Embed Size (px)
Citation preview

© 2018 : Prof JJ Smallwood
ONE-DAY ACHASM GAUTENG 2018 CONSTRUCTION
HEALTH AND SAFETY (H&S) SYMPOSIUM
MIDRAND, 12 MARCH 2018
MOTOR VEHICLE ACCIDENTS (MVAs) DURING CONSTRUCTION
PROF JOHN SMALLWOOD
PROFESSOR, DEPARTMENT OF CONSTRUCTION MANAGEMENT
NELSON MANDELA UNIVERSITY
COPYRIGHT 2018
© 2018 : Prof JJ Smallwood
Personal journey (1)
▪ Smallwood, J.J. (2002) Traffic accidents contribute
substantially to fatalities in construction. SA Builder,
September, p. 9.
▪ Smallwood, J.J. (2002) Traffic safety in construction, MBA
Bulletin, 1 October, p. 3.
▪ Traffic safety in construction: The deadly iceberg, Safety
Management, November / December, p. 8.
▪ Emuze, F.A. and Smallwood, J.J. (2012) Construction Motor
Vehicle Accidents in South Africa: Preliminary Findings. In:
Proceedings of CIB W099 International Conference 2012:
Modelling and Building Health and Safety, 10-11 September
2012, Singapore, 203-208.
© 2018 : Prof JJ Smallwood
Personal journey (2)
▪ Emuze, F.A. and Smallwood, J.J. (2013) Construction Motor
Vehicle Accidents in South Africa: Causes and Impact. In:
Proceedings of the 29th Annual Association of Researchers
in Construction Management (ARCOM) Conference, 2-4
September, Reading, UK, pp. 311-321.
© 2018 : Prof JJ Smallwood
Background (1)
▪ MVAs are reported to be the dominating cause of fatalities in
South African construction – 47% (cidb, 2009)
▪ 43 / 69 (62.3%) of fatalities in 2017 are attributable to MVAs
during construction (FEM, 2018)
▪ MVAs contribute greatly to fatalities and injuries in
construction because of common unsafe transport / traffic
practices (Smallwood, 2002) - such practices are not limited
to:▪ Workers sitting on the sides and beds of vehicles
▪ Workers mounting or dismounting from moving vehicles
▪ Overloading of vehicles
▪ Non-wearing of seat belts
▪ Unroadworthiness of vehicles

© 2018 : Prof JJ Smallwood
Background (2)
Table 1: MVAs in South African construction from 2000 to 2011 (FEM in Emuze and
Smallwood , 2012).
Year
Accidents Consequence (No.)
% No. FatalityPermanent
Disability
2011 12.47 892 23 25
2010 10.85 984 63 57
2009 9.18 949 31 51
2008 8.35 910 31 30
2007 8.30 871 30 37
2006 6.95 629 34 29
2005 7.54 674 26 24
2004 7.66 624 28 26
2003 7.55 557 36 30
2002 8.15 561 33 29
2001 4.26 278 26 11
2000 3.59 264 15 11
© 2018 : Prof JJ Smallwood
Background (3)
▪ Between 2000 and 2011, the number of accidents increased
from 264 to 892 per annum:▪ Percentage contribution has increased from 3.6% to 12.5%
▪ Invariably, the MVA incidence rate has increased
© 2018 : Prof JJ Smallwood
Legislation
▪ Regulation 21 (2) (i) of the Construction Regulations
gazetted in July 2003 states that vehicles used to transport
workers must have seats firmly secured and adequate for
the number of employees to be carried (Republic of South
Africa, 2014)
▪ National Road Traffic Regulation 2000, Regulation 247 states
that no person shall operate on a public road a goods
vehicle conveying persons unless that portion of the vehicle
in which such persons are being conveyed is enclosed to a
height of at least 350mm above the surface upon which such
person is seated or at least 900mm above the surface on
which such person is standing, in a manner and with a
material of sufficient strength to prevent such person from
falling from such vehicle when it is in motion (Republic of
South Africa, 2000)
© 2018 : Prof JJ Smallwood
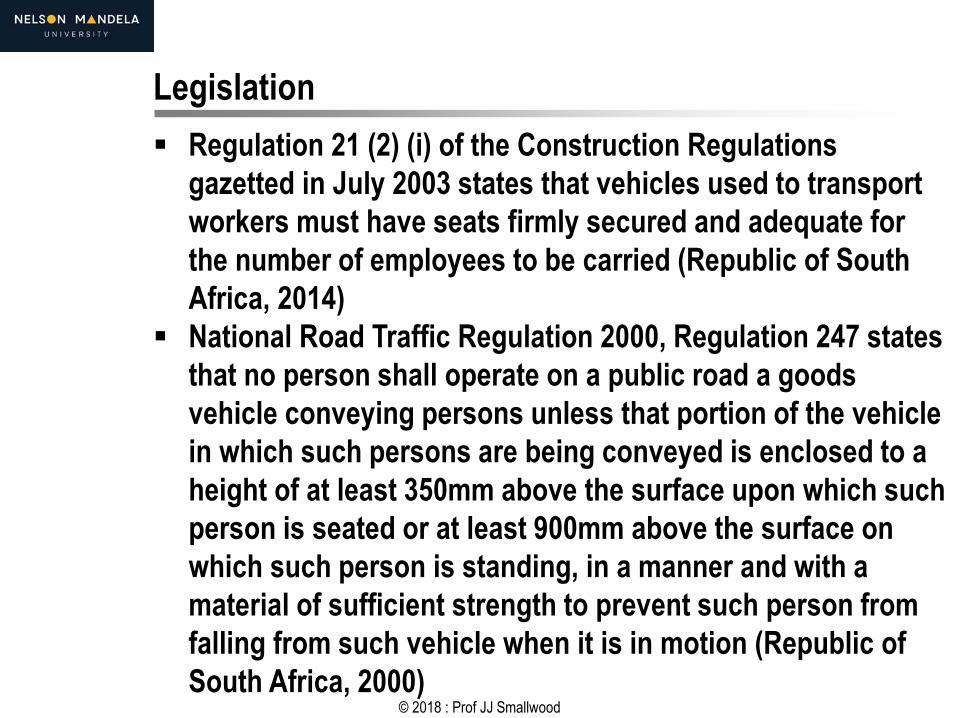
Visuals of MVAs during construction (1)
Photo 1: Overturned RMC Truck, Garsfontein Road, 14 November 2012 (Eye Witness
News)
© 2018 : Prof JJ Smallwood
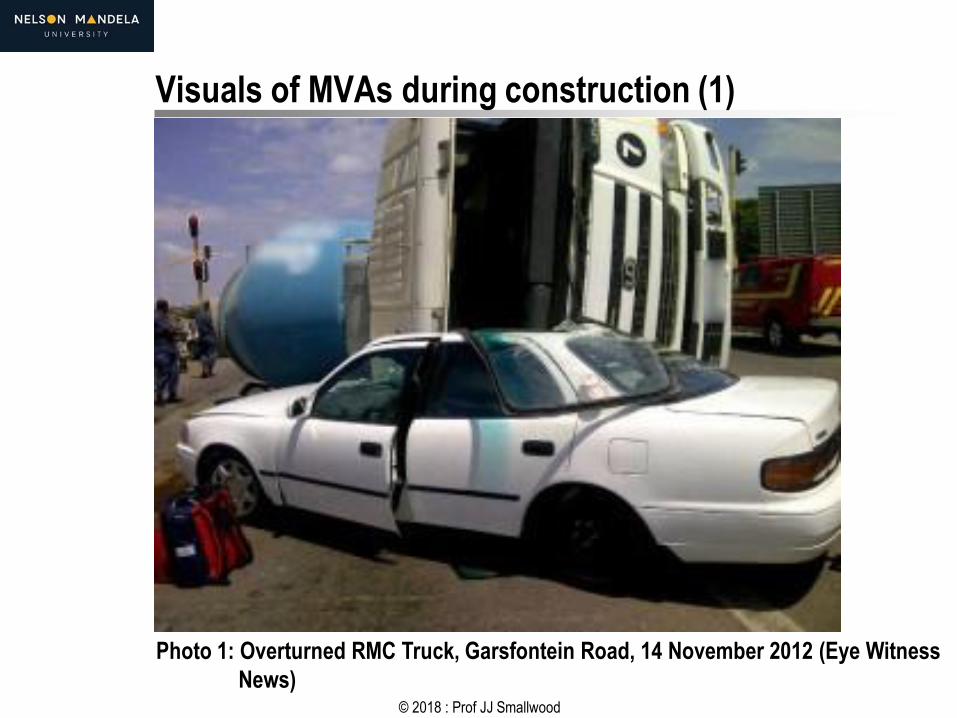
Visuals of MVAs during construction (2)
Photo 2: Overturned RMC Truck, Garsfontein Road, 14 November 2012 (Eye Witness
News)
© 2018 : Prof JJ Smallwood
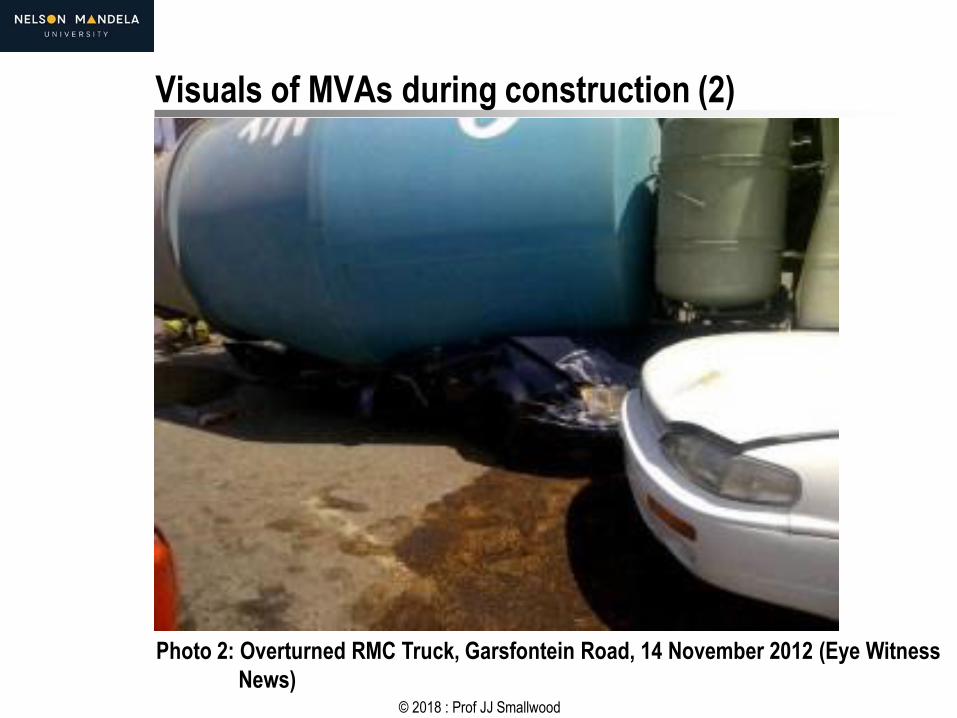
Visuals of MVAs during construction (3)
Photo 3: Overturned RMC Truck, Garsfontein Road, 14 November 2012 (Eye Witness
News)
© 2018 : Prof JJ Smallwood
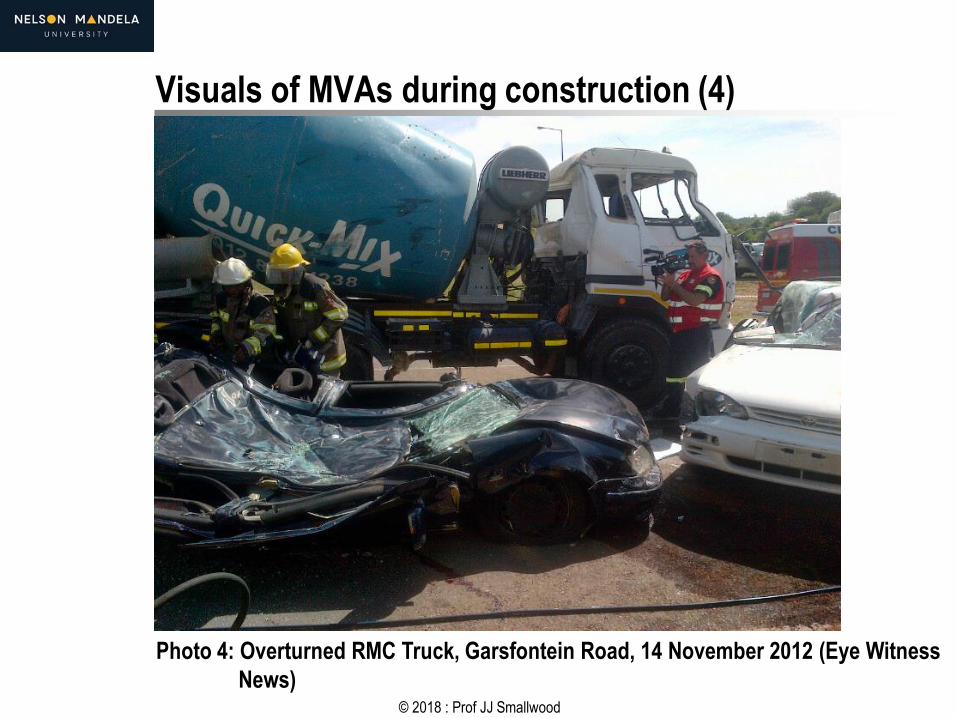
Visuals of MVAs during construction (4)
Photo 4: Overturned RMC Truck, Garsfontein Road, 14 November 2012 (Eye Witness
News)

© 2018 : Prof JJ Smallwood
Visuals of MVAs during construction (5)
Photo 5: Non-secured load fatality, Oudshoorn, 25 April 2012 (buildsafe, 2012)
© 2018 : Prof JJ Smallwood
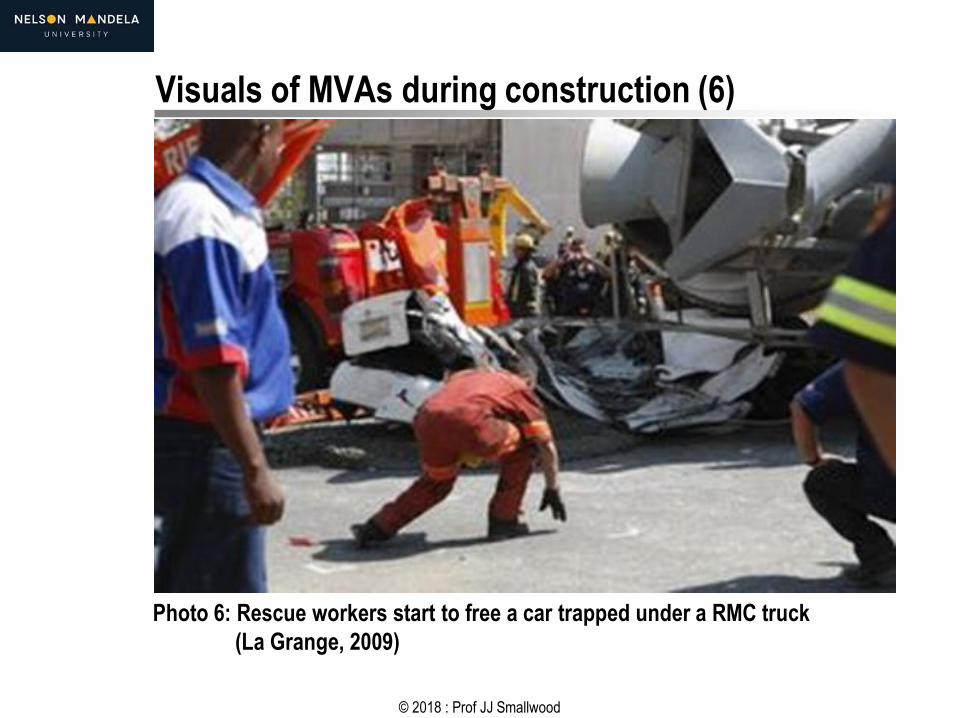
Visuals of MVAs during construction (6)
Photo 6: Rescue workers start to free a car trapped under a RMC truck
(La Grange, 2009)
© 2018 : Prof JJ Smallwood
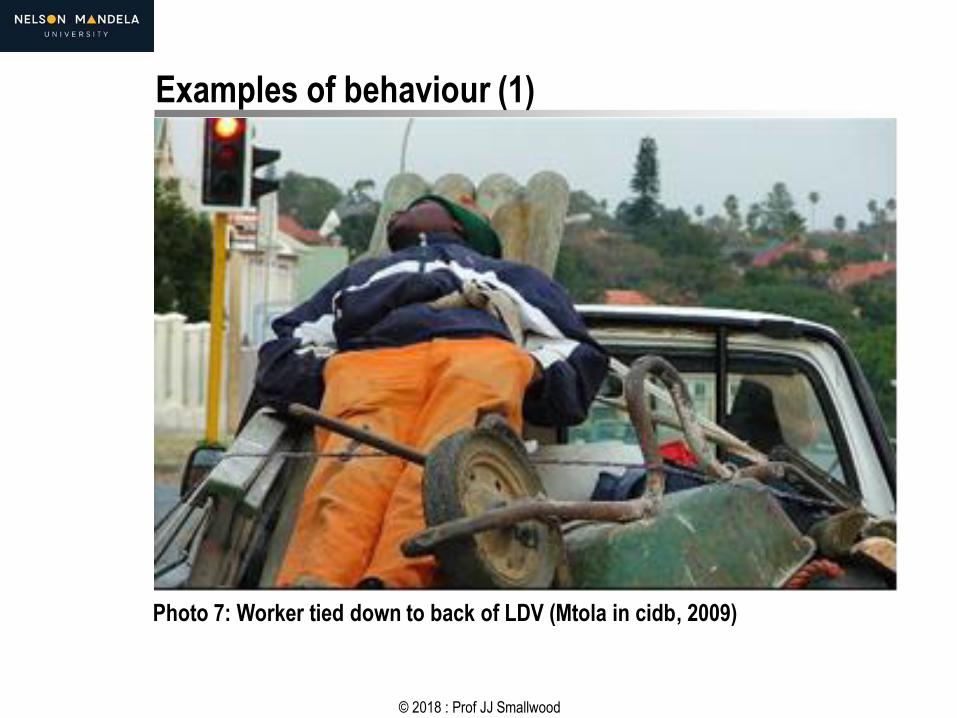
Examples of behaviour (1)
Photo 7: Worker tied down to back of LDV (Mtola in cidb, 2009)

© 2018 : Prof JJ Smallwood
Examples of behaviour (2)
Photo 8: ‘Riding’ a RMC truck, Cape Town, 14 July 2016 (Anonymous, 2016)
© 2018 : Prof JJ Smallwood
Research objectives
▪ The statistics underscore the need for an empirical study
▪ The objectives of the study are to:▪ Determine why MVA related fatalities occur
▪ Determine why MVA related fatalities have increased
▪ Evolve strategies that could address the problem
© 2018 : Prof JJ Smallwood
Research method
▪ Exploratory study
▪ Convenience sample
▪ 15 General contractor (GC) members of the East Cape
Master Builders Association (ECMBA) responded to the
survey

© 2018 : Prof JJ Smallwood
Research findings (1)
Table 2: Extent of the exposure or vulnerability of categories of personnel to MVAs (MS = 1.00 to 5.00)
(Emuze & Smallwood, 2013)
Category
Response (%)
MS RankUnsure
Minor………….…………………………Major
1 2 3 4 5
Drivers / Operators 6.7 6.7 13.3 26.7 26.7 20.0 3.43 1
General workers 0.0 26.7 6.7 20.0 20.0 26.7 3.13 2
Semi-skilled workers 0.0 20.0 13.3 33.3 20.0 13.3 2.93 3
Skilled workers 0.0 20.0 40.0 13.3 13.3 13.3 2.60 4
Site management
(supervisors, foremen)0.0 42.9 14.3 28.6 7.1 7.1 2.21 5
© 2018 : Prof JJ Smallwood
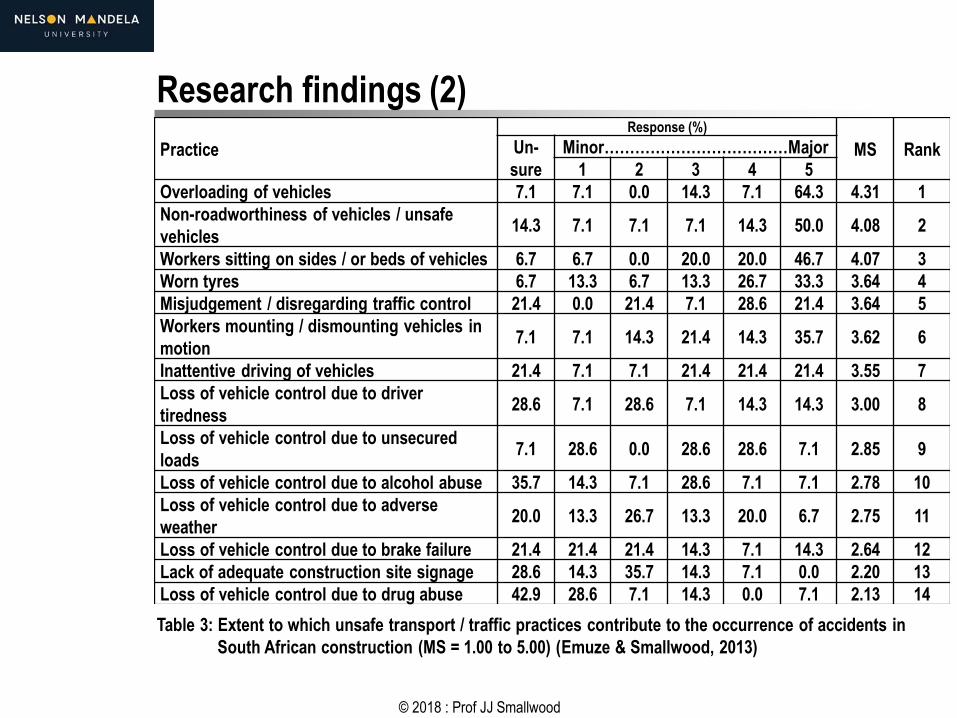
Research findings (2)
Table 3: Extent to which unsafe transport / traffic practices contribute to the occurrence of accidents in
South African construction (MS = 1.00 to 5.00) (Emuze & Smallwood, 2013)
Practice
Response (%)
MS RankUn-
sure
Minor………………………………Major
1 2 3 4 5
Overloading of vehicles 7.1 7.1 0.0 14.3 7.1 64.3 4.31 1
Non-roadworthiness of vehicles / unsafe
vehicles14.3 7.1 7.1 7.1 14.3 50.0 4.08 2
Workers sitting on sides / or beds of vehicles 6.7 6.7 0.0 20.0 20.0 46.7 4.07 3
Worn tyres 6.7 13.3 6.7 13.3 26.7 33.3 3.64 4
Misjudgement / disregarding traffic control 21.4 0.0 21.4 7.1 28.6 21.4 3.64 5
Workers mounting / dismounting vehicles in
motion7.1 7.1 14.3 21.4 14.3 35.7 3.62 6
Inattentive driving of vehicles 21.4 7.1 7.1 21.4 21.4 21.4 3.55 7
Loss of vehicle control due to driver
tiredness28.6 7.1 28.6 7.1 14.3 14.3 3.00 8
Loss of vehicle control due to unsecured
loads7.1 28.6 0.0 28.6 28.6 7.1 2.85 9
Loss of vehicle control due to alcohol abuse 35.7 14.3 7.1 28.6 7.1 7.1 2.78 10
Loss of vehicle control due to adverse
weather20.0 13.3 26.7 13.3 20.0 6.7 2.75 11
Loss of vehicle control due to brake failure 21.4 21.4 21.4 14.3 7.1 14.3 2.64 12
Lack of adequate construction site signage 28.6 14.3 35.7 14.3 7.1 0.0 2.20 13
Loss of vehicle control due to drug abuse 42.9 28.6 7.1 14.3 0.0 7.1 2.13 14
© 2018 : Prof JJ Smallwood
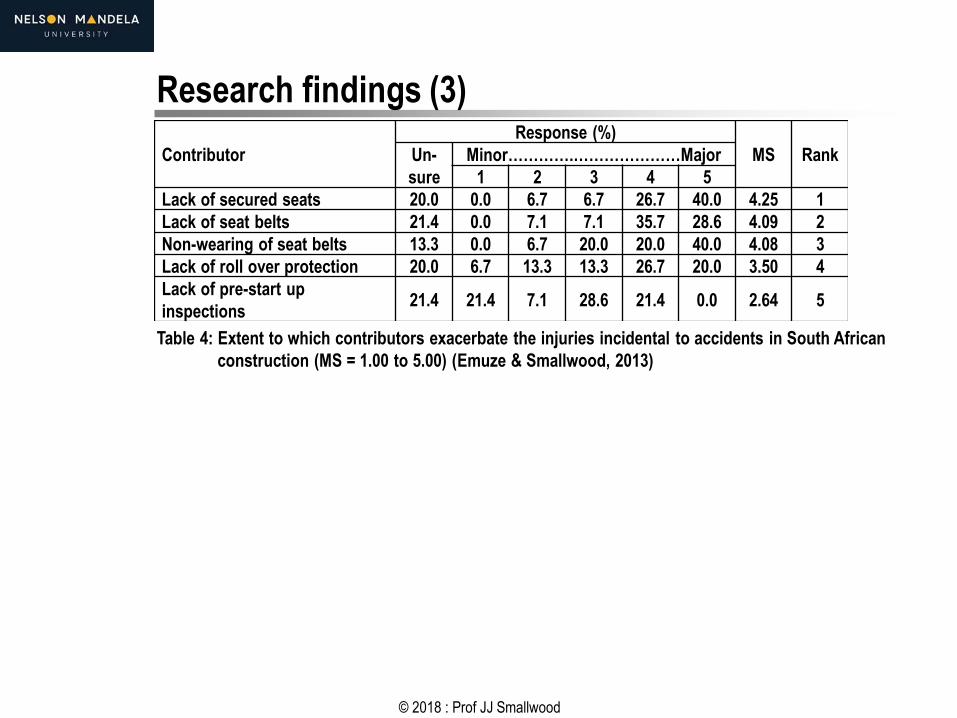
Research findings (3)
Table 4: Extent to which contributors exacerbate the injuries incidental to accidents in South African
construction (MS = 1.00 to 5.00) (Emuze & Smallwood, 2013)
Contributor
Response (%)
MS RankUn-
sure
Minor………….…………………Major
1 2 3 4 5
Lack of secured seats 20.0 0.0 6.7 6.7 26.7 40.0 4.25 1
Lack of seat belts 21.4 0.0 7.1 7.1 35.7 28.6 4.09 2
Non-wearing of seat belts 13.3 0.0 6.7 20.0 20.0 40.0 4.08 3
Lack of roll over protection 20.0 6.7 13.3 13.3 26.7 20.0 3.50 4
Lack of pre-start up
inspections21.4 21.4 7.1 28.6 21.4 0.0 2.64 5
© 2018 : Prof JJ Smallwood
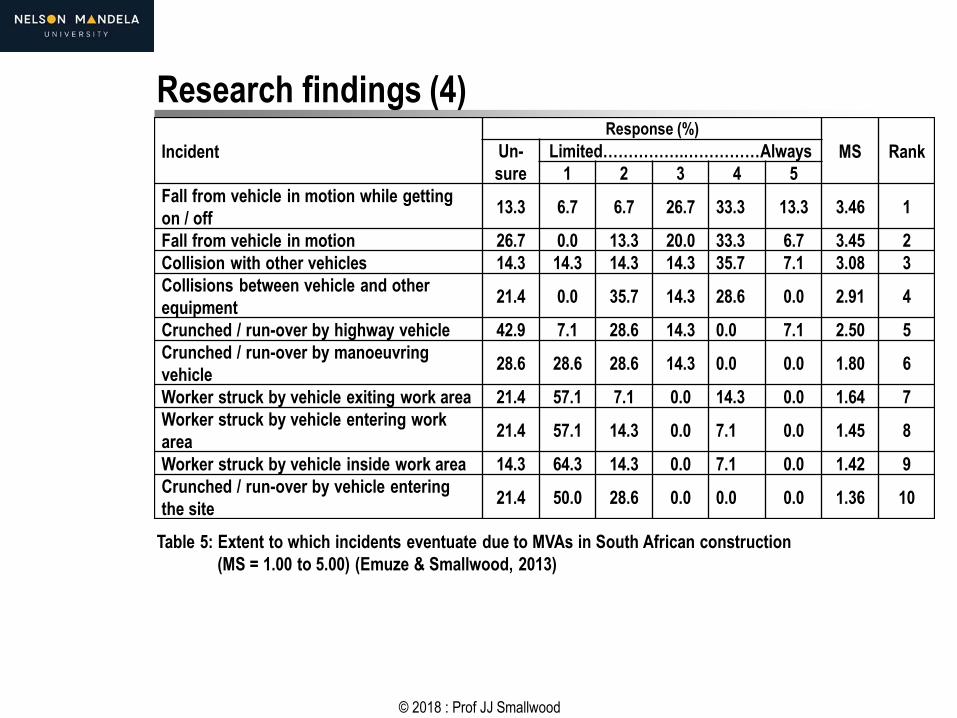
Research findings (4)
Table 5: Extent to which incidents eventuate due to MVAs in South African construction
(MS = 1.00 to 5.00) (Emuze & Smallwood, 2013)
Incident
Response (%)
MS RankUn-
sure
Limited…………….……………Always
1 2 3 4 5
Fall from vehicle in motion while getting
on / off13.3 6.7 6.7 26.7 33.3 13.3 3.46 1
Fall from vehicle in motion 26.7 0.0 13.3 20.0 33.3 6.7 3.45 2
Collision with other vehicles 14.3 14.3 14.3 14.3 35.7 7.1 3.08 3
Collisions between vehicle and other
equipment21.4 0.0 35.7 14.3 28.6 0.0 2.91 4
Crunched / run-over by highway vehicle 42.9 7.1 28.6 14.3 0.0 7.1 2.50 5
Crunched / run-over by manoeuvring
vehicle28.6 28.6 28.6 14.3 0.0 0.0 1.80 6
Worker struck by vehicle exiting work area 21.4 57.1 7.1 0.0 14.3 0.0 1.64 7
Worker struck by vehicle entering work
area21.4 57.1 14.3 0.0 7.1 0.0 1.45 8
Worker struck by vehicle inside work area 14.3 64.3 14.3 0.0 7.1 0.0 1.42 9
Crunched / run-over by vehicle entering
the site21.4 50.0 28.6 0.0 0.0 0.0 1.36 10
© 2018 : Prof JJ Smallwood
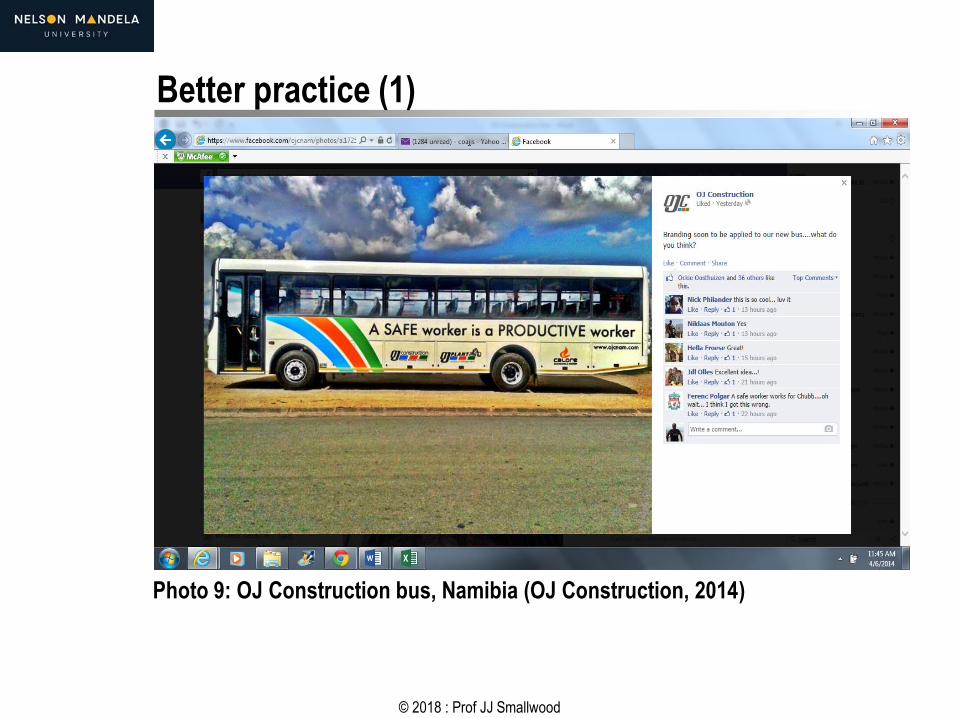
Better practice (1)
Photo 9: OJ Construction bus, Namibia (OJ Construction, 2014)

© 2018 : Prof JJ Smallwood
Better practice (2)
Photo 10: OJ Construction bus, Namibia (OJ Construction, 2014)
© 2018 : Prof JJ Smallwood
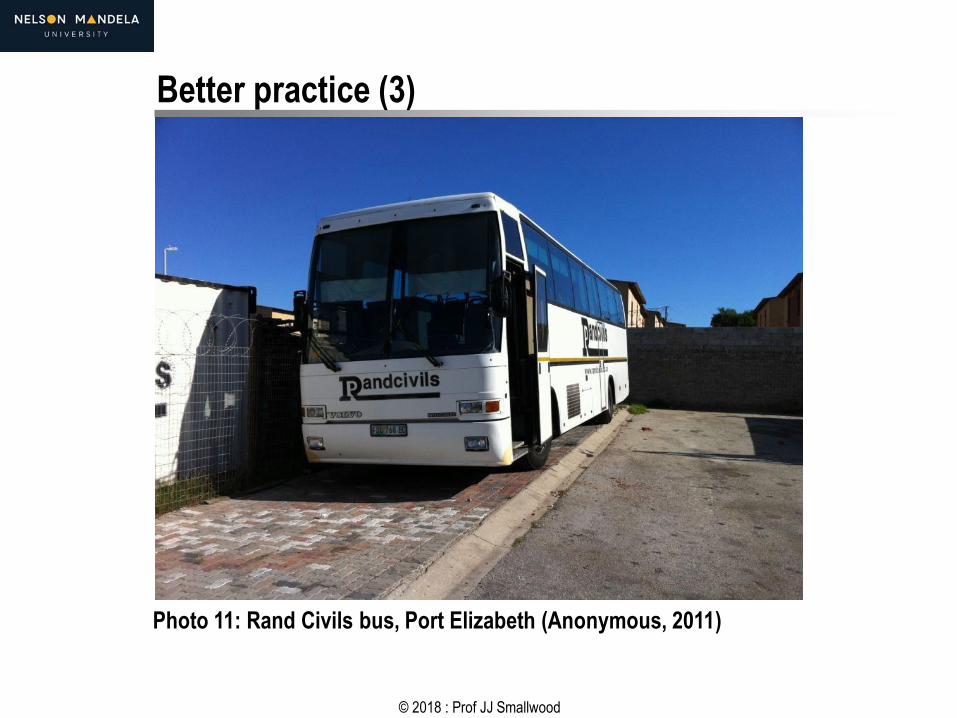
Better practice (3)
Photo 11: Rand Civils bus, Port Elizabeth (Anonymous, 2011)

© 2018 : Prof JJ Smallwood
Better practice (4)
Photo 12: Rand Civils bus, Port Elizabeth (Anonymous, 2011)
© 2018 : Prof JJ Smallwood
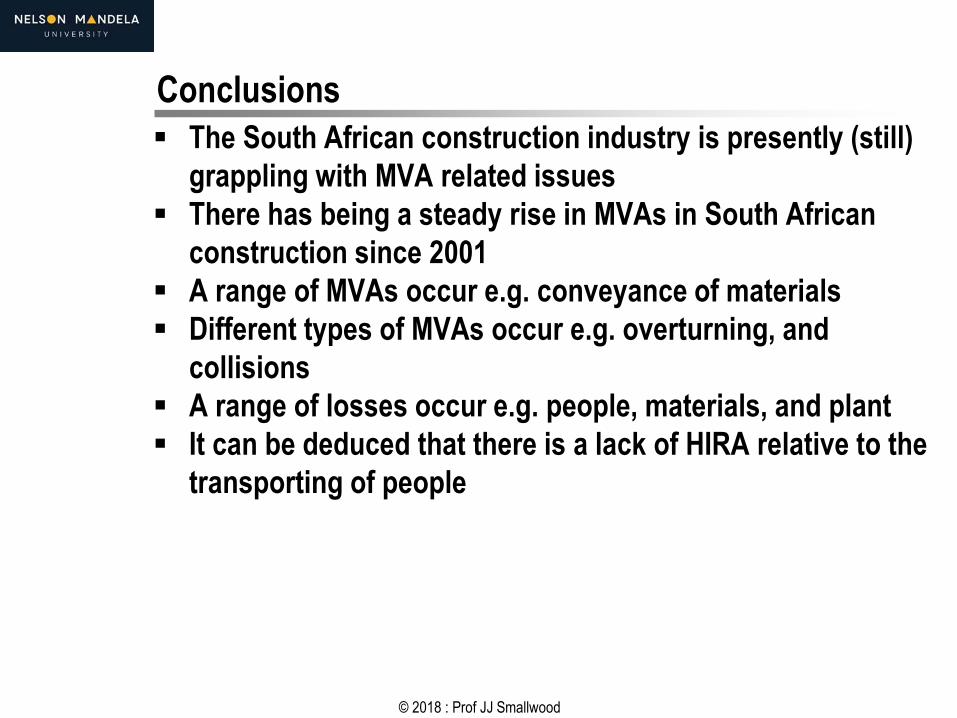
Conclusions
▪ The South African construction industry is presently (still)
grappling with MVA related issues
▪ There has being a steady rise in MVAs in South African
construction since 2001
▪ A range of MVAs occur e.g. conveyance of materials
▪ Different types of MVAs occur e.g. overturning, and
collisions
▪ A range of losses occur e.g. people, materials, and plant
▪ It can be deduced that there is a lack of HIRA relative to the
transporting of people
© 2018 : Prof JJ Smallwood
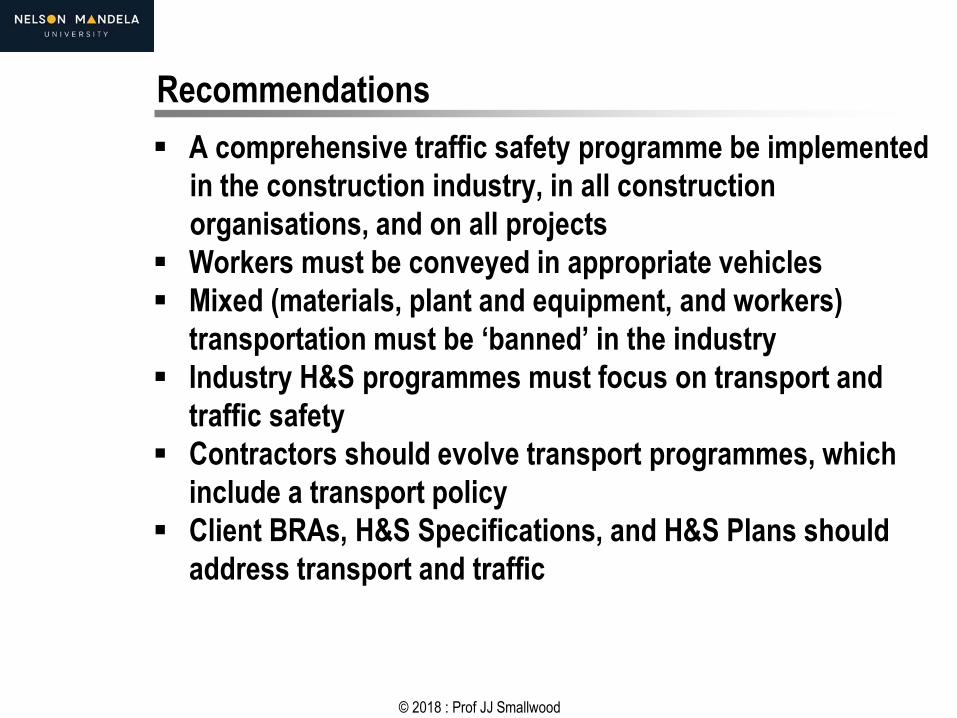
Recommendations
▪ A comprehensive traffic safety programme be implemented
in the construction industry, in all construction
organisations, and on all projects
▪ Workers must be conveyed in appropriate vehicles
▪ Mixed (materials, plant and equipment, and workers)
transportation must be ‘banned’ in the industry
▪ Industry H&S programmes must focus on transport and
traffic safety
▪ Contractors should evolve transport programmes, which
include a transport policy
▪ Client BRAs, H&S Specifications, and H&S Plans should
address transport and traffic
© 2018 : Prof JJ Smallwood
References (1)
▪ buildsafe South Africa (2012) SAFETY ALERT 045 Non-
Secured Load Fatality. Johannesburg: buildsafe.
▪ Construction Industry Development Board (cidb) (2009)
Construction Health & Safety in South Africa Status &
Recommendations. Pretoria: cidb.
▪ Emuze, F.A. and Smallwood, J.J. (2012) Construction Motor
Vehicle Accidents in South Africa: Preliminary Findings. In:
Proceedings of CIB W099 International Conference 2012:
Modelling and Building Health and Safety, 10-11 September
2012, Singapore, 203-208.
▪ Emuze, F.A. and Smallwood, J.J. (2013) Construction Motor
Vehicle Accidents in South Africa: Causes and Impact. In:
Proceedings of the 29th Annual Association of Researchers
in Construction Management (ARCOM) Conference, 2-4
September, Reading, UK, pp. 311-321.
© 2018 : Prof JJ Smallwood
References (2)
▪ Federated Employers Assurance (FEM) (2018) Injuries per
Injury Type for all MBA Regions from 2017 to 2018
http://www.fem.co.za/Layer_SL/FEM_Home/FEM_Accident_
Stats/FEM_Accident_Stats.htm [accessed 11 March 2018]
▪ La Grange, B. (2009) I just closed my eyes and waited for it
to happen [online]. Available from:
http://www.timeslive.co.za/sundaytimes/2009/09/01/
[Accessed 6 March 2012]
▪ OJ Construction (2014) Branding soon to be applied to our
new bus….what do you think?
https://www.facebook.com/ojcnam/photos/a.1725 [accessed
4 June 2014]
▪ Republic of South Africa (2000) National Road Traffic
Regulations 2000. Government Notice No. R. 225. Pretoria.
© 2018 : Prof JJ Smallwood
References (3)
▪ Republic of South Africa (2014) No. R. 84 Occupational
Health and Safety Act, 1993 Construction Regulations 2014.
Government Gazette No. 37305. Pretoria.
▪ Smallwood, J.J. (2002) Traffic accidents contribute
substantially to fatalities in construction. SA Builder,
September, p. 9.