Embed Size (px)
Citation preview
Ona Gražina Rakauskienė, Lina Volodzkienė
ISSN 2071-789X
INTERDISCIPLINARY APPROACH TO ECONOMICS AND SOCIOLOGY
Economics & Sociology, Vol. 10, No. 1, 2017
265
Ona Gražina Rakauskienė, Mykolas Romeris University, Vilnius, Lithuania, E-mail: [email protected]
THE INEQUALITY OF MATERIAL LIVING CONDITIONS IN EU
COUNTRIES Lina Volodzkienė, Mykolas Romeris University, Vilnius, Lithuania, E-mail: [email protected]
ABSTRACT. Socio-economic inequality has become one of the most relevant problems in the global economy. Studies carried out in the past 10 years have revealed that a high level of inequality prevents economic growth. The standard means of measuring these differences in equality include methods and aspects such as looking at inequalities in income and consumption, but these criteria do not reflect the actual level of inequality. To find out the actual level of socio-economic inequality, the distribution of wealth should be analysed. However, until now aspects involving the unequal distribution of material living conditions and housing inequality have not been the main objects of sufficient scientific research. For this reason, the main aspects to be analysed in this article are the distribution of material living conditions and housing inequality in Lithuania and other EU countries, with a special focus on the extent and volatility of the problem.
Received: July, 2016 1st Revision: October, 2016 Accepted: December, 2016 DOI: 10.14254/2071-789X.2017/10-1/19
JEL Classification: D63, E21, P46, D31
Keywords: wealth inequality, socio-economic inequalities, distribution of material living conditions, quality of life.
Introduction
The quality of life in society is the main factor influencing socio-economic growth.
This has mostly been driven by changes in the economic paradigm, as universal monetary
methods based on monetary factors and fiscal policies have been replaced by non-orthodox
concepts of economic development that emphasise the importance of society’s interests and
quality of life. The prioritisation of these aspects has led to economic growth and societal
satisfaction in EU countries such as Germany, France, Italy, Austria, the Scandinavian
countries and Switzerland. At the same time, other countries have underestimated the
importance of human resources and still live with the belief that the radical and liberal
doctrine of the Washington Consensus – which is criticised more and more – will improve
quality of life in society, competitive ability and socio-economic progress. Unfortunately, this
might lead to disappointment in existing political systems in various countries and the
polarisation of members of society, as well as an uneven distribution of income and resources,
high levels of inequality and poverty.
Socio-economic inequality can therefore be considered to have become one of the
most relevant problems in the global economy. Studies carried out in the past 10 years (such
as those by Stiglitz, Sen, Fitoussi, Reich, Rogoff and the World Bank) have revealed that a
high level of inequality prevents economic growth. Reich (2010) stated that the reasons for
Rakauskienė, O. G., Volodzkienė, L. (2017), The Inequality of Material Living Conditions in EU Countries, Economics and Sociology, Vol. 10, No. 1, pp. 265-278. DOI: 10.14254/2071-789X.2017/10-1/19
Ona Gražina Rakauskienė, Lina Volodzkienė
ISSN 2071-789X
INTERDISCIPLINARY APPROACH TO ECONOMICS AND SOCIOLOGY
Economics & Sociology, Vol. 10, No. 1, 2017
266
the recent global crisis were not the increase in national debts or people’s inability to live
within their means, but mainly a high level of socio-economic inequality when growth in
GDP is caused by unjustified rise in income among the rich (Rakauskienė, 2015). The report
by Stiglitz, Sen and Fitoussi (Report by the Commission on the Measurement of Economic
Performance and Social Progress, 2009) revealed that the influence of socio-economic
inequality must be analysed in relation to both economic growth and quality of life.
International organisations such as the World Bank, Organisation for Economic Co-
operation and Development (OECD), European Commission and Eurostat have carried out
studies in relation to socio-economic inequality and quality of life, and their influence on
economic development in a particular region or country. The concept of socio-economic
inequality has also been researched by Stiglitz, Reich, Atkinson, Piketty, Rakauskienė,
Lazutka and others; the concept of wealth has been analysed by Galinienė, Jakutytė-
Sungailienė, Pakalniškis and others; wealth inequality has been studied by Chesters, Jurges,
Keister, Moller, Simpson, Gollier, Wolff, Bover, Lysandrou, Cragg, Ghayad, Carroll, Young,
Wood, Rieger; and aspects involving quality of life have been researched by Puškorius,
Servetkienė, Gruževskis, Merkys, Štrimikienė and others. However, it should be noted that
the influence of material living conditions on quality of life has not been researched in-depth.
The standard means of measuring socio-economic inequality include methods and aspects
involving income distribution and inequality of consumption. According to the authors,
however, these criteria do not reveal the actual level of inequality. To find out this out, it
makes sense to research the distribution of living conditions, which might be referred to as the
most adequate criterion that reflects socio-economic inequality.
1. The Importance of Material Living Conditions in Contemporary Socio-economic
Development
Socio-economic inequality. Socio-economic inequality is the outcome of
modernisation within societies and economic development in the contemporary world. It is
influenced by various economic (macro) factors (such as economic growth, policies with
regard to taxation, social benefits and allowances, labour market policies and regulations, and
income distribution), as well as social and demographic factors (such as family size and
composition, income, education, qualifications, skills, age, sex, social status and culture) and
psychological (micro) aspects (such as a person’s characteristics, way of thinking, health and
fears). Socio-economic inequality includes all aspects involving wealth and income
distribution in societies. Moreover, imbalances in wealth and income in contemporary society
lead to uneven opportunities for future generations (Rakauskienė, 2015). Inequalities in
income and consumption are the two main concepts distinguished in scientific literature.
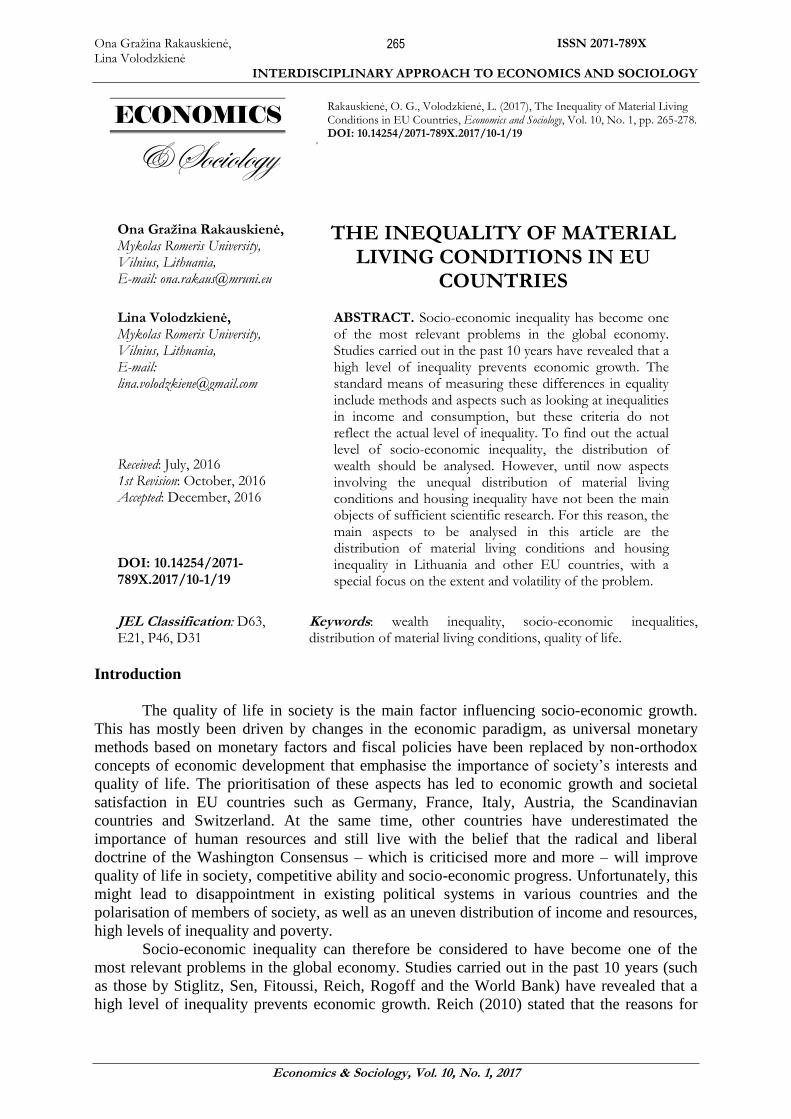
According to the authors, this kind of distribution is not finite. Figure 1 reveals other equally
important aspects of the phenomenon.
Ona Gražina Rakauskienė, Lina Volodzkienė
ISSN 2071-789X
INTERDISCIPLINARY APPROACH TO ECONOMICS AND SOCIOLOGY
Economics & Sociology, Vol. 10, No. 1, 2017
267
Figure 1. The Structure of Socio-economic Inequality
Source: created by the authors.
Socio-economic inequality remains a broad and complex concept, as many talented
philosophers, political theorists, sociologists and economists had to rack their brains in order
to explain its meaning and possible implications. Economic inequality can be conceived of as
inequality with an economic effect or an economic origin, being as much an outcome of the
underlying economic process as an input into these processes (Salverda et al., 2013).
In terms of the types of inequality cited, it can be stated that all of them are integral
parts of economics that either prevent or increase economic growth and have certain
consequences. Moreover, it should be emphasised that inequality is an economic rather than a
social problem – in other words, it is a problem that involves the economic system, especially
when this becomes excessive and prevents economic progress.
Income inequality – the key economic variable – is one of the most important
problems in the realm of socio-economic inequality and among the main subjects in many
studies concerning inequality in general. The flow of income is only one part of this problem.
The accumulated wealth and its distribution is far more illustrative rate (Salverda et al.,
2013). With regard to the distribution of income and wealth, poverty might influence not only
disparities between people in relation to those resources, but also in relation to social life
being the main reason for discontent with quality of life.
The structure of material living conditions. The most important measure of
achievement for every country is economic growth, the dynamics of which are influenced by
various factors. An increase in economic potential has its basis in cumulative and newly
created wealth (Galinienė, 2005). It should be noted that the term “wealth” might be
understood differently in relation to legal, economic, physical, social and other areas, and is
defined according to the features and priorities of a particular scientific field. This explains
why it is generally such an abstract term (Ragauskienė, 2011).
In economic theory, meanwhile, the term “wealth” includes anything that has a value
and is considered personal property (Pakalniškis et al., 2008). In analyses of the concept of
wealth, certain separate units or types of wealth are outlined, but a common method for
summarising them has never been presented. Criteria that define wealth from an economic
Ona Gražina Rakauskienė, Lina Volodzkienė
ISSN 2071-789X
INTERDISCIPLINARY APPROACH TO ECONOMICS AND SOCIOLOGY
Economics & Sociology, Vol. 10, No. 1, 2017
268
perspective are the following (Ragauskienė, 2011): 1) wealth must have a value; 2) a person
or institution must have ownership rights to an object; and 3) the object must be useful in the
future.
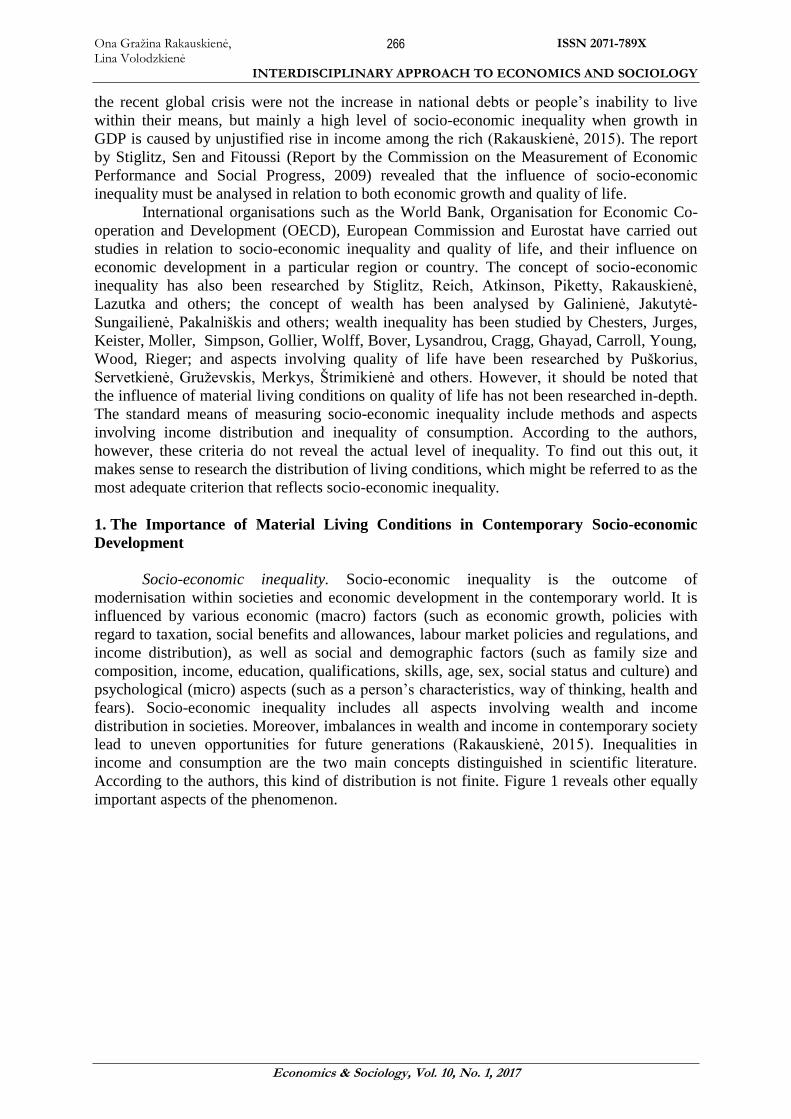
Figure 2. A Classification of Wealth
Source: Created by the authors.
Figure 2 shows an economic classification of wealth created by the authors. In this
case, material wealth is the most important factor, with the distribution and correlation
between real estate and quality of life emphasising the importance of dwelling place.
Meanwhile movable and other type of wealth is considered to be directly related to obtainable
income. The opportunity to attain and manage non-material wealth, such as copyrights and
licences, in turn depends on the amount of material wealth a person has. This opportunity
might emerge if a person has a certain social status or has accumulated a certain amount of
material wealth, or in the case of favourable circumstances (for example, inheritance).
The influence of inequalities in income and material living conditions, with a special
focus on the importance of dwelling place, has never been analysed and evaluated in relation
to quality of life. However, it is presumed that this influence may be huge. To shape a
country’s political system and ensure the well-being of society and individuals within it, the
importance of this must be thoroughly evaluated.
The distribution of material living conditions. Material living conditions and their
distribution in society can be analysed using different variables. The main ones include
financial indicators such as expenditure, income and wealth, as well as non-monetary
indicators such as multidimensional measures of material well-being and happiness, and other
variables. Income is not the only indicator of quality of life, and the welfare of households
depends on the number of family members and their health, the economic and social
Ona Gražina Rakauskienė, Lina Volodzkienė
ISSN 2071-789X
INTERDISCIPLINARY APPROACH TO ECONOMICS AND SOCIOLOGY
Economics & Sociology, Vol. 10, No. 1, 2017
269
environment, and economic resources. These resources include human capital and non-human
capital – in other words, wealth. It should be noted that wealth is more unequally distributed
than human capital, earnings or income. The Gini coefficient for disposable income in OECD
countries ranges from 0.30 to 0.50, compared with a range of 0.50 to 0.80 for the distribution
of wealth (Davies, 2013). The top 1% of families in the United States share over 30% of the
wealth, and based on certain estimates, 50% of the world’s household wealth belongs to 2%
of adults (Davies, 2013). Wealth and income are correlated, so a high level of concentration
highlights the problems of socio-economic inequality.
The concept of “wealth” is used in the meaning of all material non-human assets
minus debts. In theory, the term includes cash and deposits, other liquid assets, stocks and
bonds, business equity, owner-occupied dwellings or any other real estate, and consumer
durables, including antiques, art and jewellery. However, in practice not all assets are
included ̵ for example, consumer durables are often understood and limited by vehicles.
Moreover, the concept of wealth and assets such as consumer durables and real estate are
often understood differently in different countries.
Table 1. An International Comparison of Wealth Inequality
Country
WIDER-UNU
Year Share of top
10%
Share of top
1% Gini
Australia 2002 45.0
0.622
Canada 1999 53.0 0.688
Denmark 1975 76.4 28.8 0.808
Finland 1998 42.3 0.621
France 1994 61.0 21.3 0.730
Germany 1998 44.4 0.667
Ireland 1987 42.3 10.4 0.581
Italy 2000 48.5 17.2 0.609
Japan 1999 39.3
0.547
Korea 1988 43.1 14.0 0.579
New Zealand 2001 51.7
0.651
Norway 2000 50.5 0.633
Spain 2002 41.9 18.3 0.570
Sweden 2002 58.6 0.742
Switzerland 1997 71.3 34.8 0.803
UK 2000 56.0 23.0 0.697
USA 2001 69.8 32.7 0.801
Source: Davies, 2013.
Table 1 shows the international comparison of wealth inequality. Based on this
analysis, it is clear that wealth inequality is high in all 17 of these OECD countries. The top
10% of people in these nations share between 39.3% and 76.4% of the wealth, with the Gini
coefficient ranging from 0.547 to 0.808. It should be noted that the results were gathered
using different methods, such as surveys, wealth-tax-based estimates and estate-multiplier
figures. Considering the variety of methods applied, it remains unclear how cultural
differences might have shaped the results. Some of the most significant results are seen in the
United States, where share of wealth of wealthiest 10% of the population share 69.8% of the
wealth and the Gini coefficient is 0.801. In several other countries where a survey method
was applied, the results are similar. Based on wealth-tax and estate-multiplier estimates,
Ona Gražina Rakauskienė, Lina Volodzkienė
ISSN 2071-789X
INTERDISCIPLINARY APPROACH TO ECONOMICS AND SOCIOLOGY
Economics & Sociology, Vol. 10, No. 1, 2017
270
meanwhile, the share of wealth of wealthiest 10% of the population in the UK share 56% of
the wealth, and the share of wealth of wealthiest 10% of the population in Switzerland share
71.3% of wealth, and the Gini coefficients range from 0.697 (in the UK) to
0.803 (Switzerland) (Davies, 2013).
The impact of wealth inequality on economic well-being depends on the correlation
between wealth and income. These two factors are correlated, but are not completely
identical. It may be stated that the coefficient of their correlation is about 0.5 (Davies, 2013).
2. The Uneven Distribution of Material Living Conditions in EU Member States
An asset is considered to be a unit of wealth only if it has an owner (Galinienė, 1999).
The ability to obtain wealth and have it at one’s disposal ensures a material and moral feeling
of security, self-confidence and self-esteem, and in turn influences quality of life. From a
historical perspective, real estate is considered the most valuable type of wealth. Housing is a
significant factor in human well-being and helps to ensure stability in a society (Lipnevič,
2012), but this subject has still not been covered thoroughly enough in scientific literature.
For example, the distribution of wealth has not been measured and the influence of wealth
inequality, with a special focus on the importance of dwelling in relation to quality of life, has
not been analysed.
In 2010, EU countries started to implement the 10-year strategy Europe 2020 to help
create new workplaces and aid economic growth. The main purpose of this is to increase the
EU’s competitive ability and maintain its economic model of a social market, while
increasing the effective use of resources at the same time. This strategy also seeks to ensure
collaboration between EU member states, set priorities and aims, and create a special system
to implement those aims. The EU has correlated goals that it is seeking to accomplish by 2020
in five fields: employment; scientific research and development; climate change and energy;
education; and the battle against poverty and social exclusion (European Commission, 2014).
It has been stated that one of the main challenges faced by Europe 2020 is the reduction of
poverty and social exclusion, with a major goal of providing every EU citizen with a decent
living place in terms of both price and quality. According to Eurostat researchers, quality of
housing is key for a good quality of life, but the lack of appropriate housing is a deep-rooted
problem in many EU countries (Eurostat, 2014). It should be noted that there have been no
studies that reveal the correlation between wealth attained and quality of life, with a special
focus on living place and its quality. However, studies carried out by EU institutions in the
last few years that have examined living environments and the condition and quality of
housing have revealed that these factors directly influence quality of life.
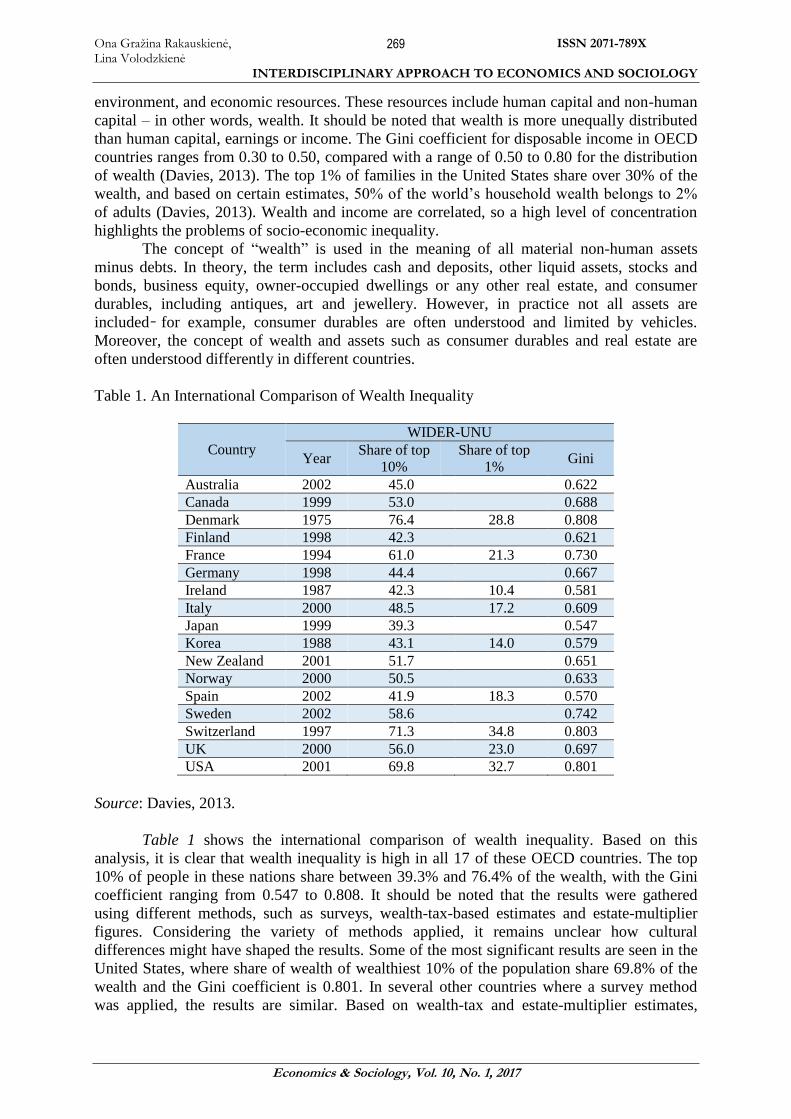
In 2012, Eurostat completed research into material living conditions and the living
environment in EU member states, with a focus on decent accommodation as one of people’s
most important needs. According to the results of this research, 41.3% of EU citizens lived in
flats, with one-third (34.1%) in detached houses and 24.0% in semi-detached houses. The
countries with the largest proportions of people who lived in flats were Estonia (65.1%),
Spain (65.0%) and Latvia (64.4%). Meanwhile, those with the largest proportions of people
who lived in detached houses were Croatia (73.0%), Slovenia (66.6%), Hungary (63.9%),
Romania (60.5%) and Norway (60.7%). Semi-detached houses were most popular in the UK
(60.9%), the Netherlands (60.0%) and Ireland (59.0%) (see Figure 3).
Ona Gražina Rakauskienė, Lina Volodzkienė
ISSN 2071-789X
INTERDISCIPLINARY APPROACH TO ECONOMICS AND SOCIOLOGY
Economics & Sociology, Vol. 10, No. 1, 2017
271
(1) Not significant for “Other” category
Figure 3. The Distribution of Population Based on Housing Type (2012)
Source: Eurostat, 2014.
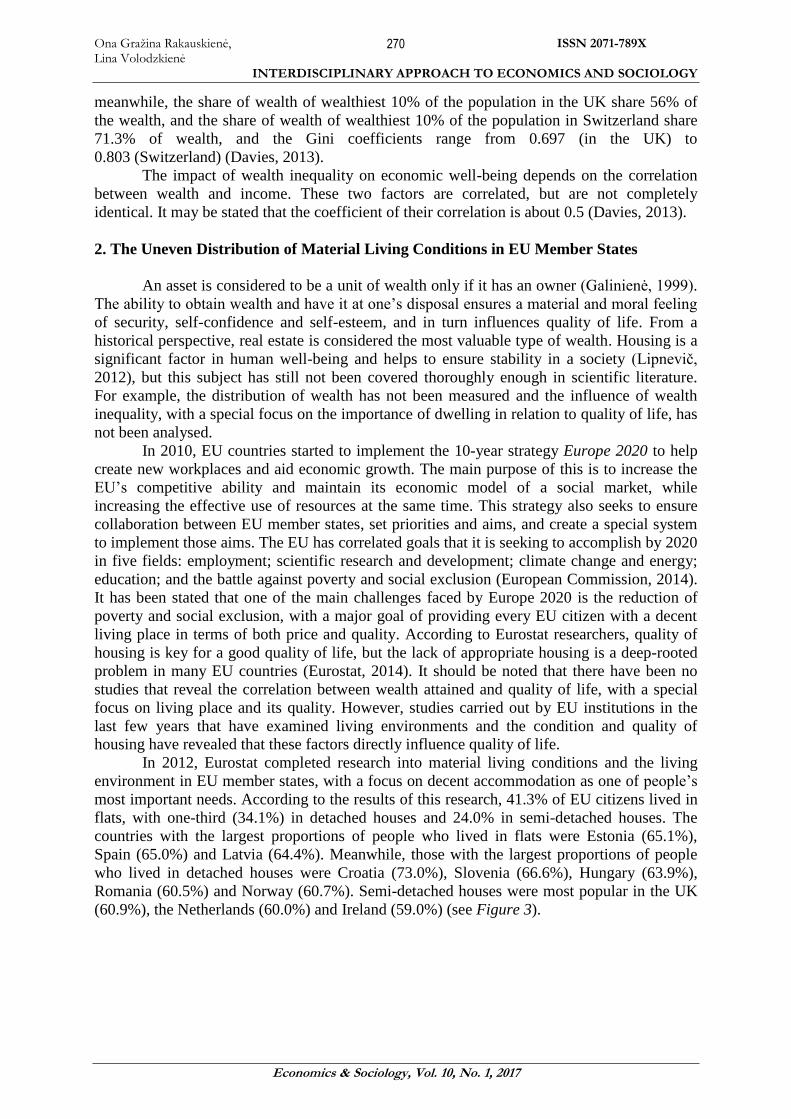
Figure 4. Distribution of Lithuanian Residents Based on Housing Type
Source: Mykolas Romeris University, Vilmorus Market and Opinion Research Centre, 2016.
In 2016, the Vilmorus Market and Opinion Research Centre completed a study on
behalf of Mykolas Romeris University showing that 72.30% of Lithuanian citizens lived in
flats. Meanwhile, 22.50% of citizens lived in detached houses for one family and 3.10% in
townhouses shared with several other families (see Figure 4).
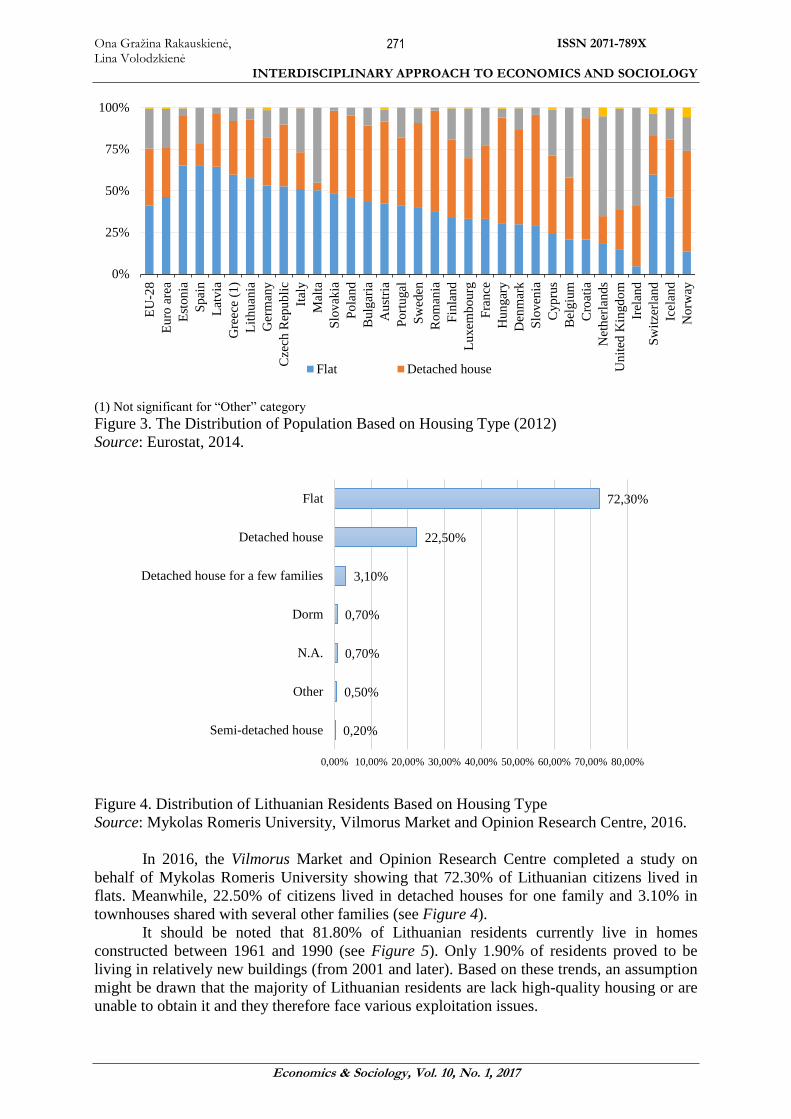
It should be noted that 81.80% of Lithuanian residents currently live in homes
constructed between 1961 and 1990 (see Figure 5). Only 1.90% of residents proved to be
living in relatively new buildings (from 2001 and later). Based on these trends, an assumption
might be drawn that the majority of Lithuanian residents are lack high-quality housing or are
unable to obtain it and they therefore face various exploitation issues.
0%
25%
50%
75%
100%
EU
-28
Eu
ro a
rea
Est
on
ia
Sp
ain
Lat
via
Gre
ece
(1)
Lit
hu
ania
Ger
man
y
Cze
ch R
epu
bli
c
Ital
y
Mal
ta
Slo
vak
ia
Po
lan
d
Bulg
aria
Au
stri
a
Po
rtu
gal
Sw
eden
Rom
ania
Fin
lan
d
Lu
xem
bou
rg
Fra
nce
Hu
ngar
y
Den
mar
k
Slo
ven
ia
Cyp
rus
Bel
giu
m
Cro
atia
Net
her
lan
ds
Un
ited
Kin
gd
om
Irel
and
Sw
itze
rlan
d
Icel
and
No
rway
Flat Detached house
0,20%
0,50%
0,70%
0,70%
3,10%
22,50%
72,30%
Semi-detached house
Other
N.A.
Dorm
Detached house for a few families
Detached house
Flat
0,00% 10,00% 20,00% 30,00% 40,00% 50,00% 60,00% 70,00% 80,00%
Ona Gražina Rakauskienė, Lina Volodzkienė
ISSN 2071-789X
INTERDISCIPLINARY APPROACH TO ECONOMICS AND SOCIOLOGY
Economics & Sociology, Vol. 10, No. 1, 2017
272
Figure 5. Homes According to Their Year of Construction
Source: Mykolas Romeris University, Vilmorus Market and Opinion Research Centre, 2016.
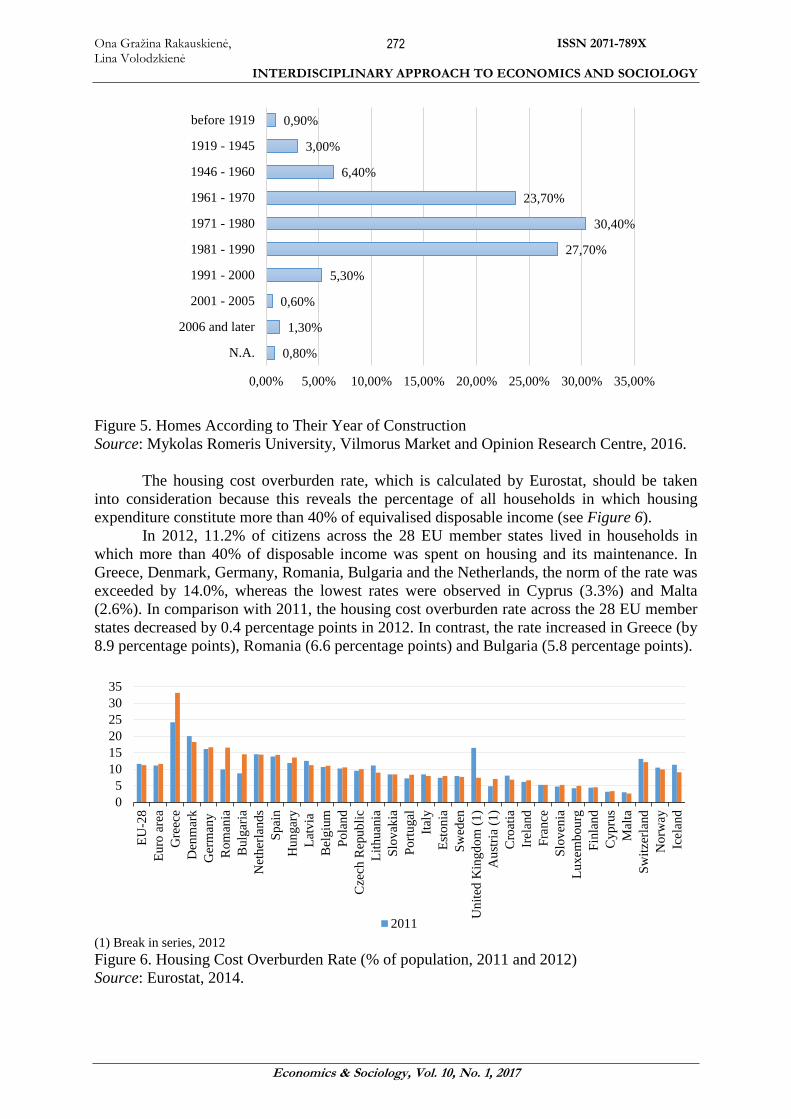
The housing cost overburden rate, which is calculated by Eurostat, should be taken
into consideration because this reveals the percentage of all households in which housing
expenditure constitute more than 40% of equivalised disposable income (see Figure 6).
In 2012, 11.2% of citizens across the 28 EU member states lived in households in
which more than 40% of disposable income was spent on housing and its maintenance. In
Greece, Denmark, Germany, Romania, Bulgaria and the Netherlands, the norm of the rate was
exceeded by 14.0%, whereas the lowest rates were observed in Cyprus (3.3%) and Malta
(2.6%). In comparison with 2011, the housing cost overburden rate across the 28 EU member
states decreased by 0.4 percentage points in 2012. In contrast, the rate increased in Greece (by
8.9 percentage points), Romania (6.6 percentage points) and Bulgaria (5.8 percentage points).
(1) Break in series, 2012
Figure 6. Housing Cost Overburden Rate (% of population, 2011 and 2012)
Source: Eurostat, 2014.
0,80%
1,30%
0,60%
5,30%
27,70%
30,40%
23,70%
6,40%
3,00%
0,90%
N.A.
2006 and later
2001 - 2005
1991 - 2000
1981 - 1990
1971 - 1980
1961 - 1970
1946 - 1960
1919 - 1945
before 1919
0,00% 5,00% 10,00% 15,00% 20,00% 25,00% 30,00% 35,00%
0
5
10
15
20
25
30
35
EU
-28
Eu
ro a
rea
Gre
ece
Den
mar
k
Ger
man
y
Rom
ania
Bulg
aria
Net
her
lan
ds
Sp
ain
Hu
ngar
y
Lat
via
Bel
giu
m
Po
lan
d
Cze
ch R
epu
bli
c
Lit
hu
ania
Slo
vak
ia
Po
rtu
gal
Ital
y
Est
on
ia
Sw
eden
Un
ited
Kin
gd
om
(1
)
Au
stri
a (1
)
Cro
atia
Irel
and
Fra
nce
Slo
ven
ia
Lu
xem
bou
rg
Fin
lan
d
Cyp
rus
Mal
ta
Sw
itze
rlan
d
No
rway
Icel
and
2011
Ona Gražina Rakauskienė, Lina Volodzkienė
ISSN 2071-789X
INTERDISCIPLINARY APPROACH TO ECONOMICS AND SOCIOLOGY
Economics & Sociology, Vol. 10, No. 1, 2017
273
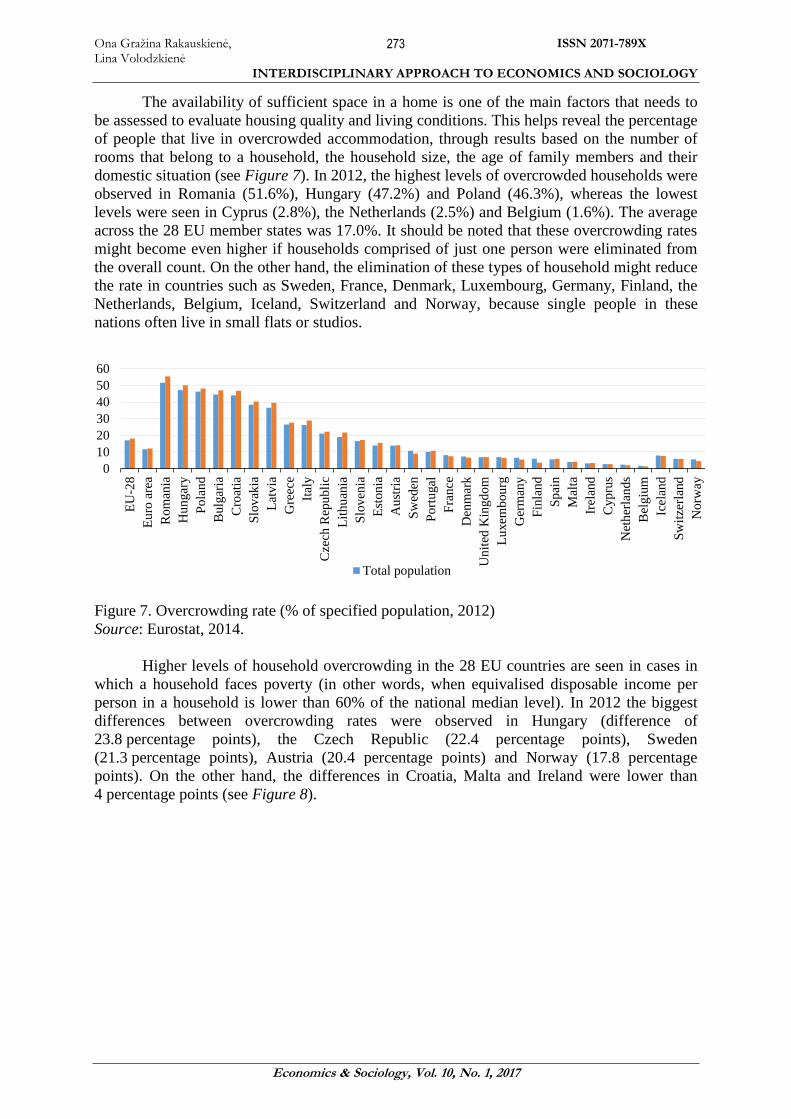
The availability of sufficient space in a home is one of the main factors that needs to
be assessed to evaluate housing quality and living conditions. This helps reveal the percentage
of people that live in overcrowded accommodation, through results based on the number of
rooms that belong to a household, the household size, the age of family members and their
domestic situation (see Figure 7). In 2012, the highest levels of overcrowded households were
observed in Romania (51.6%), Hungary (47.2%) and Poland (46.3%), whereas the lowest
levels were seen in Cyprus (2.8%), the Netherlands (2.5%) and Belgium (1.6%). The average
across the 28 EU member states was 17.0%. It should be noted that these overcrowding rates
might become even higher if households comprised of just one person were eliminated from
the overall count. On the other hand, the elimination of these types of household might reduce
the rate in countries such as Sweden, France, Denmark, Luxembourg, Germany, Finland, the
Netherlands, Belgium, Iceland, Switzerland and Norway, because single people in these
nations often live in small flats or studios.
Figure 7. Overcrowding rate (% of specified population, 2012)
Source: Eurostat, 2014.
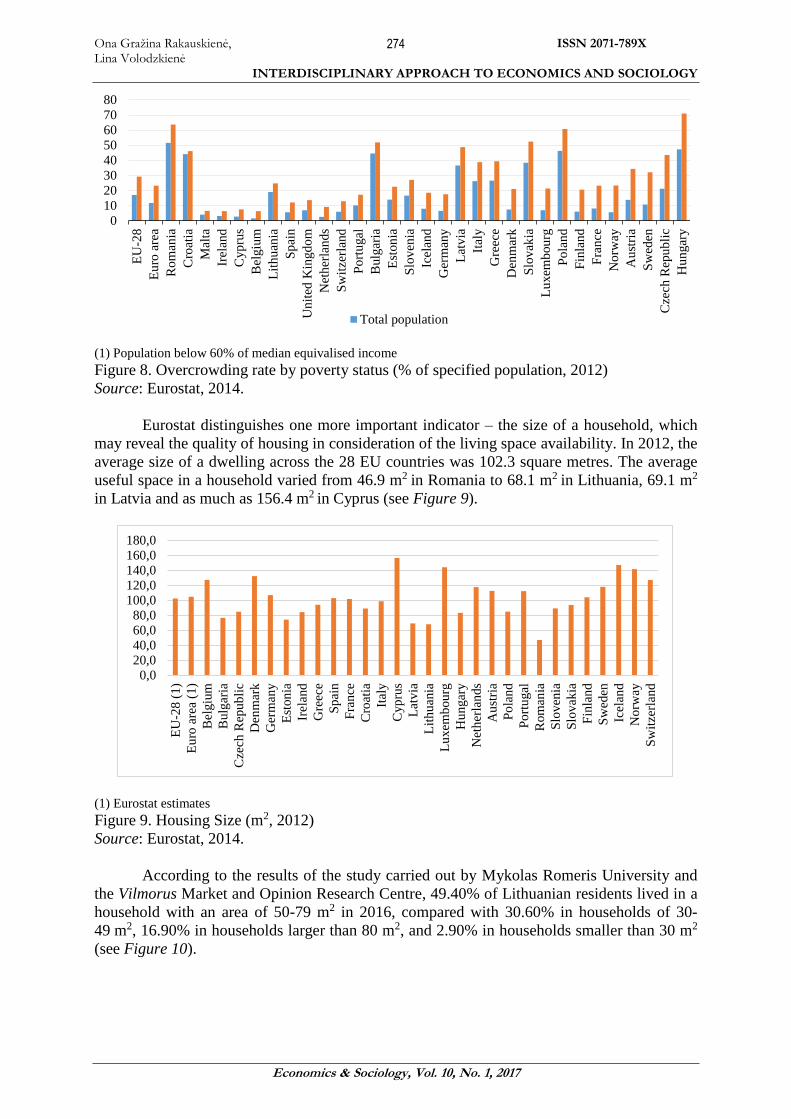
Higher levels of household overcrowding in the 28 EU countries are seen in cases in
which a household faces poverty (in other words, when equivalised disposable income per
person in a household is lower than 60% of the national median level). In 2012 the biggest
differences between overcrowding rates were observed in Hungary (difference of
23.8 percentage points), the Czech Republic (22.4 percentage points), Sweden
(21.3 percentage points), Austria (20.4 percentage points) and Norway (17.8 percentage
points). On the other hand, the differences in Croatia, Malta and Ireland were lower than
4 percentage points (see Figure 8).
0
10
20
30
40
50
60
EU
-28
Eu
ro a
rea
Rom
ania
Hu
ngar
y
Po
lan
d
Bulg
aria
Cro
atia
Slo
vak
ia
Lat
via
Gre
ece
Ital
y
Cze
ch R
epu
bli
c
Lit
hu
ania
Slo
ven
ia
Est
on
ia
Au
stri
a
Sw
eden
Po
rtu
gal
Fra
nce
Den
mar
k
Un
ited
Kin
gd
om
Lu
xem
bou
rg
Ger
man
y
Fin
lan
d
Sp
ain
Mal
ta
Irel
and
Cyp
rus
Net
her
lan
ds
Bel
giu
m
Icel
and
Sw
itze
rlan
d
No
rway
Total population
Ona Gražina Rakauskienė, Lina Volodzkienė
ISSN 2071-789X
INTERDISCIPLINARY APPROACH TO ECONOMICS AND SOCIOLOGY
Economics & Sociology, Vol. 10, No. 1, 2017
274
(1) Population below 60% of median equivalised income
Figure 8. Overcrowding rate by poverty status (% of specified population, 2012)
Source: Eurostat, 2014.
Eurostat distinguishes one more important indicator – the size of a household, which
may reveal the quality of housing in consideration of the living space availability. In 2012, the
average size of a dwelling across the 28 EU countries was 102.3 square metres. The average
useful space in a household varied from 46.9 m2 in Romania to 68.1 m2 in Lithuania, 69.1 m2
in Latvia and as much as 156.4 m2 in Cyprus (see Figure 9).
(1) Eurostat estimates
Figure 9. Housing Size (m2, 2012)
Source: Eurostat, 2014.
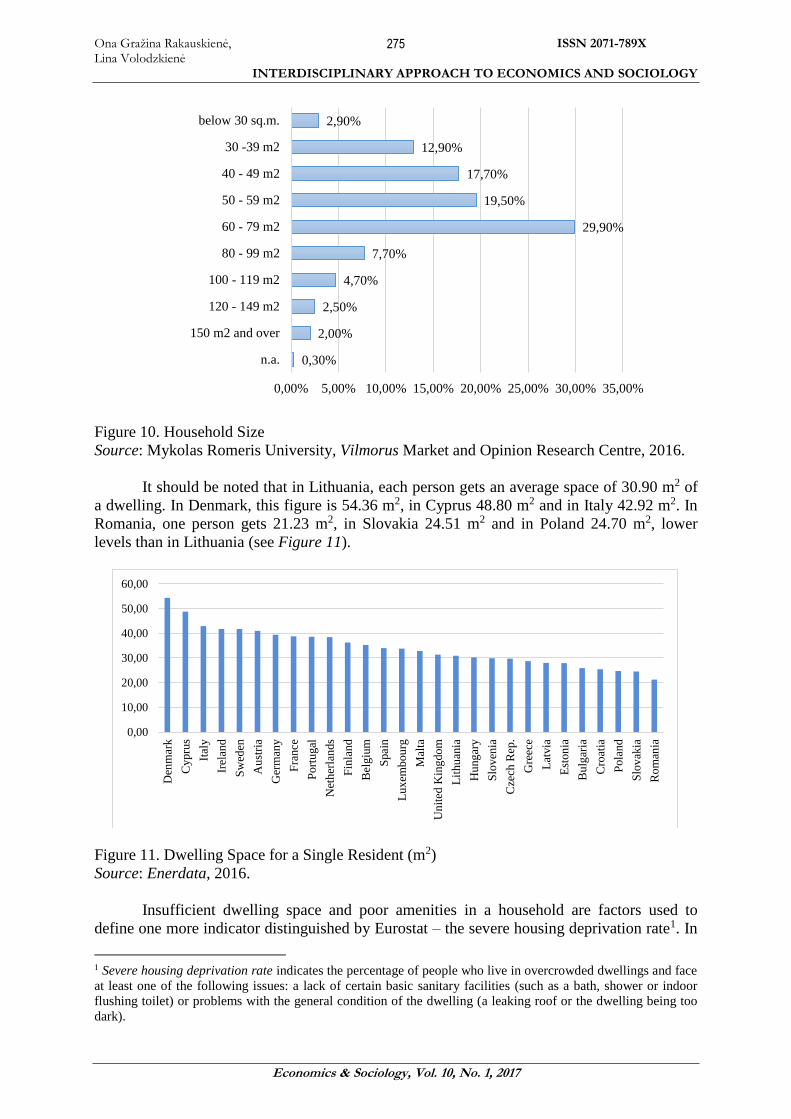
According to the results of the study carried out by Mykolas Romeris University and
the Vilmorus Market and Opinion Research Centre, 49.40% of Lithuanian residents lived in a
household with an area of 50-79 m2 in 2016, compared with 30.60% in households of 30-
49 m2, 16.90% in households larger than 80 m2, and 2.90% in households smaller than 30 m2
(see Figure 10).
0
10
20
30
40
50
60
70
80
EU
-28
Eu
ro a
rea
Rom
ania
Cro
atia
Mal
ta
Irel
and
Cyp
rus
Bel
giu
m
Lit
hu
ania
Sp
ain
Un
ited
Kin
gd
om
Net
her
lan
ds
Sw
itze
rlan
d
Po
rtu
gal
Bulg
aria
Est
on
ia
Slo
ven
ia
Icel
and
Ger
man
y
Lat
via
Ital
y
Gre
ece
Den
mar
k
Slo
vak
ia
Lu
xem
bou
rg
Po
lan
d
Fin
lan
d
Fra
nce
No
rway
Au
stri
a
Sw
eden
Cze
ch R
epu
bli
c
Hu
ngar
y
Total population
0,020,040,060,080,0
100,0120,0140,0160,0180,0
EU
-28 (
1)
Eu
ro a
rea
(1)
Bel
giu
m
Bulg
aria
Cze
ch R
epu
bli
c
Den
mar
k
Ger
man
y
Est
on
ia
Irel
and
Gre
ece
Sp
ain
Fra
nce
Cro
atia
Ital
y
Cyp
rus
Lat
via
Lit
hu
ania
Lu
xem
bou
rg
Hu
ngar
y
Net
her
lan
ds
Au
stri
a
Po
lan
d
Po
rtu
gal
Rom
ania
Slo
ven
ia
Slo
vak
ia
Fin
lan
d
Sw
eden
Icel
and
No
rway
Sw
itze
rlan
d
Ona Gražina Rakauskienė, Lina Volodzkienė
ISSN 2071-789X
INTERDISCIPLINARY APPROACH TO ECONOMICS AND SOCIOLOGY
Economics & Sociology, Vol. 10, No. 1, 2017
275
Figure 10. Household Size
Source: Mykolas Romeris University, Vilmorus Market and Opinion Research Centre, 2016.
It should be noted that in Lithuania, each person gets an average space of 30.90 m2 of
a dwelling. In Denmark, this figure is 54.36 m2, in Cyprus 48.80 m2 and in Italy 42.92 m2. In
Romania, one person gets 21.23 m2, in Slovakia 24.51 m2 and in Poland 24.70 m2, lower
levels than in Lithuania (see Figure 11).
Figure 11. Dwelling Space for a Single Resident (m2)
Source: Enerdata, 2016.
Insufficient dwelling space and poor amenities in a household are factors used to
define one more indicator distinguished by Eurostat – the severe housing deprivation rate1. In
1 Severe housing deprivation rate indicates the percentage of people who live in overcrowded dwellings and face
at least one of the following issues: a lack of certain basic sanitary facilities (such as a bath, shower or indoor
flushing toilet) or problems with the general condition of the dwelling (a leaking roof or the dwelling being too
dark).
0,30%
2,00%
2,50%
4,70%
7,70%
29,90%
19,50%
17,70%
12,90%
2,90%
n.a.
150 m2 and over
120 - 149 m2
100 - 119 m2
80 - 99 m2
60 - 79 m2
50 - 59 m2
40 - 49 m2
30 -39 m2
below 30 sq.m.
0,00% 5,00% 10,00% 15,00% 20,00% 25,00% 30,00% 35,00%
0,00
10,00
20,00
30,00
40,00
50,00
60,00
Den
mar
k
Cy
pru
s
Ital
y
Irel
and
Sw
eden
Au
stri
a
Ger
man
y
Fra
nce
Port
ugal
Net
her
lan
ds
Fin
lan
d
Bel
giu
m
Spai
n
Lux
emb
ou
rg
Mal
ta
Un
ited
Kin
gdo
m
Lit
hu
ania
Hu
ng
ary
Slo
ven
ia
Cze
ch R
ep.
Gre
ece
Lat
via
Est
on
ia
Bu
lgar
ia
Cro
atia
Pola
nd
Slo
vak
ia
Ro
man
ia
Ona Gražina Rakauskienė, Lina Volodzkienė
ISSN 2071-789X
INTERDISCIPLINARY APPROACH TO ECONOMICS AND SOCIOLOGY
Economics & Sociology, Vol. 10, No. 1, 2017
276
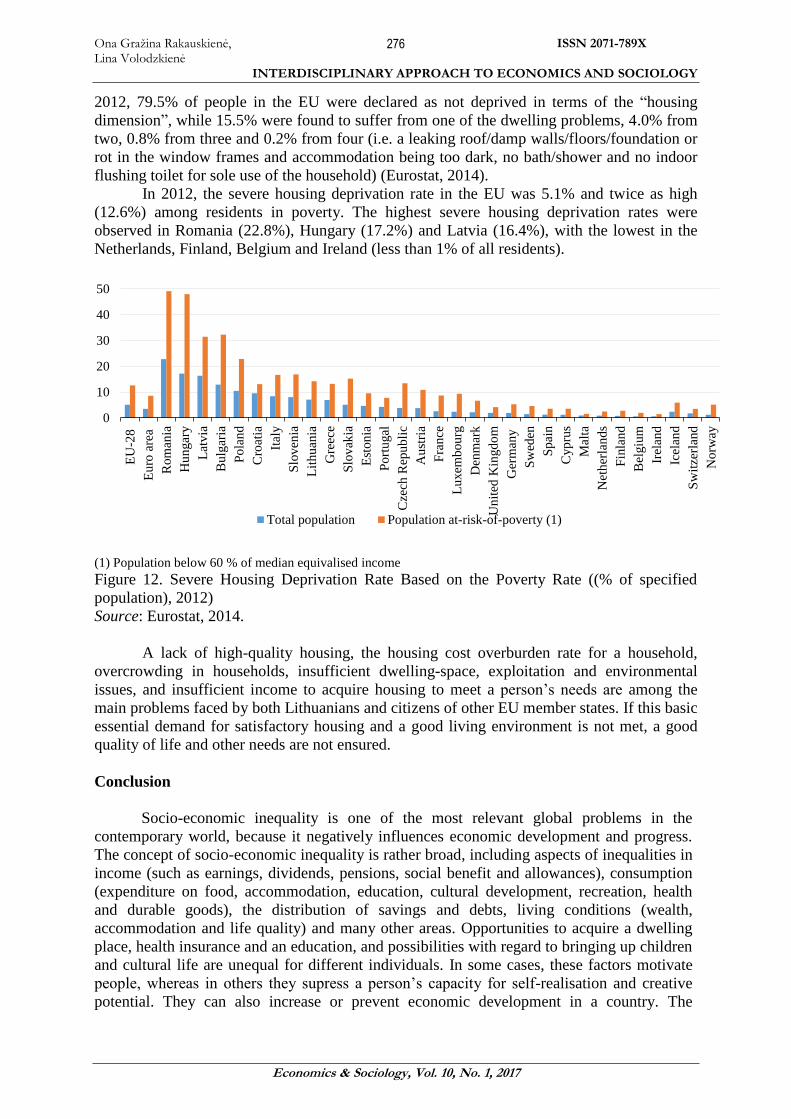
2012, 79.5% of people in the EU were declared as not deprived in terms of the “housing
dimension”, while 15.5% were found to suffer from one of the dwelling problems, 4.0% from
two, 0.8% from three and 0.2% from four (i.e. a leaking roof/damp walls/floors/foundation or
rot in the window frames and accommodation being too dark, no bath/shower and no indoor
flushing toilet for sole use of the household) (Eurostat, 2014).
In 2012, the severe housing deprivation rate in the EU was 5.1% and twice as high
(12.6%) among residents in poverty. The highest severe housing deprivation rates were
observed in Romania (22.8%), Hungary (17.2%) and Latvia (16.4%), with the lowest in the
Netherlands, Finland, Belgium and Ireland (less than 1% of all residents).
(1) Population below 60 % of median equivalised income
Figure 12. Severe Housing Deprivation Rate Based on the Poverty Rate ((% of specified
population), 2012)
Source: Eurostat, 2014.
A lack of high-quality housing, the housing cost overburden rate for a household,
overcrowding in households, insufficient dwelling-space, exploitation and environmental
issues, and insufficient income to acquire housing to meet a person’s needs are among the
main problems faced by both Lithuanians and citizens of other EU member states. If this basic
essential demand for satisfactory housing and a good living environment is not met, a good
quality of life and other needs are not ensured.
Conclusion
Socio-economic inequality is one of the most relevant global problems in the
contemporary world, because it negatively influences economic development and progress.
The concept of socio-economic inequality is rather broad, including aspects of inequalities in
income (such as earnings, dividends, pensions, social benefit and allowances), consumption
(expenditure on food, accommodation, education, cultural development, recreation, health
and durable goods), the distribution of savings and debts, living conditions (wealth,
accommodation and life quality) and many other areas. Opportunities to acquire a dwelling
place, health insurance and an education, and possibilities with regard to bringing up children
and cultural life are unequal for different individuals. In some cases, these factors motivate
people, whereas in others they supress a person’s capacity for self-realisation and creative
potential. They can also increase or prevent economic development in a country. The
0
10
20
30
40
50
EU
-28
Eu
ro a
rea
Rom
ania
Hu
ngar
y
Lat
via
Bulg
aria
Po
lan
d
Cro
atia
Ital
y
Slo
ven
ia
Lit
hu
ania
Gre
ece
Slo
vak
ia
Est
on
ia
Po
rtu
gal
Cze
ch R
epu
bli
c
Au
stri
a
Fra
nce
Lu
xem
bou
rg
Den
mar
k
Un
ited
Kin
gd
om
Ger
man
y
Sw
eden
Sp
ain
Cyp
rus
Mal
ta
Net
her
lan
ds
Fin
lan
d
Bel
giu
m
Irel
and
Icel
and
Sw
itze
rlan
d
No
rway
Total population Population at-risk-of-poverty (1)
Ona Gražina Rakauskienė, Lina Volodzkienė
ISSN 2071-789X
INTERDISCIPLINARY APPROACH TO ECONOMICS AND SOCIOLOGY
Economics & Sociology, Vol. 10, No. 1, 2017
277
standard means of measuring economic and income-based inequality include various
methods involving the distribution of income, but these do not reflect the actual level of
inequality. In order to find out the actual level of socio-economic inequality, it makes sense
to analyse the distribution of material living conditions (wealth), which might be referred to
as the most adequate criterion for assessing socio-economic inequality.
A dwelling place is a significant factor in a person’s well-being and helps to ensure a
stable society. A lack of high-quality housing, the housing cost overburden rate for a
household, overcrowding in households and insufficient dwelling space are among the main
issues faced by both Lithuanians and citizens of other EU member states. If this basic
essential demand for satisfactory housing and a good living environment is not met, a good
quality of life and other needs are not ensured. For a country to form a political system and
reduce socio-economic inequality, providing every individual with good living conditions, a
stable foundation for future generations and general well-being, it is essential to understand
the importance of a dwelling place to a person’s quality of life, as well as tendencies in
accommodation needs.
References
Galinienė, B. (1999), Turto ekonomika ir vertinimas (Wealth Economics and Evaluation),
Vilnius: BSPB, ISBN 9986-19-339-7.
Galinienė, B. (2005), Turto ir verslo vertinimo sistema: formavimas ir plėtros sistema
(Wealth and Business Evaluation System: the formation and development of the system),
Vilnius: Vilnius University, ISBN 9986-19-663-9.
Enerdata (2016), Average floor area per capita, http://www.entranze.enerdata.eu/ (referred on
20/05/2016).
European Commission (2014), Komisijos komunikatas Europos parlamentui, Tarybai,
Europos ekonomikos ir socialinių reikalų komitetui ir Regionų komitetui / Pažangaus,
tvaraus ir integracinio augimo strategijos „Europa 2020“ rezultatų apžvalga
(Communication from the Commission to the European Parliament, the Council, the
European Economic and Social Committee and the Committee of the Regions / Taking
stock of the Europe 2020 strategy for smart, sustainable and inclusive growth),
http://ec.europa.eu/europe2020/pdf/europe2020stocktaking_lt.pdf (referred on
05/04/2016).
Eurostat (2014), Housing conditions, <http://ec.europa.eu/eurostat/statistics-
explained/index.php/ Housing_conditions> (referred on 01/04/2015).
Lipnevič, A. (2012), Būsto politikos raida Lietuvoje (Evolution of Housing policy in
Lithuania), Societal Innovations for Global Growth, Vilnius: Mykolas Romeris
University, No. 1(1), ISSN 2335-2450.
Mykolas Romeris University, Market and Opinion Research Centre „Vilmorus“, Būstas,
gyvenimo sąlygos, turtas (Housing, Living Conditions and Wealth), 2016.
Pakalniškis, V., Papirtis, L. V. et al. (2008), Civilinė teisė. Bendroji dalis (Civil law. General
Part), Vilnius: Mykolas Romeris University, ISBN 978-9955-19-060-8.
Ragauskienė, E. (2011), Valstybės turto ekonominė analizė ir valdymo transformacija
(Economic analysis of the State Property Management and Transformation), Doctoral
thesis, Vilnius: Vilnius University.
Rakauskienė, O. G., Štreimikienė, D., Servetkienė, V. et al. (2015), Gyvenimo kokybės
matavimo rodiklių sistema ir vertinimo modelis (Quality of Life Measurement Indicator
System and Assessment Model), Vilnius: Mykolas Romeris University, 760 p., ISBN
978-19-713-3.
Ona Gražina Rakauskienė, Lina Volodzkienė
ISSN 2071-789X
INTERDISCIPLINARY APPROACH TO ECONOMICS AND SOCIOLOGY
Economics & Sociology, Vol. 10, No. 1, 2017
278
Salverda, W., Nolan, B., Smeeding, T. M. et al. (2013), The Oxford Hanbook of Economic
Inequality, Oxford University Press, 736 p., ISBN 978-0-19-960606-1.
Stiglitz, J. E., Sen, A., Fitoussi, J. P. (2010), Report by the Commission on the Measurement
of Economic Performance and Social Progress, Paris: Commission on the Measurement
of Economic Performance and Social Progress, http://www.stiglitz-sen-
fitoussi.fr/documents/rapport_anglais.pdf (referred on 07/05/2016).