Embed Size (px)
Citation preview

On the role of ClC-5 anion/proton exchangers in endocytosis:
Insights from intestinal infections and the hereditary renal
Dent’s disease
Von der Naturwissenschaftlichen Fakultät der
Gottfried Wilhelm Leibniz Universität Hannover
zur Erlangung des Grades
Doktorin der Naturwissenschaften (Dr. rer. nat.)
genehmigte Dissertation
von
Frederike Antonia Ruhe, M. Sc.
2018

Referent: Dr. Alexi Alekov
Korreferent: Prof. Dr. Ralf Gerhard
Korreferentin: Prof. Dr. Theresia Kraft
Tag der Promotion: 20.10.2017

i
Abstract
After antibiotic treatment, the pathogen Clostridium difficile (C. difficile) can colonize a
host’s gut. It produces the toxins TcdA and TcdB that cause severe diarrhea (Lessa et
al., 2015). TcdA/TcdB are internalized via endocytosis into the host cells and are
processed in endosomes upon acidification (Pruitt and Lacy, 2012). The present study
identifies the chloride/proton antiporter ClC-5 as a player in the intoxication of TcdA in
colon cancer cells (HT-29). ClC-5 is a member of the chloride channel family that is
situated on endosomes and essential for their acidification (Hara-Chikuma et al., 2005).
Here, ClC-5 was located in early and early-to-late endosomes, and colocalized with
TcdA. Knockdown of ClC-5 by siRNA significantly lowered the cytopathic effect of TcdA.
Vice versa, overexpression of ClC-5 increased internalization of TcdA and was
accompanied by lowered endosomal pH values. To proof whether the proton/chloride
antiport of ClC-5 is responsible for the increased cytotoxicity of TcdA, the non-
transporting E268Q ClC-5 was used. Indeed, TcdA internalization was reduced as
compared to WT ClC-5, but increased as compared to control cells. Surprisingly,
endosomal acidification was not impaired by this mutant, indicating that ClC-5-mediated
acidification of endosomes is independent of its intrinsic transport function. However,
ClC-5-promoted endosomal acidification appears to facilitate TcdA intoxication.
Since internalization of proteins depends on endocytosis and subsequent processing of
endosomes, the second part of this study established tools to investigate endosomal
motility. It focusses on the influence of ClC-5 glycosylation, since multiple ClC-5
mutations with inhibited glycosylation retain the transport in the ER and cause the renal
Dent’s disease (Scheinman, 1998). The non-complex-glycosylated R516W ClC-5 was
chosen as a representative Dent’s mutant (Ludwig et al., 2005). Using total internal
fluorescence microscopy and particle tracking analysis, this study identified R516W
ClC-5 endosomes to move faster along the plasma membrane (PM) and with reduced
target-orientation than WT ClC-5. Analysis of two artificial N-glycosylation deficient
mutants (N408E and N408A), displayed varying capabilities of endosomal retraction to
or from the PM, but indicated that a lack of N-glycans is not the main cause for the
altered endosomal mobility of R516W ClC-5.
Keywords: TcdA; ClC-5; endocytosis

ii
Zusammenfassung
Nach Antibiotika-Behandlung kann der Darm eines Patienten vom Pathogen Clostridium
difficile (C. difficile) besiedelt werden. Dieses produziert die Toxine TcdA und TcdB,
welche Durchfall verursachen können (Lessa et al., 2015). Die Toxine werden über
Endozytose in die Wirtszellen aufgenommen und in Endosomen nach deren Ansäuern
prozessiert (Pruitt and Lacy, 2012). In dieser Arbeit wurde der Chlorid/Protonen
Austauscher ClC-5 als Mitspieler in der Vergiftung von TcdA identifiziert. ClC-5, ein
Mitglied der Familie der Chloridkanäle, befindet sich an Endosomen und ist wichtig für
deren Ansäuern (Hara-Chikuma et al., 2005). In dieser Arbeit wurde ClC-5 an frühen
und frühen-späten Endosomen detektiert und kolokalisierte mit TcdA. Eine
Herunterregulierung des endogenen ClC-5 verringerte die Zytotoxizität von TcdA.
Überexpression von ClC-5 führte zu einer erhöhten Internalisierung des Toxins und
einem niedrigeren endosomalen pH. Um zu überprüfen ob der Chlorid/Protonen Antiport
von ClC-5 die erhöhte Toxizität verursacht, wurde die E268Q ClC-5 Mutante verwendet,
welche eine eingeschränkte Transportfunktion besitzt. Diese Mutante internalisierte
mehr Toxin als die Kontrolle jedoch weniger als WT ClC-5. Der endosomale pH Wert
war durch die Mutation nicht verändert, was darauf hinweist, dass das ClC-5-vermittelte
Ansäuern der Endosomen nicht von seiner eigentlichen Transportfunktion abhängt. Das
Ansäuern der Endosomen durch ClC-5 scheint somit die Toxizität von TcdA zu erhöhen.
Da die korrekte Internalisierung von Proteinen durch Endozytose und somit auch vom
Prozessieren der Endosomen beeinflusst wird, wurden im zweiten Teil dieser Studie
Methoden entwickelt um die Beweglichkeit von Endosomen zu untersuchen. Der Fokus
lag dabei auf dem Einfluss der Glykosylierung von ClC-5, da viele ClC-5 Mutanten, die
eine veränderte Glykosylierung aufweisen, und nicht aus dem ER transportiert werden
und das renale Dent Syndrom verursachen (Scheinman, 1998). Als repräsentative Dent
Mutante diente die nicht-komplex-glykosylierte R516W ClC-5 Mutante (Ludwig et al.,
2005). Endosomen der R516W bewegten sich weniger zielorientiert und schneller als
der WT entlang der Plasmamembran. Die Analyse von zwei Glykosylierungs-defizienten
Mutanten (N408E und N408A) zeigte unterschiedliche Bewegungen was verdeutlicht,
dass der Verlust der N-Glykane nicht der hauptsächliche Grund für die veränderte
Beweglichkeit ist. Schlagwörter: TcdA, ClC-5, Endozytose
iii
Contents
1 List of Figures .......................................................................................................... vii
2 List of Tables ............................................................................................................. x
3 List of Abbreviations ................................................................................................. xi
1 Introduction ............................................................................................................... 1
1.1 The CLC protein family ....................................................................................... 1
1.1.1 The chloride/proton antiporter ClC-5 ............................................................ 3
1.2 The role of ClC-5 in clathrin-mediated endocytosis ............................................ 8
1.2.1 Interaction of ClC-5 with motor proteins ..................................................... 10
1.3 ClC-5 in diseases: An overview of a pathogen causing intestinal infection
and the hereditary Dent’s disease .............................................................................. 11
1.3.1 Clostridium difficile and its enterotoxins (TcdA and TcdB) ......................... 12
1.3.2 Dent’s disease ........................................................................................... 16
1.4 Aim of the study ................................................................................................ 19
2 Methods .................................................................................................................. 20
2.1 Cell culture and transfection methods .............................................................. 20
2.2 Fixation and mounting of cells .......................................................................... 21
2.3 Microscopy and analysis of images and movies ............................................... 22
2.3.1 Confocal Microcopy ................................................................................... 22
2.3.2 Total internal reflection fluorescence microscopy ...................................... 22
2.3.3 Colocalization analysis ............................................................................... 23
2.3.4 Particle Tracking ........................................................................................ 26
2.4 Biochemical methods ....................................................................................... 28
2.4.1 SDS-PAGE ................................................................................................ 28
2.4.2 Endo H and PNGase F assay .................................................................... 29
iv
2.5 Measurement of vesicular pH using the ratiometric pH sensitive fluorescent
protein pHluorin2 ........................................................................................................ 29
2.6 Intoxication, labeling, and internalization assay of TcdA .................................. 32
2.6.1 Intoxication of cells with C. difficile toxin TcdA ........................................... 32
2.6.2 C. difficile toxin internalization assay ......................................................... 32
2.6.3 Fluorescent labelling of primary amino groups of TcdA ............................. 33
2.7 ClC-5 siRNA knockdown .................................................................................. 34
2.8 Endocytosis assay ............................................................................................ 35
3 Results ................................................................................................................... 36
3.1 ClC-5 promotes toxicity of TcdA in HT-29 cells ................................................ 36
3.1.1 ClC-5 is correctly expressed and located on endosomes in HT-29 cells ... 36
3.1.2 Knockdown of ClC-5 decrease cytopathic effect of TcdA .......................... 37
3.1.3 ClC-5 is located to early endosomes ......................................................... 39
3.1.4 The non-transporting E268Q ClC-5 is also localized on early endosomes 43
3.1.5 TcdA colocalizes with ClC-5....................................................................... 45
3.1.6 Internalization of TcdA in WT or E268Q ClC-5 cells .................................. 49
3.1.7 WT and E268Q ClC-5 promote endosomal acidification ............................ 50
3.2 Tool to study endosomal motility with regard to the pathophysiology of Dent’s
disease ....................................................................................................................... 51
3.2.1 Generation of N-glycosylation deficient ClC-5 mutants .............................. 51
3.2.2 The mutants R516W, N408E, and N408A ClC-5 are not complex
glycosylated ............................................................................................................ 52
3.2.3 Cellular distribution of WT and mutant ClC-5 in MDCKII cells .................... 53
3.2.4 Particle Tracking of ClC-5 endosomes ....................................................... 54
3.3 Low and high temporal resolution ..................................................................... 56
3.4 Low temporal resolution of particle tracking ..................................................... 57

v
3.4.1 WT ClC-5 has the longest lifetime with the slowest mean velocity in the low
temporal resolution ................................................................................................. 57
3.4.2 Calculation of Mean Square Displacement ................................................ 59
3.5 High temporal resolution of particle tracking ..................................................... 61
3.5.1 Endosomes of the R516W ClC-5 have a shorter lifetime and faster mean
velocity as compared to the WT ............................................................................. 61
3.5.2 Calculation of Mean Square Displacement (MSD) ..................................... 64
3.5.3 WT and N408E ClC-5 endosomes move more target-oriented than R516W
and N408A ClC-5 endosomes ................................................................................ 66
3.5.4 Comparison of low and high temporal resolution ....................................... 67
3.5.5 All ClC-5 variants promote endosomal acidification ................................... 69
3.5.6 Colocalization of WT, R516W, N408E, and N408A ClC-5 with Rab7 ........ 70
3.5.7 No altered fluid-phase and receptor mediated endocytosis in WT and
mutant ClC-5 .......................................................................................................... 72
4 Discussion .............................................................................................................. 74
4.1 The chloride/proton exchanger ClC-5 increases the susceptibility of HT-29 cells
towards TcdA ............................................................................................................. 75
4.1.1 WT and E268Q ClC-5 are located to early and early-to-late endosomes in
HT-29 cells ............................................................................................................. 76
4.1.2 ClC-5 colocalizes with the C. difficile toxin TcdA ........................................ 77
4.1.3 ClC-5 promotes TcdA internalization and acidification of ClC-5 positive
endosomes ............................................................................................................. 79
4.2 The role of glycosylation in fine-tuning of ClC-5 mediated endocytosis ............ 81
4.2.1 R516W, N408E, and N408A ClC-5 have no complex glycosylation ........... 81
4.2.2 Mutations affecting the glycosylation of ClC-5 influence endosomal mobility
........................................................................................................... 83
vi
4.2.3 WT and mutant ClC-5 promote acidification, are located to late endosomes
and have no impaired endocytosis ......................................................................... 87
4.3 Summary and conclusions ............................................................................... 89
5 Appendices ............................................................................................................. 91
5.1 Materials ........................................................................................................... 91
5.1.1 Chemicals, buffers, solutions and equipment............................................. 91
5.2 Cell lines ........................................................................................................... 93
5.3 Plasmids ........................................................................................................... 94
5.4 Primers ............................................................................................................. 94
5.5 Parameters used for the colocalization analysis with SQUASSH ..................... 95
5.6 Supplemental Figures ....................................................................................... 95
6 Acknowledgement ................................................................................................ 101
7 References ........................................................................................................... 102
8 Lebenslauf ............................................................................................................ 119
9 List of publications ................................................................................................ 120
vii
1 List of Figures
Figure 1: Proposed topology model and crystal structure of a CLC protein (Dutzler et al., 2002;
Feng et al., 2010a). .............................................................................................................. 1
Figure 2: Phylogenetic tree of the CLC-protein family (based on Jentsch, 2015; Jentsch et al.,
2002; Wills and Fong, 2001). ............................................................................................... 2
Figure 3: Model of the ion transport in ClC-5 (modified from Park et al., 2017). ........................... 4
Figure 4: Proposed functions of ClC-5 in endosomes. ................................................................. 6
Figure 5: The paradox of chloride conductance and transmembrane orientation of ClC-5 (based
on George et al., 2001). ....................................................................................................... 7
Figure 6: Overview of the endocytosis pathway (modified from Huotari and Helenius, 2011). ..... 9
Figure 7: Transport of ClC-5 positive endosomes along microtubule in polarized cells (from Reed
et al., 2010)........................................................................................................................ 11
Figure 8: Structure of TcdA (modified from Chumbler et al., 2016). ........................................... 13
Figure 9: Cellular intoxication process of TcdA and TcdB (from Pruitt and Lacy, 2012). ............ 15
Figure 10: Dimeric structure of a chloride antiporters and location of Dent’s disease mutations
(from Pusch and Zifarelli, 2014). ........................................................................................ 17
Figure 11: Cytopathic effect of TcdA (modified from Ruhe et al., 2017). .................................... 19
Figure 12: Principle of TIRFM (based on Konopka and Bednarek 2008). .................................. 23
Figure 13: Colocalization workflow of the Fiji plugin SQUASSH (Rizk et al., 2014). ................... 24
Figure 14: Schematic explanation of object and size based colocalization analysis ................... 25
Figure 15: Workflow of the calculation of MSD. ......................................................................... 27
Figure 16: Examples of different progression curves of MSD. There are four different types of
MSD curves: active, free, anomalous (or subdiffusion), and confined. Endosomes are most
likely to display an anomalous MSD curve ......................................................................... 28
Figure 17: pH dependent fluorescence emission spectrum of pHluorin2 (modified from Mahon,
2011). ................................................................................................................................ 30
Figure 18: Workflow and calibration for analysis of vesicular pH using pHluorin2 (based on Ruhe
et al., 2017)........................................................................................................................ 31
Figure 19: Calibration curve for the absorbance at OD560 of HEK293 cells stably overexpressing
ClC-5-mCherry, E268Q ClC-5-mCherry, or mCherry alone (based on Ruhe et al., 2017). . 33
Figure 20: Cell density curve at OD750. ...................................................................................... 35
Figure 21: Expression of ClC-5-mCherry in HT-29 and HEK293T cells (modified from Ruhe et
al., 2017). .......................................................................................................................... 36
Figure 22: Localization of ClC-5-EYFP in HT-29 cells. ............................................................... 37

viii
Figure 23: Efficacy of ClC-5 mRNA knockdown by small interfering RNA (siRNA) in HT-29 cells
(modified from Ruhe et al., 2017). ...................................................................................... 38
Figure 24: ClC-5 knockdown decreases TcdA cytotoxicity (Modified from Ruhe et al., 2017). ... 38
Figure 25: Colocalization of ClC-5 with different mutants of Rab5 (Rab5WT, Rab5CA, and
Rab5DN) in HT-29 cells (modified from Ruhe et al., 2017). ............................................... 41
Figure 26: Colocalization of ClC-5 with Rab7, Rab11 and Rab4a in HT-29 cells (modified from
Ruhe et al., 2017) .............................................................................................................. 42
Figure 27: Subcellular localization of E268Q ClC-5 in HT-29 cells (modified from Ruhe et al.,
2017. ................................................................................................................................. 43
Figure 28: Colocalization of the non-transporting mutant E268Q ClC-5 with Rab5WT and
Rab5CA. ............................................................................................................................ 44
Figure 29: Internalization of TcdA-EGFP and colocalization with ClC-5 in living cells (modified
from Ruhe et al., 2017). ..................................................................................................... 45
Figure 30: Localization of TcdA-EGFP and ClC-5 in fixed HT-29 cells (modified from Ruhe et al.,
2017). ................................................................................................................................ 46
Figure 31: Localization of ClC-5 and labelled TcdA ................................................................... 48
Figure 32: WT or E268Q ClC-5 increase endocytosis of TcdA (modified from Ruhe et al., 2017).
.......................................................................................................................................... 49
Figure 33: ClC-5 promotes acidification (modified from Ruhe et al., 2017). ............................... 50
Figure 34: Possible N-glucosylation sites in the human ClC-5 protein predicted by the NetNGlyc
1.0 Server(Blom et al., 2004). ............................................................................................ 52
Figure 35: Endo H and PNGase F assay of WT, R516W, N408E and N408A ClC-5-mCherry. .. 53
Figure 36: Subcellular distribution of WT, and mutant ClC-5-mCherry in MDCKII cells. ............. 54
Figure 37: The tracking software, u.track2.1.3 (Jaqaman et al., 2008), tracks ClC-5 positive
endosomes accurately. ...................................................................................................... 55
Figure 38: Time lapse images of ClC-5 trajectories. .................................................................. 55
Figure 39 Lifetime, net displacement and mean velocity of trajectories from single cells recorded
with the low temporal resolution. ........................................................................................ 57
Figure 40: Correlations of lifetime, net displacement and mean velocities of trajectories recorded
at the low temporal resolution. ........................................................................................... 58
Figure 41: Single and mean MSD curves of trajectories of WT, R516W, N408E and N408A ClC-
5 in the low temporal resolution. ........................................................................................ 60
Figure 42: Diffusion coefficient (D) of trajectories as means of single cells. ............................... 60
Figure 43: Lifetime, net displacement and velocity of all trajectories from single cells of the high
temporal resolution. ........................................................................................................... 62

ix
Figure 44: 2D and 3D plots of trajectories as means from single cells of the high temporal
resolution. .......................................................................................................................... 63
Figure 45: Single and mean MSD curves of trajectories of WT, R516W, N408E and N408A ClC-
5 in the high temporal resolution.. ...................................................................................... 64
Figure 46: Overview of 50 single MSD curves and the fitted average MSD of ClC-5 endosomes.
.......................................................................................................................................... 65
Figure 47: Diffusion coefficients (D) of all trajectories from ClC-5 endosomes in single cells. .... 65
Figure 48: Target-orientation of endosomes from WT, R516W, N408E, and N408A ClC-5
endosomes. ....................................................................................................................... 66
Figure 49: WT ClC-5 and the mutants R516W, N408E and N408A promote acidification. ......... 69
Figure 50: Colocalization of WT, R516W, N408E and N408A ClC-5 with Rab7 in HEK293T cells.
.......................................................................................................................................... 71
Figure 51: Uptake of albumin or dextran is not altered in HEK293T cells transiently expressing
WT, R516W, N408E and N408A ClC-5. ............................................................................. 73
Supplemental Figure 1: Densiometric analysis of SDS-gel of proteins from WT, R516W, N408E,
or N408A proteins. ............................................................................................................. 95
Supplemental Figure 2: Lifetime, net displacement and mean velocity of all trajectories of the
different ClC-5 constructs in low temporal resolution. ........................................................ 96
Supplemental Figure 3: Lifetime, net displacement and mean velocity of all trajectories of the
different ClC-5 constructs in high temporal resolution. ....................................................... 97
Supplemental Figure 4: Velocity and displacement of particles from low and high temporal
resolution. .......................................................................................................................... 98
Supplemental Figure 5: Uptake of Albumin in MDCKII cells expressing WT, R516W, N408E, and
N408A ClC-5. .................................................................................................................... 99
Supplemental Figure 6: Colocalization of WT, R516W, and N408E ClC-5 with Rab7 in MDCKII
cells. ................................................................................................................................ 100
x
2 List of Tables
Table 1: List of mutations detected in ........................................................................................ 17
Table 2: Overview of the amount of analyzed cells, detected particles and linked trajectories of
ClC-5 positive endosomes from MDCKII cells. ................................................................... 56
Table 3: Comparison of the lifetime, net displacement, mean velocity, and D values between the
low and high temporal resolution. ...................................................................................... 67
Supplementary Table 1: Chemicals used in this work. ............................................................... 91
Supplementary Table 2: Solutions and buffers used in this work. .............................................. 91
Supplementary Table 3: Cell lines and cell culture medium. ...................................................... 92
Supplementary Table 4: Kits used in this work .......................................................................... 92
Supplementary Table 5: Equipment used for this work. ............................................................. 93
Supplementary Table 6: Software and online tools. ................................................................... 93
Supplementary Table 7: Cell lines used in this work. ................................................................. 93
Supplementary Table 8: Plasmids used in this work. ................................................................. 94
Supplementary Table 9: Primers used in this work. ................................................................... 94
Supplementary Table 10:Parameters used for the colocalization analysis. Standard deviations
(stddev) of the point-spread function model (PSF) is given in pixel. ................................... 95

xi
3 List of Abbreviations
Abbreviation Description
µg microgram µl microliter µM micromolar µm micrometer APD autoprotease domain APM apical plasma membrane BCA bicinchoninic acid assay CA constitutive active C. difficile Clostridium difficile CBS cystathione ß-synthetase CC coiled coil CDI C. difficile infection CLC chloride channel cmCLC chloride channel of Cyanidioschyzon merolae CROP c-terminal repetitive oligopeptides DN dominant negative DNA Deoxyribonucleic acid EcClC-1 chloride channel 1 of Escherichia coli EDTA Ethylenediaminetetraacetic acid EE early endosome EGFP enhanced green fluorescent protein ER endoplasmic reticulum EYFP enhanced yellow fluorescent protein FBS fetal bovine serum g earth’s gravitational acceleration GC glomerular domain GTP glucosyltransferase domain GTPase guanosine triphosphatase h hours InsP6 inositol hexakisphosphate KIF3B kinesin family member B3 LE late endosome LMW low molecular weight LSM laser scanning microscope min minutes ml milliliter mRNA messenger ribonucleic acid MSD mean square displacement Nedd4-2 neuronal precursor allel expressed developmentally
downregulated 4 nm nanometer nM nanomolar

xii
OCRL oculocerebrorenal syndrome of Lowe Ostm1 osteopetrosis associated membrane protein 1 PaLoc pathogenicity loci PBS Phosphate-buffered saline PFA Paraformaldehyde PM plasma membrane PT proximale tubule qRT-PCR quantitative reverse-transcription polymerase chain reaction Rab Ras-related in brain Ras rat sarcoma Rho Ras homologe RNA Ribonucleic acid rpm rounds per minute siRNA small interference ribonucleic acid RT room temperature s seconds SDS-PAGE sodium dodecyl sulfate polyacrylamide gel electrophoresis SEM standard error of mean TcdA, TcdB Toxin A or B of Clostridium difficile TIRF total internal fluorescence VAMP Vesicle associated membrane proteins V-ATPase vacuolar adenosintriphosphatase WT wild-type
Introduction
1
1 Introduction
The CLC protein family
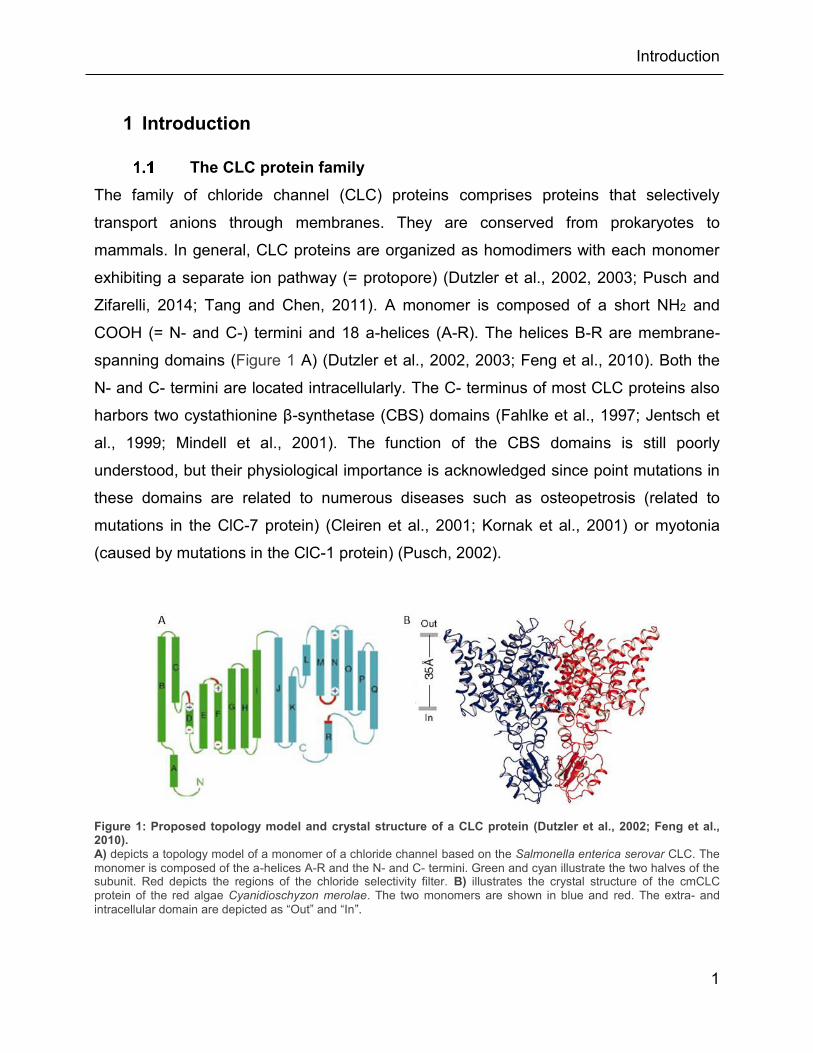
The family of chloride channel (CLC) proteins comprises proteins that selectively
transport anions through membranes. They are conserved from prokaryotes to
mammals. In general, CLC proteins are organized as homodimers with each monomer
exhibiting a separate ion pathway (= protopore) (Dutzler et al., 2002, 2003; Pusch and
Zifarelli, 2014; Tang and Chen, 2011). A monomer is composed of a short NH2 and
COOH (= N- and C-) termini and 18 a-helices (A-R). The helices B-R are membrane-
spanning domains (Figure 1 A) (Dutzler et al., 2002, 2003; Feng et al., 2010). Both the
N- and C- termini are located intracellularly. The C- terminus of most CLC proteins also
harbors two cystathionine β-synthetase (CBS) domains (Fahlke et al., 1997; Jentsch et
al., 1999; Mindell et al., 2001). The function of the CBS domains is still poorly
understood, but their physiological importance is acknowledged since point mutations in
these domains are related to numerous diseases such as osteopetrosis (related to
mutations in the ClC-7 protein) (Cleiren et al., 2001; Kornak et al., 2001) or myotonia
(caused by mutations in the ClC-1 protein) (Pusch, 2002).
Figure 1: Proposed topology model and crystal structure of a CLC protein (Dutzler et al., 2002; Feng et al., 2010). A) depicts a topology model of a monomer of a chloride channel based on the Salmonella enterica serovar CLC. The monomer is composed of the a-helices A-R and the N- and C- termini. Green and cyan illustrate the two halves of the subunit. Red depicts the regions of the chloride selectivity filter. B) illustrates the crystal structure of the cmCLC protein of the red algae Cyanidioschyzon merolae. The two monomers are shown in blue and red. The extra- and intracellular domain are depicted as “Out” and “In”.
Introduction
2
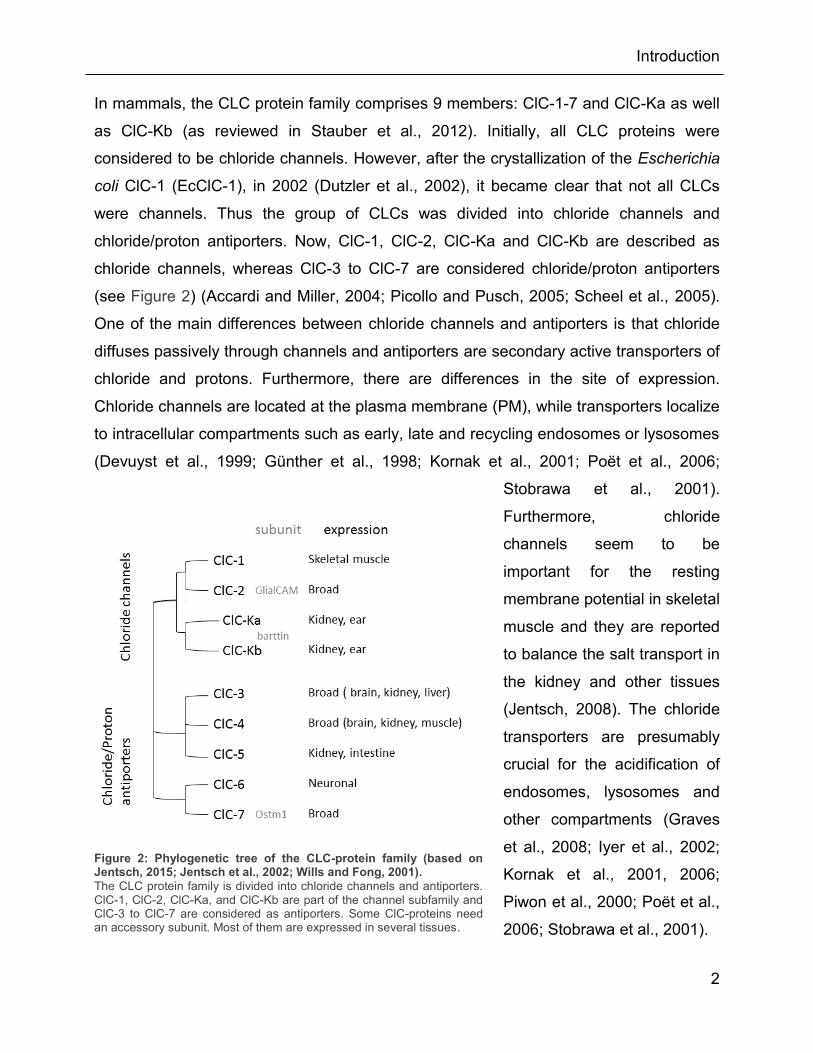
In mammals, the CLC protein family comprises 9 members: ClC-1-7 and ClC-Ka as well
as ClC-Kb (as reviewed in Stauber et al., 2012). Initially, all CLC proteins were
considered to be chloride channels. However, after the crystallization of the Escherichia
coli ClC-1 (EcClC-1), in 2002 (Dutzler et al., 2002), it became clear that not all CLCs
were channels. Thus the group of CLCs was divided into chloride channels and
chloride/proton antiporters. Now, ClC-1, ClC-2, ClC-Ka and ClC-Kb are described as
chloride channels, whereas ClC-3 to ClC-7 are considered chloride/proton antiporters
(see Figure 2) (Accardi and Miller, 2004; Picollo and Pusch, 2005; Scheel et al., 2005).
One of the main differences between chloride channels and antiporters is that chloride
diffuses passively through channels and antiporters are secondary active transporters of
chloride and protons. Furthermore, there are differences in the site of expression.
Chloride channels are located at the plasma membrane (PM), while transporters localize
to intracellular compartments such as early, late and recycling endosomes or lysosomes
(Devuyst et al., 1999; Günther et al., 1998; Kornak et al., 2001; Poët et al., 2006;
Stobrawa et al., 2001).
Furthermore, chloride
channels seem to be
important for the resting
membrane potential in skeletal
muscle and they are reported
to balance the salt transport in
the kidney and other tissues
(Jentsch, 2008). The chloride
transporters are presumably
crucial for the acidification of
endosomes, lysosomes and
other compartments (Graves
et al., 2008; Iyer et al., 2002;
Kornak et al., 2001, 2006;
Piwon et al., 2000; Poët et al.,
2006; Stobrawa et al., 2001).
Figure 2: Phylogenetic tree of the CLC-protein family (based on Jentsch, 2015; Jentsch et al., 2002; Wills and Fong, 2001).
The CLC protein family is divided into chloride channels and antiporters. ClC-1, ClC-2, ClC-Ka, and ClC-Kb are part of the channel subfamily and ClC-3 to ClC-7 are considered as antiporters. Some ClC-proteins need an accessory subunit. Most of them are expressed in several tissues.

Introduction
3
In transporters, each monomer translocates two chloride ions at the expense of one
proton through an ion translocation pathway (Alekov and Fahlke, 2009; De Angeli et al.,
2006; Zdebik et al., 2008). CLCs are expressed ubiquitously: ClC-1 is mainly expressed
in skeletal muscles where it mediates chloride conductance (Lueck et al., 2007;
Steinmeyer et al., 1991). ClC-2 is broadly expressed and one of the few chloride
channels requiring a ß-subunit, GliaCAM, which modulates its functionality (Jeworutzki
et al., 2012). ClC-Ka and ClC-Kb are present in the kidney and the stria vascularis of the
inner ear. Both chloride channels require barttin as a subunit (Estévez et al., 2001;
Uchida et al., 1995). The chloride transporters are all broadly expressed (except for ClC-
6). Multiple different functions are ascribed to ClC-3, for instance the volume-regulation
in gastric epithelial cells (Jin et al., 2003) or the influence on synaptic transmission in
neurons (Guzman et al., 2014). The function of ClC-4 is quite unclear, but an interesting
finding suggests that ClC-4 can switch from transporter to a channel-like mode (Alekov
and Fahlke, 2009). ClC-5 is required for endosomal acidification but its exact role is still
unknown (Hara-Chikuma et al., 2005). ClC-6 is the only chloride transporter which is
almost exclusively located to the neuronal system (Poët et al., 2006). The
chloride/proton exchanger ClC-7 is the only chloride transporter that needs a subunit for
functionality. The protein Ostm1 (osteopetrosis associated membrane protein 1) is
essential for the activity of ClC-7 (Lange et al., 2006; Leisle et al., 2011).
Since ClC-5 is located to endosomes and important for the endocytosis, this chloride
antiporter was of particular interest in this work. Its structure, function, and mutations in
the CLCN5 genes that are related to disease will be introduced in the following chapters.
The chloride/proton antiporter ClC-5
The chloride/proton antiporter ClC-5 is a member of the CLC antiporter subfamily. ClC-5
is highly expressed in kidney cells, especially in cells of the proximal tubule (PT), the
thick ascending limp of Henle’s loop and intercalated cells of the collecting duct (Devuyst
et al., 1999). Apart from its renal expression, ClC-5 has also been detected in the brain,
lung, liver (Steinmeyer et al., 1995), and rat intestinal cells (Vandewalle et al., 2001).
Introduction
4
ClC-5 is located on early, late, and recycling endosomes (Christensen et al., 2003a),
and to a smaller extent at the PM (Friedrich et al., 1999; Günther et al., 1998).
It is important for the regulation of endosomal pH, which is stressed by the loss of ClC-5
that impairs endosomal acidification (Hara-Chikuma et al., 2005). ClC-5 is an
electrogenic transporter exchanging two chloride ions by one proton. Thereby, it
provides chloride currents over membranes (Picollo and Pusch, 2005). The transport
depends on two anion binding sites (Scent and Sext) and two glutamates: a so-called
gating glutamate as well as a proton glutamate (E211 and E268, respectively) (see
Figure 3 for a model).
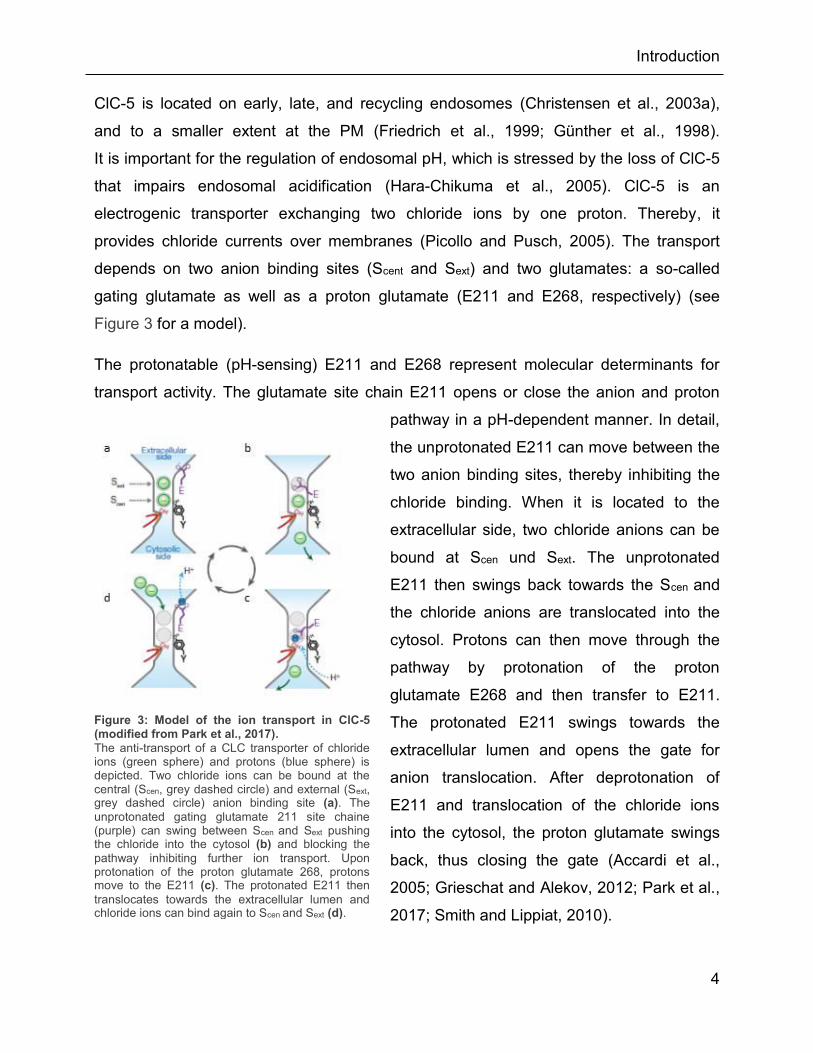
The protonatable (pH-sensing) E211 and E268 represent molecular determinants for
transport activity. The glutamate site chain E211 opens or close the anion and proton
pathway in a pH-dependent manner. In detail,
the unprotonated E211 can move between the
two anion binding sites, thereby inhibiting the
chloride binding. When it is located to the
extracellular side, two chloride anions can be
bound at Scen und Sext. The unprotonated
E211 then swings back towards the Scen and
the chloride anions are translocated into the
cytosol. Protons can then move through the
pathway by protonation of the proton
glutamate E268 and then transfer to E211.
The protonated E211 swings towards the
extracellular lumen and opens the gate for
anion translocation. After deprotonation of
E211 and translocation of the chloride ions
into the cytosol, the proton glutamate swings
back, thus closing the gate (Accardi et al.,
2005; Grieschat and Alekov, 2012; Park et al.,
2017; Smith and Lippiat, 2010).
Figure 3: Model of the ion transport in ClC-5 (modified from Park et al., 2017).
The anti-transport of a CLC transporter of chloride ions (green sphere) and protons (blue sphere) is depicted. Two chloride ions can be bound at the central (Scen, grey dashed circle) and external (Sext, grey dashed circle) anion binding site (a). The unprotonated gating glutamate 211 site chaine (purple) can swing between Scen and Sext pushing the chloride into the cytosol (b) and blocking the pathway inhibiting further ion transport. Upon protonation of the proton glutamate 268, protons move to the E211 (c). The protonated E211 then translocates towards the extracellular lumen and chloride ions can bind again to Scen and Sext (d).
Introduction
5
Electrophysiological studies have shown that ClC-5 is voltage dependent and
characterized by strong outward rectifying currents. This means that ClC-5 located to the
PM transports chloride into the cell when positive voltages are applied. However, at
negative voltages, ClC-5 does not generate any currents (Steinmeyer et al., 1995;
Zifarelli and Pusch, 2009).
The coupled transport can be abolished by mutating the proton glutamate at position
E268. Mutating the glutamate to an alanine at the corresponding site in EcClC-1
abolished the proton transport and resulted in a passive chloride channel (Accardi et al.,
2005; Lim and Miller, 2009). In ClC-5, the E268Q substitution completely abolished the
transport function (Grieschat and Alekov, 2012; Smith and Lippiat, 2010; Zdebik et al.,
2008). The transport can be uncoupled by a mutation in the gating glutamate (E211A
ClC-5), transforming the antiporter into a pure chloride channel (Accardi and Miller,
2004; Accardi et al., 2004; Picollo and Pusch, 2005; Satoh et al., 2016; Scheel et al.,
2005).
As described above, the role of the chloride/proton exchange capability of ClC-5 in
endocytosis is of great importance. This was shown in ClC-5 knockout mice which
exhibited an impaired receptor-mediated endocytosis of LMW proteins (Piwon et al.,
2000; Wang et al., 2000). Yet, its exact role has been debated over the last few years
resulting in three different models (illustrated in Figure 4). Initially, ClC-5 was described
to ensure acidification of endosomes by providing counter ions for the proton pump
V-ATPase (vacuolar-type ATPase) (Devuyst et al., 1999; Lloyd et al., 1996; Picollo and
Pusch, 2005; Piwon et al., 2000; Scheel et al., 2005; Wang et al., 2000). Alternatively, it
was also proposed that ClC-5 is necessary for direct acidification by exchanging
endosomal chloride anions for protons (Picollo and Pusch, 2005; Scheel et al., 2005).
Another possibility is that ClC-5’s exchange function creates hypotonicity (osmotic
pressure) which directly causes activation of the V-ATPase, supporting the chloride
shunt model. Using the E211A ClC-5 mutation in mice, which rendered ClC-5 a pure
chloride channel, showed an accumulation of chloride in endosomes which led to an
impaired acidification but normal endocytosis. Based on this, the researchers concluded
that the chloride/proton exchange mode of ClC-5 is necessary to activate the V-ATPase
(Satoh et al., 2016).

Introduction
6
Figure 4: Proposed functions of ClC-5 in endosomes.
The three different models for the function of ClC-5 in endosomes that were proposed are displayed. The chloride shunt model (A), direct acidification model (B), and the direct activation of V-ATPase model (C). It is established that the V-ATPase is necessary for the acidification of endosomes. It pumps protons from the cytosol into the vesicular lumen (as reviewed in Maxson and Grinstein, 2014). A) In the chloride shunt model, ClC-5 pumps chloride ions into the endosome to provide counter ions for the V-ATPase. B) The direct acidification model proposes that ClC-5 directly acidifies endosomes by pumping protons into the vesicular lumen. C) The direct activation of V-APTase model supports the chloride shunt model. Satho and coworkers showed that if ClC-5 is mutated to a pure chloride channel (E211A ClC-5), the endosomal acidification is impaired but endocytosis is normal. Based on these findings, they proposed that the chloride/proton exchange mode of ClC-5 activates the V-ATPase.
Besides the different proposed functions of ClC-5, the orientation of the ClC-5 protein in
the PM and in endosomes remains paradox (see Figure 5): In heterologous expression
systems (for instance in Xenopus oocytes or HEK293 cells), ClC-5 is expressed at the
PM and in endosomes.
When situated in the PM it exhibits an outward rectification, generating chloride
conductance into the cell at positive membrane potentials (Sakamoto et al., 1996;
Steinmeyer et al., 1995).

Introduction
7
However, Smith and Lippiat were able to demonstrate that ClC-5 is responsible for direct
acidification of endosomes independent of the activity of the V-ATPase (Smith and
Lippiat, 2010). This raises the (so far unanswered) question if ClC-5 behaves differently
in the intracellular environment or if accessory subunits modulate its activity.
Figure 5: The paradox of chloride conductance and transmembrane orientation of ClC-5 (based on George et al., 2001). The transmembrane orientation of ClC-5 in the PM or in the endosomal membrane is shown. (A) Electrophysiological studies demonstrated that ClC-5 transports chloride into the cell upon positive membrane potentials. Negative membrane potentials result in no currents (B) ClC-5 is predicted to have different transmembrane orientations in the ER, surface membranes or intracellular vesicles. The branched, black line indicates the extracellular glycosylation site and the amino and carboxyl domains are depicted by short blue lines with knobs.

Introduction
8
The role of ClC-5 in clathrin-mediated endocytosis
Endocytosis describes the process by which extracellular fluid or particles are
internalized into the cell. Since ClC-5 is involved in receptor-mediated endocytosis
(=clathrin-mediated endocytosis) (Christensen et al., 2003b), the following part will focus
on this particular endocytosis mechanism and the role of ClC-5.
In the kidney, the essential function of water and solutes handling depends on the
expression, trafficking, and interaction of transport systems (Christensen et al., 2003a;
Devuyst and Luciani, 2015). Albumin and other low molecular weight (LMW) proteins are
filtered and reabsorbed in the PT. LMW proteins include hormones such as parathyroid
or growth hormones, albumin, transferrin, carrier proteins like retinol-binding proteins,
enzymes, immunoglobulin light chains, and drugs or toxins (Christensen and Birn,
2002). Their uptake mainly occurs via clathrin-dependent, receptor-mediated
endocytosis and involves two receptors: Megalin and cubilin (Christensen et al., 2003a;
Dickson et al., 2014; Nielsen and Christensen, 2010). Using purified proteins,
Christensen and Bin have shown that the N-terminus of cubilin interacts with megalin
upon ligand binding (Christensen and Birn, 2002). After ligand binding and the
internalization of receptor and ligand into coated vesicles, the further progression of
these endosomes along the endocytic pathway is dependent on acidification of the
endosome (Hurtado-Lorenzo et al., 2006). The primary formed vesicles fuse with early
endosomes. Then, the internalized substrates are either directly transported to the PM
through recycling endosomes, or further processed in late endosomes and finally
degraded in lysosomes (Huotari and Helenius, 2011; Mellman, 1996) (see Figure 6).
The acidified environment causes the dissociation of the receptor-ligand complex. It also
modulates vesicle trafficking and fusion events with other endosomes (Johnson et al.,
1993). The acidification is accompanied by swelling of endosomes. Protons play an
important role for the maturation from early to late or recycling endosomes. At the same
time, the chloride concentration is a central element. It was shown that the chloride
concentration increases from early endosomes (20 - 40 mM) to lysosomes (>80 mM)
(Sonawane and Verkman, 2003; Sonawane et al., 2002).

Introduction
9
Renal ClC-5 is mainly expressed in cells of the PT, but also in the thick ascending limp
of Henle’s loop and a-type intercalated cells of the collecting duct (Devuyst et al., 1999).
ClC-5 colocalizes with the proton pump V-ATPase on early endosomes, which
transports protons into endosomes for acidification (Devuyst et al., 1999; Günther et al.,
1998). Although the role of ClC-5 has been debated, it is established that it plays an
important role in the endocytic pathway because a disruption of the CLCN5 gene in mice
causes a reduced endocytosis in PT (Piwon et al., 2000). In order to highlight the
importance of ClC-5 in endocytosis, the next paragraph describes its interaction with
motor proteins.
Figure 6: Overview of the endocytosis pathway (modified from Huotari and Helenius, 2011).
Endocytosed particles or substrates are internalized in vesicles. These vesicles then fuse with early endosomes (EE). EE are then either directly transported back to the PM via recycling endosomes, or the endosomes further maturate and fuse with late endosomes (LE) and are then degraded in the lysosomes. Rab proteins as marker for specific endosomes are displayed as well (as reviewed in Hutagalung and Novick, 2011).
Introduction
10
Interaction of ClC-5 with motor proteins
ClC-5 positive endosomes are transported along microtubules and this transport
requires the interaction with motor proteins. In 2010, Reed and colleagues were able to
identify one motor protein that interacts with ClC-5: Kinesin family member B3 (KIF3B), a
member of the kinesin 2 subfamily (Reed et al., 2010). In ClC-5 knockout mice and cell
cultures, the authors demonstrated that the C-terminus of ClC-5 directly interacted with
the coiled-coil (CC) and globular domain (GC) of KIF3B. In addition, KIF3B is important
for the transport of ClC-5 to the PM. The C-terminus of ClC-5 is of great importance for
the endocytosis and endosomal trafficking, as it has been shown to interact not only with
KIF3B but also with cofilin (Hryciw et al., 2003) and Nedd4-2, a member of the neuronal
precursor cell-expressed developmentally downregulated 4 protein family (Hryciw et al.,
2004). Cofilin is an actin depolymerization factor and promotes actin assembly or
disassembly (Andrianantoandro and Pollard, 2006; Bamburg and Bernstein, 2010).
Nedd4-2 on the other hand is an ubiquitin-ligase protein (Harvey and Kumar, 1999) that
is involved in the regulation of the surface expression of proteins.
Ubiquitination of ClC-5 causes a degradation of the protein as well as its removal from
the PM (Schwake et al., 2001). The proposed endocytic model in polarized cells is
displayed in Figure 7 (Reed et al., 2010): ClC-5 is located at the apical plasma
membrane (APM) with other interacting proteins such as Nedd4-2, NHERF and cofilin
(Hryciw et al., 2003, 2004, 2006). Upon binding of a ligand to megalin or cubilin
receptors, clathrin coated vesicles are internalized into the cell (Devuyst et al., 1999;
Hamm-Alvarez and Sheetz, 1998). Those vesicles contain not only ClC-5 but also
ClC-4, a homolog protein of ClC-5 that is broadly expressed in the brain, kidney and
muscles (Mohammad-Panah et al., 2003; Stauber et al., 2012). The transport along the
microtubules occurs via the Kinesin-2 complex (Hamm-Alvarez and Sheetz, 1998) and
the vesicles get acidified and fuse with early endosomes (Jentsch, 2007; Reed et al.,
2010).
Introduction
11
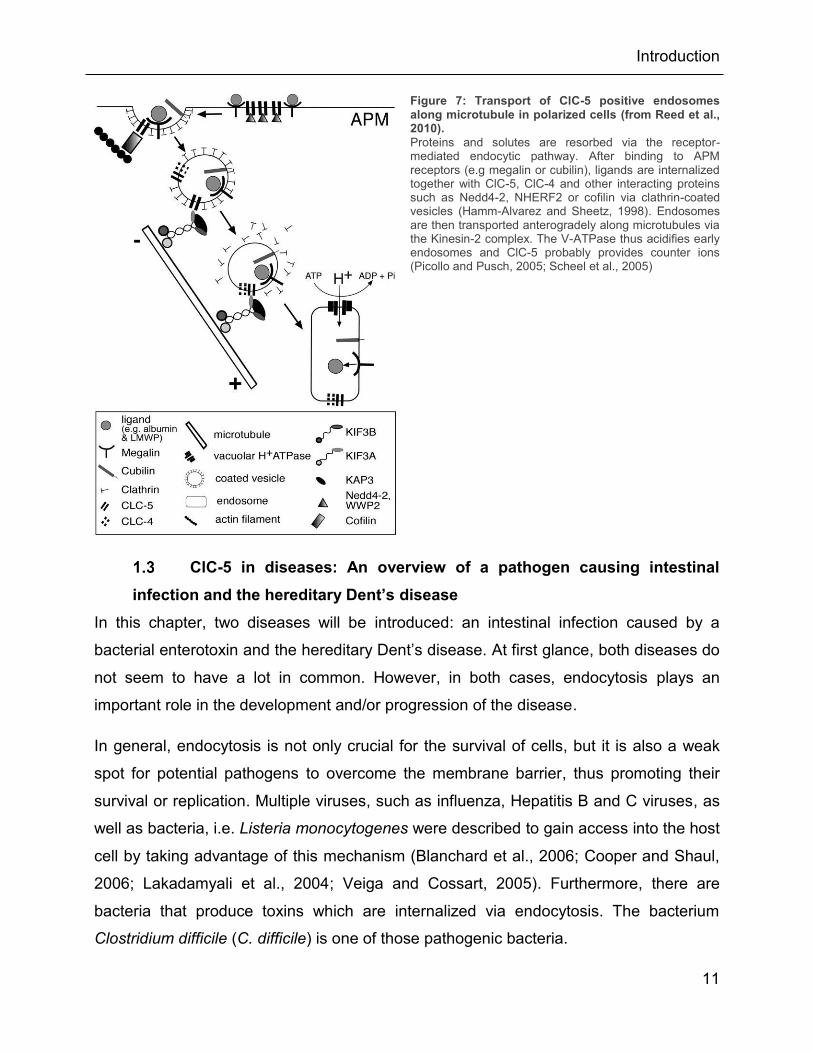
Figure 7: Transport of ClC-5 positive endosomes along microtubule in polarized cells (from Reed et al., 2010).
Proteins and solutes are resorbed via the receptor-mediated endocytic pathway. After binding to APM receptors (e.g megalin or cubilin), ligands are internalized together with ClC-5, ClC-4 and other interacting proteins such as Nedd4-2, NHERF2 or cofilin via clathrin-coated vesicles (Hamm-Alvarez and Sheetz, 1998). Endosomes are then transported anterogradely along microtubules via the Kinesin-2 complex. The V-ATPase thus acidifies early endosomes and ClC-5 probably provides counter ions (Picollo and Pusch, 2005; Scheel et al., 2005)
ClC-5 in diseases: An overview of a pathogen causing intestinal
infection and the hereditary Dent’s disease
In this chapter, two diseases will be introduced: an intestinal infection caused by a
bacterial enterotoxin and the hereditary Dent’s disease. At first glance, both diseases do
not seem to have a lot in common. However, in both cases, endocytosis plays an
important role in the development and/or progression of the disease.
In general, endocytosis is not only crucial for the survival of cells, but it is also a weak
spot for potential pathogens to overcome the membrane barrier, thus promoting their
survival or replication. Multiple viruses, such as influenza, Hepatitis B and C viruses, as
well as bacteria, i.e. Listeria monocytogenes were described to gain access into the host
cell by taking advantage of this mechanism (Blanchard et al., 2006; Cooper and Shaul,
2006; Lakadamyali et al., 2004; Veiga and Cossart, 2005). Furthermore, there are
bacteria that produce toxins which are internalized via endocytosis. The bacterium
Clostridium difficile (C. difficile) is one of those pathogenic bacteria.
Introduction
12
It is one of the most prevalent health-care related pathogens causing severe diarrhea
(Papatheodorou et al., 2010). Because ClC-5 is important for endocytosis and toxins of
C. difficile enter the host’s cell via clathrin-mediated and clathrin-independent pathways,
it may be possible that ClC-5 plays a role in this intoxication.
Besides pathogens using the cell’s endocytosis machinery for their own survival, a
disrupted endocytosis can also cause the manifestation of a disease by itself. The
hereditary Dent’s disease is one example for a disease that is characterized by a
deficiency in the endocytosis of albumin and LMW proteins. It is caused by mutations in
the CLCN5 gene (Piwon et al., 2000). Causes and symptoms of the Dent’s disease will
also be displayed in this chapter.
Clostridium difficile and its enterotoxins (TcdA and TcdB)
C. difficile is an anaerobic, spore producing, gram positive bacterium that can cause
severe C. difficile infection (CDI) (Borriello, 1998; Hall, 1935). In 2011, nearly half a
million people suffered from CDI in the United States (Lessa et al., 2015). CDI starts with
the ingestion of spores from C. difficile, for instance via aerosols, which can cause a
colonization of the bacterium in the colon (McFarland et al., 1989). Antibiotic treatment
causes a disruption of the normal bacterial gut flora, favoring the bacterium to germinate
and colonize. C. difficile thus produces toxins inducing diarrhea and colitis. Spores that
were produced by the colonizing bacteria exit the host via this route to close the life
cycle and spread to new hosts (Martinez et al., 2012; Paredes-Sabja et al., 2014).
The two main virulence factors of C. difficile are two large clostridial cytotoxins: TcdA
and TcdB (Tcd = toxin of C. difficile) (Voth and Ballard, 2005). These exotoxins are
proteins with a size of 308 and 270 kDa respectively and comprise several functional
domains (Jank and Aktories, 2008) (Figure 8): A receptor binding domain that is
composed of C-terminal combined repetitive oligopeptides (CROP), a pore-forming
domain, an autoprotease domain, and a translocation (= delivery) domain as well as the
N-terminus, which processes a glucosyltransferase domain (GTD) (Genisyuerek et al.,
2011).

Introduction
13
The genes are encoded in the pathogenicity loci (PaLoc), which contain (apart from tcda
and tcdb) the tcdr, an alternative RNA polymerase sigma factor, controlling the
expression of tcda and tcdb (Mani and Dupuy, 2001). Two additional genes responsible
for the extracellular release and gene repression are also encoded in the PaLoc
sequence (Govind and Dupuy, 2012; Govind et al., 2015; Hundsberger et al., 1997;
Olling et al., 2012; Tan et al., 2001).
Figure 8: Structure of TcdA (modified from Chumbler et al., 2016). A) TcdA is comprised of four domains that build the primary structure: the glucosyltransferase domain (GTD, red), the autoprotease domain (APD, purple; including the three-helix bundle, dark purple), the delivery domain (yellow) and the CROPS domain (white). B and C) Cartoon representing the TcdA1 -1832 structure (with the same color code as in a), with zinc shown in green. The CROP domain is not shown.
Introduction
14
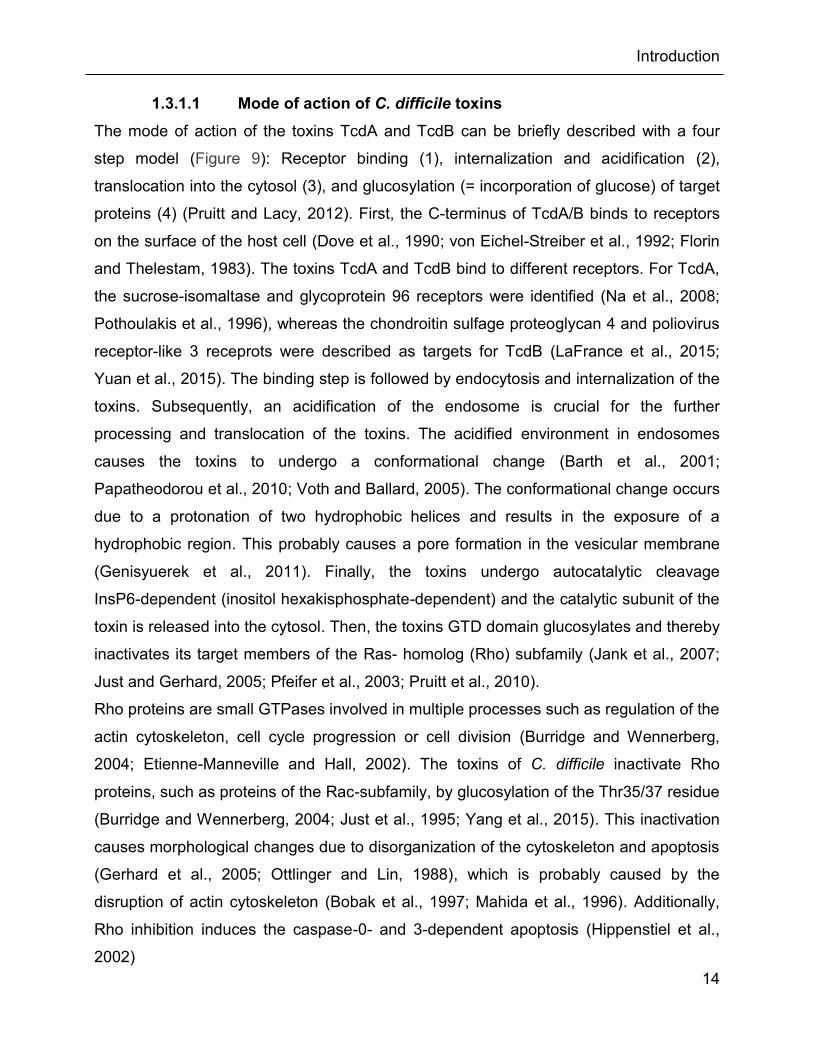
1.3.1.1 Mode of action of C. difficile toxins
The mode of action of the toxins TcdA and TcdB can be briefly described with a four
step model (Figure 9): Receptor binding (1), internalization and acidification (2),
translocation into the cytosol (3), and glucosylation (= incorporation of glucose) of target
proteins (4) (Pruitt and Lacy, 2012). First, the C-terminus of TcdA/B binds to receptors
on the surface of the host cell (Dove et al., 1990; von Eichel-Streiber et al., 1992; Florin
and Thelestam, 1983). The toxins TcdA and TcdB bind to different receptors. For TcdA,
the sucrose-isomaltase and glycoprotein 96 receptors were identified (Na et al., 2008;
Pothoulakis et al., 1996), whereas the chondroitin sulfage proteoglycan 4 and poliovirus
receptor-like 3 receprots were described as targets for TcdB (LaFrance et al., 2015;
Yuan et al., 2015). The binding step is followed by endocytosis and internalization of the
toxins. Subsequently, an acidification of the endosome is crucial for the further
processing and translocation of the toxins. The acidified environment in endosomes
causes the toxins to undergo a conformational change (Barth et al., 2001;
Papatheodorou et al., 2010; Voth and Ballard, 2005). The conformational change occurs
due to a protonation of two hydrophobic helices and results in the exposure of a
hydrophobic region. This probably causes a pore formation in the vesicular membrane
(Genisyuerek et al., 2011). Finally, the toxins undergo autocatalytic cleavage
InsP6-dependent (inositol hexakisphosphate-dependent) and the catalytic subunit of the
toxin is released into the cytosol. Then, the toxins GTD domain glucosylates and thereby
inactivates its target members of the Ras- homolog (Rho) subfamily (Jank et al., 2007;
Just and Gerhard, 2005; Pfeifer et al., 2003; Pruitt et al., 2010).
Rho proteins are small GTPases involved in multiple processes such as regulation of the
actin cytoskeleton, cell cycle progression or cell division (Burridge and Wennerberg,
2004; Etienne-Manneville and Hall, 2002). The toxins of C. difficile inactivate Rho
proteins, such as proteins of the Rac-subfamily, by glucosylation of the Thr35/37 residue
(Burridge and Wennerberg, 2004; Just et al., 1995; Yang et al., 2015). This inactivation
causes morphological changes due to disorganization of the cytoskeleton and apoptosis
(Gerhard et al., 2005; Ottlinger and Lin, 1988), which is probably caused by the
disruption of actin cytoskeleton (Bobak et al., 1997; Mahida et al., 1996). Additionally,
Rho inhibition induces the caspase-0- and 3-dependent apoptosis (Hippenstiel et al.,
2002)
Introduction
15
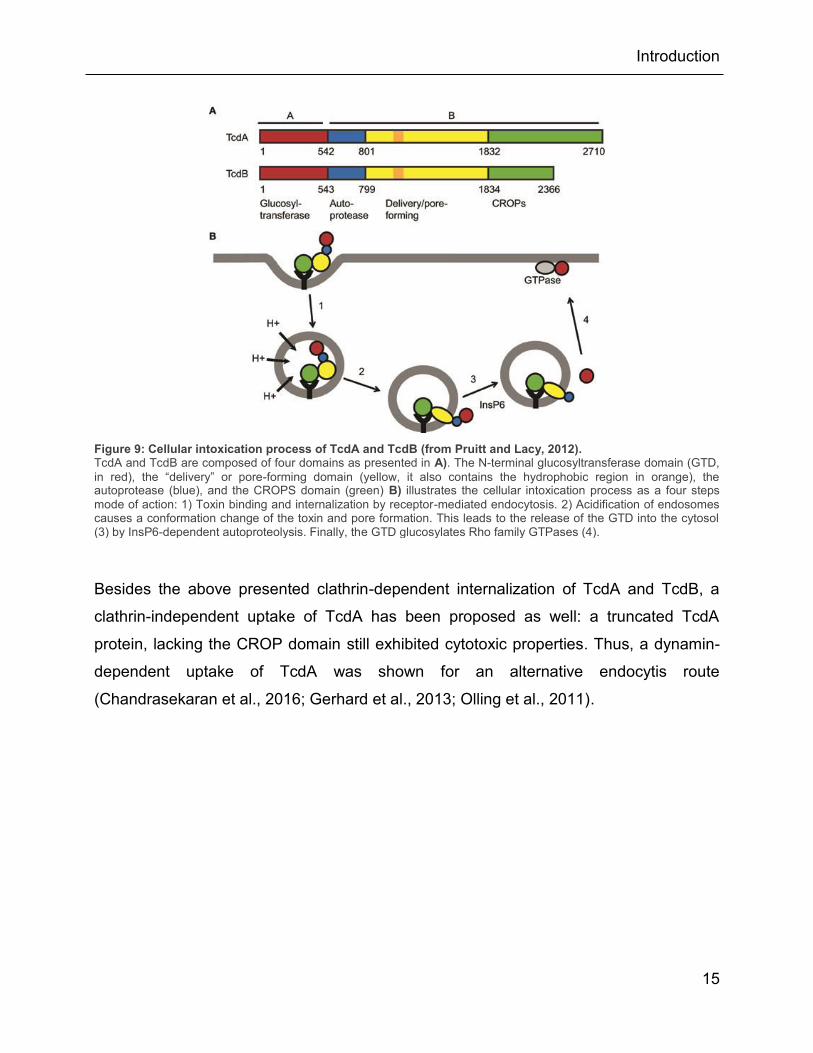
Besides the above presented clathrin-dependent internalization of TcdA and TcdB, a
clathrin-independent uptake of TcdA has been proposed as well: a truncated TcdA
protein, lacking the CROP domain still exhibited cytotoxic properties. Thus, a dynamin-
dependent uptake of TcdA was shown for an alternative endocytis route
(Chandrasekaran et al., 2016; Gerhard et al., 2013; Olling et al., 2011).
Figure 9: Cellular intoxication process of TcdA and TcdB (from Pruitt and Lacy, 2012). TcdA and TcdB are composed of four domains as presented in A). The N-terminal glucosyltransferase domain (GTD, in red), the “delivery” or pore-forming domain (yellow, it also contains the hydrophobic region in orange), the autoprotease (blue), and the CROPS domain (green) B) illustrates the cellular intoxication process as a four steps mode of action: 1) Toxin binding and internalization by receptor-mediated endocytosis. 2) Acidification of endosomes causes a conformation change of the toxin and pore formation. This leads to the release of the GTD into the cytosol (3) by InsP6-dependent autoproteolysis. Finally, the GTD glucosylates Rho family GTPases (4).

Introduction
16
Dent’s disease
Endocytosis is a pivotal cellular mechanism which is not only important for physiological
processes but also associated with diseases. On the one hand, pathogens use this
mechanism to enter the host’s cell thereby causing infections. On the other hand,
mutations in proteins involved in endocytosis might result in dysregulation of endocytic
processes which can become manifested in sever disorders. One of these diseases is
the Dent’s disease which can be caused by a mutation in the CLCN5 gene.
Dent’s disease is a tubulopathy first described in 1964 (Dent and Friedman, 1964). It is a
rare, recessive, X-linked renal disorder. So far, only members of around 250 families
have been described to suffer from Dent’s disease (Devuyst and Thakker, 2010). The
disease is characterized by a malfunction of solute handling: The main symptoms are
nephrocalcinosis, hypercalciuria and LMW proteinuria (Scheinman, 1998). In addition,
aminoaciduria, phosphaturia, glycosuria, uricosuria, kaliuresis and impaired urinary
acidification were found in affected individuals (Wrong et al., 1994). In men, some
symptoms are more manifested than in woman. For instance, 99 % of male patients
have LMW proteinuria compared to 70 % of female patients. 96 % of male Dent’s
patients also show hypercalciuria whereas only 50 % of affected females suffer from this
symptom. Around 75% of affected men show nephrocalcinosis and a lower percentage
has end stage renal failure (30 – 50 %). While these effects are extremely rare in women
(only one female Dent’s disease patient was reported to suffer from end stage renal
failure) (Scheinman, 1998; Sethi et al., 2009; Wu et al., 2009).
Dent’s disease is divided into type 1 and type 2 (Dent-1 and Dent-2) differing with regard
to mutated genes and level of manifestation of symptoms in patients (Bökenkamp and
Ludwig, 2010; Wrong et al., 1994). Mutations in the chloride transporter CLCN5 gene
are related to Dent-1. Mutations in the OCRL (oculocerebrorenal syndrome of Lowe)
gene encoding for the phosphatidyl inositol 4,5-bisphosphate 5-phosphatase are typical
for Dent-2. As described by Lloyd and colleagues, the majority of CLCN5 gene
mutations found in patients with Dent’s disease are nonsense or missense mutations
(listed in Table 1) (Lloyd et al., 1996) and occur in the transmembrane domain of the
protein (see Figure 10) (Pusch and Zifarelli, 2014). Multiple other mutations that can
cause Dent’s disease are associated with the carboxyl terminus of ClC-5 (Lloyd et al.,
1997; Wu et al., 2003).
Introduction
17
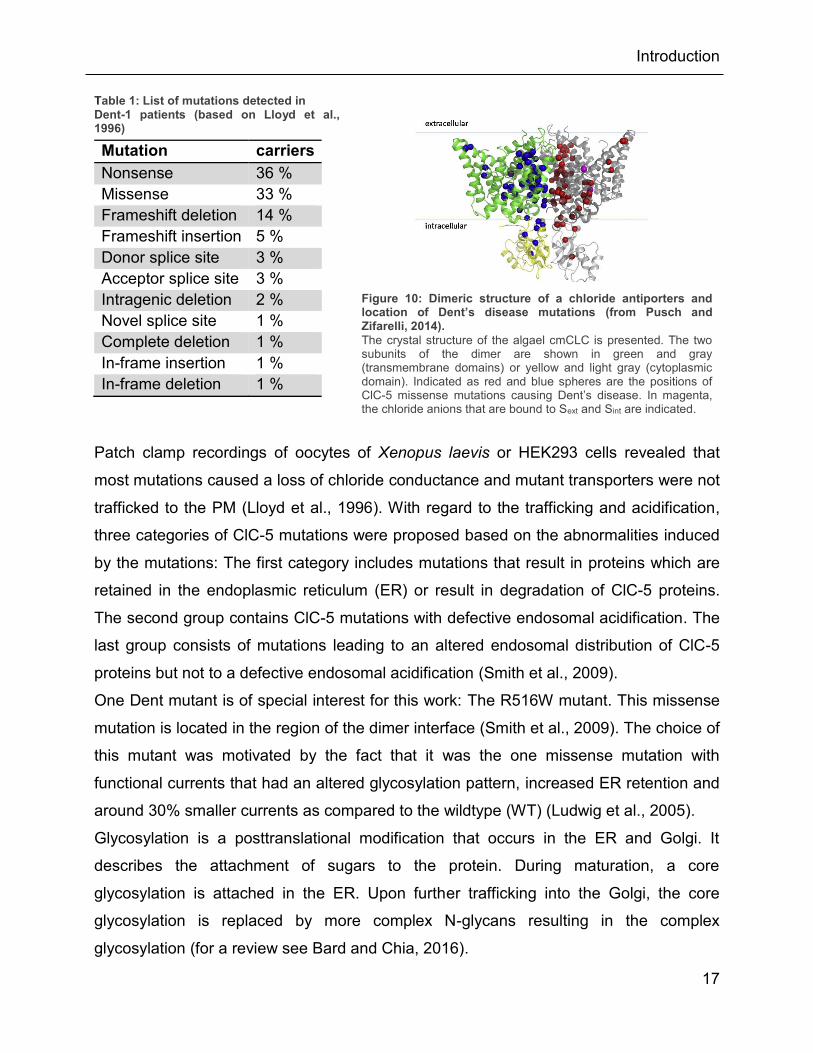
Table 1: List of mutations detected in Dent-1 patients (based on Lloyd et al., 1996)
Mutation carriers
Nonsense 36 % Missense 33 % Frameshift deletion 14 % Frameshift insertion 5 % Donor splice site 3 % Acceptor splice site 3 % Intragenic deletion 2 % Novel splice site 1 % Complete deletion 1 % In-frame insertion 1 % In-frame deletion 1 %
Figure 10: Dimeric structure of a chloride antiporters and location of Dent’s disease mutations (from Pusch and Zifarelli, 2014).
The crystal structure of the algael cmCLC is presented. The two subunits of the dimer are shown in green and gray (transmembrane domains) or yellow and light gray (cytoplasmic domain). Indicated as red and blue spheres are the positions of ClC-5 missense mutations causing Dent’s disease. In magenta, the chloride anions that are bound to Sext and Sint are indicated.
Patch clamp recordings of oocytes of Xenopus laevis or HEK293 cells revealed that
most mutations caused a loss of chloride conductance and mutant transporters were not
trafficked to the PM (Lloyd et al., 1996). With regard to the trafficking and acidification,
three categories of ClC-5 mutations were proposed based on the abnormalities induced
by the mutations: The first category includes mutations that result in proteins which are
retained in the endoplasmic reticulum (ER) or result in degradation of ClC-5 proteins.
The second group contains ClC-5 mutations with defective endosomal acidification. The
last group consists of mutations leading to an altered endosomal distribution of ClC-5
proteins but not to a defective endosomal acidification (Smith et al., 2009).
One Dent mutant is of special interest for this work: The R516W mutant. This missense
mutation is located in the region of the dimer interface (Smith et al., 2009). The choice of
this mutant was motivated by the fact that it was the one missense mutation with
functional currents that had an altered glycosylation pattern, increased ER retention and
around 30% smaller currents as compared to the wildtype (WT) (Ludwig et al., 2005).
Glycosylation is a posttranslational modification that occurs in the ER and Golgi. It
describes the attachment of sugars to the protein. During maturation, a core
glycosylation is attached in the ER. Upon further trafficking into the Golgi, the core
glycosylation is replaced by more complex N-glycans resulting in the complex
glycosylation (for a review see Bard and Chia, 2016).
Introduction
18
In general, ClC-5 was shown to be either mono glycosylated in mice and humans
(Jouret et al., 2004), or glycosylated on two sites in Xenopus laevis (Schmieder et al.,
2007). The N-linked glycosylation appears to be a crucial posttranslational modification
for ClC-5 that facilitates the transport to the PM as glycosylation deficient xClC-5 was
found to be degraded faster (Schmieder et al., 2007).
Introduction
19
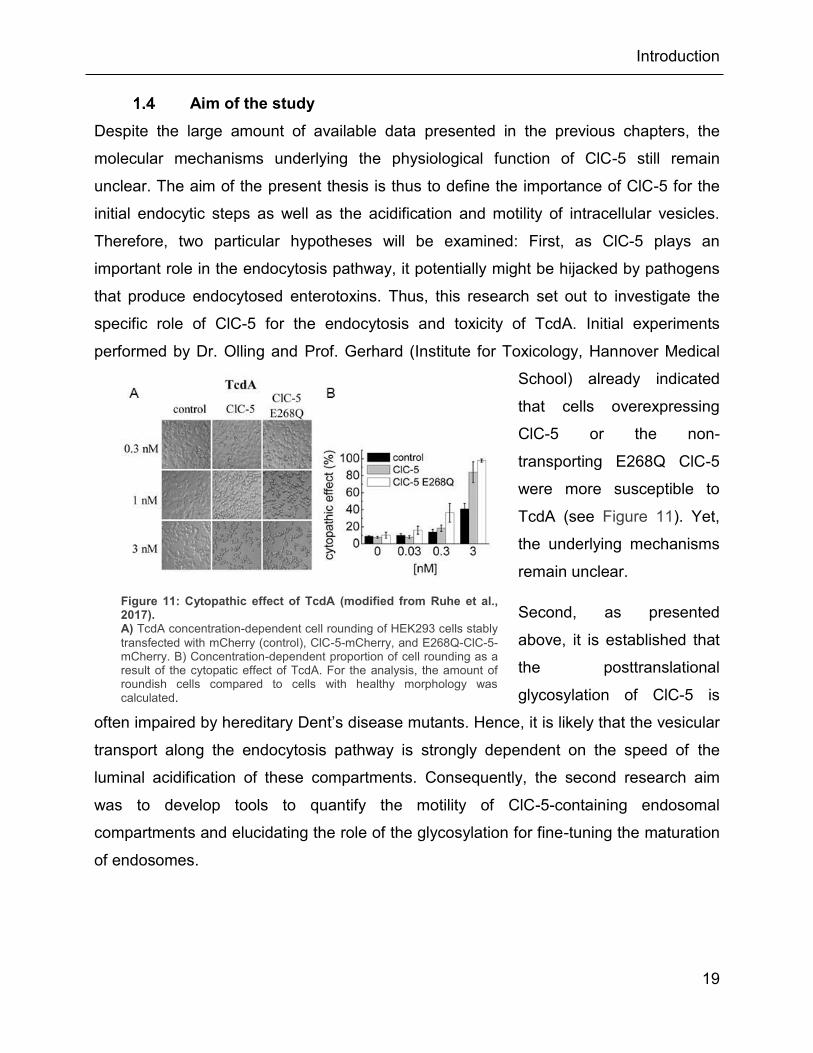
Aim of the study
Despite the large amount of available data presented in the previous chapters, the
molecular mechanisms underlying the physiological function of ClC-5 still remain
unclear. The aim of the present thesis is thus to define the importance of ClC-5 for the
initial endocytic steps as well as the acidification and motility of intracellular vesicles.
Therefore, two particular hypotheses will be examined: First, as ClC-5 plays an
important role in the endocytosis pathway, it potentially might be hijacked by pathogens
that produce endocytosed enterotoxins. Thus, this research set out to investigate the
specific role of ClC-5 for the endocytosis and toxicity of TcdA. Initial experiments
performed by Dr. Olling and Prof. Gerhard (Institute for Toxicology, Hannover Medical
School) already indicated
that cells overexpressing
ClC-5 or the non-
transporting E268Q ClC-5
were more susceptible to
TcdA (see Figure 11). Yet,
the underlying mechanisms
remain unclear.
Second, as presented
above, it is established that
the posttranslational
glycosylation of ClC-5 is
often impaired by hereditary Dent’s disease mutants. Hence, it is likely that the vesicular
transport along the endocytosis pathway is strongly dependent on the speed of the
luminal acidification of these compartments. Consequently, the second research aim
was to develop tools to quantify the motility of ClC-5-containing endosomal
compartments and elucidating the role of the glycosylation for fine-tuning the maturation
of endosomes.
Figure 11: Cytopathic effect of TcdA (modified from Ruhe et al., 2017). A) TcdA concentration-dependent cell rounding of HEK293 cells stably transfected with mCherry (control), ClC-5-mCherry, and E268Q-ClC-5-mCherry. B) Concentration-dependent proportion of cell rounding as a result of the cytopatic effect of TcdA. For the analysis, the amount of roundish cells compared to cells with healthy morphology was calculated.

Methods
20
2 Methods
Cell culture and transfection methods
In this study, human embryonic kidney cells (HEK293 and HEK293T), human colon
cancer cells (HT-29), and mardin-darby canine kidney cells (MDCKII) were used. All
cells were maintained at 37°C under a 5% CO2 humidified atmosphere and re-cultured
every 2-3 days or seeded for transfection. Confluent cells were washed once with PBS
(Lonza, Switzerland), separated by using 0.25% Trypsin-EDTA (Gibco/Life
Technologies, USA) and resuspended in medium. The appropriate amount of cells was
then transferred into a new petri dish and cultivated to subconfluence (for transfection)
or confluence. For fluorescence imaging, cells were seeded on glass cover slips, pre-
treated with polys-L-lysine (Sigma-Aldrich, Germany) for 10 min. For total internal
fluorescence (TIRF) microscopy, cells were seeded in teflon rings glued to glass cover
slips, pre-treated with 25% hydrochloric acid and irradiated to UV light for 1 h. For
transiently transfected cells, fluorescence imaging was performed 24-48 h after
transfection.
Cultivation and transfection of HT-29 cells
HT-29 cells were cultivated in full medium containing Dulbecco’s MEM/ Hams F-12
(Biochrom, Germany), 50 units/ml penicillin/streptomycin (Invitrogen, USA) and 10%
FBS (Gibco/Life Technologies, USA) and transfected using the jetPRIME transfection
reagent (Polyplus-transfection, France) according to the manufacturer’s protocol with the
following changes: For a 6 cm petri dish, 2 µg Plasmid DNA were added to 500 µl of
jetPRIME buffer. After a brief vortexing step, 4 µl jetPRIME reagent were added to the
DNA/buffer mix. This mixture was incubated for 10 min at room temperature (RT) before
it was added to the cells. For microscopy, cells were seeded on glass cover slips
12-24 h after transfection.
Cultivation and transfection of HEK293 and HEK293T cells
HEK293 and HEK293T were maintained in Dulbecos minimum Eagle’s medium (DMEM,
Gibco/Life Technologies, USA), supplemented with 10% FBS (Gibco/Life Technologies,
USA), 2 mM L-glutamine and 50 units/ml penicillin/streptomycin (Invitrogen, USA) and
transfected using calcium-phosphate precipitation (Graham and van der Eb, 1973).

Methods
21
For a 10 cm petri dish, 500 µl of 250 mM CaCl2 solution was mixed with 5 µg plasmid-
DNA and briefly vortexed. Then 500 µl of 2x HEBS were added dropwise to the
DNA/CaCl2 mixture. After 15 min of incubation at RT, the mix was then added to the
cells for transient expression.
Stably transfected HEK293 cells expressing mCherry tagged WT ClC-5 or E268Q ClC-5
and mCherry alone (Hebeisen et al., 2003) were cultivated in minimum Eagle’s medium
(MEM) (Gibco/Life Technologies, USA), supplemented with 10% FBS (Gibco/Life
Technologies, USA) and 900 µg/ml Geniticin (G418, Invitrogen, USA).
Cultivation and transfection of MDCKII cells
Mardin-Darby canine kidney (MDCKII) cells were cultivated in MEM medium (Gibco/Life
Technologies, USA) supplemented with 10% FBS (Gibco/Life Technologies, USA) and
900 µg/ml Geniticin (G418, Invitrogen, USA). For transfection, the Lipofectamin 2000
and 3000 transfection reagents (Thermo Fisher Scientific, USA) were used. The
manufacturer’s protocol was slightly changed: For a 3 cm dish, 2 µg of DNA and 4 µl of
Lipofectamine were diluted in 50 µl OptiMEM, subsequently.
Fixation and mounting of cells
For microscopy, cells were fixed using either methanol or 4% formaldehyde (PFA,
Thermo Scientific Pierce, USA) in PBS (Lonza, Switzerland). For the fixation, cells were
washed with PBS and incubated in methanol at -20°C for 10 min or 4% PFA in PBS for
20 min at RT. Afterwards, cells were washed three times with PBS to remove residual
methanol/ PFA.
For mounting the cells, the glass cover slip containing the fixed cells was carefully dried
and then placed upside down on a microscope slide glass covered with 15 µl of
Fluoromount-G® (Southern Biotechnologies, USA) and air-dried at RT.

Methods
22
Microscopy and analysis of images and movies
Confocal Microcopy
In order to visualize the subcellular localization of the proteins of interest, fluorophores
were attached to the protein and the fluorescence was visualized in living and fixed cells,
using a Spinning disc or Laser Scanning Microscope (LSM). The Spinning disc
microscope is equipped with a Yokogawa CSU-XI Spinning disc unit. The different
fluorophores were excited using the following wavelengths: mCherry at 561 nm, EYFP at
515 nm and EGFP at 445 nm. For mCherry emission detection, the mCherry bandpass
filter of 582-636 nm was used, for EYFP, EGFP, and Atto425 emission detection a
bandpass filter between 524-550 nm was used.
For the Zeiss LSM 780 confocal laser scanning microscope, the excitation wavelengths
of 488 nm for EGFP or Atto425, 514 nm for EYFP or 561 nm for mCherry were used and
emission was recorded between 493-574 nm for EGFP and EYFP and respectively
576-696 nm for mCherry.
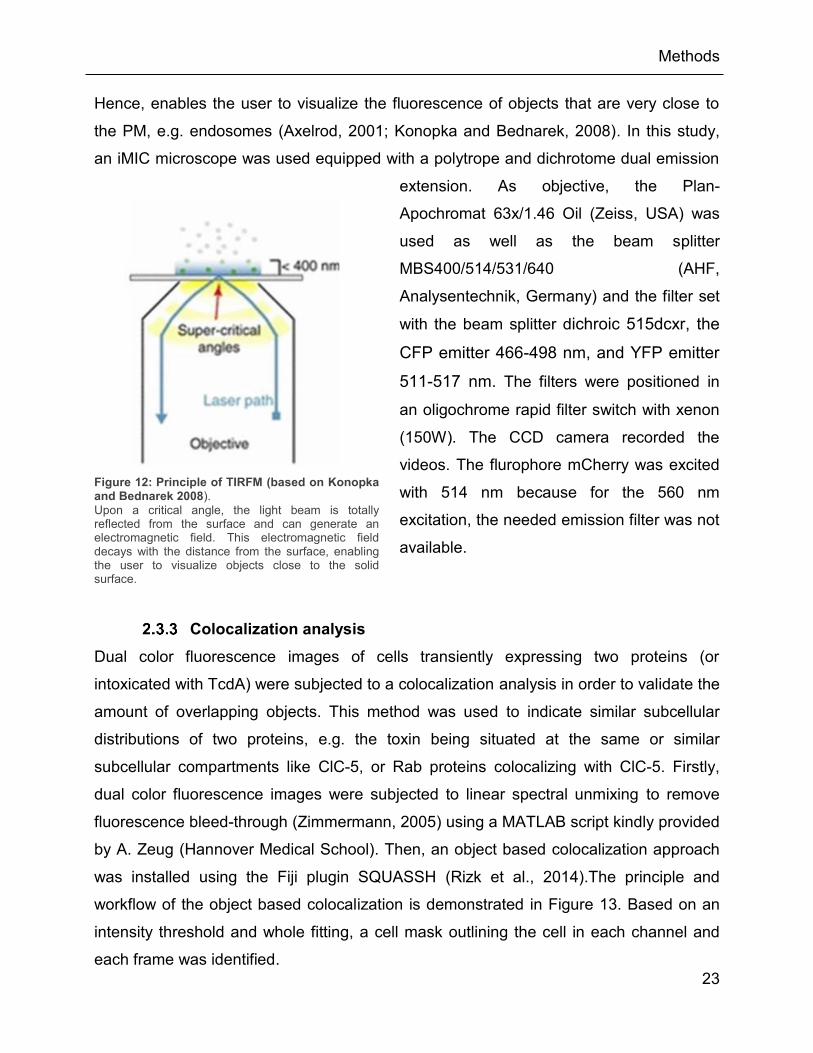
Total internal reflection fluorescence microscopy
Total internal reflection fluorescence (TIRF) microscopy is a powerful tool to visualize
objects that are situated within a defined field depth close to the site of the glass cover
slip (Fish, 2001). It offers the opportunity to study events that occur close to the cell
surface e.g. the endocytosis pathway of Rab proteins (Tsuboi and Fukuda, 2006) or the
fusion of proteins with the PM (Steyer and Almers, 2001). The theory of TIRF
microscopy is illustrated in Figure 12: Light hits a surface (e.g. glass/water interface) in a
certain angle and is refracted. At a specific critical angle, the beam is totally reflected
from this interface (Fish, 2001). A light beam from a laser that travels through the
sample above the critical angle will generate an electromagnetic field that decays
exponentially with the distance from the surface. Yet, it is capable of exciting
fluorophores near the surface without the interference of fluorescence from objects that
are not within the defined field depth. This enables the visualization of objects that are
less than 400 nm from the solid surface.
Methods
23
Hence, enables the user to visualize the fluorescence of objects that are very close to
the PM, e.g. endosomes (Axelrod, 2001; Konopka and Bednarek, 2008). In this study,
an iMIC microscope was used equipped with a polytrope and dichrotome dual emission
extension. As objective, the Plan-
Apochromat 63x/1.46 Oil (Zeiss, USA) was
used as well as the beam splitter
MBS400/514/531/640 (AHF,
Analysentechnik, Germany) and the filter set
with the beam splitter dichroic 515dcxr, the
CFP emitter 466-498 nm, and YFP emitter
511-517 nm. The filters were positioned in
an oligochrome rapid filter switch with xenon
(150W). The CCD camera recorded the
videos. The flurophore mCherry was excited
with 514 nm because for the 560 nm
excitation, the needed emission filter was not
available.
Colocalization analysis
Dual color fluorescence images of cells transiently expressing two proteins (or
intoxicated with TcdA) were subjected to a colocalization analysis in order to validate the
amount of overlapping objects. This method was used to indicate similar subcellular
distributions of two proteins, e.g. the toxin being situated at the same or similar
subcellular compartments like ClC-5, or Rab proteins colocalizing with ClC-5. Firstly,
dual color fluorescence images were subjected to linear spectral unmixing to remove
fluorescence bleed-through (Zimmermann, 2005) using a MATLAB script kindly provided
by A. Zeug (Hannover Medical School). Then, an object based colocalization approach
was installed using the Fiji plugin SQUASSH (Rizk et al., 2014).The principle and
workflow of the object based colocalization is demonstrated in Figure 13. Based on an
intensity threshold and whole fitting, a cell mask outlining the cell in each channel and
each frame was identified.
Figure 12: Principle of TIRFM (based on Konopka and Bednarek 2008). Upon a critical angle, the light beam is totally reflected from the surface and can generate an electromagnetic field. This electromagnetic field decays with the distance from the surface, enabling the user to visualize objects close to the solid surface.

Methods
24
When multiple z-stacks were analyzed, the threshold for the cell mask was set for one z-
slide. Also, all cells from one sample were treated with the same threshold. The exact
used parameters are listed in Supplementary Table 10. Then, objects in each channel
were identified (‘object outline image overlay’ with objects outlined in red or visualized in
random colors (‘seg RGB’)).
Figure 13: Colocalization workflow of the Fiji plugin SQUASSH (Rizk et al., 2014).
Composite image illustrates the overlay of dual color confocal images of ClC-5-mCherry (in red as original image channel 1) and EGFP-TcdA (in green as original image channel 2). The ”cell mask” shows the cell area that was identified based on an intensity threshold. The ‘object outline image overlay’ represents an overlay of the original image with the detected objects outlined in red. “Seg. RGB” visualizes each object in a different, random color. ‘Colocalization’ denotes the overlay of detected objects from both channels. All objects from the same channel are associated with a distinct color. The FIJI plugin SQUASSH calculates from the identified regions the number of overlapping objects as well as the overlapping area between the channels.
Methods
25
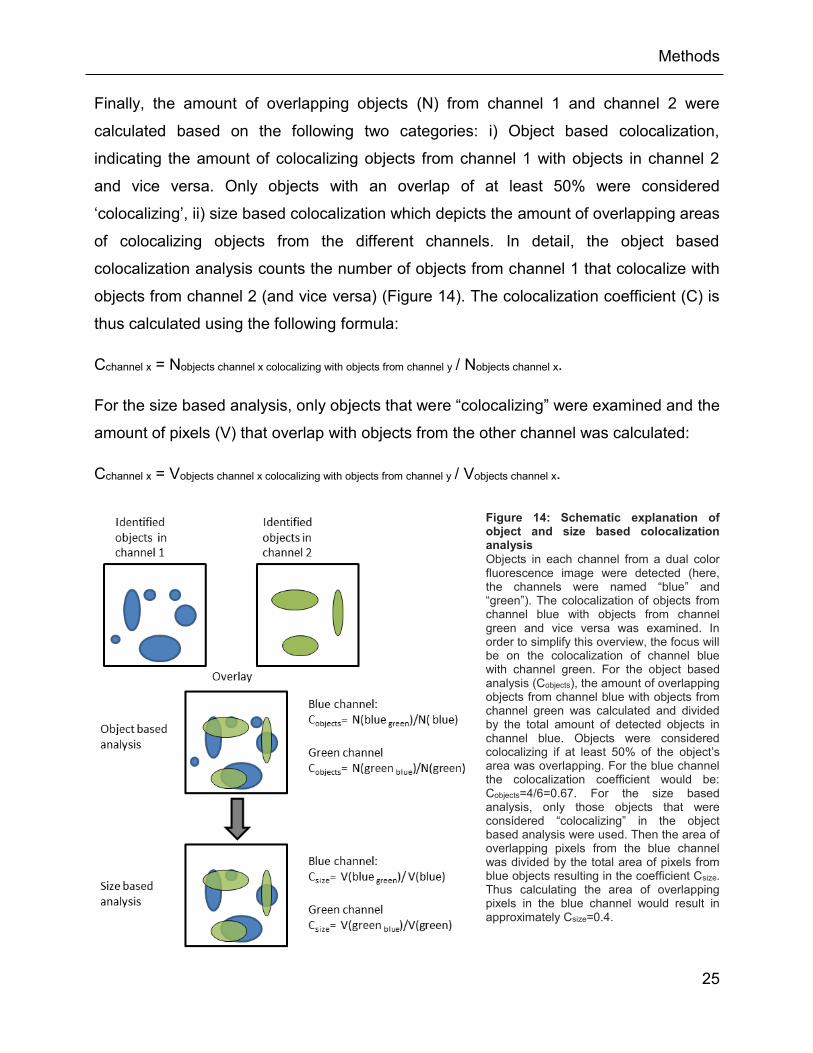
Finally, the amount of overlapping objects (N) from channel 1 and channel 2 were
calculated based on the following two categories: i) Object based colocalization,
indicating the amount of colocalizing objects from channel 1 with objects in channel 2
and vice versa. Only objects with an overlap of at least 50% were considered
‘colocalizing’, ii) size based colocalization which depicts the amount of overlapping areas
of colocalizing objects from the different channels. In detail, the object based
colocalization analysis counts the number of objects from channel 1 that colocalize with
objects from channel 2 (and vice versa) (Figure 14). The colocalization coefficient (C) is
thus calculated using the following formula:
Cchannel x = Nobjects channel x colocalizing with objects from channel y / Nobjects channel x.
For the size based analysis, only objects that were “colocalizing” were examined and the
amount of pixels (V) that overlap with objects from the other channel was calculated:
Cchannel x = Vobjects channel x colocalizing with objects from channel y / Vobjects channel x.
Figure 14: Schematic explanation of object and size based colocalization analysis
Objects in each channel from a dual color fluorescence image were detected (here, the channels were named “blue” and “green”). The colocalization of objects from channel blue with objects from channel green and vice versa was examined. In order to simplify this overview, the focus will be on the colocalization of channel blue with channel green. For the object based analysis (Cobjects), the amount of overlapping objects from channel blue with objects from channel green was calculated and divided by the total amount of detected objects in channel blue. Objects were considered colocalizing if at least 50% of the object’s area was overlapping. For the blue channel the colocalization coefficient would be: Cobjects=4/6=0.67. For the size based analysis, only those objects that were considered “colocalizing” in the object based analysis were used. Then the area of overlapping pixels from the blue channel was divided by the total area of pixels from blue objects resulting in the coefficient Csize. Thus calculating the area of overlapping pixels in the blue channel would result in approximately Csize=0.4.

Methods
26
Particle Tracking
To analyze the motility of ClC-5 positive endosomes in MDCKII cells, movies obtained
from the TIRFM were subjected to particle tracking analysis. Multiple different tracking
software tools were tested in the beginning: Particle Tracker 2D/3D (Sbalzarini and
Koumoutsakos, 2005) and SpeckleTrackerJ (Smith et al., 2011) which are part of the
Fiji/ImageJ platform. Diatrack (Vallotton and Olivier, 2013), SpatTrack (Lund et al., 2014)
and utrack2.1.3 (Jaqaman et al., 2008) were tested as well. Due to its efficiency, and the
ability to process a large amount of movies in a reasonable amount of time, utrack2.1.3
was chosen for further analyses. The program can read movies, detect particles and link
particles to trajectories. It creates a MATLAB file containing information about the movie,
particles (such as localization and walk length) and indicates the particles of different
frames that are summarized in trajectories. The information about particles and
trajectories were then extracted from the previously created MATLAB file using a self-
made MATLAB script to put the information into an order that was needed for further
processing. A “particle” was defined as one spot (=one endosome) detected in one
frame of the movie. The “trajectory” was defined as one particle that is detected in more
than one frame of the movie. Based on these definitions, the data was further processed
to determine the trajectory’s lifetime, velocity, as well as the displacement using a
MATLAB script kindly provided by A. Alekov (Hannover Medical School). The lifetime
was defined as the timespan in which a trajectory was detected. Based on the extracted
values, the mean velocity of a trajectory was calculated as well as the net displacement,
which is the distance traveled by the endosome from the point where it was last detected
to its origin. Additionally, the target-orientation of the endosomal walk was calculated,
which is value for the net displacement divided by the total distance travelled by the
endosome.
2.3.4.1 Analysis of mean square displacement
For the analysis of the mean square displacement (MSD= r²), the MATLAB based
TrackArt program was used (Matysik and Kraut, 2014). The MSD describes how far a
particle moves over a certain time increment τ. Therefore, the position of the trajectory at
specific time points is first transformed into the squared position (position = y²+x²) (see
Figure 15 A and B).
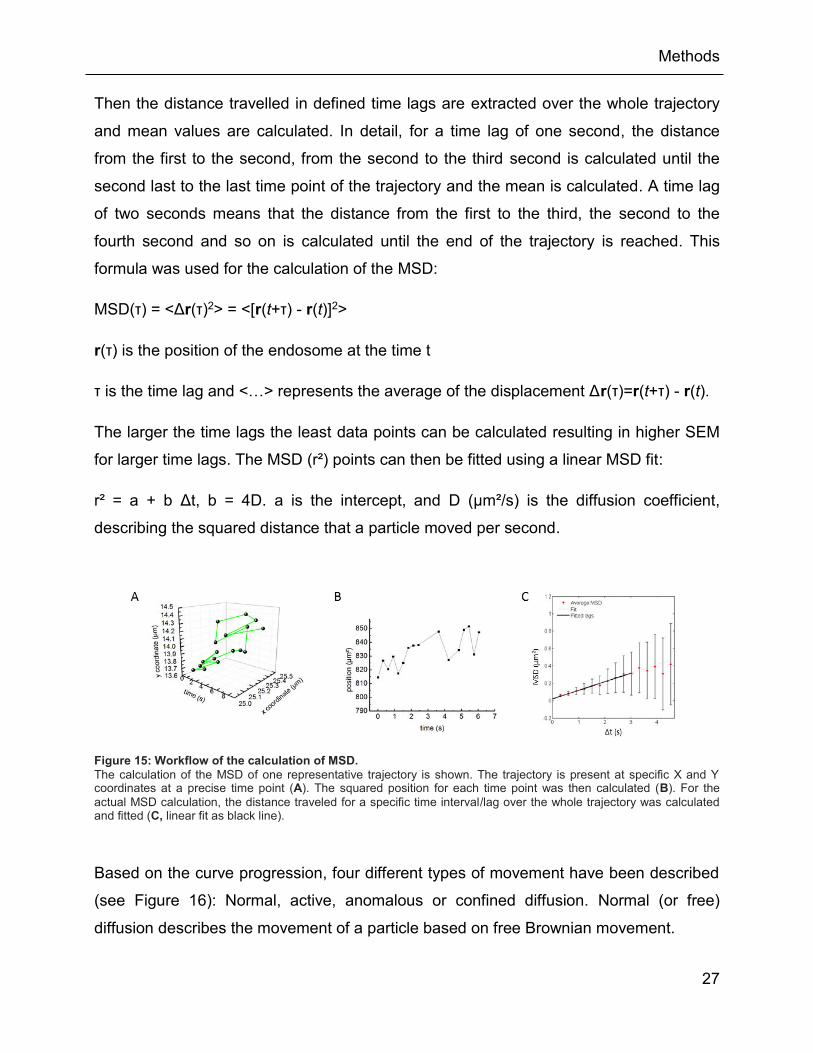
Methods
27
Then the distance travelled in defined time lags are extracted over the whole trajectory
and mean values are calculated. In detail, for a time lag of one second, the distance
from the first to the second, from the second to the third second is calculated until the
second last to the last time point of the trajectory and the mean is calculated. A time lag
of two seconds means that the distance from the first to the third, the second to the
fourth second and so on is calculated until the end of the trajectory is reached. This
formula was used for the calculation of the MSD:
MSD(τ) = <Δr(τ)2> = <[r(t+τ) - r(t)]2>
r(τ) is the position of the endosome at the time t
τ is the time lag and <…> represents the average of the displacement Δr(τ)=r(t+τ) - r(t).
The larger the time lags the least data points can be calculated resulting in higher SEM
for larger time lags. The MSD (r²) points can then be fitted using a linear MSD fit:
r² = a + b Δt, b = 4D. a is the intercept, and D (µm²/s) is the diffusion coefficient,
describing the squared distance that a particle moved per second.
Based on the curve progression, four different types of movement have been described
(see Figure 16): Normal, active, anomalous or confined diffusion. Normal (or free)
diffusion describes the movement of a particle based on free Brownian movement.
Figure 15: Workflow of the calculation of MSD.
The calculation of the MSD of one representative trajectory is shown. The trajectory is present at specific X and Y coordinates at a precise time point (A). The squared position for each time point was then calculated (B). For the actual MSD calculation, the distance traveled for a specific time interval/lag over the whole trajectory was calculated and fitted (C, linear fit as black line).

Methods
28
Active, on the other hand, describes a motion that is actively transported, e.g., by motor
proteins. Anomalous or subdiffusion is a movement among immobile obstacles. In a
confined diffusion, the MSD reaches a maximum value for larger time-lags due to
limitation of space, which means that the particle’s diffusive motion is restricted at larger
time lags (in a very visual way, one might imagine this kind of movement as a chained
dog that is moving within an area that is restricted by the chain) (Matysik and Kraut,
2014). Because of the crowded environment in cells, the transport along microtubules is
most likely to be anomalous (Höfling and Franosch, 2013; Saxton, 1994).
Biochemical methods
SDS-PAGE
SDS-PAGE was used to evaluate the correct processing of transiently expressed
proteins. Here, the expression of WT ClC-5 mCherry in HEK203T and HT-29 cells was
examined as well as the expression of R516W, N408E and N408A ClC-5-mCherry in
HEK293T cells. First, to extract whole cell proteins, 24 h after transfection, cells were
washed twice with PBS and scraped off the petri dishes and resolved in 1 ml PBS. The
cells were then washed three times by resuspending them in 1 ml PBS after
centrifugation (10 s, 100 x g). The pellet was then dissolved in 100 µl lysis buffer. The
suspension was incubated on ice for 45 min with a 10 s vortexing step every 5 min
followed by a centrifugation step for 15 min at 13,000 x g at 4°C. The supernatant was
transferred into a new collection tube and the amount of proteins was examined using
the BCA assay (Thermo Fisher Scientific, USA).
Figure 16: Examples of different progression curves of MSD. There are four different types of MSD curves: active, free, anomalous (or subdiffusion), and confined. Endosomes are most likely to display an anomalous MSD curve

Methods
29
For SDS-PAGE, 30 µg of HEK293T cell lysate and respective 60 µg of HT-29 cell lysate,
were diluted with 5x SDS loading dye according to Laemmli. The samples were stacked
on a gel containing 4% acrylamide and separated by electrophoresis in a gel containing
10% acrylamide in parallel with 1-2 µl of a molecular weight marker (Spectra Multicolor
Broad Range Protein Ladder, Thermo Scientific, USA). The fluorescent bands of the
transiently expressed proteins and the molecular weight marker were visualized on a
fluorescent scanner (Fusion SL, Vilber Lourma, Germany).
Endo H and PNGase F assay
To examine the glycosylation status of WT, R516W, N408E, and N408A ClC-5-mCherry,
the two endoglycosidases EndoHf and PNGase F (New England Biolabs, England) were
used in the following protocol: For the PNGase F digestion, 40 µg of protein lysate were
diluted with the appropriate amount of 5x SDS-loading dye and denatured for 20 min at
RT. Then 4 µl of 10x glycobuffer 2 were added as well as 4 µl NP40 and 4 µl PNGase F.
The mixture was briefly mixed and vortexed and incubated for 1 h at 37°C. For the
EndoHf analysis, 40 µg of protein lysate was also diluted with 5x SDS-loading dye and
denatured for 20 min at RT. Then 4 µl of G5-buffer and 3 µl of EndoHf were added and
the mixture was also centrifuged and incubated at 37°C for 1 h. The proportion of
glycosylation was thus examined using SDS-PAGE as described in the previous
paragraph.
Measurement of vesicular pH using the ratiometric pH sensitive
fluorescent protein pHluorin2
We aimed at measuring the pH of ClC-5 positive vesicles in HEK293T cells transiently
co-expressing synapto-pHluorin2 and WT ClC-5-mCherry, or the mutants E268Q,
R516W, N408E or N408A ClC-5-mCherry. The pH-sensor pHluorin2 is a ratiometric
pH-sensitive GFP-variant. Its excitation spectrum has two peaks at 395 and 475 nm with
an emission maximum at 509 nm (Mahon, 2011). Acidification leads to a decrease in the
fluorescence intensity of pHluorin2 at an excitation at 395 nm and an increase in
fluorescence intensity at the excitation at 475 nm (Figure 17). To ensure a vesicular
localization of pHluorin2, it was fused to VAMP-2/synaptobrevin as described before
(Alekov, 2015). In detail, cells were analyzed using the workflow depicted in Figure 18.

Methods
30
Single z-stacks were recorded at a Zeiss LSM780 microscope using three different
excitation wavelengths: 560 nm for mCherry and 488 as well as 405 nm for the
ratiometric protein synapto-pHluorin2.
Afterwards, vesicles were detected in the
mCherry (= ClC-5) channel using a MATLAB
script kindly provided by A. Alekov (Hannover
Medical School). Then, the fluorescence
intensity of those vesicles was measured in the
488 nm and 405 nm channel, respectively and
the mean F488/F405 ratio of all endosomes of
each cell was determined. Calculating the ratio
of F488/F405 enabled the experimentator to
examine the pH independently on the
fluorescence intensity, thus allowing a comparison of cells with different expression
levels. In order to calculate the actual pH from the measured ratio, a calibration curve
was needed. For this purpose, cells only transfected with synapto-pHluorin2 were
incubated for 10 min in pH buffer ranging from pH 6 to pH 8 containing 10 µM nigericin
(a K+/H+ ionophore that permeates the cell membrane to ensure equilibration of intra-
and extracellular pH). Then, the fluorescence in the two channels (excitations at 488 and
405 nm) was recorded. To determine the F488/F405 ratios at the specific pH, cell
membrane regions stained with pHluorin2 (as indicated in Figure 18 D) were chosen,
encircled and the fluorescence ratio was measured using Fiji ImageJ.
Figure 17: pH dependent fluorescence emission spectrum of pHluorin2 (modified from Mahon, 2011).
Excitation scans of pHluorin2 expressed in HEK293 cells clamped at indicated pHs.

Methods
31
Figure 18: Workflow and calibration for analysis of vesicular pH using pHluorin2 (based on Ruhe et al., 2017). A) Localization of ClC-5 mCherry (red) and synapto-pHluorin2 (green) in transiently transfected HEK293T cells. B) Representative image of vesicles detected by the analysis software (encircled). Particles in the mCherry channel were detected and the fluorescence intensity ratio F488/F405 was calculated. C) Calibration curve of synapto-pHluorin2. HEK293T cells transiently expressing synapto-pHluorin2 were maintained in solution of specific pH containing 10 µM nigericin. Regions along the plasma membrane were chosen to calculate the F488/F405 ratio as depicted in D). N=11 cells for pH 6, n=10 cells for pH 7 and n=9 cells for pH 8.
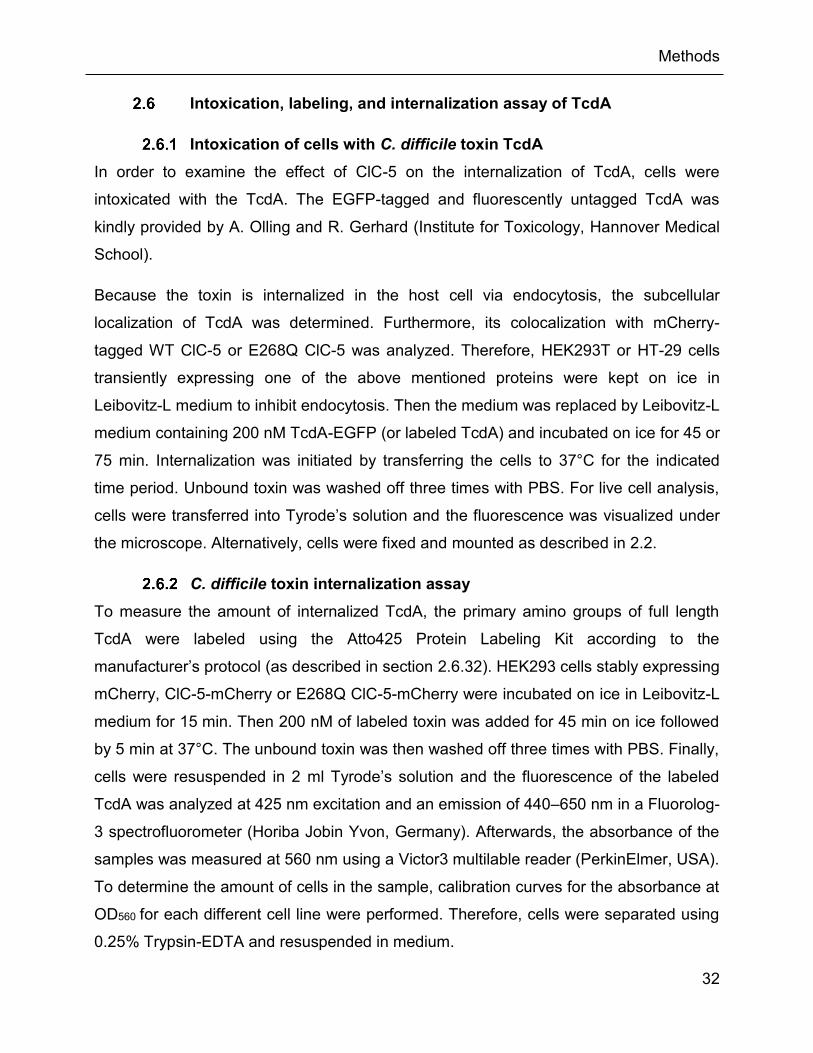
Methods
32
Intoxication, labeling, and internalization assay of TcdA
Intoxication of cells with C. difficile toxin TcdA
In order to examine the effect of ClC-5 on the internalization of TcdA, cells were
intoxicated with the TcdA. The EGFP-tagged and fluorescently untagged TcdA was
kindly provided by A. Olling and R. Gerhard (Institute for Toxicology, Hannover Medical
School).
Because the toxin is internalized in the host cell via endocytosis, the subcellular
localization of TcdA was determined. Furthermore, its colocalization with mCherry-
tagged WT ClC-5 or E268Q ClC-5 was analyzed. Therefore, HEK293T or HT-29 cells
transiently expressing one of the above mentioned proteins were kept on ice in
Leibovitz-L medium to inhibit endocytosis. Then the medium was replaced by Leibovitz-L
medium containing 200 nM TcdA-EGFP (or labeled TcdA) and incubated on ice for 45 or
75 min. Internalization was initiated by transferring the cells to 37°C for the indicated
time period. Unbound toxin was washed off three times with PBS. For live cell analysis,
cells were transferred into Tyrode’s solution and the fluorescence was visualized under
the microscope. Alternatively, cells were fixed and mounted as described in 2.2.
C. difficile toxin internalization assay
To measure the amount of internalized TcdA, the primary amino groups of full length
TcdA were labeled using the Atto425 Protein Labeling Kit according to the
manufacturer’s protocol (as described in section 2.6.32). HEK293 cells stably expressing
mCherry, ClC-5-mCherry or E268Q ClC-5-mCherry were incubated on ice in Leibovitz-L
medium for 15 min. Then 200 nM of labeled toxin was added for 45 min on ice followed
by 5 min at 37°C. The unbound toxin was then washed off three times with PBS. Finally,
cells were resuspended in 2 ml Tyrode’s solution and the fluorescence of the labeled
TcdA was analyzed at 425 nm excitation and an emission of 440–650 nm in a Fluorolog-
3 spectrofluorometer (Horiba Jobin Yvon, Germany). Afterwards, the absorbance of the
samples was measured at 560 nm using a Victor3 multilable reader (PerkinElmer, USA).
To determine the amount of cells in the sample, calibration curves for the absorbance at
OD560 for each different cell line were performed. Therefore, cells were separated using
0.25% Trypsin-EDTA and resuspended in medium.

Methods
33
After a centrifugation step at 300 x g for 3 min, cells were washed once with PBS and
centrifuged again (3 min at 300 x g). The pellet was then resuspended in 3 ml Tyrode’s
solution and the number of cells was counted using a neubauer chamber and diluted to
the indicated concentrations.
Figure 19: Calibration curve for the absorbance at OD560 of HEK293 cells stably overexpressing ClC-5-mCherry, E268Q ClC-5-mCherry, or mCherry alone (based on Ruhe et al., 2017).
Calibration curves of the absorbance at OD560. Two dilution series for each cell line were performed. The results shown are means ±SEM.
Fluorescent labelling of primary amino groups of TcdA
To fluorescently label the primary amino groups of TcdA, the Atto425 Protein Labeling
Kit (Jena Bioscience GmbH, Germany) was used following the manufacturer’s protocol.
In brief, sodium biocarbonate was added to the toxin to a final concentration of 100 mM.
Then the labeling dye (0.5 µg/µl solved in Dimethylformamide) was added in a 10:1 ratio
of TcdA to labeling dye. The mixture was then incubated for 1 h at RT in the dark on a
shaker. Finally, the residual free dye was removed from the labeled toxin using a PD
Sephadex G25 spin column (GE Healthcare, Germany) in accordance to the
manufacturer’s protocol.
Methods
34
ClC-5 siRNA knockdown
To reduce the endogenous expression levels of ClC-5 in HT-29 cells, the ON-
TARGETplus Human CLCN5 (Id: 1184) siRNA SMART pool and as negative control the
ON-TARGETplus Non-targeting Pool (Dharmacon, USA) were used. One day before
transfection, cells were seeded on glass precoated with Poly-L-lysine (Sigma-Aldrich,
USA). Then 10 nM or 20 nM of siClC-5 and 20 nM of control siRNA were transfected.
Medium was changed 24 h after transfection and cells were analyzed three days after
transfection. For microscopic analysis of cells intoxicated with TcdA, a plasmid carrying
the coding sequence of the leucocyte antigen CD-8 was cotransfected. To verify the
knockdown of ClC-5, RNA was extracted using the Isol-RNA Lysis Reagent (5PRIME,
Germany). Cells were scraped off the plate and washed once with PBS. Then Isol-RNA
Lysis Reagent was added and RNA was extracted according to the manufacturer’s
protocol. The integrity of the RNA was checked on a 2% agarose gel and its
concentration was measured using a Nanodrop Photometer (Thermo Fischer Scientific,
USA). To remove genomic DNA contamination, a DNaseI digestion was performed
using the RQ1 RNase-Free DNase (Promega, USA) according to the protocol. The
cDNA was generated with the AMV First Strand cDNA Synthesis Kit (New England
Biolabs, England). Finally, the level of ClC-5 mRNA was analyzed using appropriate
forward (ClC-5 forw) and reverse primers (ClC-5 rev) (for primer sequence please refer
to Supplementary Table 9). Expression levels were normalized to the housekeeping
gene phosphoglycerate kinase 1 (PGK1) (Jacobsen et al. 2014). For PGK1, the forward
(PGK1 forw) and reverse primers (PGK1 rev) were used. A quantitative RT-PCR was
carried out using PowerUP SYBR Green Master Mix (Thermo Fisher Scientific, USA) in
triplicates with ClC-5 and PGK1 primers. The expression levels of ClC-5 were
normalized to PGK1 levels and the 2-ΔΔCT was calculated (Livak and Schmittgen, 2001).
To analyze the cytopathic effect of TcdA on HT-29 cells with reduced levels of ClC-5,
cells were incubated with 3 nM TcdA (3 h at 37°C) 72 h after the transfection, and the
percentage of rounded cells to cells with healthy morphology was calculated. To identify
HT-29 cells with a high probability of transfection with siRNA, cells were cotransfected
with a plasmid encoding the CD8 antigen and incubated before with polystyrene
microbeads precoated with anti-CD8 antibodies (Dynabeads M-CD8, Dynal) (Me et al.,
1994).
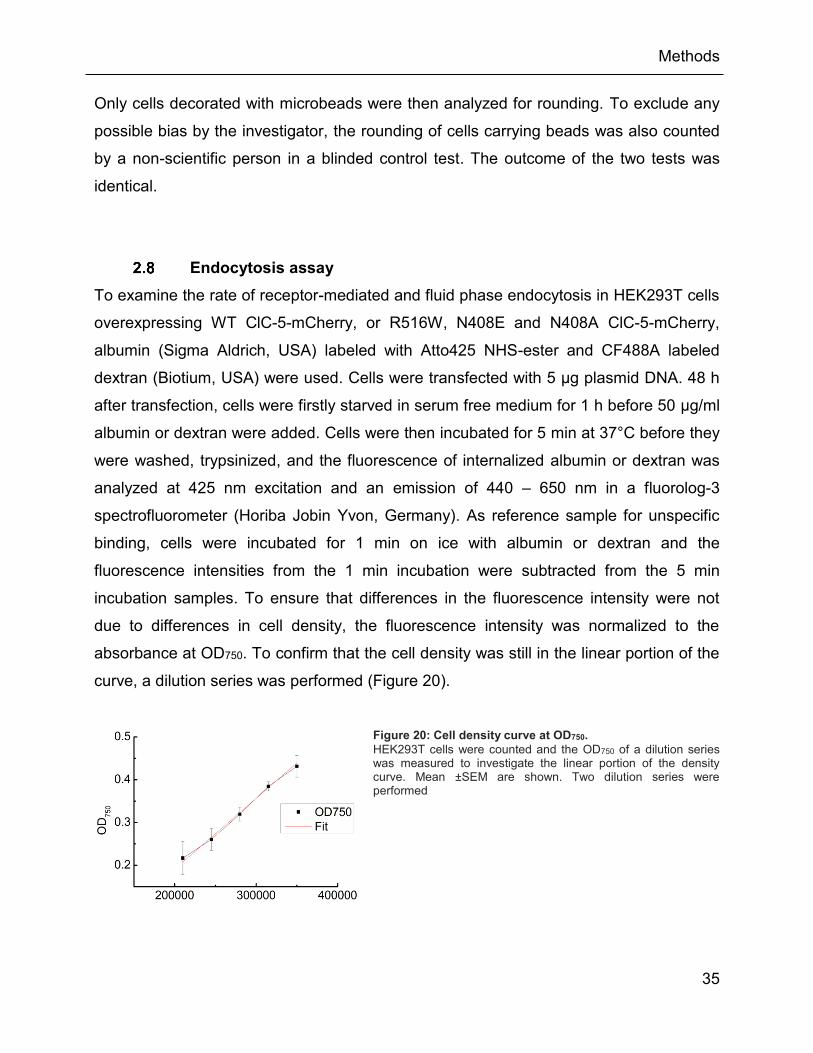
Methods
35
Only cells decorated with microbeads were then analyzed for rounding. To exclude any
possible bias by the investigator, the rounding of cells carrying beads was also counted
by a non-scientific person in a blinded control test. The outcome of the two tests was
identical.
Endocytosis assay
To examine the rate of receptor-mediated and fluid phase endocytosis in HEK293T cells
overexpressing WT ClC-5-mCherry, or R516W, N408E and N408A ClC-5-mCherry,
albumin (Sigma Aldrich, USA) labeled with Atto425 NHS-ester and CF488A labeled
dextran (Biotium, USA) were used. Cells were transfected with 5 µg plasmid DNA. 48 h
after transfection, cells were firstly starved in serum free medium for 1 h before 50 µg/ml
albumin or dextran were added. Cells were then incubated for 5 min at 37°C before they
were washed, trypsinized, and the fluorescence of internalized albumin or dextran was
analyzed at 425 nm excitation and an emission of 440 – 650 nm in a fluorolog-3
spectrofluorometer (Horiba Jobin Yvon, Germany). As reference sample for unspecific
binding, cells were incubated for 1 min on ice with albumin or dextran and the
fluorescence intensities from the 1 min incubation were subtracted from the 5 min
incubation samples. To ensure that differences in the fluorescence intensity were not
due to differences in cell density, the fluorescence intensity was normalized to the
absorbance at OD750. To confirm that the cell density was still in the linear portion of the
curve, a dilution series was performed (Figure 20).
Figure 20: Cell density curve at OD750.
HEK293T cells were counted and the OD750 of a dilution series was measured to investigate the linear portion of the density curve. Mean ±SEM are shown. Two dilution series were performed
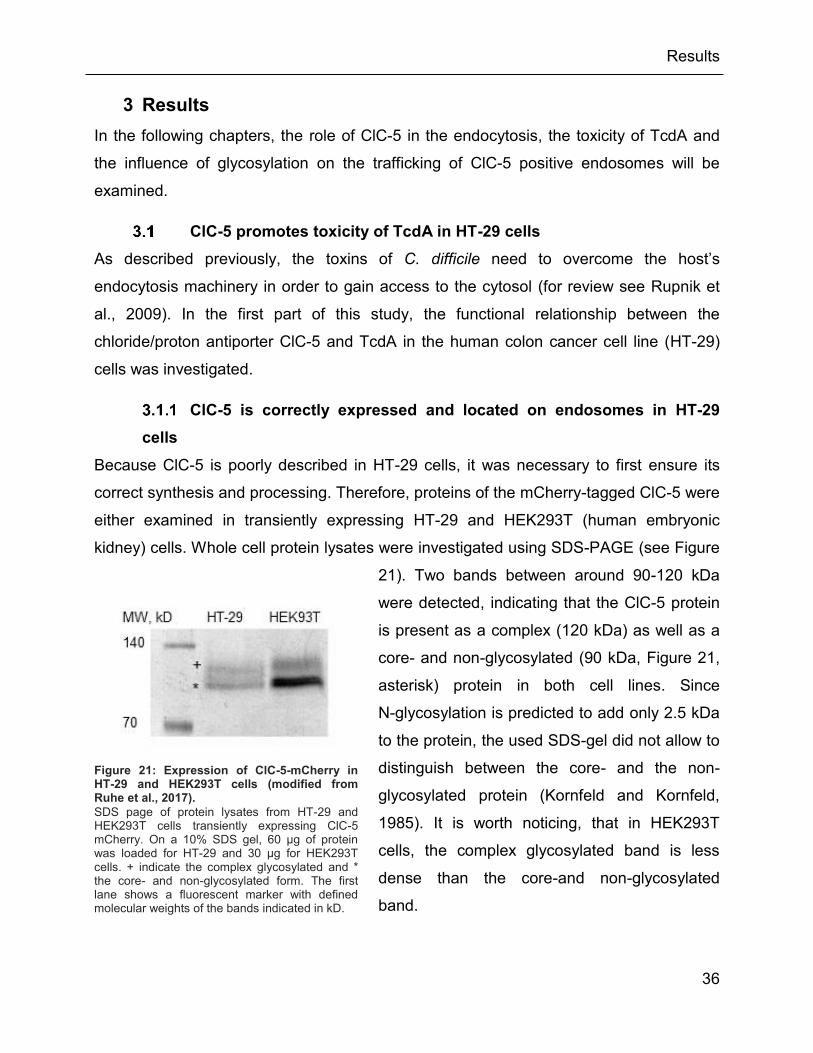
Results
36
3 Results
In the following chapters, the role of ClC-5 in the endocytosis, the toxicity of TcdA and
the influence of glycosylation on the trafficking of ClC-5 positive endosomes will be
examined.
ClC-5 promotes toxicity of TcdA in HT-29 cells
As described previously, the toxins of C. difficile need to overcome the host’s
endocytosis machinery in order to gain access to the cytosol (for review see Rupnik et
al., 2009). In the first part of this study, the functional relationship between the
chloride/proton antiporter ClC-5 and TcdA in the human colon cancer cell line (HT-29)
cells was investigated.
ClC-5 is correctly expressed and located on endosomes in HT-29
cells
Because ClC-5 is poorly described in HT-29 cells, it was necessary to first ensure its
correct synthesis and processing. Therefore, proteins of the mCherry-tagged ClC-5 were
either examined in transiently expressing HT-29 and HEK293T (human embryonic
kidney) cells. Whole cell protein lysates were investigated using SDS-PAGE (see Figure
21). Two bands between around 90-120 kDa
were detected, indicating that the ClC-5 protein
is present as a complex (120 kDa) as well as a
core- and non-glycosylated (90 kDa, Figure 21,
asterisk) protein in both cell lines. Since
N-glycosylation is predicted to add only 2.5 kDa
to the protein, the used SDS-gel did not allow to
distinguish between the core- and the non-
glycosylated protein (Kornfeld and Kornfeld,
1985). It is worth noticing, that in HEK293T
cells, the complex glycosylated band is less
dense than the core-and non-glycosylated
band.
Figure 21: Expression of ClC-5-mCherry in HT-29 and HEK293T cells (modified from Ruhe et al., 2017).
SDS page of protein lysates from HT-29 and HEK293T cells transiently expressing ClC-5 mCherry. On a 10% SDS gel, 60 µg of protein was loaded for HT-29 and 30 µg for HEK293T cells. + indicate the complex glycosylated and * the core- and non-glycosylated form. The first lane shows a fluorescent marker with defined molecular weights of the bands indicated in kD.

Results
37
At the same time, in HT-29, the complex and core-and non-glycosylated form of the ClC-
5 protein appear in a similar manner, indicating that the process of glycosylation is more
efficient in HT-29 cells.
Then, the subcellular localization of YFP-tagged ClC-5 in transiently transfected HT-29
cells was investigated with a confocal microscope (see Figure 22). It was predominantly
located in endosomes and to a smaller amount at the PM and in an ER-like structure.
ClC-5 positive vesicles were highly motile particles with a great variance in size.
Figure 22: Localization of ClC-5-EYFP in HT-29 cells. A-C) Representative confocal images of HT-29 cells transiently expressing YFP-tagged ClC-5. Single Z- slides are depicted and scale bars represent 10 µm.
Knockdown of ClC-5 decrease cytopathic effect of TcdA
Previous experiments in HEK293 cells stably overexpressing WT or E268Q ClC-5
mCherry showed that these cells were more susceptible towards intoxication of TcdA
(and TcdB). Intoxication resulted in an increased cytopathic effect in WT or E268Q
ClC-5 overexpressing cells as compared to mock cells (see Figure 11) (Ruhe et al.,
2017).
To ensure that the increased cytopathic effects of TcdA on cells expressing ClC-5 were
not due to overexpression effects, endogenously expressed ClC-5 mRNA levels were
reduced by siRNA targeting human ClC-5 (siClC-5). The successful knockdown of ClC-5
mRNA in HT-29 cells was first tested using quantitative RT-PCR (qRT-PCR). Levels of
ClC-5 were normalized to the housekeeping gene PGK1 (Jacobsen et al., 2014). Levels
of ClC-5 mRNA were reduced by 40% and 60% when transfected with 10 or 20 nM
siClC-5, respectively (Figure 23), indicating an efficient downregulation of ClC-5.

Results
38
Figure 23: Efficacy of ClC-5 mRNA knockdown by small interfering RNA (siRNA) in HT-29 cells (modified from Ruhe et al., 2017).
ClC-5 was knocked down by siRNA targeted against human ClC-5 (siClC-5). As negative control, non-targeting siRNA was used. The result of the qRT-PCR of HT-29 cells transiently transfected with 20 nM control siRNA or 10 and 20 nM siClC-5. Relative ClC-5 mRNA levels were measured against PGK1 and normalized to the value of the control cells. Mean values of three experiments ±- SEM are shown.
In a next step, cell rounding as a result of the cytopathic effect of TcdA in ClC-5
knockdown cells was examined. Therefore, cells were transfected with siClC-5 and
pLeu2-CD8 and intoxicated with 3 nM TcdA. In order to distinguish between transfected
and untransfected cells, cells were preincubated with magnetic dynabeads which bind
specifically to the CD-8 antigene (Figure 24 A). The percentage of roundish cells
compared to cells with healthy morphology was then analyzed. The outcome of the cell
counting might be influenced by the experimenter. To exclude any possible bias, the
cells were also counted by a non-scientific person who was not aware of the nature of
the research and the possible outcome. As expected, the results were the same.
Figure 24: ClC-5 knockdown decreases TcdA cytotoxicity (Modified from Ruhe et al., 2017).
Endogenously expressed ClC-5 mRNA was downregulated by siClC-5. HT-29 cells were cotransfected with pLeu2-CD8 and either 20 nM non-targeting siRNA (control) or with 10 or 20 nM siClC-5. Cells were intoxicated with 3 nM TcdA and cell rounding as result of the cytotoxic effect was examined. (A) displays representative widefield images of transfected HT-29 cells. Black dots represent IgG-CD8-loaded dynabeads, indicating transfected cells. The percentage of roundish cells is shown in (B). Scale bars represent 40 µm. n=3 petri dishes. Significance was tested using an one-way Anova with post-hoc Tukey HSD; * p<0.05.

Results
39
The downregulation of ClC-5 caused a significant decrease in the cytopathic effect
compared to cells treated with control siRNA by approximately 10% (Figure 24 B). This
indicates that cells without ClC-5 are less sensitive to the toxin and it supports the theory
that ClC-5 promotes intoxication effects of TcdA.
ClC-5 is located to early endosomes
Because TcdA is internalized and processed in endosomes (Pruitt and Lacy, 2012), the
next aim of this study was to examine the localization of ClC-5 in HT-29 cells in the
endosomal pathway. So far, it has been described that ClC-5 is present on early
endosomes in rat kidney cells (Günther et al., 1998). To investigate the endosomal
presence of ClC-5, its colocalization with different members of the Rab-family was
examined. Rab proteins are small GTPases widely used as markers of different
endosomal stages (Chavrier et al., 1990; Feng et al., 1995; Urbé et al., 1993): Rab5 and
Rab4a for early endosomes (Sönnichsen et al., 2000), Rab7 for late (Feng et al., 2010)
and Rab11 for recycling endosomes (Sönnichsen et al., 2000; Ullrich et al., 1996). Three
different Rab5 variants were available: The wildtype (WT, cycles between GTP and GDP
bound form), dominant negative (DN, locked in GDP conformation) and constitutive
active (CA, GTP bound). The GTP bound form of Rab5 has been reported to be more
membrane-associated whereas the GDP-bound form is cytoplasmic (Stone et al., 2007).
Here, the spatial overlap of ClC-5 with all three Rab5 variants was examined (Figure
25). Since a colocalization of ClC-5 with Rab5CA was already shown in kidney epithelial
cells (Günther et al., 1998), Rab5WT and Rab5DN were used as additional controls. In
all three cotransfections, ClC-5 was located to small vesicular structures. Rab5WT was
also situated on endosomes, Rab5DN was diffusely present and Rab5CA was located
on larger vesicular structures (Figure 25 A, C, and E). The images with the overlay
indicate greater colocalization of ClC-5 with the Rab5WT and CA. In order to quantify
the colocalization, a colocalization analysis was performed, using the Fiji Plugin
SQUASSH (Rizk et al., 2014). This analysis allows evaluation of the colocalizing pixels
of detected objects in the used fluorescence channels. First, the program identifies
objects in both fluorescence channels separately. Then the colocalization coefficient of
both channels is calculated in an object and a size based analysis:

Results
40
For the object based calculation, the amount of overlapping objects from one channel is
divided by the total amount of objects in this channel. In the size based analysis, only
overlapping objects are considered and the number of colocalizing pixels divided by the
total number of object-related pixels in this channel is calculated. The program always
gives two values for each analysis: Objects from channel 1 colocalizing with objects from
channel 2 and vice versa.
A perfect colocalization would result in a colocalization coefficient of 1 (=100%). For a
more detailed and graphical description, please refer to Figure 13 and the section 2.3.3
in the methods part.
The object based analysis in Figure 25 showed that ClC-5 colocalized most strongly with
Rab5CA objects (over 30% represented by a colocalization coefficient of 0.3) followed
by Rab5WT objects (around 30%). For the DN mutant, only two cells showed a distinct
colocalization of ClC-5 with Rab5 objects. Nearly no overlap was detected between
ClC-5 objects with Rab5DN objects. This may be a result of the different localization of
ClC-5 and Rab5DN (Figure 25 C): ClC-5 is mostly on punctuating structures and
Rab5DN is diffusely localized. In the analysis, Rab5DN objects were bigger than ClC-5
objects. The size based colocalization indicated that, in half of the analyzed cells, the
area of overlap was also quite small. As mentioned above, the size based colocalization
coefficient indicates the area of colocalizing pixels over the total size of objects in the
specific channel. The colocalization was defined as “good” if the object based
colocalization was similar in both channels and the size based colocalization was high.
Since this indicated that both proteins were situated in similar compartments and the
localization pattern was also alike. Based on these issues, the colocalization between
ClC-5 and Rab5CA was the highest followed by ClC-5 overlapping with Rab5WT. The
Rab5DN mutant was overlapping to a smaller amount with ClC-5. Overall, the findings
showed a distinct colocalization of ClC-5 with Rab5WT, Rab5CA and a smaller
colocalization with Rab5DN, supporting previous findings on the presence of ClC-5 on
early endosomes (Günther et al., 1998)

Results
41
Figure 25: Colocalization of ClC-5 with different mutants of Rab5 (Rab5WT, Rab5CA, and Rab5DN) in HT-29 cells (modified from Ruhe et al., 2017). A), C), E) Representative dual color confocal images showing the localization of ClC-5-EYFP (green) together with one of the three Rab5 variants: Rab5WT-RFP (A), Rab5DN-mCherry (C) or Rab5CA-mCherry (E) (all three Rab5s in red). B), D), F) Box plot summarizing the results from an object (left) and size based (right) colocalization analysis. Objects in both fluorescence channels were detected and the colocalization coefficients of overlapping objects (object base) and fractions of colocalizing objects (size base) were calculated. The channels were defined as Rab5WT-, Rab5DN-, Rab5CA- and ClC-5 as depicted in (A), (C) and (E). N = 6 cells for the RabWT and Rab5DN as well as n=9 cells for Rab5CA cotransfections. Single cells (•), mean (◊), median (─). Scale bars represent 10 µm.

Results
42
To further characterize the presence of ClC-5 in the endocytic cycle of HT-29 cells,
mCherry tagged ClC-5 was coexpressed with additional endosomal markers (GFP-
tagged Rab7, Rab11 and Rab4a) (Figure 26). Rab7 and Rab11 were present in
vesicular compartments whereas Rab4a was also located in the cytosol. The object
based colocalization was calculated and revealed a distinct overlap between ClC-5 and
Rab7 (around 24%, Figure 26 D). In addition, ClC-5 partially overlapped with Rab11
(9%). Only a few Rab4a objects colocalized with ClC-5 objects (4%), but a higher
amount of ClC-5 objects overlapped with Rab4a (36%), due to the diffusely located
Rab4a.
Overall, the results indicate that ClC-5 was also localized on late, Rab7-positive
endosomes and to a very small extend on recycling, Rab11-positive endosomes.
Figure 26: Colocalization of ClC-5 with Rab7, Rab11 and Rab4a in HT-29 cells (modified from Ruhe et al., 2017) A)-C) Single z-slides of representative confocal images of HT-29 cells cotransfected with ClC-5-mCherry (red) and either Rab7-, Rab11- or Rab4a-EGFP (all in green), respectively. D) Box plot summarizing the results from an object based colocalization analysis. Objects in both fluorescence channels were detected and the colocalization coefficients of overlapping objects were calculated. The fluorescence channels were defined as Rab7, Rab11 or Rab4a and ClC-5. N=10 cells for Rab7 as well as n=11 cells for Rab4a and n=16 cells for Rab11. Single cells (•), mean (◊), and median (─). Transfection and microscopy was performed by R. Abromeit, Image processing and colocalization analysis was performed by F. Ruhe.
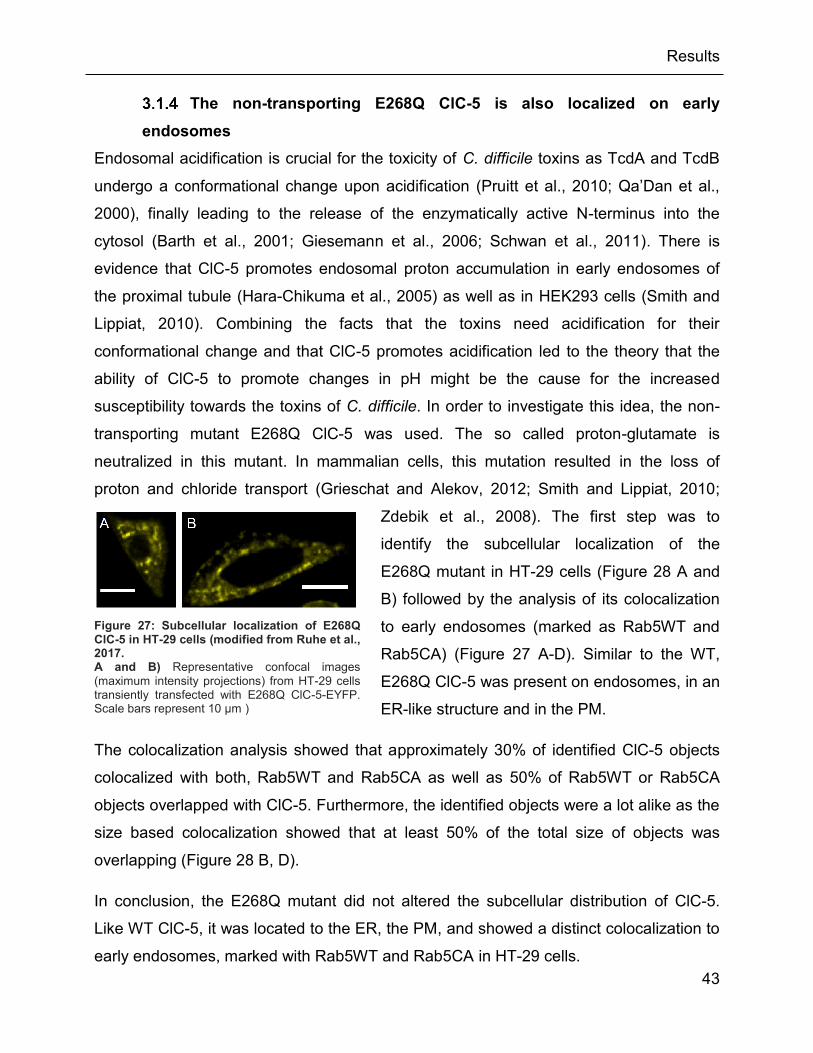
Results
43
The non-transporting E268Q ClC-5 is also localized on early
endosomes
Endosomal acidification is crucial for the toxicity of C. difficile toxins as TcdA and TcdB
undergo a conformational change upon acidification (Pruitt et al., 2010; Qa’Dan et al.,
2000), finally leading to the release of the enzymatically active N-terminus into the
cytosol (Barth et al., 2001; Giesemann et al., 2006; Schwan et al., 2011). There is
evidence that ClC-5 promotes endosomal proton accumulation in early endosomes of
the proximal tubule (Hara-Chikuma et al., 2005) as well as in HEK293 cells (Smith and
Lippiat, 2010). Combining the facts that the toxins need acidification for their
conformational change and that ClC-5 promotes acidification led to the theory that the
ability of ClC-5 to promote changes in pH might be the cause for the increased
susceptibility towards the toxins of C. difficile. In order to investigate this idea, the non-
transporting mutant E268Q ClC-5 was used. The so called proton-glutamate is
neutralized in this mutant. In mammalian cells, this mutation resulted in the loss of
proton and chloride transport (Grieschat and Alekov, 2012; Smith and Lippiat, 2010;
Zdebik et al., 2008). The first step was to
identify the subcellular localization of the
E268Q mutant in HT-29 cells (Figure 28 A and
B) followed by the analysis of its colocalization
to early endosomes (marked as Rab5WT and
Rab5CA) (Figure 27 A-D). Similar to the WT,
E268Q ClC-5 was present on endosomes, in an
ER-like structure and in the PM.
The colocalization analysis showed that approximately 30% of identified ClC-5 objects
colocalized with both, Rab5WT and Rab5CA as well as 50% of Rab5WT or Rab5CA
objects overlapped with ClC-5. Furthermore, the identified objects were a lot alike as the
size based colocalization showed that at least 50% of the total size of objects was
overlapping (Figure 28 B, D).
In conclusion, the E268Q mutant did not altered the subcellular distribution of ClC-5.
Like WT ClC-5, it was located to the ER, the PM, and showed a distinct colocalization to
early endosomes, marked with Rab5WT and Rab5CA in HT-29 cells.
Figure 27: Subcellular localization of E268Q ClC-5 in HT-29 cells (modified from Ruhe et al., 2017. A and B) Representative confocal images (maximum intensity projections) from HT-29 cells transiently transfected with E268Q ClC-5-EYFP. Scale bars represent 10 µm )

Results
44
Figure 28: Colocalization of the non-transporting mutant E268Q ClC-5 with Rab5WT and Rab5CA. A), B) C), E) Single z-slices of representative confocal images showing the localization of E268Q ClC-5-EYFP (in green) together with either Rab5WT-RFP (C) or Rab5CA-mCherry (E) (both Rab5s in red) in HT-29 cells. D, E and F) Box plots summarizing the results from object-based and size-based colocalization analysis. Objects in the two fluorescence channels were identified and the colocalization coefficients were calculated. The fluorescence channels were defined as Rab5WT or Rab5CA and ClC-5. N=7 cells for Rab5WT and n=4 cells for Rab5CA were analyzed. Single cells (•), 25 – box), mean (◊), median (─) as well as 99 % and 1 % (X)). Scale bars correspond to 10 µm. (modified from Ruhe et al., 2017)

Results
45
TcdA colocalizes with ClC-5
C. difficile’s toxins TcdA and TcdB enter the host cell via clathrin-dependent and
independent endocytosis pathways (Gerhard et al., 2013; Papatheodorou et al., 2010).
Therefore, the toxins have to use the hosts’ endocytotic machinery to gain access into
the cell. After being internalized, the toxin is located in endosomes, and since ClC-5 is
situated on early and late endosomes, it was expected that TcdA and ClC-5 colocalize to
some extent. First, to investigate the internalization of EGFP-tagged TcdA in HT-29 cells
transiently overexpressing ClC-5, cells were incubated with the toxin and the
fluorescence of EGFP-TcdA and ClC-5-mCherry was visualized under a confocal
microscope (Figure 29 A). The toxin was bound to the surface membrane and also
located in intracellular vesicles. To analyze the amount of colocalizing ClC-5 and TcdA
objects, a colocalization analysis was performed. Around 30% of TcdA objects
colocalized with ClC-5 objects, with an overlapping area of approx. 40% of the total area
of TcdA objects (Figure 29 A and B). Less ClC-5 objects colocalized with TcdA objects
(around 15%) and the area of overlapping objects was also smaller (also approx. 15%)
than compared to TcdA objects. Nevertheless, this indicated a distinct colocalization of
TcdA and ClC-5. Yet, the major amount of toxin was restricted to the cell membrane and
only little was internalized in ClC-5 expressing cells (Figure 29 A).
Figure 29: Internalization of TcdA-EGFP and colocalization with ClC-5 in living cells (modified from Ruhe et al., 2017). A) Representative dual color confocal image showing the localization of TcdA-EGFP and ClC-5-mCherry in HT-29 cells. Cells transiently expressing mCherry-tagged ClC-5 (red) were incubated with TcdA-EGFP (green).B) Box plot summarizing the results from an object- (left) and size-based (right) colocalization analysis of images as depicted in (A). Objects in the two fluorescence channels were identified and the colocalization coefficients were calculated. The two channels were defined as ClC-5- and TcdA-containing objects. N=6. Single cells (•), mean (◊), and median (─). Scale bars correspond to 10 µm. Cell culture and microscopy was performed by R. Abromeit, image processing and colocalization analysis was done by F. Ruhe.

Results
46
In order to examine the kinetics of intoxication, HT-29 cells transiently expressing ClC-5
mCherry were intoxicated with EGFP-tagged TcdA at 37°C and internalization was
stopped by fixation of the cells after 0, 8 or 15 minutes (Figure 30). Independent of the
time of internalization at 37°C, the images showed nearly no TcdA intracellularly. Most
of the toxin was bound to the PM, whereas ClC-5 was situated inside the cell. The
colocalization analysis of ClC-5- and TcdA- objects was also performed and showed a
weak colocalization (Figure 30 C). The object based colocalization analysis also showed
a very small amount of colocalizing objects in all three time steps. Only at the 8 min
internalization step, the area of overlapping pixels from the few detected overlapping
objects was slightly higher than at the other timer intervals. Because live cell images
proofed that the toxin was endocytosed in HT-29 cells (see Figure 29 A), the lack of
intracellularly detected TcdA might be a result of the fixation procedure.
Figure 30: Localization of TcdA-EGFP and ClC-5 in fixed HT-29 cells (modified from Ruhe et al., 2017). A), B) Representative confocal images of fixed HT-29 cells transiently transfected with ClC-5-mCherry (red) and intoxicated with TcdA-EGFP (green). Cells were fixed immediately upon toxin incubation (A) or after 15 min incubation at 37°C (B). C) Box plot summarizing the results from an object- (left) and size based (right) colocalization analysis. Objects were detected in the two fluorescence channels and the colocalization coefficient of overlapping objects (object based) or the area of overlapping objects (size based) colocalization was calculated. The channels were defined as ClC-5 and TcdA. N=8 cells for 0 and 8 min and n=10 cells for 15 min of toxin internalization. Single cells (•), mean (◊) Scale bars correspond to 10 µm.
Results
47
These findings raised the question if the small amount of internalized TcdA that was
detected in living cells was also a result of a destructed EGFP-fluorescence. As a control
and in order to circumvent the problem of destructed or quenched EGFP-tagged TcdA,
untagged toxin was used and labeled with an Atto425 NHS-ester dye to fluorescently
label TcdA and visualized in HT-29 as well as HEK293T cells (see Figure 31). In this
case, cells were not fixed but living cells were used for confocal imaging. It is worth
noticing, that compared to the EGFP-tagged TcdA that was internalized in living cells
(see Figure 29), Atto425-labeled TcdA resulted in a more diffuse intracellular
localization, especially in HT-29 cells. Additionally, the toxin was less membrane-bound.
The colocalization analysis of ClC-5 objects and objects of the labeled toxin showed a
smaller object and size based colocalization coefficient (under 10% in HT-29 and
HEK293 cells) (Figure 31 C and D) than the EGFP-tagged toxin (around 30% of TcdA
objects colocalized with ClC-5 objects in HT-29 cells, and 10% of ClC-5 with TcdA
objects) (Figure 29 C).
In conclusion, the fixation of cells intoxicated with EGFP-TcdA resulted in the loss of the
fluorescence intensity of intracellular toxin. Labeling TcdA with the Atto425 NHS-dye
caused a diffuse subcellular localization of the toxin. This leads to the assumption that
the initial attempt, to measure the colocalization of EGFP-TcdA and ClC-5-mCherry in
living cells was the best approach to determine the colocalization coefficient of both
proteins. This approach showed a distinct colocalization of toxin and antiporter.

Results
48
Figure 31: Localization of ClC-5 and labelled TcdA A), B) Representative dual color confocal images of living HEK293T (A) and HT-29 (B) cells transfected with ClC-5 YFP (red) with internalized Atto425-labeled TcdA (green). A 45 min (HEK293T) or 70 min (HT-29) incubation with Atto425-TcdA on ice was followed by 5 min incubation step at 37°C. C and D) Box plot summarizing the results from an object (left) and size based (right) colocalization analysis. 4 cells for each cell line were analyzed. Single cells (•), mean (◊), and median (-). The two channels were defined as ClC-5 and TcdA containing objects. Scale bars correspond to 10 µm.

Results
49
Internalization of TcdA in WT or E268Q ClC-5 cells
The increased susceptibility of ClC-5 expressing cells towards TcdA and TcdB might be
a result of a higher amount of toxin internalized in these cells. In order to investigate the
amount of endocytosed and membrane bound TcdA, HEK293 cells stably expressing
WT or E268Q ClC-5-mCherry, or mCherry alone (as a control) were intoxicated with
Atto425 labeled TcdA. Stably transfected HEK293 cells were used, because the attempt
to create stably transfected HT-29 was not successful and for this approach, it was
necessary that all cells were overexpressing one of the ClC-5 variants or mCherry. The
fluorescence of the labeled toxin was then measured and normalized to the amount of
cells in the sample (the calibration curve for the absorbance is depicted in Figure 19).
The fluorescence spectrum as well as the fluorescence intensity at 490 nm (Figure 32,
inset) showed that there was significantly more toxin internalized in cells expressing WT
or E268Q ClC-5. Yet, the amount of TcdA was twice as much in WT ClC-5 cells than in
the non-transporting mutant E268Q.
Figure 32: WT or E268Q ClC-5 increase endocytosis of TcdA (modified from Ruhe et al., 2017).
The fluorescence intensity of TcdA per cell is shown. HEK293 cells stably expressing mCherry (blue), ClC-5-mCherry (WT, black), or E268Q ClC-5-mCherry (red) were intoxicated with 200 nM TcdA, labeled with Atto425. N=9 petri dishes for WT and E268Q ClC-5–mCherry and n=10 petri dishes for mCherry on two different days. Inset represents a box plot of normalized fluorescence intensity (FI) at 490 nm emission. Single cells (•), mean (■), and median (-). *indicates a significant difference between two data sets. The significance was tested using a two-tailed t-tests and significance was set at a P value of <0.05.
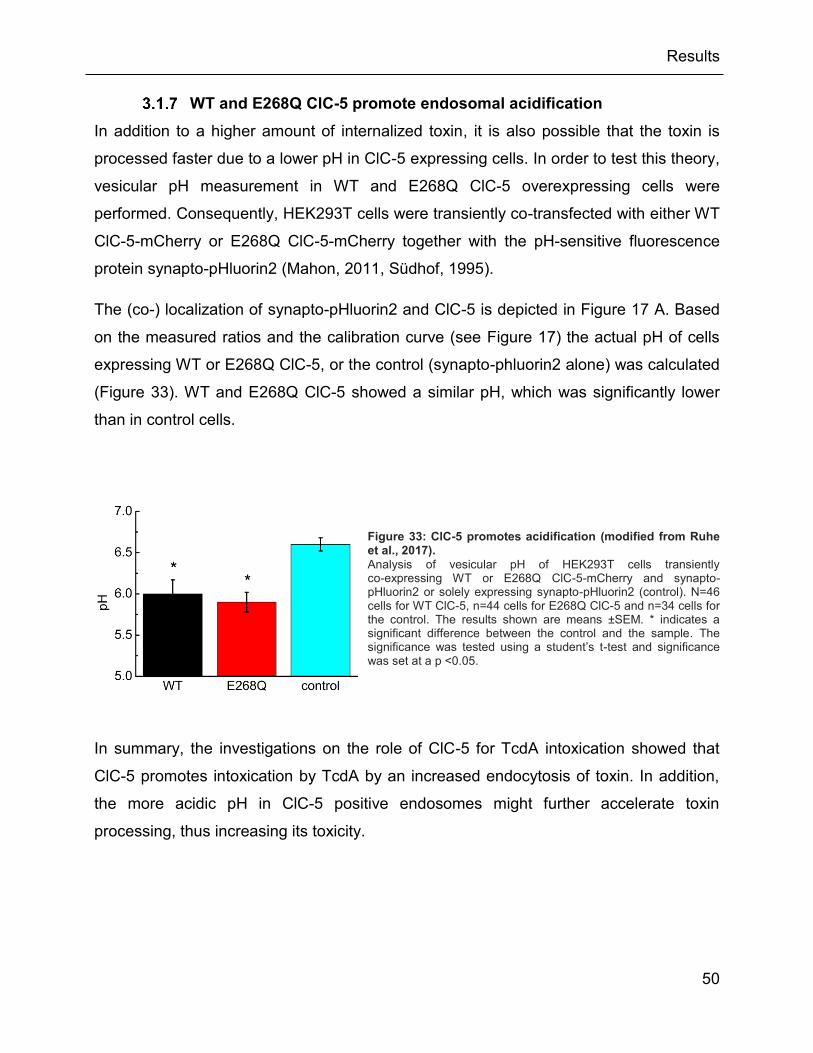
Results
50
WT and E268Q ClC-5 promote endosomal acidification
In addition to a higher amount of internalized toxin, it is also possible that the toxin is
processed faster due to a lower pH in ClC-5 expressing cells. In order to test this theory,
vesicular pH measurement in WT and E268Q ClC-5 overexpressing cells were
performed. Consequently, HEK293T cells were transiently co-transfected with either WT
ClC-5-mCherry or E268Q ClC-5-mCherry together with the pH-sensitive fluorescence
protein synapto-pHluorin2 (Mahon, 2011, Südhof, 1995).
The (co-) localization of synapto-pHluorin2 and ClC-5 is depicted in Figure 17 A. Based
on the measured ratios and the calibration curve (see Figure 17) the actual pH of cells
expressing WT or E268Q ClC-5, or the control (synapto-phluorin2 alone) was calculated
(Figure 33). WT and E268Q ClC-5 showed a similar pH, which was significantly lower
than in control cells.
In summary, the investigations on the role of ClC-5 for TcdA intoxication showed that
ClC-5 promotes intoxication by TcdA by an increased endocytosis of toxin. In addition,
the more acidic pH in ClC-5 positive endosomes might further accelerate toxin
processing, thus increasing its toxicity.
Figure 33: ClC-5 promotes acidification (modified from Ruhe et al., 2017).
Analysis of vesicular pH of HEK293T cells transiently co-expressing WT or E268Q ClC-5-mCherry and synapto-pHluorin2 or solely expressing synapto-pHluorin2 (control). N=46 cells for WT ClC-5, n=44 cells for E268Q ClC-5 and n=34 cells for the control. The results shown are means ±SEM. * indicates a significant difference between the control and the sample. The significance was tested using a student’s t-test and significance was set at a p <0.05.

Results
51
Tool to study endosomal motility with regard to the pathophysiology
of Dent’s disease
Endocytosis is a crucial cellular process to maintain homeostasis for instance of
membrane bound proteins (as reviewed in Maxfield and McGraw, 2004), but it also
presents an entrance for pathogens to invade the host cell. In the previous chapter, it
was demonstrated that ClC-5 plays an important role in the intoxication of toxins from C.
difficile. However, not only endocytosed toxins can cause diseases, but also a
malfunctioning endocytosis pathway caused by mutations in the CLCN-5 gene can lead
the kidney related Dent’s disease (Wrong et al., 1994). ClC-5 positive endosomes are
highly motile vesicles. Multiple Dent’s disease causing mutations of ClC-5 are retained in
the ER and show a disrupted electrochemical behavior with reduced or aborted
exchange of protons and chloride (Smith et al., 2009). Additionally, many of these
mutations have an impaired glycosylation pattern which led to the hypothesis that
endosomal trafficking might be influenced by the glycosylation status of ClC-5.
Therefore, the second part of this study focused on the trafficking and motility of ClC-5
endosomes. In order to understand the role of glycosylation in this process, the Dent’s
disease causing ClC-5 mutant R516W was used and two artificial glycosylation deficient
mutants were generated (N408E and N408A). In a next step, the particle movement was
analyzed by TIRF microscopy followed by particle tracking and data analysis, and finally
the endosomal pH and the endocytosis rate were measured.
Generation of N-glycosylation deficient ClC-5 mutants
Glycosylation is a crucial posttranslational modification that is involved in intercellular
communication, adhesion, and migration (Bard and Chia, 2016). It occurs in the ER and
Golgi and is characterized by the attachment of branched sugar polymers. In Xenopus
laevis, ClC-5 was shown to be N-glycosylated. In general, there are two types of
glycosylation: Core and complex. The core glycosylation is composed of glycans that
are attached to the protein in the ER. Upon further trafficking into the Golgi, these
glycans are modified, completing the complex glycosylation (Lodish et al., 2000).
Glycosylation has been shown to be crucial for the transport of ClC-5 to the PM
(Schmieder et al., 2007). Multiple Dent’s disease mutations result in proteins that have
no complex glycosylation and are retained in the ER (Smith et al., 2009).
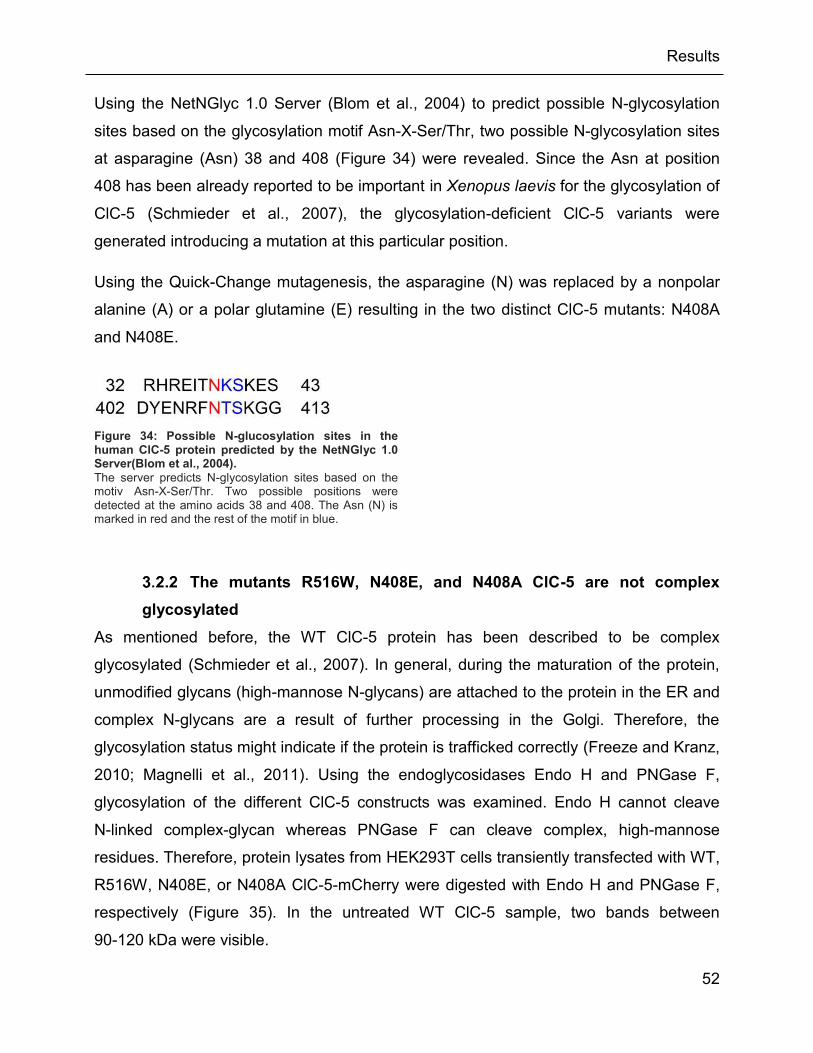
Results
52
Using the NetNGlyc 1.0 Server (Blom et al., 2004) to predict possible N-glycosylation
sites based on the glycosylation motif Asn-X-Ser/Thr, two possible N-glycosylation sites
at asparagine (Asn) 38 and 408 (Figure 34) were revealed. Since the Asn at position
408 has been already reported to be important in Xenopus laevis for the glycosylation of
ClC-5 (Schmieder et al., 2007), the glycosylation-deficient ClC-5 variants were
generated introducing a mutation at this particular position.
Using the Quick-Change mutagenesis, the asparagine (N) was replaced by a nonpolar
alanine (A) or a polar glutamine (E) resulting in the two distinct ClC-5 mutants: N408A
and N408E.
The mutants R516W, N408E, and N408A ClC-5 are not complex
glycosylated
As mentioned before, the WT ClC-5 protein has been described to be complex
glycosylated (Schmieder et al., 2007). In general, during the maturation of the protein,
unmodified glycans (high-mannose N-glycans) are attached to the protein in the ER and
complex N-glycans are a result of further processing in the Golgi. Therefore, the
glycosylation status might indicate if the protein is trafficked correctly (Freeze and Kranz,
2010; Magnelli et al., 2011). Using the endoglycosidases Endo H and PNGase F,
glycosylation of the different ClC-5 constructs was examined. Endo H cannot cleave
N-linked complex-glycan whereas PNGase F can cleave complex, high-mannose
residues. Therefore, protein lysates from HEK293T cells transiently transfected with WT,
R516W, N408E, or N408A ClC-5-mCherry were digested with Endo H and PNGase F,
respectively (Figure 35). In the untreated WT ClC-5 sample, two bands between
90-120 kDa were visible.
Figure 34: Possible N-glucosylation sites in the human ClC-5 protein predicted by the NetNGlyc 1.0 Server(Blom et al., 2004).
The server predicts N-glycosylation sites based on the motiv Asn-X-Ser/Thr. Two possible positions were detected at the amino acids 38 and 408. The Asn (N) is marked in red and the rest of the motif in blue.

Results
53
Only PNGase F was able to cleave the modified glycans, indicating that WT ClC-5 was
complex glycosylated. Densiometric analysis shows that the R516W was only core-
and/or non-glycosylated (see Supplemental Figure 1). The newly-created N408E and
N408A mutants proved both to be glycosylation deficient. Densiometric measurement
showed only one band with the size of around 90 kDA, representing the core-and/or
non-glycosylated protein (see Supplemental Figure 1).
In general, this indicated that the WT ClC-5 was complex glycosylated, the R516W was
core- and/or non-glycosylated and the N408E and N408A mutants showed no
glycosylation.
Figure 35: Endo H and PNGase F assay of WT, R516W, N408E and N408A ClC-5-mCherry.
To estimate the glycosylation status of the different ClC-5 variants, whole protein lysates of HEK293T cells transiently transfected with WT, R516W, N408E or N408A ClC-5-mCherry were used. The protein samples were thus subjected to digestion with the endoglycosydases Endo H or PNGase F. Endo H cannot cleave N-linked complex-glycan, whereas PNGase is able to cut of these complex glycans. + indicates the size of the complex glycosylated protein and * the core- and/or non-glycosylated protein size. The profile plots of each lane are shown in Supplemental Figure 1.
Cellular distribution of WT and mutant ClC-5 in MDCKII cells
According to the altered glycosylation status, the subcellular localization of WT, R516W,
N408E and N408A ClC-5-mCherry in MDCKII cells was investigated in the next
approach (Figure 36). WT ClC-5 appeared as punctuated, intracellular structures and to
a small extent to the PM. The R516W mutant was mainly located to an ER-like structure
and to a smaller amount in vesicles. The two glycosylation deficient mutants N408E and
N408A were also located to endosomes as well as in an ER-like structure but less to the
PM as the WT. This indicates that the subcellular distribution of ClC-5 is not dependent
on its glycosylation pattern.
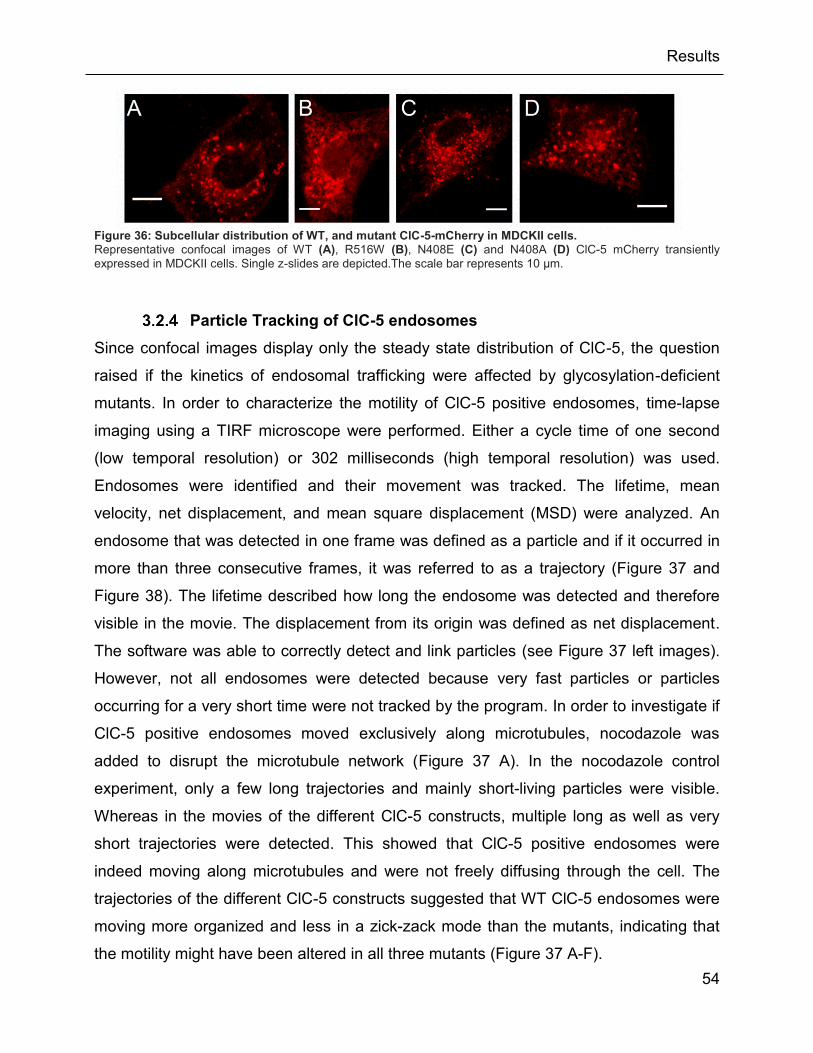
Results
54
Particle Tracking of ClC-5 endosomes
Since confocal images display only the steady state distribution of ClC-5, the question
raised if the kinetics of endosomal trafficking were affected by glycosylation-deficient
mutants. In order to characterize the motility of ClC-5 positive endosomes, time-lapse
imaging using a TIRF microscope were performed. Either a cycle time of one second
(low temporal resolution) or 302 milliseconds (high temporal resolution) was used.
Endosomes were identified and their movement was tracked. The lifetime, mean
velocity, net displacement, and mean square displacement (MSD) were analyzed. An
endosome that was detected in one frame was defined as a particle and if it occurred in
more than three consecutive frames, it was referred to as a trajectory (Figure 37 and
Figure 38). The lifetime described how long the endosome was detected and therefore
visible in the movie. The displacement from its origin was defined as net displacement.
The software was able to correctly detect and link particles (see Figure 37 left images).
However, not all endosomes were detected because very fast particles or particles
occurring for a very short time were not tracked by the program. In order to investigate if
ClC-5 positive endosomes moved exclusively along microtubules, nocodazole was
added to disrupt the microtubule network (Figure 37 A). In the nocodazole control
experiment, only a few long trajectories and mainly short-living particles were visible.
Whereas in the movies of the different ClC-5 constructs, multiple long as well as very
short trajectories were detected. This showed that ClC-5 positive endosomes were
indeed moving along microtubules and were not freely diffusing through the cell. The
trajectories of the different ClC-5 constructs suggested that WT ClC-5 endosomes were
moving more organized and less in a zick-zack mode than the mutants, indicating that
the motility might have been altered in all three mutants (Figure 37 A-F).
Figure 36: Subcellular distribution of WT, and mutant ClC-5-mCherry in MDCKII cells. Representative confocal images of WT (A), R516W (B), N408E (C) and N408A (D) ClC-5 mCherry transiently expressed in MDCKII cells. Single z-slides are depicted.The scale bar represents 10 µm.

Results
55
Figure 37: The tracking software, u.track2.1.3 (Jaqaman et al., 2008), tracks ClC-5 positive endosomes accurately. The result of the particle tracking of WT, R516W, N408E, and N408A ClC-5 positive endosomes is depicted (A-E, left images) and the first frame of the correlated movies (A-E right image). Nocodazole is shown as control for the motility without microtubule (A). WT ClC-5 is shown in in (B), R516W in (C), N408E in (D) as well as N408A in (E) Endosomes were recorded using a TIRF microscope with a field depth of 95 nm and a cycle time of one second. Scale bars represent 10 µm.
Figure 38: Time lapse images of ClC-5 trajectories.
Detailed example of the movement of WT ClC-5 positive endosomes and their trajectories in the low temporal resolution. The time lapse represents the trajectories from the white square of the bigger image with one frame every 5 seconds. The colored lines represent the detected trajectories of the specific endosome.

Results
56
Low and high temporal resolution
First it was unknown wheter differences in long living, slow endosomes or fast moving,
short living endosomes exist. Therefore, two cycle times were used and examined in
terms of lifetime, net displacement, mean velocity, and MSD. First, the results of the low
and then of the high temporal resolution will be displayed. An overview of the amount of
measured cells and detected particles/trajectories is given below in Table 2.
In the following paragraphs, the analyzed parameters were evaluated in a 1D to 2D and
finally a 3D analysis approach. The aim was to identify not only differences between the
ClC-5 constructs, but also correlations between the different parameters. In the 1D
analysis, mean values of trajectories from single cells were extracted and evaluated. In
the 2D approach two parameters were compared with each other. In the 3D analysis,
mean values of three factors of each single cell were analyzed.
Table 2: Overview of the amount of analyzed cells, detected particles and linked trajectories of ClC-5 positive endosomes from MDCKII cells.
ClC-5 construct low temporal resolution high temporal resolution
cells particles trajectories cells particles trajectories
WT 22 90755 34138 14 64234 27320 R516W 19 61705 15850 13 74898 14192 N408E 22 143352 55048 15 74910 37106 N408A 20 69256 25127 19 80071 29068
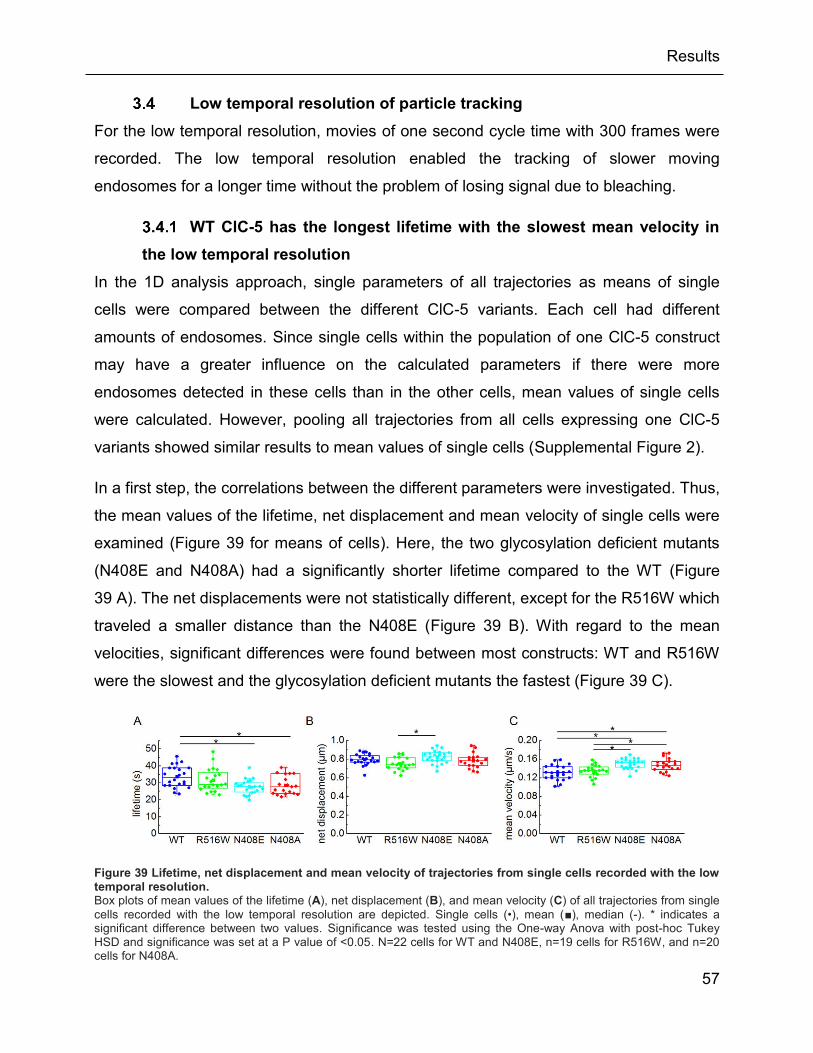
Results
57
Low temporal resolution of particle tracking
For the low temporal resolution, movies of one second cycle time with 300 frames were
recorded. The low temporal resolution enabled the tracking of slower moving
endosomes for a longer time without the problem of losing signal due to bleaching.
WT ClC-5 has the longest lifetime with the slowest mean velocity in
the low temporal resolution
In the 1D analysis approach, single parameters of all trajectories as means of single
cells were compared between the different ClC-5 variants. Each cell had different
amounts of endosomes. Since single cells within the population of one ClC-5 construct
may have a greater influence on the calculated parameters if there were more
endosomes detected in these cells than in the other cells, mean values of single cells
were calculated. However, pooling all trajectories from all cells expressing one ClC-5
variants showed similar results to mean values of single cells (Supplemental Figure 2).
In a first step, the correlations between the different parameters were investigated. Thus,
the mean values of the lifetime, net displacement and mean velocity of single cells were
examined (Figure 39 for means of cells). Here, the two glycosylation deficient mutants
(N408E and N408A) had a significantly shorter lifetime compared to the WT (Figure
39 A). The net displacements were not statistically different, except for the R516W which
traveled a smaller distance than the N408E (Figure 39 B). With regard to the mean
velocities, significant differences were found between most constructs: WT and R516W
were the slowest and the glycosylation deficient mutants the fastest (Figure 39 C).
Figure 39 Lifetime, net displacement and mean velocity of trajectories from single cells recorded with the low temporal resolution. Box plots of mean values of the lifetime (A), net displacement (B), and mean velocity (C) of all trajectories from single cells recorded with the low temporal resolution are depicted. Single cells (•), mean (■), median (-). * indicates a significant difference between two values. Significance was tested using the One-way Anova with post-hoc Tukey HSD and significance was set at a P value of <0.05. N=22 cells for WT and N408E, n=19 cells for R516W, and n=20 cells for N408A.

Results
58
In order to examine possible correlations between the parameters, the mean values of
all endosomes from single cells were analyzed in terms of lifetime versus net
displacement and the net displacement was also plotted against the velocity (Figure 40).
In general, plotting lifetime versus velocity (Figure 40 A), indicated that the faster the
vesicles were moving, the shorter was their lifetime. Another correlation between the
mean velocity and net displacement became visible: The faster particles were moving,
the more distance was covered from their origin. However, a longer lifetime did not
necessarily result in a higher net displacement (Figure 40 B). All four ClC-5 constructs
showed similar correlations and only the cells expressing WT ClC-5 formed a small
group of slowly yet far moving endosomes (see Figure 40 C)
In order to further visualize the differences between the populations of cells expressing
the same ClC-5 construct, a 3D plot of net displacement versus lifetime versus mean
velocity was constructed (Figure 40 D).The WT formed a denser group, with only one
cell that had a very short lifetime and net displacement.
Figure 40: Correlations of lifetime, net displacement and mean velocities of trajectories recorded at the low temporal resolution. Mean values of endosomes from WT ClC-5 are depicted in blue, R516W in green, N408E in cyan and N408A in red. Mean values of all trajectories of one cell (each cell is represented by one dot) of the different ClC-5 varaints are shown. The 2D analysis is shown in A, B and C and the 3D in D.Lifetime versus velocity is depicted in A), lifetime versus net displacement in B) net displacement versus velocity in C). Mean ±SEM are shown in A, B and C and in D, only mean values are depicted. N=22 cells for WT and N408E, n=19 cells for R516W, and n=20 cells for N408A.
Results
59
Cells of the R516W mutant were broadly distributed, such as the N408E and N408A
mutant. Overall, there was a major overlap of all cells of all four ClC-5 variants.
In general, in the low temporal resolution, the WT and R516W displayed the highest
lifetime; net displacements were very similar between all four ClC-5 constructs; only the
R516W had a significantly lower net displacement as compared to the N408E mutant. It
is noteworthy that the mean velocities differed considerably between most ClC-5
variants: The WT had the slowest and the N408E the fastest mean velocity.
Calculation of Mean Square Displacement
The most common way to describe particle movements is by using the mean square
displacement (MSD), which is a value for the mean square distance traveled by a
particle along the x-y axis (in µm²) in a specific time interval/lag Δt (examples for MSD
curves can be seen in Figure 41). In detail, it is evaluated how far a particle is moving for
a certain time lag over its whole trajectory’s lifetime. For instance, for a time lag of one
second, the distance travelled every second from the trajectory’s origin until its end is
examined and a mean value is calculated. The same is then done with a time lag of two
seconds, where the distance travelled every two seconds is calculated. Here, not the
displacement from the origin, which was defined as net displacement in this study, was
considered, but the total distance travelled by the endosome was used (a detailed
description is depicted in Figure 15).
MSD analysis can also be used to describe the motility of particles. Here, the curve
progression is examined in order to distinguish between free diffusion, active transport
or anomalous behavior (Figure 16). MSD curves from single trajectories and the mean
MSD curve of all trajectories of single cells of the different ClC-5 constructs indicated
that the endosomal movement can be described as anomalous (Figure 41): no limit was
reached but the progression curve decreased at longer time lags.

Results
60
Based on the calculated MSD, the diffusion coefficient D (also named transport
coefficient) was calculated indicating the squared distance traveled per second (in
µm²/s). The diffusion coefficient of the WT and R516W ClC-5 were smaller as compared
to the N408E and N408A mutants. However, the test for significance assessed only the
WT to have significantly lower D values than the N408E (Figure 42).
.
Figure 42: Diffusion coefficient (D) of trajectories as means of single cells.
The D coefficients of trajectories of the WT ClC-5 (blue), or of the ClC-5 mutants R516W (green), N408E (cyan) or N408A (red) were calculated using TrackArt (Matysik and Kraut, 2014). Mean values of all trajectories of single cells are depicted, each dot represents one cell. Single cells (•), mean (■), and median (-). * indicates a significant difference between two values. Significance was tested using the One-way Anova with post-hoc Tukey HSD and significance was set at a P value of <0.05. N=22 cells for WT and N408E, n=19 cells for R516W, and n=20 cells for N408A.
In conclusion: The motility of endosomes from all ClC-5 constructs showed kinetics
described by anomalous diffusion; the analysis of the transport coefficient indicated the
significantly faster diffusion of the N408E mutant as compared to the WT.
Figure 41: Single and mean MSD curves of trajectories of WT, R516W, N408E and N408A ClC-5 in the low temporal resolution.
The MSD curves of all trajectories from WT, R516W, N408E and N408A ClC-5 were calculated and visualized using TrackArt (Matysik and Kraut, 2014). MSDs of single cells are depicted as black lines, mean values from all cells in colored lines. N=22 cells for WT and N408E, n=19 cells for R516W, and n=20 cells for N408A.
Results
61
High temporal resolution of particle tracking
For the high temporal resolution, time-lapse images with the shortest possible cycle time
for the utilized TIRF microscope were recorded with a 302 ms frame rate for 500 frames.
The faster frame rate enabled the tracking of faster moving endosomes which might be
lost using a slower frame rate.
Endosomes of the R516W ClC-5 have a shorter lifetime and faster
mean velocity as compared to the WT
Comparing the mean values of lifetime, net displacement and mean velocity of single
cells recorded with a faster cycle time showed a similar behavior of WT and N408E (see
Figure 43 for mean of cells and Supplemental Figure 4 for all trajectories from all cells).
The N408A had the longest and the R516W the shortest lifetime. The net displacements
were also significantly different between most of the constructs: The WT and the N408E
had endosomes that moved the furthest from their origin, whereas R516W and N408A
endosomes moved significantly shorter distances from their origin as compared to WT
and N408E. The mean velocity showed significantly different values between most
ClC-5 variants, except the WT and N408E mutant. Here, the R516W had the fastest
endosomes, followed by the WT and N408E, whereas the N408A mutant had the
slowest endosomes.
In comparison with the low temporal resolution, the high temporal resolution was able to
detect more significant differences between the WT and the ClC-5 mutants (see Figure
39 and Figure 43) but the distribution of the lifetime, net displacement and mean velocity
were different between both cycle times. The R516W for instance had the longest
lifetime in the low and the shortest in the high temporal resolution. The net displacement
was very similar in all ClC-5 variants in the low temporal resolution but the high temporal
resolution was able to detect differences. The mean velocities were also quite different
between low and high temporal resolution, for instance the R516W had the fastest
endosomes in the high and one of the slowest in the low temporal resolution.
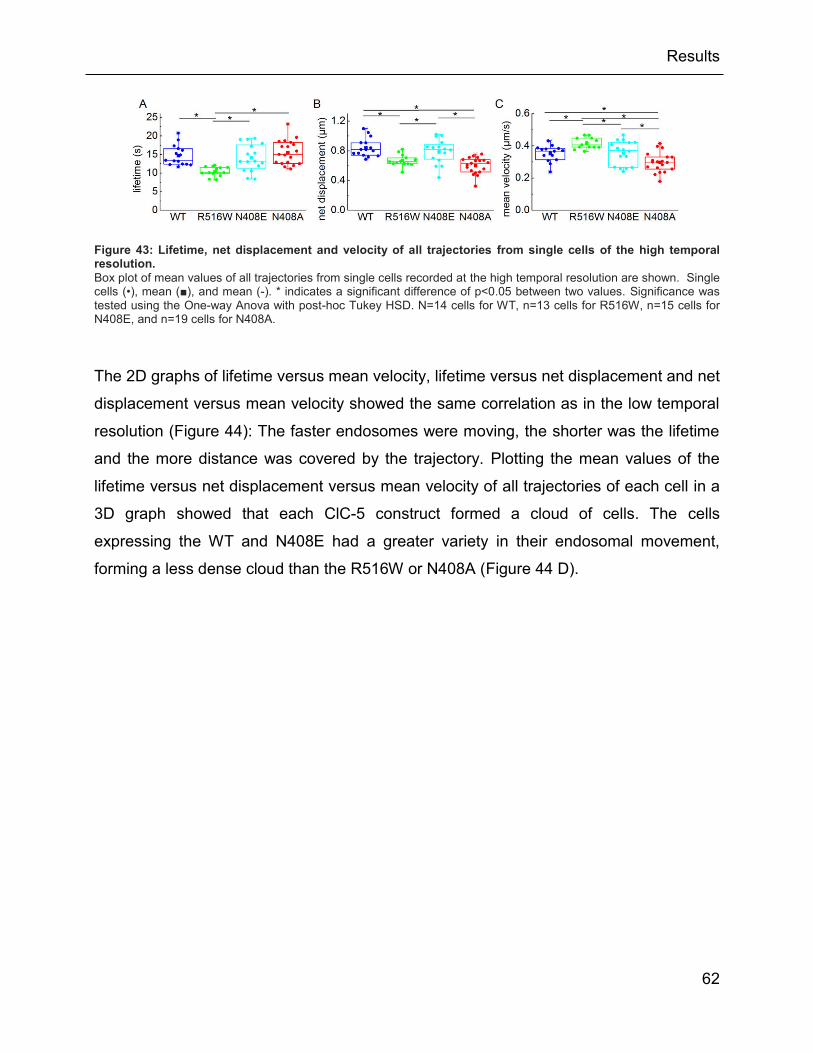
Results
62
The 2D graphs of lifetime versus mean velocity, lifetime versus net displacement and net
displacement versus mean velocity showed the same correlation as in the low temporal
resolution (Figure 44): The faster endosomes were moving, the shorter was the lifetime
and the more distance was covered by the trajectory. Plotting the mean values of the
lifetime versus net displacement versus mean velocity of all trajectories of each cell in a
3D graph showed that each ClC-5 construct formed a cloud of cells. The cells
expressing the WT and N408E had a greater variety in their endosomal movement,
forming a less dense cloud than the R516W or N408A (Figure 44 D).
Figure 43: Lifetime, net displacement and velocity of all trajectories from single cells of the high temporal resolution.
Box plot of mean values of all trajectories from single cells recorded at the high temporal resolution are shown. Single cells (•), mean (■), and mean (-). * indicates a significant difference of p<0.05 between two values. Significance was tested using the One-way Anova with post-hoc Tukey HSD. N=14 cells for WT, n=13 cells for R516W, n=15 cells for N408E, and n=19 cells for N408A.
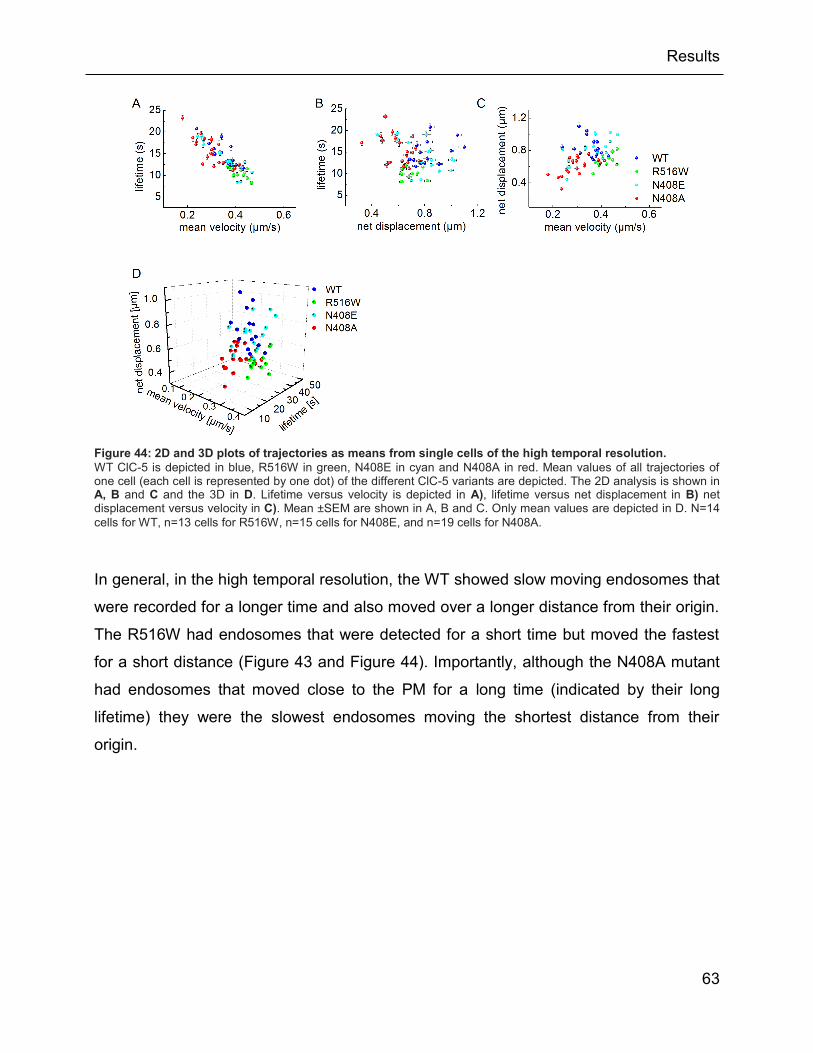
Results
63
In general, in the high temporal resolution, the WT showed slow moving endosomes that
were recorded for a longer time and also moved over a longer distance from their origin.
The R516W had endosomes that were detected for a short time but moved the fastest
for a short distance (Figure 43 and Figure 44). Importantly, although the N408A mutant
had endosomes that moved close to the PM for a long time (indicated by their long
lifetime) they were the slowest endosomes moving the shortest distance from their
origin.
Figure 44: 2D and 3D plots of trajectories as means from single cells of the high temporal resolution. WT ClC-5 is depicted in blue, R516W in green, N408E in cyan and N408A in red. Mean values of all trajectories of one cell (each cell is represented by one dot) of the different ClC-5 variants are depicted. The 2D analysis is shown in A, B and C and the 3D in D. Lifetime versus velocity is depicted in A), lifetime versus net displacement in B) net displacement versus velocity in C). Mean ±SEM are shown in A, B and C. Only mean values are depicted in D. N=14 cells for WT, n=13 cells for R516W, n=15 cells for N408E, and n=19 cells for N408A.
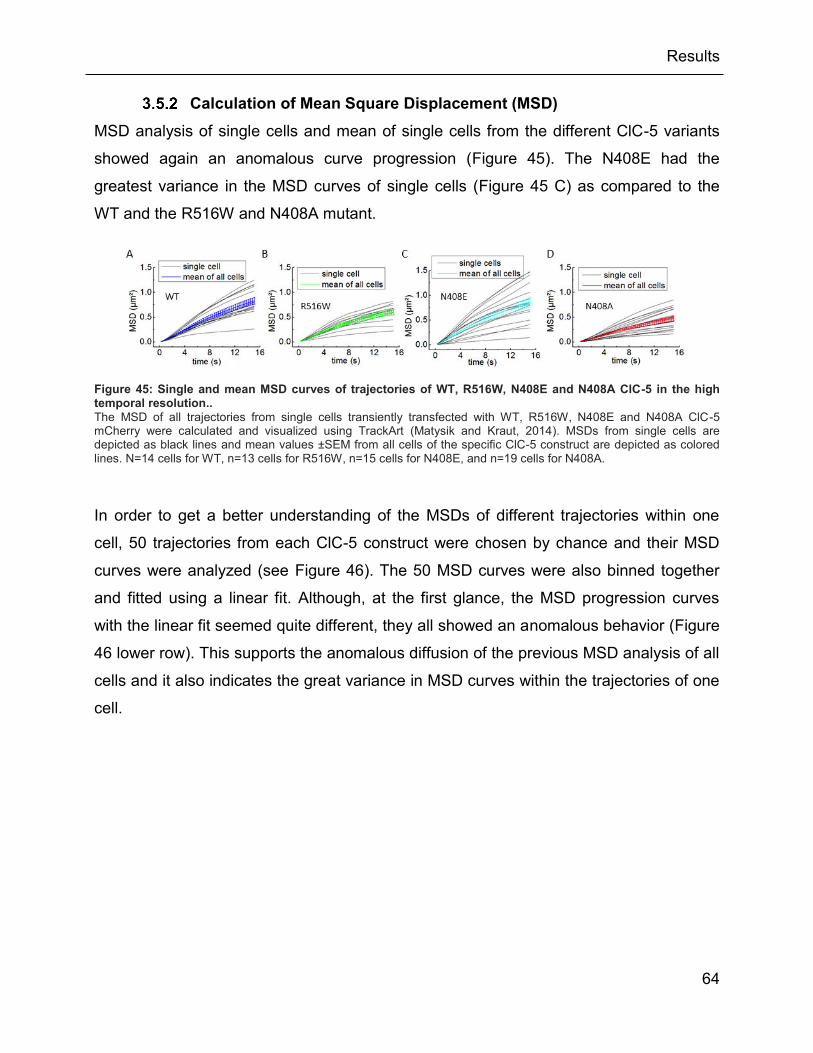
Results
64
Calculation of Mean Square Displacement (MSD)
MSD analysis of single cells and mean of single cells from the different ClC-5 variants
showed again an anomalous curve progression (Figure 45). The N408E had the
greatest variance in the MSD curves of single cells (Figure 45 C) as compared to the
WT and the R516W and N408A mutant.
Figure 45: Single and mean MSD curves of trajectories of WT, R516W, N408E and N408A ClC-5 in the high temporal resolution..
The MSD of all trajectories from single cells transiently transfected with WT, R516W, N408E and N408A ClC-5 mCherry were calculated and visualized using TrackArt (Matysik and Kraut, 2014). MSDs from single cells are depicted as black lines and mean values ±SEM from all cells of the specific ClC-5 construct are depicted as colored lines. N=14 cells for WT, n=13 cells for R516W, n=15 cells for N408E, and n=19 cells for N408A.
In order to get a better understanding of the MSDs of different trajectories within one
cell, 50 trajectories from each ClC-5 construct were chosen by chance and their MSD
curves were analyzed (see Figure 46). The 50 MSD curves were also binned together
and fitted using a linear fit. Although, at the first glance, the MSD progression curves
with the linear fit seemed quite different, they all showed an anomalous behavior (Figure
46 lower row). This supports the anomalous diffusion of the previous MSD analysis of all
cells and it also indicates the great variance in MSD curves within the trajectories of one
cell.

Results
65
Figure 46: Overview of 50 single MSD curves and the fitted average MSD of ClC-5 endosomes.
50 trajectories from one representative cell were randomly picked and the single MSD curves of WT, R516W, N408E or N408A mutant ClC-5 were calculated (upper row). Then all MSDs of all 50 trajectories were fitted using a linear fit (lower row).
Based on the MSDs the diffusion coefficients D were also extracted (Figure 47). The
N408A mutant had the lowest D values followed by the R516W and the WT. The N408E
had the, overall, highest D value but also a very broad distribution within its population.
The WT had a significantly higher D value than the N408A, and the N408A had a higher
value than the R516W and N408E.
Figure 47: Diffusion coefficients (D) of all trajectories from ClC-5 endosomes in single cells.
D values of trajectories of the WT (blue), R516E (green), N408E (cyan) or N408A ClC-5-mCherry (red) were calculated using TrackArt (Matysik and Kraut, 2014). Mean values of all trajectories of single cells are depicted. Single cells (•), mean (■), and median (-). N=14 cells for WT, n=13 cells for R516W, n=15 cells for N408E, and n=19 cells for N408A. Significance was tested using the One-way Anova with post-hoc Tukey HSD and significance was set at a P value of <0.05.

Results
66
WT and N408E ClC-5 endosomes move more target-oriented than
R516W and N408A ClC-5 endosomes
The tracked endosomes seemed to be walking more directionally in the WT than in the
mutants (Figure 37). In order to investigate if the mutant and WT ClC-5 endosomes were
moving linearly or rather in an unorganized fashion, the target-orientation of the
endosomal walk was calculated. The target-orientation was defined as the net
displacement divided by the total distance walked by a trajectory. The higher the value,
the more efficient is the target-oriented movement of endosomes. Mean values of all
trajectories from single cells were again calculated and are illustrated in Figure 48.
The WT had a target-origentation of
0.36±0.01 (SEM), the R516W
0.32±0.008, N408E 0.37±0.01, and
N408A 0.32±0.006. It is worth noticing
that the cells of the N408A ClC-5 variant
had very similar efficiency values,
whereas the WT and N408E showed
greater variances in the cells population.
In general, endosomes of the WT and
N408E ClC-5 walked with a significantly
more target-orientation away from their
origin than the R516W and N408A ClC-5
endosomes.
Figure 48: Target-orientation of endosomes from WT, R516W, N408E, and N408A ClC-5 endosomes.
Mean values of all trajectories of single cells are depicted. In a Box plot. Single cells (•), mean (■), and median (-). N=14 cells for WT, n=13 cells for R516W, n=15 cells for N408E, and n=19 cells for N408A. Significance was tested using the One-way Anova with post-hoc Tukey HSD and significance was set at a P value of <0.05.
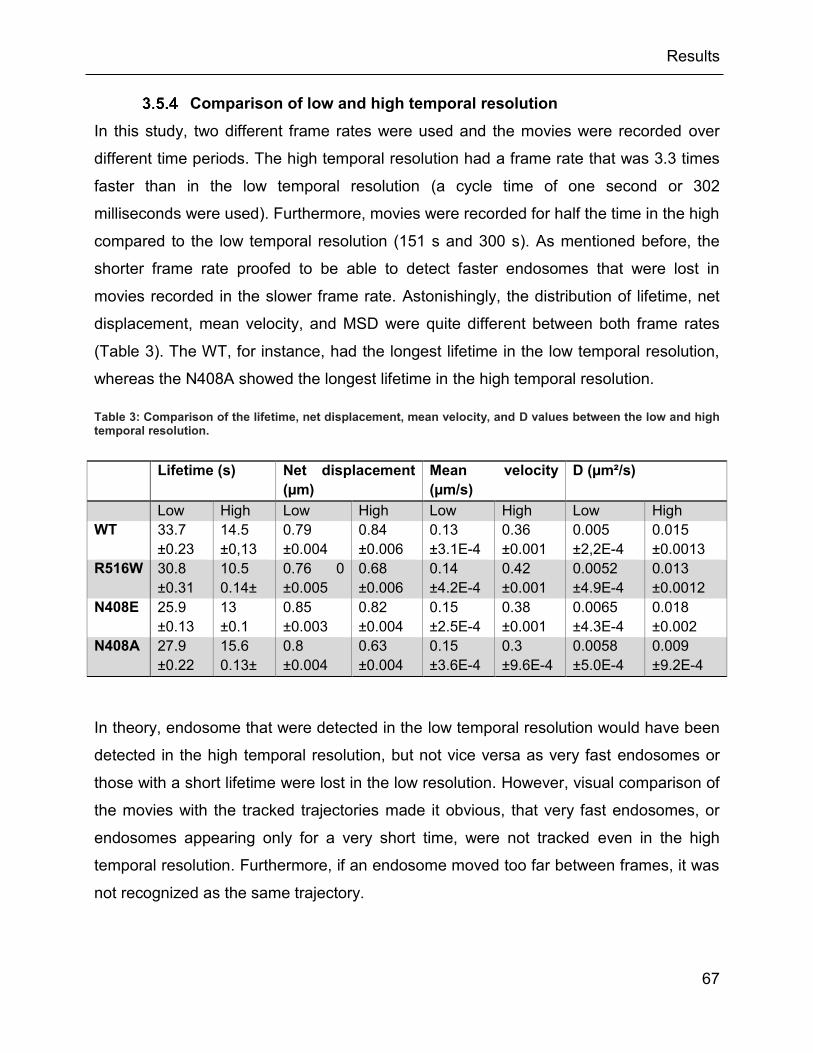
Results
67
Comparison of low and high temporal resolution
In this study, two different frame rates were used and the movies were recorded over
different time periods. The high temporal resolution had a frame rate that was 3.3 times
faster than in the low temporal resolution (a cycle time of one second or 302
milliseconds were used). Furthermore, movies were recorded for half the time in the high
compared to the low temporal resolution (151 s and 300 s). As mentioned before, the
shorter frame rate proofed to be able to detect faster endosomes that were lost in
movies recorded in the slower frame rate. Astonishingly, the distribution of lifetime, net
displacement, mean velocity, and MSD were quite different between both frame rates
(Table 3). The WT, for instance, had the longest lifetime in the low temporal resolution,
whereas the N408A showed the longest lifetime in the high temporal resolution.
Table 3: Comparison of the lifetime, net displacement, mean velocity, and D values between the low and high temporal resolution.
In theory, endosome that were detected in the low temporal resolution would have been
detected in the high temporal resolution, but not vice versa as very fast endosomes or
those with a short lifetime were lost in the low resolution. However, visual comparison of
the movies with the tracked trajectories made it obvious, that very fast endosomes, or
endosomes appearing only for a very short time, were not tracked even in the high
temporal resolution. Furthermore, if an endosome moved too far between frames, it was
not recognized as the same trajectory.
Lifetime (s) Net displacement
(µm)
Mean velocity
(µm/s)
D (µm²/s)
Low High Low High Low High Low High WT 33.7
±0.23 14.5 ±0,13
0.79 ±0.004
0.84 ±0.006
0.13 ±3.1E-4
0.36 ±0.001
0.005 ±2,2E-4
0.015 ±0.0013
R516W 30.8 ±0.31
10.5 0.14±
0.76 0 ±0.005
0.68 ±0.006
0.14 ±4.2E-4
0.42 ±0.001
0.0052 ±4.9E-4
0.013 ±0.0012
N408E 25.9 ±0.13
13 ±0.1
0.85 ±0.003
0.82 ±0.004
0.15 ±2.5E-4
0.38 ±0.001
0.0065 ±4.3E-4
0.018 ±0.002
N408A 27.9 ±0.22
15.6 0.13±
0.8 ±0.004
0.63 ±0.004
0.15 ±3.6E-4
0.3 ±9.6E-4
0.0058 ±5.0E-4
0.009 ±9.2E-4

Results
68
This raises the question as to the experimental limitations and the thresholds for the
lifetime, velocity and displacement. For the lifetime, the threshold was three seconds for
the low and 906 milliseconds for the high temporal resolution, as only trajectories with
more than three frames were analyzed. In order to determine a threshold for the
displacement and velocity, the values of the endosomal movement from frame to frame
were analyzed (the velocity and displacement of particles are depicted in Supplemental
Figure 4) and the fastest particles/endosomes of each ClC-5 construct were extracted.
In the low temporal resolution, the fastest detected endosomes in all four ClC-5
constructs had a velocity of 1.3 µm/s from frame to frame. In the high temporal
resolution, the highest speed was 4.4 µm/s. The greatest detected distance travelled
from one frame to the other was 1.3 µm in both cycle times. Based on these values, one
can conclude that for the low temporal resolution, endosomes that moved faster than
1.3 µm/s from frame to frame were not detected and for the high temporal resolution, all
endosomes faster than 4.4 µm/s were not detected or lost. Since the highest detected
displacement was the same in the low and high temporal resolution, the maximum step
that an endosome could go and still be recognized as one trajectory was 1.3 µm.
In conclusion, the high temporal resolution was able to detect more differences in terms
of lifetime, mean velocity and MSD between the four ClC-5 variants. Due to its ability to
detect faster endosomes and because of the fact that the endosomal speed was
obviously altered in the ClC-5 Dent’s and glycosylation deficient mutants, the results of
the high temporal resolution are most likely to be more profound than the results of the
low temporal resolution. Based on these findings, the particle tracking revealed that the
R516W had the lowest lifetime and the fastest endosomes. The N408A presented the
longest lifetime and slowest velocity.

Results
69
All ClC-5 variants promote endosomal acidification
The next step aimed at evaluating reasons for the altered endosomal motility. It is
established that the accumulation of protons in endosomes regulates their maturation
from early to late and recycling endosomes (Sorkin and von Zastrow, 2002). Thus, it is
possible, that endosomes of the ClC-5 mutants maturated faster or slower than the WT.
The different motilities of WT, R516W, N408E and N408A ClC-5 might have been
caused by an altered acidification of endosomes. In order to examine if the endosomal
pH of the WT and mutant ClC-5 was different, HEK293T cells transiently expressing WT,
R516W, N408E, or N408A ClC-5-mCherry and cotransfected with synapto-pHluorin2
(Mahon, 2011) and subjected to confocal imaging. For a more detailed description of the
method and analysis please refer to sections 2.5 and 3.1.7. The mean pH values of
ClC-5 positive endosomes are depicted in Figure 49.
As described earlier, the expression of WT ClC-5 significantly reduced the endosomal
pH. This was also the case for its mutants R516W, N408E and N408A. The WT,
R516W, N408E mutant displayed a pH around 6 whereas the control cells showed a
higher pH of 6.5. Additionally, the N408A ClC-5 mutation reduced the pH with an even
higher magnitude than the WT (around pH 5.7). Although the measurement of
endosomal pH in ClC-5 knockout mice (Hara-Chikuma et al., 2005), Dent’s disease
patients (Gorvin et al., 2013), or in cell culture (Alekov, 2015) indicated that mutations in
ClC-5 result in more alkaline endosomal pH, the mutant R516W seemed to be functional
to generate a WT-like pH in HEK293T cells.
.
Figure 49: WT ClC-5 and the mutants R516W, N408E and N408A promote acidification.
Analysis of vesicular pH of HEK293T cells transiently co-expressing WT, R516W, N408E, or N408A ClC-5-mCherry and synapto-pHluorin2 or solely expressing synapto-pHluorin2 (control). N=30 cells for ClC-5 WT, n=23 cells for R516W, n=21 cells for N408E, n=20 cells for N408A and n=26 cells for control. The results shown are means ±SEM. * indicates a significant difference between two samples. The significance was tested using a One-way Anova with post-hoc Tukey HSD and significance was set at a P value of <0.05
Results
70
Colocalization of WT, R516W, N408E, and N408A ClC-5 with Rab7
Following the evaluation of the endosomal pH, the question if the mutants were localized
to late endosomes to a higher extend than the WT was addressed. Since the altered
endosomal velocity of the Dent’s and the glycosylation-deficient mutants might also be a
result of a faster (or impaired) maturation of the endosomes. An increased velocity and a
more acidic pH might indicate that the endosomes are transported faster to late
endosomes (or recycling endosomes). In order to evaluate the maturation of the ClC-5
positive endosomes, the different ClC-5 constructs were cotransfected with Rab7, a
marker for late endosomes (Feng et al., 1995) and a colocalization analysis was
performed in HEK293T and MDCKII cells transiently expressing WT, R516W, N408E, or
N408A ClC-5-mCherry (Figure 50). For the HEK293T cells, the colocalization analysis
showed, in general, that there was a distinct overlap of Rab7 objects and objects of the
different ClC-5 constructs. However, only very little ClC-5 objects colocalized with Rab7
(Figure 50 E, object based), but the few overlapping objects shared a high amount of
colocalizing pixels (size based analysis). In MDCKII cells, on the other hand, there was a
high colocalization coefficient between ClC-5 and Rab7 objects and vice versa (see
Supplemental Figure 6). Here, Rab7 overlapped to nearly 100% with R516W objects
and the overlapping area was also around 100%. Yet, there were only around 30% of
R516W objects that colocalized with Rab7 (Figure 50 D). In both cell lines, none of the
mutants showed a significantly different amount of overlapping objects, indicating that all
ClC-5 variants are present on late endosomes to the same extend.

Results
71
Figure 50: Colocalization of WT, R516W, N408E and N408A ClC-5 with Rab7 in HEK293T cells. A-D) representative confocal images (single z-slides) of HEK293T cells transiently transfected with WT (A), R516W (B), N408E (C) or N408A (D) ClC-5-mCherry (in red) and cotransfected with Rab7-EYFP (in green). E) Box plots summarizing the results from object-based and size-based colocalization analysis corresponding to the number of overlapping objects defined in two channels as Rab5WT- or Rab5CA- and ClC-5-containing objects. N=10 cells for WT, R516W, and N408E, as well as n=9 cells for R516W, and N408A. Single cells (•), mean (■), and median (─). Scale bars correspond to 10 µm

Results
72
No altered fluid-phase and receptor mediated endocytosis in WT and
mutant ClC-5
The altered endosomal motility might have been the result of, or might have been
influenced by, an altered endocytosis rate. The loss or downregulation of ClC-5 was
shown to impair albumin endocytosis in kidney proximal tubular cells (PTC) in Dent’s
disease and ClC-5 knockout mice (Christensen et al., 2003a; Piwon et al., 2000). In
order to investigate the rate of receptor-mediated and fluid-phase endocytosis, the
internalization of fluorescently labeled albumin and dextran was measured. Albumin has
been established as a marker for receptor-mediated, clathrin-dependent endocytosis
(Caruso-Neves et al., 2005; Schwegler et al., 1991; Takano et al., 2002) and dextran as
a marker for fluid-phase endocytosis (Cao et al., 2007; Gorvin et al., 2013; Shurety et
al., 1998). The internalization of Atto425-labeled albumin was previously examined in
MDCKII cells transiently expressing WT, R516W, N408E, or N408A ClC-5. Albumin was
internalized and partially overlapped with ClC-5 (see Supplemental Figure 5).
Nontransfected HEK293T cells (=control) or cells transiently expressing WT, or the
mutants R516W, N408E and N408A ClC-5 mCherry were first serum starved and
subsequently incubated with either 50 µg/ml Atto425-labeled albumin or Atto488-
conjugated dextran. The unbound albumin/dextran was washed off with trypsin and the
fluorescence intensity (FI) per cell was analyzed.
The overexpression of ClC-5 caused a slightly increased internalization and thus
increased endocytosis of albumin (Figure 51 A). The mutants R516W also showed a
tendency towards a higher amount of internalized albumin and dextran, whereas N408E
and N408A ClC-5 had a decreased endocytosis rate as compared to WT ClC-5
overexpressing cells. Yet, there were no significant differences between the control and
the WT or the mutants. In the dextran uptake of the R516W mutant (see Figure 51 B)
one sample showed three times more dextran fluorescence than the other two samples.
Since no obvious reasons for the increased internalization of dextran in this specific
sample could be detected; the sample was not excluded from the data.

Results
73
Figure 51: Uptake of albumin or dextran is not altered in HEK293T cells transiently expressing WT, R516W, N408E and N408A ClC-5. The endocytosis of fluorescently labeled albumin (A) or Atto488-conjugated dextran (B) in nontransfected HEK293T cells (control) or cells transiently expressing mCherry-tagged WT ClC-5 or the mutants R516W, N408E or N408A was measured. Therefore, cells were first serum-starved for 1 h before they were incubated for 5 min with 50 µg/ml albumin or dextran at 37°C. The fluorescence intensity normalized to the cell density is shown (FI/OD750). For albumin the FI at 524 nm (excited at 488 nm) is shown and for dextran the FI at 472 nm with an excitation at 425 is displayed. Single cells (•), mean (-) is depicted. N=3 petri dishes. One-way Anova with post-hoc Tukey HSD and significance was set at a P value of <0.05, but no significant differences were detected between the samples.
In conclusion, although the pH of WT, R516W, N408E, and N408A ClC-5 was
significantly reduced, the fluid-phase and receptor-mediated endocytosis were not
notably influenced in these cells. Furthermore, all ClC-5 variants were located to late
endosomes in a similar manner.

Discussion
74
4 Discussion
This study elucidated the function of the chloride/proton exchanger ClC-5 in the
intoxication of TcdA, a toxin of the pathogenic bacterium C. difficile. Furthermore, tools
to study endosomal motility were established and the movement of ClC-5 positive
endosomes in terms of a possible influence of glycosylation of the ClC-5 protein was
analyzed.
ClC-5 is broadly expressed in the kidney (Devuyst et al., 1999), brain, lung, liver
(Steinmeyer et al., 1995), and gastrointestinal cells (Vandewalle et al., 2001). It is
located in early to late endosomes, as well as on the PM and is crucial for acidification of
endosomes and hence for the endocytosis process (Christensen et al., 2003b; Devuyst
et al., 1999; Friedrich et al., 1999; Günther et al., 1998; Hara-Chikuma et al., 2005;
Piwon et al., 2000).
C. difficile bacteria colonize a host’s gut and disrupt the gastrointestinal epithelial barrier
in order to spread to new hosts (Papatheodorou et al., 2010; Pruitt et al., 2010).
Thereby, they cause severe, life-threatening diarrhea (McFarland et al., 1989;
Papatheodorou et al., 2010). The toxins of C. difficile, TcdA and TcdB, enter the host cell
via the endocytic route and require an acidic environment in order to get access into the
cytosol where they inactivate Rho-GTPases (Barth et al., 2001; Papatheodorou et al.,
2010; Voth and Ballard, 2005). Since ClC-5 is situated in gastrointestinal cells and is
important for endocytosis, the first part of this study set out to investigate the possible
role of WT ClC-5 and its non-transporting mutant E268Q ClC-5 in the context of
intoxication of TcdA in HT-29 cells.
Since internalization of proteins depends on endocytosis and subsequent processing of
endosomes, the second part of this study focused on the motility of endosomes. The
study concentrated on the influence of ClC-5 glycosylation on the endosomal motility
close to the PM. Multiple mutations in the CLCN5 gene result in proteins that lack the
complex glycosylation. Furthermore, their transport into endosomes and to the PM is
inhibited as they are retained in the ER (Ludwig et al., 2005; Smith et al., 2009). Using
the R516W ClC-5 as representative ER-retained, non-complex-glycosylated Dent’s
disease mutant, and two artificial glycosylation-deficient mutants (N408E and N408A), a
tool was established to investigate endosomal motility.
Discussion
75
The chloride/proton exchanger ClC-5 increases the susceptibility of
HT-29 cells towards TcdA
Previous findings suggested that an overexpression of ClC-5 caused a higher cytopathic
effect of TcdA and TcdB. In order to examine if the chloride/proton transport of ClC-5 is
responsible for the increased cytopathic effect of TcdA, the non-transporting E268Q
ClC-5 was used as control (Figure 11) (Ruhe et al., 2017). In this mutant, the proton
glutamate is neutralized, abolishing the transport of protons and chloride ions (Grieschat
and Alekov, 2012; Smith and Lippiat, 2010; Zdebik et al., 2008). However, the cytopathic
effect of TcdA was increased in WT, as well as in E268Q ClC-5 expressing cells.
In order to exclude the aspect of artificial effects due to the overexpression of ClC-5,
endogenous ClC-5 was knocked down in HT-29 cells by siRNA targeted against human
ClC-5 in the present study. Cells were then intoxicated with TcdA and the cell rounding
as a result of the cytopathic effect was determined. The cytopathic effect was reduced
by approximately 10% by 10 or 20 nM siClC-5 respectively, as compared to cells
transfected with non-targeting siRNA (Figure 24). In order to detect cells that were
transfected with siClC-5, a plasmid carrying the CD8 antigen sequence was
cotransfected. Commercial microbeads with an anti-CD8 antibody were then added to
the cell mixture after intoxication and the cell morphology of cells covered with multiple
beads was investigated (as illustrated in Figure 24 A). The cotransfection rate of siRNA
and plasmid DNA is most likely not 100%, raising the question if the microbeads-marked
cells were indeed transfected with siClC-5 and thus had reduced ClC-5 RNA levels. The
qRT-PCR for the analysis of the RNA downregulation indicated that the transfection
efficiency of siCLC-5 was quite high: 70% of ClC-5 mRNA was downregulated in HT-29
cells transfected with 20 nM siClC-5 (Figure 23). Since HT-29 cells are hard-to-transfect
cells, the transfection efficiency of plasmid DNA was usually around 30% (data not
shown). For the intoxication, as well as the quantitative RT-PCR, the sample included
both transfected and non-transfected cells. The high downregulation of ClC-5 mRNA in
transfected HT-29 cells therefore indicates that the efficiency of siRNA can be
considered higher than of plasmid DNA. This, in turn, increases the probability of pLeu2-
CD8 expressing cells to be also transfected with siClC-5.

Discussion
76
The fact, that the reduction of the cytopathic effect on ClC-5 knockdown cells caused a
lower amount of morphological changes, supports the theory that ClC-5 is important for
the intoxication of TcdA. It further indicates that the findings in ClC-5 overexpressing
cells are not a mere side effect due to the overexpression.
WT and E268Q ClC-5 are located to early and early-to-late endosomes
in HT-29 cells
TcdA is internalized and processed in endosomes (Keel and Songer, 2011; Pruitt and
Lacy, 2012). ClC-5 has been described to be located to early endosomes in rat proximal
tubular cells (Günther et al., 1998). However, only very little is known about its presence
in the endocytosis pathway of HT-29 cells. Thus, at first, the expression and subcellular
localization of ClC-5 as well as its presence in the endosomal pathway of HT-29 cells
was examined (Figure 22 - Figure 29). In this model cell line, WT ClC-5 was expressed
and present as complex-, core- and non-glycosylated proteins with sizes ranging from
90-120 kDa (Figure 21), which is in accordance to the literature (Jouret et al., 2004;
Schmieder et al., 2007). Deglycosylated ClC-5 has been shown to be impaired in its cell
surface expression (Schmieder et al., 2007), thus, the different glycosylation patterns of
ClC-5 might represent the capability of the protein to be targeted to the PM in certain
tissues, or to be retained in the ER or located to endosomes. In addition to HT-29 cells,
the expression of ClC-5 in HEK293T cells was investigated. Here, ClC-5 was complex,
core-and non-glycosylated as well. However, the band of the core- and non-glycosylated
protein was more pronounced in HEK293T cells than in HT-29 cells, indicating that ClC-
5 is more efficiently maturated in HT-29 cells. Tissue dependent differences in the
glycosylation have already been reported for the ClC-5 homologue, ClC-3 (Schmieder et
al., 2007). The primary results showed that WT and the non-transporting ClC-5
increased the cytopathic effect of TcdA (Figure 11) (Ruhe et al., 2017). Since the uptake
of TcdA and TcdB depends on the host’s endocytosis machinery (Florin and Thelestam,
1983; Henriques et al., 1987; as reviewed in Voth and Ballard, 2005), the localization of
both WT and E268Q ClC-5 in the endocytic pathway in HT-29 cells was examined.
Therefore, the colocalization of WT and E268Q ClC-5 with Rab proteins, which are
considered as markers for different endosomal stages (Chavrier et al., 1990), was
assessed. The colocalization analysis demonstrated that WT and E268Q ClC-5 were

Discussion
77
both located to early, Rab5 positive endosomes. Furthermore, the WT was also targeted
on early-to-late, Rab7-positive endosomes (Figure 25 and Figure 28). In more detail,
around 25-30% of WT and E268Q ClC-5 colocalized with Rab5. Furthermore, the WT
also overlapped with around 30 % with Rab7 or Rab4a objects (Figure 25, Figure 26,
and Figure 28). The association of ClC-5 with Rab4a and Rab5 is in accordance with
findings regarding the localization of endogenous ClC-5 in rat intestinal cells
(Vandewalle et al., 2001). An overlap of ClC-5 and Rab7 has also been previously
reported for mouse thyroid gland cells (van den Hove et al., 2006). The similar
colocalization value of WT ClC-5 with Rab5 and Rab7-positive endosomes can be
explained by the endocytosis pathway: During endosomal maturation, Rab5 positive
endosomes become Rab7-positive late endosomes (Rink et al., 2005). Rab4a is also
involved in early endosomes however it is located on a different endosomal
compartment than Rab5. During maturation, Rab4a-positive endosomes become
Rab11-positive recycling endosomes (De Renzis et al., 2002).
In conclusion, the results of this research indicate that WT and E268Q ClC-5 were
mainly present in early endosomes and it shows that WT ClC-5 was also targeted to
early-to-late and not to recycling endosomes of the endocytosis pathway in HT-29 cells.
This suggests a role of ClC-5 in the sorting machinery and not in the recycling pathway.
ClC-5 colocalizes with the C. difficile toxin TcdA
In a next step, it was necessary to asses a possible colocalization of TcdA and ClC-5 in
order to investigate if the increased cytopathic effect of TcdA was a side product of the
ClC-5 expression. Such a possible side effect could be an overall increased endocytosis
rate in ClC-5 expressing cells. Another theory was that TcdA may hijackes ClC-5 either
to get access to the host cell or to increase its toxicity in a different way. In order to
investigate the last possibility, HT-29 cells overexpressing WT ClC-5 were intoxicated
with EGFP-labeled TcdA and a colocalization analysis was performed (Figure 29). The
living cell analysis (Figure 29) showed that 34% of TcdA colocalized with ClC-5. The
colocalization on similar subcellular structures indicated that ClC-5 has a direct influence
on the internalization of TcdA.
Discussion
78
As a subsequent step, the kinetic of internalization was assessed and the colocalization
of ClC-5 and TcdA during different internalization periods was analyzed (Figure 30).
However, it was not possible to achieve this research goal, because there was nearly no
intracellular TcdA detectable in the fixed cells. In contrast to living cells, in which TcdA
was observed in vesicular-like structures, in fixed cells, TcdA appeared solely at the PM
(Figure 31 for living cells, Figure 32 for fixed cells). One possible explanation for this
finding is that the internalized EGFP-tagged TcdA could not be detected due to
quenching or a severe reduction of the EGFP fluorescence intensity as a result of the
fixation procedure. The problem that a fixation step can reduce the fluorescence
intensity has already been described previously (Brock et al., 1999). In addition, Kern
and Feig described a low fluorescence intensity of intracellular EGFP-tagged TcdA
(Kern and Feig, 2011). The underlying mechanism of the reduced fluorescence intensity
of EGFP at low pH is a protonation of the hydroxyl group of tyrosine at position 66 which
probably results in a decreased molar absorption coefficient of the protein (Haupts et al.,
1998). Thus, the small amount of EGFP-TcdA carrying endosomes in the living cells
might be a result of the reduced EGFP-fluorescence intensity in endosomes that were
more acidic. Labeling TcdA with the fluorescence dye Atto425, lowered the amount of
colocalizing objects (only around 10% of colocalization was detected) but it
circumvented the problem of the quenched or protonated EGFP. The low colocalization
coefficient might be explained by the subcellular distribution of TcdA which was more
diffuse compared to the EGFP-tagged TcdA (Figure 29 for internalized EGFP-TcdA,
Figure 31 for the labeled Atto425-TcdA). The Atto425 NHS-ester dye labels primary
amines (NH2) groups of proteins. Thus, it labeled not only the full length toxin, but also
protein fragments in the sample. This probably resulted in the diffuse subcellular
localization and the higher amount of internalized toxin (or toxin fragments). The diffuse
localization pattern also caused the lower overlapping rate in the samples with the
labeled toxin compared to the EGFP-TcdA.
Overall, this study demonstrated a striking colocalization of TcdA and ClC-5, indicating
that ClC-5 has a direct influence on the intoxication of TcdA.
Discussion
79
ClC-5 promotes TcdA internalization and acidification of ClC-5
positive endosomes
There are three possibilities how ClC-5 could increase the toxicity of TcdA: i) the toxin
could be internalized faster, ii) a higher amount of toxin could be internalized or iii) the
internalized toxin is processed faster due to a lower endosomal pH.
In order to test for the first and second possibility, the amount of internalized (and
membrane-bound) TcdA in ClC-5 overexpressing cells was investigated. Since the
transporting capability of ClC-5 might be important for the toxin internalization, not only
cells expressing the WT but also the non-transporting E268Q ClC-5 mutation were used.
To examine the amount of internalized TcdA, HEK293 cells stably expressing WT or
E268Q ClC-5 were intoxicated with TcdA and the toxins’ fluorescence per cell was
measured (Figure 32). Of note, stably transfected HEK293 cells were needed for this
experiment because it was necessary for the analysis that all cells expressed WT or
E268Q ClC-5 and the transfection rate of HT-29 cells was too low for this approach.
Significantly more TcdA was internalized in WT and E268Q ClC-5 overexpressing cells
as compared to the control (mCherry overexpressing cells). It is worth noticing, that
there was also twice as much TcdA internalized in cells expressing WT ClC-5 than in the
non-transporting mutant E268Q. Immediately after endocytosis, the chloride
concentration in the vesicle raises from early to late endosomes (Sonawane et al., 2002)
and ClC-5 was reported to be involved in endosomal chloride accumulation (Novarino et
al., 2010). Hence, the reason for the reduced endocytosis in E268Q cells might be a
result of a lower chloride concentration which leads to a decreased maturation of
endosomes causing an impaired endocytosis rate. In order to determine the chloride
concentration in WT and E268Q ClC-5 endosomes, further research is required. The
present experiment was not able to distinguish between the first and second possibility
for the increased TcdA toxicity that were proposed above. Internalization kinetics are
necessary to differentiate between a higher amount of internalized toxin and a faster
internalization rate by using different time periods for the internalization step followed by
immediate fixation of the cells.
Discussion
80
In order to address the third possibility, that the acidification of ClC-5 positive
endosomes caused a faster processing of the toxin, the pH of endosomes was
assessed. The endosomal pH of WT and E268Q ClC-5 positive endosomes was
significantly lower than of the control cells (around pH 6 in ClC-5 and pH 6.5 in control
cells), pointing to more progressed endosomes in ClC-5 overexpressing cells (see
Figure 33). Surprisingly, the E268Q mutant was functional sufficient to generate a WT
like pH. In a non-transporting mutant of ClC-7, a homologue of ClC-5, a functional
vesicular acidification was shown as well (Weinert et al., 2014). The E268Q has been
identified to increase the electric capacity of membranes (Grieschat and Alekov, 2012).
In general, the acidification of endosomes is generated by the proton pump V-ATPase
(as reviewed in Forgac, 2007). However, loss of ClC-5 is linked to a defect in endosomal
acidification (Piwon et al., 2000; Silva et al., 2003; Wang et al., 2000), suggesting a role
of ClC-5 in the acidification process. It has been proposed that the chloride/proton
exchange function of ClC-5 directly activates the V-ATPase and thereby ensures normal
acidification of endosomes (Satoh et al., 2016). This stands in contrast to the findings in
this study. Here, the non-transporting E268Q ClC-5 mutant had a WT-like endosomal
pH. Possible explanations for the acidified endosomes in the E268Q mutant might be
that ClC-5 activates regulators of the V-ATPase, or that the electric membrane capacity
generated by ClC-5 activates the V-ATPase, thus promoting the proton transport into the
vesicle. Furthermore, the E268Q mutant might transport one chloride (instead of two) at
the expense of one proton, providing counter ions to maintain the function of the
V-ATPase. However, more research is needed in order to determine whether any of the
three proposed possibilities caused the decreased pH in E268Q ClC-5 cells.
In conclusion, the above mentioned findings indicate that the chloride/proton antiporter
ClC-5 promotes an increased toxicity of the C. difficile toxin TcdA due to an accelerated
maturation of endosomes. The lower pH may cause a faster pH-dependent
conformational change of TcdA which, in turn, results in the endocytosis of a higher
amount of TcdA and faster translocation of the catalytic domain into the cytosol. A faster
cell entry due to a quicker conformational change at lower pH was shown for TcdB of a
hypervirulent strain (Lanis et al., 2010).
Discussion
81
The role of glycosylation in fine-tuning of ClC-5 mediated
endocytosis
Internalization of proteins depends on the endocytosis machinery and includes the
further processing and maturation of endosomes. The second part of this study set out
to establish tools to investigate endosomal motility. Here, the focus was on the influence
of ClC-5 glycosylation, since multiple mutations in the CLCN5 gene result in proteins
with an inhibited complex glycosylation. Furthermore, these mutations have an impaired
transport into endosomes and to the PM, and cause the renal Dent’s disease (Ludwig et
al., 2005; Scheinman, 1998; Smith et al., 2009). The defects in the glycosylation
combined with the ER retention of Dent’s disease mutants led to the hypothesis that
glycosylation of ClC-5 might have an effect on the trafficking of ClC-5 positive
endosomes due to a reduced transport to or increased backhaul from the PM.
Therefore, besides the WT ClC-5, the Dent’s disease mutant R516W ClC-5 and two
artificial glycosylation deficient mutants (N408E and N408A ClC-5) were examined. The
choice for the R516W ClC-5 as a representative Dent’s disease mutant was motivated
by the fact that this mutant is the only, so far described, missense mutation exhibiting
ER-retention with functional (however reduced) chloride currents. The chloride currents
were reduced by 30 % compared to the WT, which is probably due to its lower cell
surface expression (Ludwig et al., 2005; Smith et al., 2009).
R516W, N408E, and N408A ClC-5 have no complex glycosylation
Two putative N-glycosylation positions were predicted for human ClC-5: N408 and N38
(Figure 34). Since it was previously shown that N408 is the bona fide glycosylation site
in human ClC-5 (Jouret et al., 2004; Schmieder et al., 2007), the glycosylation deficient
mutants used in this work, were generated at this position.
First, it was necessary to assess the glycosylation patterns of WT and the three ClC-5
mutants. The glycosylation assay showed that the WT ClC-5 protein was present in a
complex, and core- and non-glycosylation pattern with sizes ranging from 90-120 kDa. In
contrast, all of the mutants (R516W, N408E, and N408A ClC-5) lacked the complex
glycosylation (Figure 35).

Discussion
82
The WT ClC-5 has been described to have a complex glycosylation pattern in human
and mouse kidney (Jouret et al., 2004; Schmieder et al., 2007) as well as in Xenopus
oocytes (Jouret et al., 2004; Schmieder et al., 2007). The lack of the complex
glycosylation of the R516W ClC-5 has been described before as well (Smith et al.,
2009).
Consequently, the subcellular localization of WT, R516W, N408E, and N408A ClC-5
was examined. Therefore, fluorescence microscopy of the mCherry tagged ClC-5
constructs in MDCKII cells was used and showed that WT ClC-5 was located to
endosomes, the R516W mutant was situated in a few endosomes and to a higher
amount in an ER-like structure, and the two glycosylation-deficient mutants N408E and
N408A were also targeted to endosomes and to a smaller amount to an ER-like
structure (Figure 36). The localization pattern of the WT ClC-5, that was detected in this
work, is in accordance to the previously reported localization to the PM and intracellular
vesicles in mouse kidney (Sakamoto et al., 1999) and rat intestinal cells (Vandewalle et
al., 2001). The R516W mutant has previously been described as an ER retention mutant
(Smith et al., 2009). In this study, however, using MDCKII or HEK293T cells, this mutant
was also present on vesicular, endosomal-like structures, although to a minor degree
than the WT. The two glycosylation deficient mutants (N408E and N408A) were also
situated on the PM. In Xenopus laevis, a non-glycosylated ClC-5 mutant also showed a
localization to the PM, however the surface expression was reduced due to a retrieval
from the PM that was five times faster as compared to WT ClC-5 (Schmieder et al.,
2007).
In general, the glycosylation assay is able to indicate if proteins are trafficked from ER to
Golgi, as the complex glycosylation occurs in the Golgi compartment. Since the R516W
and the two glycosylation deficient mutants showed no complex glycosylation but were
targeted to endosomes, there may be an alternative processing pathway for these
proteins. For instance, it is also possible that they are transported through the Golgi
besides their missing N-linked glycosylation. This has been shown for other renal apical
membrane proteins such as the rat sodium-dependent purine-selective nucleoside
transporter (Mangravite and Giacomini, 2003).
Discussion
83
And also for the mammalian NaSi-1 sulfate transporter (Regeer et al., 2007). Both
proteins are transported through the Golgi or post-Golgi compartments even without a
missing N-glycosylation.
Another explanation is that the overexpression of the ClC-5 variants caused a different
localization. For ClC-6, a homologue of ClC-5 which is located on late endosomes, it
was shown that overexpression resulted in a localization to early endosomes as well
(Ignoul et al., 2007).
This study showed that ClC-5 is complex glycosylated and it underlined the previous
findings that the asparagine at position 408 is the only N-glycosylation site in human
ClC-5. This was indicated by the fact that the glycosylation deficient mutants (N408E
and N408A) lacked the band in the SDS gel with the size of the complex glycosylation.
Furthermore, the present study showed that the R516W ClC-5 had no complex
glycosylation and an altered localization as compared to the WT.
Since the surface expression of the mutant ClC-5 might be altered, the PM expression of
the different ClC-5 constructs should be examined using a biotinylation or chymotrypsin
assay. Furthermore, a colocalization analysis with an ER marker could indicate if the
R516W is indeed, more ER-retained than the other ClC-5 variants.
In conclusion, the R516W, N408E, and N408A ClC-5 had no complex N-glycans,
whereas the WT ClC-5 protein was complex glycosylated. The fluorescence microscopy
indicates that the WT, N408E, and N408A ClC-5 were located to endosomes and the
PM. The R516W was also targeted to endosomes and to an ER-like structure. This
suggests that the lack of N-glycans does not inhibit the transport of the ClC-5 protein
into endosomes and to the PM.
Mutations affecting the glycosylation of ClC-5 influence endosomal
mobility
In cells of the PT, ClC-5 is required for the uptake of LMW proteins and located mainly to
early endosomes (Devuyst et al., 1999; Luyckx et al., 1998). In cells of the collecting
duct in mice (Sayer et al., 2001), or transfected cells (Günther et al., 1998), ClC-5 is also
located to the PM. For the transport of ClC-5 to the PM, the interaction with KIF3B, a
kinesin motor, has been reported (Reed et al., 2010).

Discussion
84
For the transport back into the cell, no motor protein was identified so far. However, for
Rab5-positive early endosomes, the interaction with the motor protein dynein was
identified for long inwards movements (Flores-Rodriguez et al., 2011).
For multiple Dent’s disease causing ClC-5 mutations, the transport to the PM and into
endosomes seems to be impaired, since their localization is mainly restricted to the ER.
In addition, or maybe due to the low cell surface expression, their endocytosis rate is
impaired (Gorvin et al., 2013). As mentioned before, many of these mutants have no
complex glycosylation(Smith et al., 2009).
The next aim of this study was to examine the motility of ClC-5-positive endosomes
close to the PM in order to determine if the transport to or from the PM of these
endosomes might differ between the four ClC-5 variants. Therefore, TIRF microscopy
with a field depth of 95 nm was used and time-lapse images of ClC-5-positive
endosomes were recorded. All ClC-5 variants possessed vesicles that were transported
along microtubules. The microtubule-dependent transport can be seen by the fact that
adding nocodazole, a reagent which disrupts the microtubule network, resulted in the
loss of long, far moving endosomes (Figure 37 A). This is in accordance with previous
findings regarding the transport of endosomes along microtubule (Flores-Rodriguez et
al., 2011).
First, it was unclear whether differences in the long or short living; slow or fast moving
endosomes exist. Therefore, two different cycle times were used for the time-lapse
imaging and recorded over different time periods. The high temporal resolution (= short
cycle time) revealed more differences among the four ClC-5 constructs: The N408A
remained close to the PM for the longest (in average 15.6±0.13 seconds) and the
R516W was the shortest (10.5±0.13 seconds). Remarkably, the WT moved the furthest
from its origin (0.84±0.006 µm), whereas the N408A traveled the shortest distance
(0.63±0.004 µm) (see Figure 43 and Table 3). In terms of speed, the R516W had the
fastest endosomes (0.42±4.2E-4 µm/s) and the WT the slowest (0.36±0.001 µm/s). The
diffusion coefficient was the highest for the N408E (0.018±0.002 µm²/s) and the smallest
for the N408A (0.009±9.2E-4 µm²/s) (see Table 3, Figure 45, and Figure 47).

Discussion
85
The target-orientation of the endosomal walk correlated well with the net displacement:
WT and N408E endosomes moved more straightforward in one direction than R516W
and N408E (Figure 48).
All four ClC-5 constructs showed a variety of different motilities: Endosomes of the WT
moved slowly, more directly along the PM for a long time, either looking for a place to
fuse with the PM, or for other endosomes to fuse with. The R516W possessed
endosomes that quickly exited the measured field or fused with the PM or other
endosomes. Thereby, the endosomes did not move far away from their origin and
walked less target-oriented. The N408E had the same motilities like the WT. However,
the N408A had endosomes that moved the slowest and least far from their origin.
Furthermore, they walked less target-oriented and were present at the PM for a longer
time which indicates that they fused less with the PM or other endosomes and were not
transported fast further into the cell (Figure 47).
Confocal images indicated that the R156W is present at the PM to a smaller amount as
compared to the WT (Figure 36). In combination with the above mentioned faster
velocity and shorter time spend close to the PM of the R516W ClC-5, it is possible that
this mutant is faster transported from the PM into the cell than the other ClC-5 variants.
The PM expression of R516W has been described to be lower than in the WT due to a
retrieval of the protein from the PM that was five times faster than the WT (Ludwig et al.,
2005; Smith et al., 2009).
Astonishingly, the two glycosylation-deficient mutant showed a different motility as
compared to the R516W. The N408E endosomes had a similar motility like the WT,
whereas endosomes of the N408A moved different as compared to the WT. The fact
that the two glycosylation-deficient mutants behaved differently as compared to each
other suggests that, primarily, the lack of N-glycans is not the reason for the altered
endosomal motility. The altered motility of N408A endosomes may be a result of an
impaired interaction with motor proteins. The cell surface expression of ClC-5 has been
reported to be dependent on its interaction with KIF3B (Reed et al., 2010).
Discussion
86
In general, early and late endosomes have been reported to be transported along
microtubules by dynein-1 (Flores-Rodriguez et al., 2011; Zajac et al., 2013) and kinesin
(Chen et al., 2008; Schuster et al., 2011). Thus, the long lifetime and slow velocity of the
N408A may be a result of either a dissociation of the motor protein from N408A ClC-5
endosomes or a reduced binding capability of both proteins. This might be due to an
altered conformational change of N408A ClC-5 which was caused by the mutation.
For future research to determine if an impaired interaction with motor proteins, such as
KIF3B or dynein, is the underlying mechanism of the altered endosomal speed,
interaction studies of ClC-5 positive endosomes in vitro might give some insights.
Furthermore, the effect of dynein or kinesin depletion on the motility of ClC-5
endosomes should be examined, either by using knockdown cell lines or inhibitors such
as the small molecule ciliobrevins (for dynein) (Roossien et al., 2015). In addition, the
establishment of the particle tracking method also indicates that in order to examine
differences between the motility of endosomes, choosing the correct circumstances for
time-lapse imaging recording, such as cycle time, length of the recording need to be
evaluated as they can severely influence the results.
In conclusion, R516W and N408A ClC-5 showed altered endosomal motilities as
compared to the WT and N408E ClC-5. The Dent’s mutant R516W was probably
retrieved faster from the PM than the WT and transported quickly further into the cell.
The N408A ClC-5 had endosomes which moved slowly and less target-oriented along
the PM as compared to the WT but were not quickly retrieved from or fused with the PM
or other endosomes. This indicates that the glycosylation status alone does not
influence the trafficking of ClC-5 positive endosomes. It is more likely, that differences in
the conformation of the protein caused by the mutations, impairs the interaction of ClC-5
with motor proteins, or even the integrity of ClC-5 in membranes.
Discussion
87
WT and mutant ClC-5 promote acidification, are located to late
endosomes and have no impaired endocytosis
The altered motility of the mutant and WT ClC-5 variants might also be caused by a
changed function of ClC-5 such as a changed endosomal pH which can also effect the
maturation of endosomes. Therefore, this study further investigated the endosomal pH
of WT, R516W, N408E, N408A ClC-5 and it showed that they all promoted acidification
(Figure 49). The N408A was also located on endosomes that were even more acidic
than the WT (pH 5.7 compared to the WT with a pH of 6.1). The pH of early endosomes
was reported to be around 6.3 in mammalian cells and around 5.5 in late endosomes (as
reviewed in Casey et al., 2010).
Whole cell currents of R516W ClC-5 in HEK-MSR cells as well as in Xenopus laevis
oocytes are severely reduced as compared to WT ClC-5 currents (Ludwig et al., 2005;
Smith et al., 2009), indicating an impaired function of the mutant ClC-5. However, it is
also possible that the differences in the chloride currents are due to the low expression
of R516W at the PM. In this study, all ClC-5 mutants were sufficiently functional to
promote endosomal acidification.
During endosomal transformation from early to late endosomes, protons are
accumulated in the endosome, reducing its pH (Hurtado-Lorenzo et al., 2006; Stauber
and Jentsch, 2013). Therefore, the low pH of N408A positive vesicles might indicate that
this mutant is situated on late endosomes or is transported faster through the endosomal
pathway. The colocalization analysis with Rab7-marked, late endosomes, showed no
differences between WT and mutant ClC-5 in HEK293T and MDCKII cells (Figure 50 for
HEK293T cells, Supplemental Figure 6 for MDCKII cells). A distinct colocalization of
ClC-5 on late endosomes has been previously shown in mouse thyroid gland cells (van
den Hove et al., 2006). In order to determine if the ratio of early to late endosomes was
altered in any of the used ClC-5 variants, an additional colocalization analysis with Rab5
as marker for early endosomes needs to be performed. Furthermore, it would be
interesting to examine the localization to recycling endosomes as well. The pH in
endosomes decreases from early to late endosomes, but mildly increases in the
recycling endocytic pathway (Gagescu et al., 2000; Yamashiro et al., 1984).
Discussion
88
Therefore it is more likely that the more acidic N408A is situated on late endosomes
instead of recycling endsosomes. However, the pH is not the only evidence for
increased endosomal maturation. Besides proton accumulation, the chloride
concentration also increases from early to late endosomes (Gerasimenko et al., 1998;
Sonawane and Verkman, 2003). A combination of a chloride-sensitive and a pH-
sensitive fluorophore (similar to the approach of Sonawane et al., 2002), might give
more insights into the proton and chloride accumulation of WT, R516Q, N408E, and
N408A ClC-5 positive endosomes.
Overall, the observed results indicate that none of the mutant ClC-5 variants used in this
work was targeted to late endosomes in a higher amount than the WT.
Since Dent’s disease is characterized by an impaired receptor-mediated endocytosis
(Gorvin et al., 2013), the receptor-mediated and fluid phase endocytosis rate were
examined. Therefore, albumin was used as a marker for the receptor-mediated and
dextran as marker for fluid phase endocytosis, respectively (Cao et al., 2007; Caruso-
Neves et al., 2005; Gorvin et al., 2013; Schwegler et al., 1991; Shurety et al., 1998;
Takano et al., 2002). Neither the amount of internalized albumin nor dextran was altered
in cells overexpressing R516W, N408E, or N408A ClC-5 as compared to WT ClC-5
overexpressing cells (Figure 51). Furthermore, the control cells (= untransfected cells)
did not show a different amount of internalized albumin or dextran as compared to cells
overexpressing the different ClC-5 variants. The fact that the control cells showed no
differences to the WT ClC-5 overexpressing cells is in contrast to the reported crucial
function of ClC-5 in endocytosis: In ClC-5 knockout mice, the endocytosis of albumin
has been shown to be impaired (Hara-Chikuma et al., 2005; Piwon et al., 2000; Wang et
al., 2000). The defects in the endocytosis of albumin are probably due to an impaired
interaction of ClC-5 with cofilin, an actin-associated protein regulating the uptake of
albumin (Hryciw et al., 2003). So far, the endocytosis rate in overexpressing ClC-5
HEK293T cells has not been determined. In order to gain more insights into the
endocytosis rate of WT, R516W, N408E, and N408A ClC-5 further endocytosis assays
are required with longer incubation times and as control, the endogenous ClC-5 mRNA
levels need to be downregulated using siRNA.

Discussion
89
In conclusion, the endosomal pH of WT, R516W, N408E, and N408A was more acidic
than in control cells, indicating a sufficient function in promoting endosomal acidification.
The N408A showed an even lower pH than the WT, suggesting that this mutant might be
trafficked more pronounced towards late endosomes. However, a colocalization with
Rab7-positive, late endosomes, showed no differences between WT and the three
mutant ClC-5. In addition, the receptor-mediated and fluid-phase endocytosis was not
altered in WT, R516W, N408E, and N408A ClC-5 overexpressing cells as compared to
the control cells. This indicates that the glycosylation status of ClC-5 does not influence
the maturation of ClC-5 positive endosomes or the endocytosis rate.
Summary and conclusions
In summary, this study demonstrated a new role of ClC-5 as a promoter for intoxication
of toxins from C. difficile, by increasing toxin internalization and processing by acidifying
endosomes. Thus, it causes a faster maturation of TcdA. This effect was not dependent
on the chloride/proton exchange function of ClC-5, as the non-transporting mutant
E268Q ClC-5 was still able to acidify endosomes to a WT-like pH. However, the
transporting function is probably necessary for the normal endocytosis rate. In addition
to the effect of ClC-5 on TcdA’s toxicity, new insights on the motility of ClC-5 positive
endosomes were gained by developing tools to study the movement of ClC-5
endosomes. The Dent’s disease causing mutant R516W ClC-5 showed endosomes that
were present close to the PM for a shorter time and moved with a faster speed and less
target-oriented than the WT. However, this was most likely not caused by the lack of the
complex glycosylation of this mutant. This is indicated by the analysis of the two artificial
glycosylation-deficient mutants, N408E and N408A ClC-5. Both mutants had different
motilities with the N408E being similar to the WT. Yet, endocytosis, endosomal pH and
localization to late endosomes were unaltered in the mutants compared to the WT.
Since the endosomal processing was normal in the mutants as compared to WT ClC-5,
it is possible that conformational changes caused by the mutations led to an impaired
interaction with motor proteins which, in turn, resulted in the altered endosomal motility.
The so established particle tracking analysis leads the way for further studies such as
the analysis of fusion events of ClC-5 positive endosomes with the PM.
Discussion
90
Furthermore, tracking endosomes of ClC-5 and motor proteins simultaneously can give
information about the interaction of WT or mutant ClC-5 with this motor protein.
In conclusion, ion transporters such as ClC-5 are possible targets for pathogens to gain
access into the host’s cell or to promote the pathogens virulence. Furthermore, the
motility of endosomes is highly sensitive towards changes in proteins targeted in
endosomal membranes. By understanding the exact mechanisms behind the
intoxication of bacterial toxins and the motility of endosomes in the endocytic pathway,
possible targets for drugs curing CDI or Dent’s disease can be found.
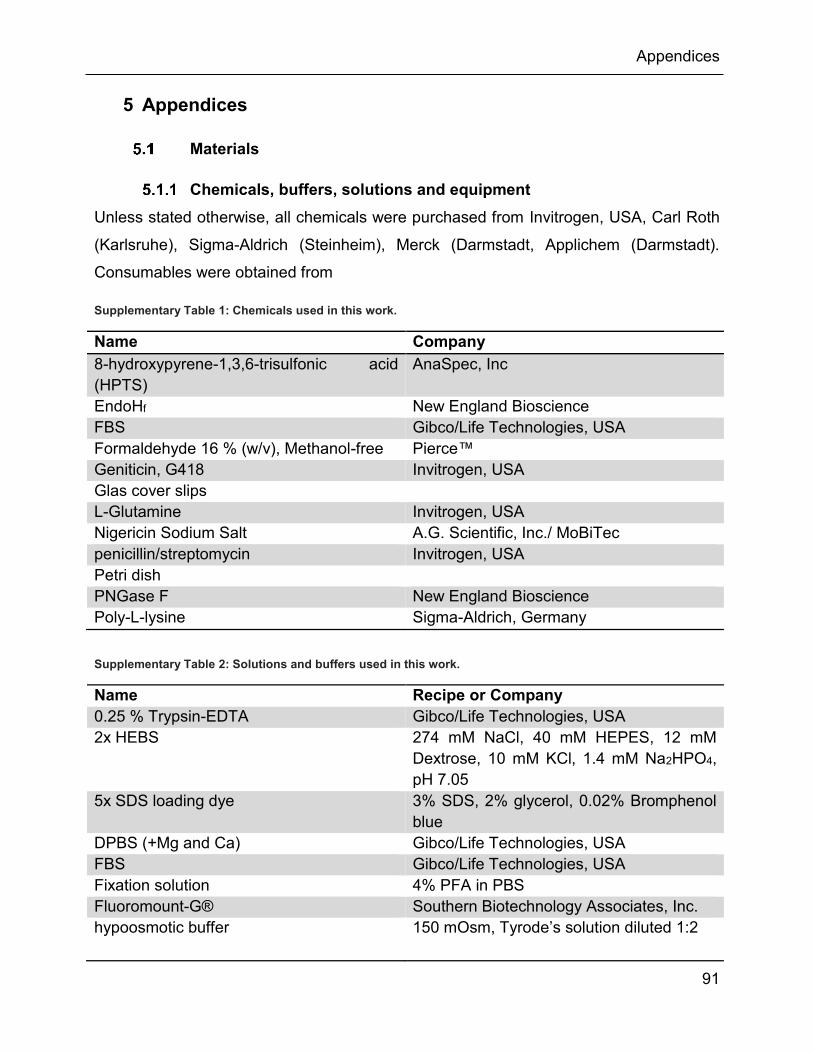
Appendices
91
5 Appendices
Materials
Chemicals, buffers, solutions and equipment
Unless stated otherwise, all chemicals were purchased from Invitrogen, USA, Carl Roth
(Karlsruhe), Sigma-Aldrich (Steinheim), Merck (Darmstadt, Applichem (Darmstadt).
Consumables were obtained from
Supplementary Table 1: Chemicals used in this work.
Name Company
8-hydroxypyrene-1,3,6-trisulfonic acid (HPTS)
AnaSpec, Inc
EndoHf New England Bioscience FBS Gibco/Life Technologies, USA Formaldehyde 16 % (w/v), Methanol-free Pierce™ Geniticin, G418 Invitrogen, USA Glas cover slips L-Glutamine Invitrogen, USA Nigericin Sodium Salt A.G. Scientific, Inc./ MoBiTec penicillin/streptomycin Invitrogen, USA Petri dish PNGase F New England Bioscience Poly-L-lysine Sigma-Aldrich, Germany
Supplementary Table 2: Solutions and buffers used in this work.
Name Recipe or Company
0.25 % Trypsin-EDTA Gibco/Life Technologies, USA 2x HEBS 274 mM NaCl, 40 mM HEPES, 12 mM
Dextrose, 10 mM KCl, 1.4 mM Na2HPO4, pH 7.05
5x SDS loading dye 3% SDS, 2% glycerol, 0.02% Bromphenol blue
DPBS (+Mg and Ca) Gibco/Life Technologies, USA FBS Gibco/Life Technologies, USA Fixation solution 4% PFA in PBS Fluoromount-G® Southern Biotechnology Associates, Inc. hypoosmotic buffer 150 mOsm, Tyrode’s solution diluted 1:2
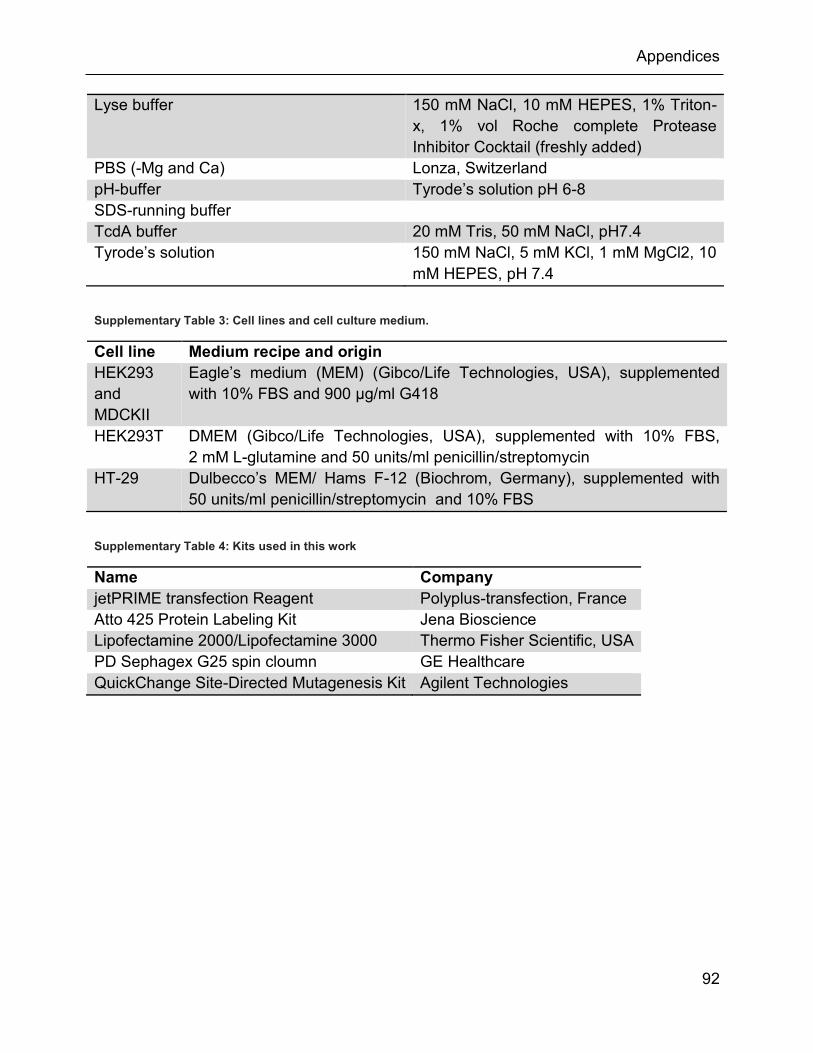
Appendices
92
Lyse buffer 150 mM NaCl, 10 mM HEPES, 1% Triton-x, 1% vol Roche complete Protease Inhibitor Cocktail (freshly added)
PBS (-Mg and Ca) Lonza, Switzerland pH-buffer Tyrode’s solution pH 6-8 SDS-running buffer TcdA buffer 20 mM Tris, 50 mM NaCl, pH7.4 Tyrode’s solution 150 mM NaCl, 5 mM KCl, 1 mM MgCl2, 10
mM HEPES, pH 7.4
Supplementary Table 3: Cell lines and cell culture medium.
Cell line Medium recipe and origin
HEK293 and MDCKII
Eagle’s medium (MEM) (Gibco/Life Technologies, USA), supplemented with 10% FBS and 900 µg/ml G418
HEK293T DMEM (Gibco/Life Technologies, USA), supplemented with 10% FBS, 2 mM L-glutamine and 50 units/ml penicillin/streptomycin
HT-29 Dulbecco’s MEM/ Hams F-12 (Biochrom, Germany), supplemented with 50 units/ml penicillin/streptomycin and 10% FBS
Supplementary Table 4: Kits used in this work
Name Company
jetPRIME transfection Reagent Polyplus-transfection, France Atto 425 Protein Labeling Kit Jena Bioscience Lipofectamine 2000/Lipofectamine 3000 Thermo Fisher Scientific, USA PD Sephagex G25 spin cloumn GE Healthcare QuickChange Site-Directed Mutagenesis Kit Agilent Technologies

Appendices
93
Supplementary Table 5: Equipment used for this work.
Name Trade label and origin
Benchtop refrigerator Enviro-Genie, Scientific Industires, Inc. Fluorescent scanner FUSION SL, Vilber Lourma, Germanyt Fluorolog Fluorolog spectrophotometer, Horiba Photospectrometer Ultrospec 2100 pro, Amersham Biosciences Platereader Victor3 multilable reader, PerkinElmer qRT-PCR Real-Time PCR-LineGene 9600 Plus System, Bioer Technology Table centrifuge Minispin, Eppendorf
Centrifuge 5415 D, Eppendorf Centrifuge 5415 D, Eppendorf
Thermoblock TDB-1200, Biosan Thermomixer comfort, Eppendorf ThermoBlock TDB-120 Kisker
Supplementary Table 6: Software and online tools.
Name Origin
Chromas Technelysium Pty Ltd Excell Microsoft ImageJ Fiji MATLAB MathWorks Origin 8.0 MicroCal Vector NTI Thermo Fisher Scientific, USA
Cell lines
Supplementary Table 7: Cell lines used in this work.
Name Abbreviation Origin
Human Colon Cancer Cells HT-29 ATCC #HTB-38 Human Embryonic Kidney Cells HEK293 ATCC #CRL-1573 Human Embryonic Kidney Cells HEK293T ATCC #CRL-3216 Madin-Darby canine kidney MDCKII ATCC #CRL-2936
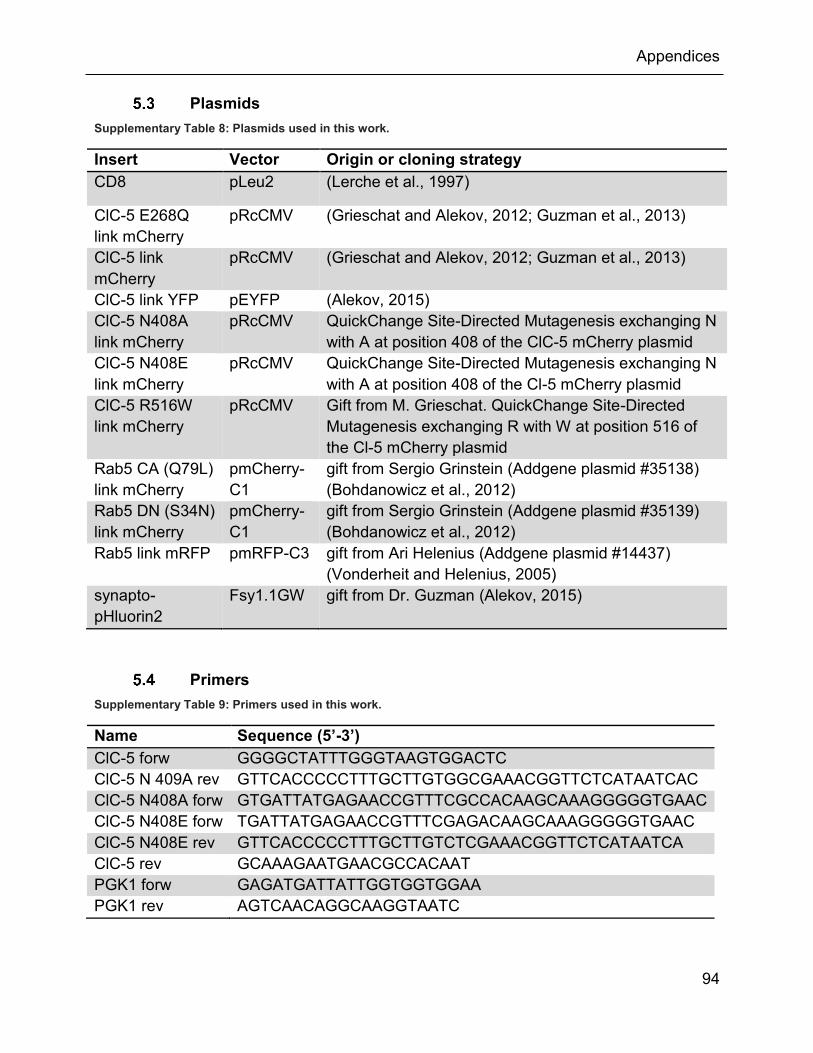
Appendices
94
Plasmids
Supplementary Table 8: Plasmids used in this work.
Insert Vector Origin or cloning strategy
CD8 pLeu2 (Lerche et al., 1997)
ClC-5 E268Q link mCherry
pRcCMV (Grieschat and Alekov, 2012; Guzman et al., 2013)
ClC-5 link mCherry
pRcCMV (Grieschat and Alekov, 2012; Guzman et al., 2013)
ClC-5 link YFP pEYFP (Alekov, 2015) ClC-5 N408A link mCherry
pRcCMV QuickChange Site-Directed Mutagenesis exchanging N with A at position 408 of the ClC-5 mCherry plasmid
ClC-5 N408E link mCherry
pRcCMV QuickChange Site-Directed Mutagenesis exchanging N with A at position 408 of the Cl-5 mCherry plasmid
ClC-5 R516W link mCherry
pRcCMV Gift from M. Grieschat. QuickChange Site-Directed Mutagenesis exchanging R with W at position 516 of the Cl-5 mCherry plasmid
Rab5 CA (Q79L) link mCherry
pmCherry-C1
gift from Sergio Grinstein (Addgene plasmid #35138) (Bohdanowicz et al., 2012)
Rab5 DN (S34N) link mCherry
pmCherry-C1
gift from Sergio Grinstein (Addgene plasmid #35139) (Bohdanowicz et al., 2012)
Rab5 link mRFP pmRFP-C3 gift from Ari Helenius (Addgene plasmid #14437) (Vonderheit and Helenius, 2005)
synapto-pHluorin2
Fsy1.1GW gift from Dr. Guzman (Alekov, 2015)
Primers
Supplementary Table 9: Primers used in this work.
Name Sequence (5’-3’) ClC-5 forw GGGGCTATTTGGGTAAGTGGACTC ClC-5 N 409A rev GTTCACCCCCTTTGCTTGTGGCGAAACGGTTCTCATAATCAC ClC-5 N408A forw GTGATTATGAGAACCGTTTCGCCACAAGCAAAGGGGGTGAAC ClC-5 N408E forw TGATTATGAGAACCGTTTCGAGACAAGCAAAGGGGGTGAAC ClC-5 N408E rev GTTCACCCCCTTTGCTTGTCTCGAAACGGTTCTCATAATCA ClC-5 rev GCAAAGAATGAACGCCACAAT PGK1 forw GAGATGATTATTGGTGGTGGAA PGK1 rev AGTCAACAGGCAAGGTAATC
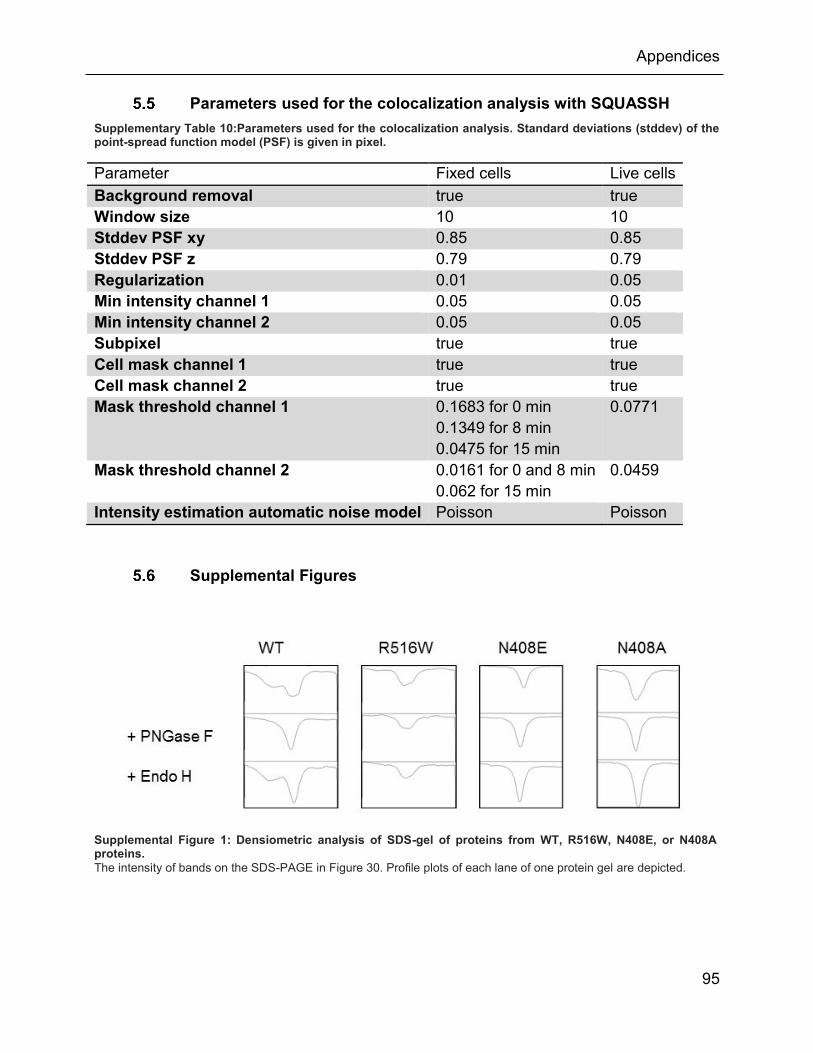
Appendices
95
Parameters used for the colocalization analysis with SQUASSH
Supplementary Table 10:Parameters used for the colocalization analysis. Standard deviations (stddev) of the point-spread function model (PSF) is given in pixel.
Parameter Fixed cells Live cells
Background removal true true Window size 10 10 Stddev PSF xy 0.85 0.85 Stddev PSF z 0.79 0.79 Regularization 0.01 0.05 Min intensity channel 1 0.05 0.05 Min intensity channel 2 0.05 0.05 Subpixel true true Cell mask channel 1 true true Cell mask channel 2 true true Mask threshold channel 1 0.1683 for 0 min
0.1349 for 8 min 0.0475 for 15 min
0.0771
Mask threshold channel 2 0.0161 for 0 and 8 min 0.062 for 15 min
0.0459
Intensity estimation automatic noise model Poisson Poisson
Supplemental Figures
Supplemental Figure 1: Densiometric analysis of SDS-gel of proteins from WT, R516W, N408E, or N408A proteins.
The intensity of bands on the SDS-PAGE in Figure 30. Profile plots of each lane of one protein gel are depicted.
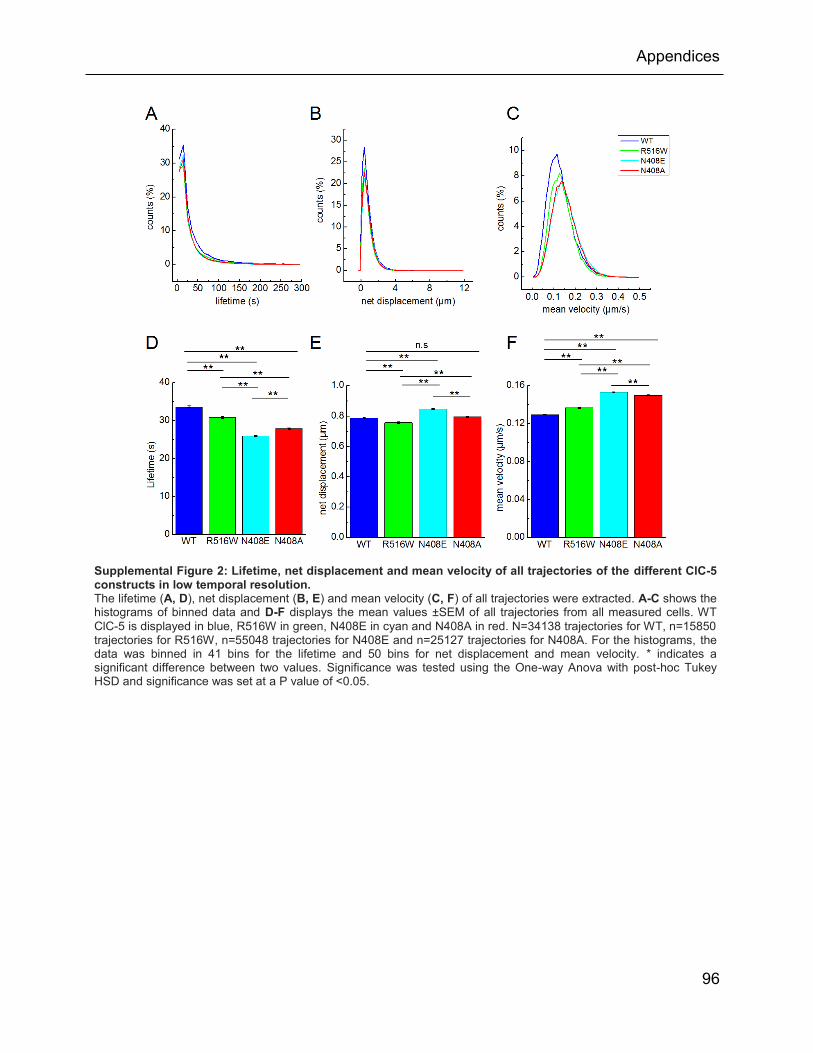
Appendices
96
Supplemental Figure 2: Lifetime, net displacement and mean velocity of all trajectories of the different ClC-5 constructs in low temporal resolution. The lifetime (A, D), net displacement (B, E) and mean velocity (C, F) of all trajectories were extracted. A-C shows the histograms of binned data and D-F displays the mean values ±SEM of all trajectories from all measured cells. WT ClC-5 is displayed in blue, R516W in green, N408E in cyan and N408A in red. N=34138 trajectories for WT, n=15850 trajectories for R516W, n=55048 trajectories for N408E and n=25127 trajectories for N408A. For the histograms, the data was binned in 41 bins for the lifetime and 50 bins for net displacement and mean velocity. * indicates a significant difference between two values. Significance was tested using the One-way Anova with post-hoc Tukey HSD and significance was set at a P value of <0.05.
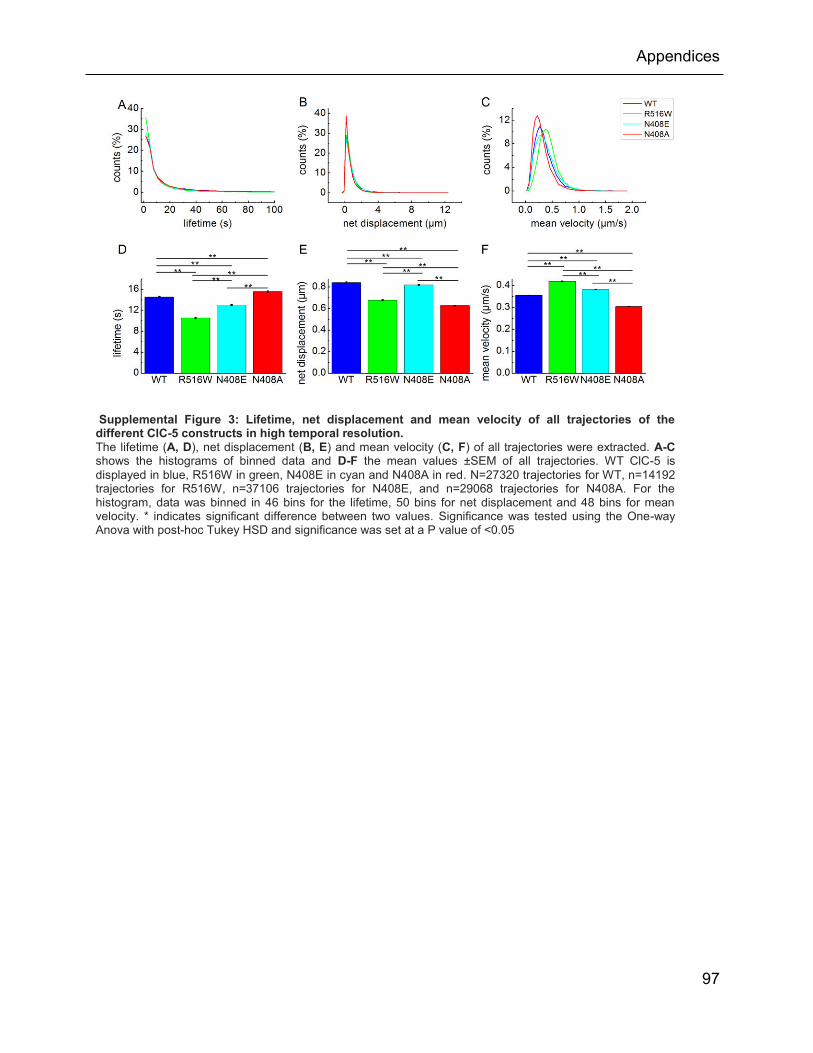
Appendices
97
Supplemental Figure 3: Lifetime, net displacement and mean velocity of all trajectories of the different ClC-5 constructs in high temporal resolution. The lifetime (A, D), net displacement (B, E) and mean velocity (C, F) of all trajectories were extracted. A-C shows the histograms of binned data and D-F the mean values ±SEM of all trajectories. WT ClC-5 is displayed in blue, R516W in green, N408E in cyan and N408A in red. N=27320 trajectories for WT, n=14192 trajectories for R516W, n=37106 trajectories for N408E, and n=29068 trajectories for N408A. For the histogram, data was binned in 46 bins for the lifetime, 50 bins for net displacement and 48 bins for mean velocity. * indicates significant difference between two values. Significance was tested using the One-way Anova with post-hoc Tukey HSD and significance was set at a P value of <0.05

Appendices
98
Supplemental Figure 4: Velocity and displacement of particles from low and high temporal resolution.
Endosomes of MDCKII cells transiently expressing WT (blue), R516W (green), N408E (cyan), or N408A (red) ClC-5 mCherry were recorded in a TIRFM and their endosomes were tracked. Two different cycle times were used: one second (low temporal resolution, left lane) and 302 milliseconds (high temporal resolution, right lane). The velocity and displacement of each particle from frame to frame were analyzed of all measured cells. Please note, for this analysis, all detected endosomes of all trajectories are shown. In all other analyses, only endosomes that were detected for more than 3 frames were taken into account. For the low temporal resolution n=90755 particles for the WT, n=61705 for R516W, n=143352 for N408E, and n=69256 for N408A. For the high temporal resolution n=64234 particles for the WT, n=74898 for R516W, n=74910 for N408E, and n=80071 particles for N408A. Data was binned in 27 bins.

Appendices
99
Supplemental Figure 5: Uptake of Albumin in MDCKII cells expressing WT, R516W, N408E, and N408A ClC-5. Representative images of MDCKII cells transiently expressing WT (A), R516W (B), N408E (C), or N408A (D) ClC-5 mCherry (red) were incubated with 50 nM albumin (green) labeled with Atto425 for 2.5 h. Single z-slides are shown and scale bar represents 10 µm.

Appendices
100
Supplemental Figure 6: Colocalization of WT, R516W, and N408E ClC-5 with Rab7 in MDCKII cells. Representative confocal images (single z-slides) of MDCKII cells transiently transfected with WT (A), R516W (B), or N408E (C) ClC-5-mCherry (in red) and cotransfected with Rab7-EYFP (in green). E) Box plots summarizing the results from object-based and size-based colocalization analysis corresponding to the number of overlapping objects defined in two channels as Rab7 and ClC-5-containing objects. N=4 cells for WT, n= 9 cells for R516W, and n=8 cells for N408A. Single cells (•), 25 – ox), mean (■), median (─) as well as 99 % and 1 % (X)). Scale bars correspond to 10 µm
Acknowledgement
101
6 Acknowledgement
First of all, I would like to thank my supervisor, Dr. Alexi Alekov, for giving me the great
opportunity of working on the projects in his laboratory. I am very grateful for his
intellectual support, his ideas and suggestions for the research projects.
Furthermore, I would like to thank Prof. Gerhard Ralf, for providing me with helpful
information about the pathophysiology of TcdA and his support during the paper
manuscript writing and revision process.
In addition I thank Dr. Andre Zeug for sharing his great knowledge about microscopy
techniques and for providing some of the MATLAB scripts.
During the last few months of writing I felt incredible well supported and motivated,
especially by Dr. Martin Fischer. I am thankful for his helpful input regarding my thesis,
and his support in several other aspects at work.
My special thanks goes out to doctores Jeanne de la Roche, Daniel Wojciechowsky,
Alexander Wirth, Josephine Labus and Yvonne Schill who gave me great input during
the writing process of the thesis and who made life in the lab more pleasant. Thank
you Dr. Matthias Grieschat for all the good music.
Next, I would like to thank Petra Kilian and Birgit Begemann for their superb technical
and personal support. They motivated me throughout the years and helped me through
tough times .
Thanks to all members of the Institute of Neurophysiology, the atmosphere was always
welcoming and supporting.
Thanks to Jan Bleidorn for counting cells .
A very special “Thank you” goes out to the Cat Empire, Bliss n Eso, and Jamie
Macdowell + Tom Thum. Their music always got me in a good mood and motivated me
to sit down and “write one more paragraph”.
Most of all I would like to thank my family for always having my back.
References
102
7 References
Accardi, A., and Miller, C. (2004). Secondary active transport mediated by a prokaryotic homologue of ClC Cl- channels. Nature 427, 803–807.
Accardi, A., Kolmakova-Partensky, L., Williams, C., and Miller, C. (2004). Ionic currents mediated by a prokaryotic homologue of CLC Cl- channels. J. Gen. Physiol. 123, 109–119.
Accardi, A., Walden, M., Nguitragool, W., Jayaram, H., Williams, C., and Miller, C. (2005). Separate ion pathways in a Cl-/H+ exchanger. J. Gen. Physiol. 126, 563–570.
Alekov, A.K. (2015). Mutations associated with Dent’s disease affect gating and voltage dependence of the human anion/proton exchanger ClC-5. Front. Physiol. 6.
Alekov, A.K., and Fahlke, C. (2009). Channel-like slippage modes in the human anion/proton exchanger ClC-4. J. Gen. Physiol. 133, 485–496.
Andrianantoandro, E., and Pollard, T.D. (2006). Mechanism of actin filament turnover by severing and nucleation at different concentrations of ADF/cofilin. Mol. Cell 24, 13–23.
Axelrod, D. (2001). Total Internal Reflection Fluorescence Microscopy in Cell Biology. Traffic 2, 764–774.
Bamburg, J.R., and Bernstein, B.W. (2010). Roles of ADF/cofilin in actin polymerization and beyond. F1000 Biol. Rep. 2.
Bard, F., and Chia, J. (2016). Cracking the Glycome Encoder: Signaling, Trafficking, and Glycosylation. Trends Cell Biol. 26, 379–388.
Barth, H., Pfeifer, G., Hofmann, F., Maier, E., Benz, R., and Aktories, K. (2001). Low pH-induced Formation of Ion Channels by Clostridium difficile Toxin B in Target Cells. J. Biol. Chem. 276, 10670–10676.
Blanchard, E., Belouzard, S., Goueslain, L., Wakita, T., Dubuisson, J., Wychowski, C., and Rouillé, Y. (2006). Hepatitis C Virus Entry Depends on Clathrin-Mediated Endocytosis. J. Virol. 80, 6964–6972.
Blom, N., Sicheritz-Pontén, T., Gupta, R., Gammeltoft, S., and Brunak, S. (2004). Prediction of post-translational glycosylation and phosphorylation of proteins from the amino acid sequence. Proteomics 4, 1633–1649.
Bobak, D., Moorman, J., Guanzon, A., Gilmer, L., and Hahn, C. (1997). Inactivation of the small GTPase Rho disrupts cellular attachment and induces adhesion-dependent and adhesion-independent apoptosis. Oncogene 15, 2179–2189.
Bohdanowicz, M., Balkin, D.M., De Camilli, P., and Grinstein, S. (2012). Recruitment of OCRL and Inpp5B to phagosomes by Rab5 and APPL1 depletes phosphoinositides and attenuates Akt signaling. Mol. Biol. Cell 23, 176–187.

References
103
Bökenkamp, A., and Ludwig, M. (2010). Disorders of the Renal Proximal Tubule. Nephron Physiol. 118, p1–p6.
Borriello, S.P. (1998). Pathogenesis of Clostridium difficile infection. J. Antimicrob. Chemother. 41, 13–19.
Brock, R., Hamelers, I.H.L., and Jovin, T.M. (1999). Comparison of fixation protocols for adherent cultured cells applied to a GFP fusion protein of the epidermal growth factor receptor. Cytometry 35, 353–362.
Burridge, K., and Wennerberg, K. (2004). Rho and Rac Take Center Stage. Cell 116, 167–179.
Cao, H., Chen, J., Awoniyi, M., Henley, J.R., and McNiven, M.A. (2007). Dynamin 2 mediates fluid-phase micropinocytosis in epithelial cells. J. Cell Sci. 120, 4167–4177.
Caruso-Neves, C., Kwon, S.-H., and Guggino, W.B. (2005). Albumin endocytosis in proximal tubule cells is modulated by angiotensin II through an AT2 receptor-mediated protein kinase B activation. Proc. Natl. Acad. Sci. U. S. A. 102, 17513–17518.
Casey, J.R., Grinstein, S., and Orlowski, J. (2010). Sensors and regulators of intracellular pH. Nat. Rev. Mol. Cell Biol. 11, 50–61.
Chandrasekaran, R., Kenworthy, A.K., and Lacy, D.B. (2016). Clostridium difficile Toxin A Undergoes Clathrin-Independent, PACSIN2-Dependent Endocytosis. PLoS Pathog. 12.
Chavrier, P., Parton, R.G., Hauri, H.P., Simons, K., and Zerial, M. (1990). Localization of low molecular weight GTP binding proteins to exocytic and endocytic compartments. Cell 62, 317–329.
Chen, H., Yang, J., Low, P.S., and Cheng, J.-X. (2008). Cholesterol Level Regulates Endosome Motility via Rab Proteins. Biophys. J. 94, 1508–1520.
Christensen, E.I., and Birn, H. (2002). Megalin and cubilin: multifunctional endocytic receptors. Nat. Rev. Mol. Cell Biol. 3, 258–268.
Christensen, E.I., Devuyst, O., Dom, G., Nielsen, R., Van Der Smissen, P., Verroust, P., Leruth, M., Guggino, W.B., and Courtoy, P.J. (2003a). Loss of chloride channel ClC-5 impairs endocytosis by defective trafficking of megalin and cubilin in kidney proximal tubules. Proc. Natl. Acad. Sci. U. S. A. 100, 8472–8477.
Christensen, E.I., Devuyst, O., Dom, G., Nielsen, R., Smissen, P.V.D., Verroust, P., Leruth, M., Guggino, W.B., and Courtoy, P.J. (2003b). Loss of chloride channel ClC-5 impairs endocytosis by defective trafficking of megalin and cubilin in kidney proximal tubules. Proc. Natl. Acad. Sci. 100, 8472–8477.
References
104
Chumbler, N.M., Rutherford, S.A., Zhang, Z., Farrow, M.A., Lisher, J.P., Farquhar, E., Giedroc, D.P., Spiller, B.W., Melnyk, R.A., and Lacy, D.B. (2016). Crystal structure of Clostridium difficile toxin A. Nat. Microbiol. 1, 15002.
Cleiren, E., Bénichou, O., Van Hul, E., Gram, J., Bollerslev, J., Singer, F.R., Beaverson, K., Aledo, A., Whyte, M.P., Yoneyama, T., et al. (2001). Albers-Schönberg disease (autosomal dominant osteopetrosis, type II) results from mutations in the ClCN7 chloride channel gene. Hum. Mol. Genet. 10, 2861–2867.
Cooper, A., and Shaul, Y. (2006). Clathrin-mediated endocytosis and lysosomal cleavage of hepatitis B virus capsid-like core particles. J. Biol. Chem. 281, 16563–16569.
De Angeli, A., Monachello, D., Ephritikhine, G., Frachisse, J.M., Thomine, S., Gambale, F., and Barbier-Brygoo, H. (2006). The nitrate/proton antiporter AtCLCa mediates nitrate accumulation in plant vacuoles. Nature 442, 939–942.
De Renzis, S., Sönnichsen, B., and Zerial, M. (2002). Divalent Rab effectors regulate the sub-compartmental organization and sorting of early endosomes. Nat. Cell Biol. 4, 124–133.
Dent, C.E., and Friedman, M. (1964). HYPERCALCURIC RICKETS ASSOCIATED WITH RENAL TUBULAR DAMAGE. Arch. Dis. Child. 39, 240–249.
Devuyst, O., and Luciani, A. (2015). Chloride transporters and receptor-mediated endocytosis in the renal proximal tubule. J. Physiol. 593, 4151–4164.
Devuyst, O., and Thakker, R.V. (2010). Dent’s disease. Orphanet J. Rare Dis. 5, 28.
Devuyst, O., Christie, P.T., Courtoy, P.J., Beauwens, R., and Thakker, R.V. (1999). Intra-Renal and Subcellular Distribution of the Human Chloride Channel, CLC-5, Reveals a Pathophysiological Basis for Dent’s Disease. Hum. Mol. Genet. 8, 247–257.
Dickson, L.E., Wagner, M.C., Sandoval, R.M., and Molitoris, B.A. (2014). The Proximal Tubule and Albuminuria: Really! J. Am. Soc. Nephrol. 25, 443–453.
Dove, C.H., Wang, S.Z., Price, S.B., Phelps, C.J., Lyerly, D.M., Wilkins, T.D., and Johnson, J.L. (1990). Molecular characterization of the Clostridium difficile toxin A gene. Infect. Immun. 58, 480–488.
Dutzler, R., Campbell, E.B., Cadene, M., Chait, B.T., and MacKinnon, R. (2002). X-ray structure of a ClC chloride channel at 3.0 |[angst]| reveals the molecular basis of anion selectivity. Nature 415, 287–294.
Dutzler, R., Campbell, E.B., and MacKinnon, R. (2003). Gating the selectivity filter in ClC chloride channels. Science 300, 108–112.
References
105
von Eichel-Streiber, C., Laufenberg-Feldmann, R., Sartingen, S., Schulze, J., and Sauerborn, M. (1992). Comparative sequence analysis of the Clostridium difficile toxins A and B. Mol. Gen. Genet. MGG 233, 260–268.
Estévez, R., Boettger, T., Stein, V., Birkenhäger, R., Otto, E., Hildebrandt, F., and Jentsch, T.J. (2001). Barttin is a Cl- channel beta-subunit crucial for renal Cl- reabsorption and inner ear K+ secretion. Nature 414, 558–561.
Etienne-Manneville, S., and Hall, A. (2002). Rho GTPases in cell biology. Nature 420, 629–635.
Fahlke, C., Yu, H.T., Beck, C.L., Rhodes, T.H., and George, A.L. (1997). Pore-forming segments in voltage-gated chloride channels. Nature 390, 529–532.
Feng, L., Campbell, E.B., Hsiung, Y., and MacKinnon, R. (2010). Structure of a eukaryotic CLC transporter defines an intermediate state in the transport cycle. Science 330, 635–641.
Feng, Y., Press, B., and Wandinger-Ness, A. (1995). Rab 7: an important regulator of late endocytic membrane traffic. J. Cell Biol. 131, 1435–1452.
Fish, K.N. (2001). Total Internal Reflection Fluorescence (TIRF) Microscopy. In Current Protocols in Cytometry, (John Wiley & Sons, Inc.), p.
Flores-Rodriguez, N., Rogers, S.S., Kenwright, D.A., Waigh, T.A., Woodman, P.G., and Allan, V.J. (2011). Roles of Dynein and Dynactin in Early Endosome Dynamics Revealed Using Automated Tracking and Global Analysis. PLoS ONE 6.
Florin, I., and Thelestam, M. (1983). Internalization of Clostridium difficile cytotoxin into cultured human lung fibroblasts. Biochim. Biophys. Acta BBA - Mol. Cell Res. 763, 383–392.
Forgac, M. (2007). Vacuolar ATPases: rotary proton pumps in physiology and pathophysiology. Nat. Rev. Mol. Cell Biol. 8, 917–929.
Freeze, H.H., and Kranz, C. (2010). Endoglycosidase and Glycoamidase Release of N-Linked Glycans. Curr. Protoc. Mol. Biol. Ed. Frederick M Ausubel Al 0 17.
Friedrich, T., Breiderhoff, T., and Jentsch, T.J. (1999). Mutational analysis demonstrates that ClC-4 and ClC-5 directly mediate plasma membrane currents. J. Biol. Chem. 274, 896–902.
Gagescu, R., Demaurex, N., Parton, R.G., Hunziker, W., Huber, L.A., and Gruenberg, J. (2000). The Recycling Endosome of Madin-Darby Canine Kidney Cells Is a Mildly Acidic Compartment Rich in Raft Components. Mol. Biol. Cell 11, 2775–2791.
Genisyuerek, S., Papatheodorou, P., Guttenberg, G., Schubert, R., Benz, R., and Aktories, K. (2011). Structural determinants for membrane insertion, pore formation and translocation of Clostridium difficile toxin B. Mol. Microbiol. 79, 1643–1654.
References
106
George, J., Alfred L., Bianchi, L., Link, E.M., and Vanoye, C.G. (2001). From stones to bones: The biology of ClC chloride channels. Curr. Biol. 11, R620–R628.
Gerasimenko, J.V., Tepikin, A.V., Petersen, O.H., and Gerasimenko, O.V. (1998). Calcium uptake via endocytosis with rapid release from acidifying endosomes. Curr. Biol. 8, 1335–1338.
Gerhard, R., Tatge, H., Genth, H., Thum, T., Borlak, J., Fritz, G., and Just, I. (2005). Clostridium difficile toxin A induces expression of the stress-induced early gene product RhoB. J. Biol. Chem. 280, 1499–1505.
Gerhard, R., Frenzel, E., Goy, S., and Olling, A. (2013). Cellular uptake of Clostridium difficile TcdA and truncated TcdA lacking the receptor binding domain. J. Med. Microbiol. 62, 1414–1422.
Giesemann, T., Jank, T., Gerhard, R., Maier, E., Just, I., Benz, R., and Aktories, K. (2006). Cholesterol-dependent Pore Formation of Clostridium difficile Toxin A. J. Biol. Chem. 281, 10808–10815.
Gorvin, C.M., Wilmer, M.J., Piret, S.E., Harding, B., van den Heuvel, L.P., Wrong, O., Jat, P.S., Lippiat, J.D., Levtchenko, E.N., and Thakker, R.V. (2013). Receptor-mediated endocytosis and endosomal acidification is impaired in proximal tubule epithelial cells of Dent disease patients. Proc. Natl. Acad. Sci. U. S. A. 110, 7014–7019.
Govind, R., and Dupuy, B. (2012). Secretion of Clostridium difficile Toxins A and B Requires the Holin-like Protein TcdE. PLoS Pathog. 8.
Govind, R., Fitzwater, L., and Nichols, R. (2015). Observations on the Role of TcdE Isoforms in Clostridium difficile Toxin Secretion. J. Bacteriol. 197, 2600–2609.
Graham, F.L., and van der Eb, A.J. (1973). A new technique for the assay of infectivity of human adenovirus 5 DNA. Virology 52, 456–467.
Graves, A.R., Curran, P.K., Smith, C.L., and Mindell, J.A. (2008). The Cl-/H+ antiporter ClC-7 is the primary chloride permeation pathway in lysosomes. Nature 453, 788–792.
Grieschat, M., and Alekov, A.K. (2012). Glutamate 268 Regulates Transport Probability of the Anion/Proton Exchanger ClC-5. J. Biol. Chem. 287, 8101–8109.
Günther, W., Lüchow, A., Cluzeaud, F., Vandewalle, A., and Jentsch, T.J. (1998). ClC-5, the chloride channel mutated in Dent’s disease, colocalizes with the proton pump in endocytotically active kidney cells. Proc. Natl. Acad. Sci. U. S. A. 95, 8075–8080.
Guzman, R.E., Grieschat, M., Fahlke, C., and Alekov, A.K. (2013). ClC-3 is an intracellular chloride/proton exchanger with large voltage-dependent nonlinear capacitance. ACS Chem. Neurosci. 4, 994–1003.
References
107
Guzman, R.E., Alekov, A.K., Filippov, M., Hegermann, J., and Fahlke, C. (2014). Involvement of ClC-3 chloride/proton exchangers in controlling glutamatergic synaptic strength in cultured hippocampal neurons. Front. Cell. Neurosci. 8, 143.
Hall, I.C. (1935). INTESTINAL FLORA IN NEW-BORN INFANTS: WITH A DESCRIPTION OF A NEW PATHOGENIC ANAEROBE, BACILLUS DIFFICILIS. Am. J. Dis. Child. 49, 390.
Hamm-Alvarez, S.F., and Sheetz, M.P. (1998). Microtubule-Dependent Vesicle Transport: Modulation of Channel and Transporter Activity in Liver and Kidney. Physiol. Rev. 78, 1109–1129.
Hara-Chikuma, M., Wang, Y., Guggino, S.E., Guggino, W.B., and Verkman, A.S. (2005). Impaired acidification in early endosomes of ClC-5 deficient proximal tubule. Biochem. Biophys. Res. Commun. 329, 941–946.
Harvey, K.F., and Kumar, S. (1999). Nedd4-like proteins: an emerging family of ubiquitin-protein ligases implicated in diverse cellular functions. Trends Cell Biol. 9, 166–169.
Haupts, U., Maiti, S., Schwille, P., and Webb, W.W. (1998). Dynamics of fluorescence fluctuations in green fluorescent protein observed by fluorescence correlation spectroscopy. Proc. Natl. Acad. Sci. U. S. A. 95, 13573–13578.
Hebeisen, S., Heidtmann, H., Cosmelli, D., Gonzalez, C., Poser, B., Latorre, R., Alvarez, O., and Fahlke, C. (2003). Anion permeation in human ClC-4 channels. Biophys. J. 84, 2306–2318.
Henriques, B., Florin, I., and Thelestam, M. (1987). Cellular internalisation of Clostridium difficile toxin A. Microb. Pathog. 2, 455–463.
Hippenstiel, S., Schmeck, B., N’Guessan, P.D., Seybold, J., Krüll, M., Preissner, K., Eichel-Streiber, C.V., and Suttorp, N. (2002). Rho protein inactivation induced apoptosis of cultured human endothelial cells. Am. J. Physiol. Lung Cell. Mol. Physiol. 283, L830-838.
Höfling, F., and Franosch, T. (2013). Anomalous transport in the crowded world of biological cells. Rep. Prog. Phys. Phys. Soc. G. B. 76, 046602.
van den Hove, M.-F., Croizet-Berger, K., Jouret, F., Guggino, S.E., Guggino, W.B., Devuyst, O., and Courtoy, P.J. (2006). The loss of the chloride channel, ClC-5, delays apical iodide efflux and induces a euthyroid goiter in the mouse thyroid gland. Endocrinology 147, 1287–1296.
Hryciw, D.H., Wang, Y., Devuyst, O., Pollock, C.A., Poronnik, P., and Guggino, W.B. (2003). Cofilin Interacts with ClC-5 and Regulates Albumin Uptake in Proximal Tubule Cell Lines. J. Biol. Chem. 278, 40169–40176.
References
108
Hryciw, D.H., Ekberg, J., Lee, A., Lensink, I.L., Kumar, S., Guggino, W.B., Cook, D.I., Pollock, C.A., and Poronnik, P. (2004). Nedd4-2 functionally interacts with ClC-5: involvement in constitutive albumin endocytosis in proximal tubule cells. J. Biol. Chem. 279, 54996–55007.
Hryciw, D.H., Ekberg, J., Ferguson, C., Lee, A., Wang, D., Parton, R.G., Pollock, C.A., Yun, C.C., and Poronnik, P. (2006). Regulation of Albumin Endocytosis by PSD95/Dlg/ZO-1 (PDZ) Scaffolds INTERACTION OF Na+-H+ EXCHANGE REGULATORY FACTOR-2 WITH ClC-5. J. Biol. Chem. 281, 16068–16077.
Hundsberger, T., Braun, V., Weidmann, M., Leukel, P., Sauerborn, M., and Von Eichel-Streiber, C. (1997). Transcription Analysis of the Genes tcdA-E of the Pathogenicity Locus of Clostridium Difficile. Eur. J. Biochem. 244, 735–742.
Huotari, J., and Helenius, A. (2011). Endosome maturation. EMBO J. 30, 3481–3500.
Hurtado-Lorenzo, A., Skinner, M., Annan, J.E., Futai, M., Sun-Wada, G.-H., Bourgoin, S., Casanova, J., Wildeman, A., Bechoua, S., Ausiello, D.A., et al. (2006). V-ATPase interacts with ARNO and Arf6 in early endosomes and regulates the protein degradative pathway. Nat. Cell Biol. 8, 124–136.
HUTAGALUNG, A.H., and NOVICK, P.J. (2011). Role of Rab GTPases in Membrane Traffic and Cell Physiology. Physiol. Rev. 91, 119–149.
Ignoul, S., Simaels, J., Hermans, D., Annaert, W., and Eggermont, J. (2007). Human ClC-6 is a late endosomal glycoprotein that associates with detergent-resistant lipid domains. PloS One 2, e474.
Iyer, R., Iverson, T.M., Accardi, A., and Miller, C. (2002). A biological role for prokaryotic ClC chloride channels. Nature 419, 715–718.
Jacobsen, A.V., Yemaneab, B.T., Jass, J., and Scherbak, N. (2014). Reference Gene Selection for qPCR Is Dependent on Cell Type Rather than Treatment in Colonic and Vaginal Human Epithelial Cell Lines. PLOS ONE 9, e115592.
Jank, T., and Aktories, K. (2008). Structure and mode of action of clostridial glucosylating toxins: the ABCD model. Trends Microbiol. 16, 222–229.
Jank, T., Giesemann, T., and Aktories, K. (2007). Rho-glucosylating Clostridium difficile toxins A and B: new insights into structure and function. Glycobiology 17, 15R–22R.
Jaqaman, K., Loerke, D., Mettlen, M., Kuwata, H., Grinstein, S., Schmid, S.L., and Danuser, G. (2008). Robust single-particle tracking in live-cell time-lapse sequences. Nat. Methods 5, 695–702.
Jentsch, T.J. (2007). Chloride and the endosomal-lysosomal pathway: emerging roles of CLC chloride transporters. J. Physiol. 578, 633–640.
References
109
Jentsch, T.J. (2008). CLC Chloride Channels and Transporters: From Genes to Protein Structure, Pathology and Physiology. Crit. Rev. Biochem. Mol. Biol. 43, 3–36.
Jentsch, T.J. (2015). Discovery of CLC transport proteins: cloning, structure, function and pathophysiology. J. Physiol. 593, 4091–4109.
Jentsch, T.J., Friedrich, T., Schriever, A., and Yamada, H. (1999). The CLC chloride channel family. Pflugers Arch. 437, 783–795.
Jentsch, T.J., Stein, V., Weinreich, F., and Zdebik, A.A. (2002). Molecular Structure and Physiological Function of Chloride Channels. Physiol. Rev. 82, 503–568.
Jeworutzki, E., López-Hernández, T., Capdevila-Nortes, X., Sirisi, S., Bengtsson, L., Montolio, M., Zifarelli, G., Arnedo, T., Müller, C.S., Schulte, U., et al. (2012). GlialCAM, a protein defective in a leukodystrophy, serves as a ClC-2 Cl(-) channel auxiliary subunit. Neuron 73, 951–961.
Jin, N.G., Kim, J.K., Yang, D.K., Cho, S.J., Kim, J.M., Koh, E.J., Jung, H.C., So, I., and Kim, K.W. (2003). Fundamental role of ClC-3 in volume-sensitive Cl- channel function and cell volume regulation in AGS cells. Am. J. Physiol. - Gastrointest. Liver Physiol. 285, G938–G948.
Johnson, L.S., Dunn, K.W., Pytowski, B., and McGraw, T.E. (1993). Endosome acidification and receptor trafficking: bafilomycin A1 slows receptor externalization by a mechanism involving the receptor’s internalization motif. Mol. Biol. Cell 4, 1251–1266.
Jouret, F., Igarashi, T., Gofflot, F., Wilson, P.D., Karet, F.E., Thakker, R.V., and Devuyst, O. (2004). Comparative ontogeny, processing, and segmental distribution of the renal chloride channel, ClC-5. Kidney Int. 65, 198–208.
Just, I., and Gerhard, R. (2005). Large clostridial cytotoxins. In Reviews of Physiology, Biochemistry and Pharmacology, (Berlin, Heidelberg: Springer Berlin Heidelberg), pp. 23–47.
Just, I., Selzer, J., Wilm, M., von Eichel-Streiber, C., Mann, M., and Aktories, K. (1995). Glucosylation of Rho proteins by Clostridium difficile toxin B. Nature 375, 500–503.
Keel, M.K., and Songer, J.G. (2011). The Attachment, Internalization, and Time-Dependent, Intracellular Distribution of Clostridium difficile Toxin A in Porcine Intestinal Explants. Vet. Pathol. 48, 369–380.
Kern, S.M., and Feig, A.L. (2011). Adaptation of Clostridium difficile toxin A for use as a protein translocation system. Biochem. Biophys. Res. Commun. 405, 570–574.
Konopka, C.A., and Bednarek, S.Y. (2008). Variable-angle epifluorescence microscopy: a new way to look at protein dynamics in the plant cell cortex. Plant J. 53, 186–196.

References
110
Kornak, U., Kasper, D., Bösl, M.R., Kaiser, E., Schweizer, M., Schulz, A., Friedrich, W., Delling, G., and Jentsch, T.J. (2001). Loss of the ClC-7 Chloride Channel Leads to Osteopetrosis in Mice and Man. Cell 104, 205–215.
Kornak, U., Ostertag, A., Branger, S., Benichou, O., and de Vernejoul, M.-C. (2006). Polymorphisms in the CLCN7 gene modulate bone density in postmenopausal women and in patients with autosomal dominant osteopetrosis type II. J. Clin. Endocrinol. Metab. 91, 995–1000.
Kornfeld, R., and Kornfeld, S. (1985). Assembly of Asparagine-Linked Oligosaccharides. Annu. Rev. Biochem. 54, 631–664.
LaFrance, M.E., Farrow, M.A., Chandrasekaran, R., Sheng, J., Rubin, D.H., and Lacy, D.B. (2015). Identification of an epithelial cell receptor responsible for Clostridium difficile TcdB-induced cytotoxicity. Proc. Natl. Acad. Sci. 112, 7073–7078.
Lakadamyali, M., Rust, M.J., and Zhuang, X. (2004). Endocytosis of influenza viruses. Microbes Infect. Inst. Pasteur 6, 929–936.
Lange, P.F., Wartosch, L., Jentsch, T.J., and Fuhrmann, J.C. (2006). ClC-7 requires Ostm1 as a beta-subunit to support bone resorption and lysosomal function. Nature 440, 220–223.
Lanis, J.M., Barua, S., and Ballard, J.D. (2010). Variations in TcdB activity and the hypervirulence of emerging strains of Clostridium difficile. PLoS Pathog. 6, e1001061.
Leisle, L., Ludwig, C.F., Wagner, F.A., Jentsch, T.J., and Stauber, T. (2011). ClC-7 is a slowly voltage-gated 2Cl(-)/1H(+)-exchanger and requires Ostm1 for transport activity. EMBO J. 30, 2140–2152.
Lerche, H., Peter, W., Fleischhauer, R., Pika-Hartlaub, U., Malina, T., Mitrovic, N., and Lehmann-Horn, F. (1997). Role in fast inactivation of the IV/S4-S5 loop of the human muscle Na+ channel probed by cysteine mutagenesis. J. Physiol. 505, 345–352.
Lessa, F.C., Mu, Y., Bamberg, W.M., Beldavs, Z.G., Dumyati, G.K., Dunn, J.R., Farley, M.M., Holzbauer, S.M., Meek, J.I., Phipps, E.C., et al. (2015). Burden of Clostridium difficile Infection in the United States. N. Engl. J. Med. 372, 825–834.
Lim, H.-H., and Miller, C. (2009). Intracellular proton-transfer mutants in a CLC Cl-/H+ exchanger. J. Gen. Physiol. 133, 131–138.
Livak, K.J., and Schmittgen, T.D. (2001). Analysis of Relative Gene Expression Data Using Real-Time Quantitative PCR and the 2−ΔΔCT Method. Methods 25, 402–408.
Lloyd, S.E., Pearce, S.H.S., Fisher, S.E., Steinmeyer, K., Schwappach, B., Scheinman, S.J., Harding, B., Bolino, A., Devoto, M., Goodyer, P., et al. (1996). A common molecular basis for three inherited kidney stone diseases. Nature 379, 445–449.

References
111
Lloyd, S.E., Pearce, S.H., Günther, W., Kawaguchi, H., Igarashi, T., Jentsch, T.J., and Thakker, R.V. (1997). Idiopathic low molecular weight proteinuria associated with hypercalciuric nephrocalcinosis in Japanese children is due to mutations of the renal chloride channel (CLCN5). J. Clin. Invest. 99, 967–974.
Lodish, H., Berk, A., Zipursky, S.L., Matsudaira, P., Baltimore, D., and Darnell, J. (2000). Protein Glycosylation in the ER and Golgi Complex.
Ludwig, M., Doroszewicz, J., Seyberth, H.W., Bökenkamp, A., Balluch, B., Nuutinen, M., Utsch, B., and Waldegger, S. (2005). Functional evaluation of Dent’s disease-causing mutations: implications for ClC-5 channel trafficking and internalization. Hum. Genet. 117, 228–237.
Lueck, J.D., Lungu, C., Mankodi, A., Osborne, R.J., Welle, S.L., Dirksen, R.T., and Thornton, C.A. (2007). Chloride channelopathy in myotonic dystrophy resulting from loss of posttranscriptional regulation for CLCN1. Am. J. Physiol. Cell Physiol. 292, C1291-1297.
Lund, F.W., Jensen, M.L.V., Christensen, T., Nielsen, G.K., Heegaard, C.W., and Wüstner, D. (2014). SpatTrack: An Imaging Toolbox for Analysis of Vesicle Motility and Distribution in Living Cells. Traffic n/a-n/a.
Luyckx, V.A., Goda, F.O., Mount, D.B., Nishio, T., Hall, A., Hebert, S.C., Hammond, T.G., and Yu, A.S.L. (1998). Intrarenal and subcellular localization of rat CLC5. Am. J. Physiol. - Ren. Physiol. 275, F761–F769.
Magnelli, P.E., Bielik, A.M., and Guthrie, E.P. (2011). Identification and Characterization of Protein Glycosylation using Specific Endo- and Exoglycosidases. J. Vis. Exp. JoVE.
Mahida, Y.R., Makh, S., Hyde, S., Gray, T., and Borriello, S.P. (1996). Effect of Clostridium difficile toxin A on human intestinal epithelial cells: induction of interleukin 8 production and apoptosis after cell detachment. Gut 38, 337–347.
Mahon, M.J. (2011). pHluorin2: an enhanced, ratiometric, pH-sensitive green florescent protein. Adv. Biosci. Biotechnol. Print 2, 132–137.
Mangravite, L.M., and Giacomini, K.M. (2003). Sorting of rat SPNT in renal epithelium is independent of N-glycosylation. Pharm. Res. 20, 319–323.
Mani, N., and Dupuy, B. (2001). Regulation of toxin synthesis in Clostridium difficile by an alternative RNA polymerase sigma factor. Proc. Natl. Acad. Sci. 98, 5844–5849.
Martinez, F.J., Leffler, D.A., and Kelly, C.P. (2012). Clostridium difficile outbreaks: prevention and treatment strategies. Risk Manag. Healthc. Policy 5, 55–64.
Matysik, A., and Kraut, R.S. (2014). TrackArt: the user friendly interface for single molecule tracking data analysis and simulation applied to complex diffusion in mica supported lipid bilayers. BMC Res. Notes 7, 274.

References
112
Maxfield, F.R., and McGraw, T.E. (2004). Endocytic recycling. Nat. Rev. Mol. Cell Biol. 5, 121–132.
Maxson, M.E., and Grinstein, S. (2014). The vacuolar-type H+-ATPase at a glance – more than a proton pump. J Cell Sci 127, 4987–4993.
McFarland, L.V., Mulligan, M.E., Kwok, R.Y.Y., and Stamm, W.E. (1989). Nosocomial Acquisition of Clostridium difficile Infection. N. Engl. J. Med. 320, 204–210.
Me, J., Lm, B., Y, L., and G, Y. (1994). Visual identification of individual transfected cells for electrophysiology using antibody-coated beads. BioTechniques 17, 876–881.
Mellman, I. (1996). Endocytosis and Molecular Sorting. Annu. Rev. Cell Dev. Biol. 12, 575–625.
Mindell, J.A., Maduke, M., Miller, C., and Grigorieff, N. (2001). Projection structure of a ClC-type chloride channel at 6.5 A resolution. Nature 409, 219–223.
Mohammad-Panah, R., Harrison, R., Dhani, S., Ackerley, C., Huan, L.-J., Wang, Y., and Bear, C.E. (2003). The chloride channel ClC-4 contributes to endosomal acidification and trafficking. J. Biol. Chem. 278, 29267–29277.
Na, X., Kim, H., Moyer, M.P., Pothoulakis, C., and LaMont, J.T. (2008). gp96 Is a Human Colonocyte Plasma Membrane Binding Protein for Clostridium difficile Toxin A. Infect. Immun. 76, 2862–2871.
Nielsen, R., and Christensen, E.I. (2010). Proteinuria and events beyond the slit. Pediatr. Nephrol. 25, 813–822.
Novarino, G., Weinert, S., Rickheit, G., and Jentsch, T.J. (2010). Endosomal Chloride-Proton Exchange Rather Than Chloride Conductance Is Crucial for Renal Endocytosis. Science 328, 1398–1401.
Olling, A., Goy, S., Hoffmann, F., Tatge, H., Just, I., and Gerhard, R. (2011). The repetitive oligopeptide sequences modulate cytopathic potency but are not crucial for cellular uptake of Clostridium difficile toxin A. PloS One 6, e17623.
Olling, A., Seehase, S., Minton, N.P., Tatge, H., Schröter, S., Kohlscheen, S., Pich, A., Just, I., and Gerhard, R. (2012). Release of TcdA and TcdB from Clostridium difficile cdi 630 is not affected by functional inactivation of the tcdE gene. Microb. Pathog. 52, 92–100.
Ottlinger, M.E., and Lin, S. (1988). Clostridium difficile toxin B induces reorganization of actin, vinculin, and talin in cultured cells. Exp. Cell Res. 174, 215–229.
Papatheodorou, P., Zamboglou, C., Genisyuerek, S., Guttenberg, G., and Aktories, K. (2010). Clostridial Glucosylating Toxins Enter Cells via Clathrin-Mediated Endocytosis. PLOS ONE 5, e10673.
References
113
Paredes-Sabja, D., Shen, A., and Sorg, J.A. (2014). Clostridium difficile spore biology: sporulation, germination, and spore structural proteins. Trends Microbiol. 22, 406–416.
Park, E., Campbell, E.B., and MacKinnon, R. (2017). Structure of a CLC chloride ion channel by cryo-electron microscopy. Nature 541, 500–505.
Pfeifer, G., Schirmer, J., Leemhuis, J., Busch, C., Meyer, D.K., Aktories, K., and Barth, H. (2003). Cellular Uptake of Clostridium difficile Toxin B TRANSLOCATION OF THE N-TERMINAL CATALYTIC DOMAIN INTO THE CYTOSOL OF EUKARYOTIC CELLS. J. Biol. Chem. 278, 44535–44541.
Picollo, A., and Pusch, M. (2005). Chloride/proton antiporter activity of mammalian CLC proteins ClC-4 and ClC-5. Nature 436, 420–423.
Piwon, N., Günther, W., Schwake, M., Bösl, M.R., and Jentsch, T.J. (2000). ClC-5 Cl--channel disruption impairs endocytosis in a mouse model for Dent’s disease. Nature 408, 369–373.
Poët, M., Kornak, U., Schweizer, M., Zdebik, A.A., Scheel, O., Hoelter, S., Wurst, W., Schmitt, A., Fuhrmann, J.C., Planells-Cases, R., et al. (2006). Lysosomal storage disease upon disruption of the neuronal chloride transport protein ClC-6. Proc. Natl. Acad. Sci. 103, 13854–13859.
Pothoulakis, C., Galili, U., Castagliuolo, I., Kelly, C., Nikulasson, S., Dudeja, P., Brasitus, T., and LaMont, J. (1996). A human antibody binds to alpha-galactose receptors and mimics the effects of Clostridium difficile toxin A in rat colon. Gastroenterology 110, 1704–1712.
Pruitt, R.N., and Lacy, D.B. (2012). Toward a structural understanding of Clostridium difficile toxins A and B. Front. Cell. Infect. Microbiol. 2.
Pruitt, R.N., Chambers, M.G., Ng, K.K.-S., Ohi, M.D., and Lacy, D.B. (2010). Structural organization of the functional domains of Clostridium difficile toxins A and B. Proc. Natl. Acad. Sci. U. S. A. 107, 13467–13472.
Pusch, M. (2002). Myotonia caused by mutations in the muscle chloride channel gene CLCN1. Hum. Mutat. 19, 423–434.
Pusch, M., and Zifarelli, G. (2014). ClC-5: Physiological role and biophysical mechanisms. ResearchGate 58.
Qa’Dan, M., Spyres, L.M., and Ballard, J.D. (2000). pH-Induced Conformational Changes in Clostridium difficile Toxin B. Infect. Immun. 68, 2470–2474.
Reed, A.A.C., Loh, N.Y., Terryn, S., Lippiat, J.D., Partridge, C., Galvanovskis, J., Williams, S.E., Jouret, F., Wu, F.T.F., Courtoy, P.J., et al. (2010). CLC-5 and KIF3B interact to facilitate CLC-5 plasma membrane expression, endocytosis, and microtubular transport: relevance to pathophysiology of Dent’s disease. Am. J. Physiol. Renal Physiol. 298, F365-380.
References
114
Regeer, R.R., Nicke, A., and Markovich, D. (2007). Quaternary structure and apical membrane sorting of the mammalian NaSi-1 sulfate transporter in renal cell lines. Int. J. Biochem. Cell Biol. 39, 2240–2251.
Rink, J., Ghigo, E., Kalaidzidis, Y., and Zerial, M. (2005). Rab Conversion as a Mechanism of Progression from Early to Late Endosomes. Cell 122, 735–749.
Rizk, A., Paul, G., Incardona, P., Bugarski, M., Mansouri, M., Niemann, A., Ziegler, U., Berger, P., and Sbalzarini, I.F. (2014). Segmentation and quantification of subcellular structures in fluorescence microscopy images using Squassh. Nat Protoc. 9, 586–596.
Roossien, D., Miller, K., and Gallo, G. (2015). Ciliobrevins as tools for studying dynein motor function. Front. Cell. Neurosci. 9.
Ruhe, F., Olling, A., Abromeit, R., Rataj, D., Grieschat, M., Zeug, A., Gerhard, R., and Alekov, A. (2017). Overexpression of the Endosomal Anion/Proton Exchanger ClC-5 Increases Cell Susceptibility toward Clostridium difficile Toxins TcdA and TcdB. Front. Cell. Infect. Microbiol. 7.
Rupnik, M., Wilcox, M.H., and Gerding, D.N. (2009). Clostridium difficile infection: new developments in epidemiology and pathogenesis. Nat. Rev. Microbiol. 7, 526–536.
Sakamoto, H., Kawasaki, M., Uchida, S., Sasaki, S., and Marumo, F. (1996). Identification of a New Outwardly Rectifying Cl Channel That Belongs to a Subfamily of the ClC Cl Channels. J. Biol. Chem. 271, 10210–10216.
Sakamoto, H., Sado, Y., Naito, I., Kwon, T.-H., Inoue, S., Endo, K., Kawasaki, M., Uchida, S., Nielsen, S., Sasaki, S., et al. (1999). Cellular and subcellular immunolocalization of ClC-5 channel in mouse kidney: colocalization with H+-ATPase. Am. J. Physiol. - Ren. Physiol. 277, F957–F965.
Satoh, N., Yamada, H., Yamazaki, O., Suzuki, M., Nakamura, M., Suzuki, A., Ashida, A., Yamamoto, D., Kaku, Y., Sekine, T., et al. (2016). A pure chloride channel mutant of CLC-5 causes Dent’s disease via insufficient V-ATPase activation. Pflugers Arch. 468, 1183–1196.
Saxton, M.J. (1994). Anomalous diffusion due to obstacles: a Monte Carlo study. Biophys. J. 66, 394–401.
Sayer, J.A., Stewart, G.S., Boese, S.H., Gray, M.A., Pearce, S.H., Goodship, T.H., and Simmons, N.L. (2001). The voltage-dependent Cl(-) channel ClC-5 and plasma membrane Cl(-) conductances of mouse renal collecting duct cells (mIMCD-3). J. Physiol. 536, 769–783.
Sbalzarini, I.F., and Koumoutsakos, P. (2005). Feature point tracking and trajectory analysis for video imaging in cell biology. J. Struct. Biol. 151, 182–195.

References
115
Scheel, O., Zdebik, A.A., Lourdel, S., and Jentsch, T.J. (2005). Voltage-dependent electrogenic chloride/proton exchange by endosomal CLC proteins. Nature 436, 424–427.
Scheinman, S.J. (1998). X-linked hypercalciuric nephrolithiasis: Clinical syndromes and chloride channel mutations. Kidney Int. 53, 3–17.
Schmieder, S., Bogliolo, S., and Ehrenfeld, J. (2007). N-glycosylation of the Xenopus laevis ClC-5 protein plays a role in cell surface expression, affecting transport activity at the plasma membrane. J. Cell. Physiol. 210, 479–488.
Schuster, M., Kilaru, S., Fink, G., Collemare, J., Roger, Y., and Steinberg, G. (2011). Kinesin-3 and dynein cooperate in long-range retrograde endosome motility along a nonuniform microtubule array. Mol. Biol. Cell 22, 3645–3657.
Schwake, M., Friedrich, T., and Jentsch, T.J. (2001). An Internalization Signal in ClC-5, an Endosomal Cl−Channel Mutated in Dent’s Disease. J. Biol. Chem. 276, 12049–12054.
Schwan, C., Nölke, T., Kruppke, A.S., Schubert, D.M., Lang, A.E., and Aktories, K. (2011). Cholesterol- and Sphingolipid-rich Microdomains Are Essential for Microtubule-based Membrane Protrusions Induced by Clostridium difficile Transferase (CDT). J. Biol. Chem. 286, 29356–29365.
Schwegler, J.S., Heppelmann, B., Mildenberger, S., and Silbernagl, S. (1991). Receptor-mediated endocytosis of albumin in cultured opossum kidney cells: a model for proximal tubular protein reabsorption. Pflugers Arch. 418, 383–392.
Sethi, S.K., Ludwig, M., Kabra, M., Hari, P., and Bagga, A. (2009). Vitamin A responsive night blindness in Dent’s disease. Pediatr. Nephrol. 24, 1765–1770.
Shurety, W., Stewart, N.L., and Stow, J.L. (1998). Fluid-Phase Markers in the Basolateral Endocytic Pathway Accumulate in Response to the Actin Assembly-promoting Drug Jasplakinolide. Mol. Biol. Cell 9, 957–975.
Silva, I.V., Cebotaru, V., Wang, H., Wang, X.-T., Wang, S.S., Guo, G., Devuyst, O., Thakker, R.V., Guggino, W.B., and Guggino, S.E. (2003). The ClC-5 knockout mouse model of Dent’s disease has renal hypercalciuria and increased bone turnover. J. Bone Miner. Res. Off. J. Am. Soc. Bone Miner. Res. 18, 615–623.
Smith, A.J., and Lippiat, J.D. (2010). Voltage-dependent charge movement associated with activation of the CLC-5 2Cl−/1H+ exchanger. FASEB J. 24, 3696–3705.
Smith, A.J., Reed, A.A.C., Loh, N.Y., Thakker, R.V., and Lippiat, J.D. (2009). Characterization of Dent’s disease mutations of CLC-5 reveals a correlation between functional and cell biological consequences and protein structure. Am. J. Physiol. - Ren. Physiol. 296, F390–F397.
References
116
Smith, M.B., Karatekin, E., Gohlke, A., Mizuno, H., Watanabe, N., and Vavylonis, D. (2011). Interactive, Computer-Assisted Tracking of Speckle Trajectories in Fluorescence Microscopy: Application to Actin Polymerization and Membrane Fusion. Biophys. J. 101, 1794–1804.
Sonawane, N.D., and Verkman, A.S. (2003). Determinants of [Cl−] in recycling and late endosomes and Golgi complex measured using fluorescent ligands. J. Cell Biol. 160, 1129–1138.
Sonawane, N.D., Thiagarajah, J.R., and Verkman, A.S. (2002). Chloride concentration in endosomes measured using a ratioable fluorescent Cl- indicator: evidence for chloride accumulation during acidification. J. Biol. Chem. 277, 5506–5513.
Sönnichsen, B., De Renzis, S., Nielsen, E., Rietdorf, J., and Zerial, M. (2000). Distinct membrane domains on endosomes in the recycling pathway visualized by multicolor imaging of Rab4, Rab5, and Rab11. J. Cell Biol. 149, 901–914.
Sorkin, A., and von Zastrow, M. (2002). Signal transduction and endocytosis: close encounters of many kinds. Nat. Rev. Mol. Cell Biol. 3, 600–614.
Stauber, T., and Jentsch, T.J. (2013). Chloride in Vesicular Trafficking and Function. Annu. Rev. Physiol. 75, 453–477.
Stauber, T., Weinert, S., and Jentsch, T.J. (2012). Cell Biology and Physiology of CLC Chloride Channels and Transporters. In Comprehensive Physiology, R. Terjung, ed. (Hoboken, NJ, USA: John Wiley & Sons, Inc.), p.
Steinmeyer, K., Klocke, R., Ortland, C., Gronemeier, M., Jockusch, H., Gründer, S., and Jentsch, T.J. (1991). Inactivation of muscle chloride channel by transposon insertion in myotonic mice. Nature 354, 304–308.
Steinmeyer, K., Schwappach, B., Bens, M., Vandewalle, A., and Jentsch, T.J. (1995). Cloning and Functional Expression of Rat CLC-5, a Chloride Channel Related to Kidney Disease. J. Biol. Chem. 270, 31172–31177.
Steyer, J.A., and Almers, W. (2001). A real-time view of life within 100 nm of the plasma membrane. Nat. Rev. Mol. Cell Biol. 2, 268–275.
Stobrawa, S.M., Breiderhoff, T., Takamori, S., Engel, D., Schweizer, M., Zdebik, A.A., Bösl, M.R., Ruether, K., Jahn, H., Draguhn, A., et al. (2001). Disruption of ClC-3, a chloride channel expressed on synaptic vesicles, leads to a loss of the hippocampus. Neuron 29, 185–196.
Stone, M., Jia, S., Heo, W.D., Meyer, T., and Konan, K.V. (2007). Participation of Rab5, an Early Endosome Protein, in Hepatitis C Virus RNA Replication Machinery. J. Virol. 81, 4551–4563.

References
117
Takano, M., Nakanishi, N., Kitahara, Y., Sasaki, Y., Murakami, T., and Nagai, J. (2002). Cisplatin-induced inhibition of receptor-mediated endocytosis of protein in the kidney. Kidney Int. 62, 1707–1717.
TAN, K.S., WEE, B.Y., and SONG, K.P. (2001). Evidence for holin function of tcdE gene in the pathogenicity of Clostridium difficile. J. Med. Microbiol. 50, 613–619.
Tang, C.-Y., and Chen, T.-Y. (2011). Physiology and Pathophysiology of CLC-1: Mechanisms of a Chloride Channel Disease, Myotonia. BioMed Res. Int. 2011, e685328.
Tsuboi, T., and Fukuda, M. (2006). Rab3A and Rab27A cooperatively regulate the docking step of dense-core vesicle exocytosis in PC12 cells. J. Cell Sci. 119, 2196–2203.
Uchida, S., Sasaki, S., Nitta, K., Uchida, K., Horita, S., Nihei, H., and Marumo, F. (1995). Localization and functional characterization of rat kidney-specific chloride channel, ClC-K1. J. Clin. Invest. 95, 104–113.
Ullrich, O., Reinsch, S., Urbé, S., Zerial, M., and Parton, R.G. (1996). Rab11 regulates recycling through the pericentriolar recycling endosome. J. Cell Biol. 135, 913–924.
Urbé, S., Huber, L. a., Zerial, M., Tooze, S. a., and Parton, R. g. (1993). Rab11, a small GTPase associated with both constitutive and regulated secretory pathways in PC12 cells. FEBS Lett. 334, 175–182.
Vallotton, P., and Olivier, S. (2013). Tri-track: Free Software for Large-Scale Particle Tracking. Microsc. Microanal. 19, 451–460.
Vandewalle, A., Cluzeaud, F., Peng, K.-C., Bens, M., Lüchow, A., Günther, W., and Jentsch, T.J. (2001). Tissue distribution and subcellular localization of the ClC-5 chloride channel in rat intestinal cells. Am. J. Physiol. - Cell Physiol. 280, C373–C381.
Veiga, E., and Cossart, P. (2005). Listeria hijacks the clathrin-dependent endocytic machinery to invade mammalian cells. Nat. Cell Biol. 7, 894–900.
Vonderheit, A., and Helenius, A. (2005). Rab7 associates with early endosomes to mediate sorting and transport of Semliki forest virus to late endosomes. PLoS Biol. 3, e233.
Voth, D.E., and Ballard, J.D. (2005). Clostridium difficile Toxins: Mechanism of Action and Role in Disease. Clin. Microbiol. Rev. 18, 247–263.
Wang, S.S., Devuyst, O., Courtoy, P.J., Wang, X.-T., Wang, H., Wang, Y., Thakker, R.V., Guggino, S., and Guggino, W.B. (2000). Mice lacking renal chloride channel, CLC-5, are a model for Dent’s disease, a nephrolithiasis disorder associated with defective receptor-mediated endocytosis. Hum. Mol. Genet. 9, 2937–2945.

References
118
Weinert, S., Jabs, S., Hohensee, S., Chan, W.L., Kornak, U., and Jentsch, T.J. (2014). Transport activity and presence of ClC-7/Ostm1 complex account for different cellular functions. EMBO Rep. 15, 784–791.
Wills, N.K., and Fong, P. (2001). ClC Chloride Channels in Epithelia: Recent Progress and Remaining Puzzles. Physiology 16, 161–166.
Wrong, O.M., Norden, A.G.W., and Feest, T.G. (1994). Dent’s disease; a familial proximal renal tubular syndrome with low-molecular-weight proteinuria, hypercalciuria, nephrocalcinosis, metabolic bone disease, progressive renal failure and a marked male predominance. QJM 87, 473–493.
Wu, F., Roche, P., Christie, P.T., Loh, N.Y., Reed, A.A.C., Esnouf, R.M., and Thakker, R.V. (2003). Modeling study of human renal chloride channel (hCLC-5) mutations suggests a structural-functional relationship. Kidney Int. 63, 1426–1432.
Wu, F., Reed, A. a. C., Williams, S.E., Loh, N.Y., Lippiat, J.D., Christie, P.T., Large, O., Bettinelli, A., Dillon, M.J., Goldraich, N.P., et al. (2009). Mutational Analysis of CLC-5, Cofilin and CLC-4 in Patients with Dent’s Disease. Nephron Physiol. 112, p53–p62.
Yamashiro, D.J., Tycko, B., Fluss, S.R., and Maxfield, F.R. (1984). Segregation of transferrin to a mildly acidic (pH 6.5) para-golgi compartment in the recycling pathway. Cell 37, 789–800.
Yang, Z., Zhang, Y., Huang, T., and Feng, H. (2015). Glucosyltransferase activity of Clostridium difficile Toxin B is essential for disease pathogenesis. Gut Microbes 6, 221–224.
Yuan, P., Zhang, H., Cai, C., Zhu, S., Zhou, Y., Yang, X., He, R., Li, C., Guo, S., Li, S., et al. (2015). Chondroitin sulfate proteoglycan 4 functions as the cellular receptor for Clostridium difficile toxin B. Cell Res. 25, 157–168.
Zajac, A.L., Goldman, Y.E., Holzbaur, E.L.F., and Ostap, E.M. (2013). Local cytoskeletal and organelle interactions impact molecular motor-driven early endosomal trafficking. Curr. Biol. CB 23, 1173–1180.
Zdebik, A.A., Zifarelli, G., Bergsdorf, E.-Y., Soliani, P., Scheel, O., Jentsch, T.J., and Pusch, M. (2008). Determinants of Anion-Proton Coupling in Mammalian Endosomal CLC Proteins. J. Biol. Chem. 283, 4219–4227.
Zifarelli, G., and Pusch, M. (2009). Conversion of the 2 Cl−/1 H+ antiporter ClC-5 in a NO3−/H+ antiporter by a single point mutation. EMBO J. 28, 175–182.
Zimmermann, T. (2005). Spectral imaging and linear unmixing in light microscopy. Adv. Biochem. Eng. Biotechnol. 95, 245–265.

Lebenslauf
119
8 Lebenslauf
Persönliches
Geburtsdatum, -ort:
23.01.1986, Paderborn
Karriere und Bildung
seit 11/2017
11/2013-05/2017
Institut für Biophysik, Leibniz Universität Hannover Medizinische Hochschule Hannover Doktorandin am Institut für Neurophysiologie, in der Arbeitsgruppe von Prof. Dr. Molekulare Physiologie.
2010 – 2012
Georg-August Universität Göttingen Master of Science in Microbiology and Biochemistry Titel der Arbeit: Steryl ester hydrolysis during germination in Arabidopsis thaliana
2006 - 2010
Julius Maximilians University Würzburg Bachelor of Science in Biologie Titel der Arbeit: Generation of an akuA deletion mutant and a deletion fragment for the vosA gene in Aspergillus fumigatus
1996 - 2005
Gymnasium Achern
Abitur
Praktika
12/2012 - 2/2013
Georg-August University Göttingen Abteilung Biochemie der Pflanze, Albrecht-von-Haller Institut für Pflanzenwissenschaften Projekt: Analysis of putative steryl ester lipases in Arabidopsis thaliana
04/2010-06/2010 Eskitis Institute, University of Brisbane, Australia
Projekt: Investigation of genes correlating with rasGRPase SH3 domain-binding protein 2 in breast cancer cells
10/2009-12/2009
Georg-August Universität Göttingen Abteilung für molekulare Mikrobiologie und Genetik Learning basic molecular and genetic tools for working with Aspergillus fumigatus
Hannover, 05 März 2018
Frederike Ruhe

List of publications
120
9 List of publications
Original article:
Ruhe, F., Olling, A., Abromeit, R., Rataj, D., Grieschat, M., Zeug, A., Gerhard, R., and Alekov, A. (2017). Overexpression of the Endosomal Anion/Proton Exchanger ClC-5 Increases Cell Susceptibility toward Clostridium difficile Toxins TcdA and TcdB. Front. Cell. Infect. Microbiol. 7.
Poster:
Uptake of Clostridium difficile toxins A and B is facilitated by the endosomal anion/proton
exchanger ClC-5. R. Gerhard, F. Ruhe, L.-A. Beer, R. Abromeit, A. Alekov
Presented at the 2nd GERMAN PHARM-TOX SUMMIT in March 2017 at Heidelberg.