Embed Size (px)
Citation preview
On the Road to SamarkandGlobalisation and the Swedish economy
Kjetil Bjorvatn
Victor Norman
Linda Orvedal
Expert report no. 21 to Sweden’s Globalisation Council
Away, for we are ready to a man!Our camels sniff the evening and are glad.Lead on, O Master of the Caravan:Lead on the Merchant-Princes of Bagdad.
Have we not Indian carpets dark as wine,Turbans and sashes, gowns and bows and veils,And broideries of intricate design,And printed hangings in enormous bales?
We have rose-candy, we have spikenard,Mastic and terebinth and oil and spice,And such sweet jams meticulously jarredAs God’s own Prophet eats in Paradise.
And we have manuscripts in peacock stylesBy Ali of Damascus: we have swordsEngraved with storks and apes and crocodiles,And heavy beaten necklaces, for Lords.
Sweet to ride forth at evening from the wellsWhen shadows pass gigantic on the sand,And softly though the silence beat the bellsAlong the Golden Road to Samarkand
James Elroy Flecker

EXPERT REPORT NUMBER 21 TO SWEDEN’SGLOBALISATION COUNCIL© THE GLOBALISATION COUNCIL 2008
AUTHOR Kjetil Bjorvatn, Victor Norman, Linda OrvedalGRAPHIC DESIGN Nina RosenkvistPRINT Edita, Västerås 2008
ISBN 978-91-85935-20-8 ISSN 1654-6245
ORDER The Globalisation CouncilPHONE +46 8 405 10 00E-MAIL [email protected]/globalisation
Preface
Globalisation has created unprecedented economic growth in South East Asia, China and India and given Russia and the countries of Eastern Europe a new start. There is still a huge potential for further economic growth. Less obvi-ous is perhaps the impact of globalisation on the Swedish economy in terms of growth and specialization.
This report applies a computable general equilibrium model in order to quantify the effects of globalisation on world markets and the implications for the Swedish econ-omy. With a fifty-year time horizon the authors focus on three important channels; trade, foreign direct investment, and migration. The authors conclude that the benefits of globalisation for a small open economy as Sweden may be equivalent to a 25 per cent increase in GDP.
However, globalisation also imposes challenges, pre-dominantly with respect to the ability to transform the economy towards a knowledge-based growth economy as a substantial part of the manufacturing sector is relocated abroad. Similarly, globalisation can be expected to widen the income distribution and foster a more geographically concentrated structure of economic activities, changes that contradict strongly rooted egalitarian traditions of the Swedish society.
The authors are currently economists at the Norwegian School of Economics and Business Administration, NHH. Kjetil Bjorvatn and Victor D. Norman are both professors of economics and Linda Orvedal is associate professor. Victor D. Norman previously served as rector at NHH and as Minister of Labour and Government Administration from 2001–2005. The authors take full responsibility for the results and the analyses presented in this report.
Stockholm, October 2008Pontus Braunerhjelm Principal Secretary, The Globalisation Council
Globalisation Council members
The Swedish Government has established a Globalisation Council to promote a deeper knowledge of globalisation issues, draw up economic policy strategies and broaden public dialogue about what needs to be done to ensure that Sweden can compete successfully in a world marked by continued rapid globalisation. The Council’s work is expected to lead to proposed measures whose purpose, broadly defined, will be to boost Sweden’s competitiveness and attractiveness on the international scene.
In addition to regular Council meetings, background reports will be written by independent researchers and other experts. These will be quality assessed by referencegroups composed of representatives from academia and the GovernmentOffices and by leading economists on the Council’s Advisory Board. The work of the Council, which must be com-pleted well before the 2010 general election, will be documented in a fi-nal report along with economic policy recommendations. Plans are also being drawn up for a number of external activities, such as conferences and seminars.
The Council comprises representatives from the business sector, the Government, social partners, the government administration, the media and the research community. It is chaired by the Minister for Education and Research, Lars Leijonborg. The Principal Secretary is Pontus Brauner-hjelm. The other members are:
• Kristina Alsér, Mercatus Engineering AB, County Governor, Kronoberg County• Hans Bergström, columnist and reader in political science• Carl Bildt, Minister for Foreign Affairs• Urban Bäckström, Director-General, Confederation of Swedish Enterprise• Lars Calmfors, professor of international economics• Per Carstedt, CEO, SEKAB Group• Dilsa Demirbag-Sten, journalist, author• Anna Ekström, Chair, Swedish Confederation of Professional Associations• Sven Otto Littorin, Minister for Employment• Wanja Lundby-Wedin, President, Swedish Trade Union Confederation (LO)• Karin Markides, President, Chalmers University of Technology• Elisabeth Nilsson, President, Swedish Steel Producers’ Association• Aina Nilsson Ström, Head of Design, AB Volvo• Sture Nordh, Chair, Swedish Confederation of Professional Employees (TCO)• Mats Odell, Minister for Local Government and Financial Markets• Maud Olofsson, Minister for Enterprise and Energy and Deputy Prime Minister• Carl-Henric Svanberg, President and CEO, Ericsson• Lena Treschow Torell, professor of physics, Royal Swedish Academy of Engineering
Sciences (IVA)• Harriet Wallberg-Henriksson, President, Karolinska Institutet• Marcus Wallenberg, Chair, International Chamber of Commerce (ICC)• Olle Wästberg, Director-General, Swedish Institute

Table of contents
1. Introduction and summary 6
2. The channels of globalisation 17 2.1 China and India 17 2.2 The three channels 20 3. Modeling the forces of globalisation 26 3.1 China, India and the world economy 27 3.2 Migration 38 3.3 Foreign direct investment 40
4. Effects on the Swedish economy 42 4.1 The SEK model 44 4.2 The globalisation scenario 51 4.3 Effects on the supply of labour and capital 52 4.4 Effects on industrial structure and the external economy 54 4.5 Effects on wages and real income 58
5. Appendix 1 Data set 61
6. Appendix 2 Description of the SEK model 62
References 73
6 • EXPERT REPORT NO. 21 TO SWEDEN’S GLOBALISATION COUNCIL
1. Introduction and summary
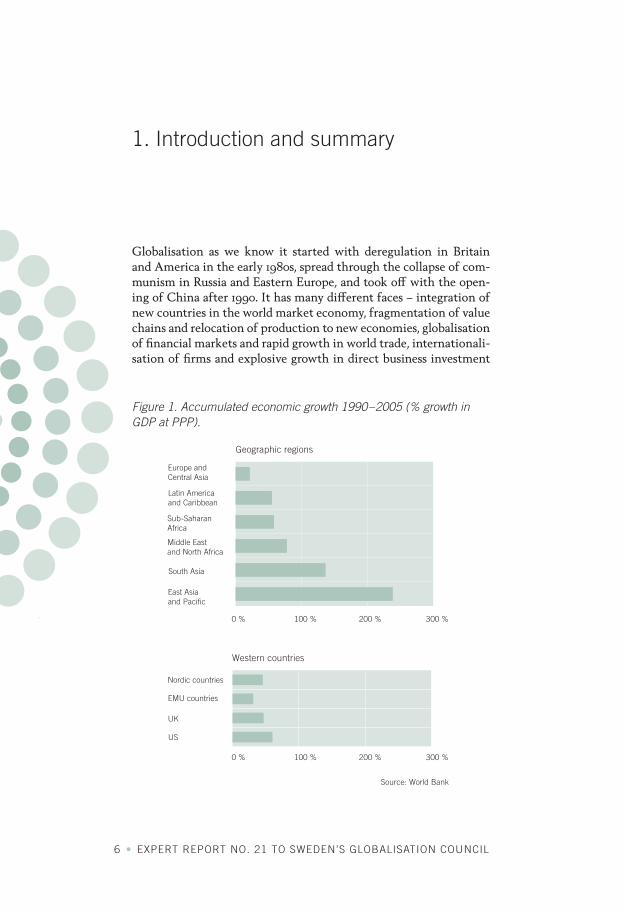
Globalisation as we know it started with deregulation in Britain and America in the early 1980s, spread through the collapse of com-munism in Russia and Eastern Europe, and took off with the open-ing of China after 1990. It has many different faces – integration of new countries in the world market economy, fragmentation of value chains and relocation of production to new economies, globalisation of financial markets and rapid growth in world trade, internationali-sation of firms and explosive growth in direct business investment
Geographic regions
Western countries
Source: World Bank
Europe and Central Asia
Latin Americaand Caribbean
Sub-Saharan Africa
Middle Eastand North Africa
South Asia
East Asia and Pacific
0 % 100 % 200 % 300 %
0 % 100 % 200 % 300 %
Nordic countries
EMU countries
UK
US
Figure 1. Accumulated economic growth 1990–2005 (% growth in GDP at PPP).
ON THE ROAD TO SAMARKAND • 7
across national boundaries, and (on a lesser scale) migration of work-ers and students seeking job and educational opportunities in other countries.
So far, globalisation has created unprecedented economic growth in South East Asia, China and India and given Russia and the coun-tries of Eastern Europe a new start – and it has done so without any indications of negative effects for the rest of the world. On the con-trary, the developing countries outside Asia have also experienced relatively rapid economic growth, with growth rates well in excess of those in the traditionally industrialised countries, so there is no reason to believe that China and the other Asian countries have crowded out other developing nations. When it comes to the OECD countries, the track record differs. Some, like the US and the Nordic countries, have maintained equal or higher growth rates than before, while others – Japan and Germany are examples – have struggled. The problems in the low-growth countries seem to have little to do with globalisation, however. All told, the record so far confirms that globalisation – as we should expect from economic theory – is a pos-itive-sum game.
We have probably only seen the early stages of the process of glo-balisation. There is still, given the size of their labour force, a huge potential for further economic growth in China and India; there is a corresponding potential in those developing countries which have not yet taken off; and there are very large potential benefits to be reaped from the internationalisation of Western firms and markets that are still largely national.
1.1 Analysing globalisation and its effects on Sweden
In this report, we quantify the effects of globalisation on world mar-kets and analyse the implications for the Swedish economy. We take a long view, with a fifty-year time horizon and a focus on underlying, long-term trends. The actual developments in the world economy are certain to deviate from the trends that we identify – there will be ordinary business cycles; with rapid growth in new economies there are likely to be financial bubbles with implications for the real economy; and there could be political turmoil affecting the pace of global integration. We believe that it is particularly important to
8 • EXPERT REPORT NO. 21 TO SWEDEN’S GLOBALISATION COUNCIL
Worldmarketprices
GLOBSIMA model of OECD marketsand China-India trade
Swedishbusinessinvestmentabroad
SEKA model of the Swedisheconomy
Labourmigrationto Sweden
know something about underlying trends in the turbulent environ-ment that is typical of day-to-day changes in a globally integrated world economy.
We concentrate on three channels of globalisation – the integra-tion of China and India into the world economy, the internationali-sation of firms and growth in cross-border business investment, and the migration of workers between Eastern and Western Europe. The general implications of each of these, and the particular effects they will have on the Swedish economy, are quantified in specialised nu-merical models. In doing so, we isolate the effects of globalisation, by using as our point of reference a steady-state equilibrium without globalisation – a growth path where Western economies save and in-vest just enough to maintain their capital stock and educational lev-el, where technological progress (if any) does not affect the balance between different sectors in the economies, and where China-India trade, the stocks of cross-border business investments, and the number of labour migrants are fixed at the pre-globalisation levels.
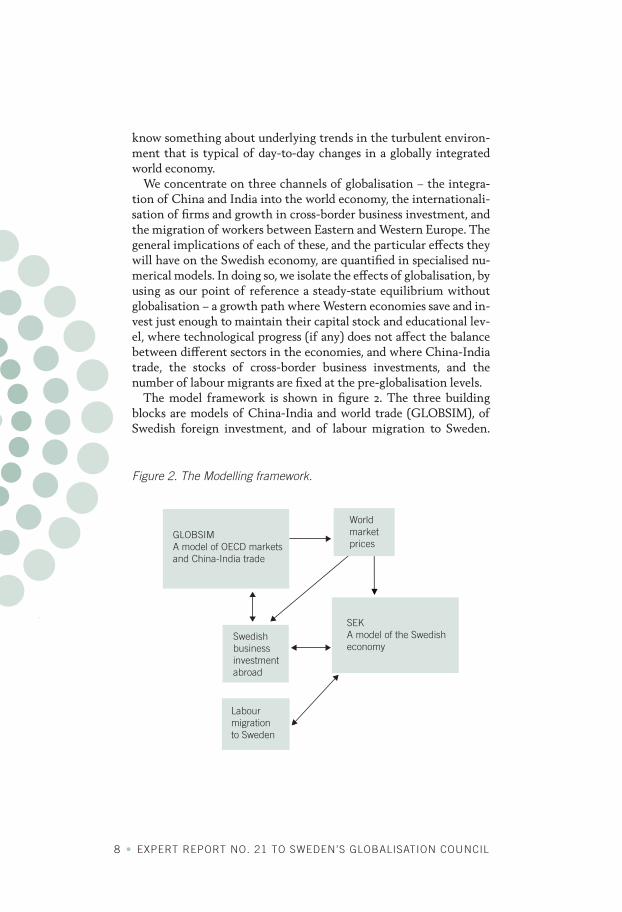
The model framework is shown in figure 2. The three building blocks are models of China-India and world trade (GLOBSIM), of Swedish foreign investment, and of labour migration to Sweden.
Figure 2. The Modelling framework.
ON THE ROAD TO SAMARKAND • 9
These are used to generate input to a model of Swedish industry and the Swedish economy. In the case of GLOBSIM, the input is the trend in world market prices that follows from further integration of China and India in the world economy; in the case of direct busi-ness investment, the input is the growth in Swedish business abroad that follows from world market growth; and when it comes to labour migration, the input is the flow of immigrants from Eastern Europe that will come under specific assumptions about changes in income opportunities in their home countries. Swedish foreign investment and labour migration will, of course, also depend on conditions in Sweden, so the two submodels for investment and migration inter-act with the model of the Swedish economy.
1.2 World market effects of globalisation
Despite record growth in production and exports over the past 15–20 years, it is still the case that only a modest share of the working pop-ulation in China and India work in the modern market economies which are integrated in the world economy. As the share continues to grow, we could see a doubling of the labour force in the integrated world economy over the next fifty years. If so, China and India will take over most of labour-intensive production – which in practice means most of traditional manufacturing – textiles and clothing, shipbuilding, production of cars, other motor vehicles, electronics and other light manufactures.
Will China and India take over all of light manufacturing? The answer is no. Even though the labour force in China and India is large, it is limited; so the two countries will not have sufficient capac-ity to satisfy the entire world demand for labour-intensive products. The total production of labour-intensive products in the world will be 60-70 per cent higher by 2060 than it is today. The entire increase will come from China and India, and they will also crowd out 70 per cent or so of the 1990 OECD production of such products. In that sense, the competition we have seen from China and India so far is only the beginning. Even so, a significant share of labour-intensive production will remain in the OECD area.

10 • EXPERT REPORT NO. 21 TO SWEDEN’S GLOBALISATION COUNCIL
At the same time, growth in China and India will create corre-spondingly large, new market opportunities for OECD producers of capital-intensive goods and services – products that require large physical investments, goods that require large investments in R&D, and goods and services which require highly educated labour and thus are intensive in the use of human capital.
As China and India expand in labour-intensive sectors, and the OECD countries shift resources to capital-intensive production, there will be less effective scarcity of labour in the OECD area and increased scarcity of labour in China and India. As a result, wages will converge – OECD wages (for unskilled workers) will decline, and wages will rise in China and India.
A key question is at what level they will converge. Will Western workers have to accept wages at the Chinese level, or will workers in China and India catch up with their OECD colleagues? Our answer is the latter. As is seen from figure 3, the long-term future wage level both in the OECD area and in China and India will be close to the initial OECD level. The reason is twofold. First, China and India will
6
5
4
3
2
1
0
2000 2020 2040 2060
OECDChina-India
Figure 3. Wage equalization.
ON THE ROAD TO SAMARKAND • 11
catch up with us when it comes to labour productivity. That has to some extent happened already, and there can be little doubt that the productivity differential will disappear as they gain further experi-ence. Second, the China-India effect will raise world income, some of which will be saved. This will gradually bring the world economy towards a new steady-state growth path, with a higher accumulated stock of capital. This globalisation-induced capital accumulation will raise labour productivity both in China-India and the OECD area, and thus counteract the negative effect on OECD wages of competition from China and India.
The real question, therefore, is how capital accumulation and the phasing-in of Chinese-Indian labour interact – particularly how rap-id capital accumulation will neutralise the wage effects of growth in China and India. Our simulations show that there will be a turning point around 2030. By then, the OECD wages will have to be almost 10 per cent lower than initially to ensure full employment. From then on, however, globalisation will permit wage growth again in the OECD countries.
When interpreting these figures, it is important to note that they do not incorporate the effect of general productivity growth that will follow from technical progress. The reference path is a steady state without technical progress. That path will be the same if we include general (sector-neutral) technological improvements – all that is needed is to rescale absolute prices and production levels to reflect better technology. If, for example, we expect 25 per cent high-er productivity in 2030 as a result of better technology, that 25 per cent can simply be added on to the 2030 wage level in figure 3 to ob-tain the equilibrium wage levels in that year – for the OECD area, that would give a wage which is roughly 15 per cent higher than the initial level.
12 • EXPERT REPORT NO. 21 TO SWEDEN’S GLOBALISATION COUNCIL
1.3 Sweden: Effects and challenges
Globalisation will have dramatic effects on the Swedish economy – and by and large, positive ones. The entry of China and India into the world economy has already benefited Swedish consumers and will continue to do so on an even larger scale in the decades ahead. The gains from trade with the Asian giants give additional indirect gains by (a) stimulating saving and investment and (b) shifting Swedish resources into knowledge-intensive activities, both of which will generate higher economic growth. At the same time, the integration of Eastern Europe means that Sweden will attract a large number of guest workers; and although most of these are likely to leave again, they will leave behind a permanent, positive influence. Continued internationalisation and more rapid growth in the OECD area will also make Swedish firms invest abroad to an even greater extent and at a more rapid pace than they have done in the past, and this foreign direct investment will contribute positively to the Swedish economy both through direct returns on the investments and through posi-tive feed-back to knowledge-intensive production in Sweden.
Growth bonusExtra educationDirect effect
30 %
25 %
20 %
15 %
10 %
5 %
0 %
2020 2035 2050
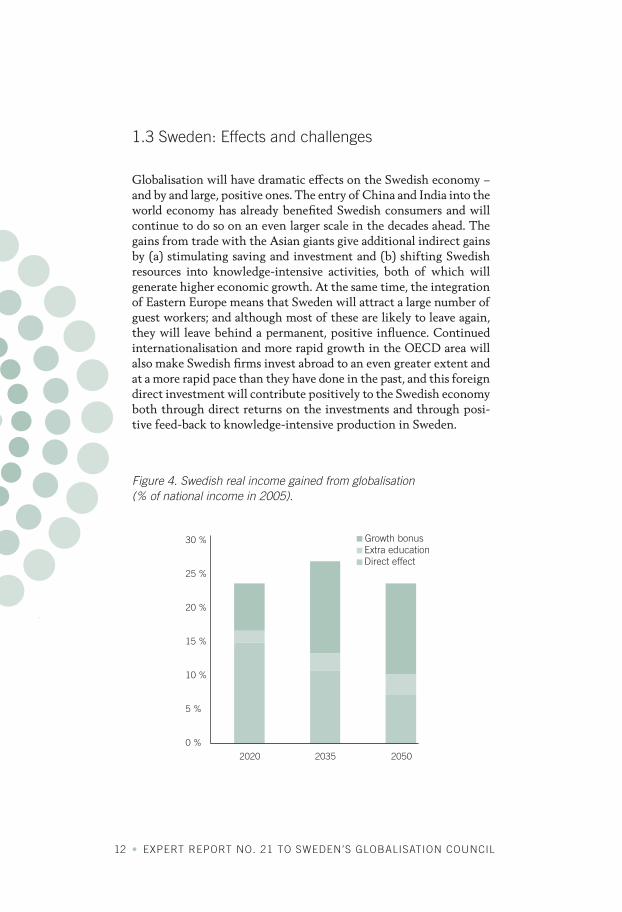
Figure 4. Swedish real income gained from globalisation (% of national income in 2005).
ON THE ROAD TO SAMARKAND • 13
A particularly noteworthy effect is that globalisation will stimu-late knowledge-intensive production in Sweden and thus lead to an increase in the demand for highly educated people. As a conse-quence, it will become more attractive to undergo higher education and more young people will choose to do so.
The total gain to the Swedish economy could, as shown in figure 4, be as large as 25 per cent. Initially, more than half the gain comes directly in the form of improved terms of trade, increased produc-tion from immigrant workers and higher returns on capital as Swed-ish firms are internationalised. Over time, the direct effects taper off, but this is more than offset by the induced, indirect effects through the stimulus that globalisation gives to saving and invest-ment in education.
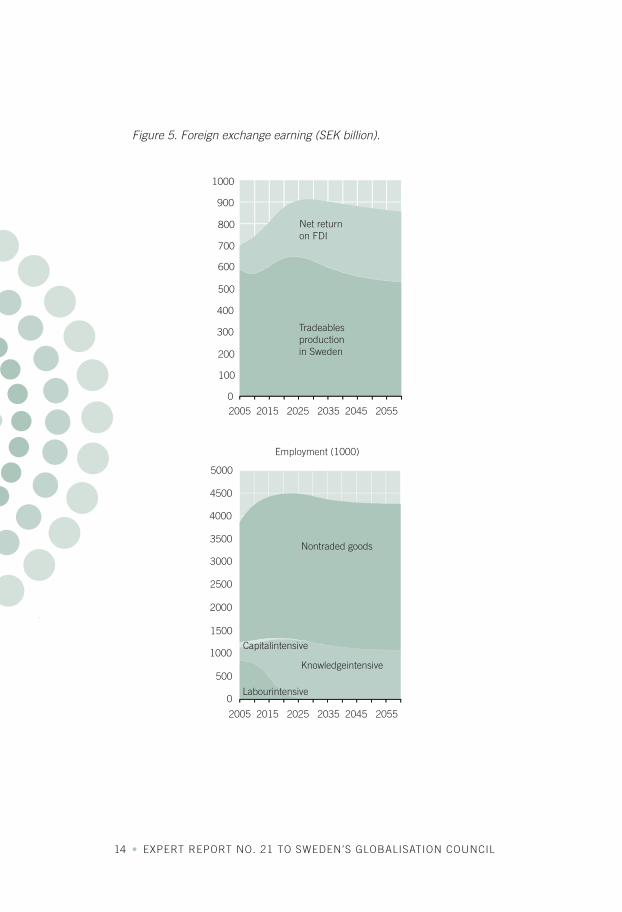
Although the effects are positive in most respects, they pose chal-lenges. The most fundamental challenge is adaptability. In order to exploit the opportunities that globalisation offers, Swedish resourc-es must – as shown in figure 5 – be shifted from manufacturing in Sweden to manufacturing activities abroad, to knowledge-based ex-port production, and to service production at home. To some extent, that can happen within currently existing firms. It is difficult, how-ever, to envisage – given the scale of the transformation – that intra-firm restructuring can account for more than a modest fraction. Most will have to occur through the establishment of new firms, through growth in currently small firms, and through foreign busi-ness investment in Sweden. To make that happen will require poli-cies that facilitate structural change, strengthen the educational sys-tem as an attractive knowledge base for new and existing firms, and encourage inwards and outwards direct business investment.
Restructuring also means that many Swedish wage earners must change jobs, and that more Swedish students must undergo higher education. The first poses a challenge to job market and welfare policies – with the Nordic welfare system, there is always a danger that people who lose their jobs end up on long-term benefits in-stead. The second requires a system of higher education which functions well not only for the top 10–20 per cent of the student body but for all students.
Because adaptability depends crucially on industrial policy, the educational system, and on R&D and tax policy, the most important question in this respect is whether Swedish policy makers are suffi-ciently adaptable. We suspect that the answer depends on the extent to which they understand the need for change and the nature of it.
14 • EXPERT REPORT NO. 21 TO SWEDEN’S GLOBALISATION COUNCIL
1000
900
800
700
600
500
400
300
200
100
0
2005 2015 2025 2035 2045 2055
2005 2015 2025 2035 2045 2055
Tradeablesproductionin Sweden
Net returnon FDI
5000
Employment (1000)
4500
4000
3500
3000
2500
2000
1500
1000
500
0
Nontraded goods
Knowledgeintensive
Labourintensive
Capitalintensive
Figure 5. Foreign exchange earning (SEK billion).
ON THE ROAD TO SAMARKAND • 15
To the extent that Swedish policy makers continue to think of Sweden as a largely industrial nation earning foreign exchange through exports of manufactured goods, they are unlikely to react correctly. If, however, they see and understand what internationalisation really implies, experience suggests that they have the innovative capacity to formulate policies that encourage structural change.
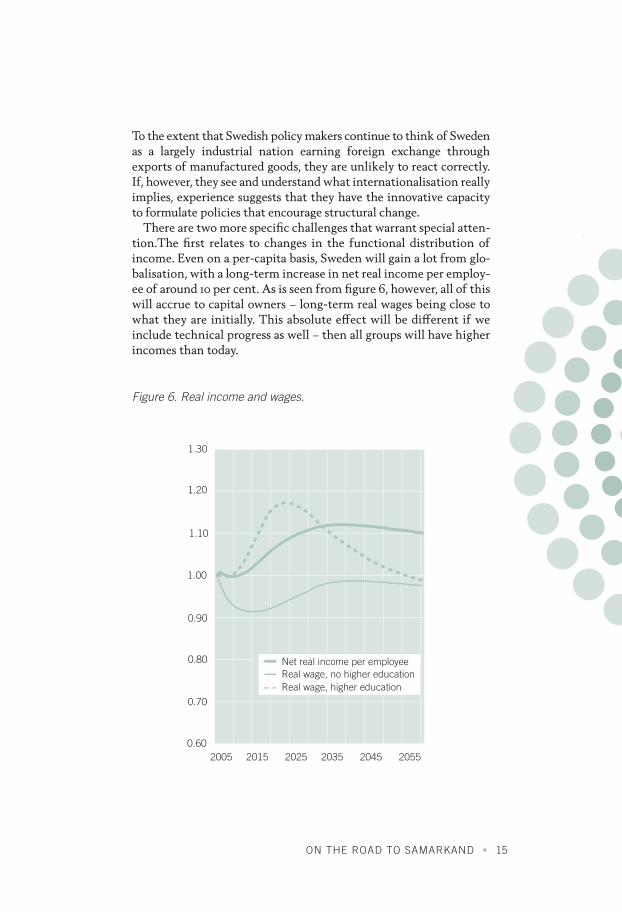
There are two more specific challenges that warrant special atten-tion.The first relates to changes in the functional distribution of income. Even on a per-capita basis, Sweden will gain a lot from glo-balisation, with a long-term increase in net real income per employ-ee of around 10 per cent. As is seen from figure 6, however, all of this will accrue to capital owners – long-term real wages being close to what they are initially. This absolute effect will be different if we include technical progress as well – then all groups will have higher incomes than today.
1.30
1.20
1.10
1.00
0.90
0.80
0.70
0.602005 2015 2025 2035 2045 2055
Net real income per employeeReal wage, no higher educationReal wage, higher education
Figure 6. Real income and wages.
16 • EXPERT REPORT NO. 21 TO SWEDEN’S GLOBALISATION COUNCIL
The relative picture will, however, be the same – globalisation will lead to a significant redistribution of income from wage earners to capital owners.
As many capital owners are at the top end of the income distribu-tion, and as most of those at the bottom end are wage earners, the result is likely to be greater inequality in pre-tax incomes. For a country that has traditionally put so much emphasis on equality, greater inequality could threaten social cohesion and political stabil-ity. The effect can be neutralised through changes in the tax system – with lower tax rates on wage income and higher tax rates on capi-tal and capital income – but international mobility of firms and cap-ital constrains the extent to which this can be done without incur-ring high costs. Sweden could, therefore, face a difficult trade-off between domestic equality on the one hand, and encouragement of inward and outward direct investment on the other hand.
The other specific challenge concerns the geographical distribu-tion of economic activity in Sweden. Much of the traditional produc-tion of traded goods will disappear as the result of globalisation, and the new tradeables production will be largely knowledge-intensive – likely to be located in areas with an abundance of highly educated labour. As traditional manufacturing in Sweden is typically located outside the Stockholm area, while highly educated people tend to converge on Stockholm, this could induce further centralisation.
ON THE ROAD TO SAMARKAND • 17
2. Channels of globalisation
China and India’s integration into the world economy is the driving force of today’s globalisation, and a major contributor to the strong growth in international trade and investment during the last dec-ades. Together with the growing labour migration from new member states of the European Union, these developments are likely to have a significant impact on the structure of production, income levels and income distribution, and by that, the structure of our societies. As a background to the analysis of the consequences of globalisa-tion on the Swedish economy later in this report, this chapter gives a brief overview of the development in China and India, and theo-ries of foreign direct investment and migration.
2.1 China and India
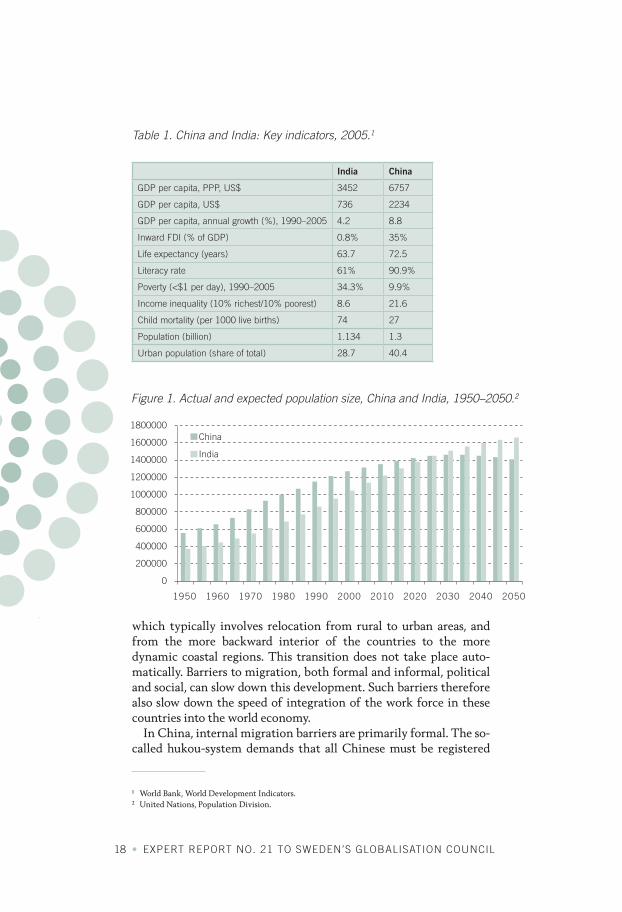
China and India are today two of the world’s fastest growing econo-mies. During the last 25 years, the two countries have opened up their markets for international trade and investment. Before the re-forms, which for China’s part took place in the late 1970s and for India’s part ten years later, both countries had an expressed ambition of national, and partly also regional, autarky. Today, China is one of the most open developing countries in the world. India, too, has drastically torn down its tariff barriers and liberalised the rules regu-lating foreign direct investment. The significance of the progress in China and India is magnified by the fact that these are the two most populous countries in the world, with 1.3 and 1.1 billion inhabitants, respectively.
The opening up of these two economies constitutes a radical in-crease in the availability of labour to the world economy. Integration of the workforce into the world economy takes place as workers move from low productive activities to high productive activities,
18 • EXPERT REPORT NO. 21 TO SWEDEN’S GLOBALISATION COUNCIL
which typically involves relocation from rural to urban areas, and from the more backward interior of the countries to the more dynamic coastal regions. This transition does not take place auto-matically. Barriers to migration, both formal and informal, political and social, can slow down this development. Such barriers therefore also slow down the speed of integration of the work force in these countries into the world economy.
In China, internal migration barriers are primarily formal. The so-called hukou-system demands that all Chinese must be registered
Figure 1. Actual and expected population size, China and India, 1950–2050.2
1800000
1600000
1400000
1200000
1000000
800000
600000
400000
200000
0
China
India
1950 1960 1970 1980 1990 2000 2010 2020 2030 2040 2050
Table 1. China and India: Key indicators, 2005.1
1 World Bank, World Development Indicators.2 United Nations, Population Division.
India China
GDP per capita, PPP, US$ 3452 6757
GDP per capita, US$ 736 2234
GDP per capita, annual growth (%), 1990–2005 4.2 8.8
Inward FDI (% of GDP) 0.8% 35%
Life expectancy (years) 63.7 72.5
Literacy rate 61% 90.9%
Poverty (<$1 per day), 1990–2005 34.3% 9.9%
Income inequality (10% richest/10% poorest) 8.6 21.6
Child mortality (per 1000 live births) 74 27
Population (billion) 1.134 1.3
Urban population (share of total) 28.7 40.4
ON THE ROAD TO SAMARKAND • 19
with permanent residency in a given location. Usually, children will inherit their mothers’ hukou, and it is in most cases extremely diffi-cult to change one’s legal residency status. An urban hukou is highly valued, since it gives the right to the cities’ more developed job mar-kets, social security systems and food subsidies.
“Hukou, in essence, enforces occupational apartheid on a huge scale. Anyone in a rural county is automatically registered as a farmer, any-one in a city as a non-farmer; and the distinction is near rigid... Al-though country people, especially the young, flock to the cities in search of work, they cannot take advantage of the municipal services available. These “migrant” workers sleep in shanty-towns or on build-ing sites, and must return to their county to marry.”
The Economist (12 February 1998).
There has been a gradual liberalisation of the rules of residency in the last three decades. Today, it is possible to live in a city even without an urban hukou. Moreover, buying and selling of hukous has become possible. But there are still large numbers of people in the cities with very limited legal rights. These are often referred to as the ‘floating population’, typically young men with an ambition to make enough money to return to the rural areas and establish a family there.
1000
900
800
700
600
500
400
300
200
100
01975 1980 1985 1990 1995 2000 2005
Migration (stock)
GNP
Exports
FDI (stock)
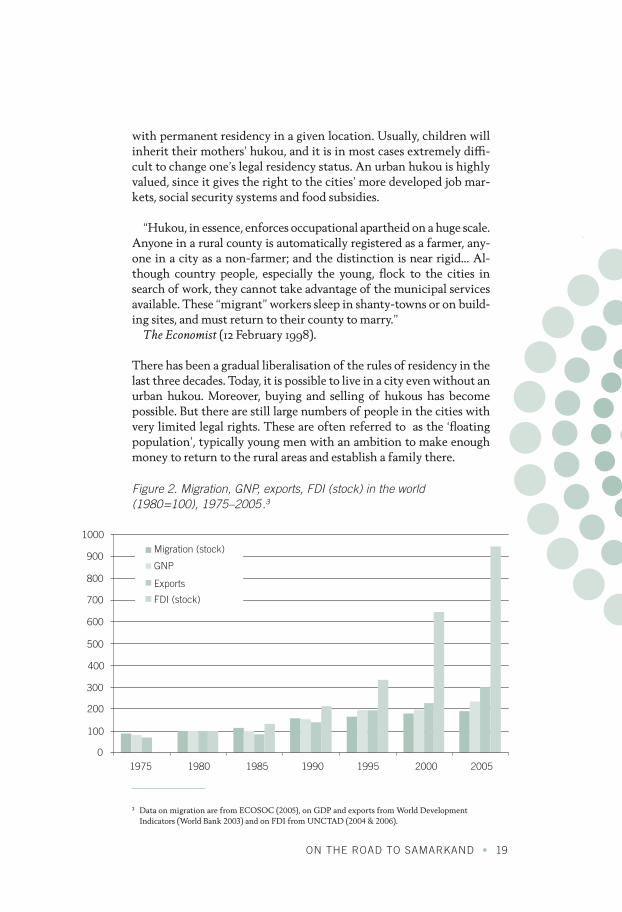
Figure 2. Migration, GNP, exports, FDI (stock) in the world (1980=100), 1975–2005.3
3 Data on migration are from ECOSOC (2005), on GDP and exports from World Development Indicators (World Bank 2003) and on FDI from UNCTAD (2004 & 2006).
20 • EXPERT REPORT NO. 21 TO SWEDEN’S GLOBALISATION COUNCIL
In India, barriers to mobility are primarily informal, and defined by the caste system. As emphasized by Munshi and Rosenzweig (2006, page 1): “India stands out for its remarkably low levels of occupational and geographic mobility.” The caste system prevents people from moving from their traditional occupations in rural areas to sectors of growth in the urban areas. This implies that large differ-ences in income, between regions and occupations, can be sustained over time, with only limited pressure from migration and restruc-turing. In addition to the caste system (but of course related to it), the larger share of poor and uneducated people in India as compared to China, in itself serves as an impediment to mobility and growth. Linguistic barriers are also more likely to be more important in India than in China.
2.2 The three channels
Globalisation works through three important channels; trade, for-eign direct investment, and migration. Figure 2 shows how these three channels of globalisation have developed since 1975, also add-ing the development of Gross Domestic Product (GDP) as a refer-ence indicator.
The figure shows how globalisation has accelerated since the 1990s. It is no coincidence that this development coincides with the open-ing up of the Chinese economy to the world economy in the 1990s. The figure also shows that FDI is the channel of globalisation that has had by far the most rapid growth. In fact, the stock of FDI has increased almost tenfold since 1980.
Historically speaking, globalisation is not a new phenomenon. For instance, driven by liberalisation and falling transportation costs, there was a substantial growth in trade, investment and migration in the period prior to the First World War. As a consequence, interna-tional prices, both of outputs and inputs, converged in this period (O’Rourke and Williamson, 1999 & 2002). A second wave of globali-sation started in the interim period between the First and Second World Wars. International investment grew substantially. According to O’Rourke (2002), not until 1990 did the importance of FDI (meas-ured as a share of GDP) reach its 1913 level.
ON THE ROAD TO SAMARKAND • 21
Foreign direct investment is typically categorised as ‘horizontal’ and ‘vertical’. Horizontal FDI is market seeking, the main objective of the investment being to reduce transaction costs by locating pro-duction closer to customers. Vertical FDI is factor seeking, the main motive typically being to access the host country’s cheap (and/or perhaps well-qualified) labour force.
Foreign direct investment can also be divided into mergers and ac-quisitions and investment in new production capacity, so-called ‘greenfield investment’. While greenfield investments dominated in the 1970s, the strong global increase in FDI during the 1980s and 1990s came in the form of mergers and acquisitions. (UNCTAD, World Investment Report, 2007).
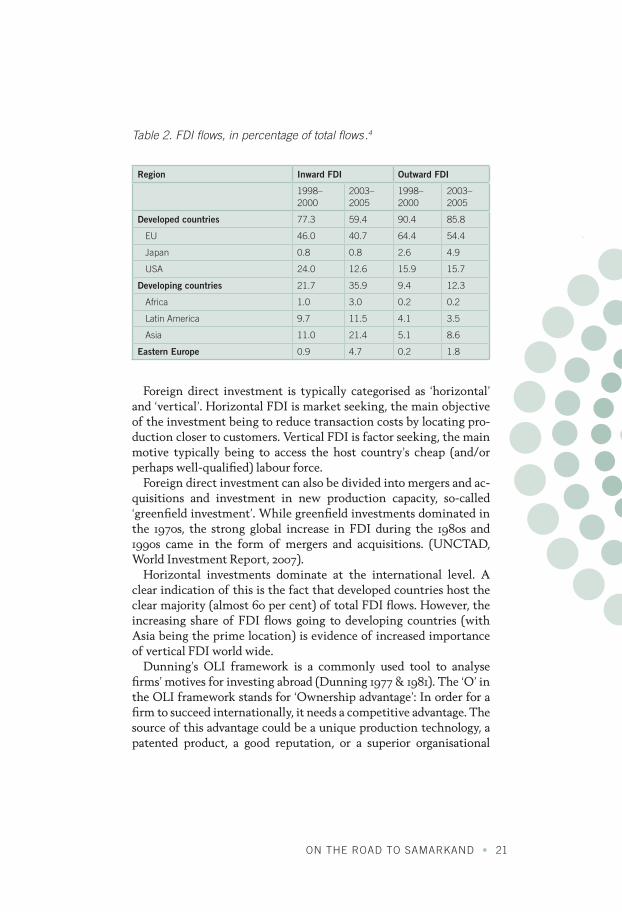
Horizontal investments dominate at the international level. A clear indication of this is the fact that developed countries host the clear majority (almost 60 per cent) of total FDI flows. However, the increasing share of FDI flows going to developing countries (with Asia being the prime location) is evidence of increased importance of vertical FDI world wide.
Dunning’s OLI framework is a commonly used tool to analyse firms’ motives for investing abroad (Dunning 1977 & 1981). The ‘O’ in the OLI framework stands for ‘Ownership advantage’: In order for a firm to succeed internationally, it needs a competitive advantage. The source of this advantage could be a unique production technology, a patented product, a good reputation, or a superior organisational
Region Inward FDI Outward FDI
1998–2000
2003–2005
1998–2000
2003–2005
Developed countries 77.3 59.4 90.4 85.8
EU 46.0 40.7 64.4 54.4
Japan 0.8 0.8 2.6 4.9
USA 24.0 12.6 15.9 15.7
Developing countries 21.7 35.9 9.4 12.3
Africa 1.0 3.0 0.2 0.2
Latin America 9.7 11.5 4.1 3.5
Asia 11.0 21.4 5.1 8.6
Eastern Europe 0.9 4.7 0.2 1.8
Table 2. FDI flows, in percentage of total flows.4
22 • EXPERT REPORT NO. 21 TO SWEDEN’S GLOBALISATION COUNCIL
structure. The advantage must more than compensate the firm for the disadvantages involved in competing in a foreign environment.
A competitive advantage can be employed in various ways. For the firm to choose FDI, there must be some advantages associated with locating production abroad. This is the ‘L’ in Dunning’s OLI synthe-sis; the ‘Location advantage’. There are different types of location advantages. One form can be low wages, serving as a motive for verti-cal FDI. The lion’s share of FDI to China has (at least up to now) been motivated by the country’s cheap labour. Large endowment of highly skilled personnel can also constitute a location advantage. When information technology multinationals cluster in high-tech centres in India, access to the country’s large supply of highly skilled (and of course relatively low-cost) computer experts is the main at-traction. A large and growing market is a powerful attraction for market-seeking investors.
The ‘I’ in the OLI framework stands for ‘Internalisation advan-tage’: A firm that is internationally competitive and wishes to pro-duce abroad can organise this production in different ways. The pro-duction unit abroad does not necessarily have to be owned by the firm in question. An alternative to FDI is ‘outsourcing’ (which in an international context is often called ‘offshoring’) where at least part of the production process is contracted out to another firm. In order for a firm to choose FDI, there must be some advantages associated with internationalising production through direct ownership. The most important advantage of internalisation is that this gives a greater measure of control to the investing firm. This, in turn, can reduce transaction costs. Particularly in countries with weak prop-erty rights protection, keeping things in house can be important.
To summarise: The OLI framework tells us that a firm will choose FDI only if the following three conditions are satisfied: (i) The firm is internationally competitive; (ii) it chooses to locate (some of the) production abroad; and (iii) it wishes to exercise control over the foreign operations through ownership.
ON THE ROAD TO SAMARKAND • 23
International migration
Migration has traditionally played an important role in globalisa-tion processes. At the end of the 19th and the beginning of the 20th century, millions of Europeans migrated to the ‘new world’. For in-stance, annual emigration from Norway during the period 1870–1910 was 0.53 per cent of the total population, resulting in a cumulative reduction in population size of 19 per cent. Since most emigrants were working-age men, the impact on the economy was even more significant. As a share of the total work force, emigration repre-sented a reduction of 0.7 per cent per year, resulting in a cumulative reduction in the work force of almost 25 per cent in this time period (Taylor & Williamson, 1997:29).
These numbers stand in stark contrast to migration flows in to-day’s globalisation process. O’Rourke (2002:72) claims that the stock of immigrants (defined as the number of people born in another country) in the world has been stable at around 2.3 per cent of the world population during the period 1965 to 1990. More restrictive immigration policies are naturally an important reason for this ob-servation. However, this is not likely to be the full explanation. For how shall we explain the substantial reduction in migration flows between European countries after the 1970s, a development that took place despite the formation of a common European labour mar-ket? This is the question that Faini and Venturini (2001) address in their article “Home bias and migration: Why is migration playing a marginal role in the globalization process?” In the following, we study briefly the main idea and main results from this article.
Which factors determine migration decisions in an integrated la-bour market? And in particular: What impact do wage and income levels in the source country have?
Faini and Venturini formulate a theoretical model to analyse these questions. There are two main ingredients in this model. First, there is an assumption of ‘home bias’ in the preferences. Second, there are certain fixed costs associated with migration. Together with credit rationing, the fixed migration costs imply that not everyone who wants to emigrate can afford to do so. The first effect implies that when the income level in the home country increases, more people can afford not to emigrate and will therefore choose to stay. This is true irrespective of the wage gap between home and abroad. More formally, cultural goods, which can only be consumed in the home
24 • EXPERT REPORT NO. 21 TO SWEDEN’S GLOBALISATION COUNCIL
country, enter the utility function on line with other goods. As long as the cultural goods are normal goods, increased income will lead to less emigration.
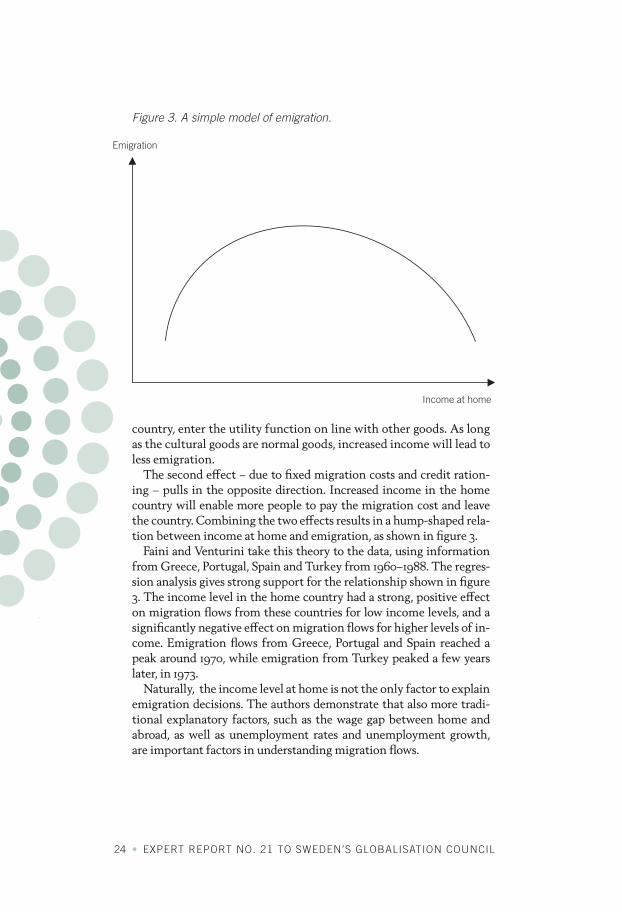
The second effect – due to fixed migration costs and credit ration-ing – pulls in the opposite direction. Increased income in the home country will enable more people to pay the migration cost and leave the country. Combining the two effects results in a hump-shaped rela-tion between income at home and emigration, as shown in figure 3.
Faini and Venturini take this theory to the data, using information from Greece, Portugal, Spain and Turkey from 1960–1988. The regres-sion analysis gives strong support for the relationship shown in figure 3. The income level in the home country had a strong, positive effect on migration flows from these countries for low income levels, and a significantly negative effect on migration flows for higher levels of in-come. Emigration flows from Greece, Portugal and Spain reached a peak around 1970, while emigration from Turkey peaked a few years later, in 1973.
Naturally, the income level at home is not the only factor to explain emigration decisions. The authors demonstrate that also more tradi-tional explanatory factors, such as the wage gap between home and abroad, as well as unemployment rates and unemployment growth, are important factors in understanding migration flows.
Emigration
Income at home
Figure 3. A simple model of emigration.
ON THE ROAD TO SAMARKAND • 25
It may be interesting to compare the 2004 expansion of the EU to the east with the expansions to the south in the 1980s, when Greece, Portugal and Spain joined the Union. In terms of population size, the two expansions are relatively similar. In both cases, the expan-sion increased the population of the Union by around 20 per cent. However, an important difference is the fact that the countries of the more recent expansion are much poorer relative to the estab-lished member countries, compared to the case of Greece, Portugal and Spain in the 1980s. In 1981, the purchasing power parity adjusted average income of these countries constituted 65 per cent of the EC average. For today’s newcomers, the corresponding number is only 45 per cent. The larger income gap should imply a greater potential for migration flows in Europe than we have seen from previous expan-sions of the Union.
To summarise: The migration decision is a trade-off between costs and benefits. The income gap between Eastern and Western Europe is substantial, and represents a powerful motive for migration flows. But migration decisions are complicated. The previous expansions of the European Community southwards have demonstrated that, contrary to some predictions at the time, substantial wage gaps do not necessarily lead to large migration flows. In general, people pre-fer to live in their home countries, and if they can afford to do so, they will. Moreover, for poor people, the migration costs can be pro-hibitively high. A more complete model of migration flows must therefore not only take into account the income gap between source and potential destination countries, but also the absolute income level in the source country.
26 • EXPERT REPORT NO. 21 TO SWEDEN’S GLOBALISATION COUNCIL
3. Modelling the forces of globalisation
The three channels of globalisation – trade, migration and direct investment – will affect different countries in different ways. For Sweden and the other small, open economies in Northern Europe, increased trade with China and India is important not so much through the direct trading opportunities it provides as through the effect that China and India will have on world market prices. It should not really matter much to Swedish consumers whether the clothing they buy is produced in China or Italy – the important thing is that competition from China has made clothing cheap wherever it is pro-duced. Migration, which was historically so important to the Nordic countries as a vent for surplus labour, is now primarily important as a source of extra labour. Internationalisation of firms through foreign direct investment, on the other hand, is primarily important because of the new opportunities open to Nordic firms. More foreign invest-ment in these countries will, of course, also be beneficial; but to coun-tries like Sweden and Norway, inward foreign investment has always been important, so in that particular respect, the current globalisation wave does not represent anything fundamentally new.
To assess the impact of globalisation on the Swedish economy, therefore, we must focus on (a) the effect of China and India on world markets and world market prices, (b) the potential labour migration – particularly from Eastern Europe – to Sweden, and (c) the potential growth in direct foreign investment by Swedish firms.
Figure 1 shows the approach we take to analyse these forces and translate them into effects for the Swedish economy. The idea is to use small, specialised models for each of the three forces to generate input to – and interact with – a larger model of the Swedish econo-my. The effects of China and India on world trade and prices are ana-lysed in GLOBSIM, a model of global comparative advantage, trade and growth based on the Heckscher-Ohlin theory of international trade and on the Solow model of economic growth.
This model generates paths for international product and factor prices. Swedish FDI is analysed in a submodel based on the Dunning

ON THE ROAD TO SAMARKAND • 27
OLI framework for multinational and international business; and migration to Sweden is modelled based on recent international work on the determinants of labour mobility. The results are translated into effects for Sweden in a general-equilibrium model (SEK) of Swedish production, capital accumulation, investment and trade.
The models are described in detail in the appendix. The purpose of this chapter is to give an intuitive guide to the models of the three forces and show how we use them in our analysis. The effects on the Swedish economy are presented in chapter 3, which also contains a presentation and guide to the SEK model.
3.1 China, India and the world economy
The first, and most important, aspect of globalisation is the integra-tion of China and India in the world economy. How will that affect us? Will they take over most of our industrial production? Will they force Western wages down to a fraction of what they are today? Will they generate permanently higher economic growth in the world?
GLOBSIMA Heckscher-Ohlin-Solow-modelfor China-India and the OECD
Prices
FDIfromSweden
Migrationto Sweden
SEKA Ricardo-VinerHeckscher-OhlinSolow-model forthe Swedish economy
Figure 1. The Modelling framework.
28 • EXPERT REPORT NO. 21 TO SWEDEN’S GLOBALISATION COUNCIL
To answer questions of this type, we first need an idea of the mag-nitudes involved. How large will the open, market-based parts of the Chinese and Indian economies become? Will they remain relatively (by Chinese and Indian standards) small enclaves in otherwise closed economies, or will they ultimately comprise most of the two coun-tries? Based on the discussion in chapter 1, we shall assume that the market enclaves will ultimately be a very large part of the Chinese economy, and a significant, but smaller, part of the Indian economy. Specifically, we shall assume that the open, market-based parts of the two countries by 2060 will have a labour force of the same size as the entire OECD area labour force today – i.e. around 650 million. That would correspond to roughly 80 per cent of the total labour force in China plus 20 per cent of the Indian labour force.
The effects that this will have will be the result of interaction between a number of different mechanisms. To see this, take as an example one particular effect – on production of labour-intensive products. Roughly speaking, labour accounts for half the total value of production in the OECD countries – real capital and the stock of knowledge accounting for the other half. With a labour force equal to that of the OECD area, therefore, the market-based parts of China
OECD
Capital Labour
Non-tradedgoods
Cap-int goods
Lab-int goods
InvestmentConsumption
Labour Capital
Non-tradedgoodsLab-int goods
InvestmentConsumption
Labour Capital
Non-tradedgoods
InvestmentConsumption
CI Enclave
Rest India-China
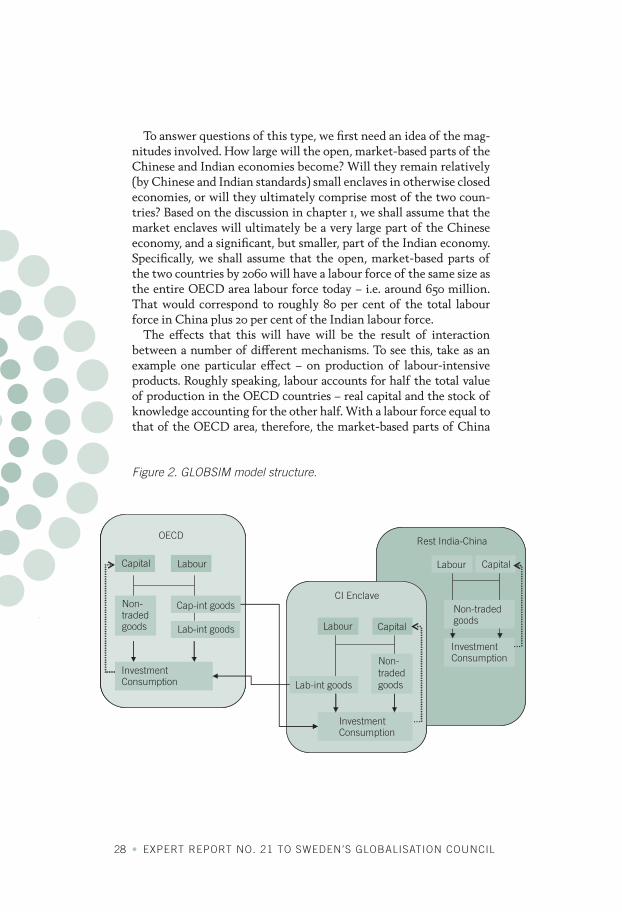
Figure 2. GLOBSIM model structure.
ON THE ROAD TO SAMARKAND • 29
and India fifty years from now should have a GDP roughly equal to half that of the OECD countries. If China and India use that same share as OECD on nontradeables, their ability to produce interna-tionally traded goods should then also be half that of the OECD countries. If fifty per cent of traded goods are labour-intensive, it would follow that China and India should be able to take over all labour-intensive production in the OECD area.
This line of reasoning is, however, a little too simple, since China and India themselves will also demand and consume labour-inten-sive products. With fifty per cent of the income and consumption levels of the OECD area, their demand for labour-intensive products will be one half that of the OECD countries. If so, China and India should be able to meet two thirds of the OECD demand for labour-intensive products.
Even this answer is too simple, and for two reasons. First, competi-tion from China and India will lower the relative prices of labour-intensive goods, and thus stimulate demand for such goods both in the OECD area and in China and India. Second, some of the higher real incomes resulting from trade gains will be saved, so there will be capital accumulation both in the OECD and the China-India enclaves – further stimulating both production capacity and the demand for labour-intensive products. To assess the effects of China and India on production, trade and prices, we need a model which captures all these mechanisms and the interaction between them.
The model
The model (sketched in figure 2) is made as simple is possible: The world is divided into three regions – the OECD area, the open market enclaves in China and India (called simply the enclave), and the rest of China and India (called Rest-China-India or RCI). RCI, which initially is the entire economy in the two countries, is treated as a closed economy. Over time, labour is transferred from RCI to the enclave, which produces and exports labour-intensive products to the OECD area. As labour is transferred to the enclave, there will be more resources per head left to the workers in RCI, and this will raise the wage and income level there as well.
30 • EXPERT REPORT NO. 21 TO SWEDEN’S GLOBALISATION COUNCIL
The model distinguishes three groups of goods and services – non-traded goods and services and two tradeables (labour-intensive and capital-intensive). These should not be linked directly to tradi-tional industrial classifications. In accordance with the fragmenta-tion of value chains that has been a characteristic feature of globali-sation so far, the idea in the model is that labour-intensive activities in all industries can be outsourced and located somewhere else. The labour-intensive part of tradeables production is the sum of these labour-intensive activities over all industries.
The nontradeables sector is important because it captures possi-ble effects of globalisation for the allocation of resources between tradeables and nontradeables. To the extent that there are gains from increased global trade, consumers will want to take out some of these in the form of increased consumption of nontradeables. As a result, one effect of globalisation should be that more resources will go to nontradeables – analogously to the Baumol effect of tech-nical progress in goods production on resource allocation between
1.00
0.90
0.80
0.70
0.60
0.50
0.40
0.30
0.20
0.10
0.002000 2010 2020 2030 2040 2050 2060
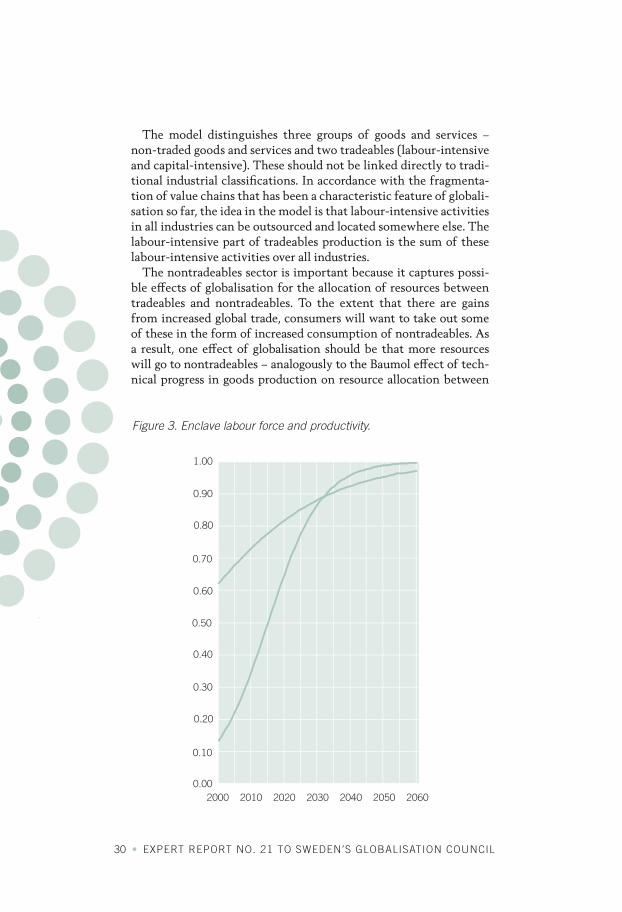
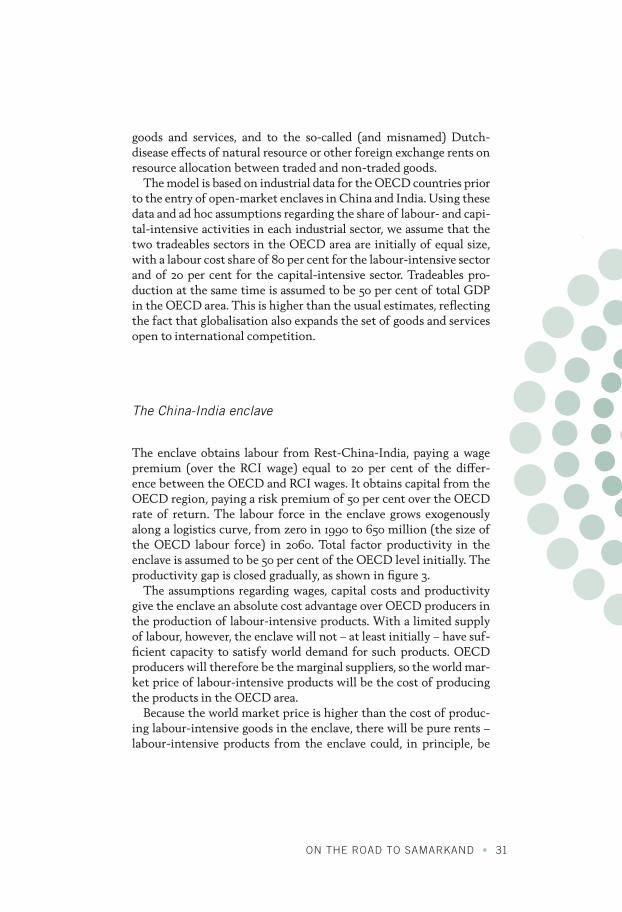
Figure 3. Enclave labour force and productivity.
ON THE ROAD TO SAMARKAND • 31
goods and services, and to the so-called (and misnamed) Dutch- disease effects of natural resource or other foreign exchange rents on resource allocation between traded and non-traded goods.
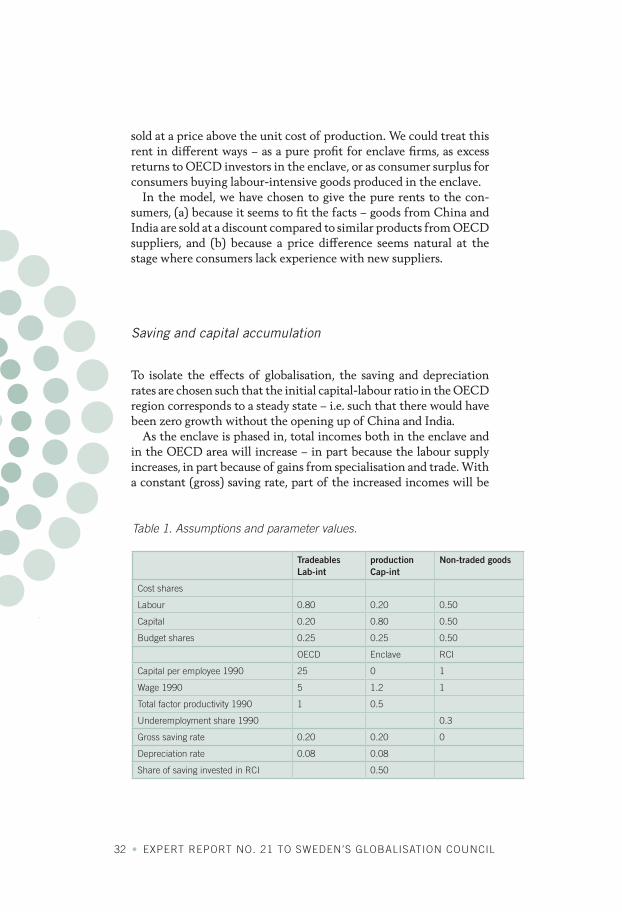
The model is based on industrial data for the OECD countries prior to the entry of open-market enclaves in China and India. Using these data and ad hoc assumptions regarding the share of labour- and capi-tal-intensive activities in each industrial sector, we assume that the two tradeables sectors in the OECD area are initially of equal size, with a labour cost share of 80 per cent for the labour-intensive sector and of 20 per cent for the capital-intensive sector. Tradeables pro-duction at the same time is assumed to be 50 per cent of total GDP in the OECD area. This is higher than the usual estimates, reflecting the fact that globalisation also expands the set of goods and services open to international competition.
The China-India enclave
The enclave obtains labour from Rest-China-India, paying a wage premium (over the RCI wage) equal to 20 per cent of the differ-ence between the OECD and RCI wages. It obtains capital from the OECD region, paying a risk premium of 50 per cent over the OECD rate of return. The labour force in the enclave grows exogenously along a logistics curve, from zero in 1990 to 650 million (the size of the OECD labour force) in 2060. Total factor productivity in the enclave is assumed to be 50 per cent of the OECD level initially. The productivity gap is closed gradually, as shown in figure 3.
The assumptions regarding wages, capital costs and productivity give the enclave an absolute cost advantage over OECD producers in the production of labour-intensive products. With a limited supply of labour, however, the enclave will not – at least initially – have suf-ficient capacity to satisfy world demand for such products. OECD producers will therefore be the marginal suppliers, so the world mar-ket price of labour-intensive products will be the cost of producing the products in the OECD area.
Because the world market price is higher than the cost of produc-ing labour-intensive goods in the enclave, there will be pure rents – labour-intensive products from the enclave could, in principle, be
32 • EXPERT REPORT NO. 21 TO SWEDEN’S GLOBALISATION COUNCIL
sold at a price above the unit cost of production. We could treat this rent in different ways – as a pure profit for enclave firms, as excess returns to OECD investors in the enclave, or as consumer surplus for consumers buying labour-intensive goods produced in the enclave.
In the model, we have chosen to give the pure rents to the con-sumers, (a) because it seems to fit the facts – goods from China and India are sold at a discount compared to similar products from OECD suppliers, and (b) because a price difference seems natural at the stage where consumers lack experience with new suppliers.
Saving and capital accumulation
To isolate the effects of globalisation, the saving and depreciation rates are chosen such that the initial capital-labour ratio in the OECD region corresponds to a steady state – i.e. such that there would have been zero growth without the opening up of China and India.
As the enclave is phased in, total incomes both in the enclave and in the OECD area will increase – in part because the labour supply increases, in part because of gains from specialisation and trade. With a constant (gross) saving rate, part of the increased incomes will be
Tradeables Lab-int
production Cap-int
Non-traded goods
Cost shares
Labour 0.80 0.20 0.50
Capital 0.20 0.80 0.50
Budget shares 0.25 0.25 0.50
OECD Enclave RCI
Capital per employee 1990 25 0 1
Wage 1990 5 1.2 1
Total factor productivity 1990 1 0.5
Underemployment share 1990 0.3
Gross saving rate 0.20 0.20 0
Depreciation rate 0.08 0.08
Share of saving invested in RCI 0.50
Table 1. Assumptions and parameter values.
ON THE ROAD TO SAMARKAND • 33
saved and invested, so the total capital stock will grow – creating further increases in incomes. The process will continue until the capital stock has grown to a level where the extra annual deprecia-tion equals the income-induced increase in gross saving.
This globalisation-induced capital accumulation will raise labour productivity and thus counteract the negative effect on OECD wages of the increased labour supply in the China-India enclave. In princi-ple, the process should continue until the new, integrated world economy (OECD plus the enclave) has the same wage level as the OECD region had initially. A key question in the model experiments is how capital accumulation and the phasing-in of the enclave inter-act – particularly how rapidly capital accumulation will neutralise the wage effects of labour-force growth in the enclave.
China - India
OECD
2.50
2.00
1.50
1.00
0.50
0.00
2000 2020 2020 2030 2040 2050 2060
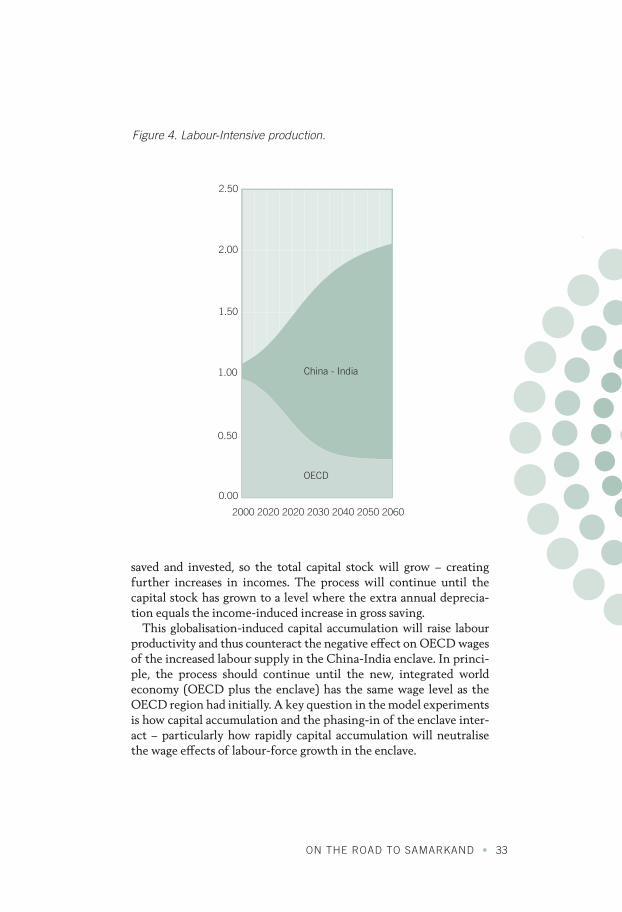
Figure 4. Labour-Intensive production.
34 • EXPERT REPORT NO. 21 TO SWEDEN’S GLOBALISATION COUNCIL
Parameter values
Table 1 summarises the parameter values and assumptions used in the modelling experiments. Two assumptions regarding the rest of China and India should be noted. The first is that RCI initially is assumed to have significant underemployment in the sense that the wage is higher than the marginal productivity of labour. As a result, labour migration to the enclave will not affect RCI-wages until the underemployment has been eliminated. The second is that we as-sume that most of the capital stock in RCI takes the form of natural resources which do not depreciate, so the RCI gross saving rate is set equal to zero. We assume, however, that 50 per cent of the enclave savings are invested in the rest of China and India, so that globalisa-tion over time gives capital accumulation in RCI as well.
Growth effectDirect effect
OECD Enclave RCI
400%
350%
300%
250%
200%
150%
100%
50%
0%
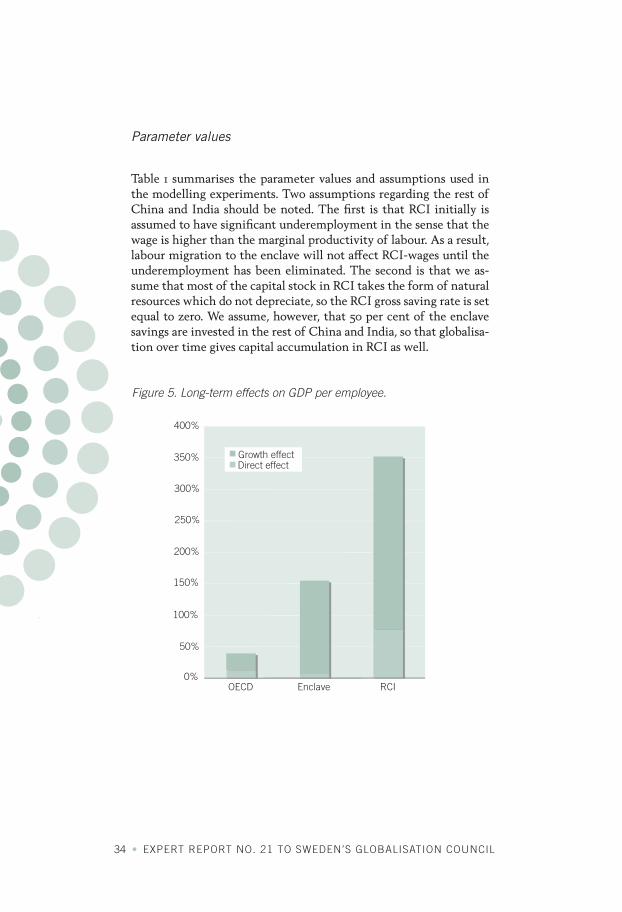
Figure 5. Long-term effects on GDP per employee.
ON THE ROAD TO SAMARKAND • 35
Results
GLOBSIM can be used to generate the effects of China and India on production, trade, income levels and factor prices, and since it models how the market enclaves are phased in, it will generate time paths for all of these variables. As the modelling results will be dis-cussed in greater detail in the next chapter, we shall only give some illustrations here.
It is natural to start with the effects on labour-intensive produc-tion and trade, as most other effects arise because the China-India enclaves specialise in labour-intensive exports. The simulated effects on labour-intensive production are shown in figure 4. Three points should be noted. The first is the sheer size of future enclave produc-tion of labour-intensive goods: by 2060 it will be 60–70 per cent greater than the total production of such goods in the OECD area
OECD wage
Enclave wage
RCI wage
Wage (w)
Rate of return (r)
w/r
6.00
5.00
4.00
3.00
2.00
1.00
0.00
2000 2010 2020 2030 2040 2050 2060 2000 2010 2020 2030 2040 2050 2060
1.20
1.10
1.00
0.90
0.80
0.70
Wage equalisation OECD factor prices
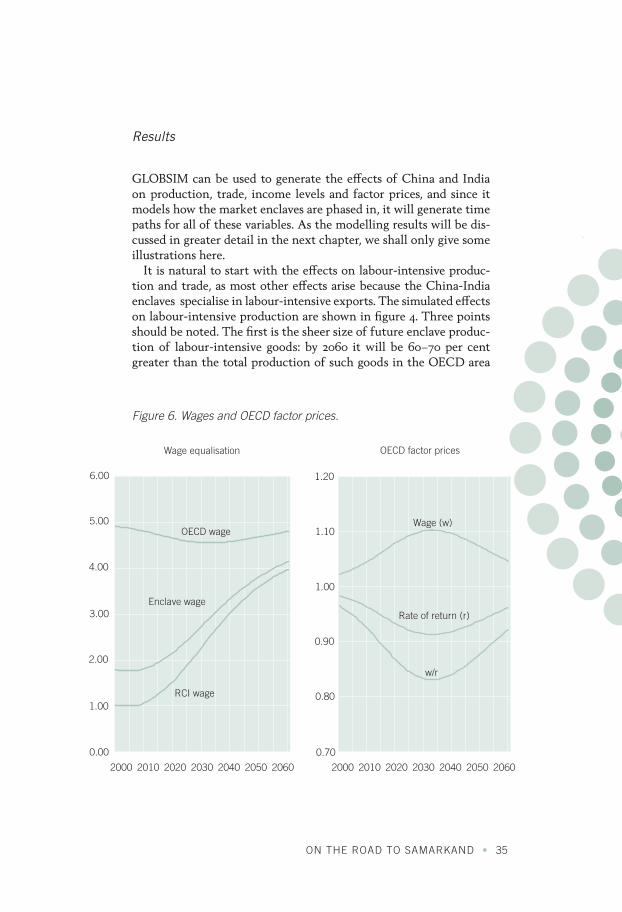
Figure 6. Wages and OECD factor prices.
36 • EXPERT REPORT NO. 21 TO SWEDEN’S GLOBALISATION COUNCIL
today. The second is that the competition we have seen from China and India so far is only a beginning – the most rapid growth in their production and exports will be from 2010 and onwards. The third, and perhaps most surprising, is that even so, significant labour-in-tensive production in the OECD region will survive.
When interpreting these results, it is important to bear in mind that labour-intensive production comprises a number of different products and production processes which differ in terms of com-plexity, the necessary labour qualifications, and the degree of labour intensity. Textiles and clothing are at one end of the scale, with very high labour intensity and low qualification requirements. The production of motor vehicles and IT services are at the other end. The natural way to interpret the results is that China and In-dia will gradually capture a larger set of labour-intensive activities – from textiles and clothing through shipbuilding to motor vehi-cles, IT and engineering.
The production capacity that the China-India enclave develops, and the sharper global division of labour that follows, will give sub-stantially higher real incomes for each of the regions affected. As some of this income gain is saved, there will be a medium-term growth effect in addition. Figure 5 shows both the direct gain and
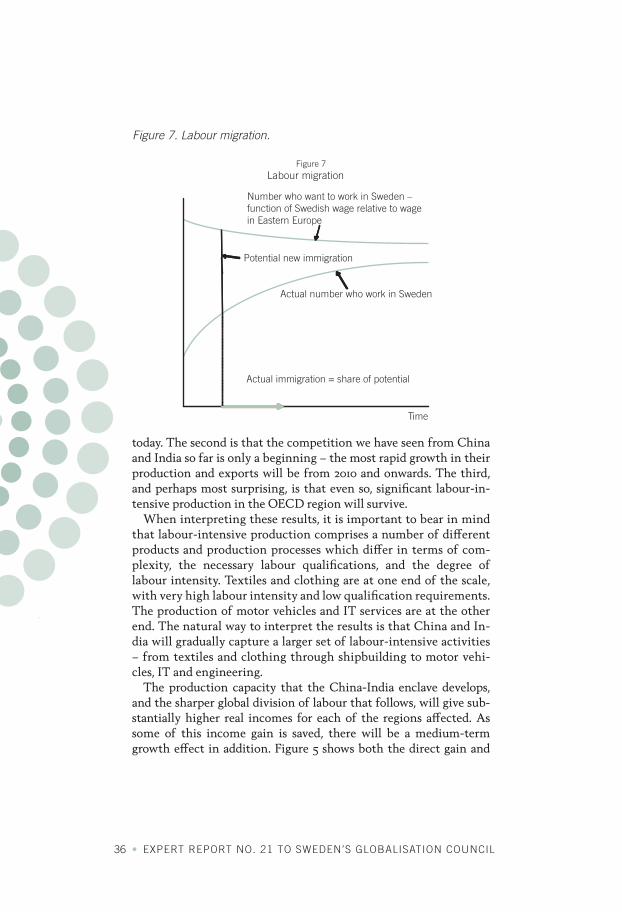
Figure 7 Labour migration
Number who want to work in Sweden –function of Swedish wage relative to wagein Eastern Europe
Potential new immigration
Actual number who work in Sweden
Actual immigration = share of potential
Time
Figure 7. Labour migration.
ON THE ROAD TO SAMARKAND • 37
the indirect, accumulated growth bonus. Not surprisingly, the rest of China and India will have the largest relative gain – partly because migration to the enclave will eliminate underemployment, and part-ly because the capital-labour ratio increases as some of the saving in the enclave is invested in RCI. The OECD region will have the small-est relative gain, but with a total gain equal to 50 per cent of the initial GDP per capita, their absolute gain is about the same as that of China and India.
Translated into annual growth rates, these numbers imply that the China-India effect for the next 40 years translates into additional an-nual growth in the OECD area of 0.5–0.6 per cent.
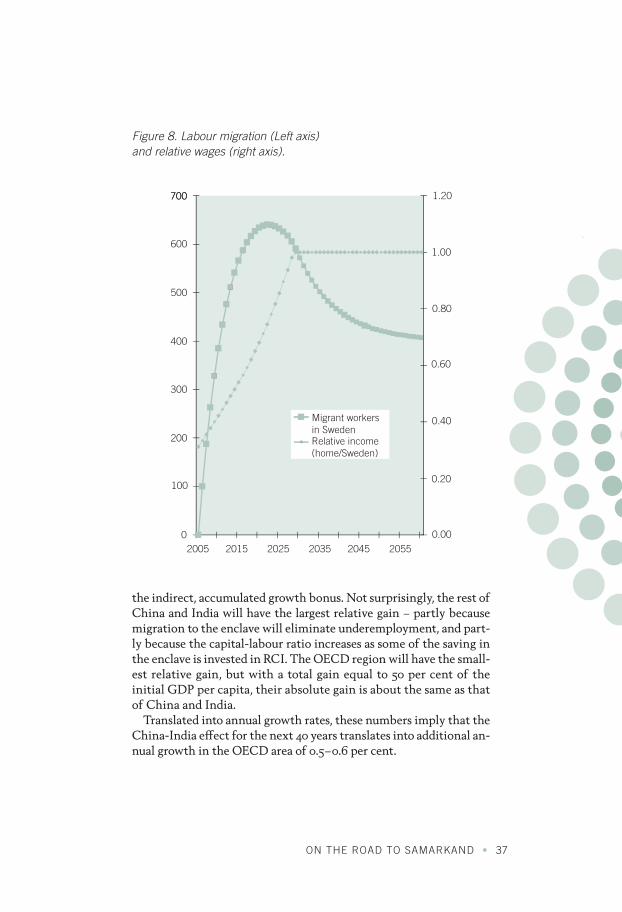
700
600
500
400
300
200
100
02005 2015 2025 2035 2045 2055
Migrant workersin Sweden
700
Relative income(home/Sweden)
1.20
1.00
0.80
0.60
0.40
0.20
0.00
Figure 8. Labour migration (Left axis) and relative wages (right axis).
38 • EXPERT REPORT NO. 21 TO SWEDEN’S GLOBALISATION COUNCIL
Trade will tend to equalise wages and other factor prices between the OECD countries and the China-India area. Because of the extra capital accumulation induced by the gains from trade, the equalised wage level will (as shown in figure 6) be close to current wages in the OECD area, so China and India will catch up – wages in the OECD area will not be forced down towards current wages in Asia.
This does not mean that wage adjustment is unproblematic, how-ever. As is also seen from figure 6, there is a need – particularly in the medium term – for substantial changes in relative factor prices in the OECD area: Wages must fall to ensure full employment, while returns on capital will increase significantly. As higher returns on capital also imply higher returns on human capital, this means that unskilled workers will lose, while capital owners and highly educat-ed workers will gain. The distributional and political challenges that this entails could be difficult to handle.
3.2 Migration
Labour migration is, as pointed out in chapter 1, generally thought to be the result of both push and pull factors. The most important of these are wage and income levels in the home and host countries. There is typically a positive relationship between migration and in-come opportunities in the host country. The relationship is more complicated in the home country. At very low income levels, there is little emigration, in part because few can afford the direct and indirect costs of moving. At reasonably high income levels, there is also little emigration, mainly because immobility itself seems to be a normal good. Typically, therefore, the relationship between the domestic wage level and emigration is hump-shaped: people migrate only at intermediate domestic wages.
It is the hump shape which is commonly thought to explain why we have seen so little migration in the current wave of globalisation. Most countries are simply below or above the income ‘window’ that induces labour migration. The most important exception is Eastern Europe. There, income levels are high enough, and formal restric-tions and other transactions costs low enough, to make migration to the West possible. At the same time, domestic income levels are suf-ficiently low to make migration attractive.
ON THE ROAD TO SAMARKAND • 39
We have no basis for estimating exactly how many Eastern Euro-pean workers who might want to work in Sweden – that depends, among other things, on job and income opportunities in other West-ern European countries. As an upper boundary, however, we assume that there are 1 million workers in Eastern Europe who, with the cur-rent wages and job opportunities at home and abroad, would like a job in Sweden. We further assume that this number declines rapidly as income levels rise at home. Specifically, we assume that the elas-ticity of the number of potential immigrants with respect to the per-centage income differential between Sweden and their home coun-try is 0.5, which means that if the income difference is reduced by 25 per cent, the number of potential immigrants declines from 1 million to a little over 800 000.
The rate of immigration, and thus the actual number of foreign workers in Sweden, is assumed to be determined by a stock-adjust-ment process, as illustrated in figure 7. The difference between the number of Eastern European workers who want to work in Sweden
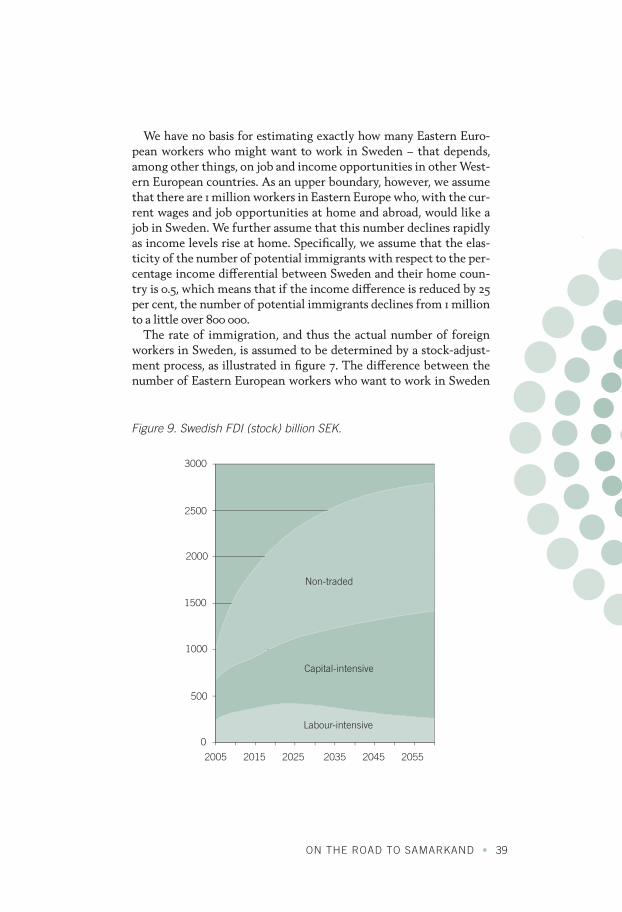
Non-traded
Capital-intensive
Labour-intensive
3000
2000
2500
1500
1000
500
0
2005 2015 2025 2035 2045 2055
Figure 9. Swedish FDI (stock) billion SEK.
40 • EXPERT REPORT NO. 21 TO SWEDEN’S GLOBALISATION COUNCIL
at the prevailing wages in Sweden and at home, and the actual number of immigrant workers in Sweden is the potential new immi-gration. The actual number of immigrants during a particular year is a fraction (in the model 10 per cent) of the potential new immigra-tion.
A key question regarding labour migration is the extent to which migrants will stay permanently or return to their country of origin once wages and income levels converge. The answer is likely to de-pend on how rapidly Eastern Europe closes the income gap to the West. In the model, we keep the issue open, by allowing for an exog-enously given return rate.
To illustrate how the migration submodel works, and also to illus-trate the types of migration paths we typically obtain, figure 8 shows estimated labour migration to Sweden in a scenario with a 5 per cent annual rate of growth in real wages in Eastern Europe, no change in Swedish wages except those needed to accommodate immigrant workers, and a long-term return rate of 60 per cent.
3.3 Foreign direct investment
When modelling Swedish foreign direct investment, we emphasise so-called horizontal investment – i.e. investments abroad by firms who want to capitalise on products and know-how in new markets, who face sufficiently high transport and transactions costs to make exports a less profitable alternative than production near the mar-ket, and who because of agency problems prefer to have production and distribution in-house. Traditionally, horizontal direct invest-ments have been quantitatively of far greater importance than verti-cal investments – i.e. direct investment by firms looking for cheaper places to produce. In the early stages of globalisation, vertical invest-ments increased significantly, as production processes were frag-mented and labour-intensive activities moved to China, India and other low-wage countries. We believe this is a transitional phenom-enon, before Chinese and Indian firms expand into a wider range of labour-intensive activities and a greater part of the labour-intensive value chains.
ON THE ROAD TO SAMARKAND • 41
Sweden already has a very significant stock of foreign direct invest-ment – with foreign employment in Swedish firms totalling around 1 million, we estimate the capital stock abroad at a little less than SEK 1000 billion. Based on the industry-level foreign employment data for Swedish FDI, we estimate that 32 per cent of the FDI stock is in non-traded goods and services. Of the remaining 68 per cent, around one third is in labour-intensive and two thirds in capital-intensive (in-cluding knowledge-intensive) tradeables.
In the model, we take an approach similar to the one we employ for migration. For each type of foreign direct investment (in nontradea-bles, and in labour- and capital-intensive tradeables), we define each year a desired or optimal Swedish-owned foreign capital stock, and then let the flow of net foreign investment be a fraction of the differ-ence between the optimal and actual capital stock.
The initial, optimal capital stock in each sector is assumed to reflect the fact that some Swedish firms are already international, while oth-ers will become international as a result of globalisation. For those firms that are already international, we assume that the initial stock of FDI is the optimal one, given the size of world markets and the rela-tive return on investment at home and abroad. For the firms which are not internationalised initially, we assume that the optimal FDI stock is proportional to their domestic capital stock, with a factor of pro-portionality of 1.5. In the simulation experiments, we assume that 60 per cent of the industrial capital stock in Sweden is in firms which are already internationalised, so the remaining potential for FDI – at initial conditions – is 1.5 times 40 per cent of the domestic capital stock in the sector.
Over time, the optimal capital stock in each sector is assumed, ceteris paribus, to grow at the same rate as the corresponding OECD production sector (taken from the GLOBSIM simulations); but at the same time to depend on the rate of return to FDI relative to the rate of return to the corresponding sector at home, with an elasticity of 5 with respect to the relative rate of return.
As an illustration of the FDI paths that follow from these assump-tions, figure 9 shows the result of a simulation experiment using the GLOBSIM paths for production in the OECD area and for OECD-area rates of return, and assuming no other exogenous changes in the Swedish economy – so the only changes at home are the effects fol-lowing from domestic saving being diverted from domestic invest-ment to FDI (and the indirect effects that follow from this, such as changes in industrial structure and factor prices at home).
42 • EXPERT REPORT NO. 21 TO SWEDEN’S GLOBALISATION COUNCIL
4. Effects on the Swedish economy
Globalisation will have dramatic effects on the Swedish economy – and by and large, positive ones. The entry of China and India into the world economy has already benefited Swedish consumers and will continue to do so on an even larger scale in the decades ahead. The gains from trade with the Asian giants give additional indirect gains by (a) stimulating saving and investment, and (b) shifting Swedish resources into knowledge-intensive activities, both of which will generate higher economic growth. At the same time, the integration of Eastern Europe means that Sweden will attract a large number of guest workers; and although most of these are likely to leave again, they will leave behind a permanent, positive influence. Continued internationalisation and more rapid growth in the OECD area will also make Swedish firms invest abroad to an even greater extent and at a more rapid pace than they have done in the past, and this foreign direct investment will contribute positively to the Swedish economy both through direct returns on the investments and through posi-tive feed-back to knowledge-intensive production in Sweden.
A particularly noteworthy effect is that globalisation will stimu-late knowledge-intensive production in Sweden and thus lead to an increase in the demand for highly educated people. As a conse-quence, it will become more attractive to undergo higher education and more young people will choose to do so.
Although the effects are positive in most respects, they pose chal-lenges. The most serious one relates to changes in the functional dis-tribution of income. All factor owners – capital owners, highly edu-cated people and people without higher education – will gain from globalisation; at least if we make the reasonable assumption that globalisation is a necessary condition for continued rapid technical progress in Sweden. Capital owners will, however, benefit to a much greater extent than wage earners. As many capital owners are at the top end of the income distribution, and as most of those at the bot-tom end are wage earners, the result is likely to be greater inequality in pre-tax incomes. For a country which has traditionally put so much emphasis on equality, greater inequality could threaten social
ON THE ROAD TO SAMARKAND • 43
cohesion and political stability. The effect can be neutralised through changes in the tax system – with lower tax rates on wage income and higher tax rates on capital and capital income – but international mobility of firms and capital constrains the extent to which this can be done without incurring high costs.
Another potential challenge concerns the geographical distribution of economic activity in Sweden. Much of the traditional production of traded goods will disappear as the result of globalisation, and the new tradeable production will be largely knowledge-intensive – likely to be located in areas with an abundance of highly educated labour. As traditional manufacturing in Sweden is typically located outside the Stockholm area, while highly educated people tend to converge on Stockholm, this could induce further centralisation.
Labour
Higher education
No higher education
Capital-intensive
Knowledge-intensive
Labourintensive
Non-tradeables
Domestic-Markets
Internationalmarkets
Internationalgiven prices
Exogenousgrowth
Capital
Exogenoustechnicalprogress Constant
Saving rate
Investment
Consumption
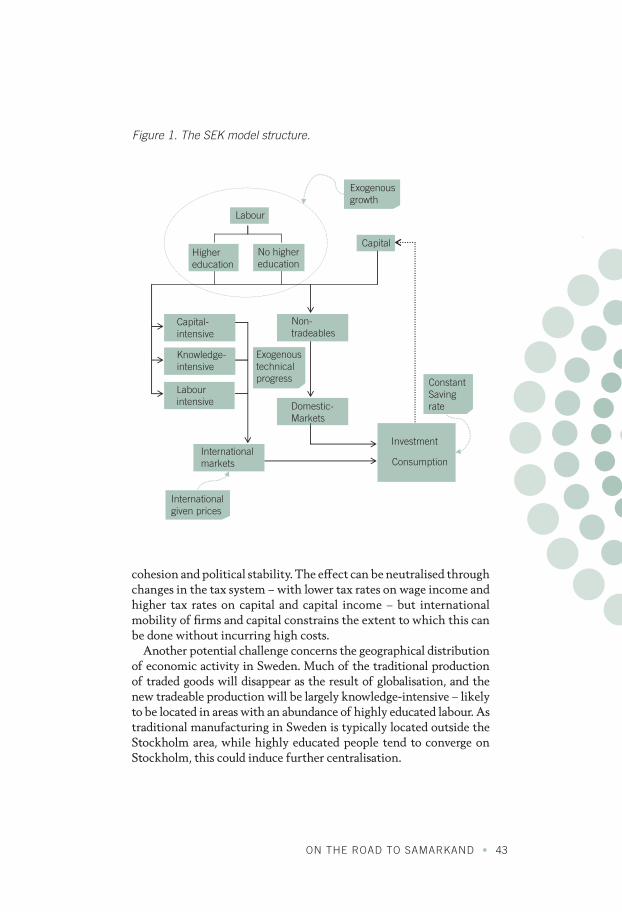
Figure 1. The SEK model structure.
44 • EXPERT REPORT NO. 21 TO SWEDEN’S GLOBALISATION COUNCIL
In this chapter, we present, elaborate on, and discuss these and other effects of globalisation. First, however, we sketch the model we use to translate the three forces of globalisation to specific impli-cations for the Swedish economy.
4.1 The SEK model
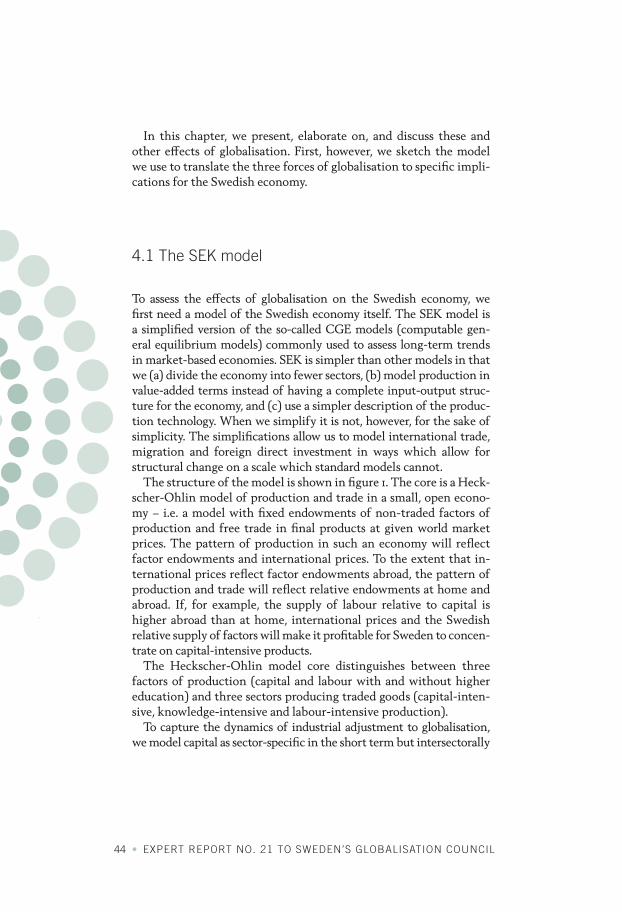
To assess the effects of globalisation on the Swedish economy, we first need a model of the Swedish economy itself. The SEK model is a simplified version of the so-called CGE models (computable gen-eral equilibrium models) commonly used to assess long-term trends in market-based economies. SEK is simpler than other models in that we (a) divide the economy into fewer sectors, (b) model production in value-added terms instead of having a complete input-output struc-ture for the economy, and (c) use a simpler description of the produc-tion technology. When we simplify it is not, however, for the sake of simplicity. The simplifications allow us to model international trade, migration and foreign direct investment in ways which allow for structural change on a scale which standard models cannot.
The structure of the model is shown in figure 1. The core is a Heck-scher-Ohlin model of production and trade in a small, open econo-my – i.e. a model with fixed endowments of non-traded factors of production and free trade in final products at given world market prices. The pattern of production in such an economy will reflect factor endowments and international prices. To the extent that in-ternational prices reflect factor endowments abroad, the pattern of production and trade will reflect relative endowments at home and abroad. If, for example, the supply of labour relative to capital is higher abroad than at home, international prices and the Swedish relative supply of factors will make it profitable for Sweden to concen-trate on capital-intensive products.
The Heckscher-Ohlin model core distinguishes between three factors of production (capital and labour with and without higher education) and three sectors producing traded goods (capital-inten-sive, knowledge-intensive and labour-intensive production).
To capture the dynamics of industrial adjustment to globalisation, we model capital as sector-specific in the short term but intersectorally
ON THE ROAD TO SAMARKAND • 45
mobile in the long term. In the short term, capital takes the form of sector-specific machines, buildings and equipment. As this depreci-ates; gross investment can either be used to replace it or be channelled to new investment in other sectors: In the long term, therefore, capi-tal can be moved between sectors in such a way that the net rate of return is the same in all sectors. This feature turns the short-term version of the model into a so-called Ricardo-Viner model.
To this model core, we add a nontradeables sector, i.e. a sector pro-ducing goods and services which are not traded internationally, and where domestic production must therefore equal domestic demand.
We also add a neoclassical growth model of the Solow type, where technological progress and growth in the labour force are given exogenously, but where capital accumulation is endogenous – deter-mined by gross saving and investment (through a fixed saving rate) and depreciation.
To this structure we add (a) positive external economies of scale to the knowledge-intensive production sector, and (b) the three chan-nels for effects of globalisation – changes in the terms of trade as a result of China and India, labour immigration, and foreign direct investment.
External economies of scale and agglomeration dynamics
External economies of scale in knowledge-intensive production cap-ture two effects. One is possible clustering or agglomeration forces in the sector as a whole or in particular industries within the sector, of the type well-known from the so-called new economic geography literature. The other is endogenous productivity growth in line with the so-called new growth theory. We make no attempt at model-ling the particular linkages at the micro level which can give rise to real or pecuniary externalities – we could not hope to do that in a satisfactory way at the high level of aggregation we have in our model. We know from the literature, however, that micro linkages will manifest themselves as positive externalities when we look at the cluster of affected firms or other agents as a group.
We only model positive externalities for the knowledge-intensive sector of the economy. We do that because the microeconomic forces
46 • EXPERT REPORT NO. 21 TO SWEDEN’S GLOBALISATION COUNCIL
which can give rise to clustering effects – knowledge spillovers, gains from larger markets for intermediate products, specialist or venture investors, or effects of market size for final products – are more likely to be present for the type of products and production processes char-acteristic of knowledge-intensive firms. In capital- or labour-inten-sive industries, production processes are typically more standardised, markets and products more well-defined, and the degree of competi-tion generally higher – all of which make it less likely that there are significant agglomeration effects.
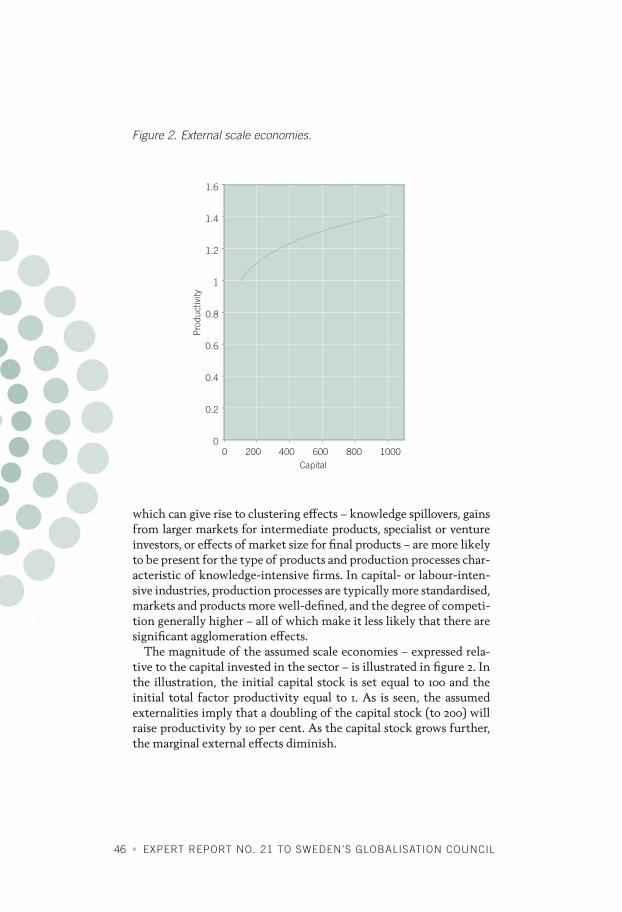
The magnitude of the assumed scale economies – expressed rela-tive to the capital invested in the sector – is illustrated in figure 2. In the illustration, the initial capital stock is set equal to 100 and the initial total factor productivity equal to 1. As is seen, the assumed externalities imply that a doubling of the capital stock (to 200) will raise productivity by 10 per cent. As the capital stock grows further, the marginal external effects diminish.
1.6
1.4
1.2
1
0.8
0.6
0.4
0.2
0
Pro
duct
ivity
Capital0 200 400 600 800 1000
Figure 2. External scale economies.
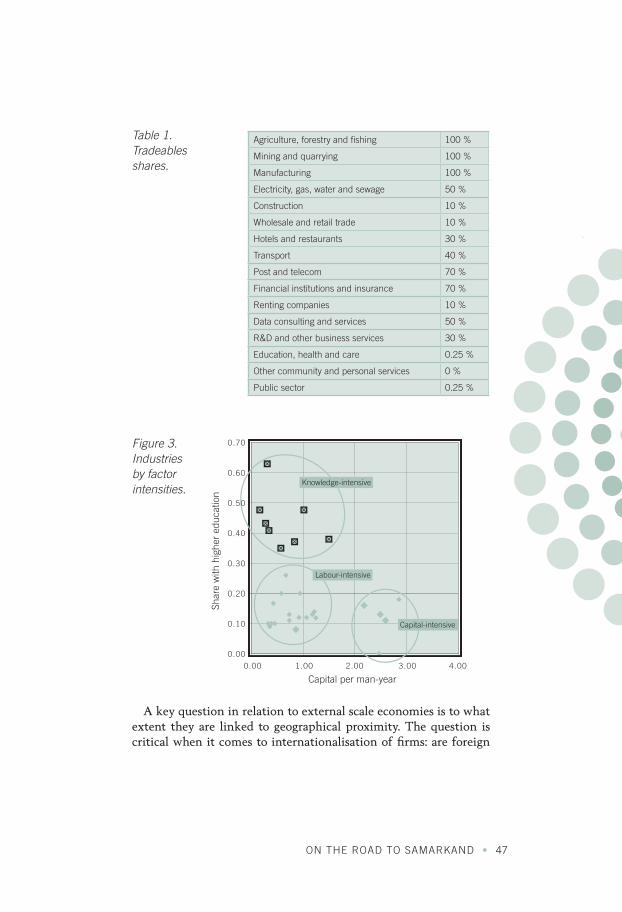
ON THE ROAD TO SAMARKAND • 47
A key question in relation to external scale economies is to what extent they are linked to geographical proximity. The question is critical when it comes to internationalisation of firms: are foreign
Capital per man-year
Capital-intensive
Labour-intensive
Knowledge-intensive
0.00
0.70
0.60
0.50
0.40
0.30
0.20
0.10
0.00
1.00 2.00 3.00 4.00
Shar
e w
ith h
ighe
r ed
ucat
ion
Table 1. Tradeables shares.
Figure 3. Industries by factor intensities.
Agriculture, forestry and fishing 100 %
Mining and quarrying 100 %
Manufacturing 100 %
Electricity, gas, water and sewage 50 %
Construction 10 %
Wholesale and retail trade 10 %
Hotels and restaurants 30 %
Transport 40 %
Post and telecom 70 %
Financial institutions and insurance 70 %
Renting companies 10 %
Data consulting and services 50 %
R&D and other business services 30 %
Education, health and care 0.25 %
Other community and personal services 0 %
Public sector 0.25 %
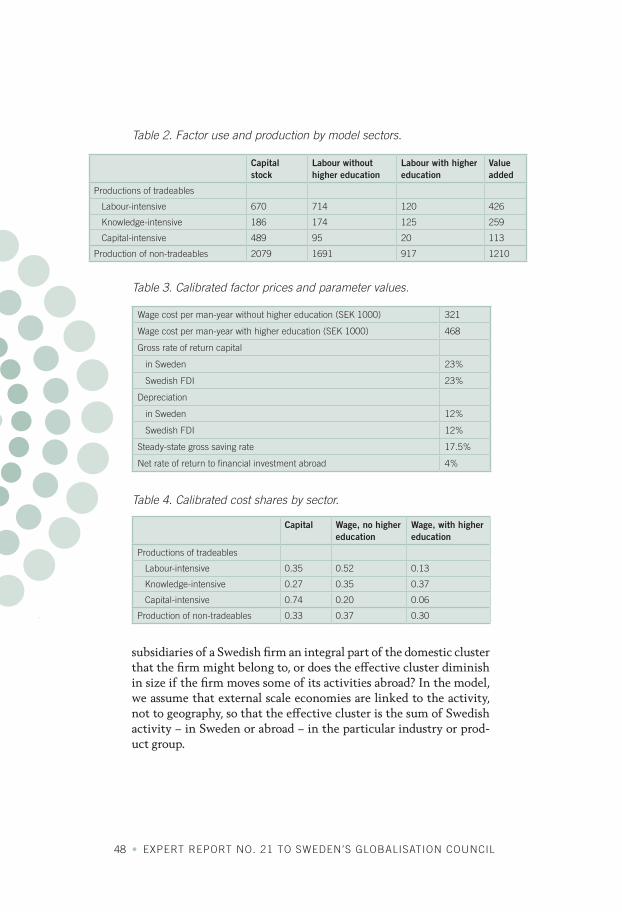
48 • EXPERT REPORT NO. 21 TO SWEDEN’S GLOBALISATION COUNCIL
subsidiaries of a Swedish firm an integral part of the domestic cluster that the firm might belong to, or does the effective cluster diminish in size if the firm moves some of its activities abroad? In the model, we assume that external scale economies are linked to the activity, not to geography, so that the effective cluster is the sum of Swedish activity – in Sweden or abroad – in the particular industry or prod-uct group.
Capital stock
Labour without higher education
Labour with higher education
Value added
Productions of tradeables
Labour-intensive 670 714 120 426
Knowledge-intensive 186 174 125 259
Capital-intensive 489 95 20 113
Production of non-tradeables 2079 1691 917 1210
Capital Wage, no higher education
Wage, with higher education
Productions of tradeables
Labour-intensive 0.35 0.52 0.13
Knowledge-intensive 0.27 0.35 0.37
Capital-intensive 0.74 0.20 0.06
Production of non-tradeables 0.33 0.37 0.30
Wage cost per man-year without higher education (SEK 1000) 321
Wage cost per man-year with higher education (SEK 1000) 468
Gross rate of return capital
in Sweden 23%
Swedish FDI 23%
Depreciation
in Sweden 12%
Swedish FDI 12%
Steady-state gross saving rate 17.5%
Net rate of return to financial investment abroad 4%
Table 2. Factor use and production by model sectors.
Table 3. Calibrated factor prices and parameter values.
Table 4. Calibrated cost shares by sector.
ON THE ROAD TO SAMARKAND • 49
Data and calibration
The model is based on, and calibrated to, data for the Swedish economy in 2004. Using national accounts and education data for production, capital stocks and labour use, we obtain the data set shown in table 1 in the appendix for factor use and value added by sector.
We proceed by assigning this factor use and value added to the four model sectors (with the exception of housing services, which we treat as consumption).
The first step is to assess, for each industry, (a) the extent to which it produces tradeables and nontradeables, and (b) the extent to which the tradeable share should be adjusted upwards to reflect interna-tionalisation. The resulting tradeable shares are given in table 2.
With these shares, non-traded value added totals SEK 1210 billion, or 60 per cent of total production (excluding housing services). A considerable part of this is value added in the public sector, which in the national accounts does not include capital costs (only deprecia-tion of capital). We correct for this by including a net rate of return on capital – equal to the average for the rest of the economy – in the public sector factor cost and value added. With this adjustment, non-traded production increases to SEK 1 400 billion, or 64 per cent of total production.
The next step is to assign tradeable production at the industry level to the three model sectors. We do this on the basis of relative factor intensities – the capital-labour ratio and the share of labour with higher education – at the industry level. The relative industry-level factor intensities are plotted in figure 3 (with the exception of elec-tricity and water supply, which is several times as capital intensive as any other industry). As is seen, the scatter defines three well-defined groups: a group with high capital intensity and low educational inten-sity, a group with high educational intensity and low capital intensity, and a (labour intensive) group with low capital- and educational intensity.
With this assignment of industries, 53 per cent of tradeable pro-duction is labour-intensive, 32 per cent knowledge-intensive, and 14 per cent capital-intensive. Total production of tradeables is SEK 800 billion, or 36 per cent of GDP.
The other data needed to close the model are initial factor prices, gross saving and depreciation. To find these, we assume that the economy is initially in equilibrium, so that the net rate of return and
Capital stock
Labour without higher education
Labour with higher education
Value added
Productions of tradeables
Labour-intensive 670 714 120 426
Knowledge-intensive 186 174 125 259
Capital-intensive 489 95 20 113
Production of non-tradeables 2079 1691 917 1210
Capital Wage, no higher education
Wage, with higher education
Productions of tradeables
Labour-intensive 0.35 0.52 0.13
Knowledge-intensive 0.27 0.35 0.37
Capital-intensive 0.74 0.20 0.06
Production of non-tradeables 0.33 0.37 0.30
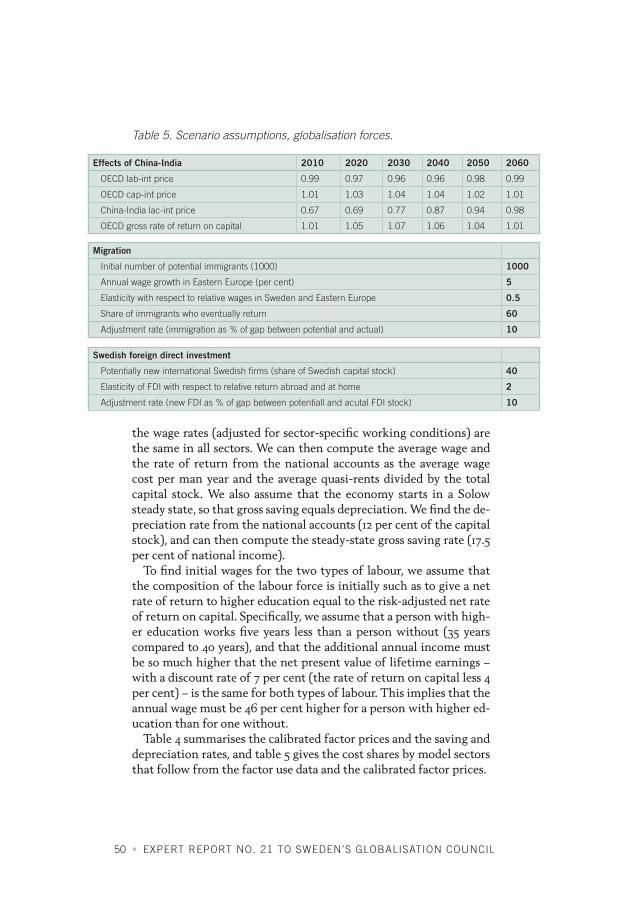
50 • EXPERT REPORT NO. 21 TO SWEDEN’S GLOBALISATION COUNCIL
the wage rates (adjusted for sector-specific working conditions) are the same in all sectors. We can then compute the average wage and the rate of return from the national accounts as the average wage cost per man year and the average quasi-rents divided by the total capital stock. We also assume that the economy starts in a Solow steady state, so that gross saving equals depreciation. We find the de-preciation rate from the national accounts (12 per cent of the capital stock), and can then compute the steady-state gross saving rate (17.5 per cent of national income).
To find initial wages for the two types of labour, we assume that the composition of the labour force is initially such as to give a net rate of return to higher education equal to the risk-adjusted net rate of return on capital. Specifically, we assume that a person with high-er education works five years less than a person without (35 years compared to 40 years), and that the additional annual income must be so much higher that the net present value of lifetime earnings – with a discount rate of 7 per cent (the rate of return on capital less 4 per cent) – is the same for both types of labour. This implies that the annual wage must be 46 per cent higher for a person with higher ed-ucation than for one without.
Table 4 summarises the calibrated factor prices and the saving and depreciation rates, and table 5 gives the cost shares by model sectors that follow from the factor use data and the calibrated factor prices.
Effects of China-India 2010 2020 2030 2040 2050 2060
OECD lab-int price 0.99 0.97 0.96 0.96 0.98 0.99
OECD cap-int price 1.01 1.03 1.04 1.04 1.02 1.01
China-India lac-int price 0.67 0.69 0.77 0.87 0.94 0.98
OECD gross rate of return on capital 1.01 1.05 1.07 1.06 1.04 1.01
Migration
Initial number of potential immigrants (1000) 1000
Annual wage growth in Eastern Europe (per cent) 5
Elasticity with respect to relative wages in Sweden and Eastern Europe 0.5
Share of immigrants who eventually return 60
Adjustment rate (immigration as % of gap between potential and actual) 10
Swedish foreign direct investment
Potentially new international Swedish firms (share of Swedish capital stock) 40
Elasticity of FDI with respect to relative return abroad and at home 2
Adjustment rate (new FDI as % of gap between potentiall and acutal FDI stock) 10
Table 5. Scenario assumptions, globalisation forces.
ON THE ROAD TO SAMARKAND • 51
4.2 The globalisation scenario
We use the model to construct a globalisation scenario for Sweden. The scenario assumes that the Swedish economy starts in a steady-state general equilibrium in which it would remain indefinitely had it not been for the three globalisation forces. The steady state im-plies an aggregate gross saving rate just sufficient to replace exist-ing capital equipment as it depreciates. It also implies no technical progress and a constant labour force with a constant share of the workforce with higher education, while general equilibrium implies that the industrial structure remains unchanged.
The advantage of using a steady-state general equilibrium as the reference point is that all changes generated by the model simula-tions are attributable to globalisation. Because the GLOBSIM model used to study the world market effects of China and India also uses a steady-state general equilibrium as its reference path, the steady-state assumption also ensures consistency between the simulations for Sweden and the more general simulations for the OECD area.
Into this steady-state equilibrium we then introduce the three globalisation forces, as described in chapter 2:
Integration of China and India into the world economy, resulting • in a massive shift of world labour-intensive production to Asia, lower relative prices of labour-intensive goods, and gradual equalisation of factor prices between China and India on the one hand and the OECD countries on the other.Large potential immigration to Sweden of workers from Eastern • Europe, driven in part by low incomes at home, in part by job opportunities and high wages in Sweden.Further internationalisation of Swedish firms, through large scale, • mainly horizontal, direct investments abroad.
The specific scenario assumptions regarding the three globalisation forces are shown in table 6. The OECD prices and the OECD rate of return on capital are all relative to 1990, while the China-India price of labour-intensive goods is relative to the 1990 OECD price for such goods. The GLOBSIM model does not have a knowledge-intensive sector, so it does not give a price path for knowledge-intensive prod-ucts. If we regard labour with higher education as 50 per cent la-bour and 50 per cent capital, however, the international price path for knowledge-intensive goods should be about midway between the
52 • EXPERT REPORT NO. 21 TO SWEDEN’S GLOBALISATION COUNCIL
paths for labour- and capital-intensive goods. The average of the two is used as the numeraire (unit of measurement) in GLOBSIM, and we do the same in the scenario, by setting the price of knowledge-intensive products equal to one.
Globalisation will affect all prices, wages and rates of return in Sweden, and this will lead to changes in consumption patterns, real-location of resources between industries, and to reallocation of sav-ings between domestic and foreign investment. We assume that the gross saving rate and the Swedish (as opposed to the immigrant) la-bour force remain unchanged. At the same time, however, we assume that the share of the working population with higher education responds to changes in relative wages: specifically, that the relative supply of highly educated people changes so as to restore, by 2060, the initial rate of return on higher education.
4.3 Effects on the supply of labour and capital
Immigration, higher returns to education, foreign direct investment and the extra saving induced by higher real income will have sub-stantial effects on the absolute and relative supplies of labour and capital to Swedish industries.
In the short to medium term, total labour supply will increase sig-nificantly as a result of immigration. This will be reversed in the longer term, as some of the labour migrants return to their home countries. Higher returns on education will, on the other hand, cause a permanent increase in the share of Swedish workers with higher education – as a result of globalisation, almost 400 000 extra persons will find it attractive to take higher education. In the long term, therefore, the supply of highly educated labour will be significantly higher than today, while the supply of low-skilled workers will decline to a permanent level that is only slightly above the initial level.
Because there is a real income gain from globalisation, there will also be higher saving and a marked increase in net capital accumula-tion – the steady-state Swedish-owned capital stock will increase by as much as a quarter. At the same time, Swedish foreign direct invest-ments will grow even more rapidly, both in relative and absolute terms. As a result, the supply of capital to production in Sweden will
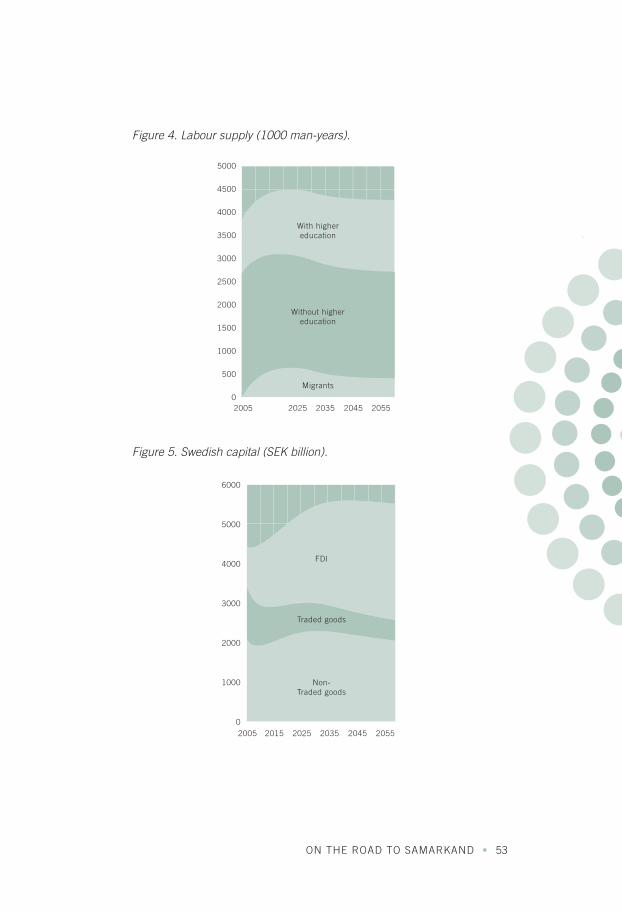
ON THE ROAD TO SAMARKAND • 53
2005
5000
4500
4000
3500
3000
2500
2000
1500
1000
500
0
6000
5000
4000
3000
2000
1000
0
With highereducation
Without highereducation
Migrants
FDI
Traded goods
Non-Traded goods
2025 2035 2045 2055
2005 2015 2025 2035 2045 2055
Figure 5. Swedish capital (SEK billion).
Figure 4. Labour supply (1000 man-years).

54 • EXPERT REPORT NO. 21 TO SWEDEN’S GLOBALISATION COUNCIL
decline – first rapidly, then (after some recovery) more slowly, as seen from figure 5. Ultimately, the domestic capital stock will decline by some SEK 800 billion, or a little less than 25 per cent.
All told, therefore, the effect of globalisation on relative factor supply will be an increase in the supply of highly educated labour relative to both the domestic supply of capital and the supply of less skilled labour. There will also be an increase in the supply of less skilled workers relative to capital.
4.4 Effects on industrial structure and the external economy
The long-term effects of globalisation on the Swedish industrial structure derive to a large extent from (a) the induced changes in relative factor supplies, and (b) the growth in FDI earnings.
In the short to medium term, the industrial-structure effects reflect the international price changes that follow from the integration of
2005
1400
1200
1000
800
600
400
200
0
Capital-intensive
Knowledge-intensive
Labour-intensive
2007 2009 2011 2013 2015
Figure 6. Employment in tradeables production (1000).

ON THE ROAD TO SAMARKAND • 55
China and India into the world economy: lower international prices for labour-intensive goods and higher prices for capital-intensive goods will give a fall in profitability in labour-intensive industries and a corresponding increase in profitability in capital- and knowl-edge-intensive activities; and as a result of the two, the demand for unskilled workers will fall. This, together with increased supply of labour from immigrant workers, causes a fall in wages for workers without higher education. The fall will not, however, be sufficient to restore the relative profitability of labour-intensive production, so, over time, capital and labour will be reallocated from labour-inten-sive to capital- and knowledge-intensive production. There will also be reallocation to production of non-traded goods, as globali-sation gives higher real incomes, some of which are spent on non-traded goods.
These short- to medium-term effects are shown in figure 7, which shows the projected employment structure until 2020.
2005 2015
5000
4500
4000
3500
3000
2500
2000
1500
1000
500
0
5000
4500
4000
3500
3000
2500
2000
1500
1000
500
0
2025 2035
Non-tradedgoods
Non-tradedgoods
Capital-intensive
Capital-intensive
Knowledge-intensiveLabour-
intensiveLabour-
intensive
Knowledge-intensive
2045 2055 2005 2015 2025 2035 2045 2055
Figure 7. Allocation of invested capital and employment.
Employment (1000) Capital invested (SEK billion)
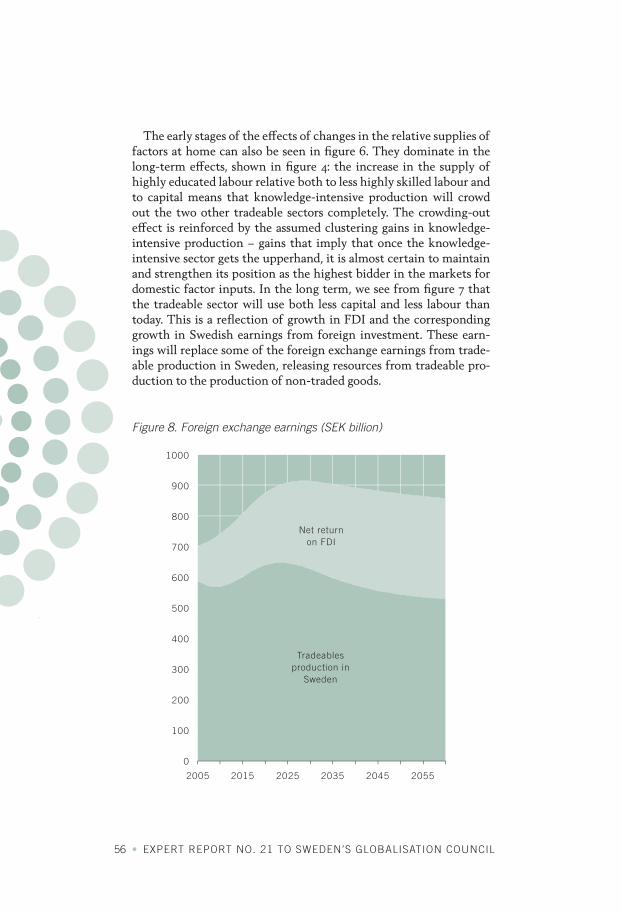
56 • EXPERT REPORT NO. 21 TO SWEDEN’S GLOBALISATION COUNCIL
The early stages of the effects of changes in the relative supplies of factors at home can also be seen in figure 6. They dominate in the long-term effects, shown in figure 4: the increase in the supply of highly educated labour relative both to less highly skilled labour and to capital means that knowledge-intensive production will crowd out the two other tradeable sectors completely. The crowding-out effect is reinforced by the assumed clustering gains in knowledge-intensive production – gains that imply that once the knowledge-intensive sector gets the upperhand, it is almost certain to maintain and strengthen its position as the highest bidder in the markets for domestic factor inputs. In the long term, we see from figure 7 that the tradeable sector will use both less capital and less labour than today. This is a reflection of growth in FDI and the corresponding growth in Swedish earnings from foreign investment. These earn-ings will replace some of the foreign exchange earnings from trade-able production in Sweden, releasing resources from tradeable pro-duction to the production of non-traded goods.
2005 2015
1000
900
800
700
600
500
400
300
200
100
0
Net returnon FDI
Tradeablesproduction in
Sweden
2025 2035 2045 2055
Figure 8. Foreign exchange earnings (SEK billion)
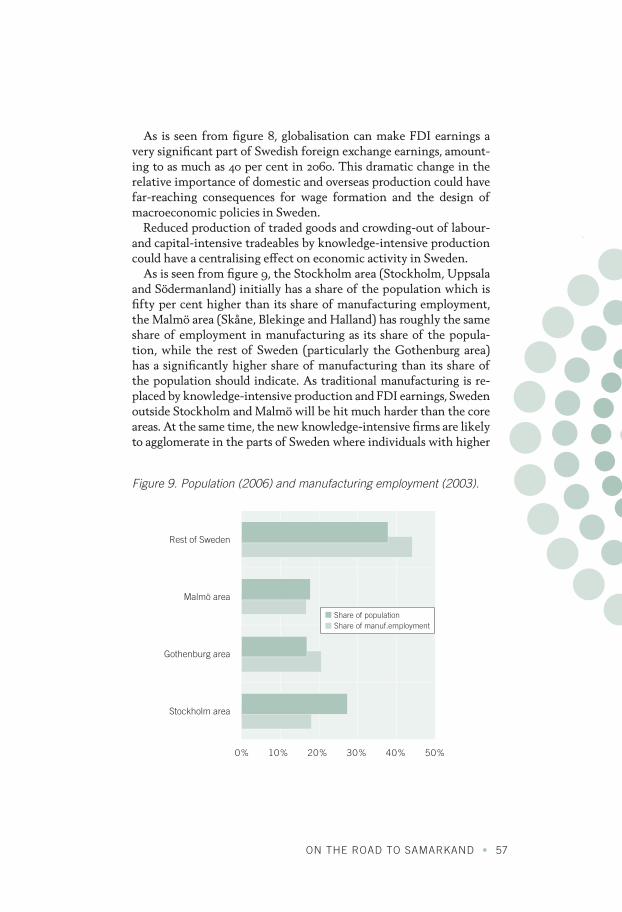
ON THE ROAD TO SAMARKAND • 57
As is seen from figure 8, globalisation can make FDI earnings a very significant part of Swedish foreign exchange earnings, amount-ing to as much as 40 per cent in 2060. This dramatic change in the relative importance of domestic and overseas production could have far-reaching consequences for wage formation and the design of macroeconomic policies in Sweden.
Reduced production of traded goods and crowding-out of labour- and capital-intensive tradeables by knowledge-intensive production could have a centralising effect on economic activity in Sweden.
As is seen from figure 9, the Stockholm area (Stockholm, Uppsala and Södermanland) initially has a share of the population which is fifty per cent higher than its share of manufacturing employment, the Malmö area (Skåne, Blekinge and Halland) has roughly the same share of employment in manufacturing as its share of the popula-tion, while the rest of Sweden (particularly the Gothenburg area) has a significantly higher share of manufacturing than its share of the population should indicate. As traditional manufacturing is re-placed by knowledge-intensive production and FDI earnings, Sweden outside Stockholm and Malmö will be hit much harder than the core areas. At the same time, the new knowledge-intensive firms are likely to agglomerate in the parts of Sweden where individuals with higher
Rest of Sweden
Malmö area
Gothenburg area
Stockholm area
Share of populationShare of manuf.employment
0% 10% 20% 30% 40% 50%
Figure 9. Population (2006) and manufacturing employment (2003).
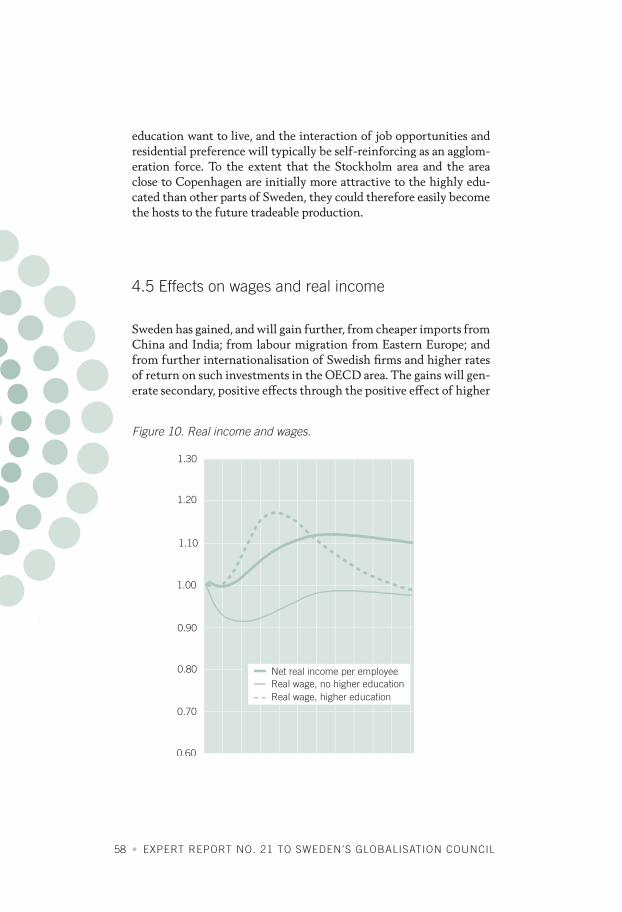
58 • EXPERT REPORT NO. 21 TO SWEDEN’S GLOBALISATION COUNCIL
education want to live, and the interaction of job opportunities and residential preference will typically be self-reinforcing as an agglom-eration force. To the extent that the Stockholm area and the area close to Copenhagen are initially more attractive to the highly edu-cated than other parts of Sweden, they could therefore easily become the hosts to the future tradeable production.
4.5 Effects on wages and real income
Sweden has gained, and will gain further, from cheaper imports from China and India; from labour migration from Eastern Europe; and from further internationalisation of Swedish firms and higher rates of return on such investments in the OECD area. The gains will gen-erate secondary, positive effects through the positive effect of higher
1.30
1.20
1.10
1.00
0.90
0.80
0.70
0.602005 2015 2025 2035 2045 2055
Net real income per employeeReal wage, no higher educationReal wage, higher education
Figure 10. Real income and wages.
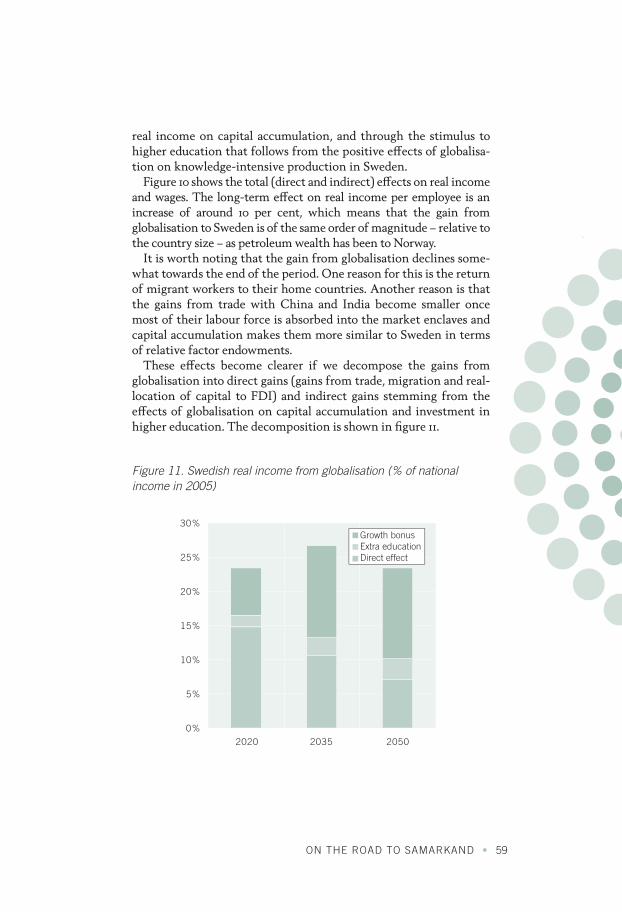
ON THE ROAD TO SAMARKAND • 59
real income on capital accumulation, and through the stimulus to higher education that follows from the positive effects of globalisa-tion on knowledge-intensive production in Sweden.
Figure 10 shows the total (direct and indirect) effects on real income and wages. The long-term effect on real income per employee is an increase of around 10 per cent, which means that the gain from globalisation to Sweden is of the same order of magnitude – relative to the country size – as petroleum wealth has been to Norway.
It is worth noting that the gain from globalisation declines some-what towards the end of the period. One reason for this is the return of migrant workers to their home countries. Another reason is that the gains from trade with China and India become smaller once most of their labour force is absorbed into the market enclaves and capital accumulation makes them more similar to Sweden in terms of relative factor endowments.
These effects become clearer if we decompose the gains from globalisation into direct gains (gains from trade, migration and real-location of capital to FDI) and indirect gains stemming from the effects of globalisation on capital accumulation and investment in higher education. The decomposition is shown in figure 11.
30%
25%
20%
15%
10%
5%
0%2020 2035 2050
Growth bonusExtra educationDirect effect
Figure 11. Swedish real income from globalisation (% of national income in 2005)
60 • EXPERT REPORT NO. 21 TO SWEDEN’S GLOBALISATION COUNCIL
We see that most of the direct gains come relatively early – in 2020 the direct gains are equivalent to 15 per cent of the 2005 GDP; by 2050 the direct gains are only half of that. The gains from induced capital accumulation (the growth bonus) and more investment in education, on the other hand, increase over time and will by 2050 total around 16 per cent of the initial GDP.
The long-term effect on real wages contrasts sharply with the effect on real income. As is seen from figure 10, the long-term effect on wages is close to zero – if anything, the effect is a slight reduction in real wages. This is consistent with the GLOBSIM model results for the OECD area and reflects global factor price equalisation. The implication is that all of the long-term gain from globalisation (and perhaps even more than that) will take the form of capital income.
The distributional implications are more complex in the short to medium term. As is also seen from figure 10, the effects in the first decades are a reduction in the equilibrium real wage for labour with-out higher education, while the incomes of those with higher educa-tion will grow more rapidly than total real income per employee. In the medium term, therefore, capital owners and individuals with higher education will be clear winners, while unskilled workers will lose both in relative and absolute terms.
If all groups are to gain, it is necessary to redistribute the aggregate gains, e.g. by shifting some of the tax burden from wage income to capital. In the medium term, it could also be an alternative to shift the tax burden from low to high wage incomes, but this would reduce the private returns on education and thereby reduce both the stimulus to undergo higher education and the induced gains that it produces.
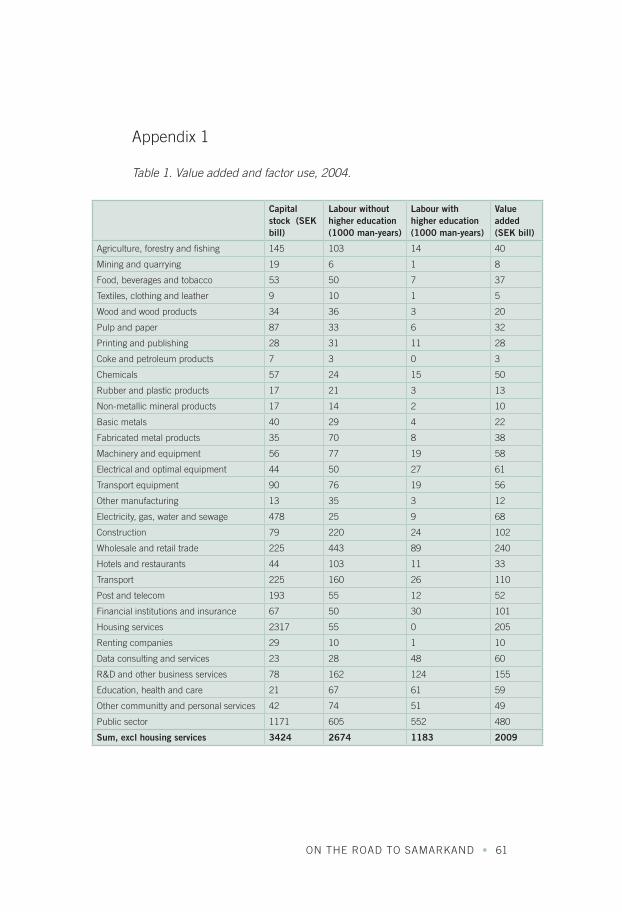
ON THE ROAD TO SAMARKAND • 61
Appendix 1
Capital stock (SEK bill)
Labour without higher education (1000 man-years)
Labour with higher education (1000 man-years)
Value added (SEK bill)
Agriculture, forestry and fishing 145 103 14 40
Mining and quarrying 19 6 1 8
Food, beverages and tobacco 53 50 7 37
Textiles, clothing and leather 9 10 1 5
Wood and wood products 34 36 3 20
Pulp and paper 87 33 6 32
Printing and publishing 28 31 11 28
Coke and petroleum products 7 3 0 3
Chemicals 57 24 15 50
Rubber and plastic products 17 21 3 13
Non-metallic mineral products 17 14 2 10
Basic metals 40 29 4 22
Fabricated metal products 35 70 8 38
Machinery and equipment 56 77 19 58
Electrical and optimal equipment 44 50 27 61
Transport equipment 90 76 19 56
Other manufacturing 13 35 3 12
Electricity, gas, water and sewage 478 25 9 68
Construction 79 220 24 102
Wholesale and retail trade 225 443 89 240
Hotels and restaurants 44 103 11 33
Transport 225 160 26 110
Post and telecom 193 55 12 52
Financial institutions and insurance 67 50 30 101
Housing services 2317 55 0 205
Renting companies 29 10 1 10
Data consulting and services 23 28 48 60
R&D and other business services 78 162 124 155
Education, health and care 21 67 61 59
Other communitty and personal services 42 74 51 49
Public sector 1171 605 552 480
Sum, excl housing services 3424 2674 1183 2009
Table 1. Value added and factor use, 2004.
62 • EXPERT REPORT NO. 21 TO SWEDEN’S GLOBALISATION COUNCIL
Appendix 2
Description of the SEK model
We have developed a numerical simulation model called SEK to ana-lyse the effects of globalisation on the Swedish economy. The SEK model is a simplified version of the so-called CGE models (comput-able general equilibrium models). It is modelled as a Ricardo-Viner/Heckscher-Ohlin model with factor mobility, external economies of scale, technological progress and savings. The model is calibrated on data from 2004 and we simulate the development in a fifty year perspective. Each single year is one period, and there is general equi-librium in each period.
In the SEK model Sweden is modelled as a small, open economy with three input factors of production – capital, labour with higher education and labour without higher education – and four sectors, three sectors producing tradeable goods and one sector producing non-tradeable goods. The three tradeable sectors produce capital-intensive goods, knowledge-intensive goods and labour-intensive goods. There is a given world market price in the three tradeable sectors, and in the non-tradeable sector the equilibrium price is giv-en by domestic supply equal to domestic demand. There is perfect competition in all sectors, and except for the knowledge-intensive sector there are constant returns to scale. In the knowledge-intensive sector there are external economies of scale.
We have also added a neoclassical growth model of the Solow type, where technological progress and growth in labour force are given exogenously, but where capital accumulation is endogenous – deter-mined by gross savings, investment and depreciation. In each period there is a given endowment of the three input factors, and in each period the economy is modelled as a Ricardo-Viner model with a fixed amount of capital in each sector, but labour is mobile between the sectors. The allocation of labour is given by a short-term general equilibrium in each period. Within each period some capital will depreciate while new investment is mobile between the sectors.
ON THE ROAD TO SAMARKAND • 63
The new investments are allocated to the sector with the highest capital return. So in the long run capital is mobile between the sec-tors and the economy will move towards a long-term equilibrium described by a Heckscher-Ohlin model.
We assume a constant saving rate. The saving can be invested in Sweden or as FDI. The relative return between the capital return in Sweden and abroad decides the share of the saving that is allocated in Sweden and abroad.The endowment of labour with higher educa-tion depends on the growth in the population, the rate of employ-ment and the share of the population with higher education.
The endowment of labour without higher education depends on the same parameters, but in addition there will be immigration of labour without higher education from Eastern Europe.
Specification of the model
In the model, sector 1 is the labour-intensive sector, sector 2 is the knowledge-intensive sector, sector 3 is the capital-intensive sector, and sector S is the non-traded sector. The production function in sector i is given by
where X is production, L is labour without higher education, H is labour with higher education, and K is capital. The parameters bi are cost coefficients, αi
L and αiH are given parameters that describe
how intensively the production uses the different factors, and Bi are constants equal to
The unit cost functions are then given by
64 • EXPERT REPORT NO. 21 TO SWEDEN’S GLOBALISATION COUNCIL
(5) for i=1,2,3,S.
(6) ,
(7) .
(8) .
In the short run the endowment of capital and the allocation of capi-tal between the sectors are given. Thus, the demand for labour in sector i is given by
where pi are prices of the goods,
There is a given endowment of labour with and without higher edu-cation in each period. Equilibrium in each period implies that
In each period the capital return in sector i is given by
In each period some capital will be invested as FDI (KFDI ) at a given rate of return equal to rFDI . The remaining capital is invested in Swe-den such that the endowment of capital in Sweden (K) is equal to
where Ki is the stock of investments in sector i.
The national income is equal to the sum of factor incomes
We assume that the demand for non-traded goods forms a constant budget share, g, of the national income such that
(5) for i=1,2,3,S.
(6) ,
(7) .
(8) .
(5) for i=1,2,3,S.
(6) ,
(7) .
(8) .
(5) for i=1,2,3,S.
(6) ,
(7) .
(8) .
ON THE ROAD TO SAMARKAND • 65
The tradeable sectors, consisting of the labour-intensive sector, the knowledge-intensive sector and the capital-intensive sector, must take the world market prices as given. In each period the equilib-rium wages and the production in the non-traded sector are given by the solution of equations (4), (7), and (8).
Technological progress
We assume that technological progress implies an increase in pro-ductivity. Technological progress is modelled as a percentage reduc-tion, ρi < 0, in the unit cost coefficient, bi , from one period to the next. Thus,
where (bi) –1 is the unit cost coefficient in sector i in the previous period.
External economies of scale
In the knowledge-intensive sector we assume that there are external economies of scale. The external economies of scale are linked to the activities both in Sweden and abroad. The size of the scale econo-mies depends on the production in the knowledge-intensive sec-tor in Sweden and on the total Swedish foreign direct investments. Specifically, we have modelled this such that the unit cost coefficient in the knowledge-intensive sector in each period depends on the value of the production in Sweden relative to the value of the initial production, and on the FDI relative to the initial FDI. The larger the knowledge-intensive production in Sweden, and the larger the FDI, the smaller the unit costs. The specific function is given by
66 • EXPERT REPORT NO. 21 TO SWEDEN’S GLOBALISATION COUNCIL
where σ is the elasticity of scale in the knowledge-intensive sector, and ι (called the ‘return commission’) is the weight that tells us how important foreign direct investments are for the external economies
of scale.
Domestic labour supply
Assume that the population in Sweden is given by
where N is the population in a given period, N– 1 is the population in the previous period and n is the growth in the population. Assume that μ is the rate of employment so that the total supply of Swedish labour, E, is equal to
The labour force consists of labour with and without higher educa-tion. Higher education is defined as an education of at least three years at university level. In each period a given share of the labour force, ha , will have higher education. The supply of labour with high-er education, Hdom , is given by
while the domestic supply of labour without higher education, Ldom , is equal to
Gradually, the share of labour with higher education will increase, and in the long run we assume that it will move towards a constant share. How fast the share increases, depends on a parameter φ. We have modelled the share of labour with higher education as follows
ON THE ROAD TO SAMARKAND • 67
(16) ,
(17) .
where (ha)–1 is the share of labour with higher education in the pre-vious period, h* is the long-term share of labour with higher educa-tion and φ is the rate of adjustment towards the long-term share of labour with higher education.
The long-term share of labour with higher education is determined endogenously such that the relative wage between labour with and without higher education in 2060 is equal to the relative wage ini-tially. The initial wage for the two types of labour is such that the net rate of return to higher education is equal to the risk-adjusted net rate of return on capital.
Immigration
We assume that in each period there is some immigration of labour without higher education to Sweden from Eastern Europe. The im-migration depends on the wages in Sweden and in Eastern Europe. Wages in Eastern Europe are assumed to grow at a rate equal to ωf until they are equal to the wages in Sweden. The wage in Eastern Europe, wf , is then equal to
where is the wage in the previous period.
We assume that, for given wages in Sweden, there will be a potential population of immigrants, Apot , who would like to work in Sweden,
Equation (17) can be interpreted as follows: The parameter Q is an upper bound on how many workers who, with the current wages and job opportunities at home and abroad, would like to work in Sweden.
(16) ,
(17) .
(16) ,
(17) .
68 • EXPERT REPORT NO. 21 TO SWEDEN’S GLOBALISATION COUNCIL
The parameter q is a permanent share of the initial queue of workers, Q, who would like to work in Sweden. And the parameter η expresses how sensitive immigration is to differences in the wages between Sweden and Eastern Europe. We assume that the actual immigration is equal to
where λ is the immigration rate of adjustment.
The actual number of immigrants in a given period will then be given by
where A–1 is the actual number of immigrants in the previous period.
The supply of labour
The supply of labour without higher education is equal to the supply of domestic labour without higher education plus the population of immigrants. In the model we treat the immigrants as guest workers. In the first period we do not distinguish between foreign and Swed-ish workers. The supply of labour without higher education is then given by
The supply of labour with higher education is equal to the supply of domestic labour with higher education,
(21) .
(22) ,
(23) ,
(24) .
Sweden Sweden
Sweden
Sweden
ON THE ROAD TO SAMARKAND • 69
(25) .
(26) ,
Sweden Sweden
Savings and investments
Assume there is a constant savings rate equal to s. The savings can be invested in Sweden or as foreign direct investments, which implies that the domestic investment, ΔK, is equal to
where s is the savings rate and
and p1index is the consumer price index for labour intensive goods. It is
a weighted average of the price on labour-intensive goods produced in the OECD area and in China:
The weight, v Sweden, is the share of labour-intensive goods imported from China. Initially this share is equal to v0
Sweden = 0,25. But over time this share changes and it is a weighted average of the consumer share of Chinese labour-intensive goods in the OECD area, v OECD, and the initial share in Sweden:
Furthermore, assume that the investments in a single sector are given by
where r̄ is the average rate of return in Sweden, the parameter κ is a sensitivity parameter for reallocation of capital between the sec-tors, and the parameter δ is the depreciation rate. The first section in equation (26) expresses the investments in sector i based on the domestic savings; the second section expresses the investments in sector i based on reallocation of capital; while the last section ex-presses the depreciation in the sector.
(21) .
(22) ,
(23) ,
(24) .
Sweden Sweden
Sweden
Sweden
(21) .
(22) ,
(23) ,
(24) .
Sweden Sweden
Sweden
Sweden
(21) .
(22) ,
(23) ,
(24) .
Sweden Sweden
Sweden
Sweden
(25) .
(26) ,
Sweden Sweden
70 • EXPERT REPORT NO. 21 TO SWEDEN’S GLOBALISATION COUNCIL
(27) ,
(28) ,
(29) ,
(30) ,
(31) .
(27) ,
(28) ,
(29) ,
(30) ,
(31) .
Foreign direct investment (FDI)
We have modelled Swedish foreign direct investments as so-called horizontal direct investments. The path for return on FDI is given by the GLOBSIM model. But the GLOBSIM model does not have a knowledge-intensive sector, so FDI can be invested in either the capital-intensive, the labour-intensive, or the non-traded sector in the OECD area.
For each type of FDI, we define each year a desired or optimal Swedish-owned foreign capital stock. The optimal stock depends on (i) the size of the sector in the OECD area given by the total amount of investments in the sector, (ii) the initial Swedish foreign invest-ments in the sector relative to the size of the sector, and (iii) the cap-ital rate of return in the particular sector relative to the rate of re-turn on foreign direct investments. The specific function for each type of investments, i, is given by
where is the total investments in the OECD area in sector i, is the gross rate of return on FDI, and ε is the elasticity of the relative rate of return. The initial FDI in sector i, , is calcu-lated as follows:
where m is a parameter that expresses the market potential abroad relative to the domestic market, and θ is a parameter that describes to what extent Swedish firms have initially exploited their foreign market potential.
The flow of net foreign investment is a fraction of the difference between the optimal and the actual capital stock. For each type of investment, i, the function is given by
where ϕ is a fraction that describes how fast the actual FDI adjust towards the optimal stock of FDI.
(27) ,
(28) ,
(29) ,
(30) ,
(31) .
(27) ,
(28) ,
(29) ,
(30) ,
(31) .
(27) ,
(28) ,
(29) ,
(30) ,
(31) .
(27) ,
(28) ,
(29) ,
(30) ,
(31) .
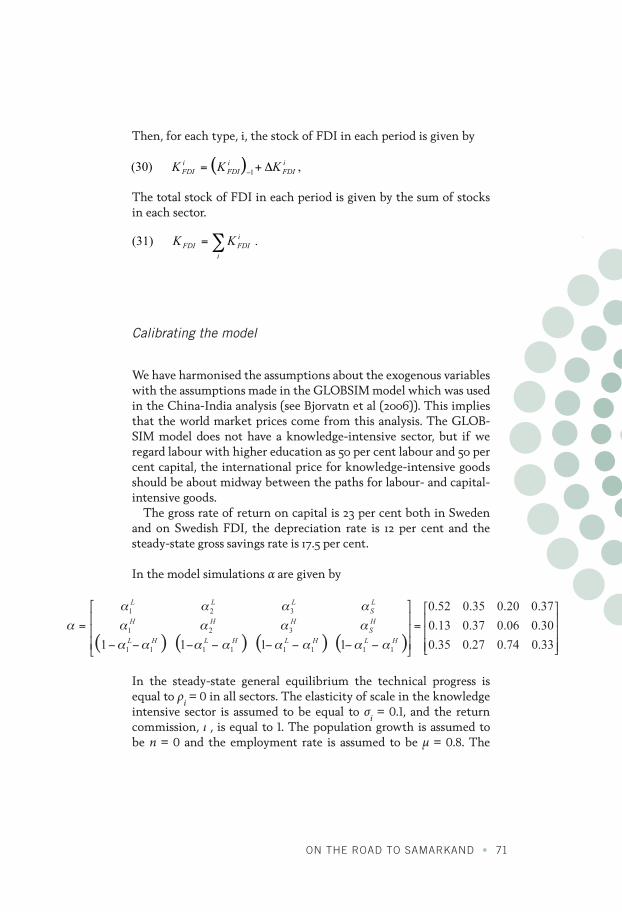
ON THE ROAD TO SAMARKAND • 71
Then, for each type, i, the stock of FDI in each period is given by
The total stock of FDI in each period is given by the sum of stocks in each sector.
Calibrating the model
We have harmonised the assumptions about the exogenous variables with the assumptions made in the GLOBSIM model which was used in the China-India analysis (see Bjorvatn et al (2006)). This implies that the world market prices come from this analysis. The GLOB-SIM model does not have a knowledge-intensive sector, but if we regard labour with higher education as 50 per cent labour and 50 per cent capital, the international price for knowledge-intensive goods should be about midway between the paths for labour- and capital-intensive goods.
The gross rate of return on capital is 23 per cent both in Sweden and on Swedish FDI, the depreciation rate is 12 per cent and the steady-state gross savings rate is 17.5 per cent.
In the model simulations α are given by
In the steady-state general equilibrium the technical progress is equal to ρi = 0 in all sectors. The elasticity of scale in the knowledge intensive sector is assumed to be equal to σi = 0.1, and the return commission, ι , is equal to 1. The population growth is assumed to be n = 0 and the employment rate is assumed to be μ = 0.8. The
(27) ,
(28) ,
(29) ,
(30) ,
(31) .
(27) ,
(28) ,
(29) ,
(30) ,
(31) .
72 • EXPERT REPORT NO. 21 TO SWEDEN’S GLOBALISATION COUNCIL
long-term share of labour with higher education is determined en-dogenously to be equal to h*= 0.41, and we assume that the rate of adjustment towards the long-term share of labour with higher edu-cation is equal to φ = 0.1.
We have assumed that the initial wage in Eastern Europe is one third of the wage in Sweden and that the wage in Eastern Europe will increase by a rate equal to ωf = 0.05. Furthermore, the parame-ters in the equation describing the potential population of immi-grants (equation (17)) are given by Q = 1000, q = 0.4 and the parame-ter that expresses how sensitive immigration is to differences in the wages between Sweden and Eastern Europe is equal to η = 0.5. The adjustment rate for immigration is equal to λ = 0.1.
The initial share of labour-intensive goods imported from China is equal to v0
Sverige = 0.25, and the sensitivity parameter for realloca-tion of capital in Sweden, in equation (26), is assumed to be equal to κ = 4.
The parameter that expresses the market potential abroad relative to the domestic market in equation (28) is assumed to be equal to m = 1,5, while the parameter that describes to what extent Swedish firms have initially exploited their foreign market potential, is as-sumed to be equal to θ = 0.4. The parameter that describes how fast the actual FDI adjusts towards the optimal stock of FDI, is assumed to be equal to ϕ = 0.1.
The model is calibrated on data from 2004. We have used educa-tional data and data from the national accounts for production, capi-tal stocks and labour, while data on FDI come from the Swedish In-stitute for Growth Policy Studies (Institutet for tillväxtpolitiska studier).
ON THE ROAD TO SAMARKAND • 73
References
BJORVATN, K., V. NORMAN, L. ORVEDAL & S. TENOLD (2006). De gode hjelperne. Virkninger av utviklingen i Kina og India for norsk økonomi, SNF-report 30/06.
DUNNING, J. H. (1977). “Trade, location of economic activity and MNE: A search for an eclectic approach,” in B. Ohlin, P. O. Hesselborn and P. M. Wijkman (eds) The international allocation of economic activity, London: Macmillan.
DUNNING, J. H. (1981). International production and the multinational enterprise, London: Allen and Unwin.
THE ECONOMIST (1998). “Control by Dossier in China”, 02.12.1998, www.economist.com
ECOSOC (2005). Trends in total migrant stock. The 2005 Revision. New York: Population Division of the Department of Economic and Social Affairs of the United Nations Secretariat, United Nations.
FAINI, R. & A. VENTURINI (2001). “Home bias and migration: Why is migration playing a marginal role in the globalization process?”, CHILD Working Paper no 27/2001, www.de.unito.it/child
INSTITUTET FöR TILVäxTPOLITISKA STUDIER (2007): Svenksägda koncerner med verksamhet i utlandet 2005, S2007:003.
MUNSHI, KAIVAN & MARK ROSENZWEIG (2006). “Why is mobility in India so low? Social insurance, inequality, and growth”, mimeo.
O’ROURKE, KEVIN (2002). “Europe and the causes of globalization, 1790–2000”, in Henryk Kierzkowski (ed.) Europe and Globalization, Basingstoke: Palgrave Macmillan: 64–68.
O’ROURKE, KEVIN AND JEFFREY WILLIAMSON (1999). Globalization and History, Cambridge: MIT Press.
O’ROURKE, KEVIN & JEFFREY WILLIAMSON (2002). “When did Globalization begin?”, European Review of Economic History, Vol. 6 (1):23–50.
TAYLOR, ALAN M. and JEFFREY WILLIAMSON (1997). “Convergence in the Age of Mass-Migration”, European Review of Economic History, Vol.1(1):27–63.
UNCTAD (2004). Development and Globalization: Facts and Figures. Geneva: United Nations Conference on Trade and Development.
UNCTAD (2006). World Investment Report 2006. Geneva: United Nations Conference on Trade and Development.
UNCTAD (2007). World Investment Report 2007. Geneva: United Nations Conference on Trade and Development.
UNDP (2007). “UNDP 2007/2008 Human Development Report”, New York: United Nations.
WORLD BANK (2003). World Development Indicators, Washington DC: World Bank.
WORLD BANK (2006). Global Economic Prospects – Economic Implications of Remittances and Migration. Washington DC: World Bank.
74 • EXPERT REPORT NO. 21 TO SWEDEN’S GLOBALISATION COUNCIL
Brief presentation of the authors:
Kjetil Bjorvatn is professor at the Norwegian School of Economics and Business Administration (NHH) and is affiliated with the Insti-tute for Research in Economics and Business Administration (SNF). His main research interest is development economics. Publication: Bjorvatn, K. (2004). “Economic integration and the profitability of cross-border mergers and acquisitions,” European Economic Review 48: 1211–1226
Victor D. Norman is professor at the Norwegian School of Economics and Business Administration (NHH) and is affiliated with the Insti-tute for Research in Economics and Business Administration (SNF). His main research area is international economics.
Linda Orvedal is associate professor at the Norwegian School of Economics and Business Administration (NHH) and is affiliated with the Institute for Research in Economics and Business Adminis-tration (SNF). Her main research area is international economics.