Embed Size (px)
DESCRIPTION
by Yuko Nishida, at Japan - Malaysia Symposium on Sustainable Cities In Asia, 22 January 2013 at Berjaya Times Square Hotel, KL
Citation preview
Yuko Nishida Bureau of Environment
Tokyo Metropolitan Government
20120122 Symposium on Sustainable Cities in Asia
On the Path
to a Low Carbon City, Tokyo
Agenda
1.Tokyo: Sustainable?
2.What we do to be a sustainable city?
3.How it works?
4.What we learned?
1. Tokyo: Sustainable?

2. What we do to be a sustainable city?
Tokyo cap& trade
TMG green building program
Carbon reduction reporting program
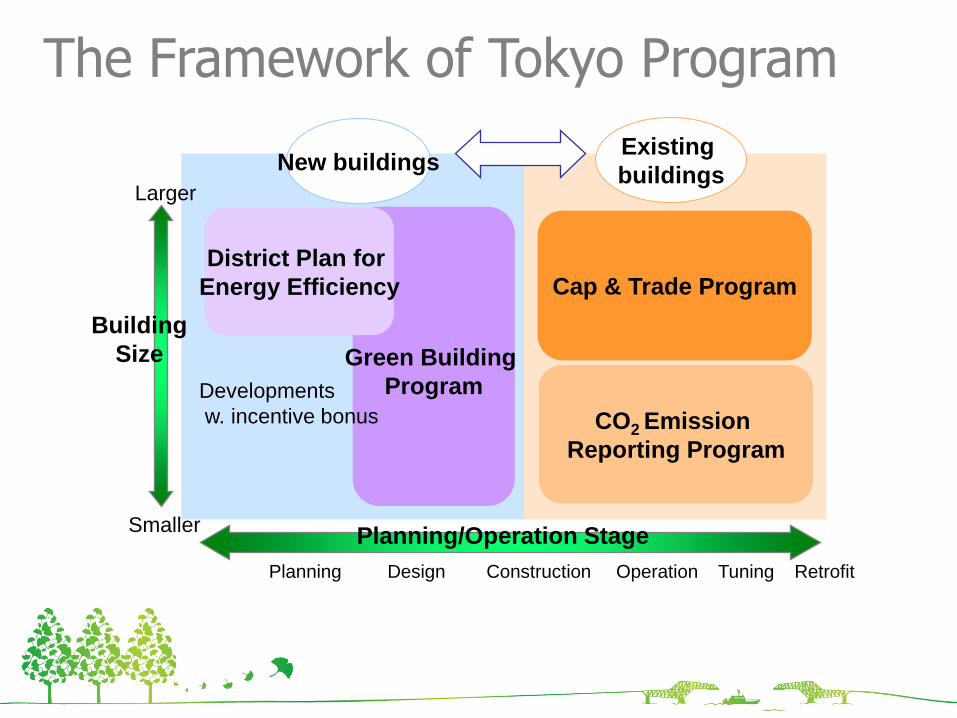
The Framework of Tokyo Program
Planning Design Construction Operation Tuning Retrofit
CO2 Emission
Reporting Program
Green Building
Program
Cap & Trade Program
Larger
New buildings Existing
buildings
Smaller
Building
Size
Planning/Operation Stage
District Plan for
Energy Efficiency
Developments
w. incentive bonus
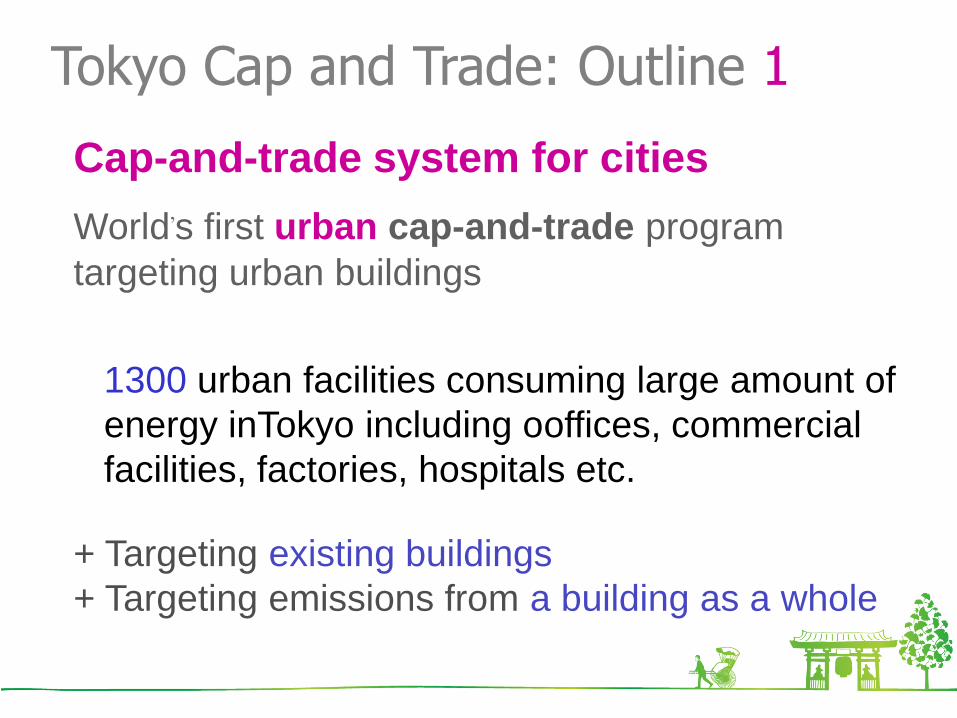
Tokyo Cap and Trade: Outline 1
Cap-and-trade system for cities
World’s first urban cap-and-trade program
targeting urban buildings
1300 urban facilities consuming large amount of
energy inTokyo including ooffices, commercial
facilities, factories, hospitals etc.
+ Targeting existing buildings
+ Targeting emissions from a building as a whole
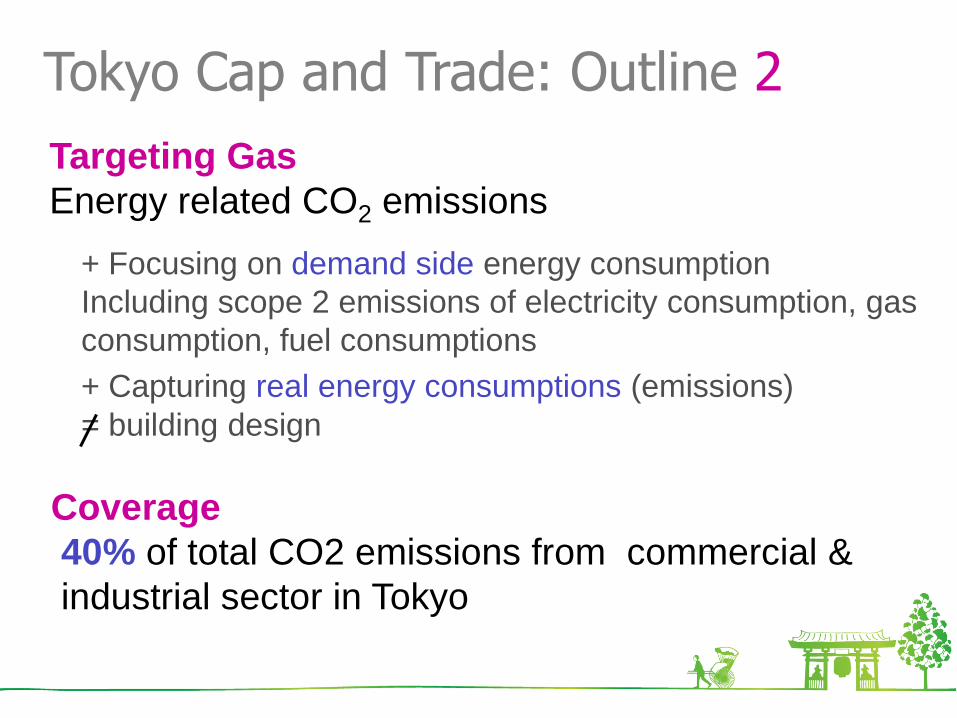
Tokyo Cap and Trade: Outline 2
Targeting Gas
Energy related CO2 emissions
+ Focusing on demand side energy consumption
Including scope 2 emissions of electricity consumption, gas
consumption, fuel consumptions
+ Capturing real energy consumptions (emissions)
= building design
Coverage
40% of total CO2 emissions from commercial &
industrial sector in Tokyo
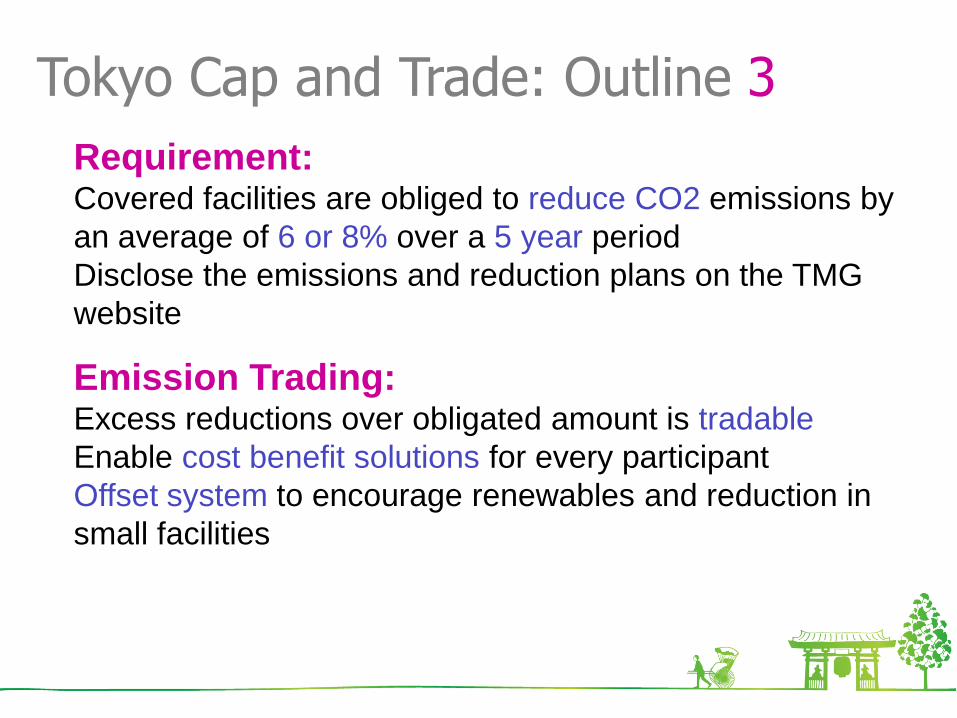
Tokyo Cap and Trade: Outline 3
Requirement: Covered facilities are obliged to reduce CO2 emissions by
an average of 6 or 8% over a 5 year period
Disclose the emissions and reduction plans on the TMG
website
Emission Trading: Excess reductions over obligated amount is tradable
Enable cost benefit solutions for every participant
Offset system to encourage renewables and reduction in
small facilities

TMG Green Building Program 1
Coverage: Newly planned large buildings (over 5,000 sq. Meters)
Requirement:
Submit sustainable design plan with its ratings
Satisfy energy standard of Tokyo
Covering 40% of new buildings
Rating and disclosure system for new buildings to promote sustainable design

TMG Green Building Program 2
Rating: 12 items in 4categories are rated
based on the TMG guideline
Disclosure:
Rated results are disclosed
on the TMG website
Rating and disclosure system for new buildings
Category Items
Energy Heat load resistance of the building envelope
Renewable energy
Energy efficient building system (equipments)
Efficient control systems
Resources
Material
Eco-materials
Protection of ozone layers
Longer building life expectancy
Hydrological cycle
Natural
environment Greening (vegetation, landscape, etc.), bio-diversity
Heat-Island
effect
Atmospheric heat waste
Surface of ground and buildings
Wind environment

TMG Green Building Program 3
Green Labeling Program
for Condominiums (2005~)
Labeling programs based on the GBP Energy Efficient Certificate System
for non-residential buildings (2010~)
Incentive planning and zoning
Utilizing the GBP ratings as a prerequisite

Carbon Reduction Reporting for small and medium facilities 1
Target: Small & medium emitters not covered by the Tokyo C&T
Requirement: Reporting annual CO2 emissions and their reduction plan
Disclose on the TMG website
Over 34,000 facilities are reporting including 10,000 volunteers

Carbon Reduction Reporting 2
Benchmarking 22 building-use categories in 7 ratings

3. How it works?
Results of the programs
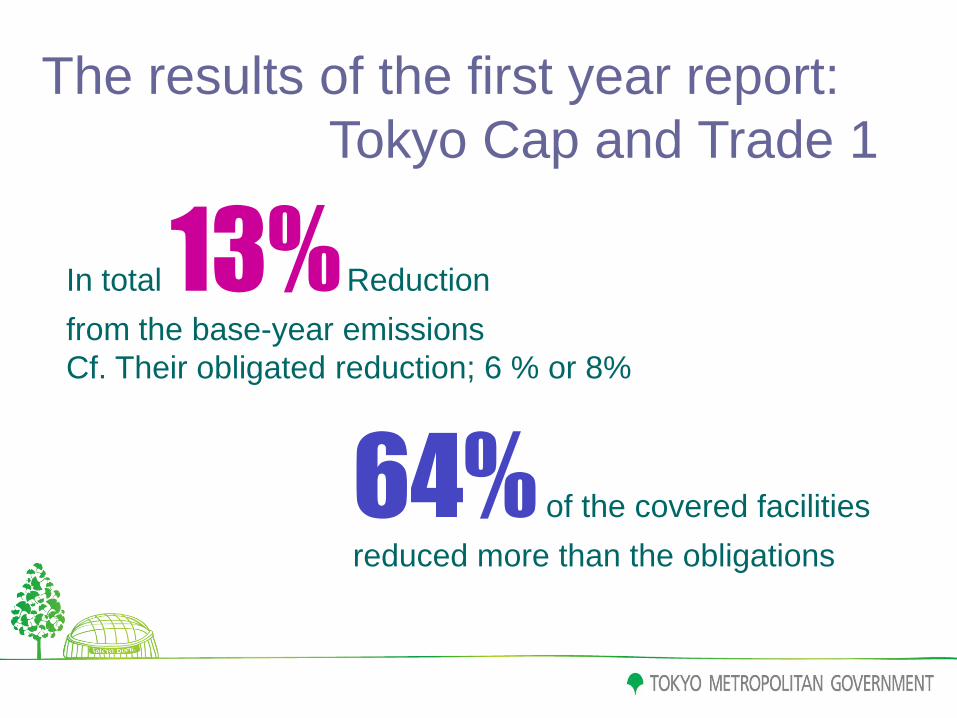
The results of the first year report:
Tokyo Cap and Trade 1
In total 13% Reduction
from the base-year emissions
Cf. Their obligated reduction; 6 % or 8%
64% of the covered facilities
reduced more than the obligations

The results of the first year report:
Tokyo Cap and Trade 2
Category # of
measures
Examples
AIr Conditioning & Ventilation
1,602 System Upgrade, tempreture-humidduty control, Control of air intake...
Lighting, other power use equipments
1,436 Introduce Hf, LED, low-eenrgy guidelight, sensors for controlling, high efficient transformer...
Heat source 897 System Upgrade, Introduce inverters,
Hot water, water supply, refregerator
302 Introduce water-saving toilet, upgrade refregerators, vending machines...
General management 275 Tenant inclusion(joint EE team, data sharing...), tunings,control system upgrade
Measures Taken

The results of the first year report:
Tokyo Cap and Trade 2
Reductions by Facility Type (Major ones)
Type #s Reduction%
Factory 134 22%
Water & Swege 39 5%
Waste management
16
22%
Type #s Reduction%
Office 509 12%
SC, Commercial F. 172 10%
Hospitals 64 7%
Schools 57 5%
Hotels 41 8%
Data center 32 1%
Cultural Fcility 24 13%
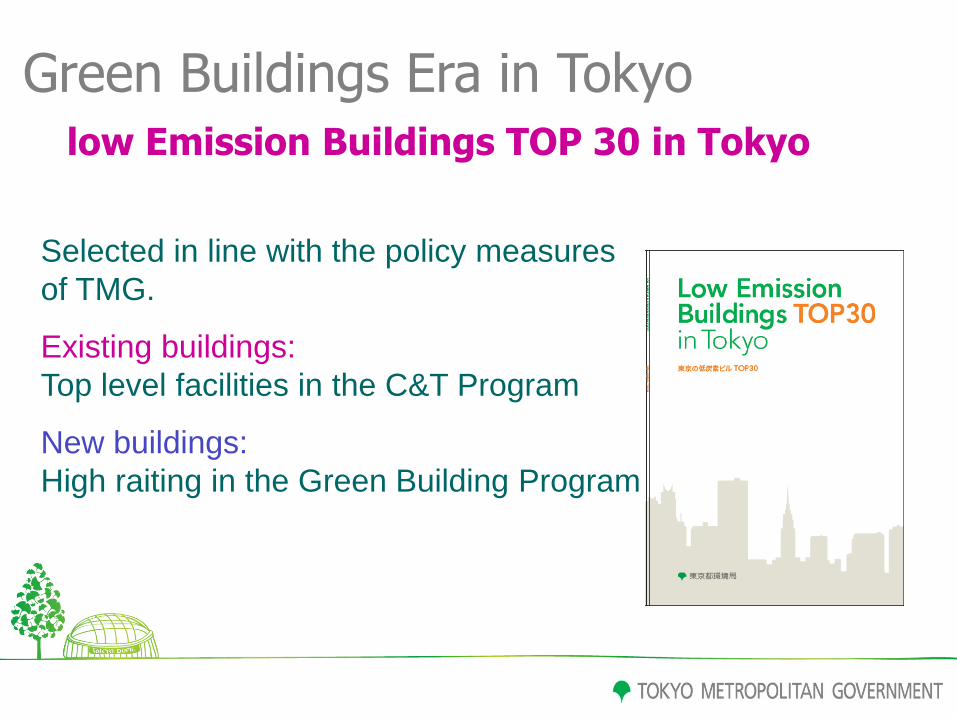
Green Buildings Era in Tokyo low Emission Buildings TOP 30 in Tokyo
Selected in line with the policy measures
of TMG.
Existing buildings:
Top level facilities in the C&T Program
New buildings:
High raiting in the Green Building Program

Roppongi Hills Mori Building Co., Ltd.
Sony City Sony Corporation
Existing Building Section
Tokyo Midtown Mitsui Fudosan Co., Ltd. East Japan Railway Company Mitsubishi Estate Co., Ltd.
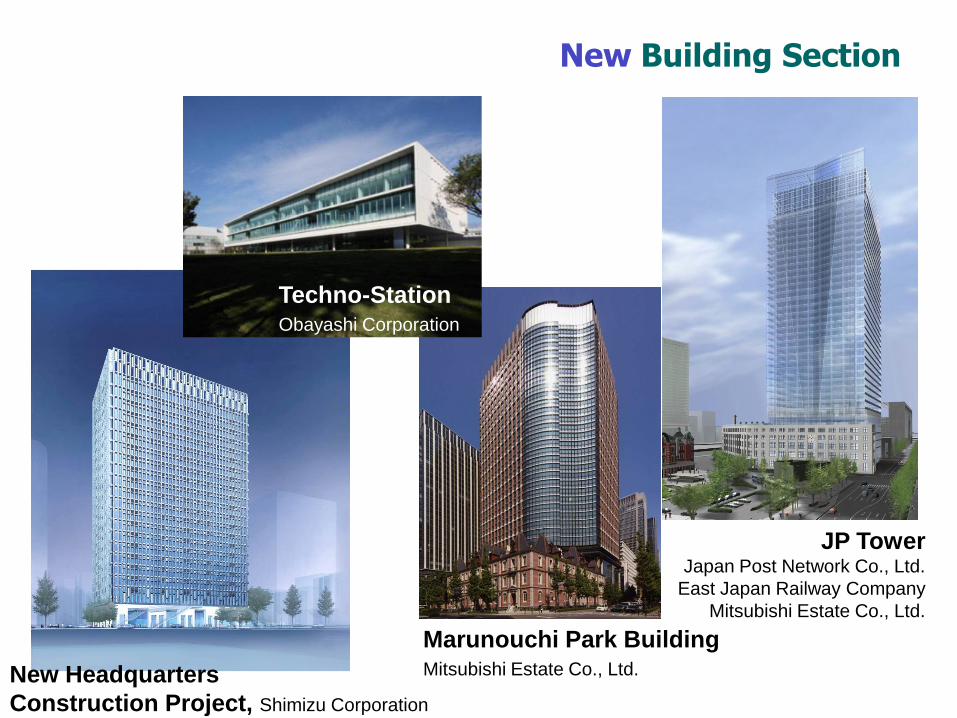
New Building Section
Marunouchi Park Building Mitsubishi Estate Co., Ltd.
Techno-Station Obayashi Corporation
JP Tower Japan Post Network Co., Ltd.
East Japan Railway Company
Mitsubishi Estate Co., Ltd.
New Headquarters
Construction Project, Shimizu Corporation
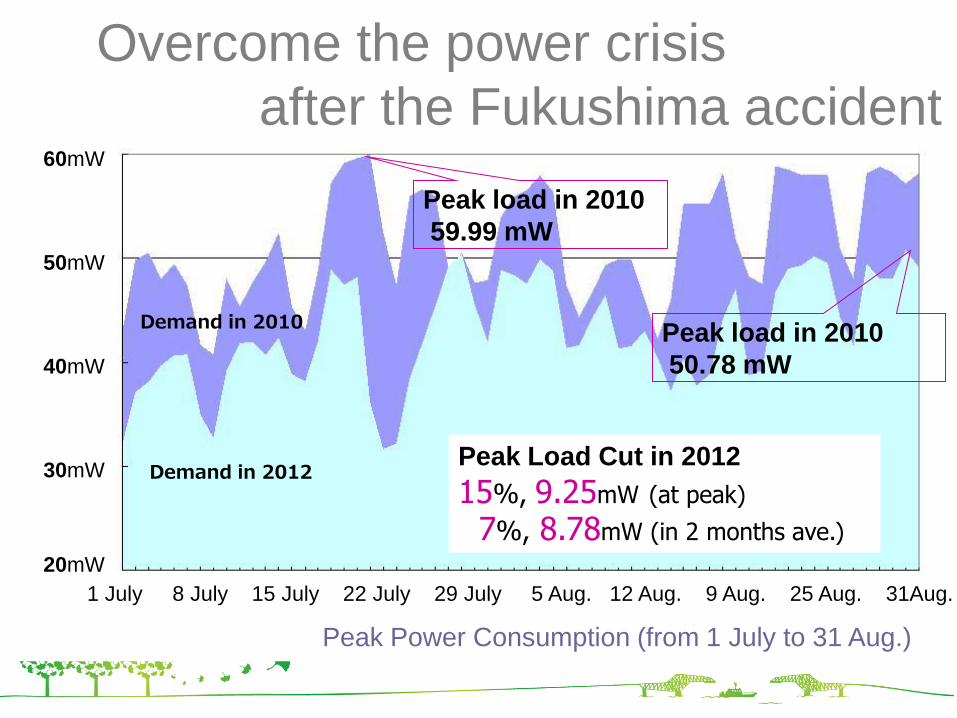
Overcome the power crisis
after the Fukushima accident
Demand in 2010
Demand in 2012
1 July 8 July 15 July 22 July 29 July 5 Aug. 12 Aug. 9 Aug. 25 Aug. 31Aug.
Peak load in 2010
59.99 mW
Peak load in 2010
50.78 mW
Peak Load Cut in 2012
15%, 9.25mW (at peak)
7%, 8.78mW (in 2 months ave.)
60mW
50mW
40mW
30mW
20mW
Peak Power Consumption (from 1 July to 31 Aug.)
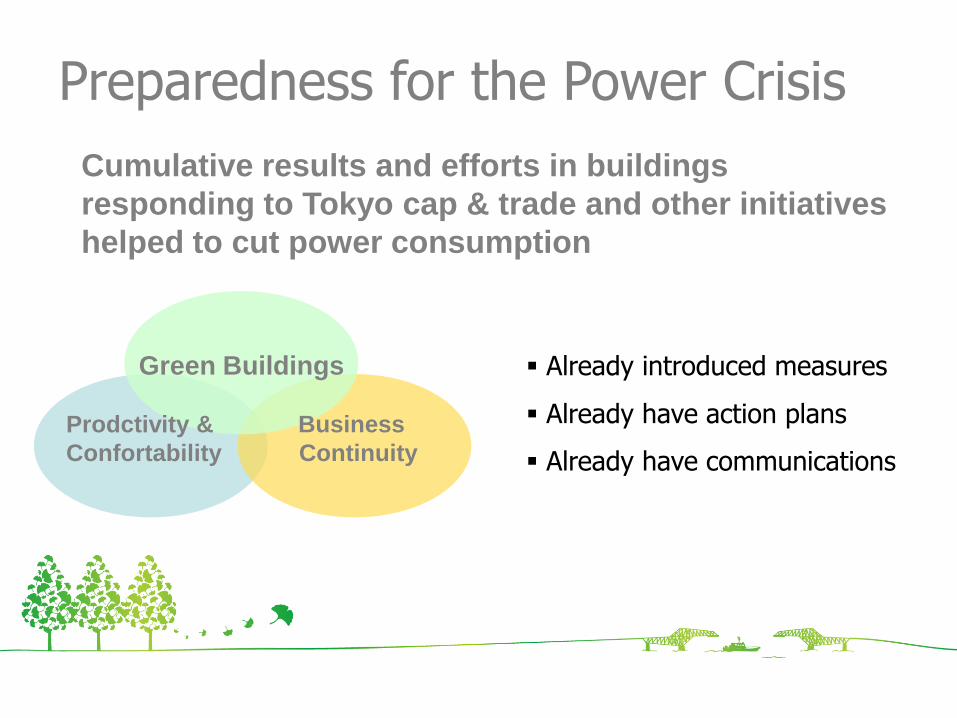
Cumulative results and efforts in buildings
responding to Tokyo cap & trade and other initiatives
helped to cut power consumption
Preparedness for the Power Crisis
Already introduced measures
Already have action plans
Already have communications
Green Buildings
Prodctivity &
Confortability
Business
Continuity
4. What we learned?
Five misunderstandings for energy efficiency
Key factors for success from policy perspective

Need to break misunderstandings on building energy efficiency
1. We have already done a lot!
2. We know our buildings well, there’s nothing else we can do!
3. It’s costly to retrofit. We can not afford it!
Typical complaints from building owners
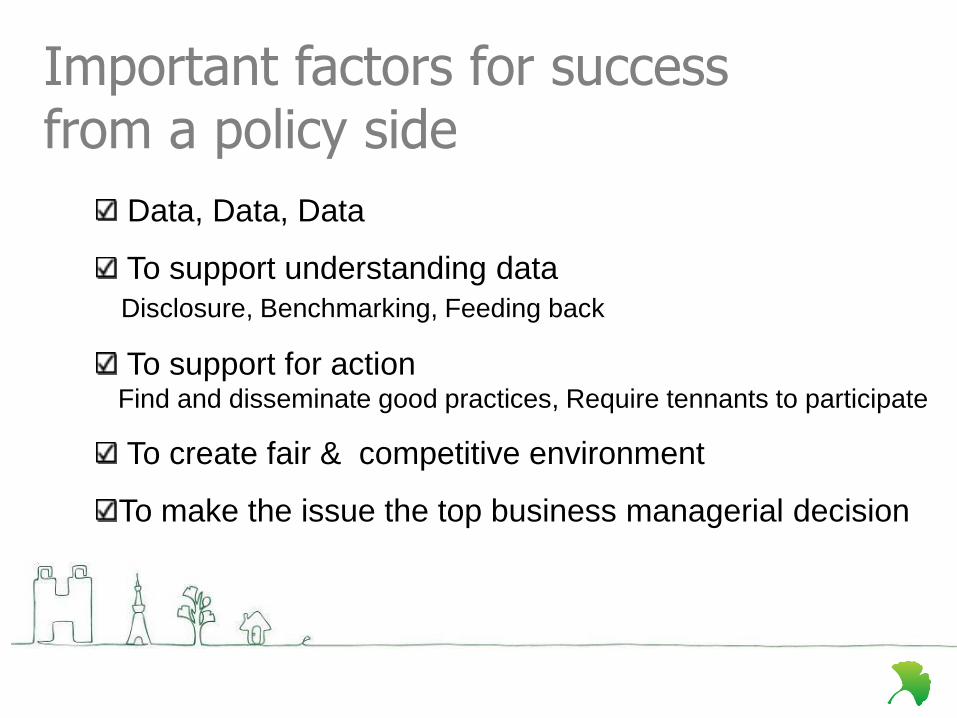
Important factors for success from a policy side
Data, Data, Data
To support understanding data
Disclosure, Benchmarking, Feeding back
To support for action Find and disseminate good practices, Require tennants to participate
To create fair & competitive environment
To make the issue the top business managerial decision

Sharing knowledge and experiences in depth
Mutual Learning is the Key

World Green Building Council
Government Leadership Award
“Most Groundbreaking Policy” To Tokyo
On the way to a sustainable city
:Tokyo

Reference
TMG Website www.kankyo.metro.tokyo.jp/enf
Tokyo Cap& trade www.kankyo.metro.tokyo.jp/en/climate/cap_and_trade.html
www.kankyo.metro.tokyo.jp/en/int/TOP30_English.pdf
Low Emission Building TOP 30 in Tokyo www.kankyo.metro.tokyo.jp/en/int/top30.html
Green Building Program www.kankyo.metro.tokyo.jp/en/climate/build.html
Contact [email protected]