Embed Size (px)
Citation preview
WORKING PAPER SERIES IN PRODUCTION AND ENERGY
KIT – The Research University in the Helmholtz Association www.iip.kit.edu
On the Long-Term Efficiency ofMarket Splitting in Germany
By Christoph Fraunholz, Dirk Hladik, Dogan Keles, Dominik Möst, Wolf Fichtner
No. 38 | FEBRUARY 2020
On the Long-Term Efficiency ofMarket Splitting in Germany
Christoph Fraunholz*1, Dirk Hladik2, Dogan Keles1,Dominik Möst2, Wolf Fichtner1
1Chair of Energy Economics, Institute for Industrial Production (IIP),Karlsruhe Institute for Technology (KIT),Hertzstr. 16, 76187 Karlsruhe, Germany2Chair of Energy Economics, Technische Universität Dresden,Münchner Platz 3, 01069 Dresden, Germany*Corresponding author, email address: [email protected],tel.: +49 721 608-44668
In Europe, the ongoing renewable expansion and delays in the planned grid extension have intensified the discussion about an adequate electricity market design. Against this background, we jointly apply an agent-based electricity market model and an optimal power flow model to investigate the long-term impacts of splitting the German market area into two price zone. Our approach allows capturing long-term investment and short-term market behavior under imperfect information. We find strong impacts of a German market splitting on electricity prices, expansion planning of generators and required congestion management. While the congestion volumes decrease significantly under a market split in the short term, the optimal zonal configuration for 2020 becomes outdated over time due to dynamic effects like grid extension, renewable expansion and new power plant investments. Policymakers and regulators should therefore regularly re-assess bidding zone configurations. Yet, this stands in contrast to the major objective of price zones to create stable locational investment incentives.
On the Long-Term Efficiency ofMarket Splitting in Germany
Christoph Fraunholz∗1, Dirk Hladik2, Dogan Keles1, Dominik Most2,Wolf Fichtner1
1Karlsruhe Institute of Technology, Chair of Energy Economics, Hertzstraße 16, D-76187Karlsruhe
2Technische Universitat Dresden, Chair of Energy Economics, Munchner Platz 3,D-01069 Dresden
February 13, 2020
Abstract
In Europe, the ongoing renewable expansion and delays in the planned gridextension have intensified the discussion about an adequate electricity marketdesign. Against this background, we jointly apply an agent-based electricitymarket model and an optimal power flow model to investigate the long-termimpacts of splitting the German market area into two price zone. Our ap-proach allows capturing long-term investment and short-term market behav-ior under imperfect information. We find strong impacts of a German marketsplitting on electricity prices, expansion planning of generators and requiredcongestion management. While the congestion volumes decrease significantlyunder a market split in the short term, the optimal zonal configuration for2020 becomes outdated over time due to dynamic effects like grid extension,renewable expansion and new power plant investments. Policymakers and reg-ulators should therefore regularly re-assess bidding zone configurations. Yet,this stands in contrast to the major objective of price zones to create stablelocational investment incentives.
∗Corresponding author, email address: [email protected]
1
Nomenclature
Parameters
∆t time step length [h]
η efficiency [MWhel/MWhth]
cvar average variable costs [EUR/MWhel]
cadd specific costs of artificial load [EUR/MWhel]
ccurt specific costs of curtailment [EUR/MWhel]
cO&M operation and maintenance costs
[EUR/MWhel]
cvar,max maximum variable costs [EUR/MWhel]
cvar,rev reverted variable costs [EUR/MWhel]
cvar variable costs [EUR/MWhel]
cvoll specific costs of lost load [EUR/MWhel]
efuel emission factor [tCO2/MWhth]
lgross gross load [MWhel]
lnet net/residual load [MWhel]
pCO2 CO2 price [EUR/tCO2]
pfuel fuel price [EUR/MWhth]
Sets and Indices
e transmission line
h hour
hoff offline hour
hon online hour
m market area
n grid node
p power plant
pcon conventional power plant
pren renewable power plant
pstor storage power plant
s scenario
y year
Variables
∆p relative day-ahead price difference [–]
∆psorted sorted day-ahead price difference
[EUR/MWhel]
λ locational marginal price [EUR/MWhel]
p average day-ahead price [EUR/MWhel]
b bid price [EUR/MWhel]
bmin bid price for minimal load [EUR/MWhel]
brest bid price for rest load [EUR/MWhel]
Ccong total costs of congestion management [EUR]
Ccurt total costs of curtailment [EUR]
Cinf total infeasibility costs [EUR]
Credisp total costs of redispatching [EUR]
cstart specific start up costs [EUR/MWel]
fAC net flow AC [MWhel]
fDC net flow DC [MWhel]
g electricity generation [MWhel]
gmarket market-dispatched electricity generation
[MWhel]
ladd artificially added load [MWhel]
lcharge storage charging demand [MWhel]
ldump dumped load [MWhel]
toff offline time [h]
ton online time [h]
2
1 Introduction
Driven by the massive expansion of renewable electricity generation as well as polit-ical phase-out decisions of technologies such as nuclear or coal-fired generation, thedesign of the European electricity markets is in a state of constant evolution. Anaspect of particular relevance in this respect is the design of the day-ahead marketsand the closely related congestion management. Currently, following the concept ofzonal pricing, the day-ahead market clearing of the interconnected European elec-tricity system is carried out without considering any grid constraints within a pricezone, which in most cases corresponds to a whole country. Only in a subsequentstep, congestion management measures, such as redispatching and curtailment ofgeneration from renewable energy sources (RES), are used if the market outcome isnot realizable due to intra-zonal congestion. Due to recent and upcoming trends,congestion management becomes increasingly important in Germany:
• Large generation capacities, mainly located in Southern Germany, are droppingout of the market until 2022 due to the political decision of phasing-out nu-clear power. Moreover, the German Kommission fur Wachstum, Strukturwandelund Beschaftigung (commonly called Kohlekommission) has recently agreed ona phase-out of coal-fired generation until 2038, which will particularly affect re-gions in the West (Rhineland) and East (Lusatia, Central German district) of thecountry (Bundesministerium fur Wirtschaft und Energie, 2019).• Electricity generation from wind power has increased significantly over the past
years and is expected to continue to do so. However, these generation capacitiesare to a large extent located in Northern Germany.• Low wholesale electricity prices provide poor incentives for investments in addi-
tional conventional generation capacity or utility-scale storage units.• While these developments result in a shift of generation capacity to Northern
Germany, the industrial load centers with a rather inflexible demand structureare mainly located in Western and Southern Germany. In the past years, thislocational mismatch between generation and consumption has already led to anincreasing number of hours where the market result had to be corrected by re-dispatching and curtailment of RES (Bundesnetzagentur and Bundeskartellamt,2019). Moreover, Poland and the Czech Republic have already installed phaseshifters to reduce loop flows from Northern Germany to Southern Germanythrough their domestic grid.• Although new high-voltage direct current (HVDC) lines are supposed to solve
these issues to a large extent, their completion is likely to be delayed by a fewyears.
3
Apart from resulting in additional costs for congestion management, these trendsmight also endanger security of supply in (Southern) Germany in the upcomingyears. Regional price signals could help to counteract these risks by incentivizinginvestments in generation capacity or avoiding decommissioning of further powerplants by adequately indicating regional scarcity.
In this context, nodal pricing is often considered to be the theoretically first bestsolution as prices in this market design directly reflect not only marginal generationcosts but also bottleneck costs (Stoft, 1997). This concept is currently for instanceused in the PJM market area of the USA and in New Zealand (Pettersen et al.,2011). However, a short-term implementation of nodal pricing in Germany or evenEurope is unlikely (Trepper et al., 2015).
Alternatively, country price zones can be split up into multiple zones, suchas those in the Nordic electricity market (Norway, Sweden, Finland, Denmark)(THEMA Consulting Group, 2013), resulting in diverging electricity prices and there-fore regional investment incentives. With regard to Germany, this solution mightbe quicker and easier to implement than a nodal pricing approach. However, thecurrent German government is strongly in favor of staying with a single Germanprice zone and has recently even changed the legislation (Stromnetzzugangsverord-nung – StromNZV ) accordingly (Bundesministerium fur Wirtschaft und Energie,2017). Nevertheless, the topic remains highly relevant not only from an academicand political perspective, but also for generation companies and grid operators.
While the short-term impacts of dividing the German price zone have alreadybeen extensively analyzed by different authors (Burstedde, 2012; Breuer et al., 2013;Breuer and Moser, 2014; Trepper et al., 2015; Egerer et al., 2016; Plancke et al.,2016), the only investigations of the long-term impacts to date have been carried outby Grimm et al. (2016a,b, 2017, 2018) and Ambrosius et al. (2019). Yet, as Grimmet al. (2016b) point out, the consideration of these long-term effects is an essentialaspect for the political discussion on concrete splitting of zones.
Against this background, we use an innovative modeling framework consistingof an agent-based electricity market simulation model (PowerACE) and an optimalpower flow model (ELMOD) to investigate the long-term impacts of splitting theGerman price zone. Contrary to the method used in Ambrosius et al. (2019), thisnew approach allows to consider multiple time periods with regard to generation andstorage expansion planning and is therefore able to capture the real-world long-termdynamics appropriately.
Our results focus on the German day-ahead market, required congestion manage-ment measures as well as associated system costs and distributional effects under azonal split as compared to the status quo of a single German price zone. Despite the
4
explicit focus on Germany, the obtained results are also relevant for other regionsusing multiple price zones within a country, such as the Nordic electricity market orItaly.
The remainder of the paper is structured as follows. In Section 2, we briefly reviewthe relevant literature and derive the research gap our paper aims to fill. Section 3introduces the proposed modeling framework and explains important methodologicalaspects in details. We then describe the most relevant input data as well as thescenario definition in Section 4. In Section 5, we present possible long-term impactsof splitting the German price zone. Ultimately, Section 6 provides a summary andan outlook on future work.
2 Literature Review and Research Gap
In the following, an overview of the previous literature relevant for this article isprovided. Firstly, we briefly review existing methods for bidding zone delimination.Secondly, the focus is set on the short-term impacts of reconfiguring the Europeanprice zones and splitting the German price zone in particular. Thirdly, we summarizeliterature on the long-term impacts of such market design changes. Ultimately, weoutline the research gap that this paper aims to fill.
Regarding the bidding zone configuration method, four main approaches can bedistinguished. Firstly, the zonal delimination is based on historical real-world gridcongestion (Egerer et al., 2016; Plancke et al., 2016). Secondly, splitting a pricezone can be conducted along the main bottlenecks of the transmission grid for afuture reference year (Trepper et al., 2015). Thirdly, nodal electricity prices areclustered, e.g., by using genetic algorithms (Breuer et al., 2013; Breuer and Moser,2014). Fourthly, a new bidding zone configuration is determined model-endogenously(Grimm et al., 2017; Ambrosius et al., 2019). In the paper at hand, we assume theregulator to base his decision on the division of the German price zone on knowledgeavailable to him at the time of decision-making. For this reason, nodal prices ofthe year 2020 are clustered using a fuzzy c-means algorithm, rather than applying amodel-endogenous approach (see Section 3).
Reconfiguring European bidding zones brings along a number of short-term im-pacts, which have already been extensively analyzed in several studies to date. Therelevant contributions are shortly presented in the next paragraphs.
Burstedde (2012) compares a nodal pricing approach and a zonal configurationbased on the clustering of nodal prices on a European level for the scenario years 2015and 2020. Both variants are then contrasted with the current situation of nation-
5
wide price zones in terms of generation and redispatching costs. While the costs ofredispatching are significantly reduced when the current zones are reconfigured andeven more so under the nodal pricing approach, the rise of generation costs almostentirely compensates this effect.
Breuer et al. (2013) and Breuer and Moser (2014) apply genetic algorithms for thescenario years 2016 and 2018 in order to deduce an optimal zonal configuration on aEuropean level from nodal prices. They investigate different numbers of zones andultimately conclude that reconfiguring the European price zones into 10 to 15 newzones, the costs of redispatching would decrease more than the costs of generationwould rise as compared to the reference case. However, also in these studies, thesavings are very low in relation to the total traded electricity volume.
Trepper et al. (2015) investigate a splitting of the German price zone based onthe most heavily congested lines for the scenario year 2020. With trading capacitiesof 10.2–15.3 GW, the redispatching volumes decrease significantly and average pricedifferences of 1.55–3.56 EUR/MWhel between the two new zones occur. Moreover,the authors find decreasing producer rents and increasing consumer rents in NorthernGermany, while the opposite is true for Southern Germany.
Egerer et al. (2016) analyze a splitting of the German price zone for the years2012 and 2015 without taking into account the German neighboring countries. Witha trading capacity of 8 GW, only small average price differences of 0.40 EUR/MWhel
(2012) and 1.70 EUR/MWhel (2015) between the two German zones arise. Redis-patching volumes decrease slightly in 2012 and more significantly in 2015.
Plancke et al. (2016) apply a European spot market model to a scenario for theyear 2020 and examine the European impact of a splitting of the German price zone.Assuming a trading capacity of 8 GW, the average price differences between the twozones amount to 5.16 EUR/MWhel. While the greatest changes in consumer rentsand producer rents can be observed in Germany, to a lesser extent, many neighboringcountries are also affected. Since the authors don’t use an additional grid model, noanalyses on the changes in redispatching volumes and costs are carried out.
All of the studies mentioned so far focus on the static short-term perspectivewithout taking into account dynamic long-term aspects, such as the impact on in-vestments in new generation capacity. The literature tackling these particular issues,as presented in the following, is substantially less extensive to date.
Applying an integrated generation investment, spot market and redispatchingmodel to a small-scale test network, Grimm et al. (2016b) provide a theoreticalanalysis of potential long-term welfare effects of splitting up price zones under con-sideration of investment behavior. In their work, they explicitly point out that forthe political discussion regarding concrete splitting of zones, the consideration of
6
such long-term impacts is essential for decision making.This aspect is further investigated in a number of additional contributions
(Grimm et al., 2016a, 2017, 2018; Ambrosius et al., 2019), all of which apply mul-tilevel equilibrium models considering both the electricity market and the electricalgrid.
In Grimm et al. (2016a), a model with decision levels for line expansion, gen-eration capacity expansion and spot market including redispatching is introduced,formally analyzed and applied to a small-scale case study. Grimm et al. (2018) thenextend this model and investigate different market design changes including marketsplitting for a strongly simplified representation of the German electricity systemand a single future year (2035). The division of the German price zone is conductedin a simplified fashion along the borders of some German federal states. The authorsfind that the locational price signals occurring under market splitting induce a moreefficient allocation of conventional power plants. This, in turn, reduces the need forgrid expansion. Moreover, the choice of appropriate transfer capacities between thetwo German zones proves to be crucial.
The first decision level of Grimm et al. (2016a) is modified in Grimm et al.(2017) in order to model-endogenously derive an optimal specification of price zonesinstead of deciding on line investments. While Grimm et al. (2017) focus on so-lution algorithms and highly-aggregated test cases, Ambrosius et al. (2019) use anagain slightly modified version of this model to derive an optimal delimination of theGerman price zone under consideration of anticipated generation capacity expansionas well as spot market trading and redispatching. A novelty of this contribution isthe model-endogenous determination of the transfer capacities between the differentGerman price zones. The extended model is applied to a strongly simplified repre-sentation of the German electricity system in a single future year (2035). Ambrosiuset al. (2019) find that under two or three price zones in Germany, the major partof the theoretically achievable welfare gains is already realized, while increasing theamount of zones further brings little additional benefit.
The above-mentioned contributions are the first in the literature to present impor-tant insights in potential long-term impacts of splitting the German price zone in twoor multiple zones. Yet, despite modeling different decision levels, Ambrosius et al.(2019) assume perfect anticipation of the regulator in terms of generation expansionplanning, spot market trading and redispatching. Moreover, the long-term effectsof splitting the German price zones are only analyzed for a single future year andunder strong simplifications, particularly in terms of grid resolution. We thereforepropose an alternative modeling framework, which extends the work of Ambrosiuset al. (2019) in three important aspects.
7
Firstly, in our approach, the regulator decides on an optimal delimination ofthe German price zone prior to the decisions of the companies on investments innew generation and storage units, i.e., under imperfect information. In a real-worldsetting, this is exactly the situation a regulator would be confronted with whendeciding on a new price zone configuration. Not having any information on thereactions of the generation companies, he could only base his decision on informationavailable to date.
Secondly, our proposed modeling framework includes an agent-based multi-periodsimulation covering 2020 through 2050 as well as Germany and all neighboring coun-tries. This approach allows to capture long-term investment and short-term marketbehavior under imperfect information while adequately accounting for both intertem-poral effects and cross-border effects.
Thirdly, the applied optimal power flow model considers the entire German trans-mission grid and auxiliary nodes in the neighboring countries rather than using astrongly simplified representation of the grid. Therefore, cross-border effects in termsof required congestion management measures and persistent intra-zonal congestioncan also be considered.
For these reasons, the novel approach presented in the following is very well suitedto capture dynamic long-term impacts of a zonal split in Germany in a closer-to-real-world fashion than any other publication available to date.
3 Methodology
Any approach that aims to investigate all relevant long-term aspects of a zonal splitin Germany needs to cover the decisions of different actors. Firstly, a regulatordeciding on the actual zonal split, secondly, the long-term investment and short-term market decisions of the different generation firms, and thirdly, the requiredcongestion management measures carried out by the transmission system operator(TSO).
We tackle this challenge by jointly applying two established energy-related mod-els, namely the optimal power flow model ELMOD and the electricity market simula-tion model PowerACE. In Section 3.1, we describe the interaction of the two modelsand outline the advantages of our modeling framework. Sections 3.2–3.5 then explainin detail, how the different decision levels are modeled in ELMOD and PowerACE.
8
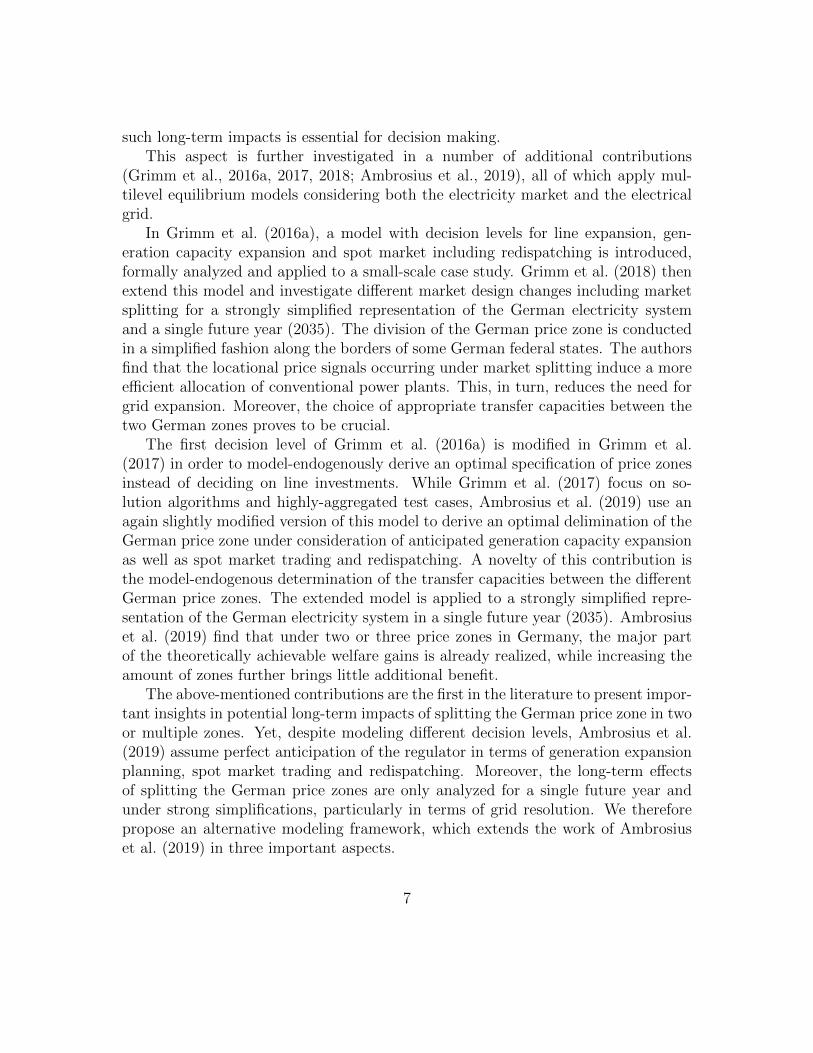
specification of zones andinter-zonal transmission
capacities (regulator)
generation and storage expansionper zone (firms) after each spotmarket + redispatching period
|Y | periods of spot market trading (firms) andsubsequent congestion management (TSO)
ty0 y1 y2 y3 Y
ELMOD
PowerACE
Figure 1: Timeline of the combined application of the models ELMOD and PowerACE (basedon a similiar illustration in Ambrosius et al., 2019).
3.1 Overview of the Modeling Framework
The timeline of the different decision levels in the combined application of ELMODand PowerACE is presented in Fig. 1. In order to outline the differences betweenour modeling approach and that of Ambrosius et al. (2019), we use the same stylefor our illustration as they do.
In a first step (bottom-left box), the regulator decides on an optimal splittingof the German price zone and corresponding transfer capacities. For this purpose,hourly nodal prices that are simulated with ELMOD for the base year 2020 are clus-tered in two zones (see Section 3.2 for details). Contrary to Ambrosius et al. (2019),the zonal delimitation is independent of the subsequent decisions on expansion plan-ning and (re)dispatch, since a regulator wouldn’t have a priori knowledge on thesedecisions in a real-world setting.
Next, |Y | periods are simulated, each denoting one year at hourly resolution.For each period, the simulation covers three steps. Firstly, using the informationon the new zonal delimination, the day-ahead market is simulated with PowerACE(for details see Section 3.3). Secondly, the hourly dispatch originating from themarket simulation serves as input to determine required congestion managementmeasures with ELMOD (for details see Section 3.4). These two steps correspond tothe top-right box in Fig. 1. Thirdly, the different companies create their individualgeneration and storage expansion plan for the subsequent periods (bottom-right box).Contrary to Ambrosius et al. (2019), these decisions are not directly related to the(re)dispatch of the following periods, but the companies rather prepare future priceforecasts and generate their expansion plans accordingly. This approach is againcloser to a real-world setting, since real companies only have limited knowledge onthe future developments of the day-ahead markets. Moreover, multiple years are
9
simulated and therefore also multiple investment decisions are taken, which makes itpossible to better grasp the long-term dynamics of a zonal split. For details on theinvestment planning, see Section 3.5.
In the subsequent Sections 3.2–3.5, we describe the different decision levels inmore detail. Additionally, Appendix A provides a brief general introduction to themodels.
3.2 Zonal Configuration and Transfer Capacities
As a first step when investigating the impacts of market splitting in Germany, weneed to carry out an adequate reconfiguration of the bidding zone which is bothstable and has low intra-zonal congestion. Stable in this context means that consid-ering all hours of a base year, the final zonal configuration is predominant to otherconfigurations.
In electricity systems, the nodal price or locational marginal price (LMP) ofa given grid node represents the marginal cost of delivering an additional unit ofelectricity to this specific node. The LMP includes information on both marginalgeneration costs and the physical aspects of the transmission grid. Using the stan-dard objective function of minimizing total generation costs, we apply ELMOD tocalculate the LMP λn at every node n ∈ N which corresponds to the dual variableof the energy balance as shown later in Eq. (2).
If the grid is congested between two nodes, the LMPs of these nodes diverge. Incontrast, nodes with identical or similar LMPs are typically not affected by congestionbetween each other. These properties of LMPs imply that clustering nodes withsimilar LMPs is a promising approach in order to determine stable zones with lowintra-zonal congestion. Therefore, in order to split the German market area into twobidding zones, we apply a fuzzy c-means clustering algorithm (Dunn, 1973; Bezdek,1981; Hong et al., 2002) to the LMPs of all German grid nodes over 8760 hours ofthe base year 2020.
The major challenge when clustering the LMPs is to avoid fragmented zones,meaning that some nodes are clustered in the same zone but are not physically con-nected. A proven solution for similar scientific network questions is the application ofspatial clustering which is based on graph theory (e.g., von Luxburg, 2007). Spatialclustering of an electricity network uses a Laplacian matrix L which considers therelation between two nodes ni, nj ∈ N as well as lines/edges e ∈ E within graphG = (N ,E). This procedure has previously been applied by Metzdorf (2016).
After determining the new bidding zone configuration for Germany, we calculatethe trading capacities between the two bidding zones based on the transmission
10
capacities on the border lines of the zones for 2020. Thereby, DC-lines are counted atfull and AC-lines at one third of their capacity to account for uncertainties regardingthe state of the grid at a given point in time. For the subsequent years, we take intoaccount additional capacities on the basis of the network development plans.
3.3 Day-Ahead Market Simulation
Splitting the German market area into two price zones has a direct impact on theoutcomes of the day-ahead markets, both in the short-term and the long-term. Usingthe zonal split determined with ELMOD, we can now apply PowerACE to quantifythese effects as explained hereafter.
The PowerACE model is structured into different market areas m ∈M , in eachof which multiple supply traders, i.e., utility companies, are active on the day-aheadmarket. The simulation of the day-ahead market consists of four steps, which arebriefly outlined in the following.
Price forecast. According to the economic theory, market participants are willingto sell electricity at their marginal generation costs. However, starting up a powerplant leads to additional costs due to higher fuel consumption and a reduced lifetimecaused by material stress. In order to account for these costs and prepare bidsaccordingly, it is important for the supply traders to estimate, if and how long aspecific power plant will be in the market on the following simulation day. Thus,in a first step, all supply traders prepare a price forecast for all hours h ∈ H ofthe following day. The basic approach for this price forecast is an extended merit-order model, i.e., a cost-minimal power plant dispatch serving the expected hourlyresidual loads in the respective market area is determined under consideration ofboth variable and start-up costs1. The major output of the price forecast are theexpected running hours for all power plants on the following simulation day.
Bidding. Using the information from the price forecast, the different supplytraders now prepare bids for all of their own power plants and each hour h of thefollowing day. These bids consist of volume (MWh), price (EUR/MWh) and type(buy or sell). While the bid volume for each power plant is determined considering anexogenously given availability factor and a potential obligation to provide balancingpower, the bid price depends both on the type of the power plant and whether thepower plant is expected to run in the respective hour or not. An overview of the
1 Formally, this step requires to solve a mixed-integer optimization problem. However, to save
computational resources, a heuristic approach is applied, such that only close-to-optimal solutions
can be guaranteed.
11
bidding strategies is provided in Appendix B.Market clearing. All bids prepared in the previous step are then submitted to
the market coupling operator. In the market clearing process, supply and demandbids are matched across all market areas, such that welfare is maximized subjectto the limited interconnector capacities between the different market areas. For aformal description and details of the market coupling and clearing, see Ringler et al.(2017). As a result, the information, which bids have been partly or fully acceptedis returned to the different supply traders.
Dispatch. All supply traders now calculate their individual hourly load curve,which is the sum of their hourly bids that have been accepted. In the final stepof the day-ahead market simulation, the different traders determine a cost-minimaldispatch of their individual power plant fleet, which serves their hourly load curveunder consideration of both variable and start-up costs1.
3.4 Congestion Management
Using the hourly dispatch of all power plants as obtained from the day-ahead marketsimulation with PowerACE, we can now determine the impact of splitting the Ger-man market area on the required congestion management measures using ELMOD.In the ELMOD version applied in this contribution, the congestion managementcomprises redispatching of conventional power plants and curtailment of renewableenergy production. The integration of these instruments into ELMOD is brieflydescribed in the following.
As shown in Eq. (1), ELMOD has a linear objective function in which the totalcosts of congestion management Ccong
total across all market areas m ∈M are minimized.
minimize Ccongtotal =
∑m∈M
(Credispm + Ccurt
m
)(1)
where
Credispm = total redispatching costs in market area m
Ccurtm = total curtailment costs in market area m
The main restriction of ELMOD is the energy balance presented in Eq. (2), whichneeds to be fulfilled at every transmission grid node n and in every hour h. Pleasenote:
• The power plant set Pn at node n comprises subsets for conventional power plantsP conn , storage plants P stor
n and renewable power plants P renn .
12
• The gross load lgrossn,h is exogenously set and assumed fully price-inelastic.
• The neighboring countries of Germany are represented with one aggregated gridnode and additional auxiliary nodes to capture interconnector behavior.
lgrossn,h +
∑p∈P stor
n
lchargep,h =
∑p∈Pn
gp,h + fACn,h + fDC
n,h ∀n ∈N , h ∈H (2)
where
lgrossn,h = gross load at node n in hour h
lchargep,h = storage charging of unit p in hour h (decision variable)
gp,h = electricity generation of power plant p in hour h (decision variable)fACn,h = net input of the AC lines at node n in hour hfDCn,h = net input of the DC lines at node n in hour h
The redispatching costs Credispm of all market areas m ∈M are determined based
on the deviations between the hourly market-dispatched power plant generationgmarketp,h with p ∈ P con
m and the endogenous generation variables gp,h of ELMOD, whichare multiplied by the marginal costs of the respective power plant cvar
p as shown inEq. (3).
Credispm =
∑p∈P con
m
∑h∈H
(gp,h − gmarket
p,h
)· cvarp ∀m ∈M (3)
It is important to note that for computational performance reasons start-up costsare considered in the market simulation with PowerACE, but not in the grid modelELMOD. Consequently, gmarket
p,h could be re-optimized without an actual grid conges-tion need. In order to avoid this, Eq. (3) needs to be reformulated such that bothpositive and negative redispatching of conventional power plants are penalized. Fordetails on the reformulation, please refer to Appendix C.
If the redispatching capacities of the conventional power plants are not sufficientto find a feasible solution, curtailment of the market-dispatched renewable generationgmarketp,h with p ∈ P ren
m is deployed by the model, i.e., gmarketp,h is reduced to gp,h.
The differences between gmarketp,h and gp,h lead to curtailment costs Ccurt
m , which are
13
integrated into ELMOD as shown in Eqs. (4) and (5)2.
Ccurtm =
∑p∈P ren
m
∑h∈H
(gmarketp,h − gp,h
)· ccurt ∀m ∈M (4)
gp,h ≤ gmarketp,h ∀p ∈ P ren, h ∈H (5)
Although most of the grid congestion events can be relieved by redispatchingand curtailment measures, it is reasonable to use additional auxiliary variables fordumped load ldump
n,h and artificially added load laddn,h to guarantee a feasible solution.
For details on the integration of these variables, please refer to Appendix C.Finally, it is important to mention that the neighboring countries of Germany
are only represented in a simplified fashion. Therefore, the focus of the congestionmanagement measures is on Germany with the neighboring countries being used forredispatching only if the German power plant capacities are not sufficient (see alsoAppendix C).
3.5 Investment Planning
The potential impact on investment incentives is an essential aspect when evaluatingthe long-term efficiency of splitting the German market area. For this purpose, thedifferent utility companies modeled as agents in PowerACE can perform long-termdecisions on investments in new conventional power plant and storage capacities atthe end of each simulation year. Contrary to the common approach of expansionplanning with the objective of minimizing total future system costs, an actor’s per-spective is taken. Consequently, investments are only carried out if expected to beprofitable by the investor agents. The applied investment planning algorithm is in-troduced and described in detail in Fraunholz et al. (2019). A brief overview of thebasic principles is given in the following.
2The curtailment costs for renewable generation are an artificial penalty, because generation
costs are already included in the market dispatch and additional costs for the system will only occur
for the positive redispatching which is needed to balance the system. Nevertheless, these penalty
costs can be explained by the Renewable Energy Directive (2009/28/EC) which claims priority
access to the grid for renewable generation in real time. Furthermore, renewable generation is often
subsidized by feed-in tariffs or premiums which add to the generation costs of the market (Bjørndal
et al., 2018). Therefore, the curtailment costs of renewable generation ccurt are orientated at the
maximum penalty costs for negative redispatching in Germany in the respective year. Using this
approach, curtailment is only carried out if the available redispatching capacities are not sufficient
to relieve the grid congestion – similarly to the real-world process.
14
The decisions of the different investors are primarily based on their expectationsregarding future electricity prices. As these, vice versa, are influenced by the invest-ment decisions of all investors in all interconnected market areas, a complex gamewith multiple possible strategies opens up. To find a stable outcome for this game,a Nash-equilibrium needs to be determined.
Therefore, the investment planning algorithm terminates when all planned invest-ments are profitable and at the same time none of the investors is able to improvehis expected payoff by carrying out further or less investments, i.e., there is no in-centive for any investor to unilaterally deviate from the equilibrium outcome. Theeleven different market areas3 are defined as the players interacting with each otherand the planned investments are then distributed among the investors within eachmarket area. This is achieved by first randomizing and then iterating over the dif-ferent investors after each investment being carried out4. Following this approach, itis possible to consider the mutual impact of investments in one market area on theelectricity prices and consequently investments in the interconnected market areas.
After the investment planning in PowerACE has been carried out, the grid nodesof ELMOD are sorted per market area in descending order beginning with the nodewhere most old power plant capacity has been decommissioned. The new investmentsin the respective market area are then allocated to the sorted list of grid nodes. Pleasenote that it may also occur that more capacity is newly built than decommissionedin a given market area. In this case, the ratio between total newly installed capacityand total decommissioned capacity in the given zone is computed. The installedcapacity at each node is then increased by this factor.
4 Data and Scenario Setup
As cross-border effects have a strong impact on the splitting of market areas, wemodel Germany and all neighboring countries plus Italy in our analysis. The timehorizon covers 2020 through 2050 at hourly resolution. While we carry out a continu-ous simulation over the whole time period in PowerACE, we only investigate selectedyears in terms of required congestion management with ELMOD. An overview of themodel resolutions is provided in Table 1 and further details are described in the fol-
3Germany in two price zones and all of its neighboring countries plus Italy.4If the investors within each market area are differently parameterized, it would also be possible
to have the single investors instead of the market areas play against each other. However, since the
focus of our paper is not on market power issues, we chose the more basic approach of defining the
market areas as players.
15
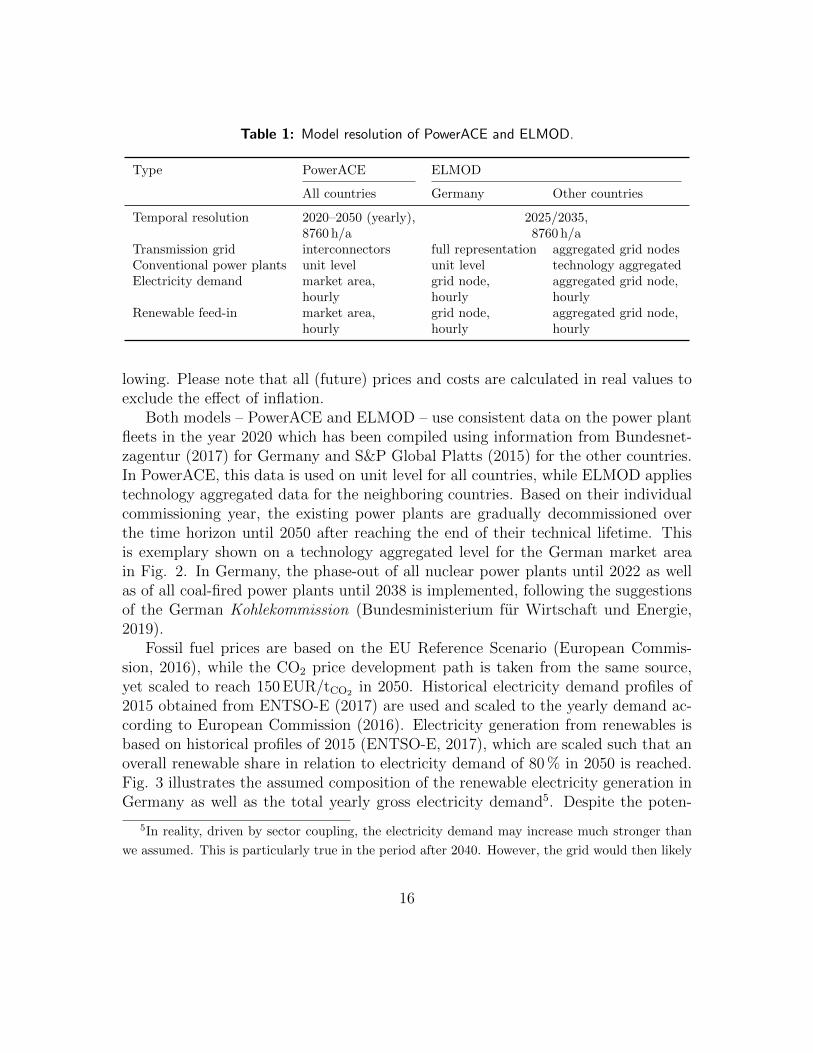
Table 1: Model resolution of PowerACE and ELMOD.
Type PowerACE ELMOD
All countries Germany Other countries
Temporal resolution 2020–2050 (yearly), 2025/2035,8760 h/a 8760 h/a
Transmission grid interconnectors full representation aggregated grid nodesConventional power plants unit level unit level technology aggregatedElectricity demand market area, grid node, aggregated grid node,
hourly hourly hourlyRenewable feed-in market area, grid node, aggregated grid node,
hourly hourly hourly
lowing. Please note that all (future) prices and costs are calculated in real values toexclude the effect of inflation.
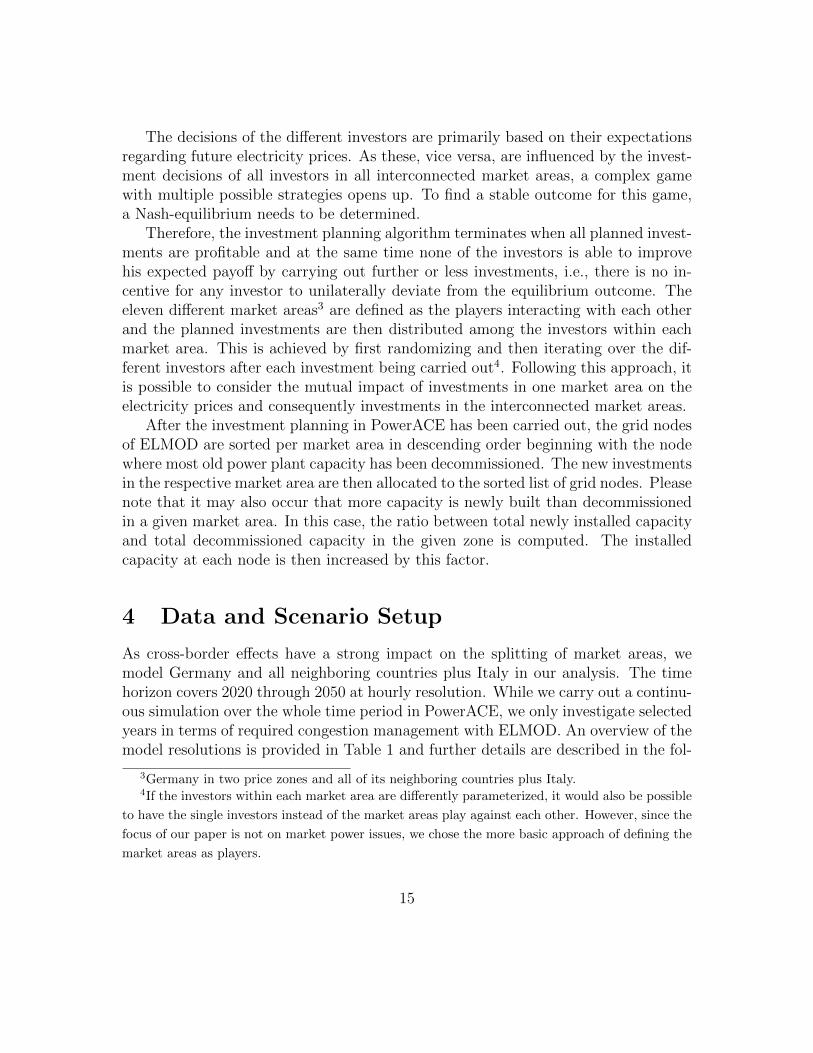
Both models – PowerACE and ELMOD – use consistent data on the power plantfleets in the year 2020 which has been compiled using information from Bundesnet-zagentur (2017) for Germany and S&P Global Platts (2015) for the other countries.In PowerACE, this data is used on unit level for all countries, while ELMOD appliestechnology aggregated data for the neighboring countries. Based on their individualcommissioning year, the existing power plants are gradually decommissioned overthe time horizon until 2050 after reaching the end of their technical lifetime. Thisis exemplary shown on a technology aggregated level for the German market areain Fig. 2. In Germany, the phase-out of all nuclear power plants until 2022 as wellas of all coal-fired power plants until 2038 is implemented, following the suggestionsof the German Kohlekommission (Bundesministerium fur Wirtschaft und Energie,2019).
Fossil fuel prices are based on the EU Reference Scenario (European Commis-sion, 2016), while the CO2 price development path is taken from the same source,yet scaled to reach 150 EUR/tCO2 in 2050. Historical electricity demand profiles of2015 obtained from ENTSO-E (2017) are used and scaled to the yearly demand ac-cording to European Commission (2016). Electricity generation from renewables isbased on historical profiles of 2015 (ENTSO-E, 2017), which are scaled such that anoverall renewable share in relation to electricity demand of 80 % in 2050 is reached.Fig. 3 illustrates the assumed composition of the renewable electricity generation inGermany as well as the total yearly gross electricity demand5. Despite the poten-
5In reality, driven by sector coupling, the electricity demand may increase much stronger than
we assumed. This is particularly true in the period after 2040. However, the grid would then likely
16
2020 2025 2030 2035 2040 2045 20500
10
20
30
40
50
60
70
Rem
ain
ing
cap
aci
ties
[GW
]
Nuclear Lignite CoalCCGT OCGT Oil
Figure 2: Assumed conventional power plant capacities in Germany without additional newinvestments (Bundesnetzagentur, 2017, and own assumptions). Abbreviations: CCGT—combined cycle gas turbine, OCGT—open cycle gas turbine.
tial impact of market splitting on regional incentives to flexibilize load, demand sidemanagement is out of the scope of this paper and not taken into account.
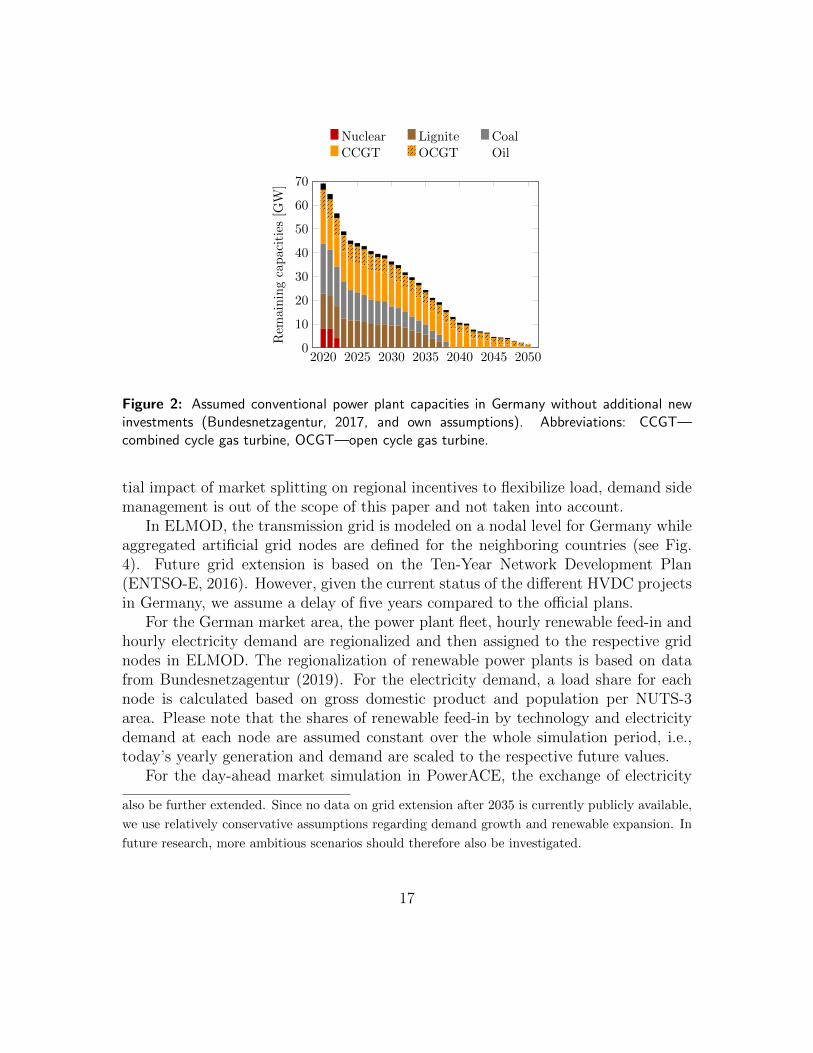
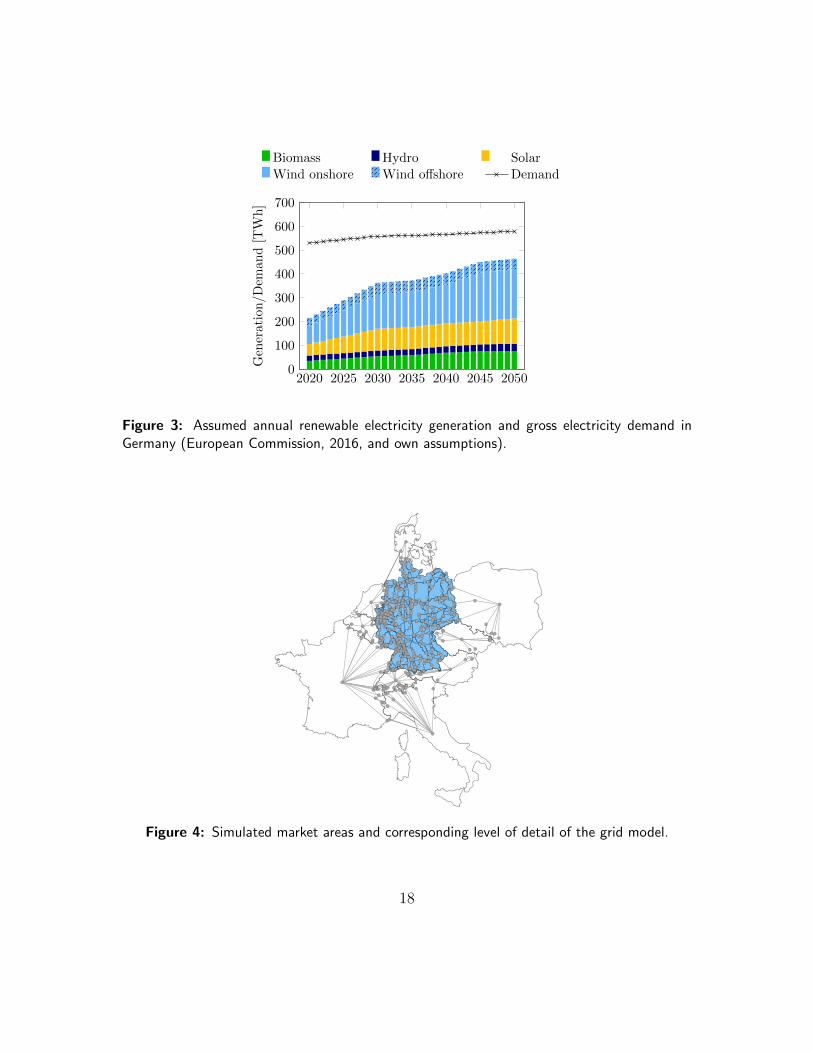
In ELMOD, the transmission grid is modeled on a nodal level for Germany whileaggregated artificial grid nodes are defined for the neighboring countries (see Fig.4). Future grid extension is based on the Ten-Year Network Development Plan(ENTSO-E, 2016). However, given the current status of the different HVDC projectsin Germany, we assume a delay of five years compared to the official plans.
For the German market area, the power plant fleet, hourly renewable feed-in andhourly electricity demand are regionalized and then assigned to the respective gridnodes in ELMOD. The regionalization of renewable power plants is based on datafrom Bundesnetzagentur (2019). For the electricity demand, a load share for eachnode is calculated based on gross domestic product and population per NUTS-3area. Please note that the shares of renewable feed-in by technology and electricitydemand at each node are assumed constant over the whole simulation period, i.e.,today’s yearly generation and demand are scaled to the respective future values.
For the day-ahead market simulation in PowerACE, the exchange of electricity
also be further extended. Since no data on grid extension after 2035 is currently publicly available,
we use relatively conservative assumptions regarding demand growth and renewable expansion. In
future research, more ambitious scenarios should therefore also be investigated.
17
2020 2025 2030 2035 2040 2045 20500
100
200
300
400
500
600
700
Gen
erati
on/D
eman
d[T
Wh
]
Biomass Hydro SolarWind onshore Wind offshore Demand
Figure 3: Assumed annual renewable electricity generation and gross electricity demand inGermany (European Commission, 2016, and own assumptions).
Figure 4: Simulated market areas and corresponding level of detail of the grid model.
18
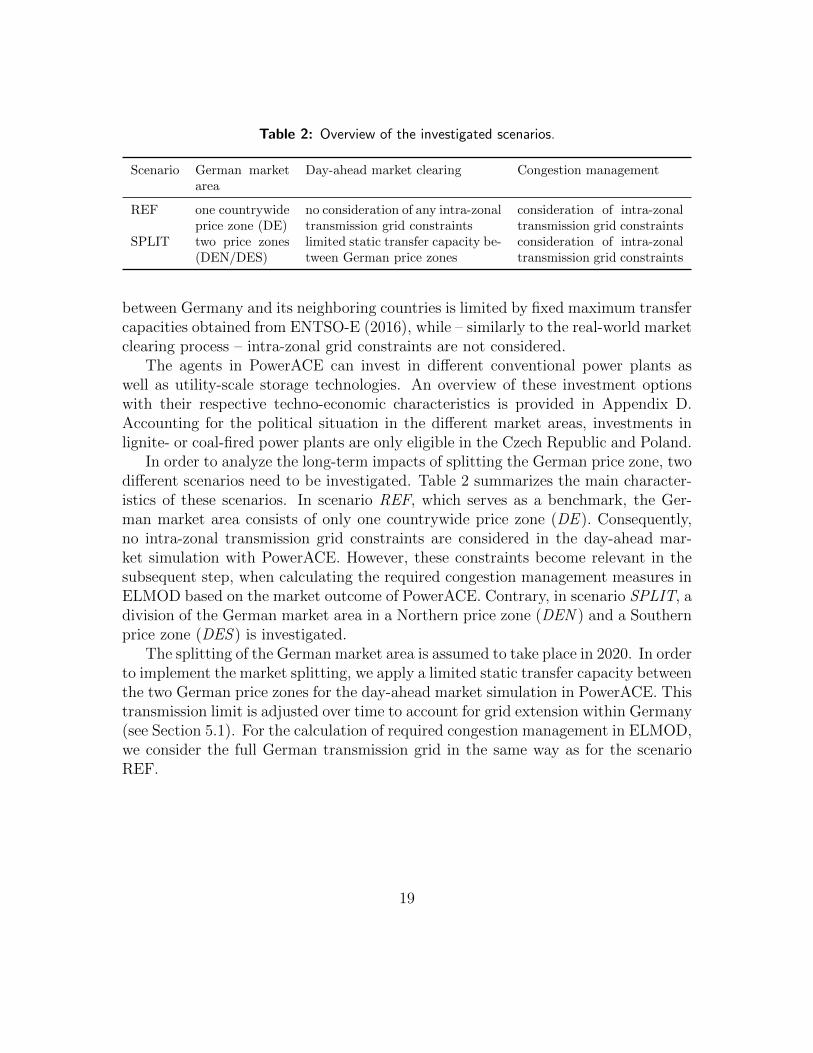
Table 2: Overview of the investigated scenarios.
Scenario German marketarea
Day-ahead market clearing Congestion management
REF one countrywideprice zone (DE)
no consideration of any intra-zonaltransmission grid constraints
consideration of intra-zonaltransmission grid constraints
SPLIT two price zones(DEN/DES)
limited static transfer capacity be-tween German price zones
consideration of intra-zonaltransmission grid constraints
between Germany and its neighboring countries is limited by fixed maximum transfercapacities obtained from ENTSO-E (2016), while – similarly to the real-world marketclearing process – intra-zonal grid constraints are not considered.
The agents in PowerACE can invest in different conventional power plants aswell as utility-scale storage technologies. An overview of these investment optionswith their respective techno-economic characteristics is provided in Appendix D.Accounting for the political situation in the different market areas, investments inlignite- or coal-fired power plants are only eligible in the Czech Republic and Poland.
In order to analyze the long-term impacts of splitting the German price zone, twodifferent scenarios need to be investigated. Table 2 summarizes the main character-istics of these scenarios. In scenario REF, which serves as a benchmark, the Ger-man market area consists of only one countrywide price zone (DE ). Consequently,no intra-zonal transmission grid constraints are considered in the day-ahead mar-ket simulation with PowerACE. However, these constraints become relevant in thesubsequent step, when calculating the required congestion management measures inELMOD based on the market outcome of PowerACE. Contrary, in scenario SPLIT, adivision of the German market area in a Northern price zone (DEN ) and a Southernprice zone (DES ) is investigated.
The splitting of the German market area is assumed to take place in 2020. In orderto implement the market splitting, we apply a limited static transfer capacity betweenthe two German price zones for the day-ahead market simulation in PowerACE. Thistransmission limit is adjusted over time to account for grid extension within Germany(see Section 5.1). For the calculation of required congestion management in ELMOD,we consider the full German transmission grid in the same way as for the scenarioREF.
19
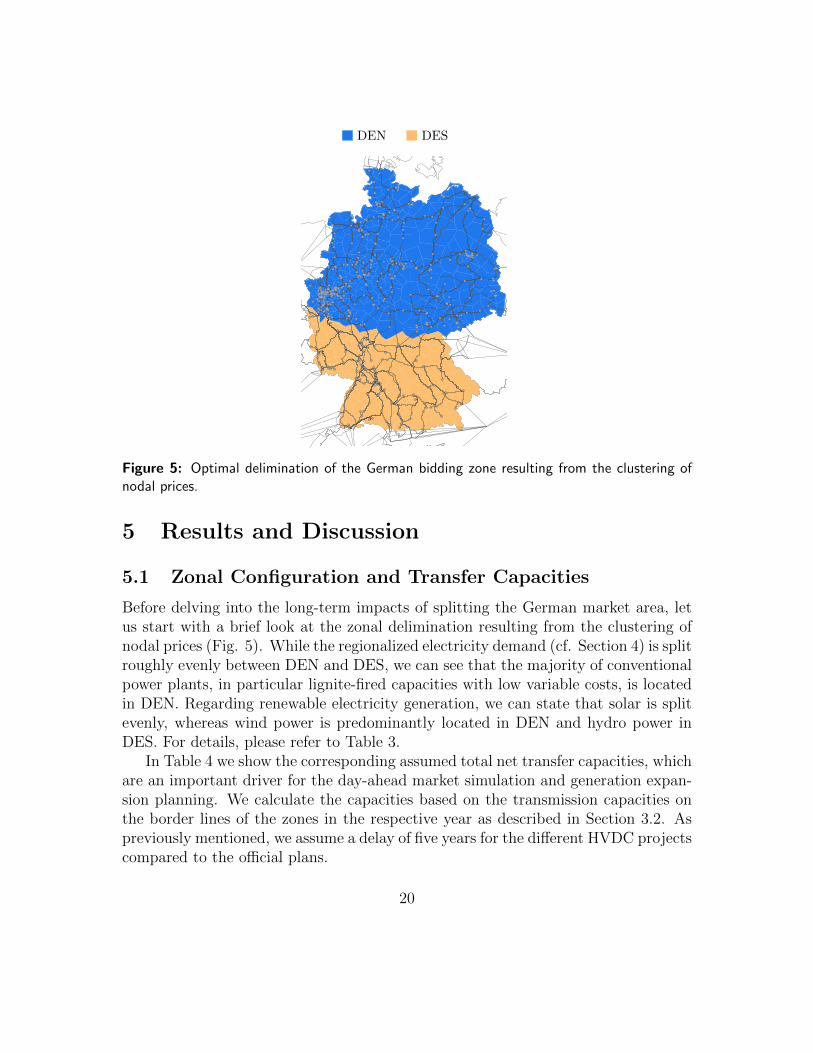
DEN DES
Figure 5: Optimal delimination of the German bidding zone resulting from the clustering ofnodal prices.
5 Results and Discussion
5.1 Zonal Configuration and Transfer Capacities
Before delving into the long-term impacts of splitting the German market area, letus start with a brief look at the zonal delimination resulting from the clustering ofnodal prices (Fig. 5). While the regionalized electricity demand (cf. Section 4) is splitroughly evenly between DEN and DES, we can see that the majority of conventionalpower plants, in particular lignite-fired capacities with low variable costs, is locatedin DEN. Regarding renewable electricity generation, we can state that solar is splitevenly, whereas wind power is predominantly located in DEN and hydro power inDES. For details, please refer to Table 3.
In Table 4 we show the corresponding assumed total net transfer capacities, whichare an important driver for the day-ahead market simulation and generation expan-sion planning. We calculate the capacities based on the transmission capacities onthe border lines of the zones in the respective year as described in Section 3.2. Aspreviously mentioned, we assume a delay of five years for the different HVDC projectscompared to the official plans.
20
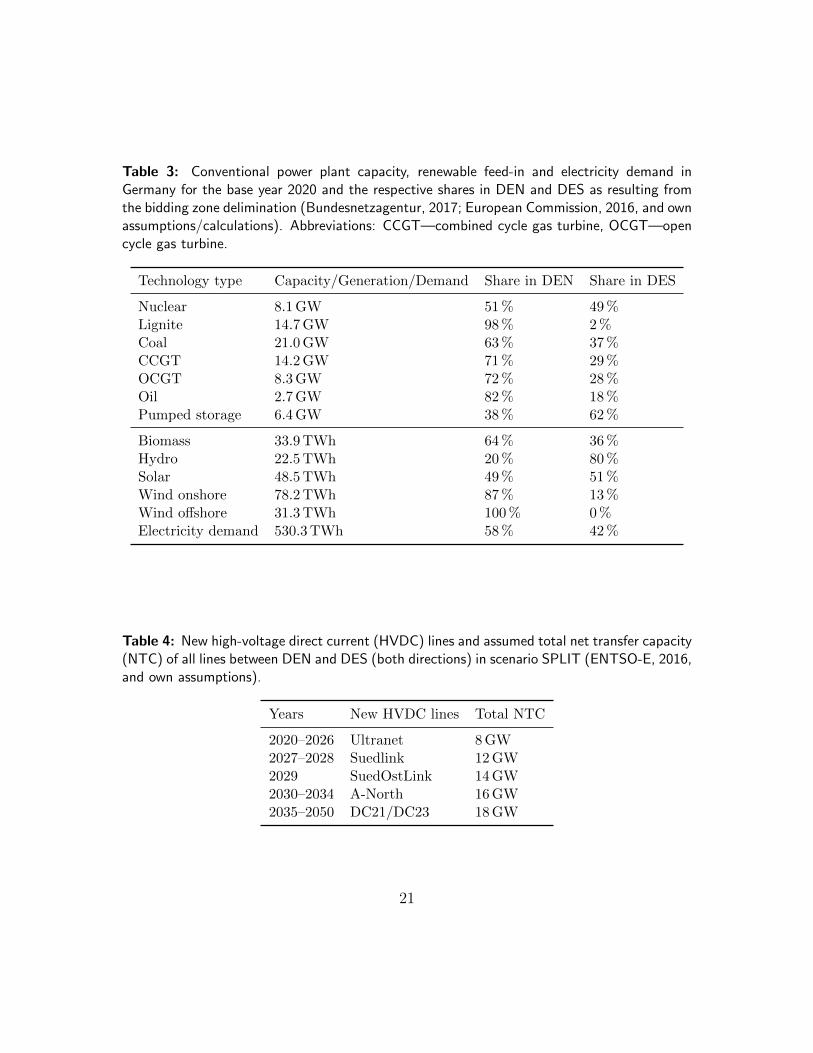
Table 3: Conventional power plant capacity, renewable feed-in and electricity demand inGermany for the base year 2020 and the respective shares in DEN and DES as resulting fromthe bidding zone delimination (Bundesnetzagentur, 2017; European Commission, 2016, and ownassumptions/calculations). Abbreviations: CCGT—combined cycle gas turbine, OCGT—opencycle gas turbine.
Technology type Capacity/Generation/Demand Share in DEN Share in DES
Nuclear 8.1 GW 51 % 49 %Lignite 14.7 GW 98 % 2 %Coal 21.0 GW 63 % 37 %CCGT 14.2 GW 71 % 29 %OCGT 8.3 GW 72 % 28 %Oil 2.7 GW 82 % 18 %Pumped storage 6.4 GW 38 % 62 %
Biomass 33.9 TWh 64 % 36 %Hydro 22.5 TWh 20 % 80 %Solar 48.5 TWh 49 % 51 %Wind onshore 78.2 TWh 87 % 13 %Wind offshore 31.3 TWh 100 % 0 %Electricity demand 530.3 TWh 58 % 42 %
Table 4: New high-voltage direct current (HVDC) lines and assumed total net transfer capacity(NTC) of all lines between DEN and DES (both directions) in scenario SPLIT (ENTSO-E, 2016,and own assumptions).
Years New HVDC lines Total NTC
2020–2026 Ultranet 8 GW2027–2028 Suedlink 12 GW2029 SuedOstLink 14 GW2030–2034 A-North 16 GW2035–2050 DC21/DC23 18 GW
21
5.2 Day-Ahead Market Impacts
Let us now move on to the short-term and long-term day-ahead market impacts ofsplitting the German market area.
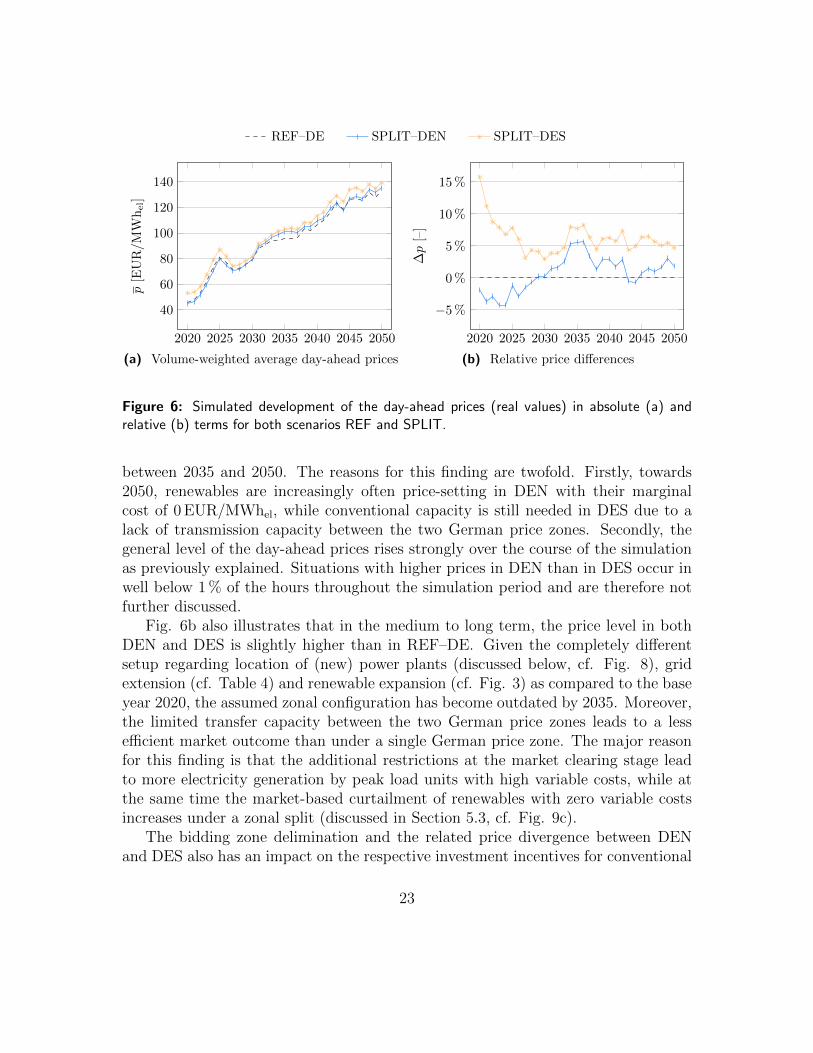
We can see that in both scenarios REF and SPLIT, the average day-ahead pricesp in Germany increase significantly throughout the simulation period despite thehigh shares of renewable electricity generation (Fig. 6a). This trend can mainly beattributed to the assumed strong increase in CO2 prices, more frequent and costlystart-ups of conventional power plants as well as some scarcity hours with prices of3000 EUR/MWhel.
In order to isolate the price impact resulting from the split of the German marketarea, we transform the mean prices p to relative price differences for further analysis(Fig. 6b). For this purpose, we define the German mean day-ahead price in scenarioREF as a reference and then compute the relative price differences ∆ps,m in scenarios and market area m as ∆ps,m = ps,m
/pREF,DE − 100 %. Consequently, by definition,
the relative price differences of REF–DE are always at 0 % throughout the simulationperiod.
We can see from Fig. 6b that initially, in 2020, the average prices in DEN areonly around 2 % (corresponds to 0.87 EUR/MWhel) lower, but those in DES almost16 % (7.23 EUR/MWhel) higher than in the single German price zone6. Between2020 and 2035, the relative price differences between DEN and DES continuouslydecline, which is mainly driven by the grid extension and the resulting increase intransfer capacities between the two German price zones (cf. Table 4). However, dueto the ongoing strong expansion of renewables (cf. Fig. 3) and no additional gridextension after 2035, the relative price differences rise again slightly in the secondpart of the simulation period (2035–2050).
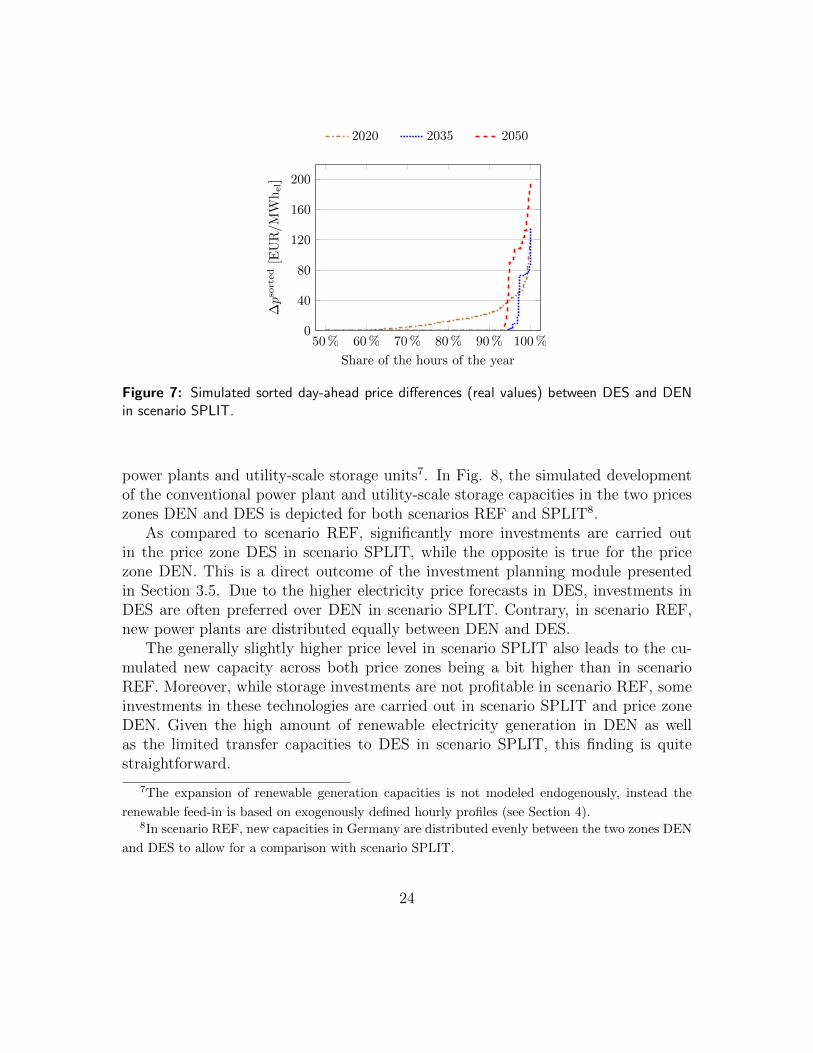
This result is also reflected in Fig. 7 showing the sorted hourly price differencesbetween DES and DEN. While the share of hours with positive price differences(i.e., higher prices in DES than in DEN) declines strongly from around 40 % toless than 10 % between 2020 and 2035, their absolute magnitude increases sharply
6These price differences between the two German price zones are higher than those found in
the literature (cf. Section 2). However, previous studies are difficult to compare to ours due
to varying scenario years and substantially different assumptions, e.g., regarding the power plant
fleets. In additional sensitivities with higher (lower) net transfer capacities of 10 GW (6 GW), we
find the price differences to decrease (increase) to 4.96 EUR/MWhel (12.37 EUR/MWhel). These
results stand well in line with those of Plancke et al. (2016). Splitting the German market area
already in 2015 instead of 2020, we obtain an average price difference of 2.35 EUR/MWhel, which
is comparable to that found by Egerer et al. (2016) for 2015 (1.70 EUR/MWhel).
22
REF–DE SPLIT–DEN SPLIT–DES
2020 2025 2030 2035 2040 2045 2050
40
60
80
100
120
140
p[E
UR/M
Whel]
(a) Volume-weighted average day-ahead prices
2020 2025 2030 2035 2040 2045 2050
−5 %
0 %
5 %
10 %
15 %
∆p
[–]
(b) Relative price differences
Figure 6: Simulated development of the day-ahead prices (real values) in absolute (a) andrelative (b) terms for both scenarios REF and SPLIT.
between 2035 and 2050. The reasons for this finding are twofold. Firstly, towards2050, renewables are increasingly often price-setting in DEN with their marginalcost of 0 EUR/MWhel, while conventional capacity is still needed in DES due to alack of transmission capacity between the two German price zones. Secondly, thegeneral level of the day-ahead prices rises strongly over the course of the simulationas previously explained. Situations with higher prices in DEN than in DES occur inwell below 1 % of the hours throughout the simulation period and are therefore notfurther discussed.
Fig. 6b also illustrates that in the medium to long term, the price level in bothDEN and DES is slightly higher than in REF–DE. Given the completely differentsetup regarding location of (new) power plants (discussed below, cf. Fig. 8), gridextension (cf. Table 4) and renewable expansion (cf. Fig. 3) as compared to the baseyear 2020, the assumed zonal configuration has become outdated by 2035. Moreover,the limited transfer capacity between the two German price zones leads to a lessefficient market outcome than under a single German price zone. The major reasonfor this finding is that the additional restrictions at the market clearing stage leadto more electricity generation by peak load units with high variable costs, while atthe same time the market-based curtailment of renewables with zero variable costsincreases under a zonal split (discussed in Section 5.3, cf. Fig. 9c).
The bidding zone delimination and the related price divergence between DENand DES also has an impact on the respective investment incentives for conventional
23
50 % 60 % 70 % 80 % 90 % 100 %0
40
80
120
160
200
Share of the hours of the year
∆pso
rted
[EU
R/M
Whel]
2020 2035 2050
Figure 7: Simulated sorted day-ahead price differences (real values) between DES and DENin scenario SPLIT.
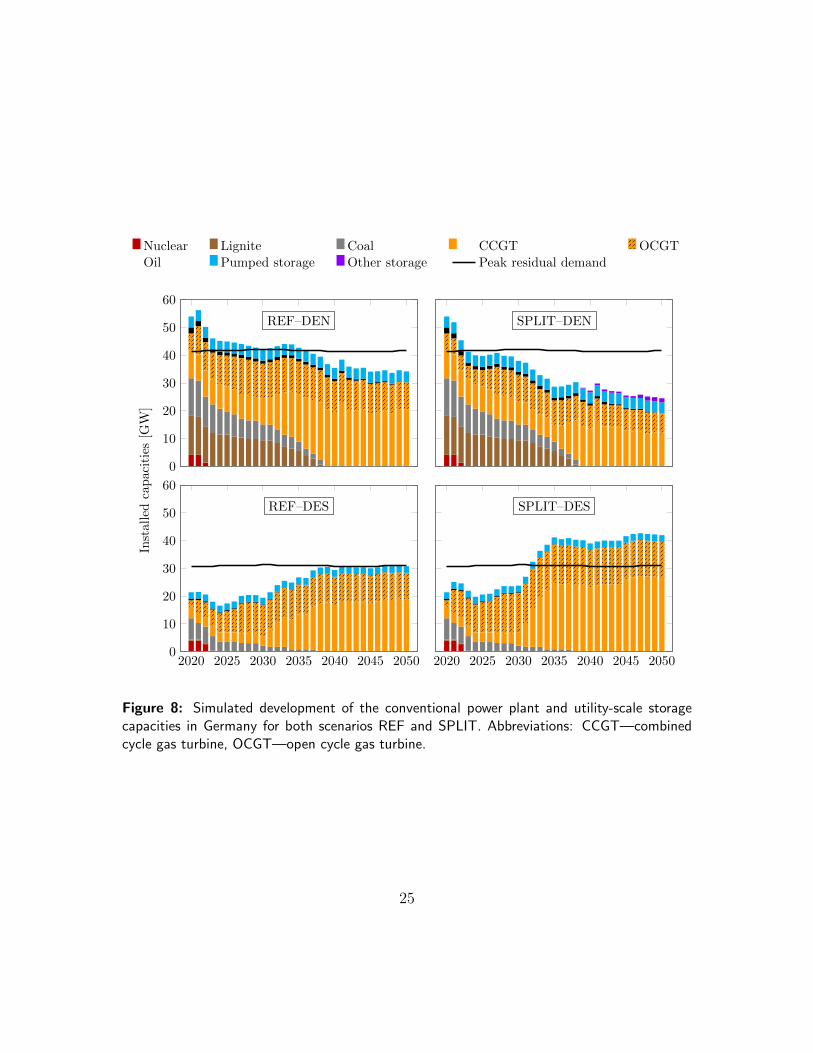
power plants and utility-scale storage units7. In Fig. 8, the simulated developmentof the conventional power plant and utility-scale storage capacities in the two priceszones DEN and DES is depicted for both scenarios REF and SPLIT8.
As compared to scenario REF, significantly more investments are carried outin the price zone DES in scenario SPLIT, while the opposite is true for the pricezone DEN. This is a direct outcome of the investment planning module presentedin Section 3.5. Due to the higher electricity price forecasts in DES, investments inDES are often preferred over DEN in scenario SPLIT. Contrary, in scenario REF,new power plants are distributed equally between DEN and DES.
The generally slightly higher price level in scenario SPLIT also leads to the cu-mulated new capacity across both price zones being a bit higher than in scenarioREF. Moreover, while storage investments are not profitable in scenario REF, someinvestments in these technologies are carried out in scenario SPLIT and price zoneDEN. Given the high amount of renewable electricity generation in DEN as wellas the limited transfer capacities to DES in scenario SPLIT, this finding is quitestraightforward.
7The expansion of renewable generation capacities is not modeled endogenously, instead the
renewable feed-in is based on exogenously defined hourly profiles (see Section 4).8In scenario REF, new capacities in Germany are distributed evenly between the two zones DEN
and DES to allow for a comparison with scenario SPLIT.
24
Nuclear Lignite Coal CCGT OCGT
Oil Pumped storage Other storage Peak residual demand
0
10
20
30
40
50
60
REF–DEN
Inst
alle
dca
pac
itie
s[G
W]
SPLIT–DEN
2020 2025 2030 2035 2040 2045 20500
10
20
30
40
50
60
REF–DES
2020 2025 2030 2035 2040 2045 2050
SPLIT–DES
Figure 8: Simulated development of the conventional power plant and utility-scale storagecapacities in Germany for both scenarios REF and SPLIT. Abbreviations: CCGT—combinedcycle gas turbine, OCGT—open cycle gas turbine.
25
DEN DES
RE
F
SP
LIT
RE
F
SP
LIT
−15
−10
−5
0
5
10
15
20
25
2025 2035
Con
ges
tion
vol
um
e[T
Wh
]
(a) Redispatch (+/−)
RE
F
SP
LIT
RE
F
SP
LIT
0
2
4
6
8
10
12
14
2025 2035
(b) Curtailment (grid)
RE
F
SP
LIT
RE
F
SP
LIT
0.0
0.5
1.0
1.5
2.0
2.5
3.0
3.5
2025 2035
(c) Curtailment(market)
RE
F
SP
LIT
RE
F
SP
LIT
0
10
20
30
40
50
2025 2035
(d) Gross congestion
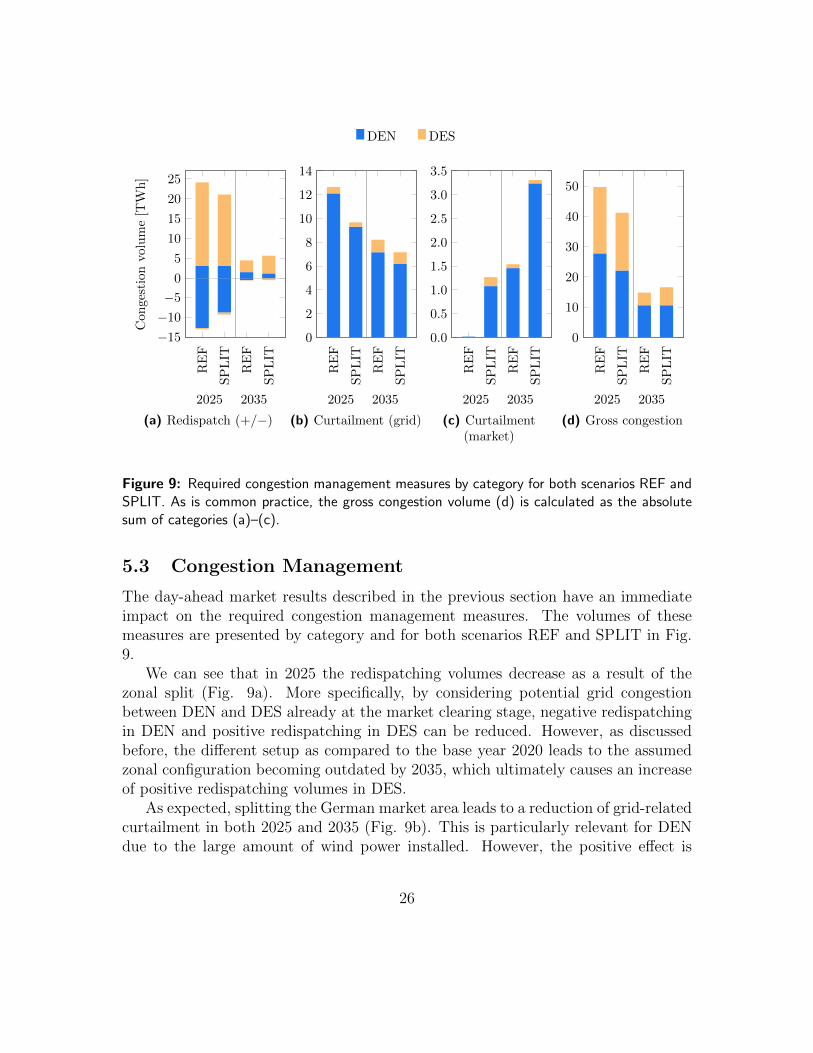
Figure 9: Required congestion management measures by category for both scenarios REF andSPLIT. As is common practice, the gross congestion volume (d) is calculated as the absolutesum of categories (a)–(c).
5.3 Congestion Management
The day-ahead market results described in the previous section have an immediateimpact on the required congestion management measures. The volumes of thesemeasures are presented by category and for both scenarios REF and SPLIT in Fig.9.
We can see that in 2025 the redispatching volumes decrease as a result of thezonal split (Fig. 9a). More specifically, by considering potential grid congestionbetween DEN and DES already at the market clearing stage, negative redispatchingin DEN and positive redispatching in DES can be reduced. However, as discussedbefore, the different setup as compared to the base year 2020 leads to the assumedzonal configuration becoming outdated by 2035, which ultimately causes an increaseof positive redispatching volumes in DES.
As expected, splitting the German market area leads to a reduction of grid-relatedcurtailment in both 2025 and 2035 (Fig. 9b). This is particularly relevant for DENdue to the large amount of wind power installed. However, the positive effect is
26
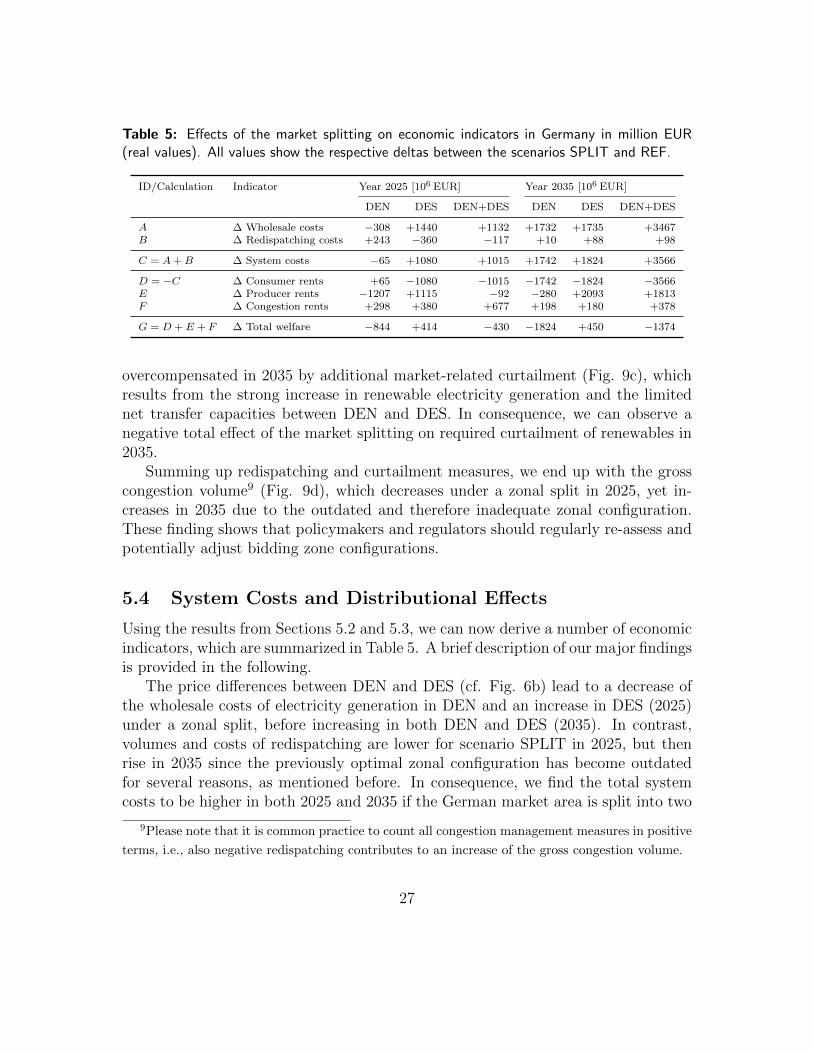
Table 5: Effects of the market splitting on economic indicators in Germany in million EUR(real values). All values show the respective deltas between the scenarios SPLIT and REF.
ID/Calculation Indicator Year 2025 [106 EUR] Year 2035 [106 EUR]
DEN DES DEN+DES DEN DES DEN+DES
A ∆ Wholesale costs −308 +1440 +1132 +1732 +1735 +3467B ∆ Redispatching costs +243 −360 −117 +10 +88 +98
C = A+B ∆ System costs −65 +1080 +1015 +1742 +1824 +3566
D = −C ∆ Consumer rents +65 −1080 −1015 −1742 −1824 −3566E ∆ Producer rents −1207 +1115 −92 −280 +2093 +1813F ∆ Congestion rents +298 +380 +677 +198 +180 +378
G = D + E + F ∆ Total welfare −844 +414 −430 −1824 +450 −1374
overcompensated in 2035 by additional market-related curtailment (Fig. 9c), whichresults from the strong increase in renewable electricity generation and the limitednet transfer capacities between DEN and DES. In consequence, we can observe anegative total effect of the market splitting on required curtailment of renewables in2035.
Summing up redispatching and curtailment measures, we end up with the grosscongestion volume9 (Fig. 9d), which decreases under a zonal split in 2025, yet in-creases in 2035 due to the outdated and therefore inadequate zonal configuration.These finding shows that policymakers and regulators should regularly re-assess andpotentially adjust bidding zone configurations.
5.4 System Costs and Distributional Effects
Using the results from Sections 5.2 and 5.3, we can now derive a number of economicindicators, which are summarized in Table 5. A brief description of our major findingsis provided in the following.
The price differences between DEN and DES (cf. Fig. 6b) lead to a decrease ofthe wholesale costs of electricity generation in DEN and an increase in DES (2025)under a zonal split, before increasing in both DEN and DES (2035). In contrast,volumes and costs of redispatching are lower for scenario SPLIT in 2025, but thenrise in 2035 since the previously optimal zonal configuration has become outdatedfor several reasons, as mentioned before. In consequence, we find the total systemcosts to be higher in both 2025 and 2035 if the German market area is split into two
9Please note that it is common practice to count all congestion management measures in positive
terms, i.e., also negative redispatching contributes to an increase of the gross congestion volume.
27
zones.Since we have assumed the electricity demand to be completely static, the increase
in system costs is identical with the reduction of the consumer rents. In scenarioSPLIT, producers in DES benefit from higher prices as compared to scenario REF.Thus, the producer rents in DES increase in 2025, while the opposite is true for DEN,in total leading to a reduction of the producer rents. In 2035, a substantial increaseof the producer rents in DES can be observed due to the preferred allocation of newgeneration capacity in DES as well as higher prices as compared to scenario REF.In DEN, a lot less generation capacity is installed in scenario SPLIT, leading to adecrease of the producer rents. Since the effect in DES is much stronger than inDEN, we find an overall increase of the producer rents in Germany in 2035.
Apart from affecting the system costs, the price differences between DEN andDES also lead to higher congestion rents under a zonal split. Since the prices in bothzones converge to a certain extent (cf. Fig. 6b), this effect is less pronounced in 2035than 2025.
We can ultimately conclude that splitting the German market area in two zoneshas strong distributional effects. DES benefits from a significant increase of theproducer rents, which overcompensates the corresponding reduction of the consumerrents, resulting in a positive welfare effect. Yet, the opposite effect occurs in DEN.Overall, we find a negative welfare effect for Germany. Finally, it is importantto mention that we take a purely German perspective in our analysis, while otherneighboring countries may benefit from a German market splitting. However, givenour simplified representation of the neighboring countries, we are unable to deriveprofound results in this regard.
6 Conclusion and Policy Implications
Using an innovative modeling framework consisting of an agent-based electricity mar-ket simulation model (PowerACE) and an optimal power flow model (ELMOD) weinvestigated the long-term impacts of splitting the German price zone in a multi-period setting with different decision levels. We found strong impacts of a marketsplitting on day-ahead electricity prices, investment planning of generation com-panies, required congestion management and, ultimately, system costs and socialwelfare.
After splitting the German market area into a Northern price zone (DEN) anda Southern price zone (DES) in 2020, the day-ahead prices in both zones initiallydiverge significantly with higher prices in DES and lower prices in DEN. The price
28
differences then decline between 2020 and 2035, which is mainly driven by gridextension, and rise again slightly between 2035 and 2050 due to the ongoing strongexpansion of renewables without additional grid extension. Since the limited transfercapacity between the two German price zones leads to a less efficient market outcome,we found the price level in both DEN and DES to be slightly higher than under asingle German price zone in the medium to long term.
The higher electricity prices in DES than DEN also have an immediate impacton investment incentives, leading to much more new power plants being built in DESthan DEN as compared to the reference case of a single German price zone.
The required congestion management decreases in 2025 under a zonal split, how-ever, we found it to be higher in 2035, since the bidding zone delimination hasbecome outdated given the completely different setup regarding location of (new)power plants, grid extension and renewable expansion as compared to the base year2020.
These results are also reflected in system costs, which rise under a zonal split inboth 2025 and 2035, mainly due to significantly higher wholesale prices for electricity.In terms of social welfare, the generation companies in DES benefit from substan-tial increases in producer rents, which overcompensate the reduction of consumerrents. In contrast, the generation companies in DEN suffer from lower producerrents (mainly 2025), which are then supplemented by a strong decrease in consumerrents in 2035. Overall, we found a negative welfare effect in Germany under a zonalsplit. However, it is important to mention that we took a purely German perspec-tive in our analysis, while other neighboring countries may benefit from the Germanmarket splitting.
Our findings are particularly crucial for policymakers and regulators in the fieldof electricity market design, but also for generation companies and grid operators.Optimization approaches with perfect anticipation of future decisions by differentplayers as previously applied in the literature typically lead to positive welfare ef-fects of market splitting. This is rather straightforward, given the perfect foresightand single-period character of these models. In contrast, our multi-period approachwith imperfect information of the different players showed that a zonal deliminationoptimal from today’s perspective may become outdated over time in a dynamic en-vironment with grid extension, renewable expansion and investments in new powerplants.
Therefore, we recommend that policymakers and regulators should regularly re-assess and potentially adjust bidding zone configurations. However, one major ob-jective of price zones is to provide locational investment incentives. These would bereduced, if investors could not rely on stable price zones. In consequence, adequately
29

setting up stable bidding zones remains a major challenge, which is reflected by mostof the European electricity market still being organized in countrywide price zones.Importantly, our results are not only valid for Germany, but also highly relevantfor any other region using multiple price zones within a country, such as the Nordicelectricity market or Italy.
We are well aware that despite providing important insights on the long-termimpacts of splitting price zones, our work could be substantially extended to geta more complete picture on this issue. Regarding the day-ahead market simula-tion, much depends on the appropriate choice of the transfer capacities between thedifferent zones, which is a difficult task. In reality, flow-based market coupling isalready in place in Central Western Europe, which automatically accounts for andat least partly solves this issue. Our day-ahead market simulation could therefore beextended to a flow-based market coupling approach.
Moreover, we have assumed exogenous expansion of renewables. However, the dif-ferent electricity price levels in DES and DEN might not only affect investments inconventional power plants, but also lead to more renewables being placed in South-ern Germany despite better wind locations in Northern Germany. Our approachcould therefore also be extended in this direction and account for model-endogenousrenewable expansion. The same applies for the electricity demand, which we haveassumed to be exogenously given and fully static. Yet, market splitting and therelated price differences might create regional incentives to flexibilize load.
In future research, it would also be possible to use a more detailed representationof the grid in the German neighboring countries than we did in our paper. Like this,the welfare effects in all these countries could be investigated rather than only inGermany. Such an analysis would likely bring interesting insights on why Germanyis reluctant to split its market area, while some neighboring countries are rather infavor of this measure.
Lastly, we have assumed the regulator to decide on the zonal delimination basedpurely on information available to him at the time of decision-making. Alternatively,some kind of iterative procedure could be implemented, in which the regulator tries toanticipate the future status of the electricity system and the behavior of the marketparticipants as a result of his zonal split. The regulator could then adjust the initialzonal delimination accordingly. Carrying out this iteration multiple times, we wouldthen likely end up with similar results as in the literature, where perfect anticipationof future decisions is often assumed. However, given the high degree of uncertaintythat a regulator deciding on a zonal delimination is confronted with, we expect ourresults to be closer to the real-world setting than models with perfect anticipationof all players’ decisions.
30
Acknowledgments
The authors acknowledge the financial support of the German Federal Ministry forEconomic Affairs and Energy under grant number 0324002A (AVerS – Analyse derVersorgungssicherheit in Suddeutschland unter Berucksichtigung der europaweitenKopplung der Strommarkte).
A Model Descriptions
A.1 Optimal Power Flow Model ELMOD
ELMOD is a linear optimization model for the analysis of interactions betweenelectricity generation and transmission grid. Originally developed at TU Dresden(Leuthold et al., 2008), ELMOD has already been used for numerous system anal-yses (e.g., Kunz et al., 2011; Kunz, 2013). In ELMOD, the European transmissiongrid as well as power plants and electricity demand are regionally modeled on a gridnode level. The load flow is approximated by a direct current (DC) approach. Theobjective of the standard model version is to minimize total generation costs. In thiscontribution, however, costs for congestion management are minimized instead, sincethe electricity generation of the different power plants results from the market sim-ulation with PowerACE and is an exogenous input for ELMOD. The constraints ofELMOD include maintaining the energy balance for each point in time and grid nodeas well as further equations regarding restrictions of the load flow and the dispatchof generation and storage units. An overview of the detailed mathematical formula-tions can be found in Leuthold et al. (2012). ELMOD is formulated in the GeneralAlgebraic Modeling System (GAMS) and solved with the commercial CPLEX solver.
A.2 Electricity Market Simulation Model PowerACE
The agent-based simulation model PowerACE has been developed at Karlsruhe Insti-tute of Technology and has already been applied for various energy system analyses(e.g., Bublitz et al., 2017; Genoese, 2010; Keles et al., 2016; Ringler et al., 2017). InPowerACE, major wholesale electricity markets and the associated market partici-pants such as utility companies, regulators and consumers are modeled. The agentsrepresenting electricity suppliers can decide on the daily scheduling of their powerplants and storage units as well as on the construction of new power plants andutility-scale storages. Thus, the short-term and long-term decision levels are consid-
31
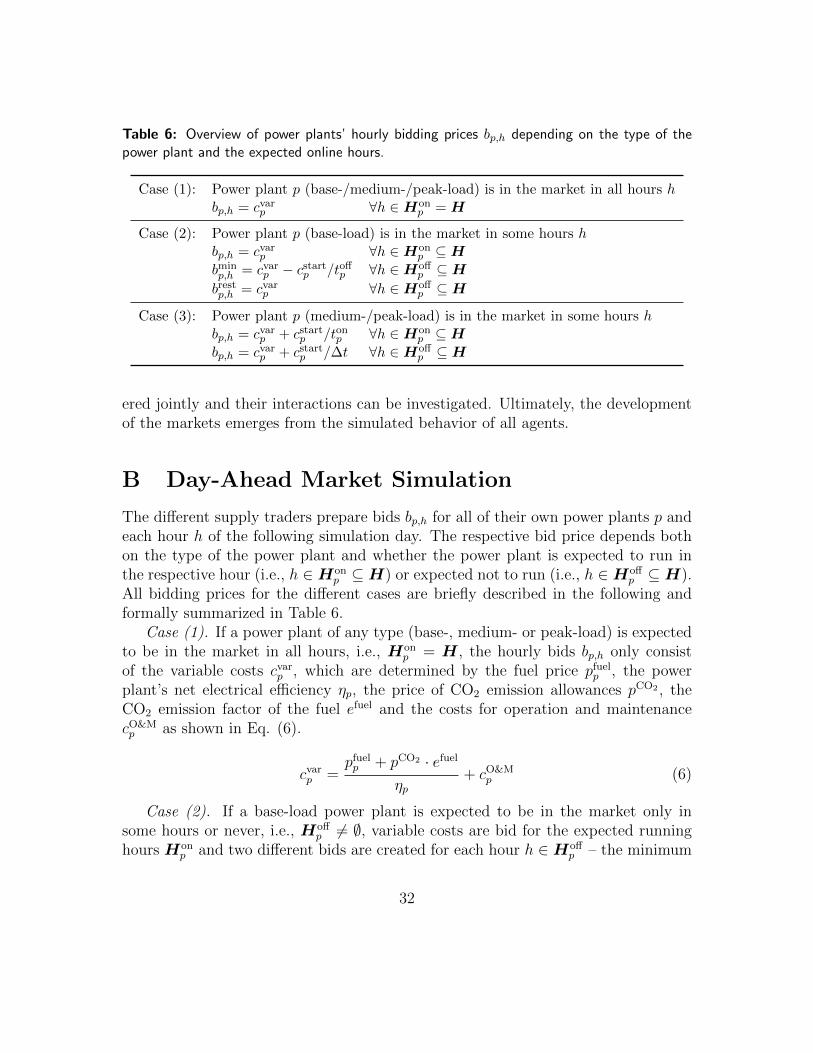
Table 6: Overview of power plants’ hourly bidding prices bp,h depending on the type of thepower plant and the expected online hours.
Case (1): Power plant p (base-/medium-/peak-load) is in the market in all hours hbp,h = cvar
p ∀h ∈Honp = H
Case (2): Power plant p (base-load) is in the market in some hours hbp,h = cvar
p ∀h ∈Honp ⊆H
bminp,h = cvar
p − cstartp /toff
p ∀h ∈Hoffp ⊆H
brestp,h = cvar
p ∀h ∈Hoffp ⊆H
Case (3): Power plant p (medium-/peak-load) is in the market in some hours hbp,h = cvar
p + cstartp /ton
p ∀h ∈Honp ⊆H
bp,h = cvarp + cstart
p /∆t ∀h ∈Hoffp ⊆H
ered jointly and their interactions can be investigated. Ultimately, the developmentof the markets emerges from the simulated behavior of all agents.
B Day-Ahead Market Simulation
The different supply traders prepare bids bp,h for all of their own power plants p andeach hour h of the following simulation day. The respective bid price depends bothon the type of the power plant and whether the power plant is expected to run inthe respective hour (i.e., h ∈Hon
p ⊆H) or expected not to run (i.e., h ∈Hoffp ⊆H).
All bidding prices for the different cases are briefly described in the following andformally summarized in Table 6.
Case (1). If a power plant of any type (base-, medium- or peak-load) is expectedto be in the market in all hours, i.e., Hon
p = H , the hourly bids bp,h only consistof the variable costs cvar
p , which are determined by the fuel price pfuelp , the power
plant’s net electrical efficiency ηp, the price of CO2 emission allowances pCO2 , theCO2 emission factor of the fuel efuel and the costs for operation and maintenancecO&Mp as shown in Eq. (6).
cvarp =
pfuelp + pCO2 · efuel
ηp+ cO&M
p (6)
Case (2). If a base-load power plant is expected to be in the market only insome hours or never, i.e., Hoff
p 6= ∅, variable costs are bid for the expected runninghours Hon
p and two different bids are created for each hour h ∈Hoffp – the minimum
32
running load of the power plant is bid at variable costs minus avoided start-up costscstartp , while the remaining load is bid at variable costs. The avoided start-up costs
are evenly distributed among the expected offline time toffp . The economic reasoning
behind this strategy is, that base-load power plants are expected to temporarilyaccept market prices below their marginal generation costs in order to avoid start-upcosts in subsequent hours.
Case (3). If a medium- or peak-load power plant is expected to be in the marketonly in some hours or never, the hourly bids consist of variable costs and start-upcosts. If the online time ton
p is longer than one hour, start-up costs are distributedevenly.
Further price-inelastic bids for demand, renewable feed-in and pumped storageunits are prepared by a single trader per market area, respectively. For details onthe determination of the bid volumes for pumped storage plants, please refer toFraunholz et al. (2017).
C Congestion Management
For computational performance reasons start-up costs are considered in the mar-ket simulation with PowerACE, but not in the grid model ELMOD. Consequently,redispatching might be carried out without an actual grid congestion need. In the fol-lowing, we describe how this issue can be avoided by reformulating Eq. (3). Thereby,the following crucial conditions need to be satisfied:
• Both, positive and negative redispatching have to be penalized to avoid redispatch-ing without a grid congestion need.• Positive redispatching should be carried out with the lowest-variable-cost power
plants able to resolve the grid congestion.• Negative redispatching should be carried out with the highest-variable-cost power
plants running according to the day-ahead market outcome.• Redispatching measures should preferably be carried out within Germany rather
than in neighboring countries.
As a first step, we define the reverted variable costs cvar,revp of a German conven-
tional power plant p ∈ P conDE as shown in Eq. (7), where cvar
DE denotes the averagevariable costs of the German conventional power plant fleet.
cvar,revp =
(cvar
DE
cvarp
)· cvar
DE ∀p ∈ P conDE (7)
33
We can now calculate the total costs for redispatching in Germany CredispDE ac-
cording to Eq. (8). In this formulation, positive redispatching is penalized withthe respective variable costs, whereas negative redispatching is penalized with therespective reverted variable costs. Like this, cost-minimal redispatching is carriedout, yet only if required for grid congestion reasons.
CredispDE =
∑p∈P con
DE
∑h∈H
(max
(gp,h − gmarket
p,h , 0)·cvarp −min
(gp,h − gmarket
p,h , 0)·cvar,revp
)(8)
As previously mentioned, the neighboring countries of Germany are consideredvia interconnectors and aggregated auxiliary grid nodes. Moreover, the focus of thisanalysis is on the congestion management capabilities of Germany. For these reasons,contrary to redispatching in Germany, both positive and negative redispatching inneighboring countries are penalized at the maximum variable costs of the Germanconventional power plants cvar,max
DE = maxp∈P conDE
cvarp as shown in Eq. (9). Using this
approach, redispatching is always preferably carried out in Germany.
Credispm =
∑p∈P con
m
∑h∈H
|gp,h − gmarketp,h | · cvar,max
DE ∀m ∈M \ {DE} (9)
In reality, if a power plant has to conduct negative redispatching, the savedmarginal costs have to be payed back to the TSO. To account for this practice,the final redispatching costs are determined by subtracting the artificial negativeredispatching costs from the positive redispatching costs subsequently to the costminimization with ELMOD.
Although most of the grid congestion events can be relieved by redispatching andcurtailment measures, situations in which the load cannot be served by the availablegeneration units under grid restrictions may occur. In these cases, part of the loadcan be dumped through ldump
n,h at a high penalty of cvoll = 10 000 EUR/MWhel10.
Contrary, the artificially added load laddn,h is implemented for modelling reasons only
in order to ensure a feasible solution and is also strongly penalized with specific costsof cadd = 10 000 EUR/MWhel. If ladd
n,h volumes arise, it may reveal model failures.
10The Value of Lost Load (VoLL) is defined as the willingness to pay of electricity consumers
to avoid a disruption of their electricity supply. The determination of the VoLL is non-trivial and
depends on several customer-specific factors as well as the respective point in time. Therefore, we
assume an average value, which is chosen high enough to only consider load shedding as a last resort
when carrying out congestion management.
34
Both penalty costs sum up to C infm as shown in Eq. (10). The objective function of
ELMOD as introduced in Eq. (1) now needs to be extended to the version shownin Eq. (11). Moreover, the energy balance shown in Eq. (2) has to account for theintroduced auxiliary variables, leading us to Eq. (12).
C infm =
∑n∈Nm
∑h∈H
(cadd · ladd
n,h + cvoll · ldumpn,h
)∀m ∈M (10)
minimize Ccongtotal =
∑m∈M
(Credispm + Ccurt
m + C infm
)(11)
lgrossn,h +
∑p∈P stor
n
lchargep,h + ladd
n,h − ldumpn,h =
∑p∈Pn
gp,h + fACn,h + fDC
n,h ∀n ∈N , h ∈H (12)
D Input Data
An overview of the techno-economic characteristics of the different investment op-tions modeled in PowerACE is provided in Tables 7 and 8.
References
Ambrosius, M., Grimm, V., Kleinert, T., Liers, F., Schmidt, M., Zottl, G., 2019.Endogenous price zones and investment incentives in electricity markets: Anapplication of multilevel optimization with graph partitioning. URL: http:
//www.optimization-online.org/DB HTML/2018/10/6868.html.
Bezdek, J.C., 1981. Pattern recognition with fuzzy objective function algorithms.Advanced applications in pattern recognition. 2. print ed., Plenum Press, NewYork.
Bjørndal, E., Bjørndal, M., Cai, H., Panos, E., 2018. Hybrid pricing in a coupledEuropean power market with more wind power. European Journal of OperationalResearch 264, 919–931. doi:10.1016/j.ejor.2017.06.048.
Breuer, C., Moser, A., 2014. Optimized bidding area delimitations and their impacton electricity markets and congestion management, in: 2014 11th InternationalConference on the European Energy Market (EEM), IEEE, Piscataway, NJ. doi:10.1109/EEM.2014.6861218.
35
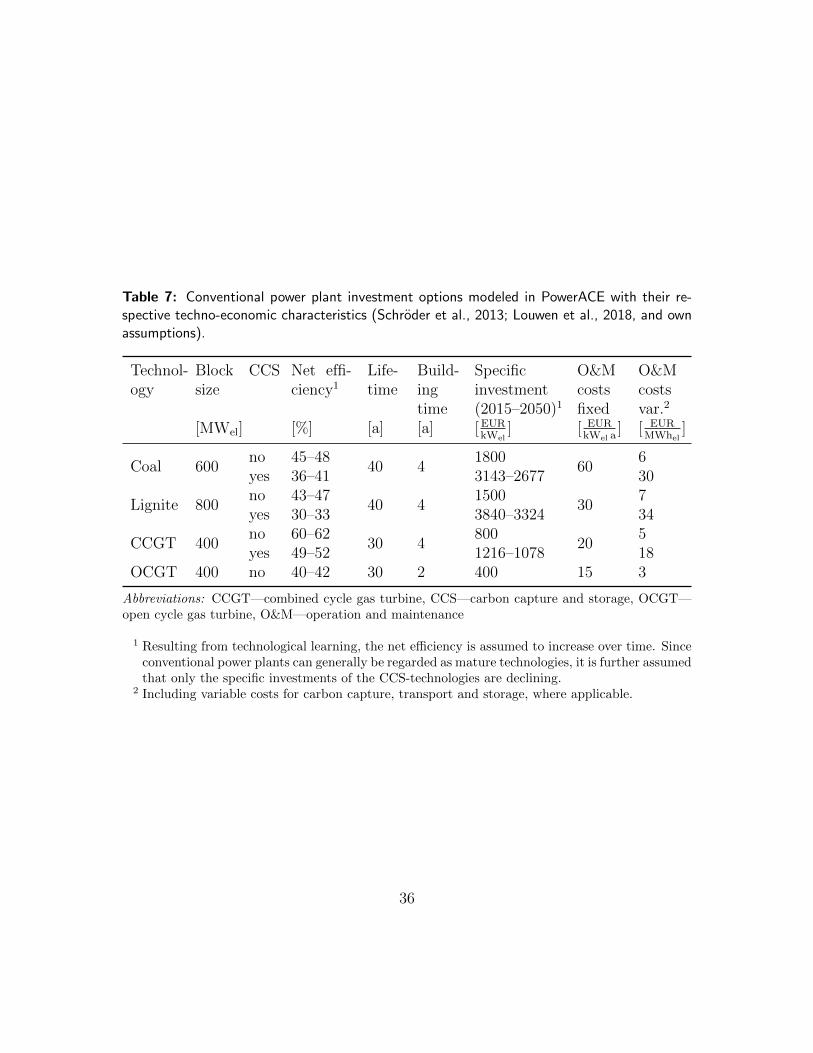
Table 7: Conventional power plant investment options modeled in PowerACE with their re-spective techno-economic characteristics (Schroder et al., 2013; Louwen et al., 2018, and ownassumptions).
Technol-ogy
Blocksize
CCS Net effi-ciency1
Life-time
Build-ingtime
Specificinvestment(2015–2050)1
O&Mcostsfixed
O&Mcostsvar.2
[MWel] [%] [a] [a] [ EURkWel
] [ EURkWel a
] [ EURMWhel
]
Coal 600no 45–48
40 41800
606
yes 36–41 3143–2677 30
Lignite 800no 43–47
40 41500
307
yes 30–33 3840–3324 34
CCGT 400no 60–62
30 4800
205
yes 49–52 1216–1078 18OCGT 400 no 40–42 30 2 400 15 3
Abbreviations: CCGT—combined cycle gas turbine, CCS—carbon capture and storage, OCGT—open cycle gas turbine, O&M—operation and maintenance
1 Resulting from technological learning, the net efficiency is assumed to increase over time. Sinceconventional power plants can generally be regarded as mature technologies, it is further assumedthat only the specific investments of the CCS-technologies are declining.
2 Including variable costs for carbon capture, transport and storage, where applicable.
36
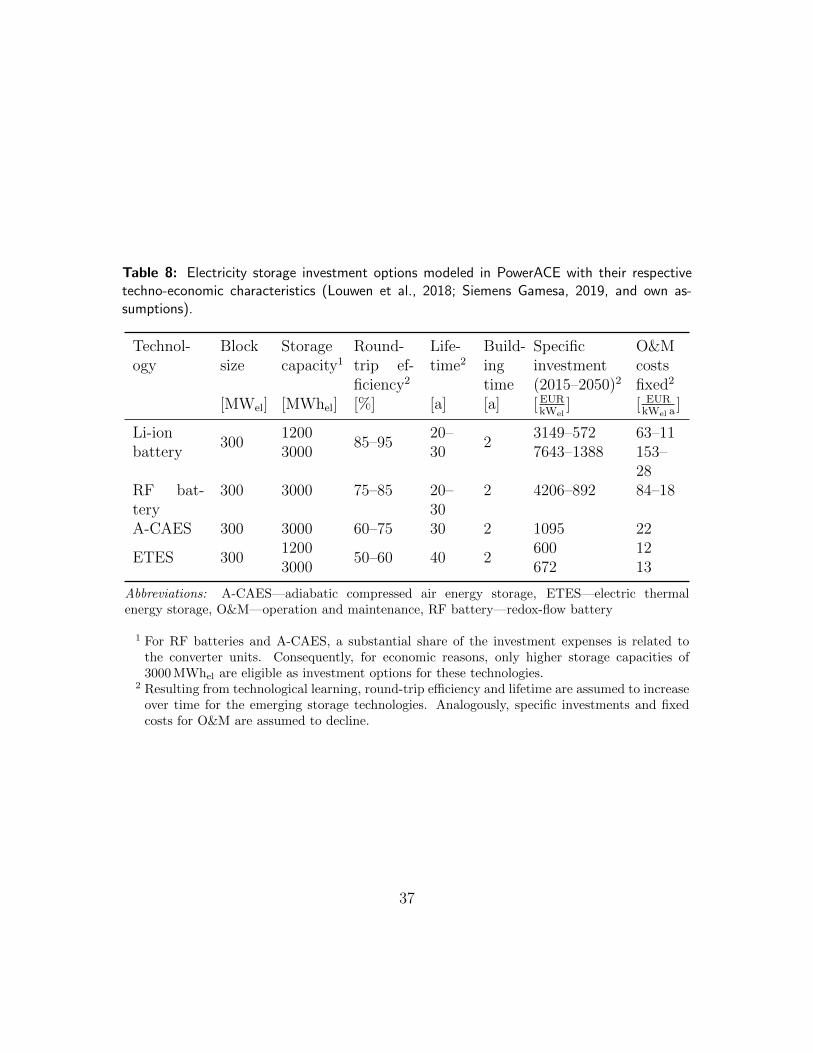
Table 8: Electricity storage investment options modeled in PowerACE with their respectivetechno-economic characteristics (Louwen et al., 2018; Siemens Gamesa, 2019, and own as-sumptions).
Technol-ogy
Blocksize
Storagecapacity1
Round-trip ef-ficiency2
Life-time2
Build-ingtime
Specificinvestment(2015–2050)2
O&Mcostsfixed2
[MWel] [MWhel] [%] [a] [a] [ EURkWel
] [ EURkWel a
]
Li-ionbattery
3001200
85–9520–30
23149–572 63–11
3000 7643–1388 153–28
RF bat-tery
300 3000 75–85 20–30
2 4206–892 84–18
A-CAES 300 3000 60–75 30 2 1095 22
ETES 3001200
50–60 40 2600 12
3000 672 13
Abbreviations: A-CAES—adiabatic compressed air energy storage, ETES—electric thermalenergy storage, O&M—operation and maintenance, RF battery—redox-flow battery
1 For RF batteries and A-CAES, a substantial share of the investment expenses is related tothe converter units. Consequently, for economic reasons, only higher storage capacities of3000 MWhel are eligible as investment options for these technologies.
2 Resulting from technological learning, round-trip efficiency and lifetime are assumed to increaseover time for the emerging storage technologies. Analogously, specific investments and fixedcosts for O&M are assumed to decline.
37
Breuer, C., Seeger, N., Moser, A., 2013. Determination of alternative bidding areasbased on a full nodal pricing approach, in: IEEE Power and Energy Society generalmeeting (PES), 2013, IEEE, Piscataway, NJ. doi:10.1109/PESMG.2013.6672466.
Bublitz, A., Keles, D., Fichtner, W., 2017. An analysis of the decline of electricityspot prices in Europe: Who is to blame? Energy Policy 107, 323–336. doi:10.1016/j.enpol.2017.04.034.
Bundesministerium fur Wirtschaft und Energie, 2017. Anderung der Stromnetzzu-gangsverordnung (StromNZV). URL: https://www.bmwi.de/Redaktion/DE/Artikel/Service/aenderung-stromnzv.html.
Bundesministerium fur Wirtschaft und Energie, 2019. Abschlussbericht der Kom-mission “Wachstum, Strukturwandel und Beschaftigung”. URL: https://www.bmwi.de/Redaktion/DE/Downloads/A/abschlussbericht-kommission-wachstu
m-strukturwandel-und-beschaeftigung.pdf.
Bundesnetzagentur, 2017. Kraftwerksliste. URL: http://www.bundesnetzagentur.de/DE/Sachgebiete/ElektrizitaetundGas/Unternehmen Institutionen/V
ersorgungssicherheit/Erzeugungskapazitaeten/Kraftwerksliste/kraftw
erksliste-node.html.
Bundesnetzagentur, 2019. EEG master data: Renewable energy installations coredata. URL: https://www.bundesnetzagentur.de/SharedDocs/Downloads/DE/Sachgebiete/Energie/Unternehmen Institutionen/ErneuerbareEnergien/Z
ahlenDatenInformationen/VOeFF Registerdaten/2019 01 Veroeff RegDate
n.xlsx.
Bundesnetzagentur, Bundeskartellamt, 2019. Monitoringbericht 2019. URL: https://www.bundesnetzagentur.de/SharedDocs/Mediathek/Berichte/2019/Moni
toringbericht Energie2019.pdf.
Burstedde, B., 2012. From Nodal to Zonal Pricing – A Bottom-Up Approach to theSecond-Best. volume 12/09 of EWI Working Paper. Koln.
Dunn, J.C., 1973. A Fuzzy Relative of the ISODATA Process and Its Use in DetectingCompact Well-Separated Clusters. Journal of Cybernetics 3, 32–57. doi:10.1080/01969727308546046.
Egerer, J., Weibezahn, J., Hermann, H., 2016. Two price zones for the German elec-tricity market – Market implications and distributional effects. Energy Economics59, 365–381. doi:10.1016/j.eneco.2016.08.002.
38
ENTSO-E, 2016. Ten Year Network Development Plan 2016: Market Modeling Data.URL: https://www.entsoe.eu/Documents/TYNDP%20documents/TYNDP%202016/rgips/TYNDP2016%20market%20modelling%20data.xlsx.
ENTSO-E, 2017. Transparency Platform. URL: https://transparency.entsoe.eu/.
European Commission, 2016. EU reference scenario 2016: Energy, transport andGHG emissions: trends to 2050. Publications Office, Luxembourg.
Fraunholz, C., Keles, D., Fichtner, W., 2019. Agent-Based Generation and StorageExpansion Planning in Interconnected Electricity Markets, in: 2019 16th Interna-tional Conference on the European Energy Market (EEM), IEEE, Piscataway, NJ.doi:10.1109/EEM.2019.8916348.
Fraunholz, C., Zimmermann, F., Keles, D., Fichtner, W., 2017. Price-based versusload-smoothing pumped storage operation: Long-term impacts on generation ad-equacy, in: 2017 14th International Conference on the European Energy Market(EEM), IEEE, Piscataway, NJ. doi:10.1109/EEM.2017.7981921.
Genoese, M., 2010. Energiewirtschaftliche Analysen des deutschen Strommarkts mitagentenbasierter Simulation. 1. aufl. ed., Nomos-Verl.-Ges, Baden-Baden.
Grimm, V., Kleinert, T., Liers, F., Schmidt, M., Zottl, G., 2017. Optimal pricezones of electricity markets: A mixed-integer multilevel model and global solutionapproaches. Optimization Methods and Software 34, 406–436. doi:10.1080/10556788.2017.1401069.
Grimm, V., Martin, A., Schmidt, M., Weibelzahl, M., Zottl, G., 2016a. Transmissionand generation investment in electricity markets: The effects of market splittingand network fee regimes. European Journal of Operational Research 254, 493–509.doi:10.1016/j.ejor.2016.03.044.
Grimm, V., Martin, A., Weibelzahl, M., Zottl, G., 2016b. On the long run effectsof market splitting: Why more price zones might decrease welfare. Energy Policy94, 453–467. doi:10.1016/j.enpol.2015.11.010.
Grimm, V., Ruckel, B., Solch, C., Zottl, G., 2018. The Impact of Market Design onTransmission and Generation Investment in Electricity Markets. doi:10.2139/ssrn.3235262.
39
Hong, Y.Y., Chang-Chien, C.N., Wu, K.L., Yang, M.S., 2002. Determination ofCongestion Zones in Deregulated Electricity Markets Using Fuzzy Clustering, in:14th Power Systems Computation Conference 2002.
Keles, D., Bublitz, A., Zimmermann, F., Genoese, M., Fichtner, W., 2016. Analysisof design options for the electricity market: The German case. Applied Energy183, 884–901. doi:10.1016/j.apenergy.2016.08.189.
Kunz, F., 2013. Improving Congestion Management: How to Facilitate the Inte-gration of Renewable Generation in Germany. The Energy Journal 34, 55–78.doi:10.5547/01956574.34.4.4.
Kunz, F., von Hirschhausen, C., Most, D., Weigt, H., 2011. Security of Supply andElectricity Network Flows after a Phase-Out of Germany’s Nuclear Plants: AnyTrouble Ahead? doi:10.2139/ssrn.1858632.
Leuthold, F.U., Weigt, H., von Hirschhausen, C., 2008. ELMOD – A Model of theEuropean Electricity Market. doi:10.2139/ssrn.1169082.
Leuthold, F.U., Weigt, H., von Hirschhausen, C., 2012. A Large-Scale Spatial Op-timization Model of the European Electricity Market. Networks and Spatial Eco-nomics 12, 75–107. doi:10.1007/s11067-010-9148-1.
Louwen, A., Junginger, M., Krishnan, S., 2018. Technological learning in energymodelling – experience curves: Policy brief for the REFLEX project.
von Luxburg, U., 2007. A tutorial on spectral clustering. Statistics and Computing17, 395–416. doi:10.1007/s11222-007-9033-z.
Metzdorf, J., 2016. Development and implementation of a spatial clustering ap-proach using a transmission grid energy system model. Master thesis. UniversitatStuttgart. URL: https://elib.dlr.de/106325/.
Pettersen, F.E., Ekern, L., Willumsen, V., 2011. Mapping of selected markets withNodal pricing or similar systems: Australia, New Zealand and North Americanpower markets. Norwegian Water Resources and Energy Directorate, Oslo.
Plancke, G., de Jonghe, C., Belmans, R., 2016. The implications of two Germanprice zones in a european-wide context, in: 2016 13th International Conference onthe European Energy Market (EEM), IEEE, Piscataway, NJ. doi:10.1109/EEM.2016.7521290.
40
Ringler, P., Keles, D., Fichtner, W., 2017. How to benefit from a common Europeanelectricity market design. Energy Policy 101, 629–643. doi:10.1016/j.enpol.2016.11.011.
Schroder, A., Kunz, F., Meiss, J., Mendelevitch, R., von Hirschhausen, C., 2013.Current and Prospective Costs of Electricity Generation until 2050. DeutschesInstitut fur Wirtschaftsforschung, Berlin.
Siemens Gamesa, 2019. ETES – Electric Thermal Energy Storage: Strommarkttref-fen May 2019. URL: https://www.strommarkttreffen.org/2019-05-10 Schum
acher ETES-Electric Thermal Energy Storage.pdf.
S&P Global Platts, 2015. World electric power plants database. URL: http://www.platts.com/products/world-electric-power-plants-database.
Stoft, S., 1997. Transmission pricing zones: Simple or complex? The ElectricityJournal 10, 24–31. doi:10.1016/S1040-6190(97)80294-1.
THEMA Consulting Group, 2013. Nordic bidding zones. URL: https://www.thema.no/wp-content/uploads/2015/04/THEMA-report-2013-27-Nordic Bidding
Zones FINAL.pdf.
Trepper, K., Bucksteeg, M., Weber, C., 2015. Market splitting in Germany – Newevidence from a three-stage numerical model of Europe. Energy Policy 87, 199–215.doi:10.1016/j.enpol.2015.08.016.
41
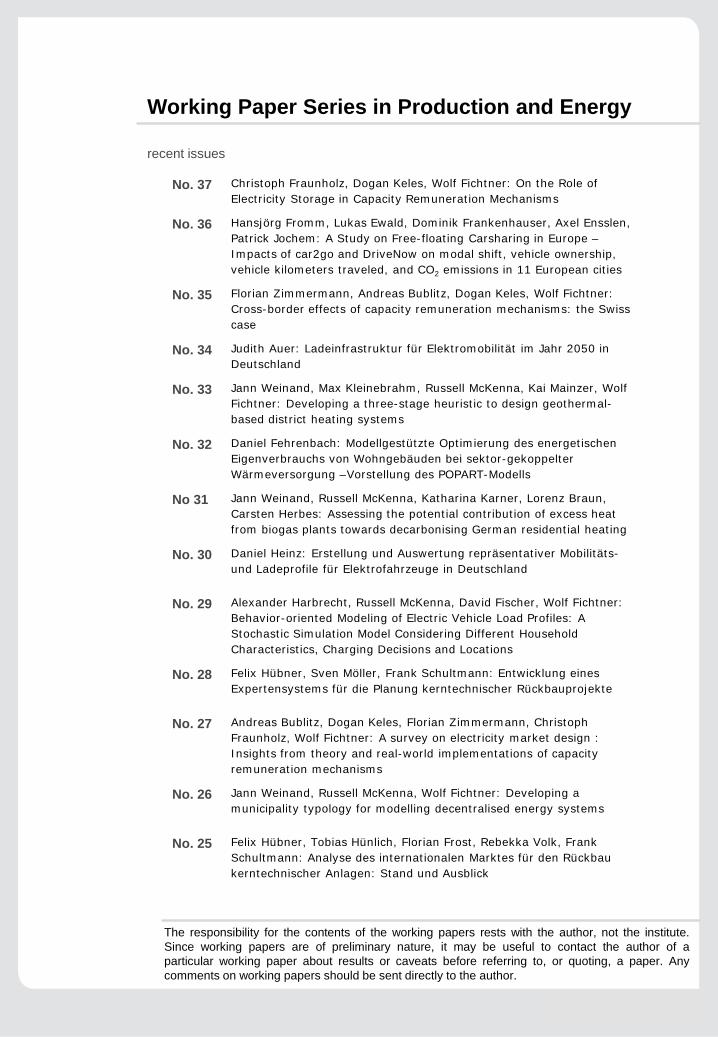
The responsibility for the contents of the working papers rests with the author, not the institute.Since working papers are of preliminary nature, it may be useful to contact the author of aparticular working paper about results or caveats before referring to, or quoting, a paper. Anycomments on working papers should be sent directly to the author.
Working Paper Series in Production and Energy
recent issues
No. 37 Christoph Fraunholz, Dogan Keles, Wolf Fichtner: On the Role of Electricity Storage in Capacity Remuneration Mechanisms
No. 36 Hansjörg Fromm, Lukas Ewald, Dominik Frankenhauser, Axel Ensslen,Patrick Jochem: A Study on Free-floating Carsharing in Europe –Impacts of car2go and DriveNow on modal shift, vehicle ownership, vehicle kilometers traveled, and CO2 emissions in 11 European cities
No. 35 Florian Zimmermann, Andreas Bublitz, Dogan Keles, Wolf Fichtner: Cross-border effects of capacity remuneration mechanisms: the Swiss case
No. 34 Judith Auer: Ladeinfrastruktur für Elektromobilität im Jahr 2050 in Deutschland
No. 33 Jann Weinand, Max Kleinebrahm, Russell McKenna, Kai Mainzer, Wolf Fichtner: Developing a three-stage heuristic to design geothermal-based district heating systems
No. 32 Daniel Fehrenbach: Modellgestützte Optimierung des energetischen Eigenverbrauchs von Wohngebäuden bei sektor-gekoppelter Wärmeversorgung –Vorstellung des POPART-Modells
No 31 Jann Weinand, Russell McKenna, Katharina Karner, Lorenz Braun, Carsten Herbes: Assessing the potential contribution of excess heat from biogas plants towards decarbonising German residential heating
No. 30 Daniel Heinz: Erstellung und Auswertung repräsentativer Mobilitäts-und Ladeprofile für Elektrofahrzeuge in Deutschland
No. 29 Alexander Harbrecht, Russell McKenna, David Fischer, Wolf Fichtner: Behavior-oriented Modeling of Electric Vehicle Load Profiles: A Stochastic Simulation Model Considering Different Household Characteristics, Charging Decisions and Locations
No. 28 Felix Hübner, Sven Möller, Frank Schultmann: Entwicklung eines Expertensystems für die Planung kerntechnischer Rückbauprojekte
No. 27 Andreas Bublitz, Dogan Keles, Florian Zimmermann, Christoph Fraunholz, Wolf Fichtner: A survey on electricity market design : Insights from theory and real-world implementations of capacityremuneration mechanisms
No. 26 Jann Weinand, Russell McKenna, Wolf Fichtner: Developing a municipality typology for modelling decentralised energy systems
No. 25 Felix Hübner, Tobias Hünlich, Florian Frost, Rebekka Volk, Frank Schultmann: Analyse des internationalen Marktes für den Rückbau kerntechnischer Anlagen: Stand und Ausblick

www.iip.kit.edu
Impressum
Karlsruher Institut für Technologie
Institut für Industriebetriebslehre und Industrielle Produktion (IIP)Deutsch-Französisches Institut für Umweltforschung (DFIU)
Hertzstr. 16D-76187 Karlsruhe
KIT – Universität des Landes Baden-Württemberg undnationales Forschungszentrum in der Helmholtz-Gemeinschaft
Working Paper Series in Production and EnergyNo. 38, February 2020
ISSN 2196-7296