Embed Size (px)
Citation preview

1
On the Fundamental Characteristics ofUltra-Dense Small Cell NetworksMing Ding∗, Senior Member, IEEE, David Lopez-Perez†, Senior Member, IEEE,
Holger Claussen‡, Senior Member, IEEE, Mohamed Ali Kaafar§, Senior Member, IEEE
Abstract—In order to cope with the forecasted 1000× increasein wireless capacity demands by 2030, network operators willaggressively densify their network infrastructure to reuse thespectrum as much as possible. However, it is important to realisethat these new ultra-dense small cell networks are fundamentallydifferent from the traditional macrocell or sparse small cellnetworks, and thus ultra-dense networks (UDNs) cannot bedeployed and operated in the same way as in the last 25 years.In this paper, we systematically investigate and visualise theperformance impacts of several fundamental characteristics ofUDNs, that mobile operators and vendors should consider whendeploying UDNs. Moreover, we also provide new deployment andmanagement guidelines to address the main challenges broughtby UDNs in the future.1
I. INTRODUCTION
Based on recent market predictions, mobile data traffic willkeep growing at an astonishing compound annual growth rateof 47 % towards 2030, beyond the so-called 1000× wirelesscapacity demand [1]. In response to this traffic explosion, anumber of technical studies have shown that a 1000× capacitygain can only be expected from solutions that involve thedeployment of a massive number of cells, either to i) reusethe current spectrum (sub-6 GHz solutions), or ii) gain accessto new frequency bands (centimetre-wave and millimetre-wavesolutions), and the mobile industry has started to walk downthis path [2], [3].
Throughout the second decade of 2000 up to now, networkdensification has energised the 3rd Generation PartnershipProject (3GPP) 4th-generation (4G) Long Term Evolution(LTE) networks, with the full integration of small cell technol-ogy in their specifications, and the commercial deployment ofsmall cell products [4]. Indoor small cells have conquered theresidential market as a coverage solution. Indeed, a total ofover 14 million small cells were deployed worldwide by Feb.2016, of which over 12 million were residential. The non-residential small cells business has also recently taken off,
∗Ming Ding is with Data61, CSIRO, Australia (e-mail:[email protected]).†David Lopez-Perez is with Nokia Bell Labs, Ireland (email: david.lopez-
[email protected]).‡Holger Claussen is leader of the Small Cells Research at Nokia Bell Labs,
Ireland (email: [email protected]).§Mohamed Ali Kaafar (Dali Kaafar) is the Group Leader of Networks
Group at Data61, CSIRO, Australia (e-mail: [email protected]).1To appear in IEEE Network Magazine. 1536-1276 copyright 2015
IEEE. Personal use is permitted, but republication/redistribution requiresIEEE permission. Please find the final version in IEEE from thelink: http://ieeexplore.ieee.org/document/xxxxxxx/. Digital Object Identifier:10.1109/TNM.2017.xxxxxxx
both as a coverage and a capacity solution, with enterpriseand outdoor small cell shipments expected to grow by 270 %and 150 %, respectively, in 2017 [4].
A. Orthogonal Deployments of UDNs in Sub-6 GHz Spectrum
The current 5th-generation (5G) networks standardisationefforts and its stringent coverage and capacity requirements,set to provide an unlimited user experience, also suggest thatsmall cells will remain the main driving force of cellulartechnology in the years to come, with the overall small cellmarket expected to generate revenues of USD 6.7 billion by2020 [4]. In more detail,• In the first deployment phase of 5G, the orthogonal
deployment2 of ultra-dense (UD) small cell networks(SCNs), a.k.a. ultra-dense networks (UDNs), at sub-6 GHz frequencies is envisaged as the workhorse for ca-pacity enhancement for most operators, mostly due to thelarge gains attainable via spatial reuse and the simplifiedinterference and mobility management, resulting from itslow interaction with the macrocell network [5]. This sub-6 GHz small cell deployments are expected to achievepeak data rates of 1 Gbps, and a ubiquitous coverage withmore than 100 Mbps wherever needed.
• In a posterior second phase of 5G, the deployment ofUDNs at centimetre-wave, millimetre-wave or even Tera-Hz [6] frequencies is expected to provide larger peakdata rates of 10 Gbps in megacities, where fibre, digitalsubscriber line (DSL) and wireless based backhaul willbe a widely available commodity [3].
B. Our Contributions and Paper Structure
In this article, we focus on the spatial reuse gain of UDNsat sub-6GHz frequencies, as their role outs are expected to beearlier than millimetre-wave ones3.
Compared with the conventional sparse/dense cellular net-works, it is obvious that UDNs directly lead to• a much shorter distance between a base station (BS) and
its served user equipment (UE), and
2 The orthogonal deployment means that small cells and macrocells areoperating on a different frequency spectrum, i.e., 3GPP Small Cell Scenario#2a [2].
3 We leave millimetre-wave communications analyses for further study asthe topic stands on its own, and requires a completely new analysis [7]. Morespecifically, millimetre-wave communications present several new featuresthat should be treated differently from sub-6GHz ones, such as short-rangecoverage, low inter-cell interference, blockage effects, and high Doppler shift,among others [7].
arX
iv:1
710.
0529
7v1
[cs
.NI]
15
Oct
201
7
2
Fig. 1: Illustration of a typical 4G LTE SCN scenario.
• a much smaller ratio of BSs to UEs.
Following those two direct consequences, in this article, wepresent five characteristics that make UDNs fundamentallydifferent from current sparse and dense networks, and drawattention to those deployment aspects that operators will needto reconsider when deploying these UDNs.
The rest of this article is structured as follows: In Section II,the most typical UDN use case together with a system modelfor its network performance study are described. In Section III,the network performance visualisation technique used in thispaper is introduced. In Sections IV∼VI, the five fundamentaldifferences that UDNs bring about are presented, and theirperformance impacts are visualised. Finally, in Section VII,the conclusions are drawn.
II. USE CASE AND SYSTEM MODEL
Megacities like New York are characterised by macrocelldeployments with a 500 m inter-site distance or less, whereeach macrocell site is usually divided into 3 macrocell sectorswith directional antennas, and each macrocell sector hostsa given number of small cell BSs. Based on the abovedescription, and assuming today’s 500 m inter-site distancetogether with 4 small cells per macrocell sector [8], we providean illustration of a typical 4G LTE SCN scenario in Fig. 1,which has a small cell density of around 50 cells/km2. In thisfigure, i) each macrocell site is illustrated with thick blacklines and is equally divided into 3 macrocell sectors with theirdirectional antennas shown as red arrows, ii) each small cellis illustrated with thick green circles, and iii) a wrap-aroundapproach, depicted as a third macrocell tier, is consideredto avoid the underestimation of interference in the outer-rimregion [8].
In this paper, we consider a similar system model withmacrocell sites deployed in a hexagonal grid to guide the ran-dom deployment of small cells with a density of λBSs/km2.In particular, we study three different small cell BS densities:
• i) A typical 4G LTE network with 4 small cells permacrocell, resulting in a λ around 50 BSs/km2;
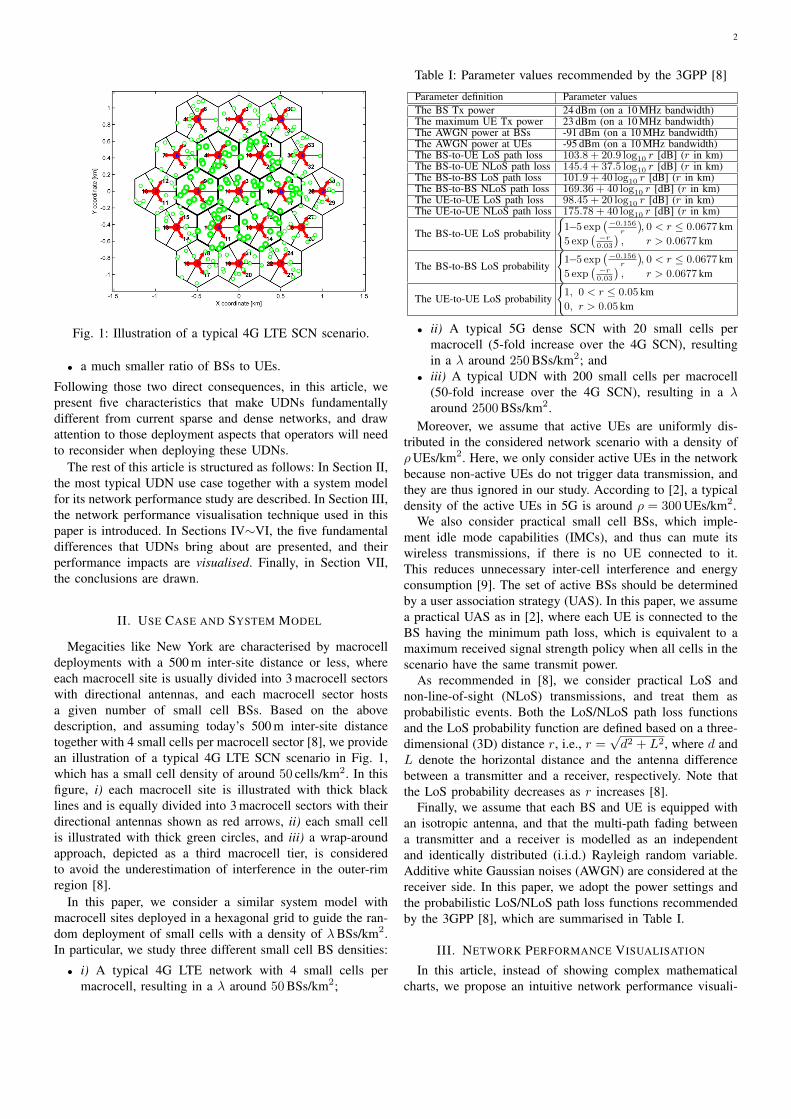
Table I: Parameter values recommended by the 3GPP [8]
Parameter definition Parameter valuesThe BS Tx power 24 dBm (on a 10 MHz bandwidth)The maximum UE Tx power 23 dBm (on a 10 MHz bandwidth)The AWGN power at BSs -91 dBm (on a 10 MHz bandwidth)The AWGN power at UEs -95 dBm (on a 10 MHz bandwidth)The BS-to-UE LoS path loss 103.8 + 20.9 log10 r [dB] (r in km)The BS-to-UE NLoS path loss 145.4 + 37.5 log10 r [dB] (r in km)The BS-to-BS LoS path loss 101.9 + 40 log10 r [dB] (r in km)The BS-to-BS NLoS path loss 169.36 + 40 log10 r [dB] (r in km)The UE-to-UE LoS path loss 98.45 + 20 log10 r [dB] (r in km)The UE-to-UE NLoS path loss 175.78 + 40 log10 r [dB] (r in km)
The BS-to-UE LoS probability
{1−5 exp
(−0.156r
),
5 exp( −r0.03
),
0 < r ≤ 0.0677 kmr > 0.0677 km
The BS-to-BS LoS probability
{1−5 exp
(−0.156r
),
5 exp( −r0.03
),
0 < r ≤ 0.0677 kmr > 0.0677 km
The UE-to-UE LoS probability
{1,
0,
0 < r ≤ 0.05 kmr > 0.05 km
• ii) A typical 5G dense SCN with 20 small cells permacrocell (5-fold increase over the 4G SCN), resultingin a λ around 250 BSs/km2; and
• iii) A typical UDN with 200 small cells per macrocell(50-fold increase over the 4G SCN), resulting in a λaround 2500 BSs/km2.
Moreover, we assume that active UEs are uniformly dis-tributed in the considered network scenario with a density ofρUEs/km2. Here, we only consider active UEs in the networkbecause non-active UEs do not trigger data transmission, andthey are thus ignored in our study. According to [2], a typicaldensity of the active UEs in 5G is around ρ = 300 UEs/km2.
We also consider practical small cell BSs, which imple-ment idle mode capabilities (IMCs), and thus can mute itswireless transmissions, if there is no UE connected to it.This reduces unnecessary inter-cell interference and energyconsumption [9]. The set of active BSs should be determinedby a user association strategy (UAS). In this paper, we assumea practical UAS as in [2], where each UE is connected to theBS having the minimum path loss, which is equivalent to amaximum received signal strength policy when all cells in thescenario have the same transmit power.
As recommended in [8], we consider practical LoS andnon-line-of-sight (NLoS) transmissions, and treat them asprobabilistic events. Both the LoS/NLoS path loss functionsand the LoS probability function are defined based on a three-dimensional (3D) distance r, i.e., r =
√d2 + L2, where d and
L denote the horizontal distance and the antenna differencebetween a transmitter and a receiver, respectively. Note thatthe LoS probability decreases as r increases [8].
Finally, we assume that each BS and UE is equipped withan isotropic antenna, and that the multi-path fading betweena transmitter and a receiver is modelled as an independentand identically distributed (i.i.d.) Rayleigh random variable.Additive white Gaussian noises (AWGN) are considered at thereceiver side. In this paper, we adopt the power settings andthe probabilistic LoS/NLoS path loss functions recommendedby the 3GPP [8], which are summarised in Table I.
III. NETWORK PERFORMANCE VISUALISATION
In this article, instead of showing complex mathematicalcharts, we propose an intuitive network performance visuali-
3
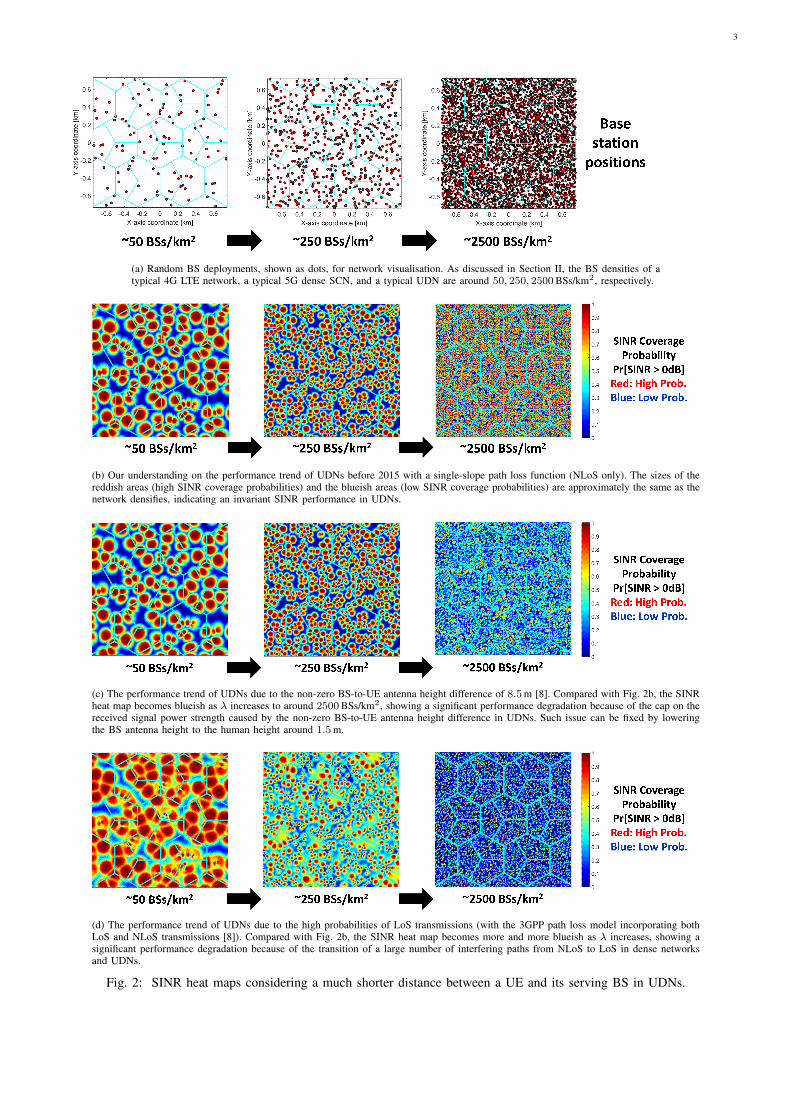
(a) Random BS deployments, shown as dots, for network visualisation. As discussed in Section II, the BS densities of atypical 4G LTE network, a typical 5G dense SCN, and a typical UDN are around 50, 250, 2500 BSs/km2, respectively.
(b) Our understanding on the performance trend of UDNs before 2015 with a single-slope path loss function (NLoS only). The sizes of thereddish areas (high SINR coverage probabilities) and the blueish areas (low SINR coverage probabilities) are approximately the same as thenetwork densifies, indicating an invariant SINR performance in UDNs.
(c) The performance trend of UDNs due to the non-zero BS-to-UE antenna height difference of 8.5 m [8]. Compared with Fig. 2b, the SINRheat map becomes blueish as λ increases to around 2500 BSs/km2, showing a significant performance degradation because of the cap on thereceived signal power strength caused by the non-zero BS-to-UE antenna height difference in UDNs. Such issue can be fixed by loweringthe BS antenna height to the human height around 1.5 m.
(d) The performance trend of UDNs due to the high probabilities of LoS transmissions (with the 3GPP path loss model incorporating bothLoS and NLoS transmissions [8]). Compared with Fig. 2b, the SINR heat map becomes more and more blueish as λ increases, showing asignificant performance degradation because of the transition of a large number of interfering paths from NLoS to LoS in dense networksand UDNs.
Fig. 2: SINR heat maps considering a much shorter distance between a UE and its serving BS in UDNs.
4
sation technique to simulate and illustrate the performance ofUDNs and open our results to a wider audience.
First, we randomly generate several network deploymentsfollowing the 3GPP approach of the hexagonal grid addressedin Section II. As discussed in Section II, the BS densities ofa typical 4G LTE network, a typical 5G dense SCN, and atypical UDN are around 50, 250, 2500 BSs/km2, respectively.In Fig. 2a, we plot the BS positions used in our networkperformance visualisation, which are represented by dots anduniformly distributed over an area of 1.5 km × 1.5 km. Notethat the hexagonal grid in Fig. 2a is of the same size as thatin Fig. 1. Such 3GPP hexagonal grid is used here to guide therandom deployment of small cell BSs in the network.
Second, based on the explicit modelling of the signal, theinterference the noise powers addressed in Section II, weplace a probe UE at a random position in the network, andthen measure its signal-to-interference-plus-noise ratio (SINR)coverage probability via 10,000 simulation experiments. SuchSINR coverage probability is defined as the probability thatthe probe UE’s SINR is larger than a threshold γ, i.e.,Pr [SINR > γ] [10]. We repeat this probing process until thewhole network is scanned with an adequate geographicalresolution. Moreover, we set the SINR threshold γ to 1 (i.e.,0 dB), which reflects the minimum working SINR thresholdfor practical receivers.
Third, since the SINR coverage probability ranges between0 and 1, we show the network performance using heat maps,with red and blue indicating a high SINR coverage probabilityand a low one, respectively. With such SINR heat maps, thesignificant performance impacts of the fundamental charac-teristics of UDNs can be translated into striking visual plots,showing performance transition as the network densifies.
It should be noted that a large body of theoretical workhas used the stochastic geometry theory to study network per-formance in terms of average coverage probability [10]–[12].Such performance metric averages the SINR coverage prob-ability in the spatial domain and gives a single performancemeasure on a macroscopic level. In our network performancevisualisation, the average color of a heat map generated for agiven scenario represents such average coverage probabilities.
Moreover, the proposed network visualisation techniqueprovides microscopic information on network performance,such as the variance of the SINR coverage probability, thelocations of coverage holes, etc., which is useful in academicstudies and for business proposals with clients. For example,the proposed technique is able to provide answers visuallywhen an operator wants to know the performance impact ofadding several specific BSs to its current network.
IV. TWO FUNDAMENTAL ASPECTS OF UDNS RELATED TOBS-TO-UE DISTANCE
Before 2015, the common understanding on UDNs was thatthe density of BSs would not affect the SINR coverage proba-bility performance in interference-limited fully-loaded wirelessnetworks, and thus the network capacity in bps/Hz/km2 wouldscale linearly with the network densification due to the linearincrease of the spectrum reuse [10].
Fig. 2b exemplifies such conclusion with a path loss ex-ponent of 3.75, showing the performance trend of three net-works with different BS densities according to [10]. Visuallyspeaking, the sizes of the reddish areas (high SINR coverageprobabilities) and the blueish areas (low SINR coverage prob-abilities) are approximately the same as the network densifies,indicating an invariant SINR performance with the BS density.
However, it is important to note that this conclusion wasobtained with considerable simplifications on the propagationenvironment and BS/UE deployment, such as a single-slopepath loss model, which should be placed under scrutiny whenevaluating UDNs, since they are fundamentally different fromsparse ones in various aspects. In this section, we study twofundamental aspects of UDNs, both resulting from the muchshorter distance between a BS and its served UEs.
A. Capped Carrier Signal Power
In the performance analysis of the conventional sparse ordense cellular networks, the antenna height difference betweenBSs and UEs is denoted by L, and is usually ignored due tothe dominance of the horizontal distance. However, with amuch shorter distance between a BS and its served UEs in anUDN, such antenna height difference becomes non-negligible.More specifically, the existence of a non-zero antenna heightdifference between BSs and UEs gives rise to a non-zero capon the minimum distance between a BS and its served UEs,and thus a cap on the received signal power strength. Thus,and although each inter-cell interference power strength issubject to the same cap, the aggregate inter-cell interferencepower will overwhelm the signal power in an UDN due to thesheer number of strong interferers.
To visualise this fundamental aspect, in Fig. 2c we plot theSINR heat map of SCNs with the following assumption:• the 3GPP antenna configuration using L = 8.5 m as
recommended in [8]. Note that in this case, the BSantenna height and the UE antenna height are assumedto be 10 m and 1.5 m, respectively.
Obversations: From Fig. 2c, we can observe that:• The non-zero BS-to-UE antenna height difference has
a negligible performance impact when the BS densityis not ultra-dense (i.e., when λ is respectively around50 BSs/km2 and 250 BSs/km2), since the SINR maps arebasically the same as those in Fig. 2b.
• Compared with Fig. 2b, the SINR heat map becomesmuch more blueish for the considered the UDN (i.e.,when λ is around 2500 BSs/km2), indicating a significantperformance degradation. This is due to the cap on thereceived signal power strength caused by the non-zeroBS-to-UE antenna height difference in UDNs.
Concluding Remark: Considering the significant perfor-mance impact of the BS-to-UE antenna height difference, wesuggest to deploy small cell BSs in UDNs as closer as possibleto human height. However, this requires a revolutionised ap-proach to BS architecture and deployment to avoid tampering,vandalism, and other unwanted effects [12].
In the following sections, we will only consider a futuristicscenario with a zero antenna height difference between BSs

5
and UEs, i.e., L = 0 m, so that the performance of UDNs isnot unnecessarily penalised by this aspect as shown in Fig. 2c.
B. Stronger Interference Power
A much shorter distance between a BS and its servedUEs in an UDN implies high probabilities of line-of-sight(LoS) transmissions. Generally speaking, LoS transmissionsare more helpful to enhance the received signal strengththan non-line-of-sight (NLoS) transmissions. However, aftera certain level of densification, not only the signal power, butalso the inter-cell interference power will significantly growdue to the emergence of LoS paths. Thus, the transition ofa large number of interfering paths from NLoS to LoS willoverwhelm the signal power in an UDN [11].
To visualise this fundamental aspect, in Fig. 2d we plot theSINR heat map of SCNs with the following assumptions:• the antenna configuration recommended in Subsec-
tion IV-A with L = 0 m, and• the 3GPP probabilistic LoS/NLoS path loss model exhib-
ited in Table I.Obversations: From Fig. 2d, we can see that:• Compared with Fig. 2b, the SINR heat map becomes
more reddish for the 4G SCN (i.e., when λ is around50 BSs/km2), because the received signal strength isenhanced by LoS transmissions, while most inter-cellinterference remain as NLoS.
• Compared with Fig. 2b, the SINR heat map becomesmore blueish when λ is equal to or larger than250 BSs/km2, thus showing a significant performancedegradation because of the transition of a large numberof interfering paths from NLoS to LoS in UDNs.
Concluding Remark: Considering the significant perfor-mance impact of the transition of a large number of interferepaths from NLoS to LoS, we propose that operators shouldcarefully plan the deployment of small cell BSs from 4G to5G, and adopt potential solutions to mitigate the accelerationof the growth of the inter-cell interference, which will bediscussed later in this article.
In the following sections, we will focus on the 3GPPprobabilistic LoS/NLoS path loss model exhibited in Table I.This propagation model is realistic and such NLoS to LoStransition cannot be avoided in the foreseeable future.
V. TWO FUNDAMENTAL ASPECTS OF UDNS RELATED TOSMALL UE NUMBER PER BS
In this section, we study another two fundamental aspectsof UDNs, caused by the much larger ratio of the BS numberover the UE number.
A. More BSs than Active UEs
In Section II, it was discussed how, with a surplus ofBSs, a BS can mute its transmissions when there is noactive UE connected to it, which is referred as the BS idlemode capability (IMC) [2]. As a result, the active UE SINRperformance benefits from (i) a BS diversity gain, i.e., eachUE has a plurality of BSs to select its server from, and (ii) a
tight control of unnecessary inter-cell interference, as idle BSsare put to sleep thanks to the IMC and do not generate anyinterference. The surplus of BSs together with the IMC canbe seen as a powerful tool that can help to mitigate the fast-growing interference problem presented in Subsection IV-B.
To visualise this fundamental aspect, in Fig. 3a we plot theSINR heat map of SCNs with the following assumptions:• the antenna configuration with L = 0 m recommended in
Subsection IV-A,• the 3GPP probabilistic LoS/NLoS path loss model rec-
ommended in Subsection IV-B, and• a finite number of UEs (ρ = 300 UEs/km2, a typical
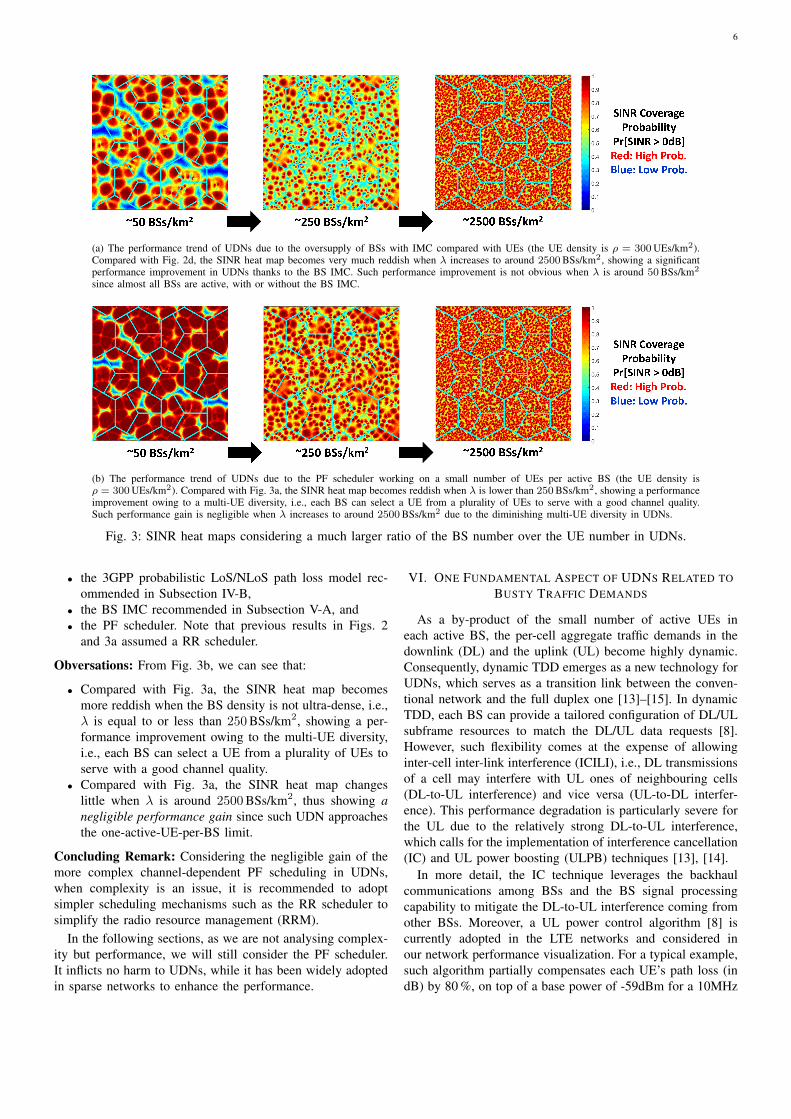
density of the active UEs in 5G) [2].Obversations: From Fig. 3a, we can see that:• Compared with Fig. 2d, the SINR heat map changes little
for the 4G SCN (i.e., when λ is around 50 BSs/km2),because almost all BSs are active with or without theIMC, due to the relatively small BS density comparedwith the UE density of ρ = 300 UEs/km2.
• Compared with Fig. 2d, the SINR heat map becomesmore reddish when λ is equal to or larger than250 BSs/km2, thus showing a significant performanceimprovement in UDNs thanks to the BS IMC. Morespecifically, the signal power continues increasing withthe network densification, while the interference poweris controlled because not all BSs are turned on.
Concluding Remark: Considering the significant perfor-mance benefit of the surplus of BS together with the IMC,we suggest that small cell BSs in UDNs should be equippedwith efficient IMCs that are able to put to sleep a given numberof BSs to realise a desired UE quality of experience (QoE).
In the following sections, we will consider the BS IMCbecause it is essential to the successful operation of UDNs.
B. Less active UEs per active BS
With a much larger number of BSs than UEs in UDNs,the number of active UEs in each BS also becomes smaller,and approaches the one-active-UE-per-BS limit when the BSdensity is very large [2]. Such phenomenon incurs in adiminishing multi-UE diversity gain, which refers to the gainthat each BS can select a UE from a plurality of UEs to servewith a good channel quality. When the one-active-UE-per-BSlimit is reached, then one BS is stuck with one UE and cannotperform any UE selection in its scheduler. In practice, twocommonly used BS schedulers are (i) the round-robin (RR)scheduler, which selects UEs in turn regardless of their channelstate, and (ii) the proportional fair (PF) scheduler that tendsto select UEs with larger multi-path fading while reinforcinga certain degree of fairness among UEs [2]. However, asthe number of active UEs per active BS approaches one inUDNs, there will be very little gain that can be achieved bythe advanced PF scheduler compared with the simplistic RRscheduler [2].
To visualise this fundamental aspect, in Fig. 3b we plot theSINR heat map of SCNs with the following assumptions:• the antenna configuration with L = 0 m recommended in
Subsection IV-A,
6
(a) The performance trend of UDNs due to the oversupply of BSs with IMC compared with UEs (the UE density is ρ = 300 UEs/km2).Compared with Fig. 2d, the SINR heat map becomes very much reddish when λ increases to around 2500 BSs/km2, showing a significantperformance improvement in UDNs thanks to the BS IMC. Such performance improvement is not obvious when λ is around 50 BSs/km2
since almost all BSs are active, with or without the BS IMC.
(b) The performance trend of UDNs due to the PF scheduler working on a small number of UEs per active BS (the UE density isρ = 300 UEs/km2). Compared with Fig. 3a, the SINR heat map becomes reddish when λ is lower than 250 BSs/km2, showing a performanceimprovement owing to a multi-UE diversity, i.e., each BS can select a UE from a plurality of UEs to serve with a good channel quality.Such performance gain is negligible when λ increases to around 2500 BSs/km2 due to the diminishing multi-UE diversity in UDNs.
Fig. 3: SINR heat maps considering a much larger ratio of the BS number over the UE number in UDNs.
• the 3GPP probabilistic LoS/NLoS path loss model rec-ommended in Subsection IV-B,
• the BS IMC recommended in Subsection V-A, and• the PF scheduler. Note that previous results in Figs. 2
and 3a assumed a RR scheduler.
Obversations: From Fig. 3b, we can see that:
• Compared with Fig. 3a, the SINR heat map becomesmore reddish when the BS density is not ultra-dense, i.e.,λ is equal to or less than 250 BSs/km2, showing a per-formance improvement owing to the multi-UE diversity,i.e., each BS can select a UE from a plurality of UEs toserve with a good channel quality.
• Compared with Fig. 3a, the SINR heat map changeslittle when λ is around 2500 BSs/km2, thus showing anegligible performance gain since such UDN approachesthe one-active-UE-per-BS limit.
Concluding Remark: Considering the negligible gain of themore complex channel-dependent PF scheduling in UDNs,when complexity is an issue, it is recommended to adoptsimpler scheduling mechanisms such as the RR scheduler tosimplify the radio resource management (RRM).
In the following sections, as we are not analysing complex-ity but performance, we will still consider the PF scheduler.It inflicts no harm to UDNs, while it has been widely adoptedin sparse networks to enhance the performance.
VI. ONE FUNDAMENTAL ASPECT OF UDNS RELATED TOBUSTY TRAFFIC DEMANDS
As a by-product of the small number of active UEs ineach active BS, the per-cell aggregate traffic demands in thedownlink (DL) and the uplink (UL) become highly dynamic.Consequently, dynamic TDD emerges as a new technology forUDNs, which serves as a transition link between the conven-tional network and the full duplex one [13]–[15]. In dynamicTDD, each BS can provide a tailored configuration of DL/ULsubframe resources to match the DL/UL data requests [8].However, such flexibility comes at the expense of allowinginter-cell inter-link interference (ICILI), i.e., DL transmissionsof a cell may interfere with UL ones of neighbouring cells(DL-to-UL interference) and vice versa (UL-to-DL interfer-ence). This performance degradation is particularly severe forthe UL due to the relatively strong DL-to-UL interference,which calls for the implementation of interference cancellation(IC) and UL power boosting (ULPB) techniques [13], [14].
In more detail, the IC technique leverages the backhaulcommunications among BSs and the BS signal processingcapability to mitigate the DL-to-UL interference coming fromother BSs. Moreover, a UL power control algorithm [8] iscurrently adopted in the LTE networks and considered inour network performance visualization. For a typical example,such algorithm partially compensates each UE’s path loss (indB) by 80 %, on top of a base power of -59dBm for a 10MHz

7
bandwidth. If such power exceeds the UE power limit, thenit will be clipped to the maximum UE transmission power of23 dBm shown in Table I. A straightforward ULPB schemewould be letting UEs transmit at their full powers to combatthe DL-to-UL interference.
To visualise this fundamental aspect, in Fig. 4, we plot theSINR heat map of SCNs with the following assumptions:• the antenna configuration with L = 0 m recommended in
Subsection IV-A,• the 3GPP probabilistic LoS/NLoS path loss model rec-
ommended in Subsection IV-B,• the BS IMC recommended in Subsection V-A,• the PF scheduler studied in Subsection V-B, and• the LTE dynamic TDD with each UE randomly re-
questing DL data and UL one with 50 % and 50 %,respectively.
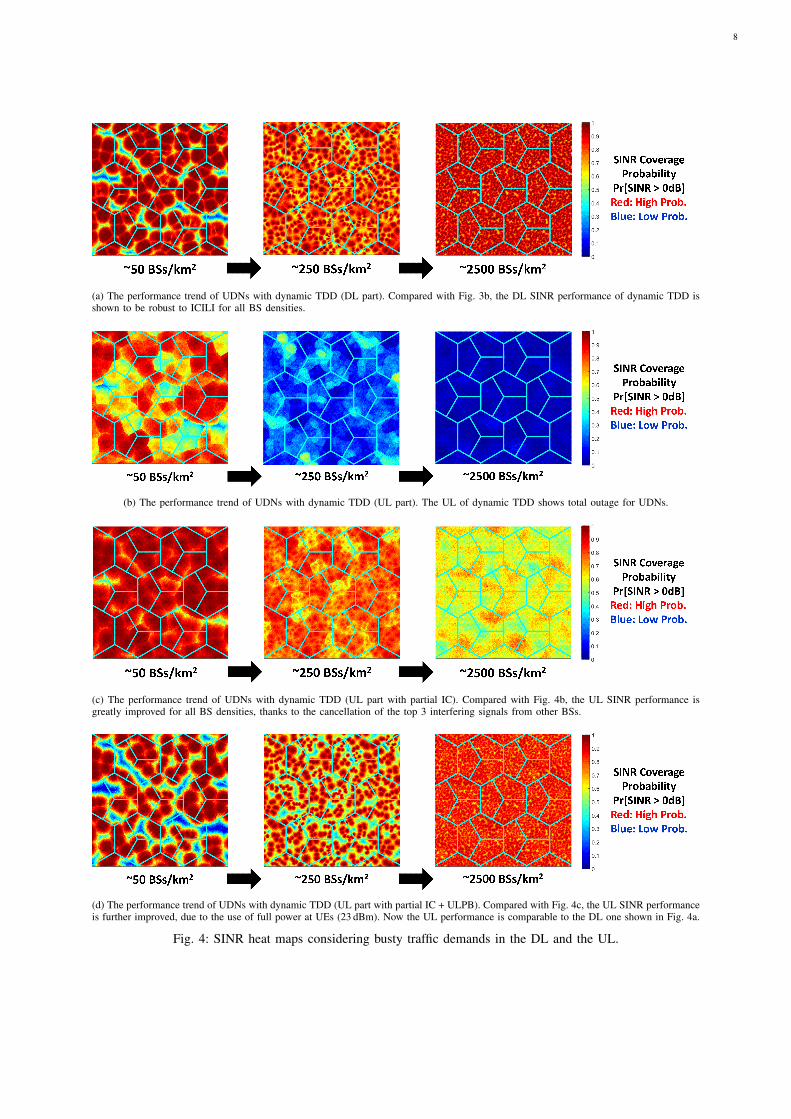
Obversations: From Fig. 4, we can see that:• In Fig. 4a, the SINR heat map of the DL UDN (i.e., whenλ is around 2500 BSs/km2) is slightly more reddish thanFig. 3b, because some DL interference is converted toUL interference, which is generally weaker.
• In Fig. 4b, the SINR heat map of the UL shows thatthe UL is particularly vulnerable to the DL-to-UL inter-ference in UDNs, especially for UDNs (i.e., when λ isaround 2500 BSs/km2).
• A potential solution to mitigate the DL-to-UL interfer-ence is the partial IC technique. Here, we assume thateach BS can remove the top 3 interfering signals fromother BSs. In Fig. 4c, the SINR heat map of the UL withpartial IC shows considerable improvement than that inFig. 4b, especially for the 4G SCN and the 5G denseSCN (i.e., when λ is equal to or less than 250 BSs/km2).
• Note that no UL power boosting was considered inFigs. 4b and 4c. Here, we assume that each UE transmitsat its full power, i.e., 23 dBm (see Table I) [8]. InFig. 4d, the SINR heat map of the UL with partialIC and ULPB is further improved when λ is around2500 BSs/km2 compared with Fig. 4c. However, suchperformance improvement is not obvious for the 4GSCN and the 5G dense SCN (i.e., when λ is equal toor less than 250 BSs/km2). This is because the ULPBtechnique considerably increases the UL-to-UL inter-cellinterference, which makes cell edge UEs suffer.
Concluding Remark: Considering the significant perfor-mance benefit of dynamic TDD, it is recommended to enabledynamic TDD in UDNs. However, special attention needs tobe paid to mitigate the strong DL-to-UL interference. Thepartial IC and the ULPB techniques were considered here.
VII. CONCLUSION
Using the proposed network performance visualisation tech-nique, we have investigated in a unified framework the fivefundamental differences between current macrocell and sparsesmall cell networks and future UDNs. From our results, weconclude that in UDNs:• The small cell BS antenna height should be lowered
closer to the UE antenna height to avoid the performancedegradation due to the capped carrier signal power.
• The small cell BS density should be carefully consideredto mitigate the performance degradation due to the NLoSto LoS interference transition.
• The small cell BS IMC is a fundamental feature to unveilthe full potential of UDNs and allow the performanceimprovement due to the UE selection of a good servingBS and the control of unnecessary inter-cell interference.
• The RR scheduler could be used to simplify the resourcemanagement, which is justified by its comparable perfor-mance to the PF one in UDNs.
• The dynamic TDD technology could be used to harnessthe high dynamics of DL/UL traffic and provide theperformance improvement in the MAC layer. However, anefficient interference management is needed in the PHYlayer, primarily to mitigate DL to UL interference.
As future work, we propose the following:• The proposed network performance visualization tech-
nique can be extended for a 3D space using plane slicing.Such extension would be useful to illustrate networkperformance for scenarios with buildings or drones.
• As indicated in Section II, we have considered uniformdistributions of UEs and BSs in this article. It is ofgreat interest to investigate a hotspot deployment withnon-uniform distributions of UEs and BSs, which wouldchange the distributions of the active BSs and the ULinterfering UEs, etc.
• The BS IMC is very useful to reduce the energy con-sumption of UDNs. However, it is important to note thata BS in idle mode may still consume a non-negligibleamount of energy, thus impacting the energy efficiencyof small cell networks. To study the energy efficiencyof realistic 5G networks, we can use the practical powermodel developed in the Green-Touch project [2].
REFERENCES
[1] CISCO, “Cisco visual networking index: Global mobile data trafficforecast update (2015-2020),” Feb. 2016.
[2] D. López-Pérez, M. Ding, H. Claussen, and A. Jafari, “Towards 1Gbps/UE in cellular systems: Understanding ultra-dense small celldeployments,” IEEE Communications Surveys Tutorials, vol. 17, no. 4,pp. 2078–2101, Jun. 2015.
[3] X. Ge, S. Tu, G. Mao, C. X. Wang, and T. Han, “5G ultra-dense cellularnetworks,” IEEE Wireless Communications, vol. 23, no. 1, pp. 72–79,Feb. 2016.
[4] Small cell forum, “Market status statistics feb 2016 - mobile experts,”Feb. 2016.
[5] S. F. Yunas, M. Valkama, and J. Niemelä, “Spectral and energy efficiencyof ultra-dense networks under different deployment strategies,” IEEECommunications Magazine, vol. 53, no. 1, pp. 90–100, January 2015.
[6] M. T. Barros, R. Mullins, and S. Balasubramaniam, “Integrated Tera-hertz communication with reflectors for 5G small-cell networks,” IEEETransactions on Vehicular Technology, vol. 66, no. 7, pp. 5647–5657,Jul. 2017.
[7] S. Rangan, T. S. Rappaport, and E. Erkip, “Millimeter-wave cellularwireless networks: Potentials and challenges,” Proceedings of the IEEE,vol. 102, no. 3, pp. 366–385, Mar. 2014.
[8] 3GPP, “TR 36.828: Further enhancements to LTE Time Division Duplexfor Downlink-Uplink interference management and traffic adaptation,”Jun. 2012.
[9] S. Lee and K. Huang, “Coverage and economy of cellular networks withmany base stations,” IEEE Communications Letters, vol. 16, no. 7, pp.1038–1040, Jul. 2012.
[10] J. Andrews, F. Baccelli, and R. Ganti, “A tractable approach to coverageand rate in cellular networks,” IEEE Transactions on Communications,vol. 59, no. 11, pp. 3122–3134, Nov. 2011.
8
(a) The performance trend of UDNs with dynamic TDD (DL part). Compared with Fig. 3b, the DL SINR performance of dynamic TDD isshown to be robust to ICILI for all BS densities.
(b) The performance trend of UDNs with dynamic TDD (UL part). The UL of dynamic TDD shows total outage for UDNs.
(c) The performance trend of UDNs with dynamic TDD (UL part with partial IC). Compared with Fig. 4b, the UL SINR performance isgreatly improved for all BS densities, thanks to the cancellation of the top 3 interfering signals from other BSs.
(d) The performance trend of UDNs with dynamic TDD (UL part with partial IC + ULPB). Compared with Fig. 4c, the UL SINR performanceis further improved, due to the use of full power at UEs (23 dBm). Now the UL performance is comparable to the DL one shown in Fig. 4a.
Fig. 4: SINR heat maps considering busty traffic demands in the DL and the UL.

9
[11] X. Zhang and J. Andrews, “Downlink cellular network analysis withmulti-slope path loss models,” IEEE Transactions on Communications,vol. 63, no. 5, pp. 1881–1894, May 2015.
[12] M. Ding and D. López-Pérez, “Please Lower Small Cell AntennaHeights in 5G,” IEEE Globecom 2016, pp. 1–6, Dec. 2016.
[13] Z. Shen, A. Khoryaev, E. Eriksson, and X. Pan, “Dynamic uplink-downlink configuration and interference management in TD-LTE,” IEEECommunications Magazine, vol. 50, no. 11, pp. 51–59, Nov. 2012.
[14] M. Ding, D. López-Pérez, R. Xue, A. Vasilakos, and W. Chen, “Ondynamic Time-Division-Duplex transmissions for small-cell networks,”IEEE Transactions on Vehicular Technology, vol. 65, no. 11, pp. 8933–8951, Nov. 2016.
[15] G. Suciu, M. Vochin, C. Diaconu, V. Suciu, and C. Butca, “Conver-gence of software defined radio: WiFi, ibeacon and epaper,” 2016 15thRoEduNet Conference: Networking in Education and Research, pp. 1–5,Sep. 2016.
Ming Ding is a Senior Research Scientist at Data61 (previously known asNICTA), CSIRO, Australia. He has authored over 60 papers in IEEE journalsand conferences, all in recognized venues, and about 20 3GPP standardizationcontributions, as well as a Springer book "Multi-point Cooperative Commu-nication Systems: Theory and Applications" (2013). As the first inventor, heholds 15 CN, 7 JP, 3 US, 2 KR patents and co-authored another 100+ patentapplications on 4G/5G technologies.
David Lopez-Perez is currently a member of Technical Staff at Nokia BellLaboratories. David has authored the book "Heterogeneous Cellular Networks:Theory, Simulation and Deployment" (Cambridge University Press, 2012),as well as over 100 book chapters, journal, and conference papers, all inrecognized venues. He also holds over 36 patents applications. David receivedthe Ph.D. Marie-Curie Fellowship in 2007 and the IEEE ComSoc Best YoungProfessional Industry Award in 2016.
Holger Claussen is the Leader of Small Cells Research at Nokia Bell Labs.He is author of more than 70 publications and 100 filed patent applications.Moreover, he is Fellow of the World Technology Network, and member ofthe IET. He received the 2014 World Technology Award in the individualcategory Communications Technologies for innovative work of "the greatestlikely long-term significance".
Mohamed Ali Kaafar is the head of the Networks group in CSIROData61 and a senior principal research scientist. His main research interestsinclude online privacy and privacy enhancing technologies, cyber-security andnetworks measurement and modelling.


![Antonio Alarcon and Francisco J. L´ opez´ · arXiv:1305.2118v3 [math.CV] 7 Jun 2016 Complete bounded embedded complex curves in C2 Antonio Alarcon and Francisco J. L´ opez´ Abstract](https://img.pdfslide.us/doc/110x75/5f74f024923c141c2c063e85/antonio-alarcon-and-francisco-j-l-opez-arxiv13052118v3-mathcv-7-jun-2016.jpg)