Embed Size (px)
Citation preview
6796 J . Am. Chem. SOC. 1990, 11 2, 6796-6803
charge distribution at the TS. The HF method overestimates the ionic character and yields large negative charges on N and X. In a later paper, we will compare the relative change in charge distribution from reactants to the TS and from the TS to the products.
Acknowledgment. A Killam postgraduate scholarship (to Z.S.) from Dalhousie University and the financial assistance of the Natural Sciences and Engineering Research Council of Canada in the form of an operating grant (to R.J.B.) are gratefully ac- knowledged. We are grateful to Dalhousie University Computing
and Information Services for a generous allocation of computer time.
Registry No. CH3H, 74-82-8; CH3F, 593-53-3; CH3CI, 74-87-3; CH3CN, 75-05-8; CH3NC. 593-75-9; CHsCCH, 74-99-7; CH,OH, 67- 56-1; CHjSH, 74-93-1; CH3NH2, 74-89-5: H-, 12184-88-2; F, 16984- 48-8; CP, 16887-00-6; OH, 14280-30-9; NH2, 17655-31-1; CN, 57-12-5.
Supplementary Material Available: Tables of total energies at the HF, MP2', and MP2 levels of all species described herein (2 pages). Ordering information is given on any current masthead page.
On the Evaluation of Interproton Distances for Three-Dimensional Structure Determination by NMR Using a Relaxation Rate Matrix Analysis
Carol Beth Robert P. Meadows,* and David G. Gorenstein*,t Contribution from the Department of Biological Sciences and Department of Chemistry, Purdue University, West Lafayette, Indiana 47907. Received October 6, I989
Abstract: The accuracy of interproton distances obtained from two-dimensional nuclear Overhauser effect (NOESY) data using a relaxation rate matrix approach is examined by theoretical simulation studies. Interproton distances, the basis for three-dimensional structure determination of macromolecules by NMR, are most often evaluated from NOESY data by using a two-spin approximation or by grouping according to strong, medium, and weak intensities. A more rigorous analysis considers interactions within the full multispin system as specified by the relaxation rate matrix. With this matrix, distances are evaluated directly from measured NOESY volumes at a single mixing time taking into account indirect relaxation effects. However, numerical errors and mathematical difficulties can arise when solving such a matrix equation. Therefore the practicality of the matrix approach including experimental limitations on the input NOESY volumes was investigated. NOESY data were generated over a range of mixing times taking into account random noise, overlapping peak volumes, and the finite sensitivity for measuring cross-peak volumes by using proton coordinates from the crystal structure of lysozyme and a DNA dodecamer. A rigid molecule with a single overall correlation time was assumed. Comparison of the cross-relaxation rates, or interproton distances, obtained from the multispin matrix solution with the actual values indicates that there are errors in the matrix solution, but the errors are smaller than those obtained with the two-spin approximation under many but not all conditions of imperfect data.
1. Introduction The ability to determine the three-dimensional structure of
proteins and nucleic acid oligomers by using interproton distances measured by NMR has been successfully demonstrated.'* In the NMR method, interproton distances evaluated from two- dimensional nuclear Overhauser effect (NOESY) data are used as restraints in a conformational search carried out by molecular dynamics,74 including simulated annealing distance geometry,I2J3 or a minimization method which employs dihedral angles as independent ~ariab1es.I~ Applications of the NMR method for structure determination have relied on obtaining a large number of distance restraints, in addition to restraints on dihedral angles and hydrogen bonds.Is In most cases, interproton distances are measured approximately based on an isolated two-spin rela- tionship for c ros~- re l axa t ion~~-~~ or only qualitatively from strong, medium, and weak NOESY cross-peak inten~ities.'**'~ Lack of quantitative distance measurements necessitates loose restraints in the conformational search: restraints are classified into distance ranges or groups, where lower bounds may be specified by van der Waals radii.I7*" Although the NMR method is established, there remains a need for increasing the precision of the structures obtained.2'*22 One aspect of the NMR method which could
'Department of Biological Sciences. *Department of Chemistry.
Present address: Department of Medicinal Chemistry, Purdue Univer- sity.
improve the structural solution is more accurate quantification of the interproton distances.
(1) Kaptein, R.; Boelens, R.; Scheek, R. M.; van Gunsteren, W. F. Bio-
(2) Wuthrich, K. NMR of Proteins ond Nucleic Acids; John Wiley &
(3) Wuthrich, K. Science 1989,243.45-50. (4) Clore, G . M.; Gronenborn, A. M. Protein Eng. 1987, I , 275-288. (5) Braun, W. Q. Reo. Eiophys. 1987, 19. 115-157. (6) Wright, P. E. TIES 1989, 14, 255-260. (7) Kaptein, R.; Zuiderweg, E. R. P.; Scheek, R. M.; Boelens, R.; van
(8) Nilsson, L.; Clore, G. M.; Gronenborn, A. M.; Brunger, A.; Karplus,
(9) Clore, G . M.; Briinger, A. T.; Karplus, M.; Gronenborn, A. M. J . Mol.
(10) Nilga, M.; Clore, G. M.; Gronenborn, A. M. FEES Lett. 1988, 229,
( I I ) Nilges, M.; Gronenborn. A. M.; Brtinger, A. T.; Clore. G . M. Protein
(12) Pardi, A.; Hare, D. R.; Wang, C. Proc. Nail. Acad. Sci. U.S.A. 1988,
(13) Havel, T. F.; Crippen, G . M.; Kuntz, I. D. Biopolymers 1979, 18,
(14) Braun, W.; GO, N. J . Mol. Biol. 1985, 186, 61 1-626. (15) Nerdal, W.; Hare, D. R.; Reid, B. R. J . Mol. Biol. 1988, 201,
(16) Hare, D.; Shapiro, L.; Patel, D. J. Biochemistry 1986, 25, 7456-7464. (17) Kline, A. D.; Braun, W.; Wuthrich, K. J . Mol. Biol. 1988, 204,
chemistry 1988, 27, 5389-5395.
Sons: New York, 1986.
Gunsteren, W. F. J. Mol. Biol. 1985, 182, 179-182.
M. J. Mol. Biol. 1986, 188, 455.
Bioi. 1986, 191, 523-551.
317-324.
Eng. 1988, 2,27-38.
85, 8785-8189.
73-81.
717-739.
675-724.
0002-7863/90/ 15 12-6796$02.50/0 0 1990 American Chemical Society
Interproton Distances for 3 0 Structure Determination
Several workers have characterized the degree of error in a two-spin analysis of NOE data measured from a multispin system. The dependence of the error on the spatial arrangement of the magnetic nuclei has been elucidated with a three-spin mode1,23*24 and investigations of multispin effects in larger systems have also been made.22,25-28 In all studies it was found that indirect re- laxation contributions to the observed NOE can be significant, particularly at long mixing times, for large molecules with long rotational correlation times or when the two protons under con- sideration are far apart. Errors in the distance obtained by the two-spin approximation can be as large as f0.5 A a t shorter mixing times and >*I .O A at longer mixing times.22*26s27
In view of the error in distance values obtained by a two-spin analysis, it is worthwhile to consider the practical use of the full set of coupled differential equations describing relaxation in a multispin system. The multispin analysis takes into account all possible pairwise relaxation pathways rather than assuming the observed NOESY cross-peak intensity arises only from direct relaxation between the two protons defining the cross-peak. The most direct approach for evaluating interproton distances is to determine the cross-relaxation rates from the NOESY intensi- ties.26.27*29 [Some author^^*^^ use the term back transformation when referring to the direct calculation of relaxation rates from NOESY intensities, which is in contrast to the calculation of NOESY intensities from a molecular structure either by the inverse matrix o p e r a t i ~ n ~ ~ . ~ ~ - ” - ~ ~ or by numerical integration p r o c e d ~ r e s . ~ ~ * ~ ~ J ~ ~ ~ ~ ] Application of the direct matrix approach to experimental data has been limited. The structures of small peptides and an antibiotic have been determined by Olejniczak and c o - w ~ r k e r s ~ ~ , ~ ~ * ~ ~ by using distances determined directly from NOESY volumes. For larger molecules, where measuring a complete data set can be difficult, Kaptein and c o - ~ o r k e r s ~ ~ . ~ ~ have developed a method involving a NOESY volume matrix which comprises both experimental intensities and theoretical intensities. The direct calculation of distances was also considered by Borgias and James27 in a simulation study of a DNA octamer at two mixing times.
Analysis involving the relaxation rate matrix is more rigorous than a two-spin analysis; however, difficulties solving the matrix equation can arise; matrix analysis reduces to finding the solution to an eigenvalue problem and hence to matrix diagonalization. The problems associated with solving eigensystems are well-known: ‘You have probably gathered by now that the solution of eigen-
(18) Clore, G. M.; Gronenborn, A. M.; Brunger, A.; Karplus, M. J. Mol.
(19) Clore. G. M.; Gronenborn, A. M.; Kjaer, M.; Poulsen, F. M. Protein Biol. 1985, 186, 435-455.
Eng. 1987, I , 305-31 1. (201 Lee. M. S.: GiDDert. G. P.: Soman. K. V.: Case. D. A.: Wright. P. E. . - . .
sciin~e 1989, 245,’ 635163i. . (21) Gnntert, P.; Braun, W.; Billeter, M.; Wllthrich, K. J. Am. Chem. Soc.
(22) Clore, G. M.; Gronenbom, A. M. J. Magn. Reson. 1989,84,398-409. (23) Keepers, J. W.; James, T. L. J . Magn. Reson. 1984, 57, 404-426. (24) Landy, S. B.; Rao, B. D. N. J . Magn. Reson. 1989, 83, 29-43. (25) Dobson, C. M.; Olejniczak, E. T.; Poulson, F. M.; Ratcliffe, R. G.
(26) Olejniczak, E. T.; Gampe. R., Jr.; Fesik, S. J . Magn. Reson. 1986,
(27) Borgias. B. A.; James, T. L. J . Magn. Reson. 1988, 79, 493-512. (28) Madrid, M.; Mace, J. E.; Jardetzky, 0. J . Magn. Reson. 1989,83,
(29) Bnmer, J.; Mendz, G. L.; Moore, W. J. J. Am. Chem. Soc. 1984,106,
(30) Boelens, R.; Koning, T. M. G.; Kaptein, R. J. Mol. Srrucr. 1988,173,
(31) Bothner-by, A. A.; Noggle, J. H. J . Am. Chem. Soc. 1979, IO/,
(32) Macura, S.; Ernst, R. R. Mol. Phys. 1980, # I , 95-117. (33) Banks, K . M.; Hare, D. R.; Reid, B. R. Biochemistry 1989, 28,
(34) LeTevre, J.; Lane, A. N.; Jardetzky, 0. Biochemistry 1987, 26,
(35) Fesik, S. W.; ODonnell, T. J.; Gampe, R. T., Jr.; Olejniczak, E. T.
(36) Fesik, S. W.; Bolis, G.; Sham, H. L.; Olejniczak, E. T. Biochemistry
(37) Boelens, R.; Koning, T. M. G.; van der Marel. G. A.; van Boom, J.
1989, I I I . 3997-4004.
J . Magn. Reson. 1982, 48, 97-1 10.
67, 28-41.
267-278.
469 1-4696.
299-3 I 1.
5152-51 55.
6996-7010.
5076-5090.
J . Am. Chem. Soc. 1986, 108, 3165-3170.
1987, 26, 1851-1859.
H.; Kaptein, R. J . Magn. Reson. 1989, 82, 290-308.
J . Am. Chem. Soc., Vol. 112, No. 19, 1990 6797
systems is a fairly complicated business”.3s Difficulties can arise from failure of the diagonalization algorithms to converge or from numerical errors in the solution as a result of experimental noise and incomplete data.
Given the importance of the NMR method for determining solution structures of macromolecules, a systematic study was undertaken to better define the strength and limitations of the direct matrix approach for evaluating interproton distances. We report here the results of simulation studies examining the con- vergence behavior and accuracy of the matrix solution as a function of mixing time, including effects from experimental limitations in measuring NOESY data. In the first section of this paper we describe the simulation and analysis of NOESY data with the program MORASS (Multispin Overhauser Relaxation Analysis and - Simulation) for a multispin system. The reliability of the ei- genvalue solution is examined in Results, first with noise free data. Effects on the accuracy due to experimental uncertainty in the NOESY intensities, including random noise, overlapping peaks, and sensitivity, are then considered. We compare the accuracy of the distance determined from a multispin analysis and eigen- value solution with that of the two-spin approximation.
11. Theory The nuclear Overhauser experiment
measures cross-relaxation rates, or the rates at which magneti- zation is transferred between nuclei. For protons, cross-relaxation occurs by through-space dipolar interactions and is a function of the interproton distance. A set of coupled differential equations describe the kinetics of magnetic relaxation in a multispin sys- tem.3’*32*3w1 For a two-dimensional NOESY experiment, the evolution of the spectral intensities as a function of the mixing time t, is described by the simultaneous BIoch equations for relaxation which in matrix form26*40s42 is
NOFSY Intensities.
The elements of the matrix V(t,) are the peak volumes from the N O S Y spectrum, and r is the symmetrical relaxation rate matrix
PI O12 O13 O14 ,., O21 P 2 O23 O24
The off-diagonal elements, uij, are cross-relaxation rates from which the distance between spins i and j is obtained, and the diagonal elements, pi, are the direct relaxation rates for each spin i. (An expression identical to eq 1 involving an asymmetrical rate matrix with chemical kinetic rate constants applies to a multisite system in chemical e x ~ h a n g e . ~ ~ ~ ~ ~ ~ )
The solution to the differential eq 1 is
V(t,) = exp(-I’t,)Vo
The elements uo of the diagonal matrix V, equal the volume of the diagonal peaks at t , = 0. Rearrangement of eq 2 gives an
(38) Press, W. H.; Flannery, B. P.; Teukolsky, S. A.; Vetterling, W. T. Numerical Recipes, The Art of Scientific Computing; Cambridge University Press: New York, 1986; p 340.
(39) Bodenhausen, G.; Ernst, R. R. J . Am. Chem. SOC. 1982, 104,
(40) Abel, E. W.; Coston, T. P. J.; Orrell, K. G.; Sik, V.; Stephenson, D.
(41) Gtassi, M.; Mann, B. E.; Pickup, B. T.; Spencer, C. M. J . Magn.
(42) Massefski, W., Jr.; Bolton, P. H. J . Magn. Reson. 1985,65, 526-530. (43) Perrin. C. L.; Gipe, R. K. J . Am. Chem. Soc. 1984, 106,4036-4038. (44) Muhandiram, D. R.; McClung, R. E. J . Magn. Reson. 1987, 71,
(45) Post, C. B.; Ray, W. J., Jr.; Gorenstein, D. G. Biochemistry 1989,28,
(46) Johnston, E. R.; Dellwo, M. J.; Hendrix, J. J . Magn. Reson. 1986,
1304-1309.
J . Magn. Reson. 1986, 70, 34-53.
Reson. 1986, 69, 92-99.
187-192.
548-558.
66, 399-409.

6798 J . Am. Chem. SOC., Vol. 112. No. 19. 1990
Scheme I _ - - - _
,, 1.
Post et al.
250 A I
expression for the relaxation rates in terms of the NOESY vol- umes:26,29.43
In [v(v,)-ll (3) 1 -r = -
t m
The logarithm in eq 3 is readily evaluated by substitution with the eigenvalues and eigenvectors of V(V,,)-':
(4) -r = -K(ln [ L ] ) K T
Matrix K and the diagonal matrix L contain the eigenvectors and eigenvalues of V(V0)-I, respectively. The evaluation of the cross-relaxation rates therefore reduces to the eigenvalue problem of determining K and L .
We note that the solution for r does not require assignment of the NOESY volumes to specific protons; all that is necessary is to correctly associate diagonal and off-diagonal volumes for identification of elements in V. Further, the direct solution for r provides values for uij, without any assumptions about the relaxation mechanism or parameters such as motional correlation times.26 Of course, the interpretation of uU in terms of interproton distances does require such assumptions.
The present work investigates by simulation techniques the reliability with which cross-relaxation rate constants can be de- termined from NOESY data by using the eigenvalue solution, eq 4. NOESY data were generated (eq 2 ) by using uij and pi values obtained from expressions for dipolar relaxation in an n-spin system4'
1
[m
n w4h2 [J(O) + 3 J ( w ) + 6 J ( 2 w ) ]
i 'I
p i = E- jzi I O ( d t ) 2
J ( w ) = ( L, 1 + w y
w and y are the resonance frequency and the gyromagnetic ratio for 'H nuclei, respectively. The spectral densities, J(w), specifying the transition probability are defined with a single, overall rota- tional correlation time, T,, and interproton distances, d,, are obtained from crystallographic or model structures. The only internal motion considered in the simulation is rotation of methyl groups. As methyl rotation occurs on a time scale of 0.01-0.2 ns,48*49 significantly faster than the overall molecular rotation of proteins and DNA oligomers, an interproton distance involving a methyl proton was considered to be an average over the three protons in the methyl group. That is, adopting a three-site jump model, relaxation between a methyl and non-methyl proton pair or between two methyl groups is proportional to the interproton d i s t a n ~ e ' ~ , ~ ~ averaged over methyl protons:
I m 1 m j=I (d$ )2 -E-
(47) Noggle, J. H.; Schirmer. R . E. The Nuclear Overhauser Ef/ect; Academic Press: New York. 1971.
(48) Olejniczak, E. T.; Dobson, C. M.; Karplus, M.; Levy, R. M. J . Am.
(49) Torchia, D. A. Ann. Rev. Biophys. Bioeng. 1984, 13, 125-144. (50) Tropp, J . J . Chem. Phys. 1980. 72, 60354043.
Chem. Soc. 1984. 106, 1923-1930.
50
45 6o t n 30
15
2 .0 3.0 4.0 Interproton distances
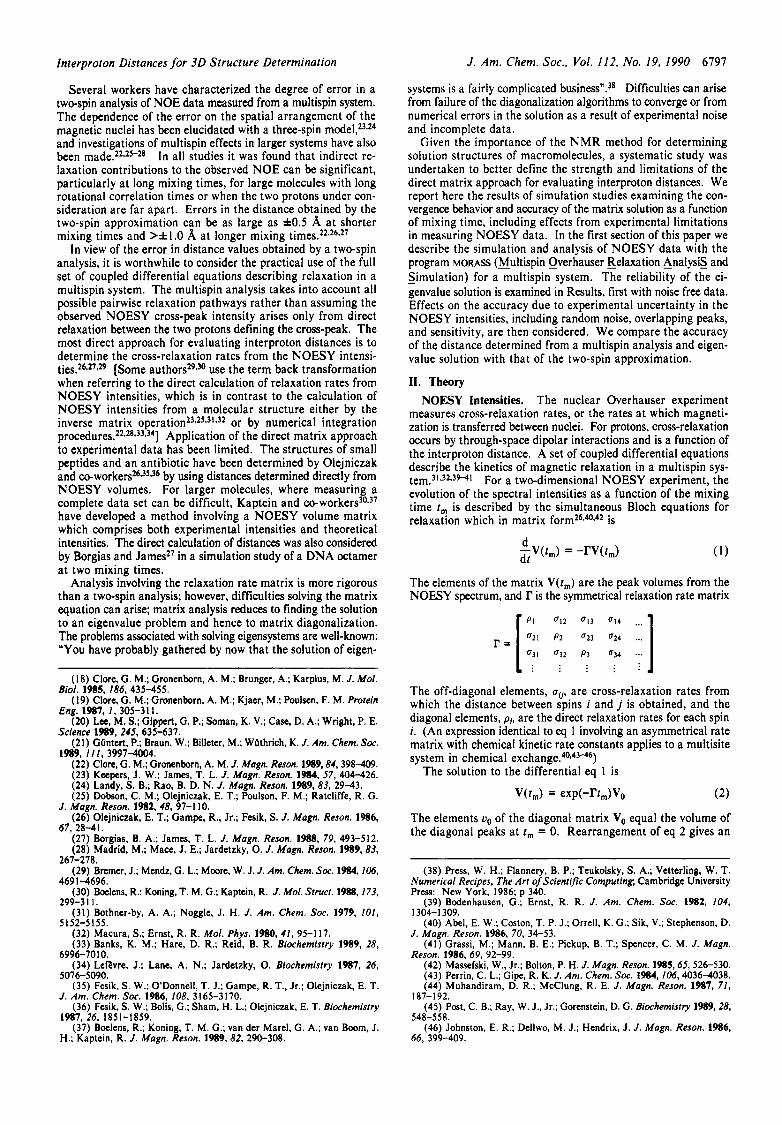
Figure 1. Interproton distance distribution for du < 4.4 A for (A) lyso- zyme (696 nonexchangeable protons, 3685 distances) and (B) the DNA dodecamer (228 nonexchangeable protons, 778 distances).
For a methyl-non-methyl pair, m = 3, and for an intermethyl pair, m = 9. The effects due to angular averaging for the spectral density J ( w ) as a result of methyl r o t a t i ~ n ~ ~ * ~ ~ were neglected. However, this simplification is not of consequence for defining the accuracy of the matrix solution.
A direct measure of the error in the matrix solution is the deviation in uij values. Nevertheless, it is useful to relate the simulation results to the distances needed for structure deter- mination, therefore the uij values obtained by the eigenvalue solution were converted to dij values (eq 5) and the accuracy reported in some cases as the deviations in dc,.
Structure Models. Scheme I outlines the protocol of this sim- ulation study implemented with the program MORASS. The volumes of diagonal and off-diagonal peaks were generated for a given t , (eq 2 ) and the relaxation rate matrix r(u$ calculated from a set of protons and a single correlation time (eq 5). I'(u7) was then calculated (eq 4) from the unaltered simulated NOES+ intensities V (noise-free data) or after altering elements of V to mimic various types of experimental noise, and the agreement was checked between the calculated ut and the actual u; values or the corresponding &j and Gj values.
NOESY data were generated for both the protein lysozyme (1 29 residues) and an oligonucleotide, d(CGCGAATTCGCG)2. Lysozyme proton positions were built from geometric consider- ations and the heavy atom coordinates of the crystallographic structure (Handoll, H.; Phillips, D. C. personal communications). The full coordinate set was optimized by energy minimization with the program C H A R M M . ~ ~ Atomic positions for all atoms of the oligonucleotide were built with standard B-DNA geometry by using the program AMBER,^* followed by energy minimization. Except as noted above for methyl rotation, the macromolecule is assumed rigid so that molecular motions are described with a single rotational correlation time. Because the effects from multispin relaxation depend on the geometric arrangement of the protons, the distribution for each molecule of interproton distances less than 4.4 A is shown in Figure 1. In addition to the peak in both distributions at 1.75 A corresponding to geminal protons, the lysozyme distribution (Figure 1 A, 696 nonexchangeable protons, 3685 distances) is nearly uniform from 2.5 to 4.4 A but with a somewhat larger number of distances near 2.5 and 3.0 A, while the oligonucleotide distribution (Figure 1 A, 228 nonex- changeable protons, 778 distances) is trimodal with peaks at 2.3, 3.0, and 3.8 A. Inclusion of exchangeable protons does not change the distributions significantly. Since a distribution similar to Figure 1A was found with the smaller protein crambin, and since distributions from several different DNA sequences were similar to Figure I B, the distributions in Figure 1 appear to represent proteins and DNA in general.
( 5 1 ) Brooks, B. R.; Bruccoleri, R. E.; Olafson, B. D.; States, D. J.; Swamtnathan, S.; Karplus, M. J . Compur. Chem. 1983,4, 187-217.
( 5 2 ) Weiner, P.; Kollman, P. J . Compur. Chem. 1981, 2, 287.

Interproton Distances for 3 0 Structure Determination
0.3
x 2 0.2
8 3
0.1
0.0 0.5 1.0 1.5 2.0 2.5 0.5 1.0 1.5 2.0 2.5 3.0
t, (4 Totl. ( X 10' E',
Figure 2. Time development of NOESY peaks calculated from the lysozyme coordinates for the diagonal peaks (1 ) Ser91 Ha and (2) Leu56 H@1 and the cross-peaks (3) Leu56 HBI-Hj32, (4) Phe HS-He, and (5) Ser91 Ha-HBI. A rigid molecule rotation time was assumed: (A) 7, = 1 ns and ( B ) T, = 4.5 ns (solid) and 9.0 ns (dashed). The abscissa of ( B ) is the generalized parameter rcfm.
The accuracy of the eigenvalue solution was determined as a function of mixing time for a field strength of 500 MHz and rotational correlation times equal to 1.0,4.5, and 9.0 ns, typical for the size of molecules studied by NMR. Either lysozyme or the dodecamer proton coordinates were used for all values of 7,
studied. A single model for a protein or nucleic acid while varying 7, had the advantage of a constant proton set with respect to spatial distribution. Given the imposed variation in 7, without explicitly altering the macromolecular size, it is appropriate to consider only interior protons and not include surface protons. As such, the simulation of NOESY data and calculation of I' included protons falling within a certain size sphere placed near the center of the molecule, while the errors in uij and dij were evaluated for the protons within a smaller sphere. To facilitate the large number of matrix evaluations required for this study (computer processing times are given below), the size of the spheres was chosen to include fewer than 200 spins. For lysozyme, a 10-A sphere centered at Leu56 H a gave 194 protons for the data simulation and I' calculation, and a 9-A sphere gave 125 protons in the error analysis. For the oligonucleotide, a 19.2- and 15.4-A sphere centered at A6 H1' gave 168 and 125 protons, respectively.
The simulation and analysis of NOESY data were carried out with MORASS. Matrix diagonalization routines from the IMSL and EISPACK libraries were used and found to have comparable con- vergence properties. For the analysis involving noise-free data, double-precision operations allowed convergence of the matrix diagonalization in some instances where singleprecision operations failed. However, for the more realistic case of imperfect data, double-precision operations are not warranted. The processing time on a MicroVax 111 workstation required for a 194-proton system was 4 min, while 496 protons took 1.9 h.
111. Results We first examine the reliability of the eigenvalue solution as
a function off, and 7, with noise-free data simulated from ly- sozyme and the DNA dodecamer. It is demonstrated that in the large molecule limit (07, >> 1) the results obtained with a given 7, value can be related to other 7, by the appropriate scaling of 1,. Since this limit is nearly valid for most molecules to which the NMR method for structure determination is applied, the results from simulations including experimental error described in the remainder of Results are reported for a single value of 7,
= 4.5 ns, from which the behavior for other T, can be obtained. In addition, test calculations on the DNA oligomer showed es- sentially identical behavior as lysozyme, thus results using im- perfect data are shown for lysozyme only. Noise-Free Data. The accuracy with which r can be evaluated
by a multispin matrix approach with noise-free NOESY data was determined by using cross-peak volumes obtained directly from
J . Am. Chem. SOC., Vol. 112, No. 19, 1990 6199
I I I I I I IA 0.03 f f A i
-4 0.5 1.0 1.5 2.0
t m ( 8 )
0.5 1.0 1.5 2.0
Totm ( X 1 0 ' s ~
Figure 3. The rms error in ut for the matrix method with noisc-free data is plotted as a function oft, (A) and 7& (B). Simulations were done with T, = 1.0 (solid), 4.5 (dashed), and 9.0 ms (dotted). The model systems are lysozyme (0) and the dodecamer (A).
aij and p i calculated from the structures. An illustration of the time development of diagonal and off-diagonal peak volumes generated from the coordinates of lysozyme for 7, = 1 ns is shown in Figure 2A and for T, = 4.5 and 9.0 ns in Figure 2B as a function of 7,t,. The motivation for 7,t, as the independent parameter comes from the fact that both aij and p i are proportional to 7, in the large molecule limit of 07, >> 1, Le., consider eq 2 in the case where r 0: 7,. In a 500-MHz field, a 7, value of 4.5 ns approaches the large molecule limit and the curves plotted as a function of 7,tm in Figure 2B are nearly superimposable. For 7, > 9 ns, the build-up intensities as a function of TCt, are identical with the dashed curves (results not shown).
With uil elements simulated at a given t , for lysozyme and the dodecamer, cross-relaxation rates were evaluated from eq 4. The rms deviations between the calculated at and the actual at used to simulate the NOESY data are shown in Figure 3A for 7, = 1.0 (solid), 4.5 (dashed), and 9.0 ns (dotted). The matrix solution applied to noise-free data is quite accurate up to a certain t,; there is no error in the calculated ut values at short t,. Only for t , values beyond the maximum in the cross-peak intensities and where the diagonal intensities are greatly reduced is there sig- nificant error in ut. Eventually as t , increases, the diagonalization algorithm fails to converge, even for double-precision operations. The mixing time at which the ai/ errors become significant m u r s at shorter t , for longer correlation times and is similar for proteins and DNA (Figure 3A). Given the limiting behavior for long 7,
in the build-up curves (see Figure 2B), a better parameter for indicating the onset of ill behavior in the eigenvalue solution is 7,t,. The deviations in ut are therefore replotted in Figure 3B, which shows that the critical value is rCtm - 1.5 X lo4 s*, or t , - 0.33 s for 7, = 4.5 ns, or t , - 0.17 s for 7, = 9.0 ns. These mixing times are substantially longer than the regime where the two-spin approximation is valid.
Random Noise. Random noise from a Gaussian distribution was added to all peak volumes in V to simulate both a constant low-level thermal noise and a peak-integration error. A level of constant noise plus noise proportional to the individual volume required generating two random numbers for each uij element. One random number specified a value fO. l to *0.5% of uo added to all uij independent of its magnitude, while a second random number specified a value f l to f4% of the particular uii. Several sets of random noise (typically 10) were added to a given V(t , ) ,

6800 J. Am. Chem. SOC., Vol. 112, No. 19, 1990
5.0
Post et al.
/ I I I / I I I
- A I I I -- - D . .
0.8 - A B -- h
J 0.8 - a'
-_
0.08 0.12 0.18 0.08 0.12 0.18 0.06 0.12 0.18
t m (4 t m (4 t m ( 8 )
Figure 4. The average (ej) and the rms deviation between the calculated 8, and the actual 4, values when random noise is added to the simulated data from the eigenvalue method (H, A) (eq 4) or the two-spin ratio approximation (X ) (eq 6). Distances are grouped as (A) dij < 2.4, ( B ) 2.4 5 dij < 3.4, and (C) 3.4 5 dij < 4.4. Random noise was added to the simulated NOESY data ( rc = 4.5 ns) at a level of 2% (H) or 4% vij (A), simulating integration error. A level of 0.1% u,, simulating thermal noise, was also added to all Dip Only one set of curves is shown for the two-spin values since the results with both noise levels are nearly identical.
and the rms deviations in uv and do calculated from each set were averaged to obtain statistically converged rms values.
The accuracy of the eigenvalue solution for r calculated from N O S Y data containing random noise is shown in Figure 4 using interproton distances obtained from ut (eq 5). The rms deviation between the actual distances 4, and the calculated distances ej as well as the calculated average distance (4,) are shown for three groups of interproton distances in lysozyme defined by the crystallographic structure. Different noise levels, indicated in the figure caption, were examined. For comparison, dij values are also determined from the same volume elements by the linear two-spin approximation:
where the distance dk, is assumed known. The reference distance was 2.52 A for Leu56 Ha-HB of lysozyme. [In practice, the reference distance should be from a fixed-distance proton pair, not a variable distance pair such as Ha-HB. For the simulation study it is inconsequential since all distances are rigidly fixed. The value 2.52 A is approximately equal to the fixed distance of a Tyr or Phe H6-Ht pair.] The average (4,) and rms deviation for the two-spin distances are essentially independent of noise level, thus the error with the two-spin method is represented by one curve in Figure 4.
At low noise levels the accuracy of the matrix method is high but diminishes as the noise level increases. With overall noise levels greater than IO%, the matrix diagonalization fails to con- verge. The eigenvalue method is more sensitive to the constant thermal noise than to the integration error; when the constant noise level is near 1% uo, poor results are obtained with the eigenvalue method. Nonetheless, with a noise level of 3-4% uij integration error and 0.5% uo thermal noise, the eigenvalue solution gives lower rms deviations in interproton distances than the two-spin ratio method. [The rms error in dij with the two-spin method depends on the reference distance. As reported by others,s3 the error is smallest for distances nearly equal to that of the reference proton pair. As such, choosing a reference proton pair of shorter distance would decrease the two-spin rms error for small di, values but increase the error at large dip] Moreover, the eigenvalue solution gives an accurate average interproton distance, as expected when the error in the solution is random. In contrast, the two-spin results show a bias toward long dij for distances less than the reference distance, and toward short d,, for distances greater than the
5.0 - I I I I I
A B
4.0
a" 3.0
2.0
O S
U
n
O S
n
O S
0
a"
4.0
3.0
2.0
5.0
4.0
3.0
2.0
2.0 3.0 4.0 2.0 3.0 4.0
Figure 5. Calculated interproton distances, 4, (A), plotted against the actual value, 4) Distances were calculated from ub values obtained with the eigenvalue method (C to F) or from a two-spin analysis employing ratios of the cross-peak volumes (A and B). NOESY intensities were simulated as noise-free (A and C), data with 3% random noise plus 0.1% thermal noise added (B and D), data with overlapping peaks where 25% of the cross-peaks had 12% noise error (E), and incomplete data from which intensities less than 1 % u, (signal to noise = 1W) were eliminated (F). All distributions are from 1, = 200 ms data. The best fit line (solid) of each distribution is shown. The dashed line is unity slope.
reference distance.53 This bias is evident in a plot of 4,. against &j (Figure 5 ) ; the slope of the best fit line for the distribution from the two-spin analysis is approximately 0.5 (Figure 5A,B), sig- nificantly less than the expected value of unity, while that from the eigenvalue analysis equals 1.0 (Figure 5C,D). In Figure 5 panels A and C were obtained with noise-free data and B and D with 3% random noise at t , = 200 ms, a mixing time with large rms deviations. Similar plots at t , = 50 ms are shown in Figure 6. Even with noise-free data the two-spin approximation has a substantial error and bias in (4)) (Figures 5A and 6A). Peak Overlap. A major experimental difficulty in measuring
N O S Y intensities from large molecules is that there is substantial overlap of peaks, particularly for diagonal peaks. The problem in quantifying volumes of overlapping peaks was simulated in a fashion analogous to low-level random noise except that a higher level of noise was imposed on a fraction of the NOFSY intensities calculated from lysozyme. The effect of peak overlap on the accuracy of the eigenvalue solution was studied for diagonal and off-diagonal peaks independently and in combination.
Overlap of diagonal peaks was examined by replacing the simulated value of uii with either the average diagonal volume, (u i i ) , or by adding a large random noise to each uii. The former
(53) Clore, G. M.; Gronenborn, A. M. J . Magn. Reson. 1985,61, 158-164.

Interproton Distances for 3 0 Structure Determination
1 I I I I
A B 5.0 - I
4.0
3.0
2.0
5.0
4.0
3.0
2.0
5.0
.' ,
I I I I I
2.0 3.0 4.0 2.0 3.0 4.0
d; (A) d; (4 Figure 6. Same as Figure 5 except for 1, = 50 ms data.
case could apply to studies of proteins and higher molecular weight oligonucleotides for which few diagonal resonances are resolved, while the latter case is relevant to smaller molecules for which a greater number of diagonal peaks are resolved. The rms de- viations in d,, for the three groups of distances when uii is replaoed by ( ua) or when random noise of f30% uii is added to individual uti are plotted in the upper panels of Figure 7. Even with this large uncertainty in diagonal peak volumes, the rms deviations are comparable or smaller than those of the two-spin approximation.
To mimic cross-peak overlap, noise of f12% uij was added to 25% of the off-diagonal volumes chosen at random from V as well as f3% random noise added to all other uti. Scatter plots of ej vs 6, are shown for 1, = 200 and 50 ms in Figures 5E and 6E, respectively. At these noise levels the rms deviations in dij are smaller for the matrix solution (Figure 7, e) than for the twespin approximation (Figure 7, X). Similar accuracy is obtained with the matrix solution when a larger fraction of peaks are overlapped if the error in u,, is smaller: if 50% of the peaks include f6% error and the lower f3% error is added to the remainder of the peaks, the deviations are similar to those in Figure 7 (e). When random noise was added at a higher level or to a greater percentage of the cross-peak volumes, the matrix diagonalization failed to converge or often returned with negative eigenvalues, physically unreal values, and the accuracy of the solution was poor.
Finally, the combined effect of uncertainity due to overlap of diagonal and off-diagonal peak intensities is also shown in Figure 7 (m). Diagonal peaks of V were replaced by (uti) , and the same noise was added to u,, as for offdiagonal overlap alone (e). The results for the rms deviations show that errors upon combining the two uncertainties are not additive; the deviations with overlap error in both uii and u, are only slightly larger than those found with noise in vij alone lor longer dii. At shorter dij, the deviations
J . Am. Chem. SOC., Vol. 112, No. 19, 1990 6801
I l l I 1 I 1 1 1
B C 0.9 *
0.08 0.12 0.18 0.06 0.12 0.18 0.08 0.12 0.18
t, (6) t m ( 5 ) t m (4 Figure 7. Rms deviations between the calculated e, and the actual 4, when accounting for overlapping peaks for distance groups (A) du < 2.4, ( B ) 2.4 5 di, < 3.4, and (C) 3.4 5 d,. < 4.4. The results from the two-spin ratio (X ) are compared with those of the eigenvalue solution: upper panels, diagonal intensities replaced with (u i i ) (0) or f30% uii random noise added (A); lower panels, off-diagonal intensities overlap simulated by adding high level random noise ( f 1 2 % uij) to 25% of the off-diagonal intensities and low-level noise (&3.0% uu) plus 0.1% uo thermal noise to other intensities (+) and combined effects when the diagonal is replaced with (u,,) plus the same off-diagonal overlap noise (HI.
are the result of diagonal peak uncertainty alone. Incomplete NOESY Data. In practice, it is possible to obtain
only a partial volume matrix as defined by the inherent sensitivity of the NMR spectrometer; small cross-peak volumes corresponding to distances greater than 4.5-5.0 A (depending on T ~ ) cannot be accurately measured. To examine the effects of incomplete data on the reliability of the eigenvalue method, elements of V less than a specified cutoff volume were replaced with a defined volume, u,. In most instances u, was set equal to 0.0. However, better convergence behavior was sometimes found when u, was set equal to a small value determined empirically and typically less than 0.2% V,,. Hence, using a low level background in V by artificially setting all weak cross-peak volumes to a small value, even though many of these uij elements are actually near zero, improved the convergence behavior, while artificially setting all small u,, to zero sometimes lead to ill-conditioned eigensystems. Moreover, when a small value was used for ur, the solution for I' generally improved by a 0.1- to 0.2-A decrease in the rms deviation of dip The apparent optimum value for u, is approximately one-half the cutoff volume, Le., one-half the noise level.
The error in Gj values from incomplete V matrices was de- termined as a function of mixing time for several cutoff values or signal-to-noise levels. The results shown in Table I and Figure 8 are the rms deviations in dij when uij < 0.2,0.5, 1 .O, or 2% of the equilibrium magnetization uo were replaced with or. NOESY data measured at a 500-MHz field strength illustrating cross-peak volumes of 1% have been Thus the range in cutoff values simulates sensitivity limits which are achievable in practice. The completeness of the NOESY data is indicated in Table I by the percentage of the total number of u,, elements that were greater than the cutoff value. Only distances corresponding to these uij elements were included in the error analysis.
The trend of increasing error with t , is also found with in- complete V as demonstrated by Figure 8. For all levels of sensitivity examined, the deviations in the eigenvalue solution for cross-relaxation rates for proton pairs separated by <3.4 A is less than 0.35 A, while the two-spin rms deviations for this group (Figures 8A,B) vary from 0.07 to 0.4 A. Even when only 50% of the intensities for distances between 2.4 and 3.4 A are included, as for short t , with cutoff volumes of 1.0 and 2.0% uo (signal to noise of uo equal to 100 and 50, see Table I), the eigenvalue solution has a small rms error, substantially less than that from the two-spin ratio method. In the distribution of Gj against Gj

6802 J . Am. Chem. SOC., Vol. 112, No. 19, 1990 Post et al.
Table I. Rms Error in dfi Determined from Incomplete NOESY Data bv the Matrix Method"
mixing time interproton distance 25 50 100 150 200
0-2.4
2.4-3.4
3.4-4.4
0-2.4
2.4-3.4
3.4-4.4
0-2.4
2.4-3.4
3.4-4.4
0-2.4
2.4-3.4
3.4-4.4
Cutoff = 0.2%. S/N = 500 rms 0.00 0.00 0.00 0.00
rms 0.02 0.01 0.00 0.01
rms 0.07 0.13 0.20 0.22 7% vi, 58 91 99 94
Cutoff = 0.5%, S/N = 200 rms 0.00 0.00 0.01 0.01
rms 0.03 0.07 0.08 0.09 7% vu 86 100 100 98 rms 0.09 0.21 0.37 0.62 % vij 6 44 80 86
Cutoff = 1.076, S / N = 100 rms 0.01 0.01 0.02 0.03
rms 0.03 0.09 0.19 0.23
rms 0.26 0.48 0.63 % vij 0 9 41 51
Cutoff = 2.0%, S / N = 50 rms 0.01 0.04 0.09 0.3W
rms 0.03 0.09 0.27 0.33c % v , 20 46 76 73 rms 0.65 0.99c % vij 0 0 12 16
%VI; 100 100 100 100
s v , 100 100 100 100
% v , 100 100 100 100
% v , 100 100 100 100
% Vij 50 81 95 94
% v u 100 100 100 94
0.01
0.06
0.44
I 0 0
98
93
0.02
0.14
0.51
100
98
85
0.03
0.22
0.73
100
98
63
0.4V
0.36c
1 .08c
90
74
20 " V was simulated with T~ = 4.5 ns from lysozyme proton coordi-
nates. Volume elements smaller than the cutoff value, expressed as a percentage of u,, were replaced with v, (see text). When all volume elements are included the rms error is 0.0 for all groups for t, 5 250 ms. bPercentage of distances with vu intensity greater than the cutoff volume. Total number of interproton distances for dij < 2.4 A is 91, for 2.4 5 dij < 3.4 A is 253 and for 3.4 5 dl . < 4.4 A is 349. CMatrix diagonalization resulted in negative eigenvalues.
'' 0.6 .rr"
0.3
0.0
0.08 0.12 0.18 0.06 0.12 0.18 0.08 0.12 0.18
tm (4 tm ( 8 ) h (8)
Figure 8. Rms error in d,, values when small u,, in the generated NOESY data are replaced with a constant u, value, simulating incomplete ex- perimental data. The cutoffs for uij are 1.0% (A), 0.5% (@), and 0.2% (e) of the diagonal volume at 1, = 0, corresponding to a signal to noise of 100, 200, and 500, respectively. Distances are grouped as (A) di, < 2.4, (9) 2.4 I dij < 3.4, and (C) 3.4 I dlj. < 4.4. The values for a two-spin analysis (X) are shown for comparison.
(Figure 5F and 6F) there is a high density of points along the line of unity slope with the eigenvalue solution although a small number of points lie far from the line in the case o f the longer t , (Figure 5F). With regard to a structure determination, such large de- viations could have an adverse effect. Large errors of this nature should become evident however from a comparison of aij and di, values evaluated at distinctly different t,.
IV. Conclusions As interproton distances are the fundamental basis of three-
dimensional structure determination by NMR, it is important to consider methods which improve the accuracy of their evalua- tion.6v2' Due to the error22-28 in the two-spin approximation procedure for evaluating interproton distances from NOESY
intensities, we have studied the feasibility of a rate matrix approach for this task. In this paper we define the practical limitations in the matrix method due to numerical error in diagonalization of a matrix of NOESY intensities when effects from experimental limitations on their measurement are present. The simulation studies show that the matrix solution is accurate when the input spectral intensities are well determined. With good quantification of NOESY volumes and complete data sets including volumes equal to 1 .O% of the diagonal intensity at t , = 0, the distances calculated with the matrix solution are more accurate than those obtained assuming the two-spin model. A relatively larger error in the quantification of a fraction of the peaks, as in overlapping resonances, can be tolerated. The need for a complete data set in the matrix analysis means that all possible peak volumes should be measured. Complete resonance assignments are not required. (Of course, the assignments as well as a dynamic model for 7, are needed to relate the calculated aij values to the restraints required in the structure determination.)
More accurate distances justify the use of tighter constraints in the conformational search by molecular dynamics or distance geometry. An advantage of tighter constraints is to achieve greater precision in the set of structures'z" obtained by the NMR method. [Although the finding of greater precision among structures when tighter restraints are used was obtained with studies on oligo- nucleotides in ref 12 and 54, it is also likely to hold for proteins since positional fluctuations are reduced in general with stronger force constants.] It is reasonable that better determined inter- proton distances would lead as well to improved accuracy in the three-dimensional structure, although such an improvement has not yet been rigorously demonstrated. Studies so directed are in progress in our laboratories. One study has indicated that the structure determination process behaves better when the distances result from a multispin analysis rather than from a two-spin analysis; Nikonowicz et al.55,M have used NMR distances to derive a family of structures for the extra-helical adenosine tridecamer d(CGCAGAATTCGCG)2. By using distances from the hybrid relaxation matrix methodology in combination with restrained molecular dynamics and starting from two quite different initial structures, it was possible to iteratively refine both to a common family of structures consistent with the NOESY-derived distances. On the other hand, differentiating between structures in which the extra-helical adenosine stacks between the third and fourth base pairs forms H-bonds to a G-C base pair to form a triplet, or even stacks between the second and third base pairs was not possible by using distances derived from the two-spin approxi- mation. Only the theoretical NOESY spectra derived from the hybrid matrix/restrained MD structures are consistent with the experimental NOESY spectra.
Most of our simulation studies were carried out with a matrix of 194 spins from the interior of lysozyme. Similar dependences on mixing time and sensitivity to imperfect NOESY data in the accuracy of the matrix solution were found for the DNA oligomer. Because of the limiting behavior when 7 is large (see Results section on noise-free data) our results as a function of t , at 7, = 4.5 ns can be extrapolated to other 7, values. The larger matrix size needed to include the full set of 696 lysozyme protons (ap- proximately a 20-A diameter sphere) would require significantly more computer time and would have poorer convergence behavior (data not shown). Therefore to evaluate distances for a molecule with greater than =200 protons, a procedure that divides the molecule into overlapping regions and uses more than one matrix to evaluate the distances might be useful.
The matrix method will benefit from increased sensitivity and signal to noise of high field spectrometers and from improvements in software for volume integration of NOESY peak^.^^,^^ With
(54) Gronenborn, A. M.; Clore, G . M. Biochemistry 1989,28,5978-5984. (55) Nikonowicz, E.; Meadows, R. P.; Gorenstein. D. G. Bull. Magn.
(56) Nikonowicz, E.; Meadows, R. P.; Gorenstein, D. G . Biochemistry
(57) Denk, W . ; Baumann. R.; Wagner, G. J . Magn. Reson. 1986, 67,
Reson. 1989, I I , 226-229.
1990, 29, 4193-4204.
386-390.

J . Am. Chem. SOC. 1990, I 12, 6803-6809 6803
noise-free data, essentially exact solutions are obtained when 7& < 1.5 X lo4 s2. In contrast, the accuracy of d,, values obtained by using a two-spin approximation is not increased by improve- ments in the data because of the inherent error in neglecting multispin relaxation effects.
Procedures involving a matrix analysis are being actively in- vestigated. Although the requirement for nearly complete data with well-determined intensities may prohibit a multispin analysis of interproton distances in the first steps of structure determination by NMR. such an analysis is beneficial in refinement of the structural solution. The need for nearly complete NOESY data sets can be circumvented in the first stages of structure deter- mination by combining experimental data with cross-peak in- tensities calculated from an initial model.'*37*55*59 An iterative procedure could also serve to improve the quantification of NOESY intensities for instances such as overlapping resonances. Furthermore, a novel approach utilizing NOESY data directly
in the conformational search, in contrast to the interproton dis- tances interpreted from them, was recently reported.60 At the least, the final structure should be evaluated by comparing sim- ulated NOESY cross-peak volumes calculated from the structural solution with the experimentally observed NOESY volumes, perhaps in a fashion analogous to the crystallographic R-fac- tor2a61*62 or as an average percent difference,59 with some provision for possible discrepancies resulting from internal motions.
Acknowledgment. We gratefully acknowledge many useful discussions with Drs. E. T. Olejniczak and C. R. Jones and the help of J. Fish in the initial stages of the development of MORAS. The work was supported in part by the National Institutes of Health (Grant RR01077) and the National Science Foundation (Grant BBS 8614177).
Registry No. d(CGCGAATTCGCG), 128496-41 -3; lysozyme, 9001- 63-2.
(58) Olejniczak, E. T.; Gampe, R. T., Jr.; Fesik, S . W. J . Magn. Reson.
(59) Gorenstein, D. G. G.; Meadows. R. P.; Metz, J. T.; Nikonowicz, E.; Post, C. B. In Advances in Biophysical Chemistry; Bush, A., Ed.; J.A.I. Press: In press.
1989,8/, 178-185. (60) Yip, P.; Case, D. A. J. Magn. Reson. 1989, 83, 643-648. (61) Summers, M. F.; South, T. L.; Kim, B.; Hare, D. R. Biochemistry
(62) Baleja, J. D.; Moult, J.; Sykes, B. D. J . Magn. Reson. 1990, 87, 1990, 29, 329-340.
375-384.
Nature of the Carbon-Phosphorus Double Bond and the Carbon-Phosphorus Triple Bond As Studied by Solid-state NMR
James C. Duchamp," Marek Pakulski,lb Alan H. Cowley,lb and Kurt W. Zilm**ll Contribution from the Department of Chemistry, Yale University, New Haven, Connecticut 0651 I , and Department of Chemistry, University of Texas at Austin, Austin, Texas 7871 2. Received January I I , I990
Abstract: The nature of the carbon-phosphorus double bond in ~,~,~-~-BLI,C~H~P=C(S~M~~)~ and the carbon-phosphorus triple bond in 2,4,6-t-Bu3C6H2C=p has been studied by 13C and 31P solid-state NMR. Magic angle spinning and static cross-polarization experiments have been used to determine the principal elements of the I3C and 31P shielding tensors. In the I3C spectra, the presence of a dipolar coupling to the IIP nucleus permits assignment of the orientation of the I3C shielding tensors in the molecular frame. These shift tensors are compared to previous work on diphosphenes, disilenes, alkenes, and alkynes. I t is found that the shift anisotropies for 3'P and I3C in these multiply bonded environments are quite similar when the larger intrinsic chemical shift range for 31P is taken into account.
Introduction Advances in synthetic chemistry over the last two decades have
resulted in the successful synthesis and isolation of a variety of main-group compounds containing multiply bonded functional groups.2 Examples of room temperature stable species with
P I P ? and Sn=Sn5 double bonds have been realized, as well as compounds with multiple bonds between main-group and transition elements. A number of mixed-main-group systems with, e g , C=Si,6 C=P? and m P ? multiple bonds are also now
( I ) (a) Yale University. (b) University of Texas at Austin. (2) (a) Cowley, A. H. Polyhedron 1984,3,389-432. (b) Cowley, A. H.
Acc. Chem. Res. 1984, 17, 386-392. (c) West, R. Pure Appl. Chem. 1984, 56. 163. (d) Raabe, G.; Michl, J. Chem. Rev. 1985, 85, 419. (e) Cowley, A. H.; Norman, N. C. Prog. lmrg. Chem. 1%. 34, 1. ( f ) Regie, M.; Binger, P. Angew. Chem.. Int . Ed. Engt. 1988, 27, 1484.
(3) West, R.; Fink, M. J.; Michl, J. Science (Washington, D.C.) 1981, 214, 1343.
(4) Yoshifuju, M.; Shima, 1.; Inamoto. N. J . Am. Chem. Soc. 1981, 103,
(5) Davidson, P. J.; Harris, D. H.; Lappert, M. F. J . Chem. Soc., Dalton 4587,4589.
Trans. 1976, 2286.
known. In this paper we report the first use of solid-state NMR methods to investigate the nature of the C=P double bond in 2-(2,4,6-tri-tert-butylphenyl)- 1, l -bis(trimethylsilyl)phosphaethene (1) and the C e P triple bond in 2-(2,4,6-tri-tert-butylphenyl)- phosphaacetylene (2). Previous efforts to characterize these novel compounds have involved studies of their chemical reactivity or used structural methods in addition to theoretical treatments. Reactivity of 1, 2, and related compounds has been found to compare favorably with that of similar alkenes and alkynes.'** X-ray crystallography finds the C=P bond length in 1 to be 1.665
(6) Brook, A. G.; Abdesaken, F.; Gutekunst, G.; Kallury, R. K. J . Chem. Soc., Chem. Commun. 1981, 191.
(7) (a) Appel, R.; Knoll, F.; Ruppert, 1. Angew. Chem., Int. Ed. Engl. 1981, 20, 731-744. (b) Kroto, H. W. Chem. Soc. Reo. 1982, 11,435.
(8) (a) Schifer, A.; Weidenbruch, M.; Saak, W.; Pohl, S . Angew. Chem., Lett. Ed. Engl. 1987, 26, 776-777. (b) Annen, U.; Regitz, M. Tetrahedron Lett. 1987, 28, 5141-5144. (c) Quin, L. D.; Hughes, A. N.; Pete, B. Terra- hedron Lett. 1987, 28, 5783-5786. (d) Xie, Z.; Wislan-Neilson, P.; Neilson, R. Organometallics 1985, 4, 339-344. (e) Becker, G.; Becker, W.; Knebl, R.; Schmidt, H.; Weeber, U.; Westerhausen, M. Noua Acta Leopold. 1985, 264, 55-67.
0002-7863/90/ 15 12-6803$02.50/0 0 1990 American Chemical Society