Embed Size (px)
Citation preview
On the Division of Short-Term and Working Memory: An Examination ofSimple and Complex Span and Their Relation to Higher Order Abilities
Nash UnsworthUniversity of Georgia
Randall W. EngleGeorgia Institute of Technology
Research has suggested that short-term memory and working memory (as measured by simple andcomplex span tasks, respectively) are separate constructs that are differentially related to higher ordercognitive abilities. This claim is critically evaluated by reviewing research that has compared simple andcomplex span tasks in both experimental and correlational studies. In addition, a meta-analysis andre-analyses of key data sets were conducted. The review and analyses suggest that simple and complexspan tasks largely measure the same basic subcomponent processes (e.g., rehearsal, maintenance,updating, controlled search) but differ in the extent to which these processes operate in a particular task.These differences largely depend on the extent to which phonological processes are maximized andvariability from long list lengths is present. Potential methodological, psychometric, and assessmentimplications are discussed and a theoretical account of the data is proposed.
Keywords: working memory, short-term memory, complex span tasks, simple span tasks
Individual differences in memory abilities have long interestedpsychologists and have played an integral role in psychometricbatteries of intelligence. Indeed, memory span tasks have been partof intelligence batteries since their inception (e.g., Terman, 1916;see Dempster, 1981, for a review). In these short-term memory (orsimple) span tasks, participants are given a list of to-be-remembered (TBR) items including letters, digits, words, or shapesand are then asked to recall the list in the correct serial orderimmediately after presentation of the last item. For example, in theletter span task, participants who receive the list “R, S, L, Q, T”must correctly recall the letters in their correct serial position. Anydeviation (e.g., recalling “S” as the first letter) is counted as anerror. Additionally, list length is typically varied such that partic-ipants are required to sometimes recall short lists (e.g., two items)and other times recall longer lists (e.g., seven items).
In working memory (or complex) span tasks, such as the simplespan ones, participants recall a set of items in their correct serialorder. The tasks differ in that complex span requires that partici-pants engage in some processing activity unrelated to the memorytask. This activity is interleaved between presentation of the indi-vidual TBR items. The processing component can include readingsentences, solving arithmetic problems, or assessing the symmetryof visual objects. For instance, in the operation span task, partic-ipants solve math problems while trying to remember unrelateditems. A trial in this task may look like:
IS �8/ 2� � 1 � 1?R
IS �6*1� � 2 � 8?L
IS �10*2� � 5 � 15?S
IS �12/6� � 4 � 10?Q
IS �2*3� � 3 � 3?T
Here, participants are instructed to solve the math problems andremember the letters. At the recall signal (???), they must recall theletters in the correct serial order. Note that the list of TBR items isexactly the same as in the simple span task.
Beginning with research by Daneman and Carpenter in 1980,several studies have shown that complex span tends to correlatehigher with measures of higher order cognition than does simplespan (e.g., Cantor, Engle, & Hamilton, 1991; Conway & Engle,1996; Conway et al., 2002; Daneman & Merikle, 1996; Dixon,LeFevre, & Twilley, 1988; Engle, Tuholski, Laughlin, & Conway,1999; Kail & Hall, 2001; Masson & Miller, 1983; Turner & Engle,1989). These findings have led some researchers to conclude thatworking memory (WM) is more important for higher order cog-nition than is short-term memory (STM). For example:
The high correlation between reading span and the various compre-hension measures is striking; the reading span task succeeds whereprevious short-term memory measures have failed. (Daneman & Car-penter, 1980, p. 463)
WMC is more closely related with Gf and Reasoning than is short-term memory (STM). (Kane, Hambrick, & Conway, 2005, p. 66)
Thus, the existing evidence, though scanty, is consistent with thehypotheses that WM and STM are distinct but related and that WMplays a greater role than STM in higher-order cognitive processes.(Kail & Hall, 2001, p. 2)
At the same time, other studies have found that simple spancorrelates nearly as well as complex span with measures of higherorder cognition (Bayliss, Jarrold, Baddeley, & Gunn, 2005; Co-lom, Rebollo, Abad, & Shih, 2006; Kane et al., 2004; La Pointe &Engle, 1990; Mukunda & Hall, 1992; Shah & Miyake, 1996;Unsworth & Engle, 2006a). This suggests that simple and complex
Nash Unsworth, Department of Psychology, University of Georgia, andRandall W. Engle, School of Psychology, Georgia Institute of Technology.
We thank Rich Heitz and Tom Redick for helpful comments in allphases of this research project.
Correspondence concerning this article should be addressed to NashUnsworth, Department of Psychology, University of Georgia, Athens, GA30602-3013. E-mail: [email protected]
Psychological Bulletin Copyright 2007 by the American Psychological Association2007, Vol. 133, No. 6, 1038–1066 0033-2909/07/$12.00 DOI: 10.1037/0033-2909.133.6.1038
1038
span largely measure the same fundamental cognitive processesand whatever is common to the tasks predicts higher order cogni-tive processes. For example:
More importantly, the simple word span task also significantly pre-dicted comprehension and, in some cases, did so as well as did thecomplex span task. (La Pointe & Engle, 1990, p. 1129)
Still another important theoretical implication is that complex spanmeasures (of WM) must not be clearly distinguished from simple spanmeasures (of STM). Both measures share something in common thatcould produce their association with cognitive ability measures. (Co-lom, Rebollo, Abad, & Shih, 2006, p. 167)
At the very least, the results suggest that complex and simple spantasks should not be dichotomized to simply reflect working memoryand short-term memory, but rather all immediate memory tasks re-quire a number of processes which may be important for higher-ordercognition. (Unsworth & Engle, 2006a, p. 77)
Comparing these discrepant findings and conclusions, however,is complicated by the fact that studies differ in the nature of theirsamples (younger adults, children, older adults) and in their pre-sentation and scoring procedures. Furthermore, simple span taskshave been studied extensively with regard to particular experimen-tal manipulations (e.g., word length, phonological similarity),whereas these manipulations have been used less often with com-plex span tasks. Thus, we suggest that a detailed examination ofboth experimental and correlational evidence may provide impor-tant insights regarding the extent to which simple and complexspan assess the same or different constructs.
The examination of potential similarities and differences insimple and complex span (and, therefore, STM and WM) isimportant from a purely cognitive perspective and is also impor-tant for many other research areas that rely on these tasks. As wenoted previously, these tasks have long been part of basic psycho-metric intelligence batteries, as well as neuropsychological assess-ments. Additionally, these tasks have played an integral role inmemory research examining correlations with other abilities, in-cluding research in the areas of cognitive aging, developmentalpsychology, and psychopathology. Finally, these tasks have beenused in research domains to make inferences about basic cognitiveprocesses, including social psychology and personality theory.Thus, determining the extent to which memory span tasks measurethe same or different constructs is an important endeavor forseveral areas of research.
In the current article, we argue that simple and complex spanlargely measure the same basic processes (e.g., rehearsal, mainte-nance, updating, controlled search) but differ in the extent to whichthese processes operate in a particular task. When we talk about theextent to which processes operate in a task, we refer to the notionthat tasks are not process pure; rather, they reflect a combinationof processes. For instance, two different tasks may involve thesame set of processes; however, a particular process (or combina-tion of processes) may affect performance more on one task thanon the other. Furthermore, we argue that a number of factors,including the nature of the sample, the scoring method, and theadministration procedures, can influence the extent to which sim-ple and complex span predict measures of higher order cognition.In particular, we argue that simple and complex span predicthigher level cognition similarly when performance from long listlengths is measured (especially in simple span tasks) and the roleof phonological rehearsal is reduced. We begin with a brief review
of the relevant literature. We then review similarities and differ-ences between simple and complex span in experimental designs.This is followed by a section describing similarities and differ-ences in how well simple and complex span predict measures ofhigher order cognition with an emphasis on the role of differentscoring procedures.
The Division of Short-Term Memory and WorkingMemory
In order to address similarities and differences between STMand WM, we must first place these concepts in a theoreticalcontext (see Engle & Oransky, 1999, for a review). Both conceptsare cast in frameworks distinguishing information that is utilizedover the short term from information that is utilized over the longterm. Initially, STM was conceptualized as a somewhat passiverepository of information before transfer to long-term memory(LTM). In modal models of memory, STM was limited in capacity,and information was maintained through rehearsal (primarily ver-bal). If not rehearsed, information was rapidly lost. Specific mod-els of STM associated it with many important control processesincluding rehearsal, coding, organization, and retrieval strategies(Atkinson & Shiffrin, 1968, 1971). Atkinson and Shiffrin (1971)suggested that these control processes were important for coordi-nating the many subcomponent processes needed to process newinformation and to retrieve relevant old information. This concep-tualization placed STM at the forefront of explaining complexcognitive activities.
Despite a wealth of data supporting a division between STM andLTM and the development of explicit models arguing for theimportance of STM in cognition, it soon became clear that STM,as initially conceptualized, was overly simplistic with respect to itsrole in higher order cognitive functions such as reading and rea-soning. With this limitation clearly in mind, Baddeley and Hitch(1974) reconceptualized STM as a more dynamic system that wasimportant for storing information over the short term and forflexible cognitive tasks in which storage and manipulation are bothrequired. In a series of experiments, Baddeley and Hitch demon-strated that participants could briefly store some information whileprocessing or manipulating aspects of other information. Conse-quently, they argued for a WM system that was responsible forstorage and many other cognitive operations simultaneously. Thus,WM included stores dedicated to briefly retaining verbal or spatialinformation and a general purpose processor involved in coordi-nating and manipulating information and in monitoring ongoingprocessing.
While Baddeley and Hitch (1974) were arguing for a dynamicWM memory system in the cognitive literature, neo-Piagetianswere making similar arguments in the developmental literature(see, e.g., Case, Kurland, & Goldberg, 1982; Pascual-Leone, 1970;Pascual-Leone & Johnson, 2004). Like Baddeley and Hitch(1974), Case, Kurland, and Goldberg (1982) argued for a distinc-tion between storage (storage space) and processing abilities (op-erating space) in order to account for developmental increases inmemory span performance. Thus, the original conception of STMwas replaced by a more dynamic conception of memory thatcombined storage and processing/manipulation/integration. Fol-lowing Baddeley and Hitch’s (1974) lead (see also Atkinson &Shiffrin, 1968, 1971; Miller, Galanter, & Pribram, 1960), WM hasbeen seen as distinct from STM ever since.
1039SIMPLE AND COMPLEX SPANS
In addition to basic theoretical differences between STM andWM, researchers also became interested in distinctions betweenputative measures of the two constructs and the extent to whichsome measures predicted higher order cognitive functioning betterthan others. A number of researchers argued that measures of STMshould correlate fairly well with measures of reasoning, readingcomprehension, and other higher order abilities. However, severalresearchers found that this was not always the case. For example,simple span tasks typically did not correlate well with measures ofreading ability (see, e.g., Perfetti & Lesgold, 1977). Noting thisapparent paradox (i.e., STM was prominent in models of complexcognition but failed to correlate with a complex task such asreading), Daneman and Carpenter (1980) suggested that simplespan does not correlate with reading ability because simple spanprimarily measures the storage aspect of STM and does not ade-quately measure the processing aspects that are emphasized inmodels of WM. In order to test this hypothesis, Daneman andCarpenter devised a task that required a trade-off between storageand processing and captured the dynamics of the whole WMsystem rather than just one component. In the initial reading spantask, Daneman and Carpenter instructed participants to read aseries of sentences and recall the last word of each at the recallprompt. This task was contrasted with a simple word span task inwhich participants remembered a series of unrelated words. Bothtasks theoretically measured storage abilities, but only the complexreading span task adequately measured the processing component.Daneman and Carpenter found that reading span correlated morehighly with several measures of reading comprehension (includingVerbal Scholastic Aptitude Test [SAT] performance) than didsimple word span, in line with the argument that processing andstorage are more important in higher order cognition than instorage alone.
For the most part, subsequent research has supported theseinitial findings, suggesting that complex span generally correlateswith higher order abilities better than simple span. However, asnoted previously, some researchers have reported significant andsometimes sizable correlations between simple span and perfor-mance on other cognitive measures. Part of the problem, as wediscuss later, may be due to unreliability in traditional measures ofsimple span (see also Dempster, 1981). Thus, although there isevidence suggesting a distinction between simple STM span tasksand complex WM span tasks in both experimental and differentialliteratures, there is also evidence suggesting that these two types oftasks measure very similar processes and abilities.
Experimental Effects in Simple and Complex Span
One approach to determining whether simple and complex spantasks measure the same or different theoretical constructs is toidentify dissociations in the influence of experimental variables.Here, we review how several experimental variables affect perfor-mance on simple and complex span tasks.
Serial Position Functions
Serial position functions, in which proportion correct for eachitem is plotted as a function of the item’s presentation position,have played an important role in theories of memory. Thesefunctions have three prominent features: good performance forearly items (primacy effects), poor performance for mid-list items,
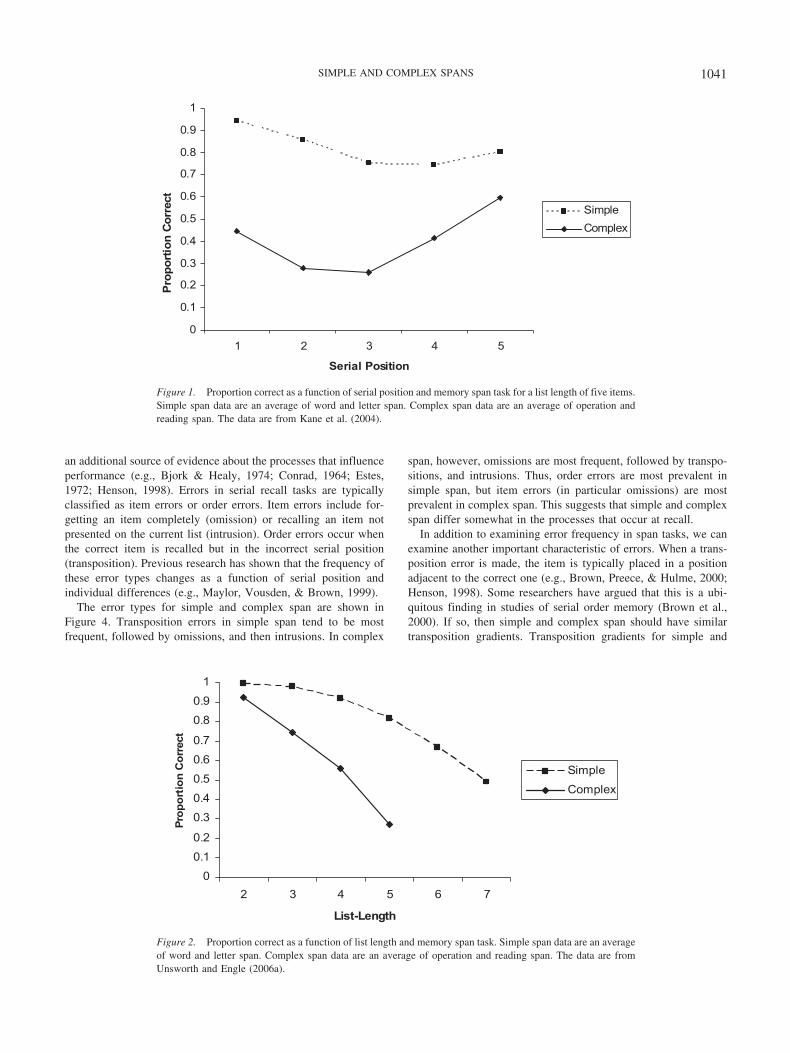
and good performance for late items (recency effects). The size ofprimacy and recency effects and the relative dominance of oneover the other vary from task to task. For instance, small primacyand large recency effects are found in immediate free recall (inwhich items can be recalled in any order). In contrast, strongprimacy and weak recency effects are found in immediate serialrecall (in which output and input position need to match from firstto last item), although this varies depending on the presentationmodality. Additionally, immediate backward serial recall (inwhich input and output position must correspond from last to firstitem) produces strong recency effects and primacy effects that aresomewhat similar to those in immediate free recall. Thus, serialposition functions change systematically depending on how recallis structured. These systematic effects have been instrumental inthinking about distinctions among memory structures and memoryfunctions. Both simple and complex span require immediate serialrecall; however, they may have different serial position functions.If so, this would support the claim that STM and WM are some-what distinct constructs. Typical serial position functions for sim-ple and complex span are shown in Figure 1. Note that items werepresented visually and recall was in the forward direction.
Performance is higher on simple span than complex span, andthe serial position curves are notably different. The recency effectis small in simple span (as is typical with visual presentation ofitems) but is pronounced in complex span. In fact, the recencyeffect in complex span is similar to that found in simple span whenbackward serial recall is required. This suggests that slightlydifferent processes may operate in the two tasks.
List-Length Effects
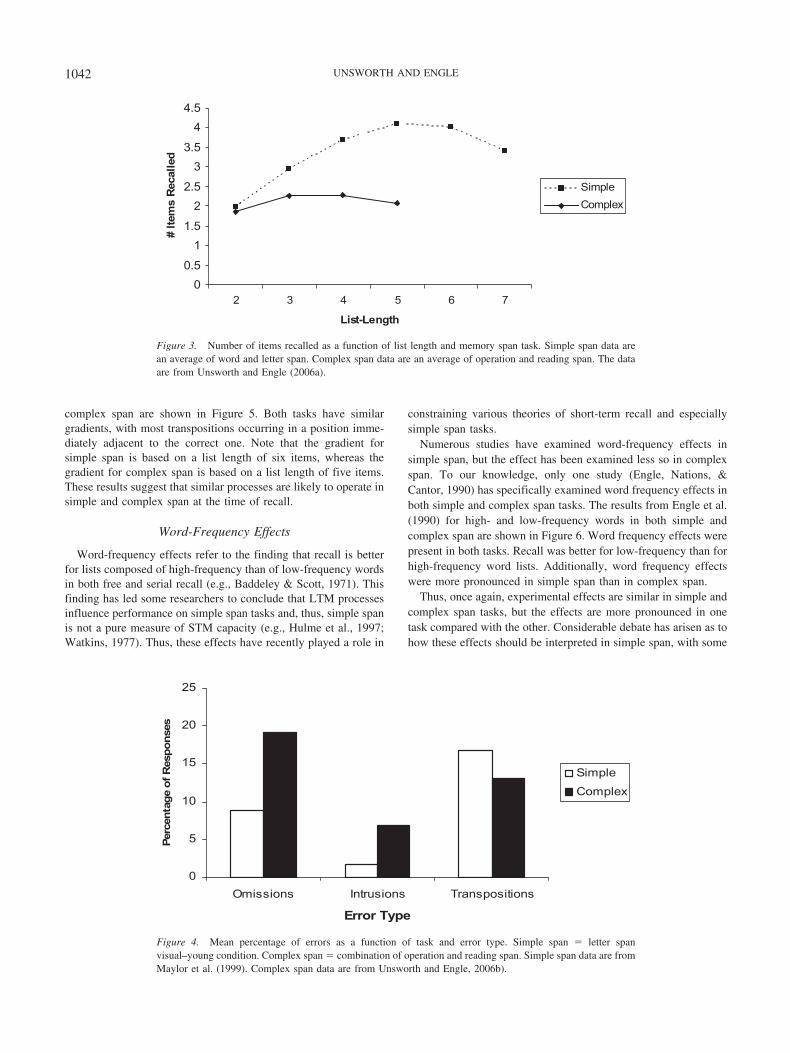
The list-length effect refers to the finding that the proportion ofitems recalled in the correct serial position decreases as a functionof list length (although the absolute number of words recalledtends to increase; Murdock, 1962; Roberts, 1972). Previous re-search has demonstrated list-length effects in a number of para-digms, including free recall, serial recall, and recognition. Mostexplanations of the effect suggest that proportion correct decreasesas a function of list length because of competition among itemssharing the same cue (i.e., cue-overload; Watkins, 1979). In aprevious study, we (Unsworth & Engle, 2006a) examined list-length effects in simple and complex span. The results are shownin Figure 2. Both simple and complex span show a clear list-lengtheffect, but it is more pronounced in complex than in simple span(see Unsworth & Engle, 2006a, for an interpretation of theseresults based on differential recall from primary and secondarymemory in simple and complex span tasks).
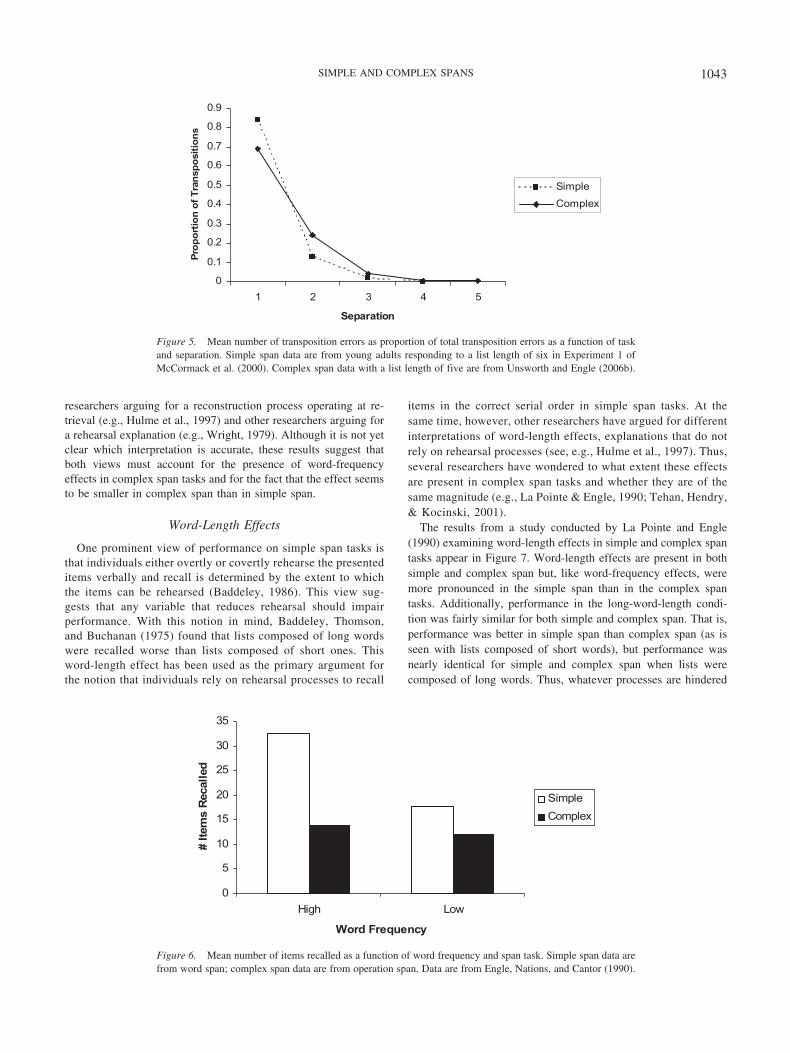
Both tasks also demonstrate an increase in the mean number ofitems recalled as list length increases, as shown in Figure 3. Thus,both aspects of the list-length effect—decrease in proportion cor-rect and initial increase in number of items recalled (see, forexample, Beaman, 2006)—are found in simple and in complexspan. This suggests that similar processes operate in the two tasks,although the extent to which they do so likely differs (see Un-sworth & Engle, 2006a, 2006b).
Recall Errors
Although proportion correct is the main indicator of perfor-mance in many studies, the type and frequency of recall errors are
1040 UNSWORTH AND ENGLE
an additional source of evidence about the processes that influenceperformance (e.g., Bjork & Healy, 1974; Conrad, 1964; Estes,1972; Henson, 1998). Errors in serial recall tasks are typicallyclassified as item errors or order errors. Item errors include for-getting an item completely (omission) or recalling an item notpresented on the current list (intrusion). Order errors occur whenthe correct item is recalled but in the incorrect serial position(transposition). Previous research has shown that the frequency ofthese error types changes as a function of serial position andindividual differences (e.g., Maylor, Vousden, & Brown, 1999).
The error types for simple and complex span are shown inFigure 4. Transposition errors in simple span tend to be mostfrequent, followed by omissions, and then intrusions. In complex
span, however, omissions are most frequent, followed by transpo-sitions, and intrusions. Thus, order errors are most prevalent insimple span, but item errors (in particular omissions) are mostprevalent in complex span. This suggests that simple and complexspan differ somewhat in the processes that occur at recall.
In addition to examining error frequency in span tasks, we canexamine another important characteristic of errors. When a trans-position error is made, the item is typically placed in a positionadjacent to the correct one (e.g., Brown, Preece, & Hulme, 2000;Henson, 1998). Some researchers have argued that this is a ubi-quitous finding in studies of serial order memory (Brown et al.,2000). If so, then simple and complex span should have similartransposition gradients. Transposition gradients for simple and
0
0.1
0.2
0.3
0.4
0.5
0.6
0.7
0.8
0.9
1
1 2 3 4 5
Serial Position
Pro
po
rtio
n C
orr
ect
Simple
Complex
Figure 1. Proportion correct as a function of serial position and memory span task for a list length of five items.Simple span data are an average of word and letter span. Complex span data are an average of operation andreading span. The data are from Kane et al. (2004).
0
0.1
0.2
0.3
0.4
0.5
0.6
0.7
0.8
0.9
1
2 3 4 5 6 7
List-Length
Pro
po
rtio
n C
orr
ect
Simple
Complex
Figure 2. Proportion correct as a function of list length and memory span task. Simple span data are an averageof word and letter span. Complex span data are an average of operation and reading span. The data are fromUnsworth and Engle (2006a).
1041SIMPLE AND COMPLEX SPANS
complex span are shown in Figure 5. Both tasks have similargradients, with most transpositions occurring in a position imme-diately adjacent to the correct one. Note that the gradient forsimple span is based on a list length of six items, whereas thegradient for complex span is based on a list length of five items.These results suggest that similar processes are likely to operate insimple and complex span at the time of recall.
Word-Frequency Effects
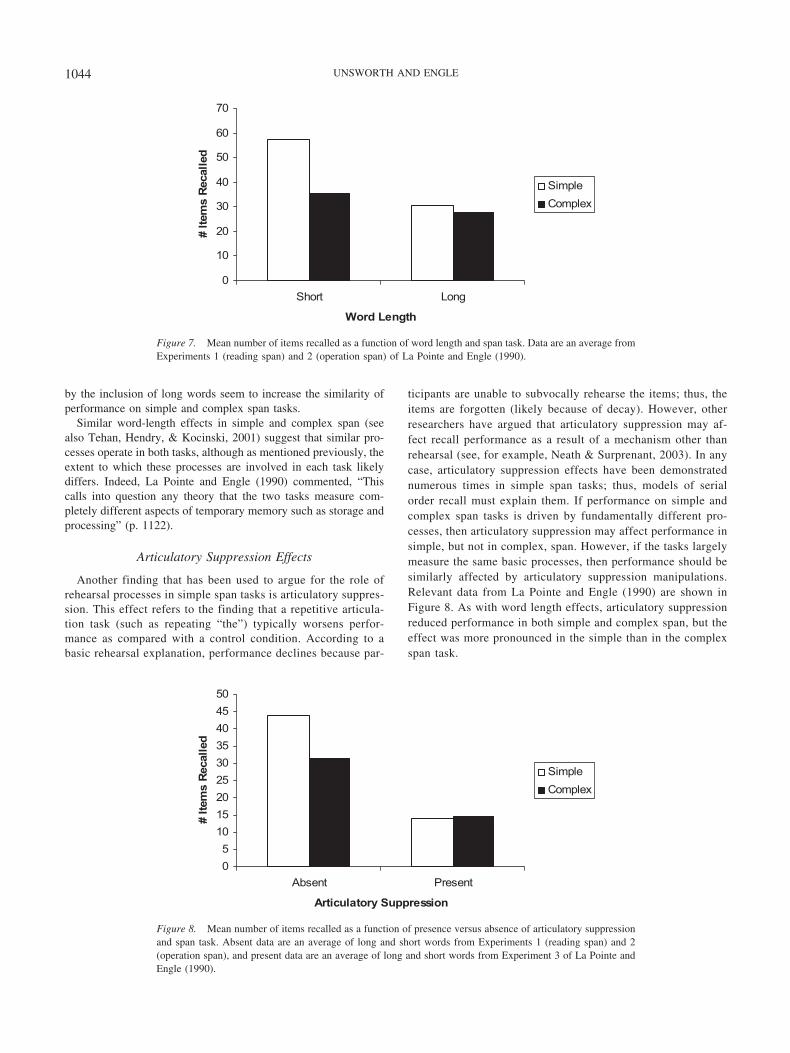
Word-frequency effects refer to the finding that recall is betterfor lists composed of high-frequency than of low-frequency wordsin both free and serial recall (e.g., Baddeley & Scott, 1971). Thisfinding has led some researchers to conclude that LTM processesinfluence performance on simple span tasks and, thus, simple spanis not a pure measure of STM capacity (e.g., Hulme et al., 1997;Watkins, 1977). Thus, these effects have recently played a role in
constraining various theories of short-term recall and especiallysimple span tasks.
Numerous studies have examined word-frequency effects insimple span, but the effect has been examined less so in complexspan. To our knowledge, only one study (Engle, Nations, &Cantor, 1990) has specifically examined word frequency effects inboth simple and complex span tasks. The results from Engle et al.(1990) for high- and low-frequency words in both simple andcomplex span are shown in Figure 6. Word frequency effects werepresent in both tasks. Recall was better for low-frequency than forhigh-frequency word lists. Additionally, word frequency effectswere more pronounced in simple span than in complex span.
Thus, once again, experimental effects are similar in simple andcomplex span tasks, but the effects are more pronounced in onetask compared with the other. Considerable debate has arisen as tohow these effects should be interpreted in simple span, with some
0
0.5
1
1.5
2
2.5
3
3.5
4
4.5
2 3 4 5 6 7
List-Length
# It
ems
Rec
alle
d
Simple
Complex
Figure 3. Number of items recalled as a function of list length and memory span task. Simple span data arean average of word and letter span. Complex span data are an average of operation and reading span. The dataare from Unsworth and Engle (2006a).
0
5
10
15
20
25
Omissions Intrusions Transpositions
Error Type
Per
cen
tag
e o
f R
esp
on
ses
Simple
Complex
Figure 4. Mean percentage of errors as a function of task and error type. Simple span � letter spanvisual–young condition. Complex span � combination of operation and reading span. Simple span data are fromMaylor et al. (1999). Complex span data are from Unsworth and Engle, 2006b).
1042 UNSWORTH AND ENGLE
researchers arguing for a reconstruction process operating at re-trieval (e.g., Hulme et al., 1997) and other researchers arguing fora rehearsal explanation (e.g., Wright, 1979). Although it is not yetclear which interpretation is accurate, these results suggest thatboth views must account for the presence of word-frequencyeffects in complex span tasks and for the fact that the effect seemsto be smaller in complex span than in simple span.
Word-Length Effects
One prominent view of performance on simple span tasks isthat individuals either overtly or covertly rehearse the presenteditems verbally and recall is determined by the extent to whichthe items can be rehearsed (Baddeley, 1986). This view sug-gests that any variable that reduces rehearsal should impairperformance. With this notion in mind, Baddeley, Thomson,and Buchanan (1975) found that lists composed of long wordswere recalled worse than lists composed of short ones. Thisword-length effect has been used as the primary argument forthe notion that individuals rely on rehearsal processes to recall
items in the correct serial order in simple span tasks. At thesame time, however, other researchers have argued for differentinterpretations of word-length effects, explanations that do notrely on rehearsal processes (see, e.g., Hulme et al., 1997). Thus,several researchers have wondered to what extent these effectsare present in complex span tasks and whether they are of thesame magnitude (e.g., La Pointe & Engle, 1990; Tehan, Hendry,& Kocinski, 2001).
The results from a study conducted by La Pointe and Engle(1990) examining word-length effects in simple and complex spantasks appear in Figure 7. Word-length effects are present in bothsimple and complex span but, like word-frequency effects, weremore pronounced in the simple span than in the complex spantasks. Additionally, performance in the long-word-length condi-tion was fairly similar for both simple and complex span. That is,performance was better in simple span than complex span (as isseen with lists composed of short words), but performance wasnearly identical for simple and complex span when lists werecomposed of long words. Thus, whatever processes are hindered
0
0.1
0.2
0.3
0.4
0.5
0.6
0.7
0.8
0.9
1 2 3 4 5
Separation
Pro
po
rtio
n o
f T
ran
spo
siti
on
sSimple
Complex
Figure 5. Mean number of transposition errors as proportion of total transposition errors as a function of taskand separation. Simple span data are from young adults responding to a list length of six in Experiment 1 ofMcCormack et al. (2000). Complex span data with a list length of five are from Unsworth and Engle (2006b).
0
5
10
15
20
25
30
35
woLhgiH
Word Frequency
# It
ems
Rec
alle
d
Simple
Complex
Figure 6. Mean number of items recalled as a function of word frequency and span task. Simple span data arefrom word span; complex span data are from operation span. Data are from Engle, Nations, and Cantor (1990).
1043SIMPLE AND COMPLEX SPANS
by the inclusion of long words seem to increase the similarity ofperformance on simple and complex span tasks.
Similar word-length effects in simple and complex span (seealso Tehan, Hendry, & Kocinski, 2001) suggest that similar pro-cesses operate in both tasks, although as mentioned previously, theextent to which these processes are involved in each task likelydiffers. Indeed, La Pointe and Engle (1990) commented, “Thiscalls into question any theory that the two tasks measure com-pletely different aspects of temporary memory such as storage andprocessing” (p. 1122).
Articulatory Suppression Effects
Another finding that has been used to argue for the role ofrehearsal processes in simple span tasks is articulatory suppres-sion. This effect refers to the finding that a repetitive articula-tion task (such as repeating “the”) typically worsens perfor-mance as compared with a control condition. According to abasic rehearsal explanation, performance declines because par-
ticipants are unable to subvocally rehearse the items; thus, theitems are forgotten (likely because of decay). However, otherresearchers have argued that articulatory suppression may af-fect recall performance as a result of a mechanism other thanrehearsal (see, for example, Neath & Surprenant, 2003). In anycase, articulatory suppression effects have been demonstratednumerous times in simple span tasks; thus, models of serialorder recall must explain them. If performance on simple andcomplex span tasks is driven by fundamentally different pro-cesses, then articulatory suppression may affect performance insimple, but not in complex, span. However, if the tasks largelymeasure the same basic processes, then performance should besimilarly affected by articulatory suppression manipulations.Relevant data from La Pointe and Engle (1990) are shown inFigure 8. As with word length effects, articulatory suppressionreduced performance in both simple and complex span, but theeffect was more pronounced in the simple than in the complexspan task.
0
10
20
30
40
50
60
70
Short Long
Word Length
# It
ems
Rec
alle
d
Simple
Complex
Figure 7. Mean number of items recalled as a function of word length and span task. Data are an average fromExperiments 1 (reading span) and 2 (operation span) of La Pointe and Engle (1990).
0
5
10
15
20
25
30
35
40
45
50
Absent Present
Articulatory Suppression
# It
ems
Rec
alle
d
Simple
Complex
Figure 8. Mean number of items recalled as a function of presence versus absence of articulatory suppressionand span task. Absent data are an average of long and short words from Experiments 1 (reading span) and 2(operation span), and present data are an average of long and short words from Experiment 3 of La Pointe andEngle (1990).
1044 UNSWORTH AND ENGLE
Additionally, the recall advantage typically seen in the simplespan task was absent when articulatory suppression was presentand recall was equivalent for both simple and complex span. Thissuggests, in conjunction with word-length effects, that whateverprocess is affected by these manipulations (e.g., rehearsal) leads tosimilar performance on simple and complex span tasks. We dis-cuss this point further below.
Phonological Similarity Effects
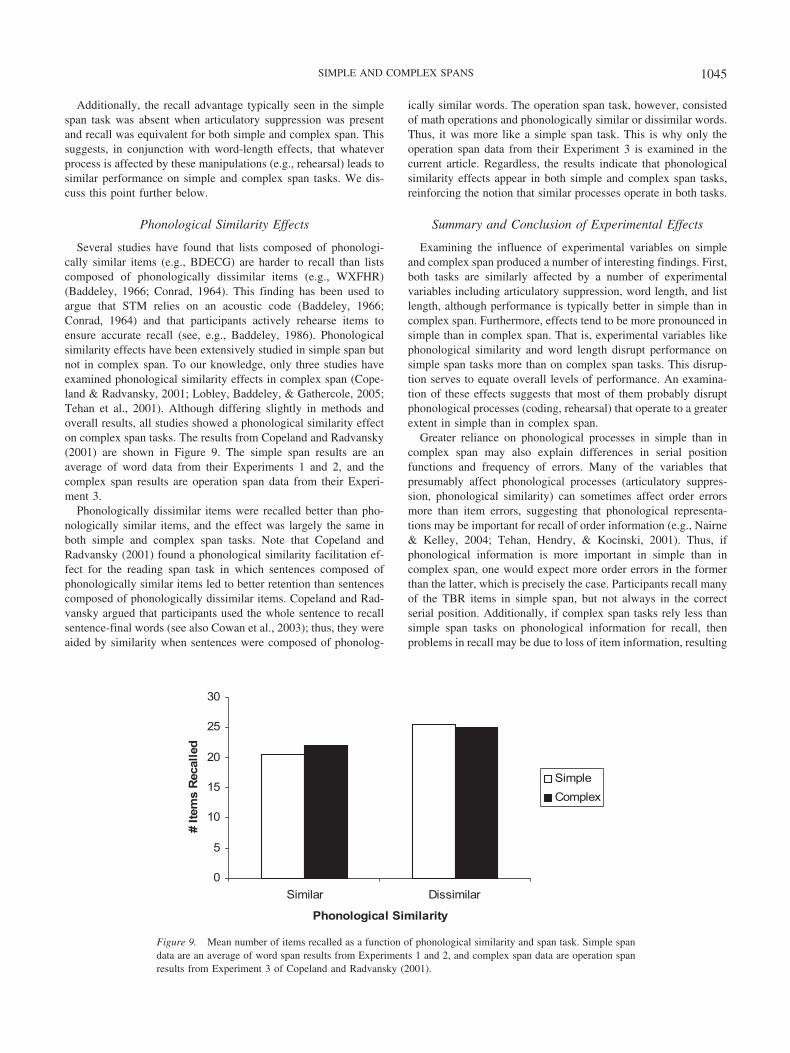
Several studies have found that lists composed of phonologi-cally similar items (e.g., BDECG) are harder to recall than listscomposed of phonologically dissimilar items (e.g., WXFHR)(Baddeley, 1966; Conrad, 1964). This finding has been used toargue that STM relies on an acoustic code (Baddeley, 1966;Conrad, 1964) and that participants actively rehearse items toensure accurate recall (see, e.g., Baddeley, 1986). Phonologicalsimilarity effects have been extensively studied in simple span butnot in complex span. To our knowledge, only three studies haveexamined phonological similarity effects in complex span (Cope-land & Radvansky, 2001; Lobley, Baddeley, & Gathercole, 2005;Tehan et al., 2001). Although differing slightly in methods andoverall results, all studies showed a phonological similarity effecton complex span tasks. The results from Copeland and Radvansky(2001) are shown in Figure 9. The simple span results are anaverage of word data from their Experiments 1 and 2, and thecomplex span results are operation span data from their Experi-ment 3.
Phonologically dissimilar items were recalled better than pho-nologically similar items, and the effect was largely the same inboth simple and complex span tasks. Note that Copeland andRadvansky (2001) found a phonological similarity facilitation ef-fect for the reading span task in which sentences composed ofphonologically similar items led to better retention than sentencescomposed of phonologically dissimilar items. Copeland and Rad-vansky argued that participants used the whole sentence to recallsentence-final words (see also Cowan et al., 2003); thus, they wereaided by similarity when sentences were composed of phonolog-
ically similar words. The operation span task, however, consistedof math operations and phonologically similar or dissimilar words.Thus, it was more like a simple span task. This is why only theoperation span data from their Experiment 3 is examined in thecurrent article. Regardless, the results indicate that phonologicalsimilarity effects appear in both simple and complex span tasks,reinforcing the notion that similar processes operate in both tasks.
Summary and Conclusion of Experimental Effects
Examining the influence of experimental variables on simpleand complex span produced a number of interesting findings. First,both tasks are similarly affected by a number of experimentalvariables including articulatory suppression, word length, and listlength, although performance is typically better in simple than incomplex span. Furthermore, effects tend to be more pronounced insimple than in complex span. That is, experimental variables likephonological similarity and word length disrupt performance onsimple span tasks more than on complex span tasks. This disrup-tion serves to equate overall levels of performance. An examina-tion of these effects suggests that most of them probably disruptphonological processes (coding, rehearsal) that operate to a greaterextent in simple than in complex span.
Greater reliance on phonological processes in simple than incomplex span may also explain differences in serial positionfunctions and frequency of errors. Many of the variables thatpresumably affect phonological processes (articulatory suppres-sion, phonological similarity) can sometimes affect order errorsmore than item errors, suggesting that phonological representa-tions may be important for recall of order information (e.g., Nairne& Kelley, 2004; Tehan, Hendry, & Kocinski, 2001). Thus, ifphonological information is more important in simple than incomplex span, one would expect more order errors in the formerthan the latter, which is precisely the case. Participants recall manyof the TBR items in simple span, but not always in the correctserial position. Additionally, if complex span tasks rely less thansimple span tasks on phonological information for recall, thenproblems in recall may be due to loss of item information, resulting
0
5
10
15
20
25
30
Similar Dissimilar
Phonological Similarity
# It
ems
Rec
alle
d
Simple
Complex
Figure 9. Mean number of items recalled as a function of phonological similarity and span task. Simple spandata are an average of word span results from Experiments 1 and 2, and complex span data are operation spanresults from Experiment 3 of Copeland and Radvansky (2001).
1045SIMPLE AND COMPLEX SPANS
in more item errors (omissions and intrusions) in complex thansimple span, which is again the case. This differential involvementof order and item information in simple and complex span may beone reason why they demonstrate slightly different serial positionfunctions and load on separate factors in factor analytic studies.Furthermore, simple span begins to resemble complex span interms of overall performance when phonological processes aredisrupted. This suggests that simple and complex span tasks likelymeasure the same processes but differ in the extent to which theseprocesses operate in a particular task. Specifically, phonologicalprocesses may be more prominent in simple than in complex span,and other processes (e.g., temporal–contextual search) may bemore prominent in complex than in simple span. However, allprocesses likely operate in both tasks. Thus, we have reached aconclusion very similar to that of Tehan, Hendry, and Kocinski(2001), who noted, “When it comes to performance on simple andcomplex span tasks, the data clearly indicate that both tasks aresupported by a common storage system” (p. 346). As we discusslater, the common storage system likely involves a number ofsubcomponent processes (e.g., rehearsal, maintenance, updating,controlled search) that are needed in both simple and complex spantasks.
Simple and Complex Span as Predictors of Higher OrderCognitive Abilities
The review provided above suggests that simple and complexspan are similarly affected by experimental manipulations (such aslist length and articulatory suppression) and likely involve similarprocesses. Indeed, this claim is bolstered by the fact that simplespan is almost always moderately or strongly correlated withcomplex span (Colom, Shih, Flores-Mendoza, & Quiroga, 2006;Conway et al., 2002; Engle et al., 1999; Kane et al., 2004). Thus,it is parsimonious to conclude that the two tasks largely measurethe same construct (e.g., Colom, Shih, Flores-Mendoza, & Qui-roga, 2006). However, the real debate is not necessarily aboutwhether or not the two tasks measure common processes, butrather whether one task (complex span) measures processes overand above those measured in the other task (simple span). If so, isthis why complex span predicts performance on many measures of
higher order cognition better than simple span? As noted previ-ously, many researchers (including us) have answered this ques-tion in the affirmative. Numerous studies have suggested thatcomplex span is better than simple span at predicting higher ordercognition (e.g., Ackerman, Beier, & Boyle, 2005; Daneman &Merikle, 1996); thus, researchers have concluded that WM is moreimportant in complex cognitive activities than is STM. This con-clusion, however, seems to fly in the face of decades of researchsuggesting that STM does contribute to higher order cognitiveprocesses. As mentioned previously, simple span tasks have longbeen a part of IQ batteries, and previous research has shown thatthey are at least moderately correlated with measures of higherorder cognitive functioning (see, e.g., Beier & Ackerman, 2004;Carroll, 1993).
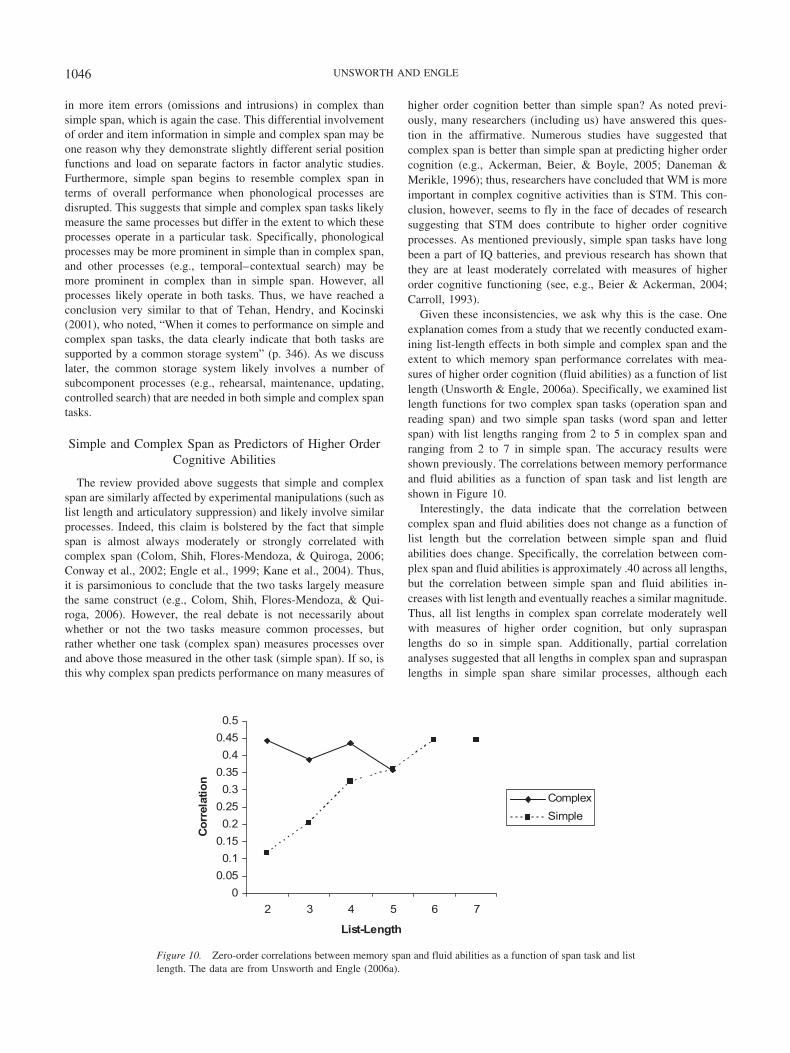
Given these inconsistencies, we ask why this is the case. Oneexplanation comes from a study that we recently conducted exam-ining list-length effects in both simple and complex span and theextent to which memory span performance correlates with mea-sures of higher order cognition (fluid abilities) as a function of listlength (Unsworth & Engle, 2006a). Specifically, we examined listlength functions for two complex span tasks (operation span andreading span) and two simple span tasks (word span and letterspan) with list lengths ranging from 2 to 5 in complex span andranging from 2 to 7 in simple span. The accuracy results wereshown previously. The correlations between memory performanceand fluid abilities as a function of span task and list length areshown in Figure 10.
Interestingly, the data indicate that the correlation betweencomplex span and fluid abilities does not change as a function oflist length but the correlation between simple span and fluidabilities does change. Specifically, the correlation between com-plex span and fluid abilities is approximately .40 across all lengths,but the correlation between simple span and fluid abilities in-creases with list length and eventually reaches a similar magnitude.Thus, all list lengths in complex span correlate moderately wellwith measures of higher order cognition, but only supraspanlengths do so in simple span. Additionally, partial correlationanalyses suggested that all lengths in complex span and supraspanlengths in simple span share similar processes, although each
0
0.05
0.1
0.15
0.2
0.25
0.3
0.35
0.4
0.45
0.5
2 3 4 5 6 7
List-Length
Co
rrel
atio
n
Complex
Simple
Figure 10. Zero-order correlations between memory span and fluid abilities as a function of span task and listlength. The data are from Unsworth and Engle (2006a).
1046 UNSWORTH AND ENGLE
accounted for a small amount of unique variance in fluid abilities.Previous studies examining the differential predictive power ofsimple and complex span tasks may not have measured supraspanlist lengths, leading to differences in the relation between simpleand complex span and higher order cognition.
If this is, indeed, one of the primary reasons that simple spantasks typically have lower and less consistent correlations withmeasures of higher order cognition than complex span tasks, thenwhy have supraspan list lengths been excluded from the data?Several reasons include the nature of the sample, the types of tasksused to measure simple and complex span, the administrationprocedures, and the scoring methods. Here, we explore how scor-ing methods may affect the predictive utility of span tasks.
Although correct responses in simple and complex span taskscan be scored in several different ways (see, e.g., Conway et al.,2005; Friedman & Miyake, 2005), we focus on two of the mostpopular methods. The first method is the “absolute” scoring (ABS)procedure in which a participant’s score is the sum of all perfectlyrecalled list lengths. For example, if an individual recalls 2 itemsin a list of 2, 3 items in a list of 3, and 3 items in a list of 4, thenhis or her absolute span score is 5 (2 � 3 � 0). We have used thismethod extensively in both quasi-experimental and large-scalecorrelational designs (e.g., Engle et al., 1999; Kane, Bleckley,Conway, & Engle, 2001). The second scoring procedure is pro-portion correct scoring (PCS). This score is the proportion of itemsthat a participant recalls in the correct serial position. This methodis used predominantly when examining immediate serial recall ofsupraspan lists. Recently, this procedure has been used by anumber of researchers (including us) to examine individual differ-ences in complex span (Friedman & Miyake, 2004; Kane et al.,2004; Unsworth, Heitz, Schrock, & Engle, 2005).
One reason that we switched to the PCS method is because itdemonstrates better psychometric properties than does the ABSmethod (for detailed discussions, see Conway et al., 2005; Fried-man & Miyake, 2005). Another reason to prefer the PCS methodis that it results in slightly higher correlations with criterion mea-sures than does the ABS method. For instance, in examiningdifferent scoring procedures for the reading span task, Friedmanand Miyake (2005) found that the PCS method, which they called“proportion words,” correlated slightly higher with Verbal SATscores than did the ABS method, which they called “correct setwords,” (rs � .44 and .40, respectively). Friedman and Miyakesuggested that one reason for the discrepant correlations was thatoutliers might be more influential in one scoring method than inthe other. Therefore, Friedman and Miyake reanalyzed the datawith the outliers removed but still found a difference in thecorrelations; in fact, the difference was slightly larger than before(rs � .46 and .35, respectively). On the basis of these findings,Friedman and Miyake (2005; see also Conway et al., 2005) sug-gested that the PCS method may be more sensitive to subtleindividual differences than the ABS method; thus, it correlateswith the criterion measure more highly. With this we completelyagree, albeit for a slightly different reason. We argue that the PCSmethod correlates higher with criterion measures than does theABS method because of a part–whole relation (e.g., Carroll, 1988;J. Cohen & Cohen, 1983). That is, the PCS method contains thesame information as the ABS method plus additional informationfrom items on lists that were not perfectly recalled. This additionalinformation may be an important source of variance that is notincluded when the ABS method is used. It may include individual
differences in the ability to effectively retrieve items from supra-span lists or individual differences in the types of errors thatindividuals make on the span tasks.
Additional limitations of the ABS method are apparent whenconsidering some of the experimental effects discussed previously.Specifically, one cannot examine either serial position functions orerror responses using the ABS method because only trials in whichall items are recalled in the correct position are included. Anyinformation provided by differences in serial position functions orrecall errors is effectively lost when using the ABS procedure.Thus, the binary nature (correct vs. incorrect) of the methodreduces the overall level of variability because variability from thelongest lists is excluded. The continuous nature of the PCSmethod includes variability from all list lengths; thus, the PCSis more likely than the ABS method to reveal subtle individualdifferences.1
Meta-Analysis of the Predictive Power of Simple andComplex Span
Much of the research demonstrating a distinction between sim-ple and complex span in terms of predicting measures of higherorder cognition has generally relied on something similar to theABS procedure. For instance, Engle et al. (1999) and Conway etal. (2002) used the ABS procedure, and both found that a latentvariable composed of variance common to complex span taskspredicted fluid abilities better than a latent variable composed ofvariance common to simple span tasks. In contrast, studies sug-gesting similarities between simple and complex span have tendedto rely on something similar to the PCS method (e.g., Unsworth &Engle, 2006a). In order to examine precisely how simple andcomplex span relate to measures of higher order cognition, weconducted a meta-analysis. Specifically, we examined correlationsbetween span tasks and measures of higher order cognition (verbaland spatial abilities) for both the ABS and the PCS scoringmethods.
Literature Search
The studies included in our meta-analysis were a subset of thoseused in previous meta-analyses plus several recently publishedstudies. A total of 22 studies met our criteria for inclusion (seebelow); 13 were used in previous meta-analyses (see, e.g., Acker-man, Beier, & Boyle, 2005; Daneman & Merikle, 1996; Mukunda& Hall, 1992) and 8 were recently published studies (Colom,Abad, Rebollo, & Shih, 2005; Hambrick, 2003; Kane et al., 2004;Lustig, Hasher, & May, 2001, young adults only; Mackintosh &Bennett, 2003; Su� et al., 2002; Unsworth & Engle, 2005; andUnsworth et al., 2005). Additionally, we included one study(Crawford & Stankov, 1983) that had not appeared in previousmeta-analyses but met our inclusion criteria. (All of the studies thatwere included in our meta-analysis are designated as such in theReferences section.)
Criteria for inclusion. Several excellent meta-analyses of re-lations among WM, STM, and higher order cognition have alreadybeen published (Ackerman et al., 2005; Daneman & Merikle,
1 We thank Oliver Wilhelm for initially drawing our attention to themerits of the PCS method.
1047SIMPLE AND COMPLEX SPANS
1996; Mukunda & Hall, 1992). Thus, we restricted our focus tostudies that specifically examined simple and/or complex spantasks in young adults. We did not examine other putative WM orSTM tasks, such as running memory span, memory updating, andmental counters. This was done because the specific question inthis article is whether complex and simple span (as measures ofWM and STM, respectively) represent similar or different con-structs. Additionally, only studies with young adults (typicallyages 17 to 35 years) were included because of differences that mayarise when examining memory span performance in children or oldadults. Additionally, as mentioned previously, studies were in-cluded only if it was clear that either the ABS or the PCS methodwas used to score the data. Using these criteria, several prominentWM studies were excluded, among these, Daneman and Carpenter(1980) and Turner and Engle (1989). Finally, reading comprehen-sion and spatial/matrix reasoning have been the two most studiedmeasures of higher order cognition associated with complex andsimple span tasks; thus, we included only studies that used mea-sures of verbal/reading comprehension or spatial/matrix reasoning.Thus, our inclusion criteria were the following:
1. The study had to clearly assess either simple or complex span;
2. The study had to have data from only young adults (17 to 35 yearsof age);
3. The study had to use either the ABS or the PCS scoring method;and
4. The criterion measure in the study had to be either verbal compre-hension or spatial/matrix reasoning. For verbal comprehension, themeasures included the Nelson–Denny Reading Comprehension Test,the Verbal SAT, and other tasks variously labeled as reading com-prehension. The Verbal SAT measures more than reading compre-hension; thus, we labeled this as verbal comprehension. Studies thatmeasured vocabulary alone were not used. For spatial/matrix reason-ing, the tasks included the Raven Progressive Matrices (Raven,Raven, & Court, 1998; both standard and advanced), Cattell’s CultureFair Test (Cattell, 1973), the Wechsler Abbreviated Scale of Intelli-gence (WASI), Matrix Reasoning subtest (Wechsler, 1999), and theBeta Examination (3rd ed.; Beta III), Matrix Reasoning subtest(Kellogg & Morton, 1999).
Clearly these criteria drastically reduced the number of usablestudies; however, much of the previous research arguing for a
distinction between simple and complex span has made this dis-tinction on the basis of only simple and complex span tasks,primarily in young adults, and with verbal comprehension orspatial/matrix reasoning abilities as the criterion measure.
Aggregation of within-sample effect sizes. Several studies re-ported multiple correlations between the span tasks and the abilitymeasures. Therefore, correlations from these studies were aggre-gated, and the mean correlation was used. Mean correlations fromthese studies were obtained with Fisher’s r-to-z transformation.
Correlational analysis. The procedure described by Hedgesand Olkin (1985) was used to compute meta-analytic estimates ofeffect size. Specifically, effect size for each memory/ability cor-relation was computed as the weighted (by sample size) average ofall correlations entering into the computation. The estimated pop-ulation correlation (�) was obtained with a z-to-r transformation ofthe estimated effect size.
Confidence intervals. Ninety-five percent confidence intervals(CIs) were calculated with formulas described by Hedges andOlkin (1985).
Results and Conclusions
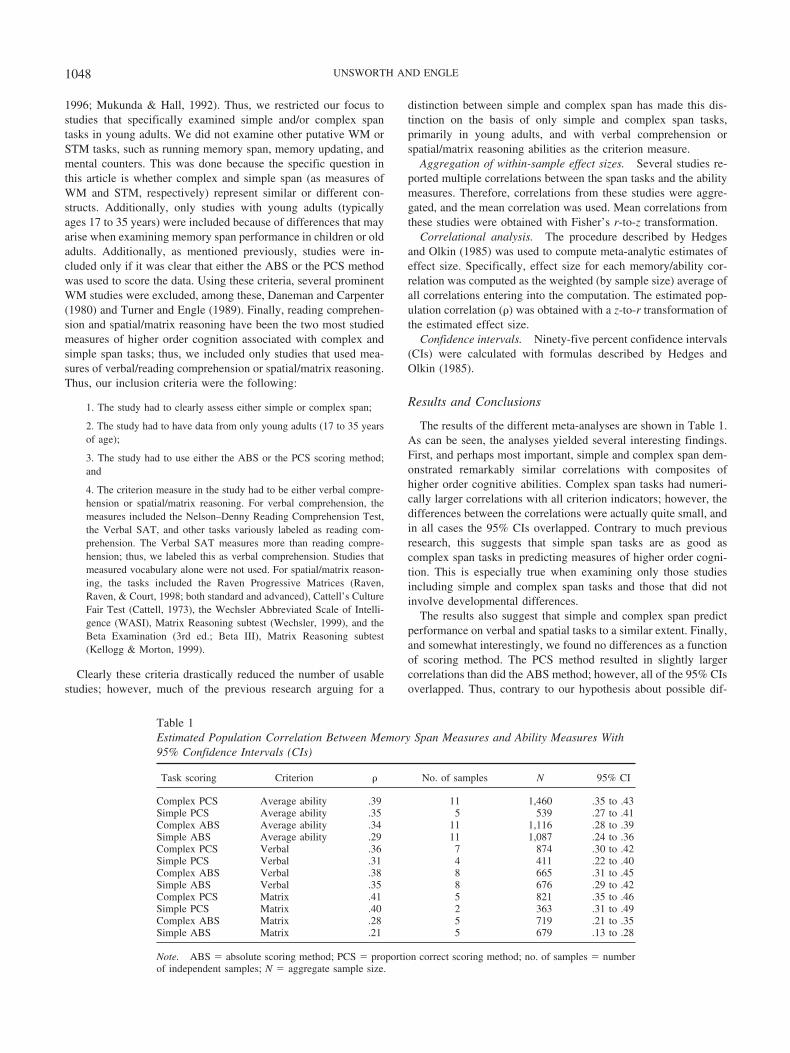
The results of the different meta-analyses are shown in Table 1.As can be seen, the analyses yielded several interesting findings.First, and perhaps most important, simple and complex span dem-onstrated remarkably similar correlations with composites ofhigher order cognitive abilities. Complex span tasks had numeri-cally larger correlations with all criterion indicators; however, thedifferences between the correlations were actually quite small, andin all cases the 95% CIs overlapped. Contrary to much previousresearch, this suggests that simple span tasks are as good ascomplex span tasks in predicting measures of higher order cogni-tion. This is especially true when examining only those studiesincluding simple and complex span tasks and those that did notinvolve developmental differences.
The results also suggest that simple and complex span predictperformance on verbal and spatial tasks to a similar extent. Finally,and somewhat interestingly, we found no differences as a functionof scoring method. The PCS method resulted in slightly largercorrelations than did the ABS method; however, all of the 95% CIsoverlapped. Thus, contrary to our hypothesis about possible dif-
Table 1Estimated Population Correlation Between Memory Span Measures and Ability Measures With95% Confidence Intervals (CIs)
Task scoring Criterion � No. of samples N 95% CI
Complex PCS Average ability .39 11 1,460 .35 to .43Simple PCS Average ability .35 5 539 .27 to .41Complex ABS Average ability .34 11 1,116 .28 to .39Simple ABS Average ability .29 11 1,087 .24 to .36Complex PCS Verbal .36 7 874 .30 to .42Simple PCS Verbal .31 4 411 .22 to .40Complex ABS Verbal .38 8 665 .31 to .45Simple ABS Verbal .35 8 676 .29 to .42Complex PCS Matrix .41 5 821 .35 to .46Simple PCS Matrix .40 2 363 .31 to .49Complex ABS Matrix .28 5 719 .21 to .35Simple ABS Matrix .21 5 679 .13 to .28
Note. ABS � absolute scoring method; PCS � proportion correct scoring method; no. of samples � numberof independent samples; N � aggregate sample size.
1048 UNSWORTH AND ENGLE
ferences between the ABS and PCS methods, the meta-analysissuggested only minor differences. In fact, the only difference thatwe found was that the PCS method had a higher magnitudecorrelation with spatial/matrix reasoning than did the ABS method.
Overall, the results from the meta-analysis were fairly straight-forward in suggesting that simple and complex span correlatesimilarly with higher order cognition when using fairly strictinclusion criteria involving only those studies with simple orcomplex span, ABS or PCS scoring methods, young adults, andcriterion measures of verbal comprehension or spatial/matrix rea-soning. However, as noted above, our hypothesis that differencesin scoring method would influence the correlations was not sup-ported. Why might this be the case? Two possibilities seem mostrelevant. First and most obvious, scoring procedure may have noinfluence on the magnitude of correlations between span andcomplex cognition. This would mean that Unsworth and Engle’s(2006a) results suggesting differences as a function of list lengthwere an anomaly. Second, perhaps differences in scoring proce-dures do matter, but these differences were somehow obscured byidiosyncrasies in the studies that were included in our meta-analysis.Although we attempted to select studies that used the same basicmethodology, perhaps other factors (e.g., nature of the sample, spe-cific tasks, group vs. individual administration) influenced some ofthe correlations. Indeed, one large difference among the studies ex-amined here was that some used a procedure in which list lengthswere presented in an ascending order (e.g., Lustig, Hasher, & May,2001), whereas others used a procedure in which list lengths werepresented randomly (e.g., Kane et al., 2004). Therefore, in order to testour scoring hypothesis more directly, we decided to rescore andreanalyze one data set that has previously been used to argue fordifferences between WM and STM and their relation to higher ordercognition (i.e., Engle et al., 1999).
Rescoring and Reanalyses of Previous Data Sets
Rescoring and Reanalysis of Engle, Tuholski, Laughlin,and Conway (1999)
Engle et al. (1999) examined relations among WM, STM, andgeneral fluid intelligence (gF) with a latent variable analysis ofcomplex span, simple span, and pencil-and-paper measures ofmatrix reasoning. These included three complex span tasks, threesimple span tasks, two measures of gF, several other putativemeasures of WM, and participants’ SAT scores. Engle et al. foundthat latent variables consisting of complex and simple span taskswere strongly related (.68); however, complex span was morehighly related to gF than was simple span. Moreover, the structuralequation models (SEMs) suggested that the correlation betweensimple span and gF was mediated by performance on complexspan. Accordingly, Engle et al. argued that WM is more importantfor higher order cognition than is STM, echoing previous claims(e.g., Daneman & Carpenter, 1980; Daneman & Merikle, 1996;Turner & Engle, 1989). However, all of the span tasks in the Engleet al. (1999) study were scored with the ABS method. Thus, datafrom the longest list lengths on the simple span tasks were usuallyexcluded. If, as argued previously, variability from these long listsis important in predicting performance on higher order cognitivetasks (see Unsworth & Engle, 2006a), then using the ABS methodlikely reduced the amount of variability from these list lengths andattenuated the correlations. If the PCS method had been used, an
entirely different pattern of results may have emerged such thatsimple and complex span predicted higher order cognition simi-larly. In addition, and perhaps more importantly, results derivedfrom the PCS method may indicate that complex span does notmediate the relation between simple span and higher order cogni-tion (specifically, gF). That is, much has been made of the fact thatcomplex span tends to predict variance in measures of higher ordercognition over and above that predicted by simple span (Bayliss,Jarrold, Gunn, & Baddeley, 2003; Conway et al., 2002; Engle etal., 1999), suggesting that additional important processes (execu-tive functions) are tapped by complex span, but not simple span,tasks. In order to examine these issues more thoroughly, weperformed several confirmatory factor analyses (CFAs) and exam-ined several SEMs using the original data from Engle et al. (1999).Additionally, we tested the same models after rescoring all of thespan tasks using the PCS method. This allowed us to directlycompare the influence of scoring methods on the correlationswithin the same data set.
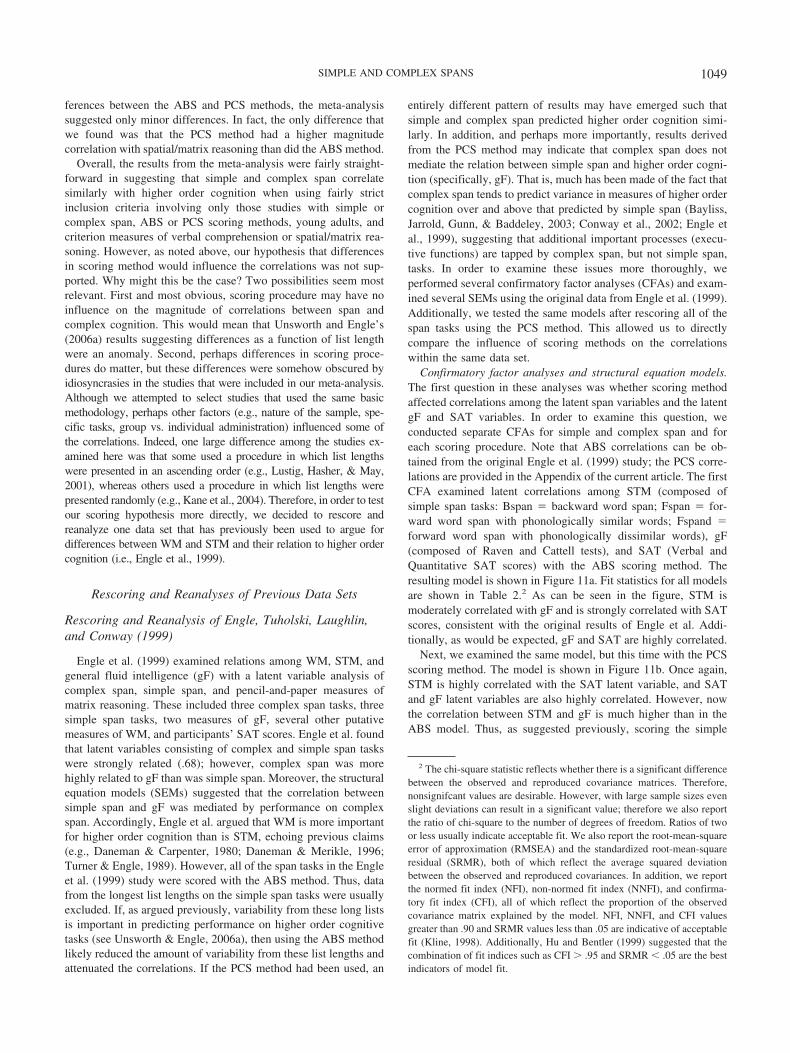
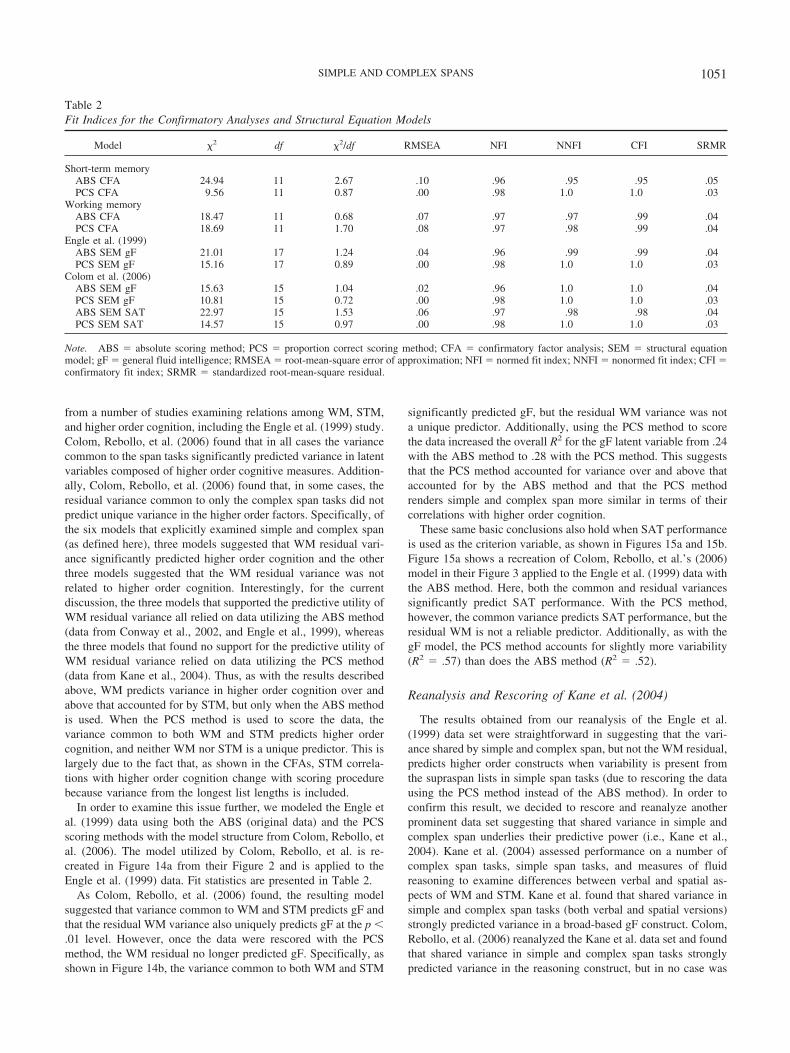
Confirmatory factor analyses and structural equation models.The first question in these analyses was whether scoring methodaffected correlations among the latent span variables and the latentgF and SAT variables. In order to examine this question, weconducted separate CFAs for simple and complex span and foreach scoring procedure. Note that ABS correlations can be ob-tained from the original Engle et al. (1999) study; the PCS corre-lations are provided in the Appendix of the current article. The firstCFA examined latent correlations among STM (composed ofsimple span tasks: Bspan � backward word span; Fspan � for-ward word span with phonologically similar words; Fspand �forward word span with phonologically dissimilar words), gF(composed of Raven and Cattell tests), and SAT (Verbal andQuantitative SAT scores) with the ABS scoring method. Theresulting model is shown in Figure 11a. Fit statistics for all modelsare shown in Table 2.2 As can be seen in the figure, STM ismoderately correlated with gF and is strongly correlated with SATscores, consistent with the original results of Engle et al. Addi-tionally, as would be expected, gF and SAT are highly correlated.
Next, we examined the same model, but this time with the PCSscoring method. The model is shown in Figure 11b. Once again,STM is highly correlated with the SAT latent variable, and SATand gF latent variables are also highly correlated. However, nowthe correlation between STM and gF is much higher than in theABS model. Thus, as suggested previously, scoring the simple
2 The chi-square statistic reflects whether there is a significant differencebetween the observed and reproduced covariance matrices. Therefore,nonsignifcant values are desirable. However, with large sample sizes evenslight deviations can result in a significant value; therefore we also reportthe ratio of chi-square to the number of degrees of freedom. Ratios of twoor less usually indicate acceptable fit. We also report the root-mean-squareerror of approximation (RMSEA) and the standardized root-mean-squareresidual (SRMR), both of which reflect the average squared deviationbetween the observed and reproduced covariances. In addition, we reportthe normed fit index (NFI), non-normed fit index (NNFI), and confirma-tory fit index (CFI), all of which reflect the proportion of the observedcovariance matrix explained by the model. NFI, NNFI, and CFI valuesgreater than .90 and SRMR values less than .05 are indicative of acceptablefit (Kline, 1998). Additionally, Hu and Bentler (1999) suggested that thecombination of fit indices such as CFI � .95 and SRMR � .05 are the bestindicators of model fit.
1049SIMPLE AND COMPLEX SPANS
span tasks differently and allowing for variance from long listlengths increased the correlations among the STM and higherorder constructs.
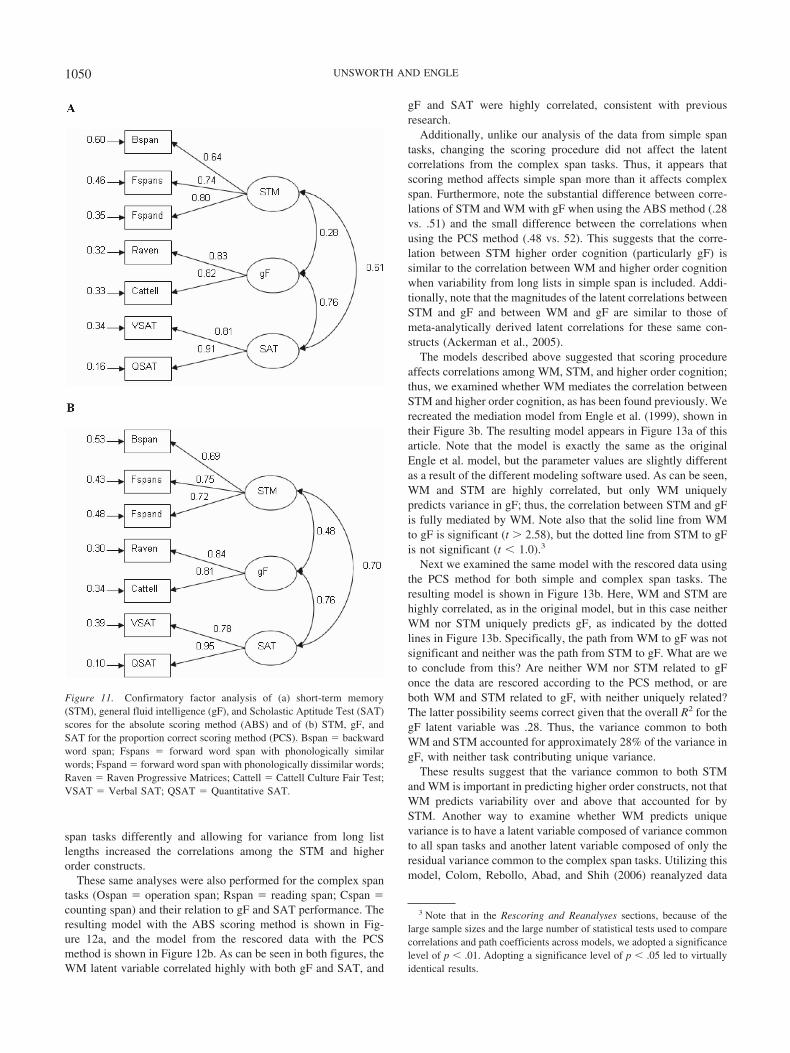
These same analyses were also performed for the complex spantasks (Ospan � operation span; Rspan � reading span; Cspan �counting span) and their relation to gF and SAT performance. Theresulting model with the ABS scoring method is shown in Fig-ure 12a, and the model from the rescored data with the PCSmethod is shown in Figure 12b. As can be seen in both figures, theWM latent variable correlated highly with both gF and SAT, and
gF and SAT were highly correlated, consistent with previousresearch.
Additionally, unlike our analysis of the data from simple spantasks, changing the scoring procedure did not affect the latentcorrelations from the complex span tasks. Thus, it appears thatscoring method affects simple span more than it affects complexspan. Furthermore, note the substantial difference between corre-lations of STM and WM with gF when using the ABS method (.28vs. .51) and the small difference between the correlations whenusing the PCS method (.48 vs. 52). This suggests that the corre-lation between STM higher order cognition (particularly gF) issimilar to the correlation between WM and higher order cognitionwhen variability from long lists in simple span is included. Addi-tionally, note that the magnitudes of the latent correlations betweenSTM and gF and between WM and gF are similar to those ofmeta-analytically derived latent correlations for these same con-structs (Ackerman et al., 2005).
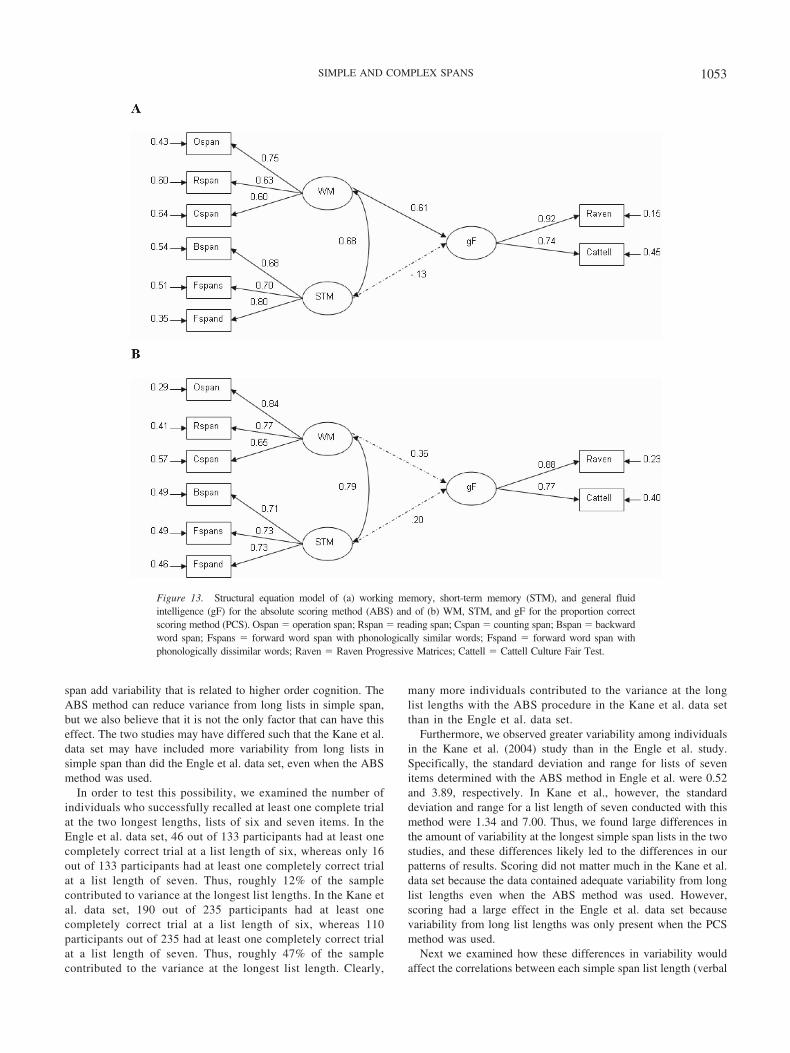
The models described above suggested that scoring procedureaffects correlations among WM, STM, and higher order cognition;thus, we examined whether WM mediates the correlation betweenSTM and higher order cognition, as has been found previously. Werecreated the mediation model from Engle et al. (1999), shown intheir Figure 3b. The resulting model appears in Figure 13a of thisarticle. Note that the model is exactly the same as the originalEngle et al. model, but the parameter values are slightly differentas a result of the different modeling software used. As can be seen,WM and STM are highly correlated, but only WM uniquelypredicts variance in gF; thus, the correlation between STM and gFis fully mediated by WM. Note also that the solid line from WMto gF is significant (t � 2.58), but the dotted line from STM to gFis not significant (t � 1.0).3
Next we examined the same model with the rescored data usingthe PCS method for both simple and complex span tasks. Theresulting model is shown in Figure 13b. Here, WM and STM arehighly correlated, as in the original model, but in this case neitherWM nor STM uniquely predicts gF, as indicated by the dottedlines in Figure 13b. Specifically, the path from WM to gF was notsignificant and neither was the path from STM to gF. What are weto conclude from this? Are neither WM nor STM related to gFonce the data are rescored according to the PCS method, or areboth WM and STM related to gF, with neither uniquely related?The latter possibility seems correct given that the overall R2 for thegF latent variable was .28. Thus, the variance common to bothWM and STM accounted for approximately 28% of the variance ingF, with neither task contributing unique variance.
These results suggest that the variance common to both STMand WM is important in predicting higher order constructs, not thatWM predicts variability over and above that accounted for bySTM. Another way to examine whether WM predicts uniquevariance is to have a latent variable composed of variance commonto all span tasks and another latent variable composed of only theresidual variance common to the complex span tasks. Utilizing thismodel, Colom, Rebollo, Abad, and Shih (2006) reanalyzed data
3 Note that in the Rescoring and Reanalyses sections, because of thelarge sample sizes and the large number of statistical tests used to comparecorrelations and path coefficients across models, we adopted a significancelevel of p � .01. Adopting a significance level of p � .05 led to virtuallyidentical results.
Figure 11. Confirmatory factor analysis of (a) short-term memory(STM), general fluid intelligence (gF), and Scholastic Aptitude Test (SAT)scores for the absolute scoring method (ABS) and of (b) STM, gF, andSAT for the proportion correct scoring method (PCS). Bspan � backwardword span; Fspans � forward word span with phonologically similarwords; Fspand � forward word span with phonologically dissimilar words;Raven � Raven Progressive Matrices; Cattell � Cattell Culture Fair Test;VSAT � Verbal SAT; QSAT � Quantitative SAT.
1050 UNSWORTH AND ENGLE
from a number of studies examining relations among WM, STM,and higher order cognition, including the Engle et al. (1999) study.Colom, Rebollo, et al. (2006) found that in all cases the variancecommon to the span tasks significantly predicted variance in latentvariables composed of higher order cognitive measures. Addition-ally, Colom, Rebollo, et al. (2006) found that, in some cases, theresidual variance common to only the complex span tasks did notpredict unique variance in the higher order factors. Specifically, ofthe six models that explicitly examined simple and complex span(as defined here), three models suggested that WM residual vari-ance significantly predicted higher order cognition and the otherthree models suggested that the WM residual variance was notrelated to higher order cognition. Interestingly, for the currentdiscussion, the three models that supported the predictive utility ofWM residual variance all relied on data utilizing the ABS method(data from Conway et al., 2002, and Engle et al., 1999), whereasthe three models that found no support for the predictive utility ofWM residual variance relied on data utilizing the PCS method(data from Kane et al., 2004). Thus, as with the results describedabove, WM predicts variance in higher order cognition over andabove that accounted for by STM, but only when the ABS methodis used. When the PCS method is used to score the data, thevariance common to both WM and STM predicts higher ordercognition, and neither WM nor STM is a unique predictor. This islargely due to the fact that, as shown in the CFAs, STM correla-tions with higher order cognition change with scoring procedurebecause variance from the longest list lengths is included.
In order to examine this issue further, we modeled the Engle etal. (1999) data using both the ABS (original data) and the PCSscoring methods with the model structure from Colom, Rebollo, etal. (2006). The model utilized by Colom, Rebollo, et al. is re-created in Figure 14a from their Figure 2 and is applied to theEngle et al. (1999) data. Fit statistics are presented in Table 2.
As Colom, Rebollo, et al. (2006) found, the resulting modelsuggested that variance common to WM and STM predicts gF andthat the residual WM variance also uniquely predicts gF at the p �.01 level. However, once the data were rescored with the PCSmethod, the WM residual no longer predicted gF. Specifically, asshown in Figure 14b, the variance common to both WM and STM
significantly predicted gF, but the residual WM variance was nota unique predictor. Additionally, using the PCS method to scorethe data increased the overall R2 for the gF latent variable from .24with the ABS method to .28 with the PCS method. This suggeststhat the PCS method accounted for variance over and above thataccounted for by the ABS method and that the PCS methodrenders simple and complex span more similar in terms of theircorrelations with higher order cognition.
These same basic conclusions also hold when SAT performanceis used as the criterion variable, as shown in Figures 15a and 15b.Figure 15a shows a recreation of Colom, Rebollo, et al.’s (2006)model in their Figure 3 applied to the Engle et al. (1999) data withthe ABS method. Here, both the common and residual variancessignificantly predict SAT performance. With the PCS method,however, the common variance predicts SAT performance, but theresidual WM is not a reliable predictor. Additionally, as with thegF model, the PCS method accounts for slightly more variability(R2 � .57) than does the ABS method (R2 � .52).
Reanalysis and Rescoring of Kane et al. (2004)
The results obtained from our reanalysis of the Engle et al.(1999) data set were straightforward in suggesting that the vari-ance shared by simple and complex span, but not the WM residual,predicts higher order constructs when variability is present fromthe supraspan lists in simple span tasks (due to rescoring the datausing the PCS method instead of the ABS method). In order toconfirm this result, we decided to rescore and reanalyze anotherprominent data set suggesting that shared variance in simple andcomplex span underlies their predictive power (i.e., Kane et al.,2004). Kane et al. (2004) assessed performance on a number ofcomplex span tasks, simple span tasks, and measures of fluidreasoning to examine differences between verbal and spatial as-pects of WM and STM. Kane et al. found that shared variance insimple and complex span tasks (both verbal and spatial versions)strongly predicted variance in a broad-based gF construct. Colom,Rebollo, et al. (2006) reanalyzed the Kane et al. data set and foundthat shared variance in simple and complex span tasks stronglypredicted variance in the reasoning construct, but in no case was
Table 2Fit Indices for the Confirmatory Analyses and Structural Equation Models
Model 2 df 2/df RMSEA NFI NNFI CFI SRMR
Short-term memoryABS CFA 24.94 11 2.67 .10 .96 .95 .95 .05PCS CFA 9.56 11 0.87 .00 .98 1.0 1.0 .03
Working memoryABS CFA 18.47 11 0.68 .07 .97 .97 .99 .04PCS CFA 18.69 11 1.70 .08 .97 .98 .99 .04
Engle et al. (1999)ABS SEM gF 21.01 17 1.24 .04 .96 .99 .99 .04PCS SEM gF 15.16 17 0.89 .00 .98 1.0 1.0 .03
Colom et al. (2006)ABS SEM gF 15.63 15 1.04 .02 .96 1.0 1.0 .04PCS SEM gF 10.81 15 0.72 .00 .98 1.0 1.0 .03ABS SEM SAT 22.97 15 1.53 .06 .97 .98 .98 .04PCS SEM SAT 14.57 15 0.97 .00 .98 1.0 1.0 .03
Note. ABS � absolute scoring method; PCS � proportion correct scoring method; CFA � confirmatory factor analysis; SEM � structural equationmodel; gF � general fluid intelligence; RMSEA � root-mean-square error of approximation; NFI � normed fit index; NNFI � nonormed fit index; CFI �confirmatory fit index; SRMR � standardized root-mean-square residual.
1051SIMPLE AND COMPLEX SPANS
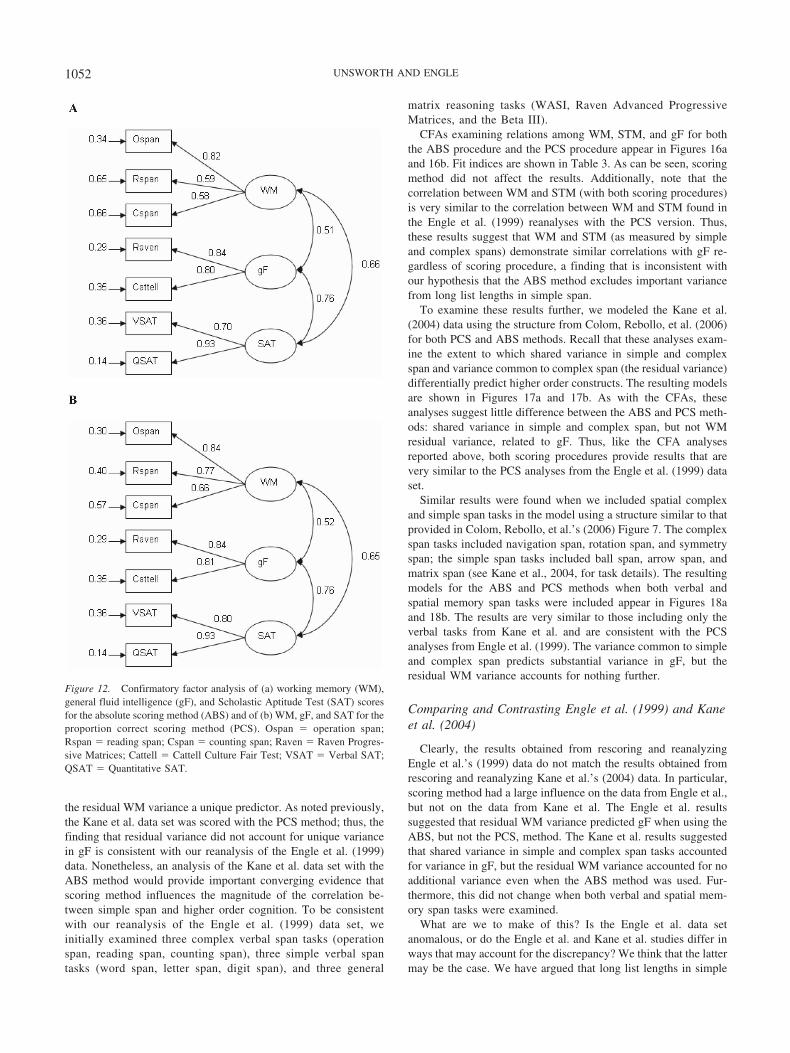
the residual WM variance a unique predictor. As noted previously,the Kane et al. data set was scored with the PCS method; thus, thefinding that residual variance did not account for unique variancein gF is consistent with our reanalysis of the Engle et al. (1999)data. Nonetheless, an analysis of the Kane et al. data set with theABS method would provide important converging evidence thatscoring method influences the magnitude of the correlation be-tween simple span and higher order cognition. To be consistentwith our reanalysis of the Engle et al. (1999) data set, weinitially examined three complex verbal span tasks (operationspan, reading span, counting span), three simple verbal spantasks (word span, letter span, digit span), and three general
matrix reasoning tasks (WASI, Raven Advanced ProgressiveMatrices, and the Beta III).
CFAs examining relations among WM, STM, and gF for boththe ABS procedure and the PCS procedure appear in Figures 16aand 16b. Fit indices are shown in Table 3. As can be seen, scoringmethod did not affect the results. Additionally, note that thecorrelation between WM and STM (with both scoring procedures)is very similar to the correlation between WM and STM found inthe Engle et al. (1999) reanalyses with the PCS version. Thus,these results suggest that WM and STM (as measured by simpleand complex spans) demonstrate similar correlations with gF re-gardless of scoring procedure, a finding that is inconsistent withour hypothesis that the ABS method excludes important variancefrom long list lengths in simple span.
To examine these results further, we modeled the Kane et al.(2004) data using the structure from Colom, Rebollo, et al. (2006)for both PCS and ABS methods. Recall that these analyses exam-ine the extent to which shared variance in simple and complexspan and variance common to complex span (the residual variance)differentially predict higher order constructs. The resulting modelsare shown in Figures 17a and 17b. As with the CFAs, theseanalyses suggest little difference between the ABS and PCS meth-ods: shared variance in simple and complex span, but not WMresidual variance, related to gF. Thus, like the CFA analysesreported above, both scoring procedures provide results that arevery similar to the PCS analyses from the Engle et al. (1999) dataset.
Similar results were found when we included spatial complexand simple span tasks in the model using a structure similar to thatprovided in Colom, Rebollo, et al.’s (2006) Figure 7. The complexspan tasks included navigation span, rotation span, and symmetryspan; the simple span tasks included ball span, arrow span, andmatrix span (see Kane et al., 2004, for task details). The resultingmodels for the ABS and PCS methods when both verbal andspatial memory span tasks were included appear in Figures 18aand 18b. The results are very similar to those including only theverbal tasks from Kane et al. and are consistent with the PCSanalyses from Engle et al. (1999). The variance common to simpleand complex span predicts substantial variance in gF, but theresidual WM variance accounts for nothing further.
Comparing and Contrasting Engle et al. (1999) and Kaneet al. (2004)
Clearly, the results obtained from rescoring and reanalyzingEngle et al.’s (1999) data do not match the results obtained fromrescoring and reanalyzing Kane et al.’s (2004) data. In particular,scoring method had a large influence on the data from Engle et al.,but not on the data from Kane et al. The Engle et al. resultssuggested that residual WM variance predicted gF when using theABS, but not the PCS, method. The Kane et al. results suggestedthat shared variance in simple and complex span tasks accountedfor variance in gF, but the residual WM variance accounted for noadditional variance even when the ABS method was used. Fur-thermore, this did not change when both verbal and spatial mem-ory span tasks were examined.
What are we to make of this? Is the Engle et al. data setanomalous, or do the Engle et al. and Kane et al. studies differ inways that may account for the discrepancy? We think that the lattermay be the case. We have argued that long list lengths in simple
Figure 12. Confirmatory factor analysis of (a) working memory (WM),general fluid intelligence (gF), and Scholastic Aptitude Test (SAT) scoresfor the absolute scoring method (ABS) and of (b) WM, gF, and SAT for theproportion correct scoring method (PCS). Ospan � operation span;Rspan � reading span; Cspan � counting span; Raven � Raven Progres-sive Matrices; Cattell � Cattell Culture Fair Test; VSAT � Verbal SAT;QSAT � Quantitative SAT.
1052 UNSWORTH AND ENGLE
span add variability that is related to higher order cognition. TheABS method can reduce variance from long lists in simple span,but we also believe that it is not the only factor that can have thiseffect. The two studies may have differed such that the Kane et al.data set may have included more variability from long lists insimple span than did the Engle et al. data set, even when the ABSmethod was used.
In order to test this possibility, we examined the number ofindividuals who successfully recalled at least one complete trialat the two longest lengths, lists of six and seven items. In theEngle et al. data set, 46 out of 133 participants had at least onecompletely correct trial at a list length of six, whereas only 16out of 133 participants had at least one completely correct trialat a list length of seven. Thus, roughly 12% of the samplecontributed to variance at the longest list lengths. In the Kane etal. data set, 190 out of 235 participants had at least onecompletely correct trial at a list length of six, whereas 110participants out of 235 had at least one completely correct trialat a list length of seven. Thus, roughly 47% of the samplecontributed to the variance at the longest list length. Clearly,
many more individuals contributed to the variance at the longlist lengths with the ABS procedure in the Kane et al. data setthan in the Engle et al. data set.
Furthermore, we observed greater variability among individualsin the Kane et al. (2004) study than in the Engle et al. study.Specifically, the standard deviation and range for lists of sevenitems determined with the ABS method in Engle et al. were 0.52and 3.89, respectively. In Kane et al., however, the standarddeviation and range for a list length of seven conducted with thismethod were 1.34 and 7.00. Thus, we found large differences inthe amount of variability at the longest simple span lists in the twostudies, and these differences likely led to the differences in ourpatterns of results. Scoring did not matter much in the Kane et al.data set because the data contained adequate variability from longlist lengths even when the ABS method was used. However,scoring had a large effect in the Engle et al. data set becausevariability from long list lengths was only present when the PCSmethod was used.
Next we examined how these differences in variability wouldaffect the correlations between each simple span list length (verbal
Figure 13. Structural equation model of (a) working memory, short-term memory (STM), and general fluidintelligence (gF) for the absolute scoring method (ABS) and of (b) WM, STM, and gF for the proportion correctscoring method (PCS). Ospan � operation span; Rspan � reading span; Cspan � counting span; Bspan � backwardword span; Fspans � forward word span with phonologically similar words; Fspand � forward word span withphonologically dissimilar words; Raven � Raven Progressive Matrices; Cattell � Cattell Culture Fair Test.
1053SIMPLE AND COMPLEX SPANS
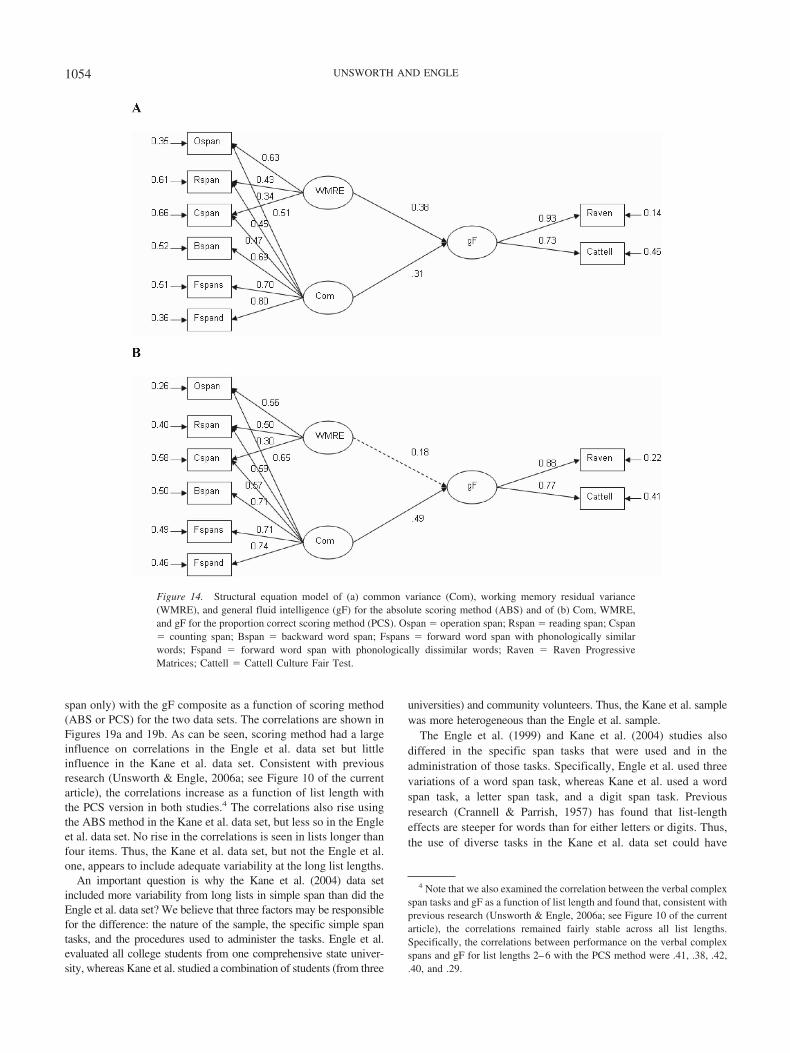
span only) with the gF composite as a function of scoring method(ABS or PCS) for the two data sets. The correlations are shown inFigures 19a and 19b. As can be seen, scoring method had a largeinfluence on correlations in the Engle et al. data set but littleinfluence in the Kane et al. data set. Consistent with previousresearch (Unsworth & Engle, 2006a; see Figure 10 of the currentarticle), the correlations increase as a function of list length withthe PCS version in both studies.4 The correlations also rise usingthe ABS method in the Kane et al. data set, but less so in the Engleet al. data set. No rise in the correlations is seen in lists longer thanfour items. Thus, the Kane et al. data set, but not the Engle et al.one, appears to include adequate variability at the long list lengths.
An important question is why the Kane et al. (2004) data setincluded more variability from long lists in simple span than did theEngle et al. data set? We believe that three factors may be responsiblefor the difference: the nature of the sample, the specific simple spantasks, and the procedures used to administer the tasks. Engle et al.evaluated all college students from one comprehensive state univer-sity, whereas Kane et al. studied a combination of students (from three
universities) and community volunteers. Thus, the Kane et al. samplewas more heterogeneous than the Engle et al. sample.
The Engle et al. (1999) and Kane et al. (2004) studies alsodiffered in the specific span tasks that were used and in theadministration of those tasks. Specifically, Engle et al. used threevariations of a word span task, whereas Kane et al. used a wordspan task, a letter span task, and a digit span task. Previousresearch (Crannell & Parrish, 1957) has found that list-lengtheffects are steeper for words than for either letters or digits. Thus,the use of diverse tasks in the Kane et al. data set could have
4 Note that we also examined the correlation between the verbal complexspan tasks and gF as a function of list length and found that, consistent withprevious research (Unsworth & Engle, 2006a; see Figure 10 of the currentarticle), the correlations remained fairly stable across all list lengths.Specifically, the correlations between performance on the verbal complexspans and gF for list lengths 2–6 with the PCS method were .41, .38, .42,.40, and .29.
Figure 14. Structural equation model of (a) common variance (Com), working memory residual variance(WMRE), and general fluid intelligence (gF) for the absolute scoring method (ABS) and of (b) Com, WMRE,and gF for the proportion correct scoring method (PCS). Ospan � operation span; Rspan � reading span; Cspan� counting span; Bspan � backward word span; Fspans � forward word span with phonologically similarwords; Fspand � forward word span with phonologically dissimilar words; Raven � Raven ProgressiveMatrices; Cattell � Cattell Culture Fair Test.
1054 UNSWORTH AND ENGLE
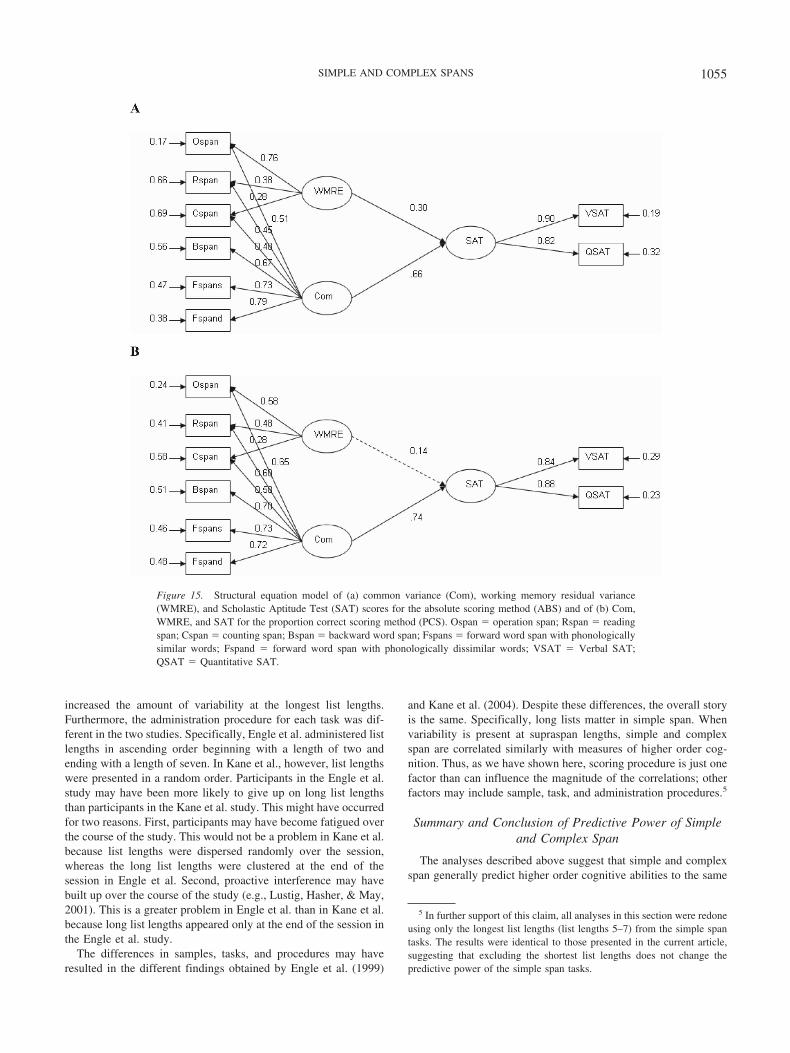
increased the amount of variability at the longest list lengths.Furthermore, the administration procedure for each task was dif-ferent in the two studies. Specifically, Engle et al. administered listlengths in ascending order beginning with a length of two andending with a length of seven. In Kane et al., however, list lengthswere presented in a random order. Participants in the Engle et al.study may have been more likely to give up on long list lengthsthan participants in the Kane et al. study. This might have occurredfor two reasons. First, participants may have become fatigued overthe course of the study. This would not be a problem in Kane et al.because list lengths were dispersed randomly over the session,whereas the long list lengths were clustered at the end of thesession in Engle et al. Second, proactive interference may havebuilt up over the course of the study (e.g., Lustig, Hasher, & May,2001). This is a greater problem in Engle et al. than in Kane et al.because long list lengths appeared only at the end of the session inthe Engle et al. study.
The differences in samples, tasks, and procedures may haveresulted in the different findings obtained by Engle et al. (1999)
and Kane et al. (2004). Despite these differences, the overall storyis the same. Specifically, long lists matter in simple span. Whenvariability is present at supraspan lengths, simple and complexspan are correlated similarly with measures of higher order cog-nition. Thus, as we have shown here, scoring procedure is just onefactor than can influence the magnitude of the correlations; otherfactors may include sample, task, and administration procedures.5
Summary and Conclusion of Predictive Power of Simpleand Complex Span
The analyses described above suggest that simple and complexspan generally predict higher order cognitive abilities to the same
5 In further support of this claim, all analyses in this section were redoneusing only the longest list lengths (list lengths 5–7) from the simple spantasks. The results were identical to those presented in the current article,suggesting that excluding the shortest list lengths does not change thepredictive power of the simple span tasks.
Figure 15. Structural equation model of (a) common variance (Com), working memory residual variance(WMRE), and Scholastic Aptitude Test (SAT) scores for the absolute scoring method (ABS) and of (b) Com,WMRE, and SAT for the proportion correct scoring method (PCS). Ospan � operation span; Rspan � readingspan; Cspan � counting span; Bspan � backward word span; Fspans � forward word span with phonologicallysimilar words; Fspand � forward word span with phonologically dissimilar words; VSAT � Verbal SAT;QSAT � Quantitative SAT.
1055SIMPLE AND COMPLEX SPANS
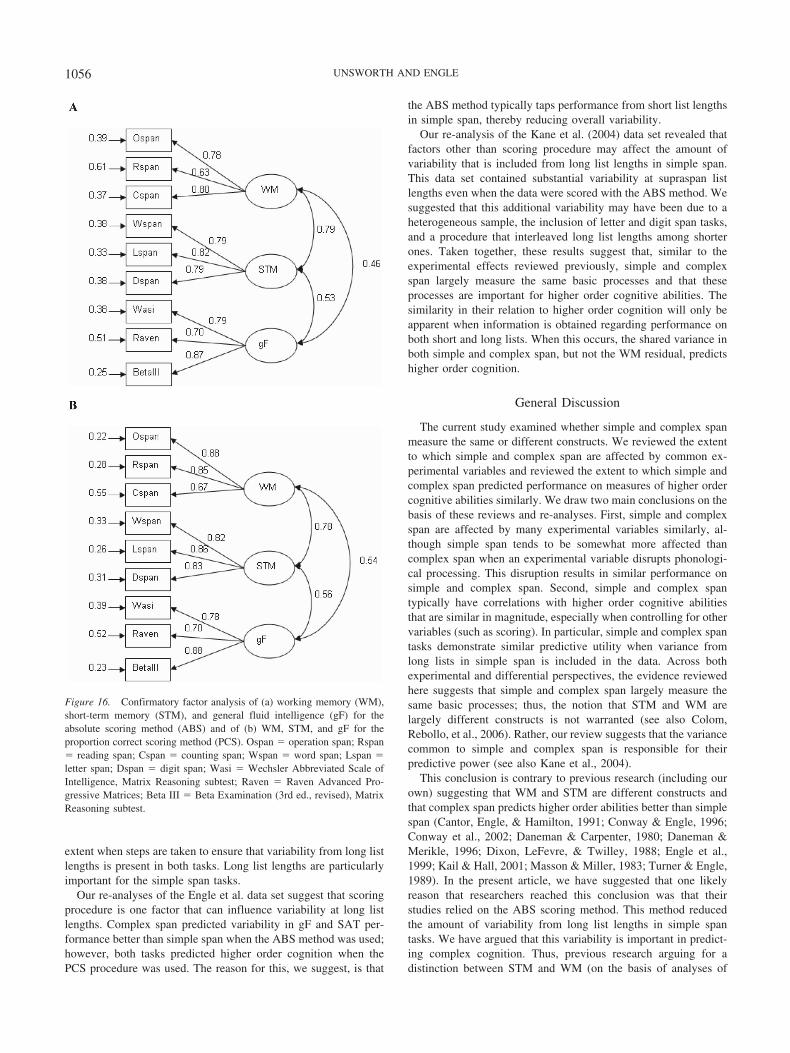
extent when steps are taken to ensure that variability from long listlengths is present in both tasks. Long list lengths are particularlyimportant for the simple span tasks.
Our re-analyses of the Engle et al. data set suggest that scoringprocedure is one factor that can influence variability at long listlengths. Complex span predicted variability in gF and SAT per-formance better than simple span when the ABS method was used;however, both tasks predicted higher order cognition when thePCS procedure was used. The reason for this, we suggest, is that
the ABS method typically taps performance from short list lengthsin simple span, thereby reducing overall variability.
Our re-analysis of the Kane et al. (2004) data set revealed thatfactors other than scoring procedure may affect the amount ofvariability that is included from long list lengths in simple span.This data set contained substantial variability at supraspan listlengths even when the data were scored with the ABS method. Wesuggested that this additional variability may have been due to aheterogeneous sample, the inclusion of letter and digit span tasks,and a procedure that interleaved long list lengths among shorterones. Taken together, these results suggest that, similar to theexperimental effects reviewed previously, simple and complexspan largely measure the same basic processes and that theseprocesses are important for higher order cognitive abilities. Thesimilarity in their relation to higher order cognition will only beapparent when information is obtained regarding performance onboth short and long lists. When this occurs, the shared variance inboth simple and complex span, but not the WM residual, predictshigher order cognition.
General Discussion
The current study examined whether simple and complex spanmeasure the same or different constructs. We reviewed the extentto which simple and complex span are affected by common ex-perimental variables and reviewed the extent to which simple andcomplex span predicted performance on measures of higher ordercognitive abilities similarly. We draw two main conclusions on thebasis of these reviews and re-analyses. First, simple and complexspan are affected by many experimental variables similarly, al-though simple span tends to be somewhat more affected thancomplex span when an experimental variable disrupts phonologi-cal processing. This disruption results in similar performance onsimple and complex span. Second, simple and complex spantypically have correlations with higher order cognitive abilitiesthat are similar in magnitude, especially when controlling for othervariables (such as scoring). In particular, simple and complex spantasks demonstrate similar predictive utility when variance fromlong lists in simple span is included in the data. Across bothexperimental and differential perspectives, the evidence reviewedhere suggests that simple and complex span largely measure thesame basic processes; thus, the notion that STM and WM arelargely different constructs is not warranted (see also Colom,Rebollo, et al., 2006). Rather, our review suggests that the variancecommon to simple and complex span is responsible for theirpredictive power (see also Kane et al., 2004).
This conclusion is contrary to previous research (including ourown) suggesting that WM and STM are different constructs andthat complex span predicts higher order abilities better than simplespan (Cantor, Engle, & Hamilton, 1991; Conway & Engle, 1996;Conway et al., 2002; Daneman & Carpenter, 1980; Daneman &Merikle, 1996; Dixon, LeFevre, & Twilley, 1988; Engle et al.,1999; Kail & Hall, 2001; Masson & Miller, 1983; Turner & Engle,1989). In the present article, we have suggested that one likelyreason that researchers reached this conclusion was that theirstudies relied on the ABS scoring method. This method reducedthe amount of variability from long list lengths in simple spantasks. We have argued that this variability is important in predict-ing complex cognition. Thus, previous research arguing for adistinction between STM and WM (on the basis of analyses of
Figure 16. Confirmatory factor analysis of (a) working memory (WM),short-term memory (STM), and general fluid intelligence (gF) for theabsolute scoring method (ABS) and of (b) WM, STM, and gF for theproportion correct scoring method (PCS). Ospan � operation span; Rspan� reading span; Cspan � counting span; Wspan � word span; Lspan �letter span; Dspan � digit span; Wasi � Wechsler Abbreviated Scale ofIntelligence, Matrix Reasoning subtest; Raven � Raven Advanced Pro-gressive Matrices; Beta III � Beta Examination (3rd ed., revised), MatrixReasoning subtest.
1056 UNSWORTH AND ENGLE
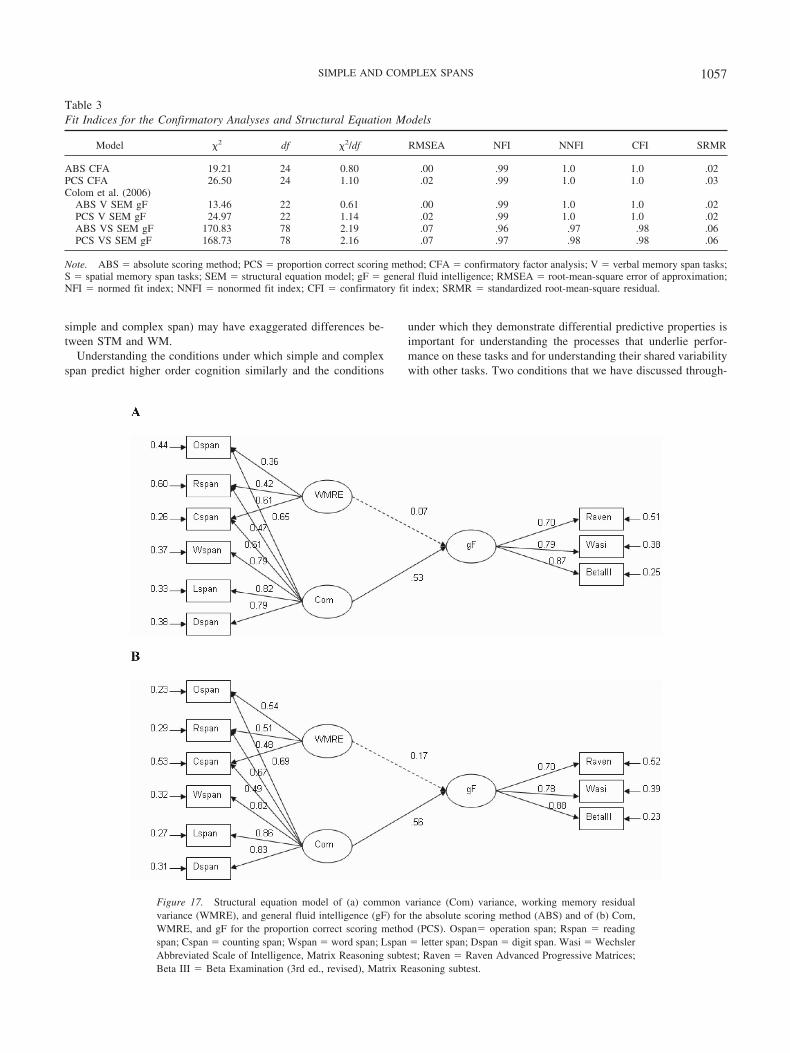
simple and complex span) may have exaggerated differences be-tween STM and WM.
Understanding the conditions under which simple and complexspan predict higher order cognition similarly and the conditions
under which they demonstrate differential predictive properties isimportant for understanding the processes that underlie perfor-mance on these tasks and for understanding their shared variabilitywith other tasks. Two conditions that we have discussed through-
Table 3Fit Indices for the Confirmatory Analyses and Structural Equation Models
Model 2 df 2/df RMSEA NFI NNFI CFI SRMR
ABS CFA 19.21 24 0.80 .00 .99 1.0 1.0 .02PCS CFA 26.50 24 1.10 .02 .99 1.0 1.0 .03Colom et al. (2006)
ABS V SEM gF 13.46 22 0.61 .00 .99 1.0 1.0 .02PCS V SEM gF 24.97 22 1.14 .02 .99 1.0 1.0 .02ABS VS SEM gF 170.83 78 2.19 .07 .96 .97 .98 .06PCS VS SEM gF 168.73 78 2.16 .07 .97 .98 .98 .06
Note. ABS � absolute scoring method; PCS � proportion correct scoring method; CFA � confirmatory factor analysis; V � verbal memory span tasks;S � spatial memory span tasks; SEM � structural equation model; gF � general fluid intelligence; RMSEA � root-mean-square error of approximation;NFI � normed fit index; NNFI � nonormed fit index; CFI � confirmatory fit index; SRMR � standardized root-mean-square residual.
Figure 17. Structural equation model of (a) common variance (Com) variance, working memory residualvariance (WMRE), and general fluid intelligence (gF) for the absolute scoring method (ABS) and of (b) Com,WMRE, and gF for the proportion correct scoring method (PCS). Ospan� operation span; Rspan � readingspan; Cspan � counting span; Wspan � word span; Lspan � letter span; Dspan � digit span. Wasi � WechslerAbbreviated Scale of Intelligence, Matrix Reasoning subtest; Raven � Raven Advanced Progressive Matrices;Beta III � Beta Examination (3rd ed., revised), Matrix Reasoning subtest.
1057SIMPLE AND COMPLEX SPANS
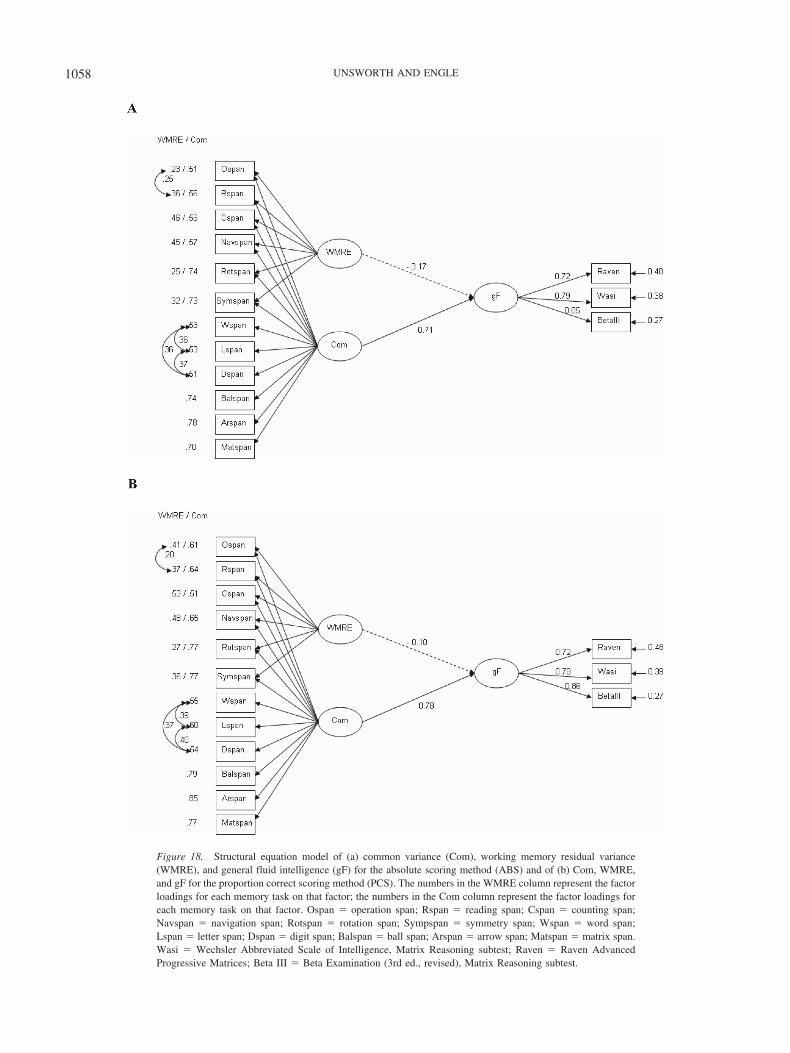
Figure 18. Structural equation model of (a) common variance (Com), working memory residual variance(WMRE), and general fluid intelligence (gF) for the absolute scoring method (ABS) and of (b) Com, WMRE,and gF for the proportion correct scoring method (PCS). The numbers in the WMRE column represent the factorloadings for each memory task on that factor; the numbers in the Com column represent the factor loadings foreach memory task on that factor. Ospan � operation span; Rspan � reading span; Cspan � counting span;Navspan � navigation span; Rotspan � rotation span; Sympspan � symmetry span; Wspan � word span;Lspan � letter span; Dspan � digit span; Balspan � ball span; Arspan � arrow span; Matspan � matrix span.Wasi � Wechsler Abbreviated Scale of Intelligence, Matrix Reasoning subtest; Raven � Raven AdvancedProgressive Matrices; Beta III � Beta Examination (3rd ed., revised), Matrix Reasoning subtest.
1058 UNSWORTH AND ENGLE
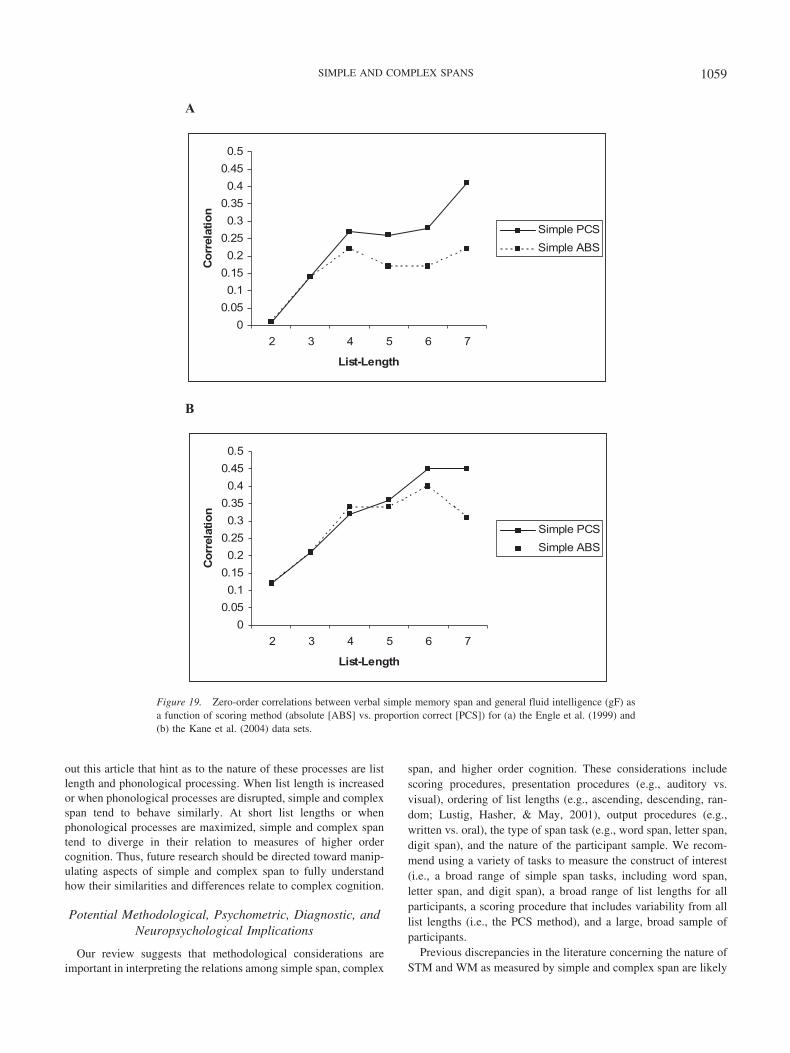
out this article that hint as to the nature of these processes are listlength and phonological processing. When list length is increasedor when phonological processes are disrupted, simple and complexspan tend to behave similarly. At short list lengths or whenphonological processes are maximized, simple and complex spantend to diverge in their relation to measures of higher ordercognition. Thus, future research should be directed toward manip-ulating aspects of simple and complex span to fully understandhow their similarities and differences relate to complex cognition.
Potential Methodological, Psychometric, Diagnostic, andNeuropsychological Implications
Our review suggests that methodological considerations areimportant in interpreting the relations among simple span, complex
span, and higher order cognition. These considerations includescoring procedures, presentation procedures (e.g., auditory vs.visual), ordering of list lengths (e.g., ascending, descending, ran-dom; Lustig, Hasher, & May, 2001), output procedures (e.g.,written vs. oral), the type of span task (e.g., word span, letter span,digit span), and the nature of the participant sample. We recom-mend using a variety of tasks to measure the construct of interest(i.e., a broad range of simple span tasks, including word span,letter span, and digit span), a broad range of list lengths for allparticipants, a scoring procedure that includes variability from alllist lengths (i.e., the PCS method), and a large, broad sample ofparticipants.
Previous discrepancies in the literature concerning the nature ofSTM and WM as measured by simple and complex span are likely
A
0
0.05
0.1
0.15
0.2
0.25
0.3
0.35
0.4
0.45
0.5
2 3 4 5 6 7
List-Length
Co
rrel
atio
n
Simple PCS
Simple ABS
B
0
0.05
0.1
0.15
0.2
0.25
0.3
0.35
0.4
0.45
0.5
2 3 4 5 6 7
List-Length
Co
rrel
atio
n
Simple PCS
Simple ABS
Figure 19. Zero-order correlations between verbal simple memory span and general fluid intelligence (gF) asa function of scoring method (absolute [ABS] vs. proportion correct [PCS]) for (a) the Engle et al. (1999) and(b) the Kane et al. (2004) data sets.
1059SIMPLE AND COMPLEX SPANS
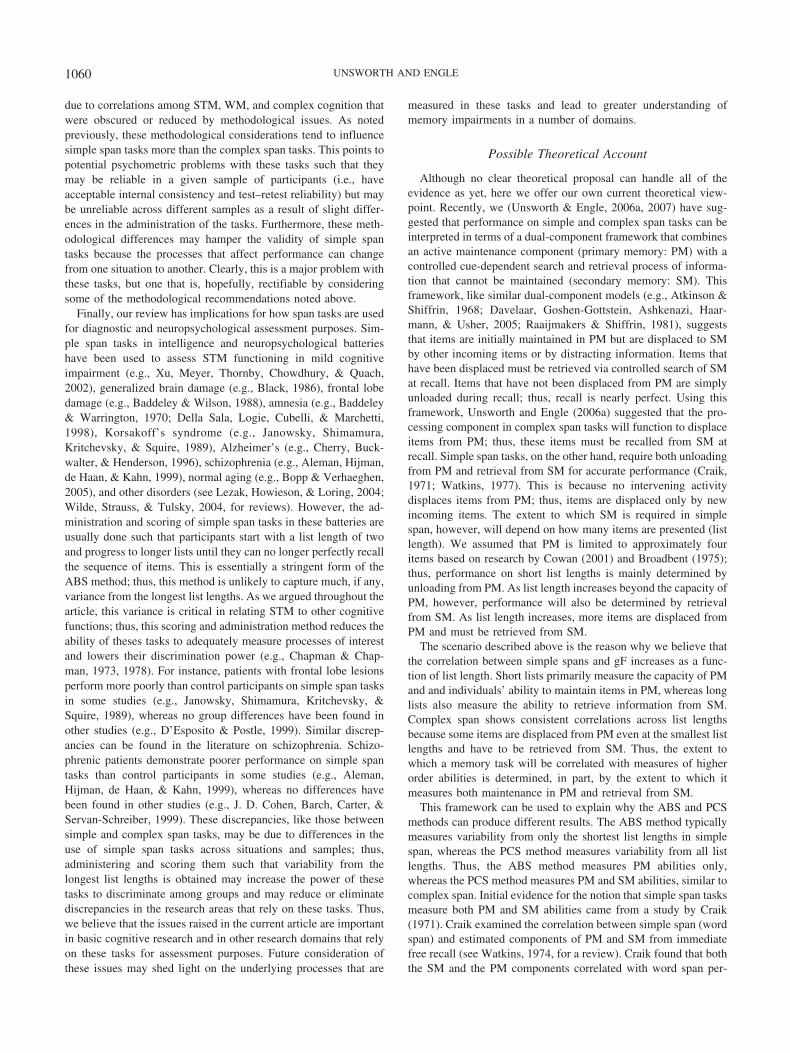
due to correlations among STM, WM, and complex cognition thatwere obscured or reduced by methodological issues. As notedpreviously, these methodological considerations tend to influencesimple span tasks more than the complex span tasks. This points topotential psychometric problems with these tasks such that theymay be reliable in a given sample of participants (i.e., haveacceptable internal consistency and test–retest reliability) but maybe unreliable across different samples as a result of slight differ-ences in the administration of the tasks. Furthermore, these meth-odological differences may hamper the validity of simple spantasks because the processes that affect performance can changefrom one situation to another. Clearly, this is a major problem withthese tasks, but one that is, hopefully, rectifiable by consideringsome of the methodological recommendations noted above.
Finally, our review has implications for how span tasks are usedfor diagnostic and neuropsychological assessment purposes. Sim-ple span tasks in intelligence and neuropsychological batterieshave been used to assess STM functioning in mild cognitiveimpairment (e.g., Xu, Meyer, Thornby, Chowdhury, & Quach,2002), generalized brain damage (e.g., Black, 1986), frontal lobedamage (e.g., Baddeley & Wilson, 1988), amnesia (e.g., Baddeley& Warrington, 1970; Della Sala, Logie, Cubelli, & Marchetti,1998), Korsakoff’s syndrome (e.g., Janowsky, Shimamura,Kritchevsky, & Squire, 1989), Alzheimer’s (e.g., Cherry, Buck-walter, & Henderson, 1996), schizophrenia (e.g., Aleman, Hijman,de Haan, & Kahn, 1999), normal aging (e.g., Bopp & Verhaeghen,2005), and other disorders (see Lezak, Howieson, & Loring, 2004;Wilde, Strauss, & Tulsky, 2004, for reviews). However, the ad-ministration and scoring of simple span tasks in these batteries areusually done such that participants start with a list length of twoand progress to longer lists until they can no longer perfectly recallthe sequence of items. This is essentially a stringent form of theABS method; thus, this method is unlikely to capture much, if any,variance from the longest list lengths. As we argued throughout thearticle, this variance is critical in relating STM to other cognitivefunctions; thus, this scoring and administration method reduces theability of theses tasks to adequately measure processes of interestand lowers their discrimination power (e.g., Chapman & Chap-man, 1973, 1978). For instance, patients with frontal lobe lesionsperform more poorly than control participants on simple span tasksin some studies (e.g., Janowsky, Shimamura, Kritchevsky, &Squire, 1989), whereas no group differences have been found inother studies (e.g., D’Esposito & Postle, 1999). Similar discrep-ancies can be found in the literature on schizophrenia. Schizo-phrenic patients demonstrate poorer performance on simple spantasks than control participants in some studies (e.g., Aleman,Hijman, de Haan, & Kahn, 1999), whereas no differences havebeen found in other studies (e.g., J. D. Cohen, Barch, Carter, &Servan-Schreiber, 1999). These discrepancies, like those betweensimple and complex span tasks, may be due to differences in theuse of simple span tasks across situations and samples; thus,administering and scoring them such that variability from thelongest list lengths is obtained may increase the power of thesetasks to discriminate among groups and may reduce or eliminatediscrepancies in the research areas that rely on these tasks. Thus,we believe that the issues raised in the current article are importantin basic cognitive research and in other research domains that relyon these tasks for assessment purposes. Future consideration ofthese issues may shed light on the underlying processes that are
measured in these tasks and lead to greater understanding ofmemory impairments in a number of domains.
Possible Theoretical Account
Although no clear theoretical proposal can handle all of theevidence as yet, here we offer our own current theoretical view-point. Recently, we (Unsworth & Engle, 2006a, 2007) have sug-gested that performance on simple and complex span tasks can beinterpreted in terms of a dual-component framework that combinesan active maintenance component (primary memory: PM) with acontrolled cue-dependent search and retrieval process of informa-tion that cannot be maintained (secondary memory: SM). Thisframework, like similar dual-component models (e.g., Atkinson &Shiffrin, 1968; Davelaar, Goshen-Gottstein, Ashkenazi, Haar-mann, & Usher, 2005; Raaijmakers & Shiffrin, 1981), suggeststhat items are initially maintained in PM but are displaced to SMby other incoming items or by distracting information. Items thathave been displaced must be retrieved via controlled search of SMat recall. Items that have not been displaced from PM are simplyunloaded during recall; thus, recall is nearly perfect. Using thisframework, Unsworth and Engle (2006a) suggested that the pro-cessing component in complex span tasks will function to displaceitems from PM; thus, these items must be recalled from SM atrecall. Simple span tasks, on the other hand, require both unloadingfrom PM and retrieval from SM for accurate performance (Craik,1971; Watkins, 1977). This is because no intervening activitydisplaces items from PM; thus, items are displaced only by newincoming items. The extent to which SM is required in simplespan, however, will depend on how many items are presented (listlength). We assumed that PM is limited to approximately fouritems based on research by Cowan (2001) and Broadbent (1975);thus, performance on short list lengths is mainly determined byunloading from PM. As list length increases beyond the capacity ofPM, however, performance will also be determined by retrievalfrom SM. As list length increases, more items are displaced fromPM and must be retrieved from SM.
The scenario described above is the reason why we believe thatthe correlation between simple spans and gF increases as a func-tion of list length. Short lists primarily measure the capacity of PMand and individuals’ ability to maintain items in PM, whereas longlists also measure the ability to retrieve information from SM.Complex span shows consistent correlations across list lengthsbecause some items are displaced from PM even at the smallest listlengths and have to be retrieved from SM. Thus, the extent towhich a memory task will be correlated with measures of higherorder abilities is determined, in part, by the extent to which itmeasures both maintenance in PM and retrieval from SM.
This framework can be used to explain why the ABS and PCSmethods can produce different results. The ABS method typicallymeasures variability from only the shortest list lengths in simplespan, whereas the PCS method measures variability from all listlengths. Thus, the ABS method measures PM abilities only,whereas the PCS method measures PM and SM abilities, similar tocomplex span. Initial evidence for the notion that simple span tasksmeasure both PM and SM abilities came from a study by Craik(1971). Craik examined the correlation between simple span (wordspan) and estimated components of PM and SM from immediatefree recall (see Watkins, 1974, for a review). Craik found that boththe SM and the PM components correlated with word span per-
1060 UNSWORTH AND ENGLE
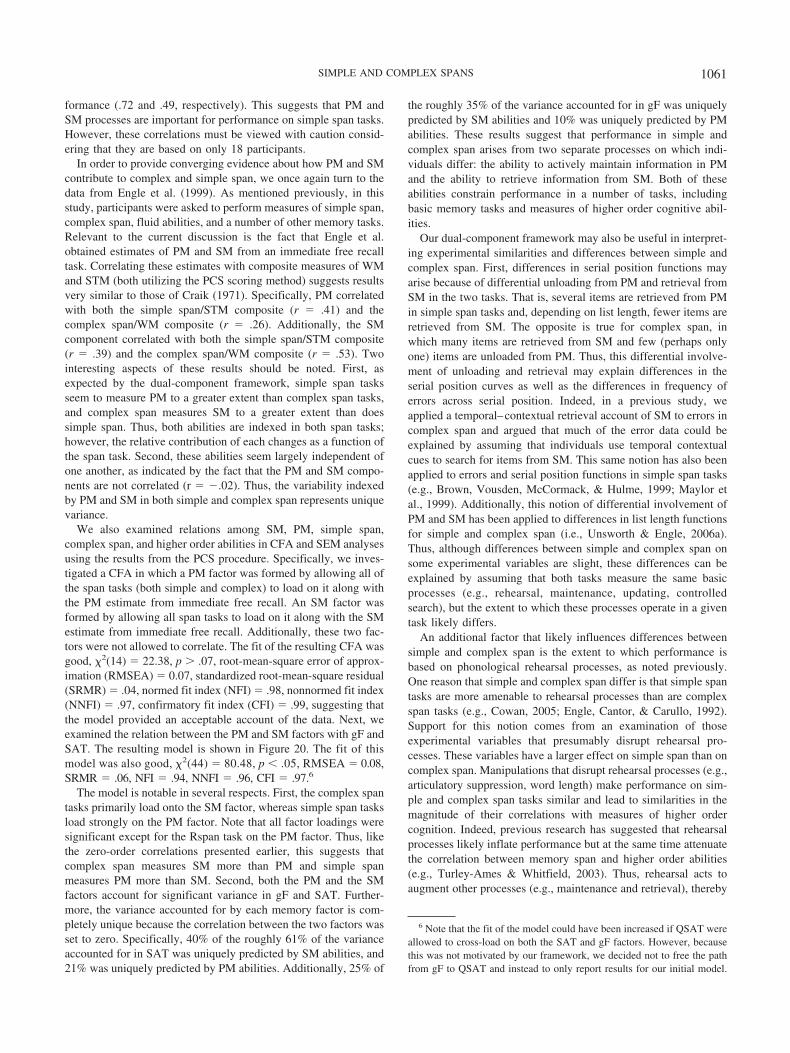
formance (.72 and .49, respectively). This suggests that PM andSM processes are important for performance on simple span tasks.However, these correlations must be viewed with caution consid-ering that they are based on only 18 participants.
In order to provide converging evidence about how PM and SMcontribute to complex and simple span, we once again turn to thedata from Engle et al. (1999). As mentioned previously, in thisstudy, participants were asked to perform measures of simple span,complex span, fluid abilities, and a number of other memory tasks.Relevant to the current discussion is the fact that Engle et al.obtained estimates of PM and SM from an immediate free recalltask. Correlating these estimates with composite measures of WMand STM (both utilizing the PCS scoring method) suggests resultsvery similar to those of Craik (1971). Specifically, PM correlatedwith both the simple span/STM composite (r � .41) and thecomplex span/WM composite (r � .26). Additionally, the SMcomponent correlated with both the simple span/STM composite(r � .39) and the complex span/WM composite (r � .53). Twointeresting aspects of these results should be noted. First, asexpected by the dual-component framework, simple span tasksseem to measure PM to a greater extent than complex span tasks,and complex span measures SM to a greater extent than doessimple span. Thus, both abilities are indexed in both span tasks;however, the relative contribution of each changes as a function ofthe span task. Second, these abilities seem largely independent ofone another, as indicated by the fact that the PM and SM compo-nents are not correlated (r � .02). Thus, the variability indexedby PM and SM in both simple and complex span represents uniquevariance.
We also examined relations among SM, PM, simple span,complex span, and higher order abilities in CFA and SEM analysesusing the results from the PCS procedure. Specifically, we inves-tigated a CFA in which a PM factor was formed by allowing all ofthe span tasks (both simple and complex) to load on it along withthe PM estimate from immediate free recall. An SM factor wasformed by allowing all span tasks to load on it along with the SMestimate from immediate free recall. Additionally, these two fac-tors were not allowed to correlate. The fit of the resulting CFA wasgood, 2(14) � 22.38, p � .07, root-mean-square error of approx-imation (RMSEA) � 0.07, standardized root-mean-square residual(SRMR) � .04, normed fit index (NFI) � .98, nonnormed fit index(NNFI) � .97, confirmatory fit index (CFI) � .99, suggesting thatthe model provided an acceptable account of the data. Next, weexamined the relation between the PM and SM factors with gF andSAT. The resulting model is shown in Figure 20. The fit of thismodel was also good, 2(44) � 80.48, p � .05, RMSEA � 0.08,SRMR � .06, NFI � .94, NNFI � .96, CFI � .97.6
The model is notable in several respects. First, the complex spantasks primarily load onto the SM factor, whereas simple span tasksload strongly on the PM factor. Note that all factor loadings weresignificant except for the Rspan task on the PM factor. Thus, likethe zero-order correlations presented earlier, this suggests thatcomplex span measures SM more than PM and simple spanmeasures PM more than SM. Second, both the PM and the SMfactors account for significant variance in gF and SAT. Further-more, the variance accounted for by each memory factor is com-pletely unique because the correlation between the two factors wasset to zero. Specifically, 40% of the roughly 61% of the varianceaccounted for in SAT was uniquely predicted by SM abilities, and21% was uniquely predicted by PM abilities. Additionally, 25% of
the roughly 35% of the variance accounted for in gF was uniquelypredicted by SM abilities and 10% was uniquely predicted by PMabilities. These results suggest that performance in simple andcomplex span arises from two separate processes on which indi-viduals differ: the ability to actively maintain information in PMand the ability to retrieve information from SM. Both of theseabilities constrain performance in a number of tasks, includingbasic memory tasks and measures of higher order cognitive abil-ities.
Our dual-component framework may also be useful in interpret-ing experimental similarities and differences between simple andcomplex span. First, differences in serial position functions mayarise because of differential unloading from PM and retrieval fromSM in the two tasks. That is, several items are retrieved from PMin simple span tasks and, depending on list length, fewer items areretrieved from SM. The opposite is true for complex span, inwhich many items are retrieved from SM and few (perhaps onlyone) items are unloaded from PM. Thus, this differential involve-ment of unloading and retrieval may explain differences in theserial position curves as well as the differences in frequency oferrors across serial position. Indeed, in a previous study, weapplied a temporal–contextual retrieval account of SM to errors incomplex span and argued that much of the error data could beexplained by assuming that individuals use temporal contextualcues to search for items from SM. This same notion has also beenapplied to errors and serial position functions in simple span tasks(e.g., Brown, Vousden, McCormack, & Hulme, 1999; Maylor etal., 1999). Additionally, this notion of differential involvement ofPM and SM has been applied to differences in list length functionsfor simple and complex span (i.e., Unsworth & Engle, 2006a).Thus, although differences between simple and complex span onsome experimental variables are slight, these differences can beexplained by assuming that both tasks measure the same basicprocesses (e.g., rehearsal, maintenance, updating, controlledsearch), but the extent to which these processes operate in a giventask likely differs.
An additional factor that likely influences differences betweensimple and complex span is the extent to which performance isbased on phonological rehearsal processes, as noted previously.One reason that simple and complex span differ is that simple spantasks are more amenable to rehearsal processes than are complexspan tasks (e.g., Cowan, 2005; Engle, Cantor, & Carullo, 1992).Support for this notion comes from an examination of thoseexperimental variables that presumably disrupt rehearsal pro-cesses. These variables have a larger effect on simple span than oncomplex span. Manipulations that disrupt rehearsal processes (e.g.,articulatory suppression, word length) make performance on sim-ple and complex span tasks similar and lead to similarities in themagnitude of their correlations with measures of higher ordercognition. Indeed, previous research has suggested that rehearsalprocesses likely inflate performance but at the same time attenuatethe correlation between memory span and higher order abilities(e.g., Turley-Ames & Whitfield, 2003). Thus, rehearsal acts toaugment other processes (e.g., maintenance and retrieval), thereby
6 Note that the fit of the model could have been increased if QSAT wereallowed to cross-load on both the SAT and gF factors. However, becausethis was not motivated by our framework, we decided not to free the pathfrom gF to QSAT and instead to only report results for our initial model.
1061SIMPLE AND COMPLEX SPANS
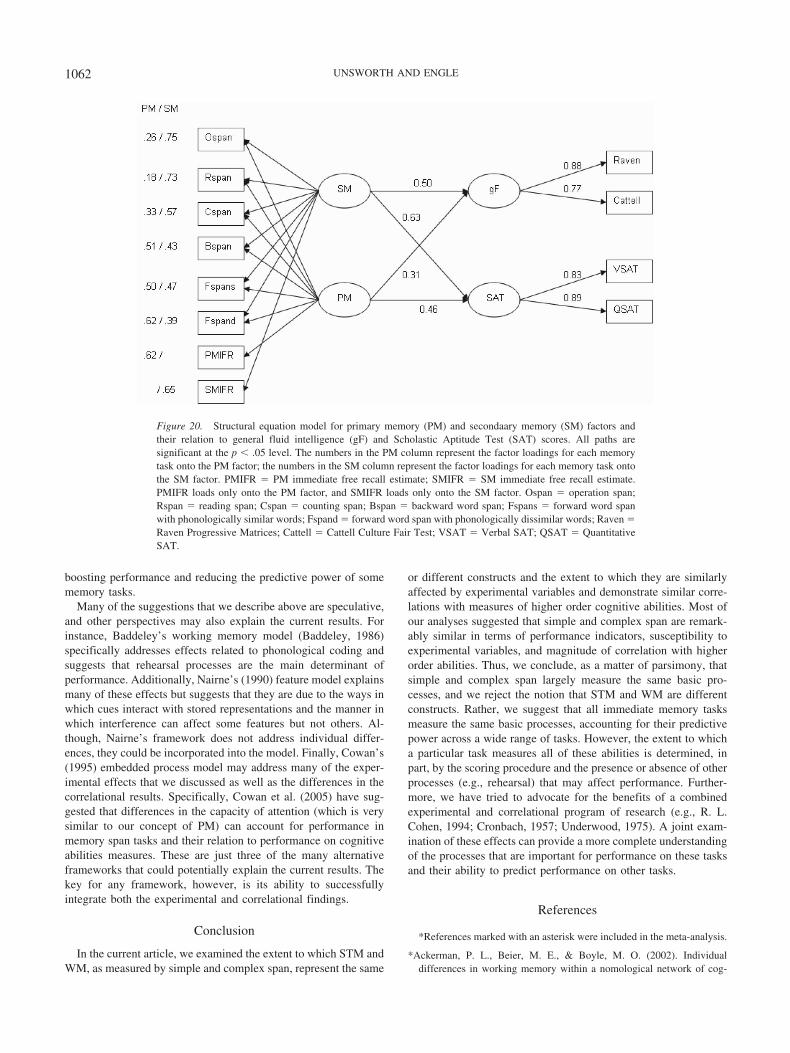
boosting performance and reducing the predictive power of somememory tasks.
Many of the suggestions that we describe above are speculative,and other perspectives may also explain the current results. Forinstance, Baddeley’s working memory model (Baddeley, 1986)specifically addresses effects related to phonological coding andsuggests that rehearsal processes are the main determinant ofperformance. Additionally, Nairne’s (1990) feature model explainsmany of these effects but suggests that they are due to the ways inwhich cues interact with stored representations and the manner inwhich interference can affect some features but not others. Al-though, Nairne’s framework does not address individual differ-ences, they could be incorporated into the model. Finally, Cowan’s(1995) embedded process model may address many of the exper-imental effects that we discussed as well as the differences in thecorrelational results. Specifically, Cowan et al. (2005) have sug-gested that differences in the capacity of attention (which is verysimilar to our concept of PM) can account for performance inmemory span tasks and their relation to performance on cognitiveabilities measures. These are just three of the many alternativeframeworks that could potentially explain the current results. Thekey for any framework, however, is its ability to successfullyintegrate both the experimental and correlational findings.
Conclusion
In the current article, we examined the extent to which STM andWM, as measured by simple and complex span, represent the same
or different constructs and the extent to which they are similarlyaffected by experimental variables and demonstrate similar corre-lations with measures of higher order cognitive abilities. Most ofour analyses suggested that simple and complex span are remark-ably similar in terms of performance indicators, susceptibility toexperimental variables, and magnitude of correlation with higherorder abilities. Thus, we conclude, as a matter of parsimony, thatsimple and complex span largely measure the same basic pro-cesses, and we reject the notion that STM and WM are differentconstructs. Rather, we suggest that all immediate memory tasksmeasure the same basic processes, accounting for their predictivepower across a wide range of tasks. However, the extent to whicha particular task measures all of these abilities is determined, inpart, by the scoring procedure and the presence or absence of otherprocesses (e.g., rehearsal) that may affect performance. Further-more, we have tried to advocate for the benefits of a combinedexperimental and correlational program of research (e.g., R. L.Cohen, 1994; Cronbach, 1957; Underwood, 1975). A joint exam-ination of these effects can provide a more complete understandingof the processes that are important for performance on these tasksand their ability to predict performance on other tasks.
References
*References marked with an asterisk were included in the meta-analysis.
*Ackerman, P. L., Beier, M. E., & Boyle, M. O. (2002). Individualdifferences in working memory within a nomological network of cog-
Figure 20. Structural equation model for primary memory (PM) and secondaary memory (SM) factors andtheir relation to general fluid intelligence (gF) and Scholastic Aptitude Test (SAT) scores. All paths aresignificant at the p � .05 level. The numbers in the PM column represent the factor loadings for each memorytask onto the PM factor; the numbers in the SM column represent the factor loadings for each memory task ontothe SM factor. PMIFR � PM immediate free recall estimate; SMIFR � SM immediate free recall estimate.PMIFR loads only onto the PM factor, and SMIFR loads only onto the SM factor. Ospan � operation span;Rspan � reading span; Cspan � counting span; Bspan � backward word span; Fspans � forward word spanwith phonologically similar words; Fspand � forward word span with phonologically dissimilar words; Raven �Raven Progressive Matrices; Cattell � Cattell Culture Fair Test; VSAT � Verbal SAT; QSAT � QuantitativeSAT.
1062 UNSWORTH AND ENGLE
nitive and perceptual speed abilities. Journal of Experimental Psychol-ogy: General, 131, 567–589.
Ackerman, P. L., Beier, M. E., & Boyle, M. O. (2005). Working memoryand intelligence: The same or different constructs? Psychological Bul-letin, 131, 30–60.
Aleman, A., Hijman, R., de Haan, E. H. F., & Kahn, R. S. (1999). Memoryimpairments in schizophrenia: A meta-analysis. American Journal ofPsychiatry, 156, 1358–1366.
Atkinson, R. C., & Shiffrin, R. M. (1968). Human memory: A proposedsystem and its control processes. In K. W. Spence (Ed.), The psychologyof learning and motivation (Vol. 2, pp. 89–195). New York: AcademicPress.
Atkinson, R. C., & Shiffrin, R. M. (1971). The control of short-termmemory. Scientific American, 225, 82–90.
Baddeley, A. D. (1966). The influence of acoustic and semantic similarityon long-term memory for word sequences. Quarterly Journal of Exper-imental Psychology, 18, 302–309.
Baddeley, A. D. (1986). Working memory. London: Oxford UniversityPress.
Baddeley, A. D., & Hitch, G. (1974). Working memory. In G. H. Bower(Ed.), The psychology of learning and motivation (Vol. 8, pp. 47–89).New York: Academic Press.
*Baddeley, A. D., Logie, R. H., Nimmo-Smith, I., & Brereton, N. (1985).Components of fluid reading. Journal of Memory & Language, 24,119–131.
Baddeley, A. D., & Scott, D. (1971). Word frequency and the unit-sequence interference hypothesis in short-term memory. Journal ofVerbal Learning and Verbal Behavior, 10, 35–40.
Baddeley, A. D., Thomson, N., & Buchanan, M. (1975). Word length andthe structure of short-term memory. Journal of Verbal Learning andVerbal Behavior, 14, 575–589.
Baddeley, A. D., & Warrington, E. K. (1970). Amnesia and the distinctionbetween long- and short-term memory. Journal of Verbal Learning andVerbal Behavior, 9, 176–189.
Baddeley, A. D., & Wilson, B. (1988). Frontal amnesia and the dysexecu-tive syndrome. Brain and Cognition, 7, 212–230.
Bayliss, D. M., Jarrold, C., Baddeley, A. D., & Gunn, D. M. (2005). Therelationship between short-term memory and working memory: Com-plex span made simple? Memory, 13, 414–421.
Bayliss, D. M., Jarrold, C., Gunn, D. M., & Baddeley, A. D. (2003). Thecomplexities of complex span: Explaining individual differences inworking memory in children and adults. Journal of Experimental Psy-chology: General, 132, 71–92.
Beaman, C. P. (2006). The relationship between absolute and proportionscores of serial order memory: Simulation predictions and empiricaldata. Psychonomic Bulletin & Review, 13, 92–98.
Beier, M. E., & Ackerman, P. L. (2004). A reappraisal of the relationshipbetween span memory and intelligence via “best evidence synthesis.”Intelligence, 32, 607–619.
Bjork, E. L., & Healy, A. F. (1974). Short-term order and item retention.Journal of Verbal Learning and Verbal Behavior, 13, 80–97.
Black, F. W. (1986). Digit repetition in brain-damaged adults: Clinical andtheoretical implications. Journal of Clinical Psychology, 42, 770–782.
Bopp, K. L., & Verhaeghen, P. (2005). Aging and verbal memory span: Ameta-analysis. The Journals of Gerontology: Series B, 60B, 223–233.
Broadbent, D. E. (1975). The magic number seven after fifteen years. InR. A. Kennedy & A. Wilkes (Eds.), Studies in long-term memory (pp.3–18). New York: Wiley.
Brown, G. D. A., Preece, T., & Hulme, C. (2000). Oscillator-based mem-ory for serial order. Psychological Review, 107, 127–181.
Brown, G. D. A., Vousden, J. I., McCormack, T., & Hulme, C. (1999). Thedevelopment of memory for serial order: A temporal–contextual dis-tinctiveness model. International Journal of Psychology, 34, 389–402.
*Cantor, J., Engle, R. W., & Hamilton, G. (1991). Short-term memory,
working memory, and verbal abilities: How do they relate? Intelligence,15, 229–246.
Carroll, J. B. (1988). Individual differences in cognitive functioning. InR. C. Atkinson, R. J. Herrnstein, G. Lindzey, & R. D. Luce (Eds.),Stevens’ handbook of experimental psychology (pp. 813–862). NewYork: Wiley.
Carroll, J. B. (1993). Human cognitive abilities: A survey of factor-analyticstudies. New York: Cambridge University Press.
Case, R., Kurland, M. D., & Goldberg, J. (1982). Operational efficiencyand the growth of short-term memory span. Journal of ExperimentalChild Psychology, 33, 386–404.
Cattell, R. B. (1973). Measuring intelligence with culture fair tests. Cham-paign, IL: Institute for Personality and Ability Testing.
Chapman, L. J., & Chapman, J. P. (1973). Problems in the measurement ofcognitive deficit. Psychological Bulletin, 79, 380–385.
Chapman, L. J., & Chapman, J. P. (1978). The measurement of differentialdeficit. Journal of Psychiatric Research, 14, 303–311.
Cherry, B. J., Buckwalter, J. G., & Henderson, V. W. (1996). Memory spanprocedures in Alzheimer’s disease. Neuropsychology, 10, 286–293.
Cohen, J., & Cohen, P. (1983). Applied multiple regression/correlationanalysis for the behavioral sciences. Hillsdale, NJ: Erlbaum.
Cohen, J. D., Barch, D. M., Carter, C., & Servan-Schreiber, D. (1999).Context processing deficits in schizophrenia: Converging evidence fromthree theoretically motivated cognitive tasks. Journal of Abnormal Psy-chology, 108, 120–133.
Cohen, R. L. (1994). Some thoughts on individual differences and theoryconstruction. Intelligence, 18, 3–13.
*Colom, R., Abad, F. J., Rebollo, I., & Shih, P. C. (2005). Memory spanand general intelligence: A latent variable approach. Intelligence, 33,623–624.
Colom, R., Rebollo, I., Abad, F. J., & Shih, P. C. (2006). Complex spantasks, simple span tasks, and cognitive abilities: A reanalysis of keystudies. Memory & Cognition, 34, 158–171.
Colom, R., Shih, P. C., Flores-Mendoza, C., & Quiroga, M. A. (2006). Thereal relationship between short-term memory and working memory.Memory, 14, 804–813.
Conrad, R. (1964). Acoustic confusions in immediate memory. BritishJournal of Psychology, 55, 75–84.
*Conway, A. R. A., Cowan, N., Bunting, M. F., Therriault, D. J., &Minkoff, S. R. B. (2002). A latent variable analysis of working memorycapacity, short-term memory capacity, processing speed, and generalfluid intelligence. Intelligence, 30, 163–183.
*Conway, A. R. A., & Engle, R. W. (1996). Individual differences inworking memory capacity: More evidence for a general capacity theory.Memory, 4, 577–590.
Conway, A. R. A., Kane, M. J., Bunting, M. F., Hambrick, D. Z., Wilhelm,O., & Engle, R. W. (2005). Working memory span tasks: A method-ological review and user’s guide. Psychonomic Bulletin & Review, 12,769–786.
Copeland, D. W., & Radvansky, G. A. (2001). Phonological similarity inworking memory. Memory & Cognition, 29, 774–776.
Cowan, N. (1995). Attention and memory: An integrated framework.Oxford, England: Oxford University Press.
Cowan, N. (2001). The magical number 4 in short-term memory: Areconsideration of mental storage capacity. Behavioral and Brain Sci-ences, 24, 97–185.
Cowan, N. (2005). Working memory capacity. Hove, England: PsychologyPress.
Cowan, N., Elliott, E. M., Saults, J. S., Morey, C. C., Mattox, S.,Hismjatullina, A., & Conway, A. R. A. (2005). On the capacity ofattention: Its estimation and its role in working memory and cognitiveaptitudes. Cognitive Psychology, 51, 42–100.
Cowan, N., Towse, J. N., Hamilton, Z., Saults, J. S., Elliot, E. M., Lacey,J. F., Moreno, M. V., & Hitch, G. J. (2003). Children’s working memory
1063SIMPLE AND COMPLEX SPANS
processes: A response-timing analysis. Journal of Experimental Psy-chology: General, 132, 113–132.
Craik, F. I. M. (1971). Primary memory. British Medical Bulletin, 27,232–236.
Crannell, C. W., & Parrish, J. N. (1957). A comparison of immediatememory span for digits, letters, and words. Journal of Psychology, 44,319–327.
*Crawford, J., & Stankov, L. (1983). Fluid and crystallized intelligenceand primacy/recency measures of short-term memory. Intelligence, 7,227–252.
Cronbach, L. J. (1957). The two disciplines of scientific psychology.American Psychologist, 12, 671–684.
Daneman, M., & Carpenter, P. A. (1980). Individual differences in workingmemory and reading. Journal of Verbal Learning and Verbal Behavior,19, 450–466.
Daneman, M., & Merikle, P. M. (1996). Working memory and languagecomprehension: A meta-analysis. Psychonomic Bulletin & Review, 3,422–433.
Davelaar, E. J., Goshen-Gottstein, Y., Ashkenazi, A., Haarmann, H. J., &Usher, M. (2005). The demise of short-term memory revisited: Empir-ical and computational investigations of recency effects. PsychologicalReview, 112, 3–42.
Della Sala, S., Logie, R. H., Cubelli, R., & Marchetti, C. (1998). Dissoci-ation between recency and span: Neuropsychological and experimentalevidence. Neuropsychology, 12, 533–545.
Dempster, F. N. (1981). Memory span: Sources of individual and devel-opmental differences. Psychological Bulletin, 89, 63–100.
D’Esposito, M., & Postle, B. R. (1999). The dependence of span anddelayed-response performance on prefrontal cortex. Neuropsychologia,37, 1303–1315.
*Dixon, P., LeFevre, J., & Twilley, L. C. (1988). Word knowledge andworking memory as predictors of reading skill. Journal of EducationalPsychology, 80, 465–472.
Engle, R. W., Cantor, J., & Carullo, J. J. (1992). Individual differences inworking memory and comprehension: A test of four hypotheses. Journalof Experimental Psychology: Learning, Memory, and Cognition, 18,972–992.
*Engle, R. W., Nations, J. K., & Cantor, J. (1990). Is “working memorycapacity” just another name for word knowledge? Journal of Educa-tional Psychology, 82, 799–804.
Engle, R. W., & Oransky, N. (1999). The evolution from short-term toworking memory: Multi-store to dynamic models of temporary storage.In R. Sternberg (Ed.), The nature of cognition (pp. 514–555). Cam-bridge, MA: MIT Press.
*Engle, R. W., Tuholski, S. W., Laughlin, J. E., & Conway, A. R. A.(1999). Working memory, short-term memory and general fluid intelli-gence: A latent variable approach. Journal of Experimental Psychology:General, 128, 309–331.
Estes, W. K. (1972). An associative basis for coding and organization inmemory. In A. W. Melton & E. Martin (Eds.), Coding processes inhuman memory. Washington, DC: V. H. Winston.
Friedman, N. P., & Miyake, A. (2004). The reading span test and itspredictive power for reading comprehension ability. Journal of Memoryand Language, 51, 136–158.
Friedman, N. P., & Miyake, A. (2005). Comparison of four scoringmethods for the reading span test. Behavior Research Methods, Instru-ments, & Computers, 37, 581–590.
*Hambrick, D. Z. (2003). Why are some people more knowledgeable thanothers? A longitudinal study of real-world knowledge acquisition. Mem-ory & Cognition, 31, 902–917.
Hedges, L. V., & Olkin, I. (1985). Statisical methods for meta-analysis.Orlando, FL: Academic Press.
Henson, R. N. A. (1998). Short-term memory for serial order: The start–end model. Cognitive Psychology, 36, 73–137.
Hu, L., & Bentler, P. M. (1999). Cutoff criteria for fit indexes in covariance
structure analysis: Conventional criteria versus new alternatives. Struc-tural Equation Modeling, 6, 1–55.
Hulme, C., Roodenrys, S., Schweickert, R., Brown, G. D. A., Martin, S., &Stuart, G. (1997). Word-frequency effects on short-term memory tasks:Evidence for a redintegration process in immediate serial recall. Journalof Experimental Psychology: Learning, Memory, and Cognition, 23,1217–1232.
*Jackson, M. D., & McClelland, J. L. (1979). Processing determinants ofreading speed. Journal of Experimental Psychology: General, 108, 151–181.
Janowsky, J. S., Shimamura, A. P., Kritchevsky, M., & Squire, L. R.(1989). Cognitive impairment following frontal lobe damage and itsrelevance to human amnesia. Behavioral Neuroscience, 103, 548–560.
Kail, R., & Hall, L. K. (2001). Distinguishing short-term memory fromworking memory. Memory & Cognition, 29, 1–9.
Kane, M. J., Bleckley, M. K., Conway, A. R. A., & Engle, R. W. (2001).A controlled attention view of working memory capacity. Journal ofExperimental Psychology: General, 130, 169–183.
Kane, M. J., Hambrick, D. Z., & Conway, A. R. A. (2005). Workingmemory capacity and fluid intelligence are strongly related constructs:Comment on Ackerman, Beier, and Boyle (2005). Psychological Bulle-tin, 131, 66–71.
*Kane, M. J., Hambrick, D. Z., Tuholski, S. W., Wilhelm, O., Payne,T. W., & Engle, R. W. (2004). The generality of working-memorycapacity: A latent-variable approach to verbal and visuo-spatial memoryspan and reasoning. Journal of Experimental Psychology: General, 133,189–217.
Kellogg, C. E., & Morton, N. W. (1999). Revised Beta Examination (3rded.). San Antonio, TX: Psychological Corporation.
Kline, R. B. (1998). Principles and practice of structural equation mod-eling. New York: Guilford Press.
*La Pointe, L. B., & Engle, R. W. (1990). Simple and complex word spansas measures of working memory capacity. Journal of ExperimentalPsychology: Learning, Memory, and Cognition, 16, 1118–1133.
Lezak, M. D., Howieson, D. B., & Loring, D. W. (2004). Neuropsycho-logical assessment (4th ed.). New York: Oxford University Press.
Lobley, K. J., Baddeley, A. D., & Gathercole, S. E. (2005). Phonologicalsimilarity effects in verbal complex span. Quarterly Journal of Experi-mental Psychology, 58A, 1462–1478.
*Lustig, C., Hasher, L., & May, C. P. (2001). Working memory span andthe role of proactive interference. Journal of Experimental Psychology:General, 130, 199–207.
*Mackintosh, N. J., & Bennett, E. S. (2003). The fractionation of workingmemory maps onto different components of intelligence. Intelligence,31, 519–531.
*Masson, M. E. J., & Miller, J. A. (1983). Working memory and individualdifferences in comprehension and memory for text. Journal of Educa-tional Psychology, 75, 314–318.
Maylor, E. A., Vousden, J. I., & Brown, G. D. A. (1999). Adult agedifferences in short-term memory for serial order: Data and a model.Psychology and Aging, 14, 572–594.
McCormack, T., Brown, G. D. A., Vousden, J. I., & Henson, R. N. A.(2000). Children’s serial recall errors: Implications for theories of short-term memory development. Journal of Experimental Child Psychology,76, 222–252.
Miller, G. A., Galanter, E., & Pribram, K. H. (1960). Plans and thestructure of behavior. New York: Holt.
Mukunda, K. V., & Hall, V. C. (1992). Does performance on memory fororder correlate with performance on standardized measures of ability? Ameta-analysis. Intelligence, 16, 81–97.
Murdock, B. B. (1962). The serial position effect of free recall. Journal ofVerbal Learning and Verbal Behavior, 64, 482–488.
Nairne, J. S. (1990). A feature model of immediate memory. Memory &Cognition, 18, 251–269.
Nairne, J. S., & Kelley, M. R. (2004). Seperating item and order informa-
1064 UNSWORTH AND ENGLE
tion through process dissociation. Journal of Memory and Language, 50,113–133.
Neath, I., & Surprenant, A. M. (2003). Human memory: An introduction toresearch, data, and theory (2nd ed.). Belmont, CA: Wadsworth.
Pascual-Leone, J. (1970). A mathematical model for the transition rule inPiaget’s developmental stages. Acta Psychologica, 63, 301–345.
Pascual-Leone, J., & Johnson, J. (2004). A dialectical constructivist viewof developmental intelligence. In O. Wilhelm & R. W. Engle (Eds.),Understanding and measuring intelligence (pp. 177–201). New York:Sage.
Perfetti, C. A., & Lesgold, A. M. (1977). Discourse comprehension andsources of individual differences. In M. A. Just & P. A. Carpenter (Eds.),Cognitive processes in comprehension (pp. 141–183). Hillsdale, NJ:Erlbaum.
Raaijmakers, J. G. W., & Shiffrin, R. M. (1981). Search of associativememory. Psychological Review, 88, 93–134.
Raven, J. C., Raven, J. E., & Court, J. H. (1998). Progressive matrices.Oxford, England: Oxford Psychologists Press.
Roberts, W. A. (1972). Free recall of word lists varying in length and rateof presentation: A test of total-time hypotheses. Journal of ExperimentalPsychology, 92, 365–372.
*Rosen, V. M., & Engle, R. W. (1997). Forward and backward serial recall.Intelligence, 25, 37–47.
Shah, P., & Miyake, A. (1996). The separability of working memoryresources for spatial thinking and language processing: An individualdifferences approach. Journal of Experimental Psychology: General,125, 4–27.
*Su�, H.-M., Oberauer, K., Wittmann, W. W., Wilhelm, O., & Schulze, R.(2002). Working memory capacity explains reasoning ability—and alittle bit more. Intelligence, 30, 261–288.
Tehan, G., Hendry, L., & Kocinski, D. (2001). Word length and phono-logical similarity effects in simple, complex, and delayed serial recalltasks: Implications for working memory. Memory, 9, 333–348.
Terman, L. M. (1916). The measurement of intelligence. Boston: HoughtonMifflin.
*Tirre, W. C., & Pena, C. M. (1992). Investigation of functional workingmemory in the reading span test. Journal of Educational Psychology, 84,462–472.
Turley-Ames, K. J., & Whitfield, M. M. (2003). Strategy training andworking memory task performance. Journal of Memory and Language,49, 446–468.
Turner, M. L., & Engle, R. W. (1989). Is working memory capacity taskdependent? Journal of Memory and Language, 28, 127–154.
Underwood, B. J. (1975). Individual differences as a crucible in theoryconstruction. American Psychologist, 30, 128–134.
*Unsworth, N., & Engle, R. W. (2005). Working memory capacity andfluid abilities: Examining the correlation between operation span andRaven. Intelligence, 33, 67–81.
Unsworth, N., & Engle, R. W. (2006a). Simple and complex memory spansand their relation to fluid abilities: Evidence from list-length effects.Journal of Memory and Language, 54, 68–80.
Unsworth, N., & Engle, R. W. (2006b). A temporal–contextual retrievalaccount of complex span: An analysis of errors. Journal of Memory andLanguage, 54, 346–362.
Unsworth, N., & Engle, R. W. (2007). The nature of individual differencesin working memory capacity: Active maintenance in primary memoryand controlled search from secondary memory. Psychological Review,114, 104–132.
*Unsworth, N., Heitz, R. P., Schrock, J. C., & Engle, R. W. (2005). Anautomated version of the operation span task. Behavior Research Meth-ods, 37, 498–505.
Watkins, M. J. (1974). Concept and measurement of primary memory.Psychological Bulletin, 81, 695–711.
Watkins, M. J. (1977). The intricacy of memory span. Memory & Cogni-tion, 5, 529–534.
Watkins, M. J. (1979). Engrams as cuegrams and forgetting as cue over-load: A cueing approach to the structure of memory. In C. R. Puff (Ed.),Memory organization and structure (pp. 173–195). New York: Aca-demic Press.
Wechsler, D. (1999). Wechsler Abbreviated Scale of Intelligence. SanAntonio, TX: Psychological Corporation.
Wilde, N. J., Strauss, E., & Tulsky, D. S. (2004). Memory span on theWechsler scales. Journal of Clinical and Experimental Neuropsychol-ogy, 26, 539–549.
Wright, C. C. (1979). Duration differences between rare and commonwords and their implication for the interpretation of word frequencyeffects. Memory & Cognition, 7, 411–419.
Xu, G., Meyer, J. S., Thornby, J., Chowdhury, M., & Quach, M. (2002).Screening for mild cognitive impairment (MCI) utilizing combinedMini-Mental-Cognitive Capacity Examinations for identifying dementiaprodromes. International Journal of Geriatric Psychiatry, 17, 1027–1033.
(Appendix follows)
1065SIMPLE AND COMPLEX SPANS
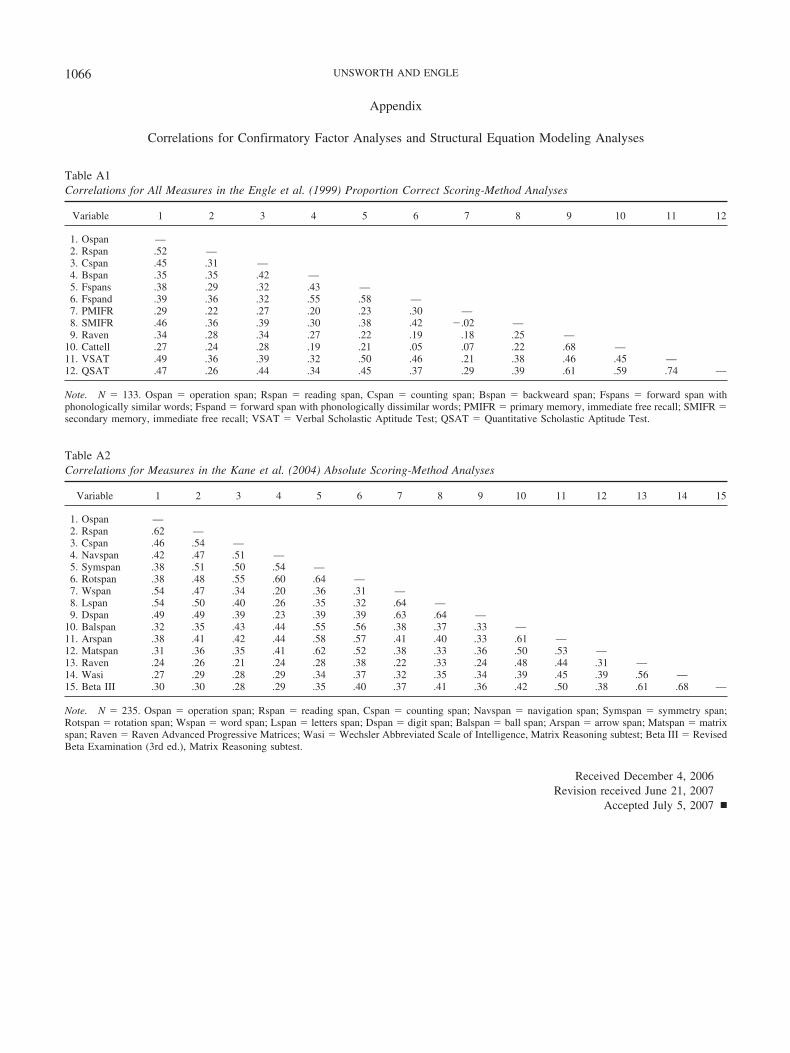
Appendix
Correlations for Confirmatory Factor Analyses and Structural Equation Modeling Analyses
Received December 4, 2006Revision received June 21, 2007
Accepted July 5, 2007 �
Table A1Correlations for All Measures in the Engle et al. (1999) Proportion Correct Scoring-Method Analyses
Variable 1 2 3 4 5 6 7 8 9 10 11 12
1. Ospan —2. Rspan .52 —3. Cspan .45 .31 —4. Bspan .35 .35 .42 —5. Fspans .38 .29 .32 .43 —6. Fspand .39 .36 .32 .55 .58 —7. PMIFR .29 .22 .27 .20 .23 .30 —8. SMIFR .46 .36 .39 .30 .38 .42 .02 —9. Raven .34 .28 .34 .27 .22 .19 .18 .25 —
10. Cattell .27 .24 .28 .19 .21 .05 .07 .22 .68 —11. VSAT .49 .36 .39 .32 .50 .46 .21 .38 .46 .45 —12. QSAT .47 .26 .44 .34 .45 .37 .29 .39 .61 .59 .74 —
Note. N � 133. Ospan � operation span; Rspan � reading span, Cspan � counting span; Bspan � backweard span; Fspans � forward span withphonologically similar words; Fspand � forward span with phonologically dissimilar words; PMIFR � primary memory, immediate free recall; SMIFR �secondary memory, immediate free recall; VSAT � Verbal Scholastic Aptitude Test; QSAT � Quantitative Scholastic Aptitude Test.
Table A2Correlations for Measures in the Kane et al. (2004) Absolute Scoring-Method Analyses
Variable 1 2 3 4 5 6 7 8 9 10 11 12 13 14 15
1. Ospan —2. Rspan .62 —3. Cspan .46 .54 —4. Navspan .42 .47 .51 —5. Symspan .38 .51 .50 .54 —6. Rotspan .38 .48 .55 .60 .64 —7. Wspan .54 .47 .34 .20 .36 .31 —8. Lspan .54 .50 .40 .26 .35 .32 .64 —9. Dspan .49 .49 .39 .23 .39 .39 .63 .64 —
10. Balspan .32 .35 .43 .44 .55 .56 .38 .37 .33 —11. Arspan .38 .41 .42 .44 .58 .57 .41 .40 .33 .61 —12. Matspan .31 .36 .35 .41 .62 .52 .38 .33 .36 .50 .53 —13. Raven .24 .26 .21 .24 .28 .38 .22 .33 .24 .48 .44 .31 —14. Wasi .27 .29 .28 .29 .34 .37 .32 .35 .34 .39 .45 .39 .56 —15. Beta III .30 .30 .28 .29 .35 .40 .37 .41 .36 .42 .50 .38 .61 .68 —
Note. N � 235. Ospan � operation span; Rspan � reading span, Cspan � counting span; Navspan � navigation span; Symspan � symmetry span;Rotspan � rotation span; Wspan � word span; Lspan � letters span; Dspan � digit span; Balspan � ball span; Arspan � arrow span; Matspan � matrixspan; Raven � Raven Advanced Progressive Matrices; Wasi � Wechsler Abbreviated Scale of Intelligence, Matrix Reasoning subtest; Beta III � RevisedBeta Examination (3rd ed.), Matrix Reasoning subtest.
1066 UNSWORTH AND ENGLE


![The%20 effects%20of%20second%20step%20on%20student%20behavior[1]](https://img.pdfslide.us/doc/110x75/58f1902c1a28abdc378b4653/the20-effects20of20second20step20on20student20behavior1.jpg)