Embed Size (px)
DESCRIPTION
http://live.gea.com/global/de/binaries/1GEA%20on%20Roadshows%20and%20Conferences%20Q1%202014%20final_tcm30-25574.pdf
Citation preview

GEA Group
Düsseldorf, May 06, 2014
Q1 2014Presentation for Roadshows and ConferencesGEA continuing operations

engineering for a better world
Disclaimer
Forward-looking statements are based on our current assumptions and forecasts. These statements naturally entail
risks and uncertainties, which may cause the actual results of operations, financial position or performance to diverge
significantly from the estimates given here. Factors that could cause such a divergence include changes in the
economic and business environment, fluctuations in exchange rates and interest rates, launches of competing
products, poor acceptance of new products or services, and changes in business strategy. We are under no obligation
to update forward-looking statements.
Due to rounding, the sum of percentages of order intake and sales by region as well as by customer industry may vary
from 100%.
2 GEA on Roadshows and Conferences - Q1 2014
engineering for a better world
Table of Contents
GEA Group in Summary
GEA on Roadshows and Conferences - Q1 2014
Pages 5 - 20
GEA Group Industry Split Page 6
Segment Performance incl. Organic Growth Rates Pages 45 – 52
Q1 2014 Results Presentation Page 24 - 39
Outlook Pages 40 – 41
GEA Group Regional Split Page 7
Historical Key Figures GEA Group and Segments Pages 61 - 65
ADR Information Page 67
3

engineering for a better world
Agenda
The GEA Group
Results Q1 2014
Backup
GEA on Roadshows and Conferences - Q1 20144

engineering for a better world
The GEA Group in Summary
• GEA provides the world with innovative solutions for smart food processing and for a more efficient use of energy resources.
• Market and technology leader for demanding equipment and process technology particularly for the food industry (72% of group sales).
• Revenue 2013: EUR 4,320 million • Emerging Market Exposure: ~40% of total sales• Operating EBIT 2013: EUR 459 million / 10.6% margin• Cash Flow Driver 2013: EUR 414 million / 9.6% of sales• Employees per 31/12/13: Around 18,000
5 GEA on Roadshows and Conferences - Q1 2014

engineering for a better world
GEA – Our Industries
6 GEA on Roadshows and Conferences - Q1 2014
FY13 Sales split: 72% Food exposure
Pharma/Chemical
Food
Beverages14%
Dairy Processing22%
23%
Milking/Farming
Others
15%
13%
13%
• 1 out of 4 liters of milk isprocessed by GEA technology
• 1 out of 3 coffeeproduction lines aroundthe world comes fromGEA
• Every 2nd liter of beer isproduced with the help ofGEA‘s processingequipment

engineering for a better world
GEA – Our Regions
GEA on Roadshows and Conferences - Q1 20147
FY13 Sales split: 40% Emerging Markets Exposure
Middle East5%
17%
Asia-Pacific
25%
Africa
9%
7%34%
4%
North America
Western Europe
Latin America
Eastern Europe & CISChina10% of Sales
USA16% of Sales
Germany9% of Sales
Top-3-Countries
engineering for a better world
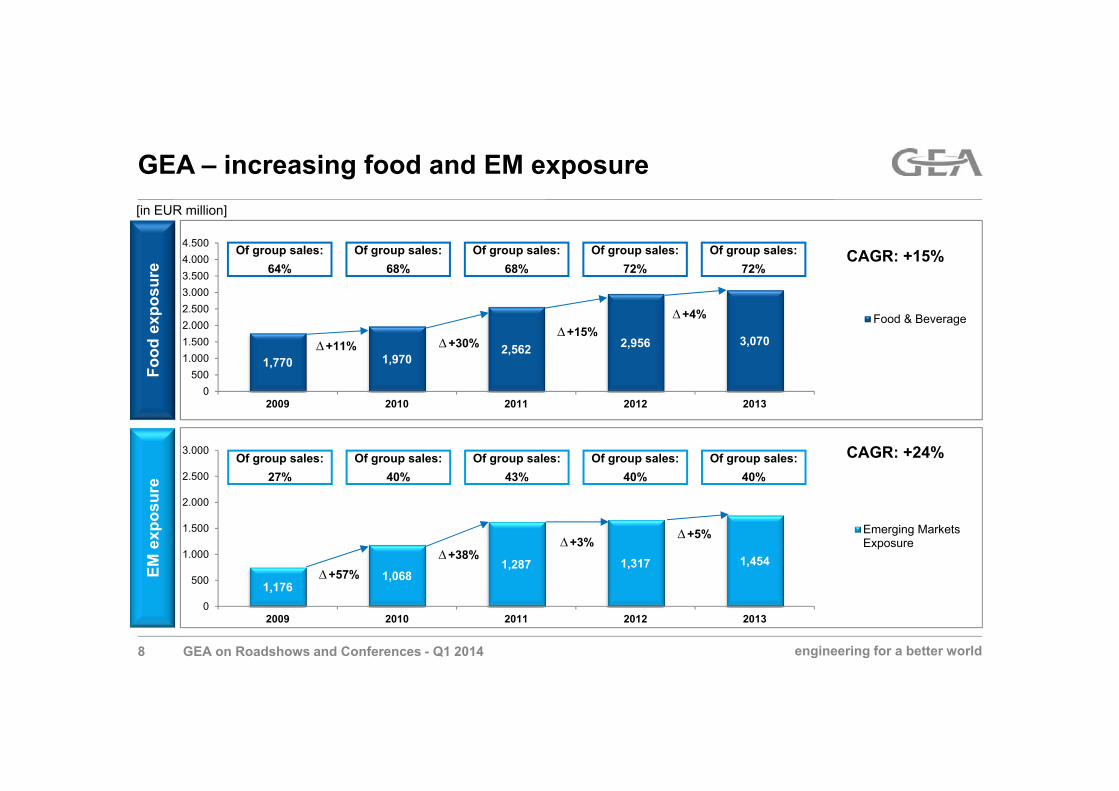
1,770 1,9702,562 2,956 3,070
0500
1.0001.5002.0002.5003.0003.5004.0004.500
2009 2010 2011 2012 2013
Food & Beverage
1,1761,068
1,287 1,317 1,454
0
500
1.000
1.500
2.000
2.500
3.000
2009 2010 2011 2012 2013
Emerging MarketsExposure
Food
exp
osur
e
[in EUR million]
GEA on Roadshows and Conferences - Q1 2014
Of group sales:64%
EM e
xpos
ure
GEA – increasing food and EM exposure
8
+11%+15%
+30%
+4%
+57%
+3%+38%
+5%
CAGR: +24%
CAGR: +15%Of group sales:68%
Of group sales:68%
Of group sales:72%
Of group sales:72%
Of group sales:27%
Of group sales:40%
Of group sales:43%
Of group sales:40%
Of group sales:40%
engineering for a better world
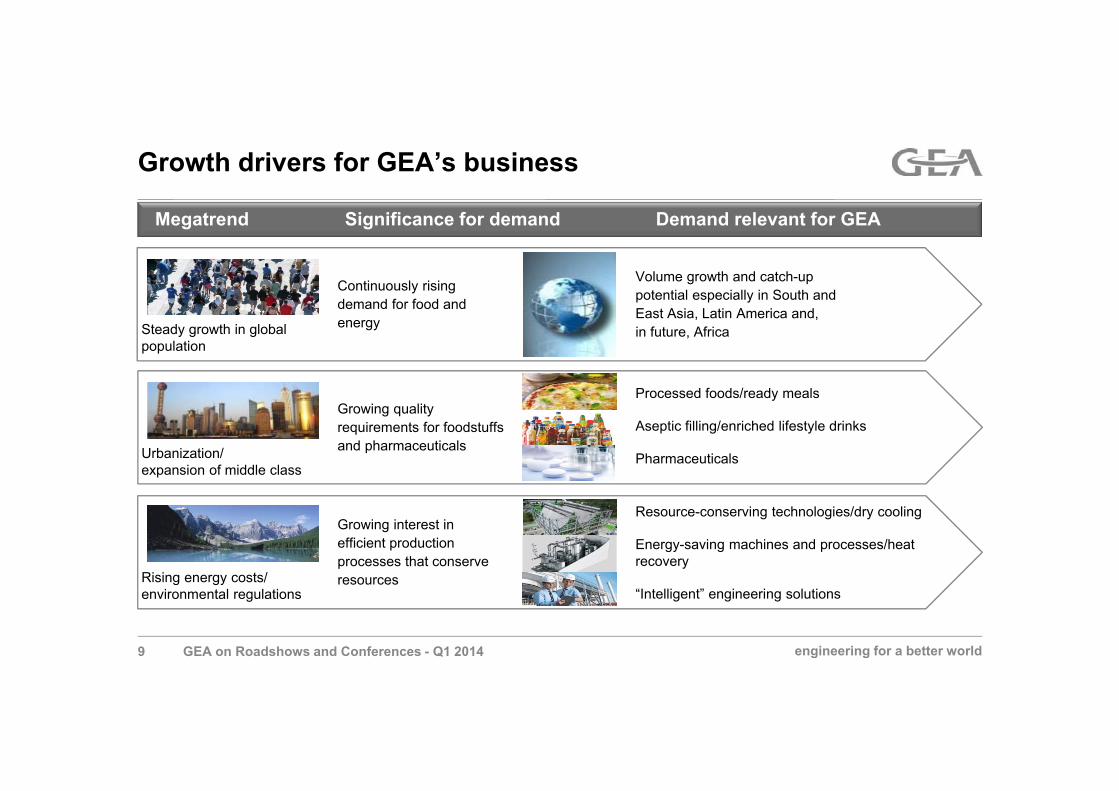
Growth drivers for GEA’s business
Megatrend Significance for demand Demand relevant for GEA
Steady growth in global population
Continuously rising demand for food and energy
Volume growth and catch-up potential especially in South and East Asia, Latin America and, in future, Africa
Growing interest in efficient production processes that conserve resources
Resource-conserving technologies/dry cooling
Energy-saving machines and processes/heat recovery
“Intelligent” engineering solutionsRising energy costs/ environmental regulations
Urbanization/expansion of middle class
Growing quality requirements for foodstuffs and pharmaceuticals
Processed foods/ready meals
Aseptic filling/enriched lifestyle drinks
Pharmaceuticals
9 GEA on Roadshows and Conferences - Q1 2014
engineering for a better world10 GEA on Roadshows and Conferences - Q1 2014
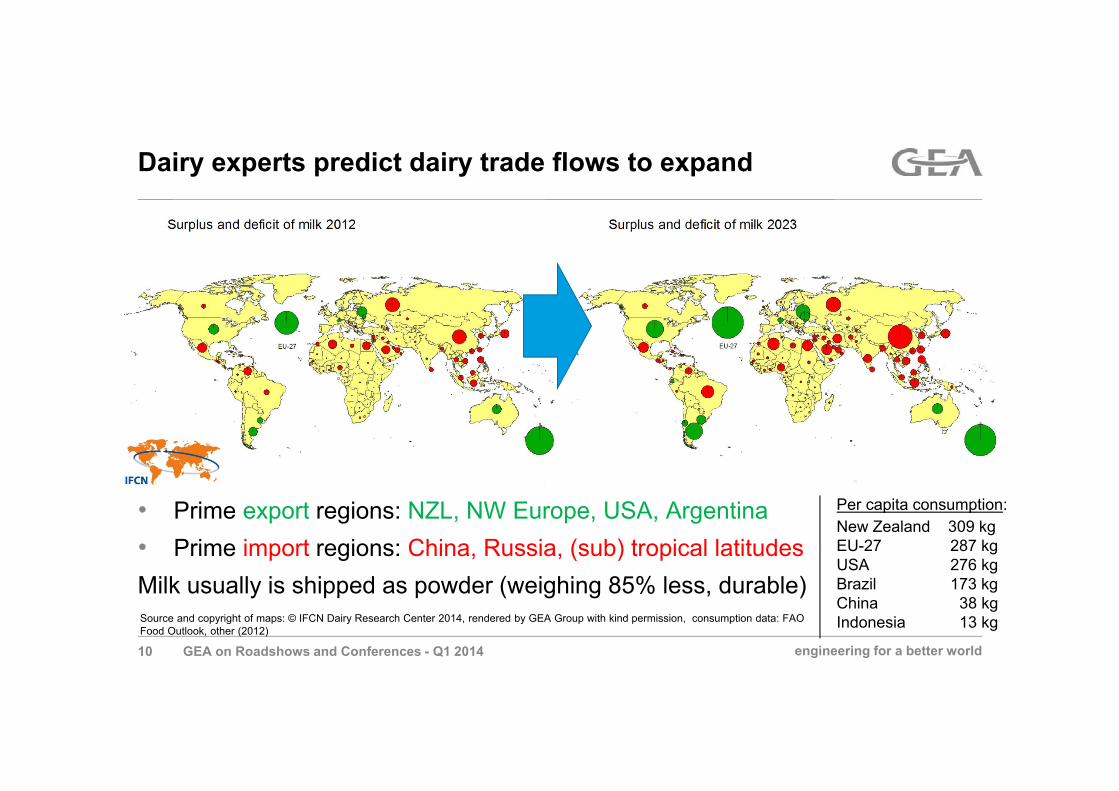
Dairy experts predict dairy trade flows to expand
• Prime export regions: NZL, NW Europe, USA, Argentina• Prime import regions: China, Russia, (sub) tropical latitudesMilk usually is shipped as powder (weighing 85% less, durable)Source and copyright of maps: © IFCN Dairy Research Center 2014, rendered by GEA Group with kind permission, consumption data: FAO Food Outlook, other (2012)
Per capita consumption:New Zealand 309 kgEU-27 287 kgUSA 276 kgBrazil 173 kg China 38 kgIndonesia 13 kg

engineering for a better world
0
20
40
60
80
100
120
140
2009 2010 2011 2012 2013
GDP GEA
GEA – Organic Sales
GEA on Roadshows and Conferences - Q1 2014
CAGR Global GDP growth 2009-2013:
+3.8%
CAGR GEA organic sales growth 2009-2013:
+5.8%
(Index 2009 = 100)
11
GEA‘s organic sales growth clearly outperforms GDP

engineering for a better worldGEA on Roadshows and Conferences - Q1 2014
722 732 802974
1,114 1,153 1,160
21.5%
26.0% 27.1%25.4%
26.9% 26.7% 26.7%
2008 2009 2010 2011 2012 2013 Q1 14 LTMService Sales GEA Service as % of Sales
GEA – Service Business
12
[in EUR million]
Service business already at EUR 1.2bn p.a.
engineering for a better world
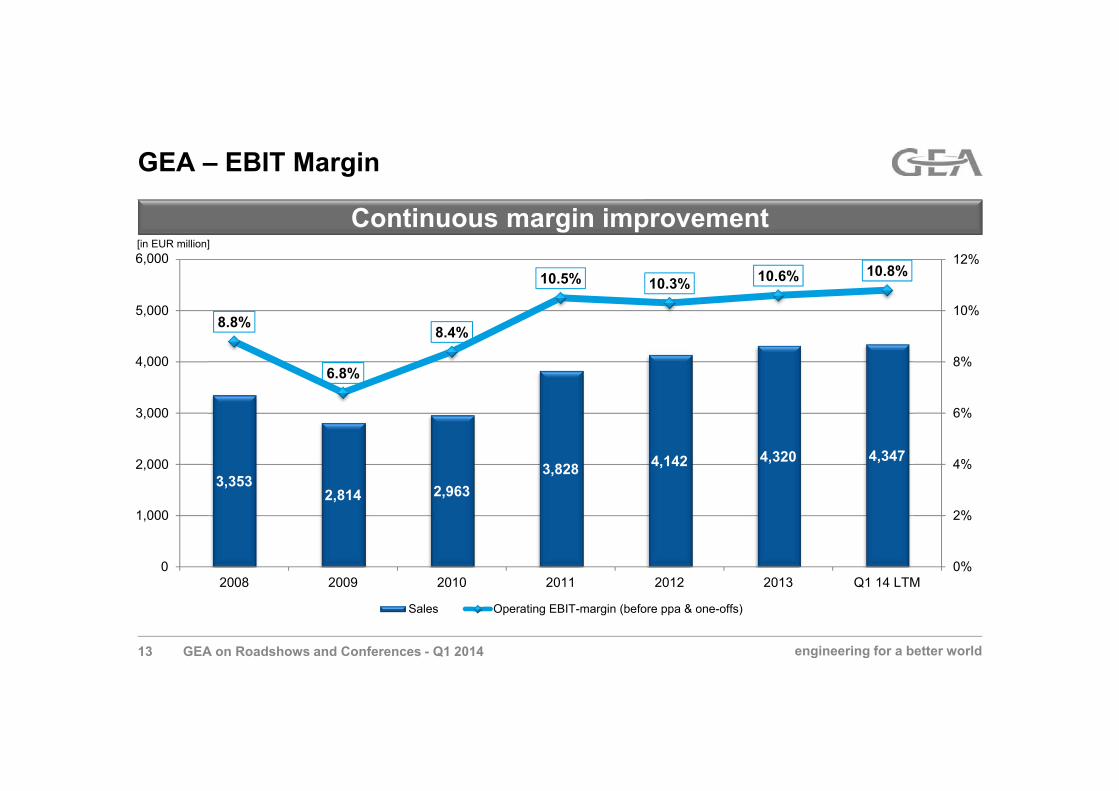
3,3532,814 2,963
3,828 4,142 4,320 4,347
8.8%
6.8%
8.4%
10.5% 10.3% 10.6% 10.8%
0%
2%
4%
6%
8%
10%
12%
0
1000
2000
3000
4000
5000
6000
2008 2009 2010 2011 2012 2013 Q1 14 LTM
Sales Operating EBIT-margin (before ppa & one-offs)
GEA – EBIT Margin
13 GEA on Roadshows and Conferences - Q1 2014
[in EUR million]6,000
5,000
4,000
3,000
2,000
1,000
Continuous margin improvement

engineering for a better world
1,772 1,830 1,873 1,887 1,890 1,891 1,886 1,895 1,900
17.5%18.6% 18.6%
16.7%
18.8% 19.3%19.6%
22.1% 22.6%
0%
5%
10%
15%
20%
25%
0
500
1000
1500
2000
2500
3000
Q1 12 Q2 12 Q3 12 Q4 12 Q1 13 Q2 13 Q3 13 Q4 13 Q1 14
Capital Employed (average LTM) ROCE (average LTM)
GEA’s major bonus driversStrong focus on cash generation and ROCE
GEA on Roadshows and Conferences - Q1 2014
[in EUR million]
14
3,000
2,500
2,000
1,500
1,000
*ROCE LTM = EBIT (LTM) / Capital employed excluding goodwill from the acquisition of the former GEA AG by the former Metallgesellschaft AG in 1999 (average LTM)
ROCE*Cash Flow Driver Margin
500
0
142173 189 207
310355
387414 404
3.6%
4.3%4.6%
5.0%
7.4%
8.3%
9.0%9.6%
9.3%
0%
1%
2%
3%
4%
5%
6%
7%
8%
9%
10%
0
50
100
150
200
250
300
350
400
450
Q1 12 Q2 12 Q3 12 Q4 12 Q1 13 Q2 13 Q3 13 Q4 13 Q1 14
Cash Flow Driver (LTM) Cash Flow Driver Margin (LTM)
engineering for a better world
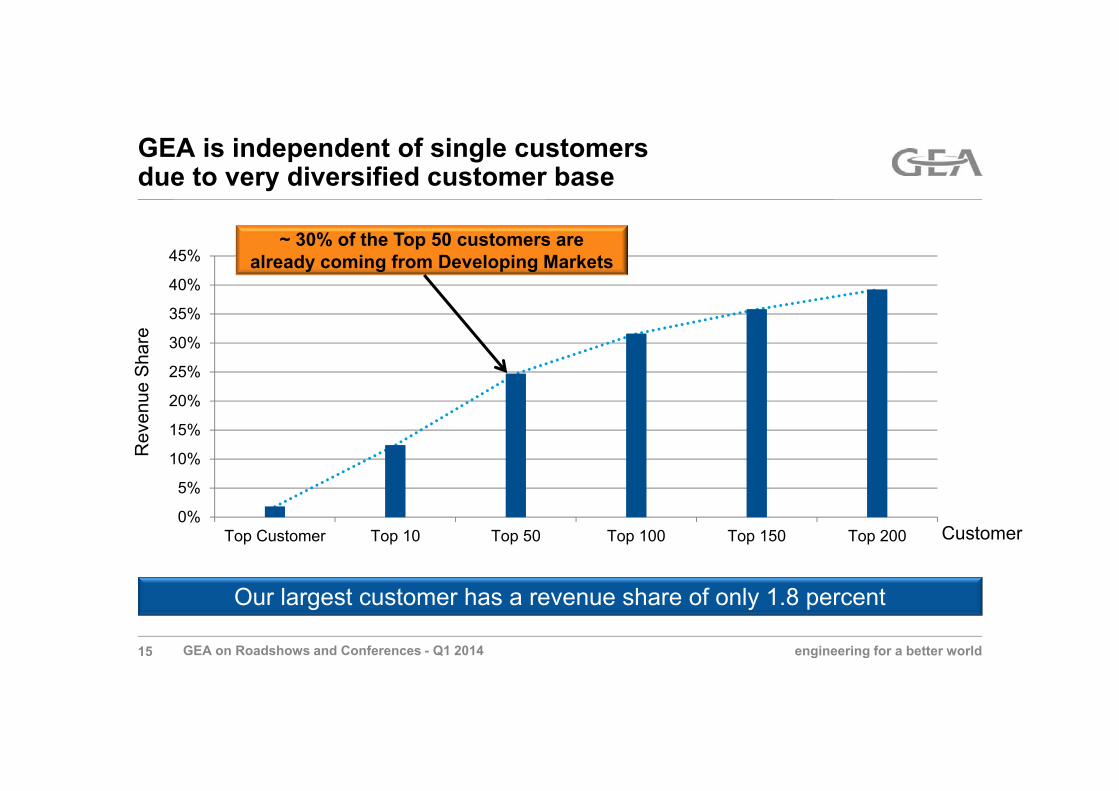
GEA is independent of single customers due to very diversified customer base
Our largest customer has a revenue share of only 1.8 percent
0%
5%
10%
15%
20%
25%
30%
35%
40%
45%
Top Customer Top 10 Top 50 Top 100 Top 150 Top 200
Rev
enue
Sha
re
Customer
GEA on Roadshows and Conferences - Q1 201415
~ 30% of the Top 50 customers arealready coming from Developing Markets

engineering for a better world
GEA – Segment Structure
16 GEA on Roadshows and Conferences - Q1 2014
Milking & Cooling
Farm Services
Farm Equipment
GEA Farm Technologies
13 %of Group Sales
~ 100 %food related
Operating EBIT FY 2013: 7.7%
ROCEFY 2013: 12.7%
Separators & Decanters
Homogenizers & Flow Components
Food Solutions
GEA Mechanical Equipment
30 %of Group Sales
~ 64 %food related
Operating EBIT FY 2013: 14.1%
ROCEFY 2013: 17.4%
Dairy and Brewery Systems
Aseptic Filling
Pharma Systems
GEA Process Engineering
40%of Group Sales
~ 75 %food related
Operating EBIT FY 2013: 10.5%
ROCEFY 2013: 73.2%
Compressors
Ice Machines
Freezers
GEA Refrigeration Technologies
17 %of Group Sales
~ 62 %food related
Operating EBIT FY 2013: 8.4%
ROCEFY 2013: 22.7%

engineering for a better world
Structured strategic realignment
HX Divestment
Long-term strategicdirection
Comprehensive portfolio analysis of all GEA BUs
2012 2013 – 2014
„GEA Fit for 2020“
Technology & Competence Mapping
Application StrategyAnalysis of >30 applications and
selected technologies
2015
GEA on Roadshows and Conferences - Q1 201417

engineering for a better world
75%
25%
Target Footprint 2020 with focus on food
Clear growth path in target applications
Expand presence in animal proteins, renewable foods* & packaging
Maintain growth in demanding non-food industries
Well-balanced application & customer portfolio
++
==
Sales exposure 2020
Organic growth and acquisitions
Grow market position in milk production, dairy & liquid food processing
FoodNon-Food
++
* e.g. edible oils or starch
GEA on Roadshows and Conferences - Q1 201418

engineering for a better world
Holistic approach to deriving target footprint 2020
GEA on Roadshows and Conferences - Q1 201419
GEA presence & white spots plotted across application process value chain
>30 applications & technologies
Applications and strategic moves evaluated for relative attractiveness and prioritized
Customer buying preferences discussed in >100 client & GEA expert interviews
Suitable business models and roadmap for closing white spots developed by application

engineering for a better world
Business model & organizational cornerstones
GEA on Roadshows and Conferences - Q1 201420
Best-in-class components and engineering that meet customers’ specific application and regional preferences
Cross-business collaboration to deliver best value to customer on a global scale
Operational and organizational excellence
“Fit for 2020”

engineering for a better world21
Increasingly stringent hygiene and safety regulations in end markets
Growth driven by shift in consumer preferences towards functional, processed and convenience foods
Global leading positions with exceptionally high barriers to entry
Unrivalled quality and breadth of product range
Pure Play: Highly focused and resilient end market exposure
Balanced income split resting on strong food share of revenue of around 70-75 percent
1
2
3
4
5
6
The GEA VisionKey investment case post strategy implementation
GEA on Roadshows and Conferences - Q1 201421


engineering for a better world
Agenda
The GEA Group
Results Q1 2014
Backup
GEA on Roadshows and Conferences - Q1 201423
engineering for a better world
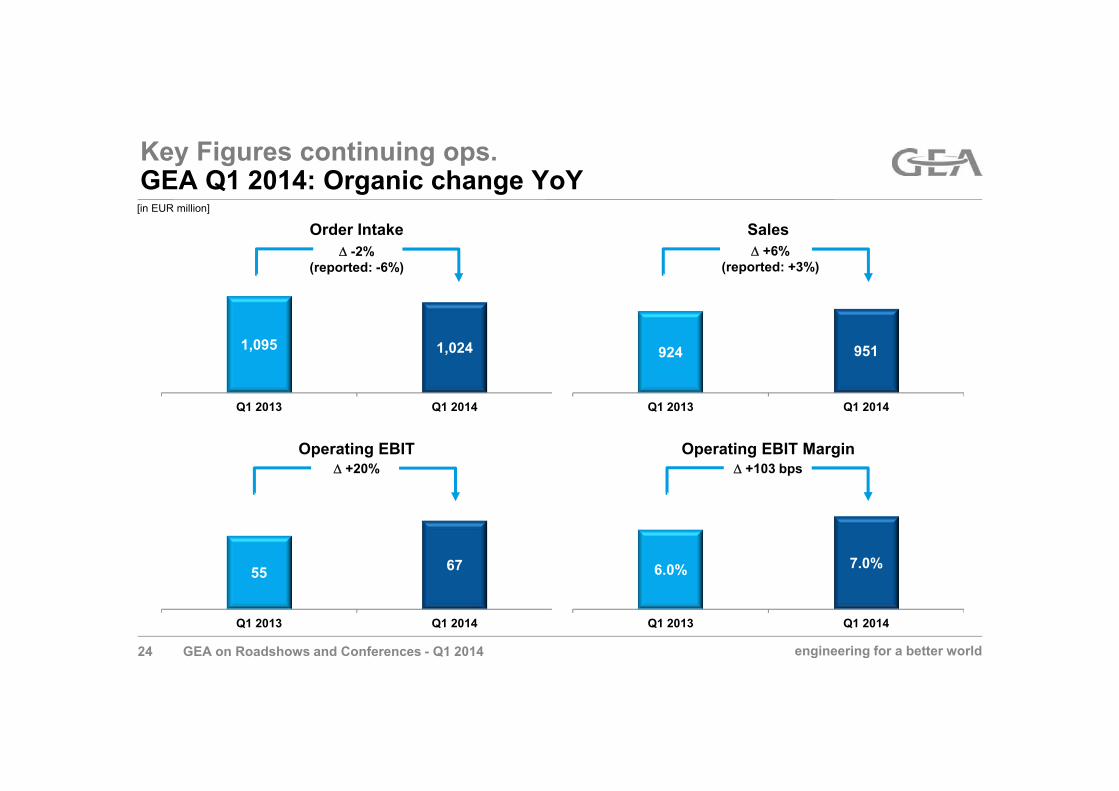
-2%(reported: -6%)
1,095 1,024
Q1 2013 Q1 2014
[in EUR million]
Order Intake +6%
(reported: +3%)
924 951
Q1 2013 Q1 2014
Sales
+20%
55 67
Q1 2013 Q1 2014
Operating EBIT +103 bps
6.0% 7.0%
Q1 2013 Q1 2014
Operating EBIT Margin
Key Figures continuing ops.GEA Q1 2014: Organic change YoY
GEA on Roadshows and Conferences - Q1 201424
engineering for a better world
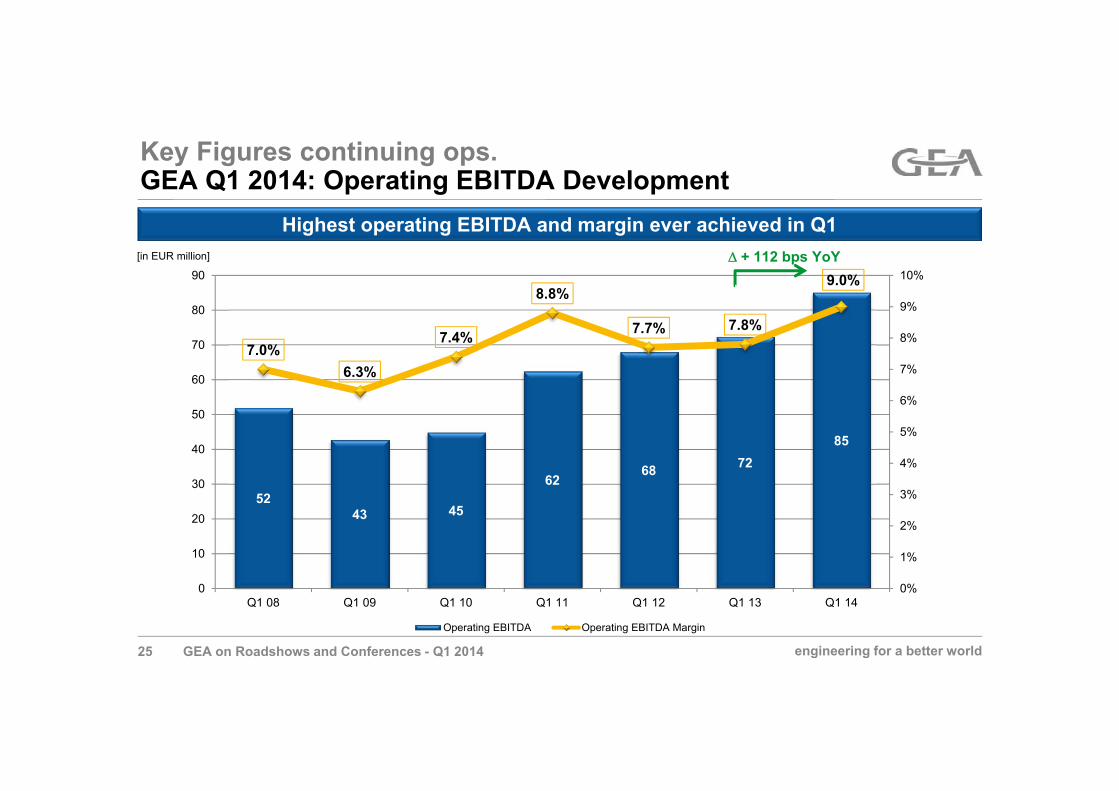
Key Figures continuing ops.GEA Q1 2014: Operating EBITDA Development
5243 45
6268 72
85
7.0%6.3%
7.4%
8.8%
7.7% 7.8%
9.0%
0%
1%
2%
3%
4%
5%
6%
7%
8%
9%
10%
0
10
20
30
40
50
60
70
80
90
Q1 08 Q1 09 Q1 10 Q1 11 Q1 12 Q1 13 Q1 14
Operating EBITDA Operating EBITDA Margin
+ 112 bps YoY[in EUR million]
Highest operating EBITDA and margin ever achieved in Q1
GEA on Roadshows and Conferences - Q1 201425
engineering for a better world
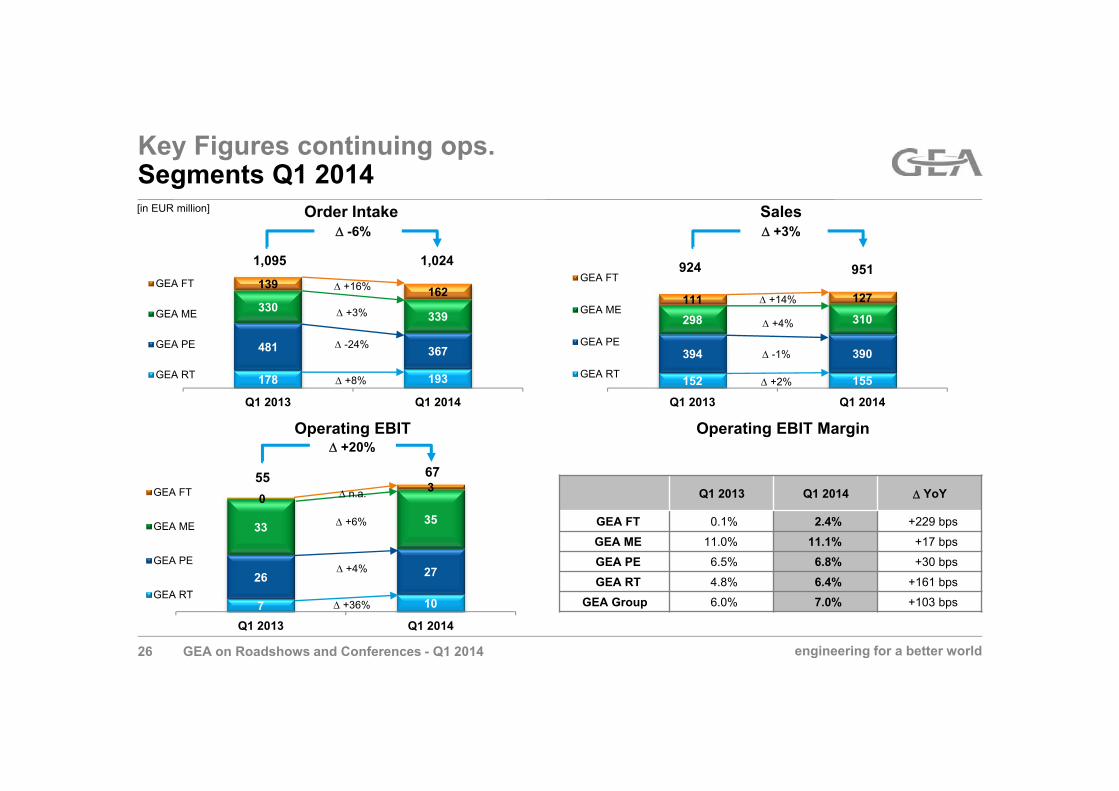
7 10
26 27
33 350
3
Q1 2013 Q1 2014
GEA FT
GEA ME
GEA PE
GEA RT
178 193
481 367
330339
139 162
Q1 2013 Q1 2014
GEA FT
GEA ME
GEA PE
GEA RT
Key Figures continuing ops.Segments Q1 2014
1,095 1,024
+3%
-24%
+8%
+16%
Operating EBIT Margin
[in EUR million]
-6%Order Intake
152 155
394 390
298 310111 127
Q1 2013 Q1 2014
GEA FT
GEA ME
GEA PE
GEA RT
924 951
+4%
-1%
+2%
+14%
+3%Sales
55 67
+4%
+6%
+36%
n.a.
+20%Operating EBIT
Q1 2013 Q1 2014 YoY
GEA FT 0.1% 2.4% +229 bps
GEA ME 11.0% 11.1% +17 bps
GEA PE 6.5% 6.8% +30 bps
GEA RT 4.8% 6.4% +161 bps
GEA Group 6.0% 7.0% +103 bps
GEA on Roadshows and Conferences - Q1 201426

engineering for a better world
[in EUR million]
Organic Growth Q1 2014 YoY: -2.5% due to missing large orders; base business strong +7% YoY
1,095
Q1 2014
1,024
OrganicFXQ1 2013
-4.0%
-2.5%
-44
-27
Q1 2014
1,024
Large Orders > EUR 15m
Orders > EUR 5m < EUR 15m
Base Orders < EUR 5m
Q1 2013
1,095 -88
+59
-8.0%
+5.4%
-6.5% -6.5%
Order Intake Bridge
-42
-3.8%
GEA on Roadshows and Conferences - Q1 201427

engineering for a better world
496 519 518 576 596 619705 686 669 737 711 702 745 710 722 724 747 754
163 157 139149 173 168
185 166 208214
172 221 175144
234 167211 160
38 61 6563
64135
135128 111
96102
124 107131
102132 67 88
16 40 3366 41
60 58100
4465 112
110
162144 121
22
0
200
400
600
800
1.000
1.200
1.400
Q1 10 Q2 10 Q3 10 Q4 10 Q1 11 Q2 11(w/o FS)
Q2 11(incl.FS)
Q3 11 Q4 11 Q1 12 Q2 12 Q3 12 Q4 12 Q1 13 Q2 13 Q3 13 Q4 13 Q1 14
OI < EUR 1m OI >= EUR 1m < EUR 5m OI >= EUR 5m < EUR 15m OI >= EUR 15m
Performance continuing ops.Large Order Development since Q1 2010[in EUR million]
~7% YoY growth in orders < EUR 5m in Q1 2014 = good growth in base business
GEA on Roadshows and Conferences - Q1 201428

engineering for a better world
0 100 200 300 400 500 600
Q1 13Q2 13Q3 13Q4 13Q1 14
0 300 600 900 1200
Q1 13Q2 13Q3 13Q4 13Q1 14
0 100 200 300 400 500 600
Q1 13Q2 13Q3 13Q4 13Q1 14
0 100 200 300 400 500 600
Q1 13Q2 13Q3 13Q4 13Q1 14
0 100 200 300 400 500 600
Q1 13Q2 13Q3 13Q4 13Q1 14
0 100 200 300 400 500 600
Q1 13Q2 13Q3 13Q4 13Q1 14
0 100 200 300 400 500 600
Q1 13Q2 13Q3 13Q4 13Q1 14
0 100 200 300 400 500 600
Q1 13Q2 13Q3 13Q4 13Q1 14
Eastern Europe & CISWestern Europe
Asia Pacific
North America ∆ QoQ: -1% w/o LO*: -11%
∆ YoY: -17% w/o LO*: +8%
∆ QoQ: -32% w/o LO*: -40%
∆ YoY: -43% w/o LO*: -26%
∆ QoQ: +8% w/o LO*: -11%
∆ YoY: 0% w/o LO*: -18%
∆ QoQ: +38% w/o LO*: +22%
∆ YoY: -5% w/o LO*: +6%
∆ QoQ: -31% w/o LO*: -17%
∆ YoY: -2% w/o LO*: +25%
∆ QoQ: +10% w/o LO*: +10%
∆ YoY: -15% w/o LO*: -15%
∆ QoQ: -8% w/o LO*: +8%
∆ YoY: +5% w/o LO*: +9%
∆ QoQ: -10% w/o LO*: -5%
∆ YoY: -6% w/o LO*: +7%
[in EUR million]
Latin America
Middle EastAfrica GEA
* LO: large orders with volume of greater than EUR 5m are illustrated at the end of the bars.
Performance continuing ops.Regional Order Intake Trend as of Q1 2014
GEA on Roadshows and Conferences - Q1 201429

engineering for a better world
35%(33%)
25%(25%)
17%(18%)
9%(9%)
7%(7%)
4%(4%)
4%(4%)
Emerging markets* exposure: 40% (40%)
abs.: +2% YoY(Durchschnitt der Definition von Dow
Jones und MSCI*)
Sales L4Q per Q1 2014:EUR 4,347m
+4% YoY
Performance continuing ops.Regional Sales Split L4Q per Q1 2014
China10% (9%) abs.: +11% YoY
USA16% (17%) abs.: -1% YoY
Germany9% (8%) abs.: +10% YoY
Top-3-Countries
Western Europe abs.: +11% YoY
Asia-Pacific abs.: +4% YoY
North America abs.: -2% YoY
Latin America abs.: -2% YoY
Eastern Europe & CIS abs.: -4% YoY
Middle East abs.: +12% YoY
Africa abs.: -4% YoY
* According to the definition of emerging/developing economies by International Monetary Fund. Dow Jones Emerging Markets Index besteht aus 35 Ländern, von denen 20 für GEA relevant sind; MSCI definiert 21 Länder als Emerging Markets, von denen 17 für GEA relevant sind
GEA on Roadshows and Conferences - Q1 201430

engineering for a better world
13%
26%
22%
12%
12%
16%
OI L4Q per Q1 2014:
EUR 4,557m+4% YoY
Performance continuing ops.Order Intake by Customer Industry since Q4 2009*
* Average last four quarters: Q1 – Q4 2009 = Index 100
80%100%120%140%160%180%200%220%
Q409
Q110
Q210
Q310
Q410
Q111
Q211
Q311
Q411
Q112
Q212
Q312
Q412
Q113
Q213
Q313
Q413
Q114
Milking/Farming Dairy Processing GEA Group
80%
100%
120%
140%
160%
180%
Q409
Q110
Q210
Q310
Q410
Q111
Q211
Q311
Q411
Q112
Q212
Q312
Q412
Q113
Q213
Q313
Q413
Q114
Pharma/Chemical Other Industries GEA Group
80%
100%
120%
140%
160%
180%
Q409
Q110
Q210
Q310
Q410
Q111
Q211
Q311
Q411
Q112
Q212
Q312
Q412
Q113
Q213
Q313
Q413
Q114
Food Beverages GEA Group
Milking/Farming abs.: +8% YoY
Dairy Processing abs.: +32% YoY
Food abs.: -3% YoY
Beverages abs.: -19% YoY
Pharma & Chemical abs.: -12% YoY
Other Industries abs.: +11% YoY
GEA on Roadshows and Conferences - Q1 201431

engineering for a better world
Performance continuing ops.Book to Bill Ratios by Industry/Region L4Q
<= 0.8 > 0.8 and < 1.0 >= 1.2> 1.0 and < 1.2Colour code: Only cross-sections with a share of > 1% of group order intake are colored
Book to Bill categories
BtB % of OI BtB % of OI BtB % of OI BtB % of OI BtB % of OI BtB % of OI BtB % of OI BtB % of OI
Strong BtB-Ratios in Dairy Processing, Western Europe and Asia-Pacific
Book to bill ratio (L4Q) Q1 2014
Milking / Farming 1,06 5,3% 1,04 1,3% 1,03 4,3% 1,05 0,9% 1,00 0,0% 0,93 0,1% 1,01 1,4% 1,04 13,3%
Dairy Processing 1,61 12,2% 0,95 1,7% 0,67 2,3% 1,03 1,4% 1,02 0,7% 0,82 0,7% 1,26 7,2% 1,23 26,0%
Food 1,00 8,8% 0,76 1,7% 1,01 3,1% 1,23 1,5% 1,18 1,5% 1,11 0,9% 1,06 4,2% 1,01 21,7%
Beverages 0,76 3,0% 1,12 1,6% 0,60 0,9% 0,41 0,4% 1,35 0,9% 1,05 0,5% 0,90 4,2% 0,84 11,6%
Food & Beverages 1,16 29,3% 0,94 6,3% 0,87 10,6% 0,95 4,2% 1,18 3,1% 0,98 2,1% 1,08 17,0% 1,05 72,6%
Pharma 1,09 2,2% 0,90 0,6% 1,24 1,1% 1,13 0,5% 1,03 0,2% 1,54 0,3% 1,05 2,3% 1,09 7,3%
Chemical 0,75 1,0% 1,00 0,2% 0,94 0,9% 0,87 0,4% 1,40 0,1% 0,19 0,1% 1,07 1,9% 0,86 4,6%
Pharma/Chemical 0,95 3,3% 0,92 0,8% 1,08 2,0% 1,01 0,9% 1,08 0,3% 0,62 0,4% 1,06 4,2% 0,99 11,9%
Environment 1,06 1,5% 1,33 0,3% 0,67 0,5% 0,48 0,1% 0,35 0,0% 0,91 0,1% 1,56 1,4% 1,06 4,0%
Oil & Gas 1,76 0,8% 2,67 0,4% 0,93 0,8% 0,23 0,0% 0,32 0,0% 0,33 0,2% 1,17 1,5% 1,07 3,6%
Marine 0,94 1,3% 1,21 0,0% 1,02 0,1% 0,82 0,1% 0,75 0,0% 0,95 0,0% 1,43 1,6% 1,14 3,2%
Power 1,16 0,3% 12,05 0,3% 1,38 0,1% 0,98 0,2% 0,89 0,1% 0,80 0,3% 1,14 0,1% 1,23 1,4%
Others 1,01 1,0% 1,52 0,3% 1,08 0,3% 0,69 0,2% 0,97 0,1% 0,71 0,1% 1,06 1,2% 1,02 3,3%
Other Industries 1,09 4,9% 2,12 1,4% 0,88 1,9% 0,64 0,6% 0,64 0,3% 0,62 0,8% 1,29 5,7% 1,08 15,5%
Total 1,13 37,4% 1,03 8,5% 0,90 14,5% 0,91 5,7% 1,10 3,7% 0,81 3,3% 1,12 26,9% 1,05 100,0%
WesternEurope
Eastern Europe & CIS
North America Latin America Africa Middle - East Asia - Pacific Total
GEA on Roadshows and Conferences - Q1 201432
engineering for a better world
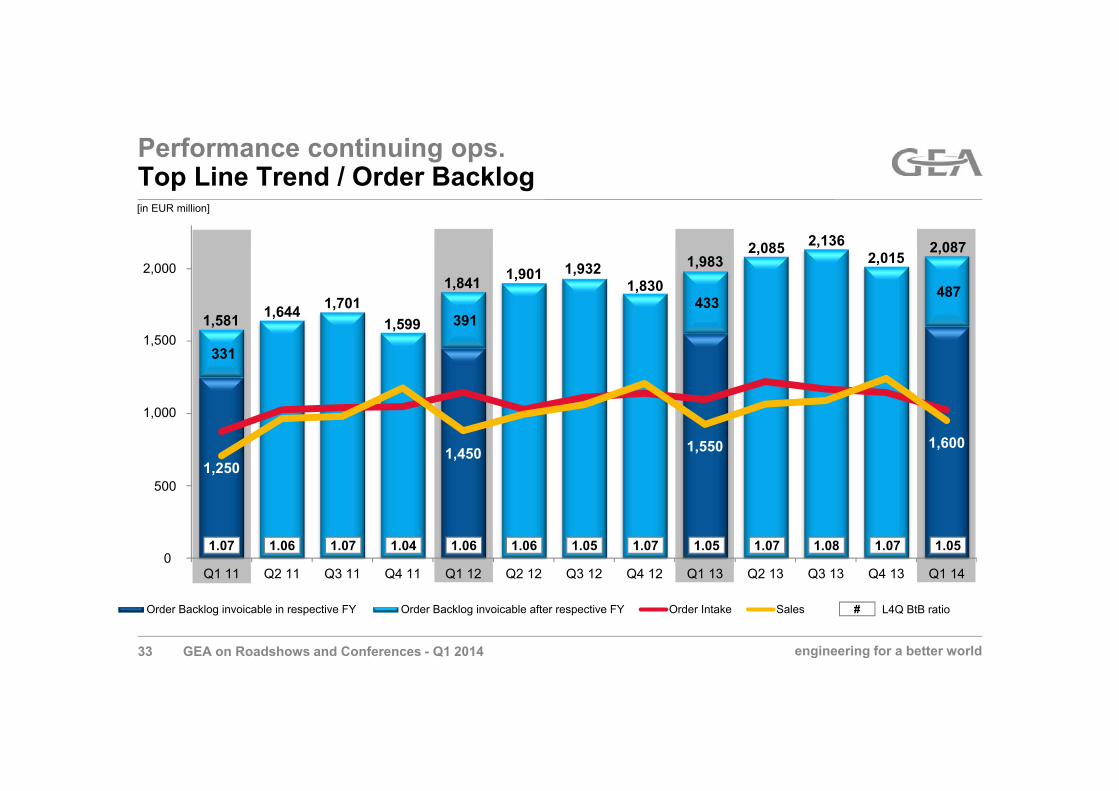
1,2501,450 1,550 1,600
331
391 433
487
0
500
1000
1500
2000
Q1 11 Q2 11 Q3 11 Q4 11 Q1 12 Q2 12 Q3 12 Q4 12 Q1 13 Q2 13 Q3 13 Q4 13 Q1 14
Order Backlog invoicable in respective FY Order Backlog invoicable after respective FY Order Intake Sales
2,000
1,500
1,000
500
0
Performance continuing ops.Top Line Trend / Order Backlog
2,136
1,581 1,644 1,7011,599
1,841 1,9011,983
2,085
1,8301,932
L4Q BtB ratio
1.07 1.04 1.06 1.06 1.07 1.081.07 1.06 1.05 1.07 1.05
#
[in EUR million]
2,015
1.07 1.05
2,087
GEA on Roadshows and Conferences - Q1 201433

engineering for a better world
1,772 1,830 1,873 1,887 1,890 1,891 1,886 1,895 1,900
17.5%18.6% 18.6%
16.7%
18.8% 19.3% 19.6%
22.1% 22.6%
0%
5%
10%
15%
20%
25%
0
500
1000
1500
2000
2500
3000
Q1 12 Q2 12 Q3 12 Q4 12 Q1 13 Q2 13 Q3 13 Q4 13 Q1 14
Capital Employed (average LTM) ROCE (average LTM)
Performance continuing ops.ROCE increases above 22%[in EUR million]
*ROCE LTM = EBIT (LTM) / Capital employed excluding goodwill from the acquisition of the former GEA AG by the former Metallgesellschaft AG in 1999 (average LTM)
0
3,000
2,500
2,000
1,500
1,000
500
+ 381 bps YoY
GEA on Roadshows and Conferences - Q1 201434
engineering for a better world
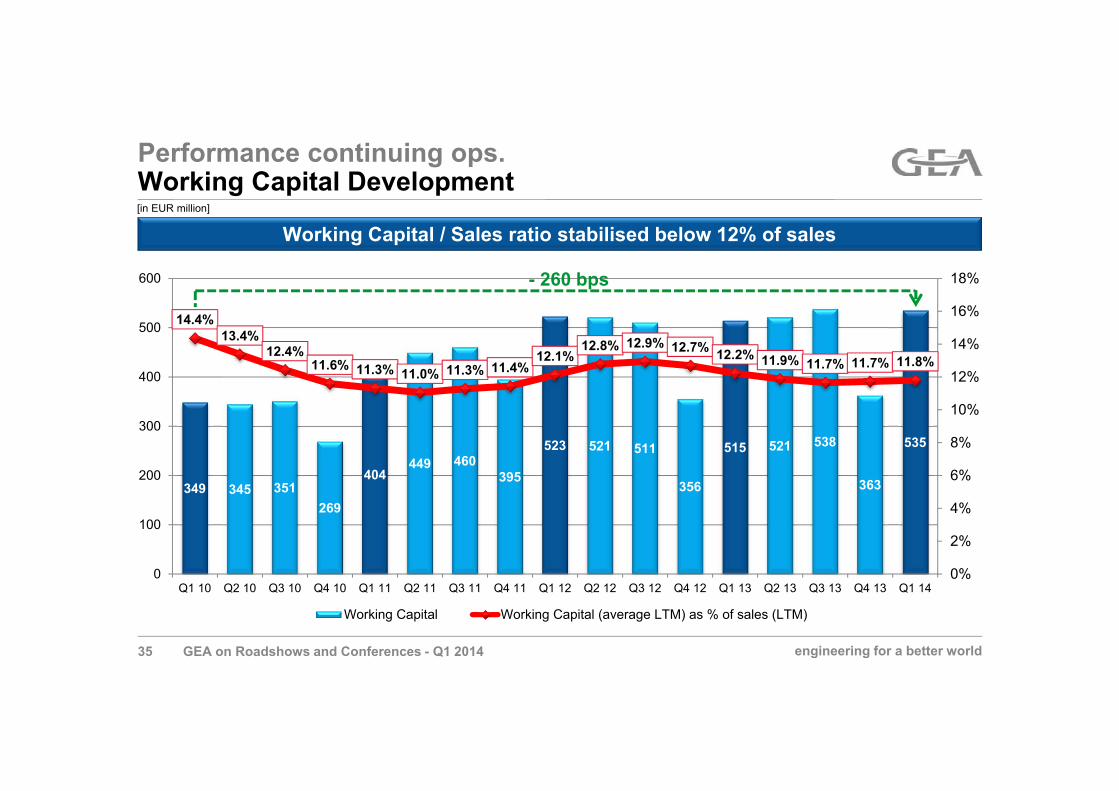
349 345 351269
404449 460
395
523 521 511
356
515 521 538
363
535
14.4%13.4%
12.4%11.6% 11.3% 11.0% 11.3% 11.4%
12.1%12.8% 12.9% 12.7% 12.2% 11.9% 11.7% 11.7% 11.8%
0%
2%
4%
6%
8%
10%
12%
14%
16%
18%
0
100
200
300
400
500
600
Q1 10 Q2 10 Q3 10 Q4 10 Q1 11 Q2 11 Q3 11 Q4 11 Q1 12 Q2 12 Q3 12 Q4 12 Q1 13 Q2 13 Q3 13 Q4 13 Q1 14
Working Capital Working Capital (average LTM) as % of sales (LTM)
- 260 bps
[in EUR million]
Working Capital / Sales ratio stabilised below 12% of sales
Performance continuing ops.Working Capital Development
GEA on Roadshows and Conferences - Q1 201435

engineering for a better world
142173 189 207
310355
387414 404
3.6%
4.3%4.6%
5.0%
7.4%
8.3%
9.0%9.6%
9.3%
0%
1%
2%
3%
4%
5%
6%
7%
8%
9%
10%
0
50
100
150
200
250
300
350
400
450
Q1 12 Q2 12 Q3 12 Q4 12 Q1 13 Q2 13 Q3 13 Q4 13 Q1 14
Cash Flow Driver (LTM) Cash Flow Driver Margin (LTM)
Performance continuing ops.Cash Flow Driver Margin Development [in EUR million]
527404
122 -1
512 513
Ø WC Q2 12-Q1 13
Ø WC Q2 13-Q1 14
Cash Flow Driver LTM per Q1 14
WC LTMCAPEX LTM per Q1 14
EBITDA LTM per Q1 14
GEA on Roadshows and Conferences - Q1 201436

engineering for a better world
[in EUR million]
Cash generation LTM: EUR ~230m
Performance Net Liquidity Reconciliation incl. GEA HX
-105.9Dividend
Net Debt 31.03.2014 -432.4
CAPEX -154.4
Delta Working Capital -67.2
-261.1
-84.6
Net Debt bef. DOP, M&A and Dividend
-58.4Discontinuing Operations
Taxes / Interests
-7.0
-129.3
Others
668.4
Net Debt 31.03.2013 -494.0
Effect from acquisitions
EBITDA
+EUR 233m
GEA on Roadshows and Conferences - Q1 201437
engineering for a better world
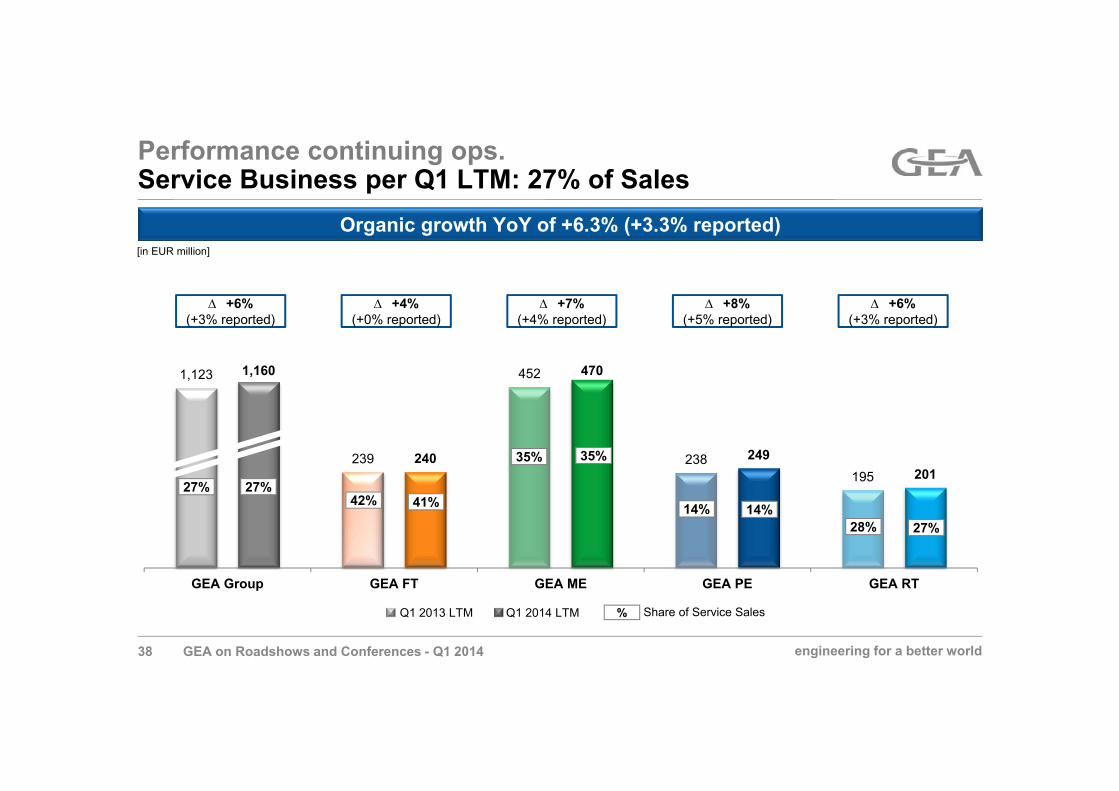
Performance continuing ops.Service Business per Q1 LTM: 27% of Sales
1,123
239
452
238195
1,160
240
470
249201
GEA Group GEA FT GEA ME GEA PE GEA RT
Share of Service Sales
Organic growth YoY of +6.3% (+3.3% reported)
+6%(+3% reported)
%
27% 27%41%
35% 35%
14% 14%28% 27%
42%
[in EUR million]
Q1 2013 LTM Q1 2014 LTM
+4%(+0% reported)
+7%(+4% reported)
+8%(+5% reported)
+6%(+3% reported)
GEA on Roadshows and Conferences - Q1 201438

engineering for a better world
Performance continuing ops.Summary Segment Performance Q1 2014 YoY
Q1 13 Q1 14 organic
Order Intake 329.7 339.1 +2.9 +5.3
Sales 298.1 310.0 +4.0 +6.5
Operating EBIT
32.7 34.5 +5.6
Operating EBIT Margin
11.0% 11.1% +17bps
Q1 13 Q1 14 organic
Order Intake 138.8 161.6 +16.5 +21.6
Sales 110.8 126.6 +14.3 +20.2
Operating EBIT
0.1 3.1 n.a.
Operating EBIT Margin
0.1% 2.4% +229bps
GEA FT GEA ME
GEA PE GEA RT
[in EUR million]
Q1 13 Q1 14 organic
Order Intake 481.3 366.7 -23.8 -19.7
Sales 394.3 390.7 -0.9 +1.5
Operating EBIT
25.7 26.6 +3.6
OperatingEBIT Margin
6.5% 6.8% +30bps
Q1 13 Q1 14 organic
Order Intake 177.9 192.9 +8.4 +13.5
Sales 152.1 154.9 +1.9 +5.3
Operating EBIT
7.3 10.0 +36.0
OperatingEBIT Margin
4.8% 6.4% +161bps
GEA on Roadshows and Conferences - Q1 201439
engineering for a better world
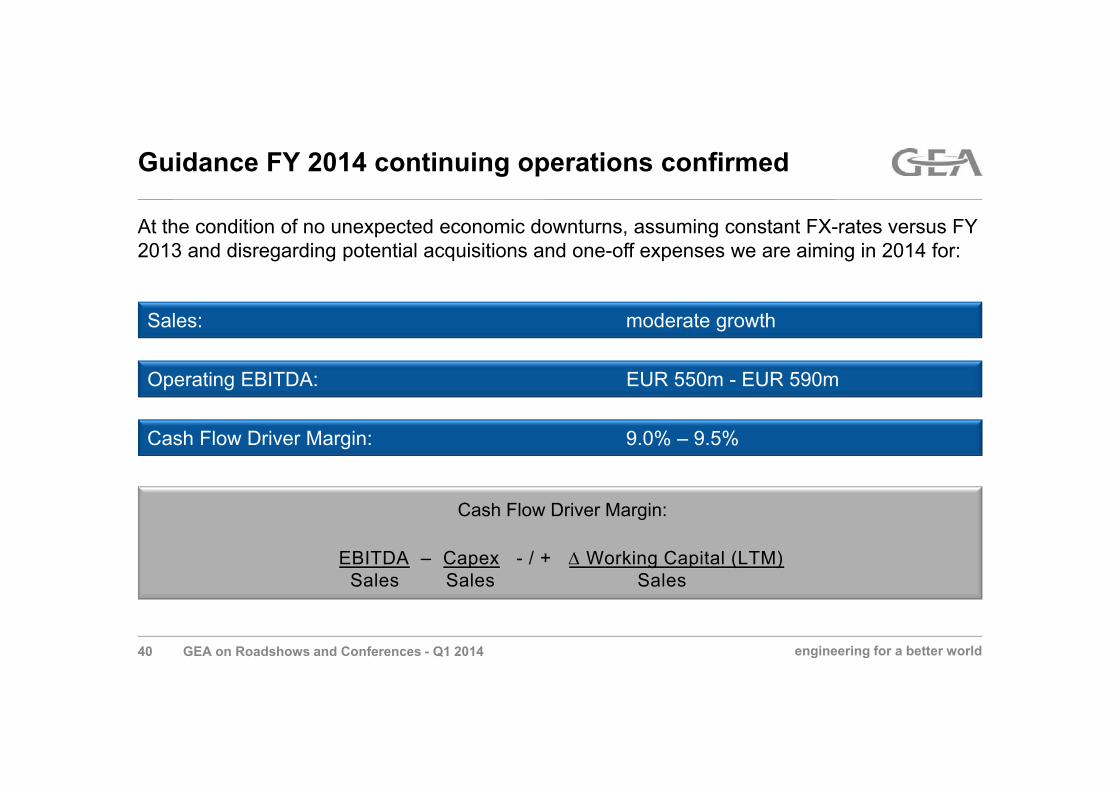
Guidance FY 2014 continuing operations confirmed
Sales: moderate growth
Cash Flow Driver Margin:
EBITDA – Capex - / + Working Capital (LTM)Sales Sales Sales
Operating EBITDA: EUR 550m - EUR 590m
At the condition of no unexpected economic downturns, assuming constant FX-rates versus FY 2013 and disregarding potential acquisitions and one-off expenses we are aiming in 2014 for:
Cash Flow Driver Margin: 9.0% – 9.5%
GEA on Roadshows and Conferences - Q1 201440
engineering for a better world
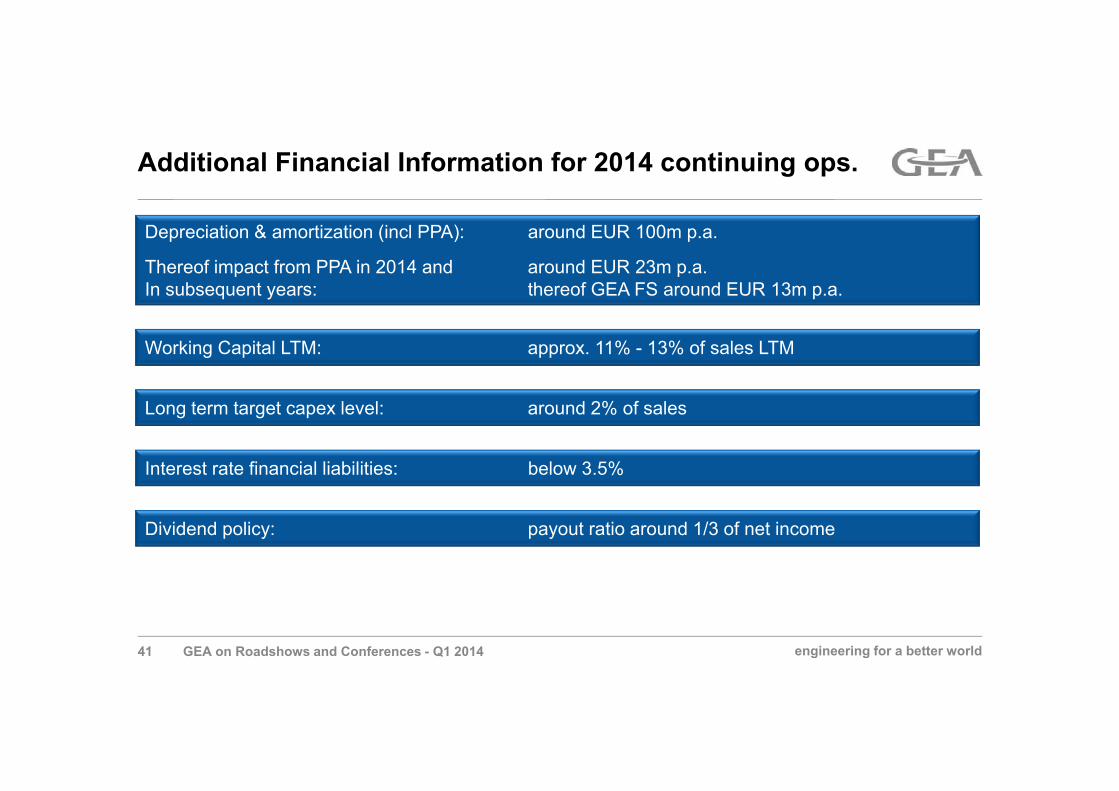
Additional Financial Information for 2014 continuing ops.
Depreciation & amortization (incl PPA): around EUR 100m p.a.
Thereof impact from PPA in 2014 and around EUR 23m p.a.In subsequent years: thereof GEA FS around EUR 13m p.a.
Long term target capex level: around 2% of sales
Working Capital LTM: approx. 11% - 13% of sales LTM
Dividend policy: payout ratio around 1/3 of net income
Interest rate financial liabilities: below 3.5%
GEA on Roadshows and Conferences - Q1 201441

engineering for a better world
Investor Relations CalendarUpcoming Roadshows and Conferences
May 7, 2014 Roadshow Germany Frankfurt
May 22, 2014 Conference Sweden Stockholm
May 13, 2014 Conference Netherlands Amsterdam
May 14, 2014 Roadshow France Paris
June 3, 2014 Roadshow Germany Munich
June 11 - 13, 2014 Conference Germany Berlin
June 11 - 13, 2014 Conferences UK London
July 10 – 11, 2014 Capital Markets Day London
GEA on Roadshows and Conferences - Q1 201442

engineering for a better world
Financial Calendar
July 28, 2014 Interim Report Q2 2014
October 28, 2014 Interim Report Q3 2014
GEA on Roadshows and Conferences - Q1 201443

engineering for a better world
Agenda
The GEA Group
Results FY 2013
Backup
GEA on Roadshows and Conferences - Q1 201444
engineering for a better world
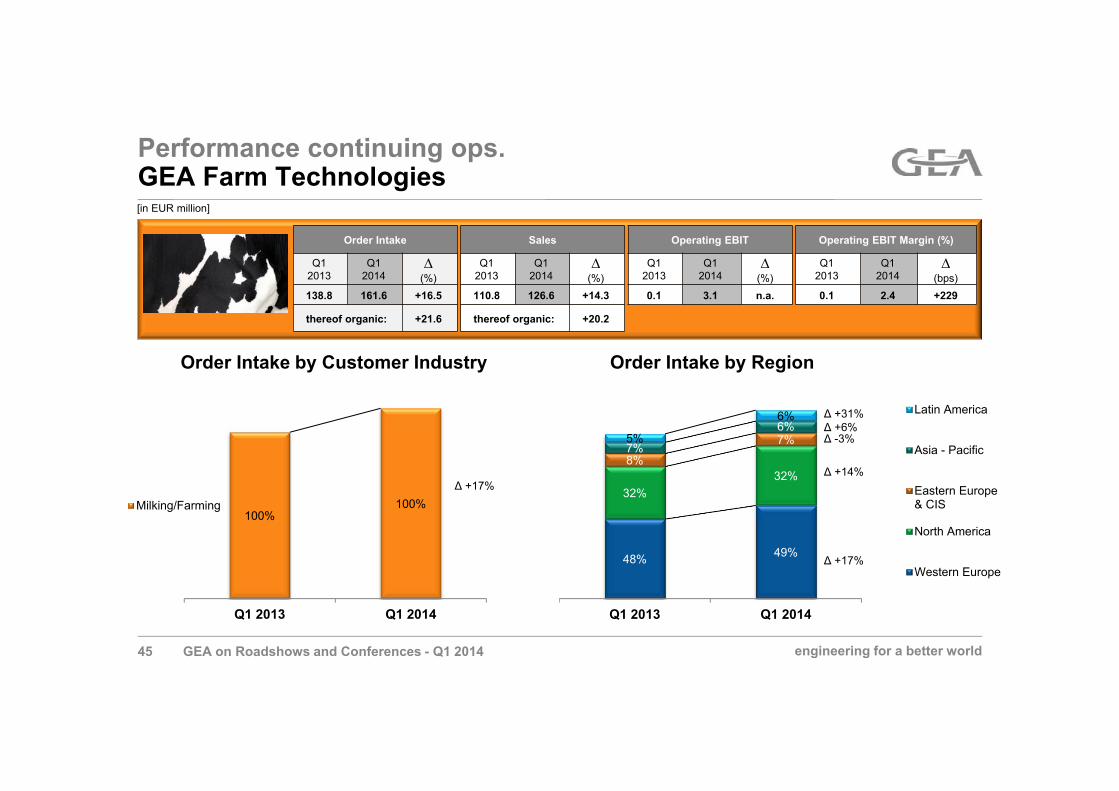
Performance continuing ops.GEA Farm Technologies
Order Intake by Customer Industry Order Intake by Region
[in EUR million]
48% 49%
32%32%
8%
7%7%
6%5%
6%
Q1 2013 Q1 2014
Latin America
Asia - Pacific
Eastern Europe& CIS
North America
Western Europe
100%100%
Q1 2013 Q1 2014
Milking/Farming∆ +17%
∆ +17%
∆ +14%
∆ +31%∆ +6%∆ -3%
Order Intake
Q12013
Q12014
∆(%)
138.8 161.6 +16.5
thereof organic: +21.6
Sales
Q12013
Q12014
∆(%)
110.8 126.6 +14.3
thereof organic: +20.2
Operating EBIT
Q12013
Q12014
∆(%)
0.1 3.1 n.a.
Operating EBIT Margin (%)
Q12013
Q12014
∆(bps)
0.1 2.4 +229
GEA on Roadshows and Conferences - Q1 201445

engineering for a better world
Performance continuing ops.GEA Farm Technologies
Quarterly Large Order Development
[in EUR million]
100116 115 116 126 130 140 129
147 144 146 143 139 151 149 151 161
1
31 1 1 5 2 1
1
0
20
40
60
80
100
120
140
160
180
Q1 10 Q2 10 Q3 10 Q4 10 Q1 11 Q2 11 Q3 11 Q4 11 Q1 12 Q2 12 Q3 12 Q4 12 Q1 13 Q2 13 Q3 13 Q4 13 Q1 14OI < EUR 1m OI >= EUR 1m < EUR 5m OI >= EUR 5m < EUR 15m OI >= EUR 15m
Order Intake
L4Q per Q1 2013
L4Q per Q1 2014
∆(%)
574.5 619.6 +7.9
thereof organic: +8.8
Sales
L4Q per Q1 2013
L4Q per Q1 2014
∆(%)
573.9 593.4 +3.4
thereof organic: +4.3
Operating EBIT
L4Q per Q1 2013
L4Q per Q1 2014
∆(%)
44.5 47.5 +6.6
Operating EBIT Margin (%)
L4Q per Q1 2013
L4Q per Q1 2014
∆(bps)
7.8 8.0 +24
GEA on Roadshows and Conferences - Q1 201446

engineering for a better world
Performance continuing ops.GEA Mechanical Equipment
Order Intake by Region
[in EUR million]
40% 43%
15% 13%10% 8%8% 9%
27% 27%
Q1 2013 Q1 2014
Other Industries
Pharma/Chemical
Beverages
Dairy Processing
Food36% 39%
26% 28%
18% 15%6% 7%8% 6%4% 5%2% 2%
Q1 2013 Q1 2014
Africa
Middle - East
Latin America
Eastern Europe &CISNorth America
Asia - Pacific
Western Europe
∆ +8%
∆ -7%
∆ +7%
∆ -2%
∆ -13%
∆ +8%
∆ +8%
∆ -17%
∆ +30%∆ -30%∆ +7%∆ -10%
Order Intake
Q12013
Q12014
∆(%)
329.7 339.1 +2.9
thereof organic: +5.3
Sales
Q12013
Q12014
∆(%)
298.1 310.0 +4.0
thereof organic: +6.5
Operating EBIT
Q12013
Q12014
∆(%)
32.7 34.5 +5.6
Operating EBIT Margin (%)
Q12013
Q12014
∆(bps)
11.0 11.1 +17
Order Intake by Customer Industry
GEA on Roadshows and Conferences - Q1 201447

engineering for a better world
278 280 274336
280 271 289 289 300 301 283 311
46 30 49 42 44 26 1938 31 40
219 19 7 12 8 58 8 11 633
1718
0
50
100
150
200
250
300
350
400
Q2 11 Q3 11 Q4 11 Q1 12 Q2 12 Q3 12 Q4 12 Q1 13 Q2 13 Q3 13 Q4 13 Q1 14OI < EUR 1m OI >= EUR 1m < EUR 5m OI >= EUR 5m < EUR 15m OI >= EUR 15m
Performance continuing ops.GEA Mechanical Equipment
Quarterly Large Order Development
[in EUR million]
Order Intake
L4Q perQ1 2013
L4Q perQ1 2014
∆(%)
1,341.4 1,377.6 +2.7
thereof organic: +4.7
Sales
L4Q perQ1 2013
L4Q perQ1 2014
∆(%)
1,295.2 1,339.6 +3.4
thereof organic: +5.4
Operating EBIT
L4Q perQ1 2013
L4Q perQ1 2014
∆(%)
181.4 189.4 +4.4
Operating EBIT Margin (%)
L4Q perQ1 2013
L4Q perQ1 2014
∆(bps)
14.0 14.1 +13
GEA on Roadshows and Conferences - Q1 201448

engineering for a better world
Performance continuing ops.GEA Process Engineering
Order Intake by Region
[in EUR million]
44%45%
30%
20%
5%
6%
16%
21%
6%
9%
Q1 2013 Q1 2014
Other Industries
Pharma/Chemical
Food
Beverages
Dairy Processing 27% 31%
25% 31%
19%14%
9%
8%
14%
8%
2%
4%
4%
4%
Q1 2013 Q1 2014
Middle - East
Africa
Latin America
Eastern Europe& CISNorth America
Asia - Pacific
Western Europe
∆ -23%
∆ -49%
∆ -8%
∆ +3%
∆ +15%
∆ -12%
∆ -6%
∆ -42%∆ -29%∆ -59%∆ +46%∆ -29%
Order Intake
Q12013
Q12014
∆(%)
481.3 366.7 -23.8
thereof organic: -19.7
Sales
Q12013
Q12014
∆(%)
394.3 390.7 -0.9
thereof organic: +1.5
Operating EBIT
Q12013
Q12014
∆(%)
25.7 26.6 +3.6
Operating EBIT Margin (%)
Q12013
Q12014
∆(bps)
6.5 6.8 +30
Order Intake by Customer Industry
GEA on Roadshows and Conferences - Q1 201449

engineering for a better world
Performance continuing ops.GEA Process Engineering
Quarterly Large Order Development
[in EUR million]
Order Intake
L4Q per Q1 2013
L4Q per Q1 2014
∆(%)
1,820.2 1,946.4 +6.9
thereof organic: +9.7
Sales
L4Q per Q1 2013
L4Q per Q1 2014
∆(%)
1,737.4 1,794.3 +3.3
thereof organic: +6.0
Operating EBIT
L4Q per Q1 2013
L4Q per Q1 2014
∆(%)
171.8 189.2 +10.1
Operating EBIT Margin (%)
L4Q per Q1 2013
L4Q per Q1 2014
∆(bps)
9.9 10.5 +66
138 117 136 177 169 178 167 159 186 175 170 197 174 170 166 194 184
143121 110
119 133 122 116 121144
107 132 100 104 15598
13091
3861 43
58 59127
90 11182
75101 94 126
82124 50
6916 40 33
66 41 60 58100
4465 79 78
162127 121
22
0
100
200
300
400
500
600
Q1 10 Q2 10 Q3 10 Q4 10 Q1 11 Q2 11 Q3 11 Q4 11 Q1 12 Q2 12 Q3 12 Q4 12 Q1 13 Q2 13 Q3 13 Q4 13 Q1 14OI < EUR 1m OI >= EUR 1m < EUR 5m OI >= EUR 5m < EUR 15m OI >= EUR 15m
GEA on Roadshows and Conferences - Q1 201450
engineering for a better world
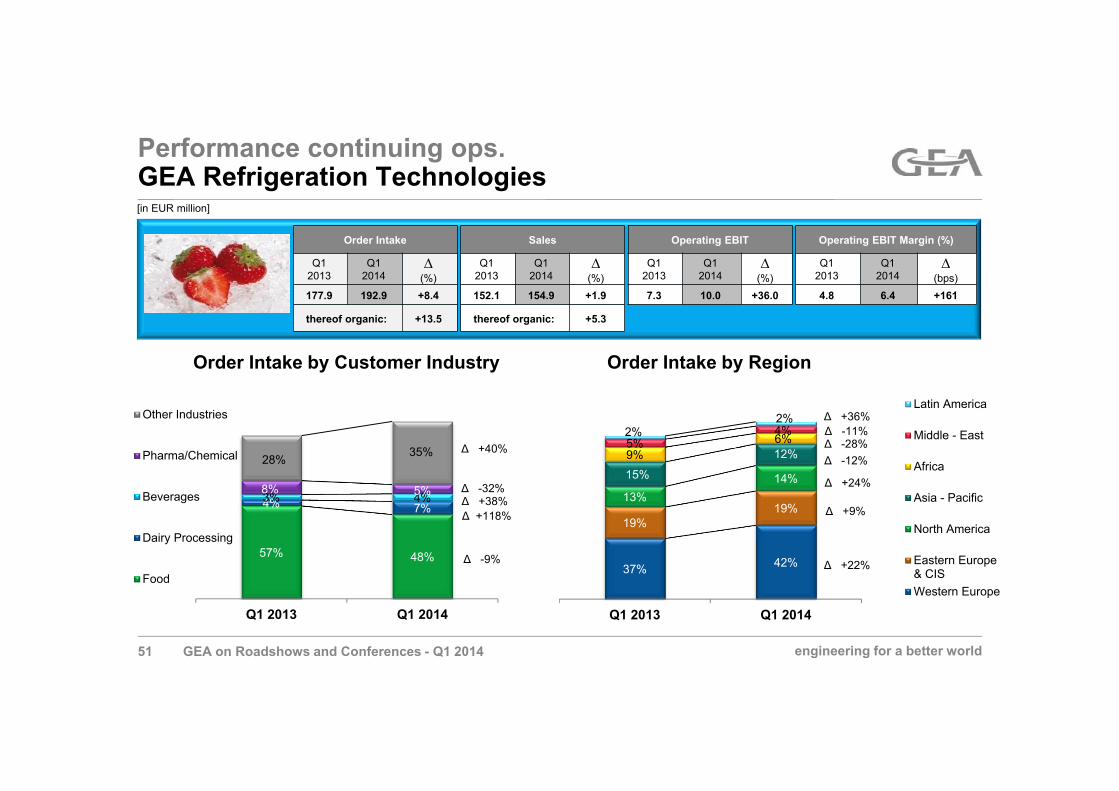
Performance continuing ops.GEA Refrigeration Technologies[in EUR million]
Order Intake
Q12013
Q12014
∆(%)
177.9 192.9 +8.4
thereof organic: +13.5
Sales
Q12013
Q12014
∆(%)
152.1 154.9 +1.9
thereof organic: +5.3
Operating EBIT
Q12013
Q12014
∆(%)
7.3 10.0 +36.0
Operating EBIT Margin (%)
Q12013
Q12014
∆(bps)
4.8 6.4 +161
Order Intake by Region
57% 48%
4% 7%3% 4%8% 5%
28% 35%
Q1 2013 Q1 2014
Other Industries
Pharma/Chemical
Beverages
Dairy Processing
Food37% 42%
19%19%
13%14%15%
12%9%6%5%4%2%2%
Q1 2013 Q1 2014
Latin America
Middle - East
Africa
Asia - Pacific
North America
Eastern Europe& CISWestern Europe
Order Intake by Customer Industry
∆ -9%
∆ +38%∆ -32%
∆ +40%
∆ +22%
∆ +9%
∆ +24%
∆ -11%∆ +36%
∆ -12%∆ -28%
∆ +118%
GEA on Roadshows and Conferences - Q1 201451

engineering for a better world
Performance continuing ops.GEA Refrigeration Technologies
Quarterly Large Order Development
[in EUR million]
Order Intake
L4Q per Q1 2013
L4Q per Q1 2014
∆(%)
756.2 741.2 -2.0
thereof organic: +0.9
Sales
L4Q per Q1 2013
L4Q per Q1 2014
∆(%)
697.4 739.5 +6.0
thereof organic: +9.1
Operating EBIT
L4Q per Q1 2013
L4Q per Q1 2014
∆(%)
54.8 64.2 +17.0
Operating EBIT Margin (%)
L4Q per Q1 2013
L4Q per Q1 2014
∆(bps)
7.9 8.7 +82
113 121 122 120 128 145 126 135 140 139 146 142 140 134 139 146 134
1430 17 27 19
1720
35 29 2244 50
22 35 35 40 4610 5 6 19
8 2010 6
126 13
0
50
100
150
200
250
Q1 10 Q2 10 Q3 10 Q4 10 Q1 11 Q2 11 Q3 11 Q4 11 Q1 12 Q2 12 Q3 12 Q4 12 Q1 13 Q2 13 Q3 13 Q4 13 Q1 14OI < EUR 1m OI >= EUR 1m < EUR 5m OI >= EUR 5m < EUR 15m OI >= EUR 15m
16
GEA on Roadshows and Conferences - Q1 201452

engineering for a better world
Performance continuing ops.Order Intake Q1 2014
Q1 2014 vs. Q1 2013
Q1 2014 vs. Q4 2013
Order Intake previousperiod 1,095 1,144
Structural Change 0 0% 0 0%
Currency Effects -44 -4.0% -4 -0.3%
Organic Development -27 -2.5% -116 -10.2%
Order Intake currentperiod 1,024 -6.5% 1,024 -10.5%
∆ abs. ∆ in % ∆ abs. ∆ in %
[in EUR million]
GEA on Roadshows and Conferences - Q1 201453

engineering for a better world
∆ abs. ∆ in % ∆ abs. ∆ in % ∆ abs. ∆ in %
[in EUR million]
Performance continuing ops.Sales Q1 2014
Q1 2014 vs. Q1 2013
Q1 2014 vs. Q4 2013
Salesprevious period 924 1,242
Structural Change 0 0% 0 0%
Currency Effects -29 -3.1% -4 -0.4%
Organic Development +55 +6.0% -287 -23.1%
Salescurrent period 951 +2.9% 951 -23.5%
∆ abs. ∆ in % ∆ abs. ∆ in %
GEA on Roadshows and Conferences - Q1 201454

engineering for a better world
Performance continuing ops. Operating EBITDA Q1 2014
∆ abs. ∆ in % ∆ abs. ∆ in % ∆ abs. ∆ in %
[in EUR million]
Q1 2014 vs. Q1 2013
Q1 2014 vs. Q4 2013
Operating EBITDA previous period 72.4 205.7
Structural Change 0 0% 0 0%
Currency Effects -2.0 -2.8% -0.2 -0.1%
Organic Development +14.8 +20.4% -120.4 -58.5%
Operating EBITDA current period 85.1 +17.6% 85.1 -58.6%
∆ abs. ∆ in % ∆ abs. ∆ in %
GEA on Roadshows and Conferences - Q1 201455

engineering for a better world
8387
72
85
Q1 2014 Operating EBITDA
One-OffsFXQ1 2014 Operating EBITDA
before FX
OrganicQ1 2013 Operating EBITDA
Q1 2014 Reported EBITDA
+15 -2 -2
+20.4%
-2.8% -2.9%
[in EUR million]
Performance continuing ops. EBITDA Bridge Q1 2014
GEA on Roadshows and Conferences - Q1 201456

engineering for a better world
USD
DKK
GBP
CNY
PLN
BRL
SGD
NZD
AUD
17%
7%
4%
5%
2%
2%
2%
3%
2%
-3.6%
0.0%
+2.8%
-1.6%
-0.7%
-18.6%
-6.0%
-3.4%
-16.8%
Currency % total Q1 3rd party Sales
FX developmentQ1 14 vs Q1 13 (avg)
Performance continuing ops.FX Development Q1 2014 YoY
CAD 1% -11.9%
GEA on Roadshows and Conferences - Q1 201457

engineering for a better world
625
551
615
872
929
912
506
647
510
477
470
481
515
363
535
TradeReceivables Inventories
Trade Payables
AdvancePayments
Working Capital
Q4 2013
Q1 2014
-17-2%
+64+12%
-137-21%
+11+2%
+172+47%
Q1 2013 +57+6%
-74-12%
+141+28%
-7-1%
-152-29%
_
_
_
[in EUR million]
Performance continuing ops.Working Capital Development
GEA on Roadshows and Conferences - Q1 201458

engineering for a better world
Performance GEA Heat Exchangers
Order Intake by Region
[in EUR million]
17%
36%
34%
32% 28%
14% 4%
5% 4%
4% 4%
3% 8%
6%
Q1 2013 Q1 2014
Others
Food &BeveragesPharma/ChemicalMarine
Power
Environment
Oil & Gas
46% 36%
10% 24%
19%
17%11%
10%3%
7%8%
3%3%
2%
Q1 2013 Q1 2014
Middle - East
Africa
Latin America
Eastern Europe &CISAsia - Pacific
North America
Western Europe
∆ +3%
∆ +42%
∆ -7%
∆ -11%
∆ +167%
∆ +1%
∆ -2%
∆ -14%∆ -50%∆ +131%
∆ -46%
Order Intake
Q12013
Q12014
∆(%)
361.9 399.7 +10.4
thereof organic: +14.8
Sales
Q12013
Q12014
∆(%)
318.1 311.4 -2.1
thereof organic: +1.1
Operating EBIT
Q12013
Q12014
∆(%)
17.8 17.6 -0.8
Operating EBIT Margin (%)
Q12013
Q12014
∆(bps)
5.6 5.7 +7
Order Intake by Customer Industry
∆ +137%
∆ -7%∆ -15%
GEA on Roadshows and Conferences - Q1 201459

engineering for a better world
Performance GEA Heat Exchangers
Quarterly Large Order Development
[in EUR million]
Order Intake
L4Q per Q1 2013
L4Q per Q1 2014
∆(%)
1,465.6 1,538.1 +4.9
thereof organic: +7.1
Sales
L4Q per Q1 2013
L4Q per Q1 2014
∆(%)
1,537.2 1,482.4 -3.6
thereof organic: -1.3
Operating EBIT
L4Q per Q1 2013
L4Q per Q1 2014
∆(%)
128.8 123.2 -4.4
Operating EBIT Margin (%)
L4Q per Q1 2013
L4Q per Q1 2014
∆(bps)
8.4 8.3 -7
250 266 256 239290 294 276 254 281 272 274
225 261 276 253 248 251
4052 46 74
37 47 6133
62 66 4554
65 48 57 61 601427 30 7 18
42 3272
33 128
3112 40
10 28 3253 73 80 31
63 104 3028 49
39 24 2989 56
0
50
100
150
200
250
300
350
400
450
500
Q1 10 Q2 10 Q3 10 Q4 10 Q1 11 Q2 11 Q3 11 Q4 11 Q1 12 Q2 12 Q3 12 Q4 12 Q1 13 Q2 13 Q3 13 Q4 13 Q1 14OI < EUR 1m OI >= EUR 1m < EUR 5m OI >= EUR 5m < EUR 15m OI >= EUR 15m
GEA on Roadshows and Conferences - Q1 201460
engineering for a better world
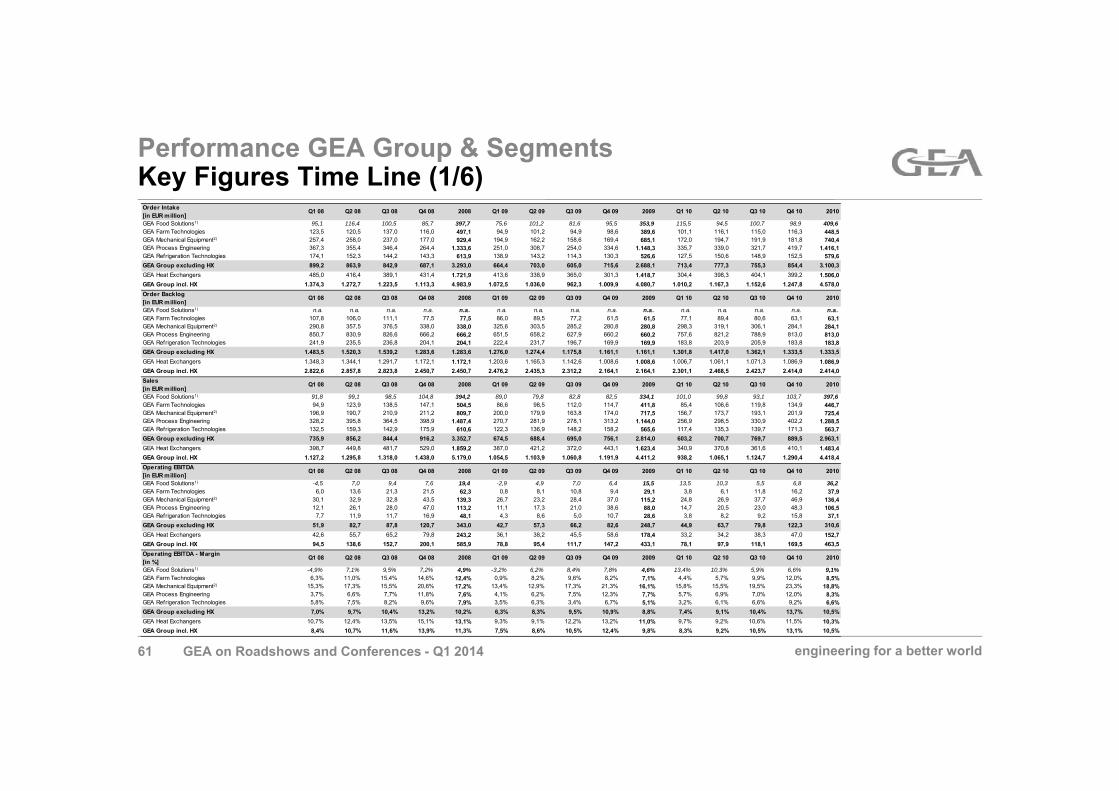
Performance GEA Group & SegmentsKey Figures Time Line (1/6)
Order Intake[in EUR million]
Q1 08 Q2 08 Q3 08 Q4 08 2008 Q1 09 Q2 09 Q3 09 Q4 09 2009 Q1 10 Q2 10 Q3 10 Q4 10 2010
GEA Food Solutions1) 95,1 116,4 100,5 85,7 397,7 75,6 101,2 81,6 95,5 353,9 115,5 94,5 100,7 98,9 409,6GEA Farm Technologies 123,5 120,5 137,0 116,0 497,1 94,9 101,2 94,9 98,6 389,6 101,1 116,1 115,0 116,3 448,5GEA Mechanical Equipment2) 257,4 258,0 237,0 177,0 929,4 194,9 162,2 158,6 169,4 685,1 172,0 194,7 191,9 181,8 740,4GEA Process Engineering 367,3 355,4 346,4 264,4 1.333,6 251,0 308,7 254,0 334,6 1.148,3 335,7 339,0 321,7 419,7 1.416,1GEA Refrigeration Technologies 174,1 152,3 144,2 143,3 613,9 138,9 143,2 114,3 130,3 526,6 127,5 150,6 148,9 152,5 579,6GEA Group excluding HX 899,2 863,9 842,9 687,1 3.293,0 664,4 703,0 605,0 715,6 2.688,1 713,4 777,3 755,3 854,4 3.100,3GEA Heat Exchangers 485,0 416,4 389,1 431,4 1.721,9 413,6 338,9 365,0 301,3 1.418,7 304,4 398,3 404,1 399,2 1.506,0GEA Group incl. HX 1.374,3 1.272,7 1.223,5 1.113,3 4.983,9 1.072,5 1.036,0 962,3 1.009,9 4.080,7 1.010,2 1.167,3 1.152,6 1.247,8 4.578,0Order Backlog[in EUR million]
Q1 08 Q2 08 Q3 08 Q4 08 2008 Q1 09 Q2 09 Q3 09 Q4 09 2009 Q1 10 Q2 10 Q3 10 Q4 10 2010
GEA Food Solutions1) n.a. n.a. n.a. n.a. n.a. n.a. n.a. n.a. n.a. n.a. n.a. n.a. n.a. n.a. n.a. GEA Farm Technologies 107,8 106,0 111,1 77,5 77,5 86,0 89,5 77,2 61,5 61,5 77,1 89,4 80,6 63,1 63,1GEA Mechanical Equipment2) 290,8 357,5 376,5 338,0 338,0 325,6 303,5 285,2 280,8 280,8 298,3 319,1 306,1 284,1 284,1GEA Process Engineering 850,7 830,9 826,6 666,2 666,2 651,5 658,2 627,9 660,2 660,2 757,6 821,2 788,9 813,0 813,0GEA Refrigeration Technologies 241,9 235,5 236,8 204,1 204,1 222,4 231,7 196,7 169,9 169,9 183,8 203,9 205,9 183,8 183,8GEA Group excluding HX 1.483,5 1.520,3 1.539,2 1.283,6 1.283,6 1.276,0 1.274,4 1.175,8 1.161,1 1.161,1 1.301,8 1.417,0 1.362,1 1.333,5 1.333,5GEA Heat Exchangers 1.348,3 1.344,1 1.291,7 1.172,1 1.172,1 1.203,6 1.165,3 1.142,6 1.008,6 1.008,6 1.006,7 1.061,1 1.071,3 1.086,9 1.086,9GEA Group incl. HX 2.822,6 2.857,8 2.823,8 2.450,7 2.450,7 2.476,2 2.435,3 2.312,2 2.164,1 2.164,1 2.301,1 2.468,5 2.423,7 2.414,0 2.414,0Sales[in EUR million]
Q1 08 Q2 08 Q3 08 Q4 08 2008 Q1 09 Q2 09 Q3 09 Q4 09 2009 Q1 10 Q2 10 Q3 10 Q4 10 2010
GEA Food Solutions1) 91,8 99,1 98,5 104,8 394,2 89,0 79,8 82,8 82,5 334,1 101,0 99,8 93,1 103,7 397,6GEA Farm Technologies 94,9 123,9 138,5 147,1 504,5 86,6 98,5 112,0 114,7 411,8 85,4 106,6 119,8 134,9 446,7GEA Mechanical Equipment2) 196,9 190,7 210,9 211,2 809,7 200,0 179,9 163,8 174,0 717,5 156,7 173,7 193,1 201,9 725,4GEA Process Engineering 328,2 395,8 364,5 398,9 1.487,4 270,7 281,9 278,1 313,2 1.144,0 256,9 298,5 330,9 402,2 1.288,5GEA Refrigeration Technologies 132,5 159,3 142,9 175,9 610,6 122,3 136,9 148,2 158,2 565,6 117,4 135,3 139,7 171,3 563,7GEA Group excluding HX 735,9 856,2 844,4 916,2 3.352,7 674,5 688,4 695,0 756,1 2.814,0 603,2 700,7 769,7 889,5 2.963,1GEA Heat Exchangers 398,7 449,8 481,7 529,0 1.859,2 387,0 421,2 372,0 443,1 1.623,4 340,9 370,8 361,6 410,1 1.483,4GEA Group incl. HX 1.127,2 1.295,8 1.318,0 1.438,0 5.179,0 1.054,5 1.103,9 1.060,8 1.191,9 4.411,2 938,2 1.065,1 1.124,7 1.290,4 4.418,4Operating EBITDA[in EUR million]
Q1 08 Q2 08 Q3 08 Q4 08 2008 Q1 09 Q2 09 Q3 09 Q4 09 2009 Q1 10 Q2 10 Q3 10 Q4 10 2010
GEA Food Solutions1) -4,5 7,0 9,4 7,6 19,4 -2,9 4,9 7,0 6,4 15,5 13,5 10,3 5,5 6,8 36,2GEA Farm Technologies 6,0 13,6 21,3 21,5 62,3 0,8 8,1 10,8 9,4 29,1 3,8 6,1 11,8 16,2 37,9GEA Mechanical Equipment2) 30,1 32,9 32,8 43,5 139,3 26,7 23,2 28,4 37,0 115,2 24,8 26,9 37,7 46,9 136,4GEA Process Engineering 12,1 26,1 28,0 47,0 113,2 11,1 17,3 21,0 38,6 88,0 14,7 20,5 23,0 48,3 106,5GEA Refrigeration Technologies 7,7 11,9 11,7 16,9 48,1 4,3 8,6 5,0 10,7 28,6 3,8 8,2 9,2 15,8 37,1GEA Group excluding HX 51,9 82,7 87,8 120,7 343,0 42,7 57,3 66,2 82,6 248,7 44,9 63,7 79,8 122,3 310,6GEA Heat Exchangers 42,6 55,7 65,2 79,8 243,2 36,1 38,2 45,5 58,6 178,4 33,2 34,2 38,3 47,0 152,7GEA Group incl. HX 94,5 138,6 152,7 200,1 585,9 78,8 95,4 111,7 147,2 433,1 78,1 97,9 118,1 169,5 463,5Operating EBITDA - Margin[in %]
Q1 08 Q2 08 Q3 08 Q4 08 2008 Q1 09 Q2 09 Q3 09 Q4 09 2009 Q1 10 Q2 10 Q3 10 Q4 10 2010
GEA Food Solutions1) -4,9% 7,1% 9,5% 7,2% 4,9% -3,2% 6,2% 8,4% 7,8% 4,6% 13,4% 10,3% 5,9% 6,6% 9,1%GEA Farm Technologies 6,3% 11,0% 15,4% 14,6% 12,4% 0,9% 8,2% 9,6% 8,2% 7,1% 4,4% 5,7% 9,9% 12,0% 8,5%GEA Mechanical Equipment2) 15,3% 17,3% 15,5% 20,6% 17,2% 13,4% 12,9% 17,3% 21,3% 16,1% 15,8% 15,5% 19,5% 23,3% 18,8%GEA Process Engineering 3,7% 6,6% 7,7% 11,8% 7,6% 4,1% 6,2% 7,5% 12,3% 7,7% 5,7% 6,9% 7,0% 12,0% 8,3%GEA Refrigeration Technologies 5,8% 7,5% 8,2% 9,6% 7,9% 3,5% 6,3% 3,4% 6,7% 5,1% 3,2% 6,1% 6,6% 9,2% 6,6%GEA Group excluding HX 7,0% 9,7% 10,4% 13,2% 10,2% 6,3% 8,3% 9,5% 10,9% 8,8% 7,4% 9,1% 10,4% 13,7% 10,5%GEA Heat Exchangers 10,7% 12,4% 13,5% 15,1% 13,1% 9,3% 9,1% 12,2% 13,2% 11,0% 9,7% 9,2% 10,6% 11,5% 10,3%GEA Group incl. HX 8,4% 10,7% 11,6% 13,9% 11,3% 7,5% 8,6% 10,5% 12,4% 9,8% 8,3% 9,2% 10,5% 13,1% 10,5%
GEA on Roadshows and Conferences - Q1 201461

engineering for a better world
Performance GEA Group & SegmentsKey Figures Time Line (2/6)Order Intake[in EUR million]
Q1 11 Q2 11 Q3 11 Q4 11 2011 Q1 12 Q2 12 Q3 12 Q4 12 2012 Q1 13 Q2 13 Q3 13 Q4 13 2013 Q1 14
GEA Food Solutions1) 125,5 - - - - - - - - - - - - - - -GEA Farm Technologies 125,9 129,5 140,3 131,7 527,4 148,1 145,7 147,4 142,6 583,9 138,8 155,7 150,7 151,6 596,7 161,6GEA Mechanical Equipment2) 219,2 332,5 329,5 323,6 1.204,7 336,2 329,0 327,1 355,6 1.347,9 329,7 346,4 357,7 334,4 1.368,2 339,1GEA Process Engineering 401,5 426,2 433,3 449,0 1.709,9 511,3 401,2 468,5 469,2 1.850,2 481,3 570,0 515,2 494,6 2.061,0 366,7GEA Refrigeration Technologies 152,7 162,8 164,8 170,1 650,4 177,9 180,4 200,1 197,8 756,2 177,9 181,2 174,9 192,3 726,3 192,9GEA Group excluding HX 874,3 1.024,8 1.040,6 1.047,0 3.986,7 1.146,0 1.028,6 1.111,6 1.139,2 4.425,4 1.095,1 1.220,0 1.168,3 1.144,4 4.627,9 1.024,3GEA Heat Exchangers 375,5 445,6 369,8 462,3 1.653,2 406,1 379,0 375,1 349,7 1.509,8 361,9 363,5 348,1 426,8 1.500,3 399,7GEA Group incl. HX 1.242,1 1.462,5 1.402,8 1.502,2 5.609,7 1.544,9 1.401,0 1.477,3 1.477,9 5.901,1 1.447,1 1.574,0 1.509,2 1.562,5 6.092,7 1.415,1Order Backlog[in EUR million]
Q1 11 Q2 11 Q3 11 Q4 11 2011 Q1 12 Q2 12 Q3 12 Q4 12 2012 Q1 13 Q2 13 Q3 13 Q4 13 2013 Q1 14
GEA Food Solutions1) 104,4 - - - - - - - - - - - - - - -GEA Farm Technologies 85,4 92,5 93,9 74,4 74,4 104,5 117,3 107,1 79,9 79,9 107,8 120,9 112,2 85,6 85,6 114,3GEA Mechanical Equipment2) 304,1 431,2 445,9 395,2 395,2 446,5 452,9 442,5 438,4 438,4 442,6 446,5 456,8 428,4 428,4 456,3GEA Process Engineering 888,2 927,4 972,2 951,2 951,2 1.082,3 1.104,5 1.142,5 1.069,6 1.069,6 1.164,2 1.269,5 1.334,9 1.290,5 1.290,5 1.267,9GEA Refrigeration Technologies 210,4 206,6 206,1 197,0 197,0 224,4 245,8 265,4 257,0 257,0 283,6 268,8 253,1 229,5 229,5 272,2GEA Group excluding HX 1.581,2 1.643,7 1.700,9 1.599,2 1.599,2 1.841,1 1.900,9 1.932,4 1.829,9 1.829,9 1.982,6 2.085,3 2.136,2 2.015,5 2.015,5 2.086,7GEA Heat Exchangers 1.092,5 1.135,4 1.063,5 1.086,0 1.086,0 1.103,2 1.074,1 1.045,5 933,3 933,3 979,3 846,5 799,5 805,1 805,1 878,8GEA Group incl. HX 2.666,6 2.770,6 2.755,7 2.677,3 2.677,3 2.935,6 2.967,4 2.967,8 2.751,6 2.751,6 2.950,0 2.919,1 2.926,5 2.810,9 2.810,9 2.956,6Sales[in EUR million]
Q1 11 Q2 11 Q3 11 Q4 11 2011 Q1 12 Q2 12 Q3 12 Q4 12 2012 Q1 13 Q2 13 Q3 13 Q4 13 2013 Q1 14
GEA Food Solutions1) 112,9 - - - - - - - - - - - - - - -GEA Farm Technologies 99,6 118,3 138,1 153,8 509,8 117,8 133,1 157,8 172,3 580,9 110,8 133,8 156,9 176,2 577,7 126,6GEA Mechanical Equipment2) 191,6 311,1 317,0 371,0 1.190,7 269,3 319,2 328,6 349,2 1.266,4 298,1 334,0 336,3 359,3 1.327,8 310,0GEA Process Engineering 300,8 385,1 394,7 496,6 1.577,2 373,2 401,2 423,6 518,3 1.716,3 394,3 435,6 441,3 526,7 1.798,0 390,7GEA Refrigeration Technologies 132,8 166,6 166,2 181,6 647,2 149,5 165,2 177,0 203,1 694,8 152,1 189,2 184,8 210,6 736,6 154,9GEA Group excluding HX 706,7 964,6 980,5 1.176,4 3.828,3 880,5 994,1 1.060,5 1.207,2 4.142,3 924,2 1.064,6 1.089,1 1.242,2 4.320,0 950,7GEA Heat Exchangers 338,1 390,9 424,2 463,6 1.616,8 389,7 404,3 392,1 422,7 1.608,8 318,1 385,9 380,8 404,2 1.489,1 311,4GEA Group incl. HX 1.038,0 1.349,0 1.397,4 1.632,2 5.416,5 1.263,7 1.391,3 1.445,6 1.619,6 5.720,1 1.232,7 1.441,9 1.459,5 1.638,1 5.772,2 1.253,1Operating EBITDA[in EUR million]
Q1 11 Q2 11 Q3 11 Q4 11 2011 Q1 12 Q2 12 Q3 12 Q4 12 2012 Q1 13 Q2 13 Q3 13 Q4 13 2013 Q1 14
GEA Food Solutions1) 6,2 - - - - - - - - - - - - - - -GEA Farm Technologies 5,0 8,4 15,0 16,8 45,2 5,0 11,2 17,8 24,5 58,5 3,1 8,5 17,6 27,8 56,9 6,1GEA Mechanical Equipment2) 32,7 50,9 51,5 69,9 204,9 32,9 47,7 54,9 63,8 199,3 38,6 48,3 56,8 71,0 214,7 42,1GEA Process Engineering 20,0 31,2 38,6 73,4 163,2 20,1 39,4 43,0 75,9 178,4 29,4 45,0 46,3 82,5 203,2 30,2GEA Refrigeration Technologies 8,9 14,5 14,1 22,4 60,0 11,0 13,4 16,0 24,9 65,2 9,6 16,8 17,1 27,5 71,0 12,4GEA Group excluding HX 62,4 100,3 119,8 187,0 469,6 68,0 110,7 132,3 183,5 494,4 72,4 118,4 133,5 205,7 530,1 85,1GEA Heat Exchangers 29,5 35,3 46,9 48,7 160,4 32,6 35,9 37,5 61,5 167,5 26,1 37,6 38,6 55,9 158,2 25,8GEA Group incl. HX 91,9 135,7 166,7 235,7 630,1 100,6 146,6 169,8 245,0 661,9 98,5 156,0 172,1 261,6 688,3 110,6Operating EBITDA - Margin[in %]
Q1 11 Q2 11 Q3 11 Q4 11 2011 Q1 12 Q2 12 Q3 12 Q4 12 2012 Q1 13 Q2 13 Q3 13 Q4 13 2013 Q1 14
GEA Food Solutions1) 5,5% - - - - - - - - - - - - - - -GEA Farm Technologies 5,0% 7,1% 10,8% 10,9% 8,9% 4,2% 8,5% 11,3% 14,2% 10,1% 2,8% 6,4% 11,2% 15,8% 9,9% 4,8%GEA Mechanical Equipment2) 17,1% 16,4% 16,2% 18,8% 17,2% 12,2% 14,9% 16,7% 18,3% 15,7% 12,9% 14,5% 16,9% 19,8% 16,2% 13,6%GEA Process Engineering 6,6% 8,1% 9,8% 14,8% 10,3% 5,4% 9,8% 10,1% 14,6% 10,4% 7,5% 10,3% 10,5% 15,7% 11,3% 7,7%GEA Refrigeration Technologies 6,7% 8,7% 8,5% 12,4% 9,3% 7,3% 8,1% 9,0% 12,2% 9,4% 6,3% 8,9% 9,3% 13,1% 9,6% 8,0%GEA Group excluding HX 8,8% 10,4% 12,2% 15,9% 12,3% 7,7% 11,1% 12,5% 15,2% 11,9% 7,8% 11,1% 12,3% 16,6% 12,3% 9,0%GEA Heat Exchangers 8,7% 9,0% 11,1% 10,5% 9,9% 8,4% 8,9% 9,6% 14,5% 10,4% 8,2% 9,7% 10,1% 13,8% 10,6% 8,3%GEA Group incl. HX 8,9% 10,1% 11,9% 14,4% 11,6% 8,0% 10,5% 11,7% 15,1% 11,6% 8,0% 10,8% 11,8% 16,0% 11,9% 8,8%
GEA on Roadshows and Conferences - Q1 201462

engineering for a better world
Performance GEA Group & SegmentsKey Figures Time Line (3/6)EBITDA reported[in EUR million]
Q1 08 Q2 08 Q3 08 Q4 08 2008 Q1 09 Q2 09 Q3 09 Q4 09 2009 Q1 10 Q2 10 Q3 10 Q4 10 2010
GEA Food Solutions1) -4,5 7,0 9,4 7,6 19,4 -2,9 4,9 7,0 6,4 15,5 13,5 10,3 5,5 6,8 36,2GEA Farm Technologies 6,0 13,6 21,3 21,5 62,3 0,8 6,0 10,2 5,9 23,0 3,8 5,7 11,7 13,1 34,3GEA Mechanical Equipment2) 30,1 32,9 32,8 43,5 139,3 26,7 23,1 26,6 27,1 103,5 24,8 25,3 28,9 45,2 124,1GEA Process Engineering 12,1 26,1 28,0 47,0 113,2 10,2 14,0 11,2 30,9 66,4 14,7 19,8 22,8 48,1 105,4GEA Refrigeration Technologies 7,7 11,9 11,7 16,9 48,1 4,0 8,1 3,9 6,6 22,5 3,7 7,5 7,1 2,6 21,0GEA Group excluding HX 49,8 80,5 85,6 118,5 334,4 38,6 49,0 48,3 51,7 187,6 47,0 57,2 65,4 102,3 271,9GEA Heat Exchangers 42,6 55,7 65,2 79,8 243,2 35,5 30,7 35,2 59,4 160,8 32,1 23,4 18,7 15,2 89,4GEA Group incl. HX 94,5 138,6 152,7 200,1 585,9 76,7 82,3 87,9 121,8 368,7 76,8 83,3 86,7 118,9 365,7Operating EBIT[in EUR million]
Q1 08 Q2 08 Q3 08 Q4 08 2008 Q1 09 Q2 09 Q3 09 Q4 09 2009 Q1 10 Q2 10 Q3 10 Q4 10 2010
GEA Food Solutions1) -8,6 3,4 6,1 4,4 5,3 -8,2 1,5 3,7 3,4 0,4 9,5 7,0 1,6 3,1 21,2GEA Farm Technologies 4,3 11,9 19,5 19,5 55,2 -1,3 6,0 8,6 7,0 20,3 1,0 3,1 8,8 13,4 26,3GEA Mechanical Equipment2) 27,2 29,9 29,6 39,7 126,4 23,3 19,4 24,7 32,8 100,2 20,8 22,8 33,6 39,7 117,0GEA Process Engineering 9,5 23,5 25,2 43,6 101,8 8,0 14,2 18,0 35,5 75,7 11,5 17,2 19,8 44,7 93,2GEA Refrigeration Technologies 5,9 10,0 9,9 15,4 41,2 2,5 6,6 3,1 8,9 21,1 1,9 6,3 7,3 13,9 29,4GEA Group excluding HX 40,6 71,0 75,4 107,2 294,1 29,4 43,4 52,4 66,3 191,6 29,9 48,5 65,3 104,1 247,9GEA Heat Exchangers 36,5 49,3 58,4 72,3 216,6 28,5 29,8 37,0 49,0 144,3 24,5 25,1 29,2 40,0 118,8GEA Group incl. HX 77,1 120,6 133,6 179,1 510,4 57,9 73,3 89,4 121,4 341,9 54,4 73,6 94,5 144,3 366,8Operating EBIT - Margin[in %]
Q1 08 Q2 08 Q3 08 Q4 08 2008 Q1 09 Q2 09 Q3 09 Q4 09 2009 Q1 10 Q2 10 Q3 10 Q4 10 2010
GEA Food Solutions1) -9,4% 3,4% 6,2% 4,2% 1,3% -9,2% 1,9% 4,5% 4,1% 0,1% 9,4% 7,0% 1,7% 3,0% 5,3%GEA Farm Technologies 4,6% 9,6% 14,1% 13,2% 10,9% -1,5% 6,1% 7,6% 6,1% 4,9% 1,2% 2,9% 7,4% 9,9% 5,9%GEA Mechanical Equipment2) 13,8% 15,7% 14,0% 18,8% 15,6% 11,6% 10,8% 15,1% 18,8% 14,0% 13,3% 13,1% 17,4% 19,7% 16,1%GEA Process Engineering 2,9% 5,9% 6,9% 10,9% 6,8% 3,0% 5,0% 6,5% 11,3% 6,6% 4,5% 5,8% 6,0% 11,1% 7,2%GEA Refrigeration Technologies 4,5% 6,3% 6,9% 8,7% 6,8% 2,0% 4,8% 2,1% 5,6% 3,7% 1,6% 4,6% 5,3% 8,1% 5,2%GEA Group excluding HX 5,5% 8,3% 8,9% 11,7% 8,8% 4,4% 6,3% 7,5% 8,8% 6,8% 5,0% 6,9% 8,5% 11,7% 8,4%GEA Heat Exchangers 9,2% 11,0% 12,1% 13,7% 11,7% 7,4% 7,1% 9,9% 11,1% 8,9% 7,2% 6,8% 8,1% 9,8% 8,0%GEA Group incl. HX 6,8% 9,3% 10,1% 12,5% 9,9% 5,5% 6,6% 8,4% 10,2% 7,8% 5,8% 6,9% 8,4% 11,2% 8,3%EBIT reported[in EUR million]
Q1 08 Q2 08 Q3 08 Q4 08 2008 Q1 09 Q2 09 Q3 09 Q4 09 2009 Q1 10 Q2 10 Q3 10 Q4 10 2010
GEA Food Solutions1) -8,6 3,4 6,1 4,4 5,3 -8,2 1,5 3,7 3,4 0,4 9,5 7,0 1,6 3,1 21,2GEA Farm Technologies 4,1 11,6 18,8 18,8 53,4 -1,6 3,6 7,4 3,1 12,4 0,5 2,2 8,1 9,2 20,0GEA Mechanical Equipment2) 27,0 29,7 29,4 39,5 125,6 23,0 19,1 22,7 22,7 87,6 20,5 21,0 24,6 37,6 103,8GEA Process Engineering 9,2 23,1 24,8 43,1 100,2 6,7 10,4 7,8 27,4 52,3 11,1 16,1 19,1 43,9 90,2GEA Refrigeration Technologies 5,9 9,8 9,7 15,2 40,7 1,8 5,9 1,7 3,9 13,3 1,5 5,3 5,0 0,4 12,2GEA Group excluding HX 37,6 67,7 71,7 103,5 280,5 24,0 33,7 33,0 33,4 124,2 30,5 40,4 49,3 82,0 202,2GEA Heat Exchangers 36,4 49,1 58,1 71,8 215,4 27,2 21,8 26,0 48,8 123,8 22,8 13,4 8,9 -15,2 29,9GEA Group incl. HX 76,1 119,3 131,8 177,1 504,2 53,8 58,1 63,5 92,8 268,2 51,0 56,4 60,8 68,2 236,5
GEA on Roadshows and Conferences - Q1 201463

engineering for a better world
Performance GEA Group & SegmentsKey Figures Time Line (4/6)
EBITDA reported[in EUR million]
Q1 11 Q2 11 Q3 11 Q4 11 2011 Q1 12 Q2 12 Q3 12 Q4 12 2012 Q1 13 Q2 13 Q3 13 Q4 13 2013 Q1 14
GEA Food Solutions1) 6,2 - - - - - - - - - - - - - - -GEA Farm Technologies 5,0 8,4 15,0 16,8 45,2 5,0 11,2 17,8 24,2 58,2 2,8 8,5 17,6 27,8 56,7 6,1GEA Mechanical Equipment2) 32,7 31,4 52,1 69,9 186,1 -3,0 43,5 48,3 46,1 134,9 38,6 48,3 56,8 71,0 214,7 42,1GEA Process Engineering 20,0 31,2 38,6 73,4 163,2 20,1 39,4 42,7 75,9 178,1 29,4 45,0 46,3 82,5 203,2 30,2GEA Refrigeration Technologies 8,9 14,3 14,1 21,7 59,0 11,0 13,4 16,0 24,9 65,2 9,6 16,8 17,1 27,5 71,0 12,4GEA Group excluding HX 59,9 78,1 117,9 184,4 440,3 29,4 104,1 123,0 163,5 420,1 71,1 113,8 130,0 200,3 515,2 83,0GEA Heat Exchangers 29,5 35,3 46,9 48,6 160,3 32,6 35,9 37,5 61,5 167,5 26,0 36,3 38,4 54,5 155,2 25,8GEA Group incl. HX 91,9 116,0 167,4 234,9 610,2 64,7 142,4 162,9 226,9 597,0 98,1 152,4 168,9 240,5 659,8 106,7Operating EBIT[in EUR million]
Q1 11 Q2 11 Q3 11 Q4 11 2011 Q1 12 Q2 12 Q3 12 Q4 12 2012 Q1 13 Q2 13 Q3 13 Q4 13 2013 Q1 14
GEA Food Solutions1) 2,8 - - - - - - - - - - - - - - -GEA Farm Technologies 2,1 5,6 12,1 14,0 33,8 1,9 8,2 14,7 21,5 46,3 0,1 5,5 14,4 24,5 44,6 3,1GEA Mechanical Equipment2) 28,6 44,4 44,8 64,0 181,7 26,8 42,6 49,1 57,0 175,5 32,7 42,0 50,1 62,8 187,6 34,5GEA Process Engineering 16,5 27,6 34,6 69,4 148,2 16,6 35,8 39,1 71,3 162,7 25,7 41,2 42,4 79,0 188,3 26,6GEA Refrigeration Technologies 7,1 12,3 11,9 20,1 51,3 8,7 11,1 13,8 22,6 56,2 7,3 14,3 14,7 25,2 61,5 10,0GEA Group excluding HX 48,2 83,2 101,9 169,3 402,6 50,7 94,9 115,4 164,7 425,8 55,4 101,0 115,6 186,8 458,8 66,8GEA Heat Exchangers 20,8 26,5 37,9 36,7 121,8 24,0 27,6 31,3 52,1 135,0 17,8 29,0 30,0 46,5 123,3 17,6GEA Group incl. HX 69,0 109,7 139,8 206,1 524,6 74,7 122,5 146,7 216,8 560,8 73,2 129,9 145,6 233,3 582,1 84,1Operating EBIT - Margin[in %]
Q1 11 Q2 11 Q3 11 Q4 11 2011 Q1 12 Q2 12 Q3 12 Q4 12 2012 Q1 13 Q2 13 Q3 13 Q4 13 2013 Q1 14
GEA Food Solutions1) 2,5% - - - - - - - - - - - - - - -GEA Farm Technologies 2,1% 4,7% 8,7% 9,1% 6,6% 1,6% 6,2% 9,3% 12,5% 8,0% 0,1% 4,1% 9,2% 13,9% 7,7% 2,4%GEA Mechanical Equipment2) 14,9% 14,3% 14,1% 17,2% 15,3% 9,9% 13,3% 15,0% 16,3% 13,9% 11,0% 12,6% 14,9% 17,5% 14,1% 11,1%GEA Process Engineering 5,5% 7,2% 8,8% 14,0% 9,4% 4,4% 8,9% 9,2% 13,8% 9,5% 6,5% 9,5% 9,6% 15,0% 10,5% 6,8%GEA Refrigeration Technologies 5,3% 7,4% 7,2% 11,0% 7,9% 5,8% 6,7% 7,8% 11,1% 8,1% 4,8% 7,6% 8,0% 12,0% 8,4% 6,4%GEA Group excluding HX 6,8% 8,6% 10,4% 14,4% 10,5% 5,8% 9,5% 10,9% 13,6% 10,3% 6,0% 9,5% 10,6% 15,0% 10,6% 7,0%GEA Heat Exchangers 6,1% 6,8% 8,9% 7,9% 7,5% 6,2% 6,8% 8,0% 12,3% 8,4% 5,6% 7,5% 7,9% 11,5% 8,3% 5,7%GEA Group incl. HX 6,6% 8,1% 10,0% 12,6% 9,7% 5,9% 8,8% 10,1% 13,4% 9,8% 5,9% 9,0% 10,0% 14,2% 10,1% 6,7%EBIT reported[in EUR million]
Q1 11 Q2 11 Q3 11 Q4 11 2011 Q1 12 Q2 12 Q3 12 Q4 12 2012 Q1 13 Q2 13 Q3 13 Q4 13 2013 Q1 14
GEA Food Solutions1) 2,8 - - - - - - - - - - - - - - -GEA Farm Technologies 1,5 5,0 11,4 13,2 31,1 1,2 7,5 13,9 20,3 42,9 -0,9 4,8 13,7 23,7 41,2 2,3GEA Mechanical Equipment2) 28,4 17,6 38,9 60,3 145,2 -12,8 34,5 38,5 21,8 82,1 28,7 38,1 46,1 58,8 171,7 30,5GEA Process Engineering 16,1 27,2 34,1 68,8 146,1 15,9 35,0 38,1 70,8 159,8 25,0 40,6 41,8 78,3 185,7 26,0GEA Refrigeration Technologies 6,8 10,6 11,1 18,0 46,6 8,2 10,6 13,3 22,0 54,0 6,8 13,8 14,2 24,2 59,0 9,4GEA Group excluding HX 44,0 51,1 91,6 160,2 347,0 6,5 82,3 100,1 125,4 314,3 48,1 90,4 106,0 175,1 419,6 58,7GEA Heat Exchangers 20,2 25,7 37,2 35,0 118,0 23,4 27,0 30,7 49,2 130,3 17,1 27,1 29,3 42,4 116,0 17,0GEA Group incl. HX 66,8 79,3 131,3 197,2 474,6 32,6 111,7 133,1 176,5 453,9 66,2 119,7 135,8 203,2 525,0 73,6
GEA on Roadshows and Conferences - Q1 201464
engineering for a better world
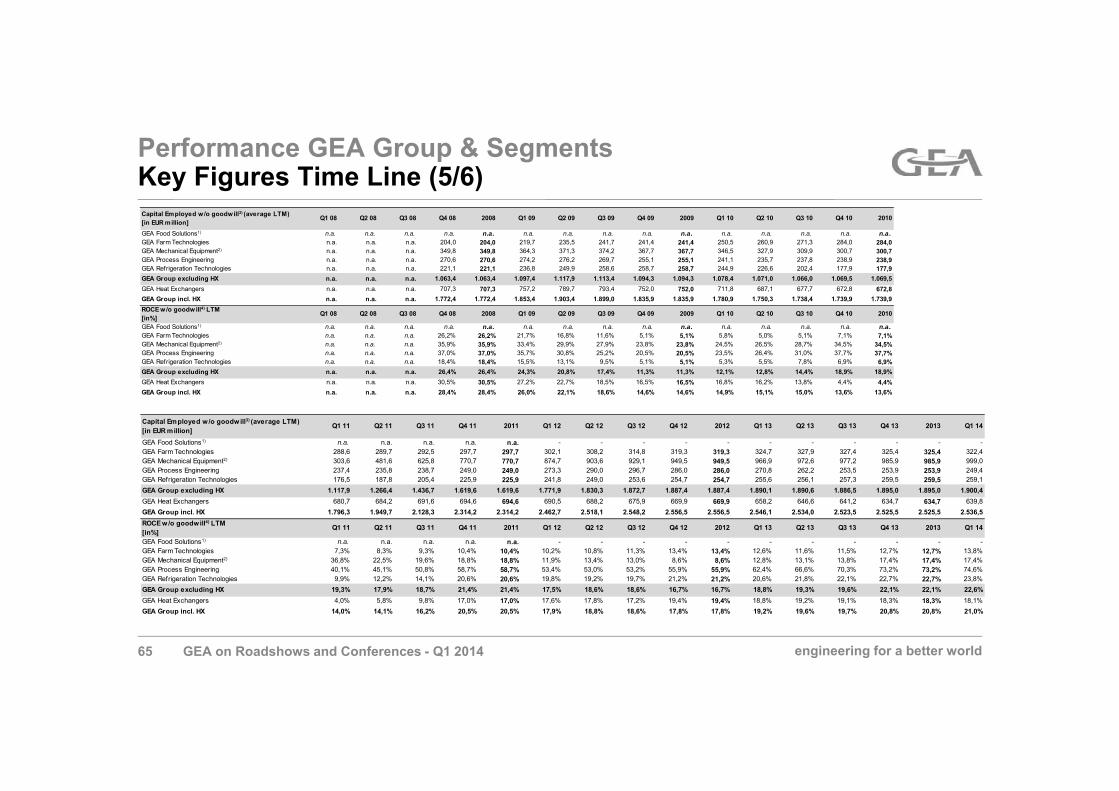
Performance GEA Group & SegmentsKey Figures Time Line (5/6)
Capital Employed w/o goodwill3) (average LTM)[in EUR million]
Q1 08 Q2 08 Q3 08 Q4 08 2008 Q1 09 Q2 09 Q3 09 Q4 09 2009 Q1 10 Q2 10 Q3 10 Q4 10 2010
GEA Food Solutions1) n.a. n.a. n.a. n.a. n.a. n.a. n.a. n.a. n.a. n.a. n.a. n.a. n.a. n.a. n.a.GEA Farm Technologies n.a. n.a. n.a. 204,0 204,0 219,7 235,5 241,7 241,4 241,4 250,5 260,9 271,3 284,0 284,0GEA Mechanical Equipment2) n.a. n.a. n.a. 349,8 349,8 364,3 371,3 374,2 367,7 367,7 346,5 327,9 309,9 300,7 300,7GEA Process Engineering n.a. n.a. n.a. 270,6 270,6 274,2 276,2 269,7 255,1 255,1 241,1 235,7 237,8 238,9 238,9GEA Refrigeration Technologies n.a. n.a. n.a. 221,1 221,1 236,8 249,9 258,6 258,7 258,7 244,9 226,6 202,4 177,9 177,9GEA Group excluding HX n.a. n.a. n.a. 1.063,4 1.063,4 1.097,4 1.117,9 1.113,4 1.094,3 1.094,3 1.078,4 1.071,0 1.066,0 1.069,5 1.069,5GEA Heat Exchangers n.a. n.a. n.a. 707,3 707,3 757,2 789,7 793,4 752,0 752,0 711,8 687,1 677,7 672,8 672,8GEA Group incl. HX n.a. n.a. n.a. 1.772,4 1.772,4 1.853,4 1.903,4 1.899,0 1.835,9 1.835,9 1.780,9 1.750,3 1.738,4 1.739,9 1.739,9ROCE w/o goodw ill4) LTM[in%]
Q1 08 Q2 08 Q3 08 Q4 08 2008 Q1 09 Q2 09 Q3 09 Q4 09 2009 Q1 10 Q2 10 Q3 10 Q4 10 2010
GEA Food Solutions1) n.a. n.a. n.a. n.a. n.a. n.a. n.a. n.a. n.a. n.a. n.a. n.a. n.a. n.a. n.a.GEA Farm Technologies n.a. n.a. n.a. 26,2% 26,2% 21,7% 16,8% 11,6% 5,1% 5,1% 5,8% 5,0% 5,1% 7,1% 7,1%GEA Mechanical Equipment2) n.a. n.a. n.a. 35,9% 35,9% 33,4% 29,9% 27,9% 23,8% 23,8% 24,5% 26,5% 28,7% 34,5% 34,5%GEA Process Engineering n.a. n.a. n.a. 37,0% 37,0% 35,7% 30,8% 25,2% 20,5% 20,5% 23,5% 26,4% 31,0% 37,7% 37,7%GEA Refrigeration Technologies n.a. n.a. n.a. 18,4% 18,4% 15,5% 13,1% 9,5% 5,1% 5,1% 5,3% 5,5% 7,8% 6,9% 6,9%GEA Group excluding HX n.a. n.a. n.a. 26,4% 26,4% 24,3% 20,8% 17,4% 11,3% 11,3% 12,1% 12,8% 14,4% 18,9% 18,9%GEA Heat Exchangers n.a. n.a. n.a. 30,5% 30,5% 27,2% 22,7% 18,5% 16,5% 16,5% 16,8% 16,2% 13,8% 4,4% 4,4%GEA Group incl. HX n.a. n.a. n.a. 28,4% 28,4% 26,0% 22,1% 18,6% 14,6% 14,6% 14,9% 15,1% 15,0% 13,6% 13,6%
Capital Employed w/o goodwill3) (average LTM)[in EUR million]
Q1 11 Q2 11 Q3 11 Q4 11 2011 Q1 12 Q2 12 Q3 12 Q4 12 2012 Q1 13 Q2 13 Q3 13 Q4 13 2013 Q1 14
GEA Food Solutions1) n.a. n.a. n.a. n.a. n.a. - - - - - - - - - - -GEA Farm Technologies 288,6 289,7 292,5 297,7 297,7 302,1 308,2 314,8 319,3 319,3 324,7 327,9 327,4 325,4 325,4 322,4GEA Mechanical Equipment2) 303,6 481,6 625,8 770,7 770,7 874,7 903,6 929,1 949,5 949,5 966,9 972,6 977,2 985,9 985,9 999,0GEA Process Engineering 237,4 235,8 238,7 249,0 249,0 273,3 290,0 296,7 286,0 286,0 270,8 262,2 253,5 253,9 253,9 249,4GEA Refrigeration Technologies 176,5 187,8 205,4 225,9 225,9 241,8 249,0 253,6 254,7 254,7 255,6 256,1 257,3 259,5 259,5 259,1GEA Group excluding HX 1.117,9 1.266,4 1.436,7 1.619,6 1.619,6 1.771,9 1.830,3 1.872,7 1.887,4 1.887,4 1.890,1 1.890,6 1.886,5 1.895,0 1.895,0 1.900,4GEA Heat Exchangers 680,7 684,2 691,6 694,6 694,6 690,5 688,2 675,9 669,9 669,9 658,2 646,6 641,2 634,7 634,7 639,8GEA Group incl. HX 1.796,3 1.949,7 2.128,3 2.314,2 2.314,2 2.462,7 2.518,1 2.548,2 2.556,5 2.556,5 2.546,1 2.534,0 2.523,5 2.525,5 2.525,5 2.536,5ROCE w/o goodwill4) LTM[in%]
Q1 11 Q2 11 Q3 11 Q4 11 2011 Q1 12 Q2 12 Q3 12 Q4 12 2012 Q1 13 Q2 13 Q3 13 Q4 13 2013 Q1 14
GEA Food Solutions1) n.a. n.a. n.a. n.a. n.a. - - - - - - - - - - -GEA Farm Technologies 7,3% 8,3% 9,3% 10,4% 10,4% 10,2% 10,8% 11,3% 13,4% 13,4% 12,6% 11,6% 11,5% 12,7% 12,7% 13,8%GEA Mechanical Equipment2) 36,8% 22,5% 19,6% 18,8% 18,8% 11,9% 13,4% 13,0% 8,6% 8,6% 12,8% 13,1% 13,8% 17,4% 17,4% 17,4%GEA Process Engineering 40,1% 45,1% 50,8% 58,7% 58,7% 53,4% 53,0% 53,2% 55,9% 55,9% 62,4% 66,6% 70,3% 73,2% 73,2% 74,6%GEA Refrigeration Technologies 9,9% 12,2% 14,1% 20,6% 20,6% 19,8% 19,2% 19,7% 21,2% 21,2% 20,6% 21,8% 22,1% 22,7% 22,7% 23,8%GEA Group excluding HX 19,3% 17,9% 18,7% 21,4% 21,4% 17,5% 18,6% 18,6% 16,7% 16,7% 18,8% 19,3% 19,6% 22,1% 22,1% 22,6%GEA Heat Exchangers 4,0% 5,8% 9,8% 17,0% 17,0% 17,6% 17,8% 17,2% 19,4% 19,4% 18,8% 19,2% 19,1% 18,3% 18,3% 18,1%GEA Group incl. HX 14,0% 14,1% 16,2% 20,5% 20,5% 17,9% 18,8% 18,6% 17,8% 17,8% 19,2% 19,6% 19,7% 20,8% 20,8% 21,0%
GEA on Roadshows and Conferences - Q1 201465

engineering for a better world
Performance GEA Group & SegmentsKey Figures Time Line (6/6): Remarks
1) All historical figures for GEA FS before Q2 2011 are pro-forma figures only and haven't been audited due to the fact that GEA FS's Financial Year was ending end of February. The listed historical figures before Q2 2011 are not included in the Group-numbers of the corresponding period.
2) Since Q2 2011 GEA ME figures includes GEA FS
3) Capital employed excluding goodwill from the acquisition of the former GEA AG by the former Metallgesellschaft AG in 1999.
4) ROCE LTM = EBIT reported (LTM) / Capital employed excluding goodwill from the acquisition of the former GEA AG by the former Metallgesellschaft AG in 1999 (average LTM).
GEA on Roadshows and Conferences - Q1 201466

engineering for a better world
ADR Information
GEA on Roadshows and Conferences - Q1 2014
GEA Group has a sponsored level I ADR program
Ratio: 1 ADR = 1 Ordinary share
Bloomberg ticker: GEAGY:US CUSIP: 361592108 ISIN: US3615921083
Depositary bank: Deutsche Bank Trust Company Americas
Depositary bank contacts: ADR broker helpline
Tel: +1 212 250 9100 (New York) Tel: +44 207 547 6500 (London) Email: [email protected] and website: www.adr.db.com
Depositary bank’s local custodian: Deutsche Bank Frankfurt67

engineering for a better world
Investor Relations Contact: [email protected]
GEA on Roadshows and Conferences - Q1 2014
Donat von Müller+49 211 9136 [email protected]
Axel Wolferts+49 211 9136 [email protected]
68
Dr. Helmut Schmale+49 211 9136 [email protected]