Embed Size (px)
Citation preview

On the Discriminability of the Handwriting of Twins
Sargur Srihari, Chen Huang and Harish Srinivasan
TR-04-07 June 2007
Center of Excellence for Document Analysis and Recognition (CEDAR) 520 Lee Entrance, Suite 202 Amherst. New York 14228
To appear in the Journal of Forensic Sciences

1
On the Discriminability of the Handwriting ofTwins
Sargur Srihari, Chen Huang, Harish Srinivasan
This project was funded in part by Grant Number 2004-IJ-CX-K050 awarded by the National Institute of Justice, Office of Justice Programs, US Departmentof Justice. Points of view in this document are those of the authors and do not necessarily represent the official position or policies of the US Department ofJustice.
SUNY Distinguished Professor, Department of Computer Science and Engineering and Director, Center of Excellence for Document Analysis andRecognition, University at Buffalo, State University of New York, Buffalo, NY 14228.
Doctoral Candidate, Department of Computer Science and Engineering, University at Buffalo, State University of New York, Buffalo, NY 14228.
Abstract
Since handwriting is influenced by physiology, training andother behavioral factors, a study ofthe handwriting of twins can shed light on the individualityof handwriting. The paper describes themethodology and results of such a study where handwriting samples of twins were compared by anautomatic handwriting verification system. The results complement that of a previous study wherea diverse population was used. The present study involves samples of 206 pairs of twins, whereeach sample consisted of a page of handwriting. The verification task was to determine whethertwo half-page documents (where the original samples were divided into upper and lower halves)were written by the same individual. For twins there were 1236 verification cases– including 824tests where the textual content of writing was different and412 tests where it was the same. Anadditional set of 1,648 test cases were obtained from handwriting samples of non-twins (generalpopulation). In order to make the handwriting comparison, the system computed macro features(overall pictorial attributes), micro features (characteristics of individual letters) , and style features(characteristics of whole-word shapes and letter pairs). Four testing scenarios were evaluated: twinsand non-twins writing the same text and writing different texts. Results of the verification testsshow that the handwriting of twins is less discriminable than that of non-twins: an overall errorrate of 12.91% for twins and 3.7% for non-twins. Error rates with identical twins were higherthan with fraternal twins. Error rates in all cases can be arbitrarily reduced by rejecting (notmaking a decision on) borderline cases. A level of confidencein the results obtained is given bythe fact that system error rates are comparable to that of humans (lower than that of lay personsand higher than that of questioned document examiners).
Index Terms
forensic science, questioned document examination, handwriting processing, document analy-sis, writer verification, twins study
I. I NTRODUCTION
The distinctiveness of each person’s handwriting has long been intuitively observed. Methods have beendeveloped for a human expertise of handwriting matching over many decades [1], [2], [3], [4], [5]. Yet thereis a need for studies in the quantitative assessment of the discriminative power of handwriting particularlyfor the acceptance by the courts of evidence provided by Questioned Document (QD) examiners. In aprevious study of handwriting individuality [6] we reported on the discriminability of handwriting of adiverse population from across the Unites States. The present paper reports on a complementary studyof the discriminatory power of handwriting when the population consists of a cohort group consisting oftwins. Both the previous study and the current study are basedon automated methods for handwritingcomparison. The current study uses algorithms that are updated with respect to the types of handwritingfeatures that are computed.
The necessity of studying cohort groups such as twins has been considered to be important in variousmedical [7], social [8], biometric and forensic fields. The similarities of genetic and environmentalinfluences of twins allow the importance of the characteristic to be studied in its limiting conditionswhere extraneous factors are minimized. Any methodology needs to be tested for boundary conditionswhere the possibility of error is maximum. Satisfactory performance with twins strengthens the reliabilityof the method. Research has been done on twins for biometrics such as fingerprints [9] and DNA [10],which are physiological in nature, i.e., they do not change after birth. On the other hand, handwriting ismore of a behavioral characteristic with a significant psychological component associated with it - whichmakes the study of the handwriting of twins to be meaningful [11].
Computational methods for handwriting analysis have been more recently developed [12], [13], [14],[6]. When designed as a system they allow conducting large scale and statistically meaningful tests. Theyprovide accuracy rates for verification (which is the task ofdetermining whether two handwriting samples
were written by the same person) and for identification (which is the task of determining the writerof a questioned document from a set of known writers). They provide a base-line result for human andautomated questioned handwriting examination. Subjecting automatic methods to the handwriting of twinswill throw some light on the effect of genetic and environmental factors.
Specific goals of the present study are to extend a previous study [6] on automated handwritinganalysis by (i) comparing performance on handwriting of twins with those of the general population;(ii) determining performance when the textual content of the questioned and known writing is different;(iii) comparing performance on fraternal and identical twins; and (iv) comparing system performancewith that of humans. The evaluation was done using an automatic method of writer verification, whichprovides a quantitative measure of the degree of match between a pair of handwriting samples, knownand questioned, based on the shapes of characters, bi-gramsand words, and the global structure of thecomposition, e.g., slant, word spacing, etc.
The rest of the paper is organized as follows. We first describe the verification system including thefeatures, similarity computation and decision algorithm.Then we present the twins test bed i.e., the wayin which the test cases were obtained and grouped. After thatwe give the results of the experimentsperformed, followed by comparison between human performance and system performance on the sametesting scenarios, and comparison of the current results with those that were reported previously withsamples not specialized to twins. The last section containsconcluding remarks.
II. A UTOMATIC WRITER VERIFICATION METHOD
To begin, it is useful to define the terms verification, identification and recognition. Verification isthe task of determining whether a pair of handwriting samples was written by the same individual.Identification is to find the writer having the closest match with the questioned document out of a poolof writers. Recognition is to convert images to text. The CEDAR-FOX system was used to performthese functions [15]. The system has interfaces to scan handwritten document images, obtain line andword segments, and automatically extract features for handwriting matching after performing characterrecognition and/or word recognition (with or without interactive human assistance in the recognitionprocess, e.g., by providing word truth).
Statistical parameters for writer verification are built into CEDAR-FOX - which were obtained usingseveral pairs of documents, which were either written by thesame writer or by different writers. Writerverification consists of four steps: (i) writing element extraction, (ii) similarity computation, (iii) estimatingconditional probability density estimates for the difference being from the same writer or from differentwriters (as Gaussian or Gamma).
Given a new pair of documents verification is performed as follows: (i) writing element extraction, (ii)similarity computation, (iii) determining the log-likelihood ratio (LLR) from the estimated conditionalprobability density estimates.
A. Features and Similarity
The system computes three types of features– macro featuresat the document level, micro features atthe character level and style features from bi-grams and words. Each of these features contributes to thefinal result to provide a confidence measure of whether two documents under consideration are from sameor different writers.
Macro-featurescapture the global characteristics of writer’s individualwriting habit and style. They areextracted from the entire document. Totally there are thirteen macro features including the initial elevenfeatures reported in the previous study [6] and two new ones –stroke width and average word gap. Theinitial eleven features are: entropy of gray values, binarization threshold, number of black pixels, numberof interior contours, number of exterior contours, contourslope components consisting of horizontal (0degree or flat stroke), positive (45 or 225 degree), vertical(90 or 270 degree) and negative (135 or 315degree), average height and average slant per line. In our current system, 11 out of 13 macro features
(except entropy and number of black pixels) are set to be the default features and were used in theexperiments.
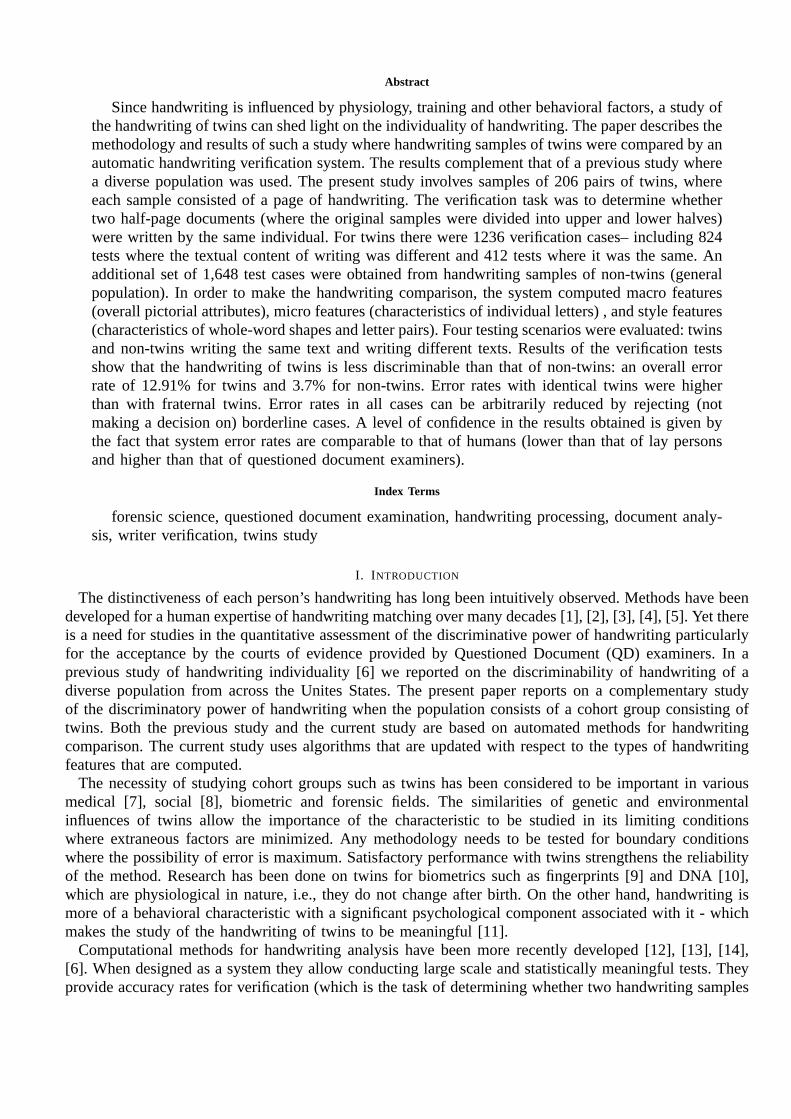
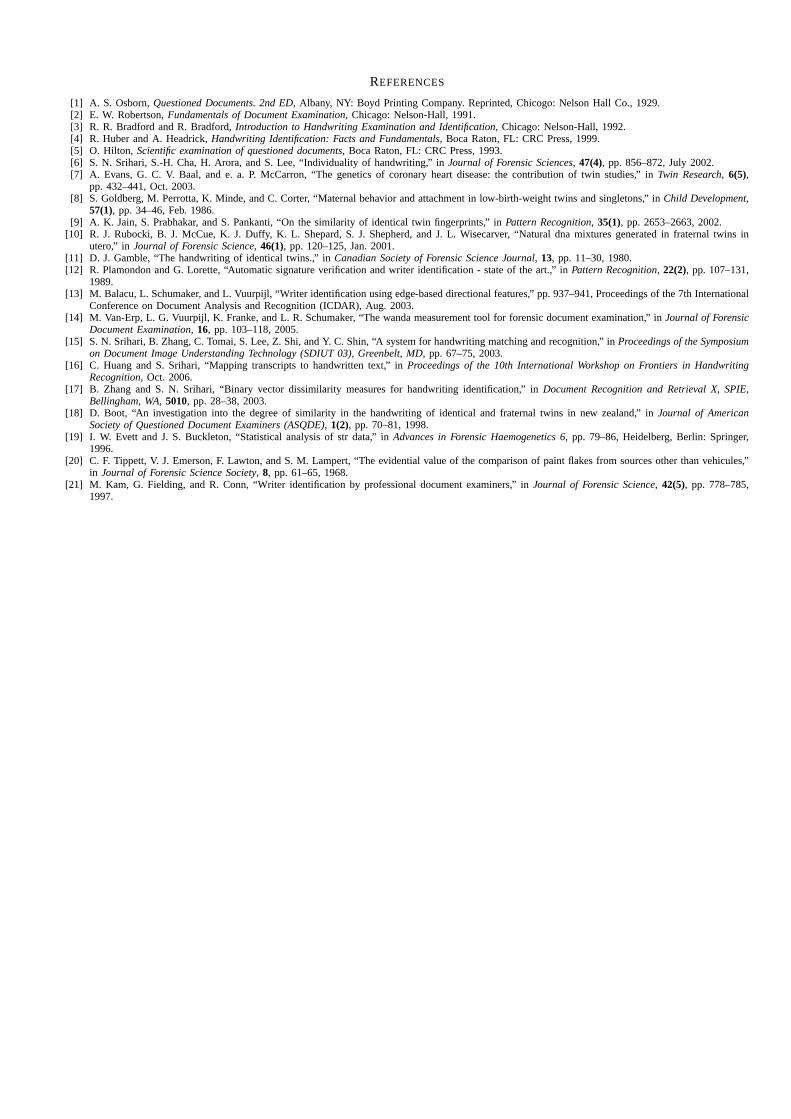
Micro-featuresare designed to capture the finer details at the character level. Each micro feature isa gradient-based binary feature vector, which consists of 512 bits corresponding to gradient (192 bits),structural (192 bits) and concavity (128 bits) features, known as GSC features [6]. Fig.1 shows threeexamples of the letter ’e’, the first two of which were writtenby the same person and the third waswritten by a different person. The pairwise score is positive for the first pair (indicating same writer) andnegative for the other pairs (indicating different writers).
[Figure 1 here]
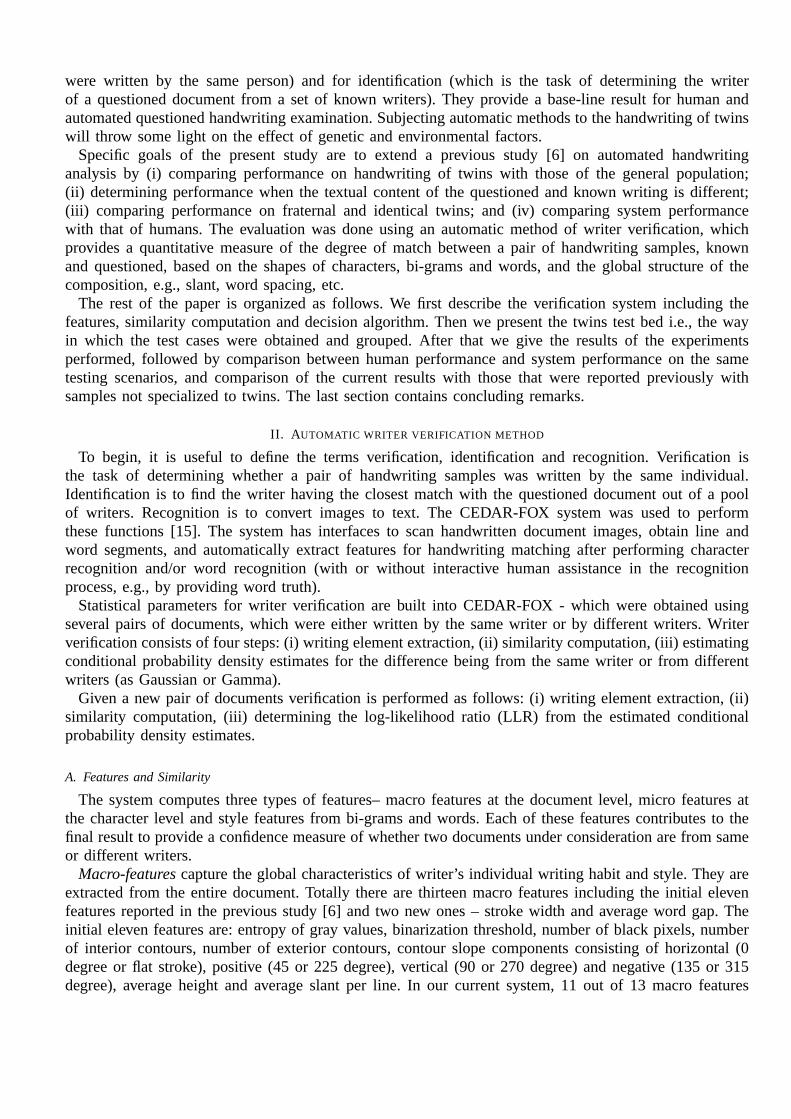
The use of micro features depends on the availability of recognized characters, i.e. character imagesassociated with truth. Four possible methods are availablein CEDAR-FOX to get recognized characters:(i) manually crop characters and label each with its truth; this labor-intensive method has the highestaccuracy, (ii) automatically recognize characters by using a built-in character recognizer; the method iserror prone for cursive handwriting where there are few isolated characters, (iii) automatically recognizewords using a word-lexicon from which segmented and recognized characters are obtained; error ratesdepend on the size of lexicon which can be as high as 40% for a page, and (iv) use transcript mappingto associate typed words in a transcript of the entire page with word images [16]; it involves typingthe document content once which can then be reused with each scanned document. Since the full-pagedocuments have the same content (CEDAR-letter), the transcript mapping approach was used as shownin Fig.2 This method has an 85% accuracy among words recognized. Since most words are recognized,they are also useful for extracting features of letter pairsand whole words, as discussed next.
[Figure 2 here]
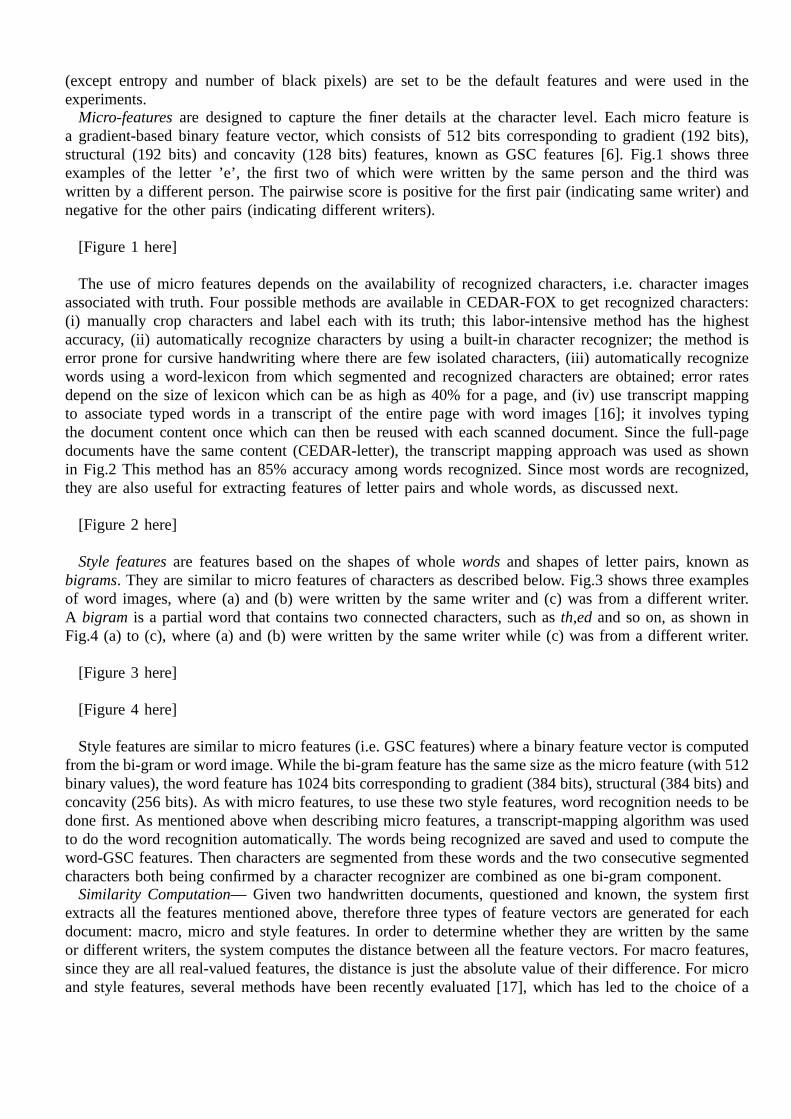
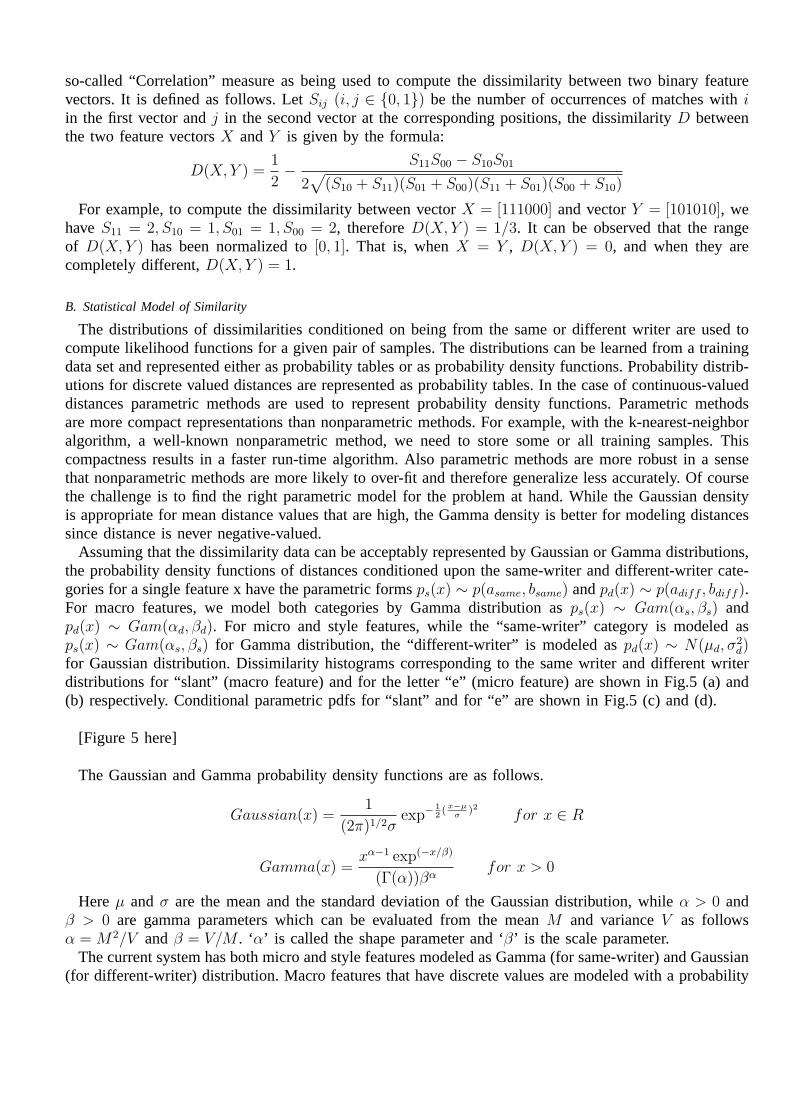
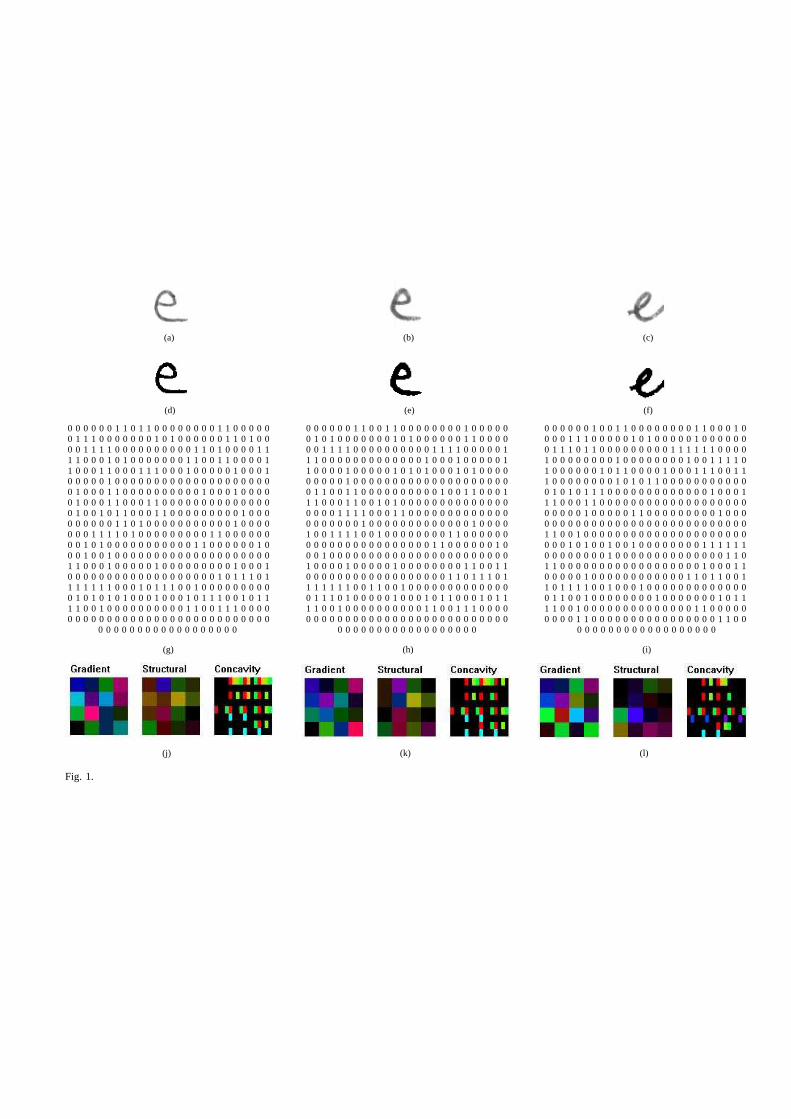
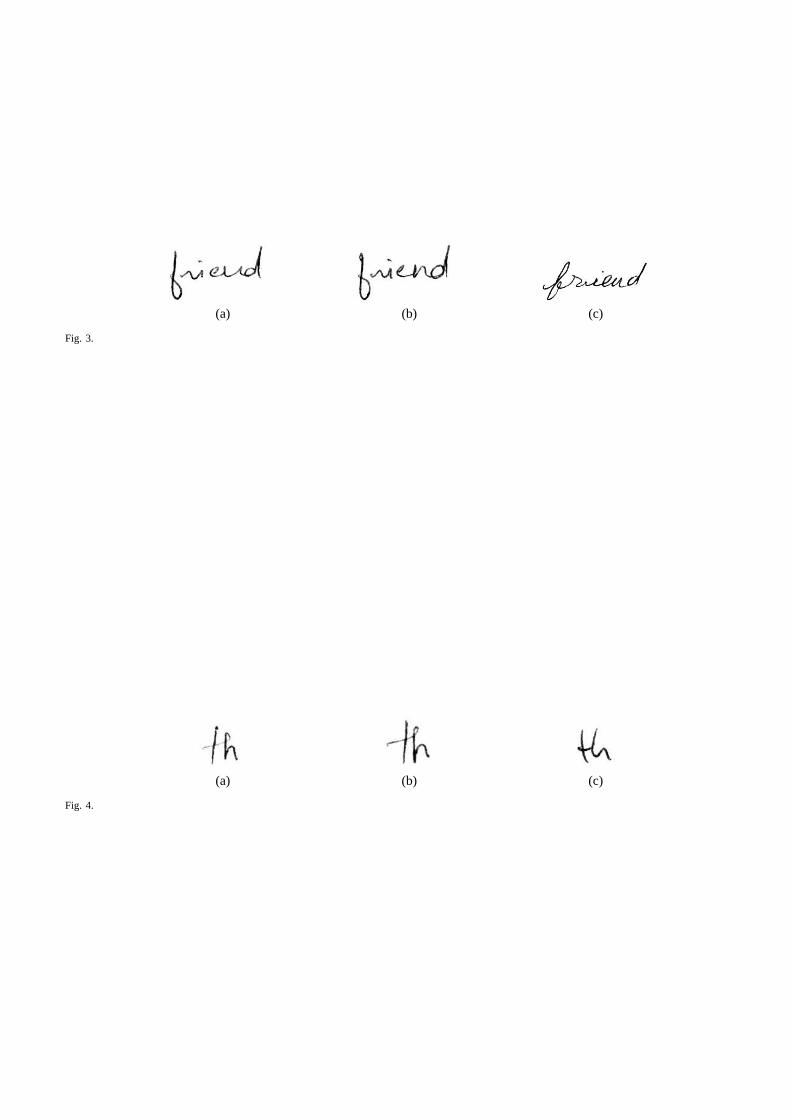
Style featuresare features based on the shapes of wholewords and shapes of letter pairs, known asbigrams. They are similar to micro features of characters as described below. Fig.3 shows three examplesof word images, where (a) and (b) were written by the same writer and (c) was from a different writer.A bigram is a partial word that contains two connected characters, such asth,ed and so on, as shown inFig.4 (a) to (c), where (a) and (b) were written by the same writer while (c) was from a different writer.
[Figure 3 here]
[Figure 4 here]
Style features are similar to micro features (i.e. GSC features) where a binary feature vector is computedfrom the bi-gram or word image. While the bi-gram feature has the same size as the micro feature (with 512binary values), the word feature has 1024 bits corresponding to gradient (384 bits), structural (384 bits) andconcavity (256 bits). As with micro features, to use these two style features, word recognition needs to bedone first. As mentioned above when describing micro features, a transcript-mapping algorithm was usedto do the word recognition automatically. The words being recognized are saved and used to compute theword-GSC features. Then characters are segmented from these words and the two consecutive segmentedcharacters both being confirmed by a character recognizer are combined as one bi-gram component.
Similarity Computation— Given two handwritten documents, questioned and known, the system firstextracts all the features mentioned above, therefore threetypes of feature vectors are generated for eachdocument: macro, micro and style features. In order to determine whether they are written by the sameor different writers, the system computes the distance between all the feature vectors. For macro features,since they are all real-valued features, the distance is just the absolute value of their difference. For microand style features, several methods have been recently evaluated [17], which has led to the choice of a
so-called “Correlation” measure as being used to compute thedissimilarity between two binary featurevectors. It is defined as follows. LetSij (i, j ∈ {0, 1}) be the number of occurrences of matches withiin the first vector andj in the second vector at the corresponding positions, the dissimilarity D betweenthe two feature vectorsX andY is given by the formula:
D(X,Y ) =1
2−
S11S00 − S10S01
2√
(S10 + S11)(S01 + S00)(S11 + S01)(S00 + S10)
For example, to compute the dissimilarity between vectorX = [111000] and vectorY = [101010], wehaveS11 = 2, S10 = 1, S01 = 1, S00 = 2, thereforeD(X,Y ) = 1/3. It can be observed that the rangeof D(X,Y ) has been normalized to[0, 1]. That is, whenX = Y , D(X,Y ) = 0, and when they arecompletely different,D(X,Y ) = 1.
B. Statistical Model of Similarity
The distributions of dissimilarities conditioned on beingfrom the same or different writer are used tocompute likelihood functions for a given pair of samples. The distributions can be learned from a trainingdata set and represented either as probability tables or as probability density functions. Probability distrib-utions for discrete valued distances are represented as probability tables. In the case of continuous-valueddistances parametric methods are used to represent probability density functions. Parametric methodsare more compact representations than nonparametric methods. For example, with the k-nearest-neighboralgorithm, a well-known nonparametric method, we need to store some or all training samples. Thiscompactness results in a faster run-time algorithm. Also parametric methods are more robust in a sensethat nonparametric methods are more likely to over-fit and therefore generalize less accurately. Of coursethe challenge is to find the right parametric model for the problem at hand. While the Gaussian densityis appropriate for mean distance values that are high, the Gamma density is better for modeling distancessince distance is never negative-valued.
Assuming that the dissimilarity data can be acceptably represented by Gaussian or Gamma distributions,the probability density functions of distances conditioned upon the same-writer and different-writer cate-gories for a single feature x have the parametric formsps(x) ∼ p(asame, bsame) andpd(x) ∼ p(adiff , bdiff ).For macro features, we model both categories by Gamma distribution asps(x) ∼ Gam(αs, βs) andpd(x) ∼ Gam(αd, βd). For micro and style features, while the “same-writer” category is modeled asps(x) ∼ Gam(αs, βs) for Gamma distribution, the “different-writer” is modeledas pd(x) ∼ N(µd, σ
2d)
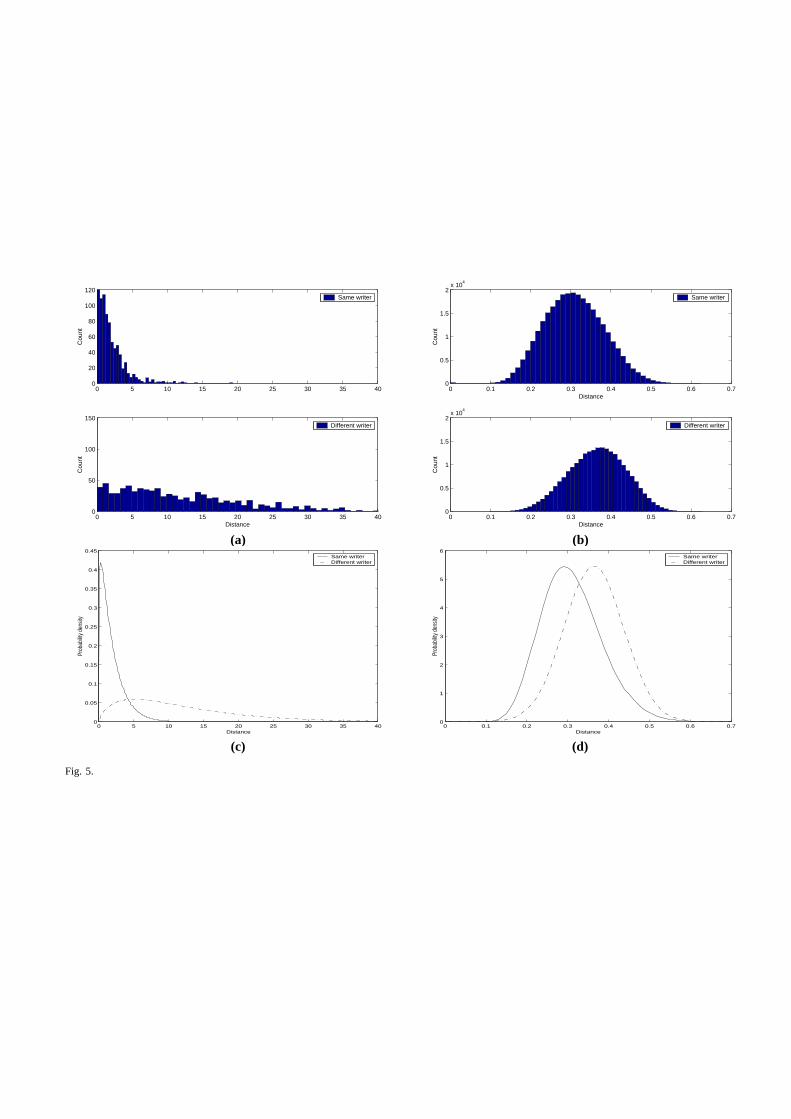
for Gaussian distribution. Dissimilarity histograms corresponding to the same writer and different writerdistributions for “slant” (macro feature) and for the letter “e” (micro feature) are shown in Fig.5 (a) and(b) respectively. Conditional parametric pdfs for “slant” and for “e” are shown in Fig.5 (c) and (d).
[Figure 5 here]
The Gaussian and Gamma probability density functions are asfollows.
Gaussian(x) =1
(2π)1/2σexp−
1
2(x−µ
σ)2 for x ∈ R
Gamma(x) =xα−1 exp(−x/β)
(Γ(α))βαfor x > 0
Here µ and σ are the mean and the standard deviation of the Gaussian distribution, while α > 0 andβ > 0 are gamma parameters which can be evaluated from the meanM and varianceV as followsα = M2/V andβ = V/M . ‘α’ is called the shape parameter and ‘β’ is the scale parameter.
The current system has both micro and style features modeledas Gamma (for same-writer) and Gaussian(for different-writer) distribution. Macro features thathave discrete values are modeled with a probability
table and those that have continuous values are modeled as Gamma distributions. The features and thedistributions by which they are modeled are summarized in Table 1.
[Table 1 here]
C. Parameter Estimation
All statistical parameters for each of the features used by CEDAR-FOX were estimated by usingmaximum likelihood estimation. The training data is a set oflearning, or design, samples provided by1, 000 non-twin writers who provided three samples each. Each document is a handwritten copy of a sourcedocument in English, known as the CEDAR letter [6]. The sourcedocument is concise and complete inthat it captures all characters (all numerals, small case and upper case English letters), punctuations anddistinctive letter and numeral combinations (ff, tt, oo, 00). The learning set provided by1, 000 writers isa subset of samples provided by1, 568 non-twin writers. The remainder of the samples was kept asidefor testing as non-twins data.
The list of macro features modeled as Gamma distribution andtheir estimated parameters are given inTable 2. The parameters were estimated by using3, 000 pairs of half-page documents including1, 500from same writer and1, 500 from different writer.
[Table 2 here]
D. Likelihood Ratio Computation
When two handwritten document images, which are labeled as known and questioned, are presented tothe CEDAR-FOX verification subsystem, the system segments each document into lines and words. A set ofmacro, micro and style features are extracted that capture both global characteristics from entire documentand local characteristics from individual characters, bi-grams and words. The system has available to ita set of statistical parameters for each of the macro, micro and style features. These parameters are usedto determine the probabilities of the differences observedin the value of the feature for each of the twodocuments, if they are from the same writer distribution or different writer distributions.
When each document is characterized by more than one feature CEDAR-FOX makes the assumption thatthe writing elements or features are statistically independent, although strictly speaking this is incorrect.Fig.6 shows a scatter plot for the first 12 macro features, which shows that there are some correlationsbetween the features. However such a classification method,known as naive Bayes classification, hasyielded good results in machine learning. We also investigated more complex models, such as a Bayesianneural network, and got an improvement of 1-2% on overall accuracy, which is not significant. There areseveral other justifications for choosing nave Bayes. First,its functioning is simple to explain and modify,e.g., since log-likelihood ratios are additive it allows usto observe the effects of adding and removingfeatures easily. Its simplicity goes back to the earliest QDE literature [1] where there is reference tomultiplying the probabilities of handwriting elements. Finally, a simpler model philosophically relates toOccam’s razor and practically to the avoidance of over-fitting.
[Figure 6 here]
Each of the two likelihoods that the given pair of documents were either written by the same individual orby different individuals can be expressed, assuming statistical independence of the features as follows. Foreach writing elementei, i = 1, · · · , c, wherec is the number of writing elements considered, we computethe distancedi(j, k) between thejth occurrence ofei in the first document and thekth occurrence ofei
in the second document for that writing element. The likelihoods are extracted as

Ls =c
∏
i=1
∏
j
∏
k
ps(di(j, k))
Ld =c
∏
i=1
∏
j
∏
k
pd(di(j, k))
The log-likelihood ratio (LLR) in this case has the form
LLR =c
∑
i=1
∑
j
∑
k
[ln ps(di(j, k)) − ln pd(di(j, k))]
That is, the finalLLR value is computed using all the features, considering each occurrence of eachelement in each document. The CEDAR-FOX verification system outputs theLLR of two documents beingtested. When the likelihood ratio (LR) is above1, the LLR value is positive and when the likelihoodratio is below1, the LLR value is negative. Hence, if the final score obtained is positive, the systemconcludes that the two documents were written by the same writer. Similarly, if the finalLLR score isnegative, the system concludes that the two documents were written by different writers.
E. Correction to Tails
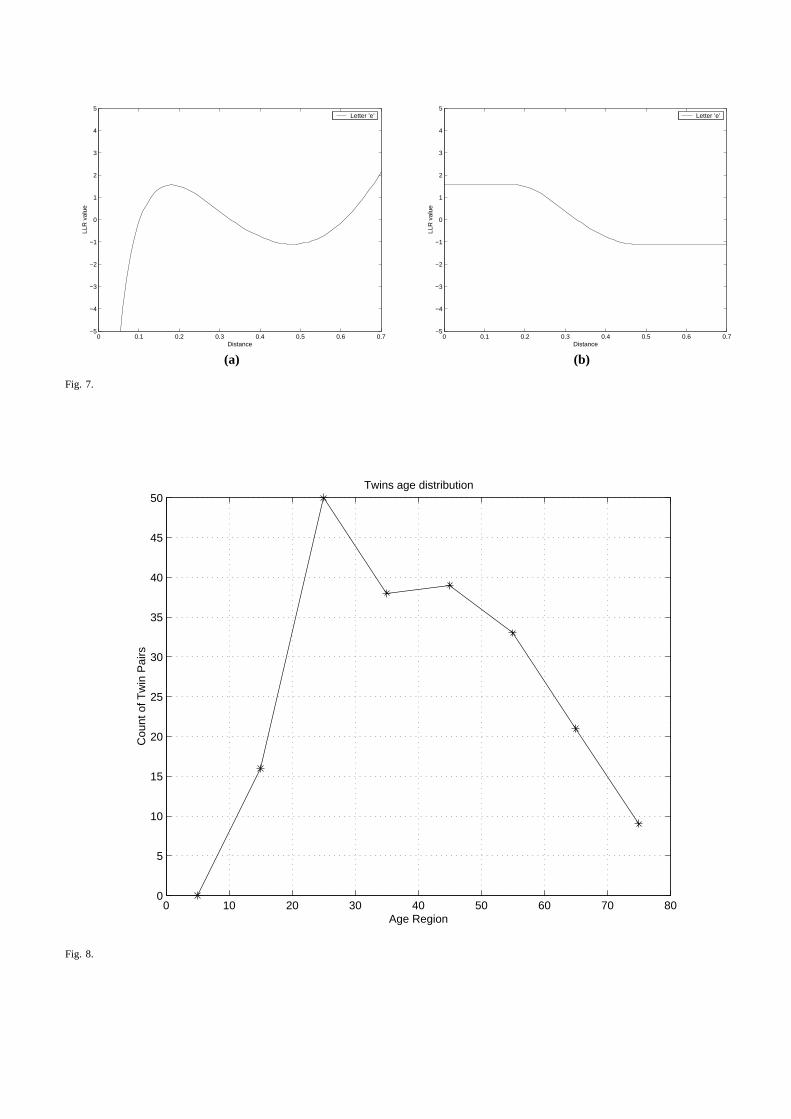
Finally it is necessary to introduce a correction to the computed LLR at the extremely unlikely tailregions of the distributions. For a given feature, when the distance between two elements being matcheddecreases we expect the score to be a positive value that is increasing. Similarly when the distanceincreases we expect the LLR to be a negative value that decreases. However for very small distancevalues and very large distance values, which lie at the tailsof the Gamma and Gaussian distributions, theasymptotic behavior can be anomalous. Fig.7 (a) shows an example of the original relationship betweenLLR score and the distance for letter ‘e’ based on the model as shown in Fig.5(d). From the figure,it can be observed that for small values of distance (< 0.17 in this case) when decreasing the distancethe LLR value also drops; while for large value of distance (> 0.49 in this case) when increasing thedistance the LLR value starts to increase monotonically. This is because we use a parametric method(Gaussian or Gamma) to model the data. The probability density functions learned from the training setare approximations whose interactions in the tail region are not modeled accurately. This phenomenonis a consequence of distributions and parametric models that assign non-zero values to the distributionasymptotically. Therefore it is necessary to correct the LLR value in the boundary cases so that we haveonly one decision boundary. The adjusted model has a distance-LLR relationship as shown in Fig.7(b). Forsmall values of distance we assign a fixed LLR value that is themaximum value in the region. Similarlyfor large value of distance we assign the minimum value in that region.
[Figure 7 here]
III. T WINS TEST-BED
The purpose of this study was to determine the performance ofCEDAR-FOX on handwriting samplesprovided by twins. Handwritten documents from two hundred and six pairs of twins and non-twins werecollected. None of the twins’ handwriting was used in the design of the CEDAR-FOX system and hencethe results on twins provide an objective evaluation of the system.

A. Demographic distribution of twins
The demographic data for the individuals who contributed tothe twin’s data set is as follows.• Location Samples were obtained from people coming from at least 150 different cities and 7 different
countries.• Age The age distribution of the sample pairs is as shown in Fig.8. Here age is divided into regions
with the first region representing age from 0-10, second from10-20 and so on. As seen from thegraph, age from 20-30 is the interval with the most twin pairs.
[Figure 8 here]
• School All the twins attended the same school as their twin pair. 16% had private schooling whilethe rest 84% had public schooling.
• Handedness Of the 412 test cases, 15 (3.6%) were ambidextrous, 45 (10.9%) were left handed andthe rest 352 (85.5%) were right handed. Among twin 36 (17.5%)pairs had different handedness.
• Type of twins Out of the 206 pairs of twins 31 (15.1%) were fraternal, 170 (82.5%) were identicaland the rest of the 5 (2.4%) pairs were unsure.
• Sex 69 (16.7%) test cases were male and the rest 343 (83.3%) female.• Injuries 21 (5.1%) had injuries that could affect their handwriting.
B. Writing styles
The handwriting samples were divided into three different categories based on the style of writing: bothtwins used printing (including upper case printing), both used cursive, one used printing and the otherused cursive (mixed). Table 3 shows the number of twin pairs for each category.
[Table 3 here]
C. Document Content
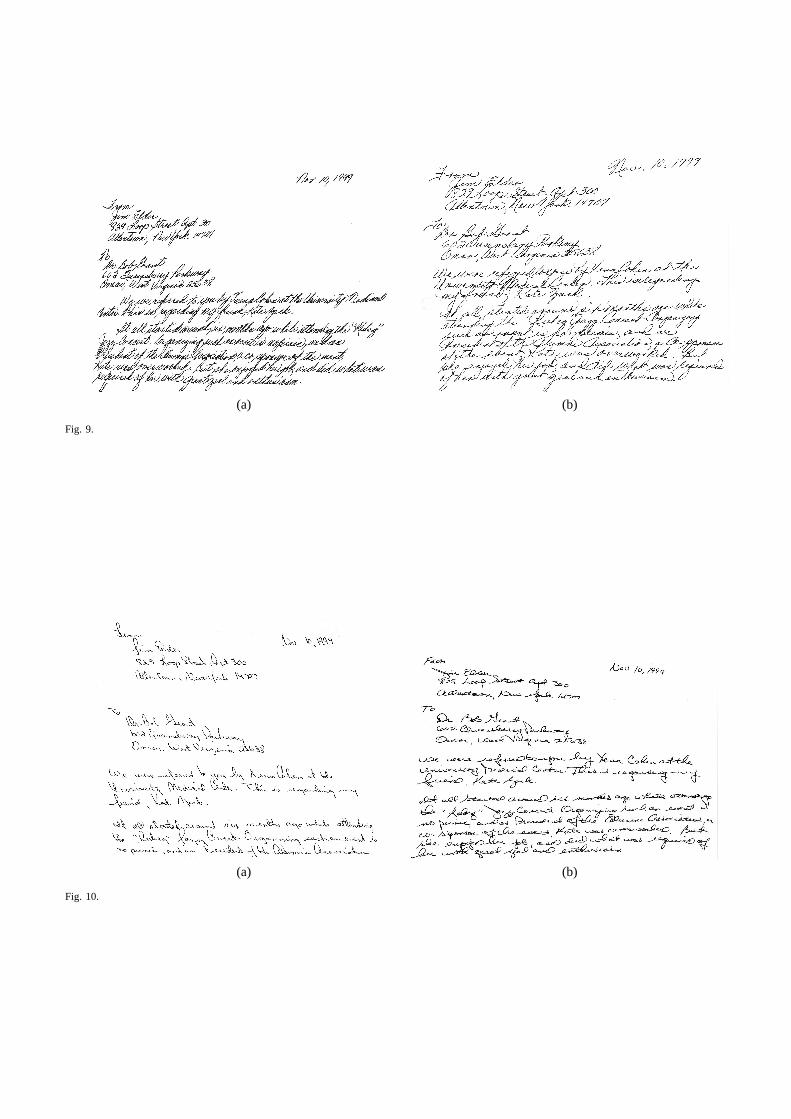
As in the case of the design samples, each twin participant was required to copy the CEDAR letter oncein his/her most natural handwriting using plain unlined sheets, and a medium black ball-point pen. Portionsof the CEDAR letter for two pairs of twins having similar and dissimilar handwriting are shown in Fig.9and Fig.10. They are also examples of different-writer same-content (DS) test (see details discussed innext section). The similarity scores of these two pairs of documents are shown in Table 4 and Table 5.
[Figure 9 here]
[Table 4 here]
[Figure 10 here]
[Table 5 here]
D. Verification test cases
Two hundred and six pairs of twins provided one sample each. Thus a total of 412 (206×2) documentswere obtained. Each of the document images was cut into two roughly, logically equal size images – theupper and lower parts – and these half page images were used for testing same and different documentcontent. Two documents images, corresponding to the upper and lower parts from the same writer, which

is one test case of “Same-writer Different-content” (SD) are shown in Fig.11. The similarity scores ofthese two documents are shown in Table 6.
[Figure 11 here]
[Table 6 here]
Fig.12 shows the schematics of the method by which the test cases were generated.
[Figure 12 here]
Verification test scenarios are therefore divided into the following four classes.1) Same writer, Same content (SS):The two samples are from the same writer having the same textual
content.2) Same writer, Different content (SD):The two samples are from the same writer having different
textual content.3) Different writer, Same content (DS):The two samples are from different writers having the same
textual content.4) Different writer, Different content (DD):The two samples are from different writers having different
textual content.Note that SD and DD are complementary in that both involve different content data. The average of
the SD and DD cases gives the overall accuracy on different content data. The DS does not have acomplementary SS case since there was only one sample provided by each twin writer. For non-twins,since we have three samples from each writer, we generated another set of 412 half-page documents fromthe original data set to form the SS test cases, as shown in Fig.12(b). The number of test cases for eachof the four scenarios are given in Table 7.
[Table 7 here]
Thus, from 824 half page documents of the twins, we generate atotal of 1236 (412+412+412) testcases for the experiments. And a total of 1648 test cases wereobtained from a different set of 412 writerstaken from the general population samples.
E. Testing Process
CEDAR-FOX version 0.53 was used for all testing. The verification process was run with all the testcases specified. The results of these test cases were in the LLR format as explained above. Scatter plotgraphs were made of the final LLR score to show the distribution. The accuracy of each individual featurein discriminating among writers as well as the accuracy of the system, when all the features are consideredsimultaneously is calculated.
IV. V ERIFICATION RESULTS
The outcome of a writer verification experiment can be one four possibilities: (a)true positive:documentswritten by the same writers and it is confirmed by the results;(b) true negative:documents written bydifferent writers and it is confirmed by the results; (c)false positive:documents written by differentwriters but the results concluding them to be written by the same writer and (d)false negative:documentswritten by the same writers but the results concluding that they are written by the different writers. Truepositive and true negative are correct results while false positive and false negative are erroneous results.In CEDAR-FOX same/different decision is based on computing the LLR value.
A. Scatter Plots
The test results for the data were plotted as a scatter plot graph where the x-axis represents the number oftest cases and the y-axis represents the LLR values obtained. LLR values indicate the extent of similaritybetween the writers. The higher the LLR, the greater is the similarity between the writers while low LLRindicates dissimilarity within the writers.
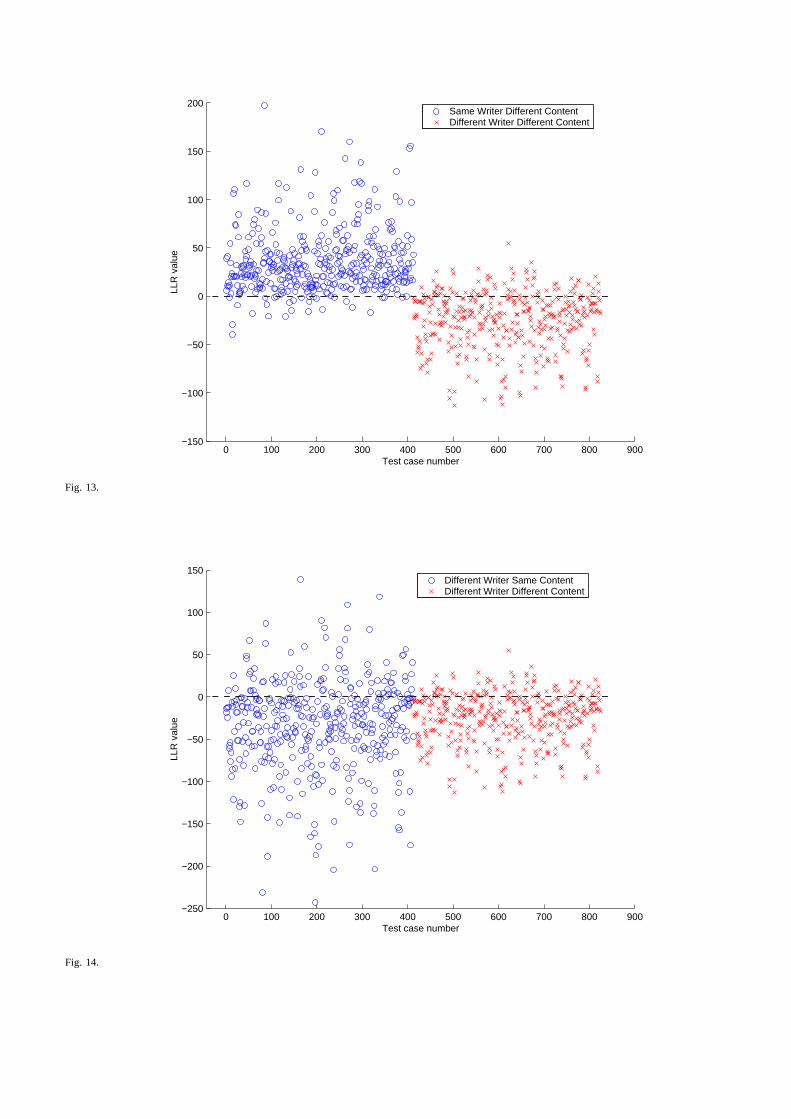
Different Content (SD + DD)–For different content tests, when using 11 macro features plus micro andstyle features, (which gives the best performance, as we will see in the next section), the LLR valuesrange from−39.25 to 197.95 for Same writer Different content data with majority of themlying in the0 ∼ 50 range (as shown in Fig.13). Test cases having LLR values lessthan 0 are false negatives. ForDifferent writer Different content data LLR values range from −112.62 to 54.36 with most of them lyingin −70 ∼ 10 range.
[Figure 13 here]
Different Writer (DS + DD)–For Different writer Same content (DS), the LLR values range from−243.24 to 138.4. Majority of the cases lie in the−75 ∼ 20 range. As seen from Fig.14, different writersame content data has more false positives than different writer different content. This can be attributedto the pictorial effects where different content appears asdifferent pictorial content.
[Figure 14 here]
B. Verification error rates with twins and non-twins
The error rates of verification using different content dataare given in Table 8. This is the case whenthere is no rejection, i.e., in each case a hard decision is made whether the writers are the same or different.As shown in the table, using the combination of all the features together shows an overall improvementover any of the individual features. The overall error rate for twins is 12.6%. In comparison the overallerror rate for non-twins is 3.15%.
[Table 8 here]
Error rates for twins and non-twins using same content data are shown in Table 9. Since only a singledocument per twin was available, the Same-writer Same-content (SS) testing was performed only on non-twins as shown in Fig.12(b). However, since the same writer testing is independent of twins, we use thesame values (column 4) for both twins and non-twins to compute overall error rates (columns 5 and 6).
[Table 9 here]
The overall error rates for twins versus non-twins can be observed by combining the results of samecontent (Table 8) and different content (Table 9 IX ). When using all features the average overall errorrate for twins is 12.91% (average of 12.6% and 13.22%) and theoverall error rate for non-twins is 3.7%(average of 3.15% and 4.24%). This attests to the fact that twins’ handwriting is indeed more similar thanthat of non-twins.
The error rate of the system can be decreased by rejecting test cases that lie in a region of LLR ambiguity.In this experiment, the rejection intervals are chosen symmetrically aroundLLR = 0. A bigger intervalwill lead to a higher rejection rate and a lower error rate. Since the final LLR value is the summation ofall the features considered, the upper and lower thresholdsof LLR values for rejection depend on howmany features are used. In the current system, the default features setting is the combination of all threetypes of features, i.e., macro, micro and style features. There are another two factors that could affect the
selection of rejection intervals. The first one is whether the compared documents have same (or different)content. Because same content documents have more common elements to be compared, generally theyhave a larger range of the final LLR values. Therefore, in order to having a same rejection rate (forexample 20%), one needs to choose a bigger interval for same content cases (−20 ∼ 20 in this case) anda smaller interval for different content cases (−10 ∼ 10 in this case). The second factor is how difficultthe testing cases are. For example, in our experiments, it can be observed that, with a same rejectioninterval twin cases have a much higher rejection rate, whichalso means that handwriting of twins aremore similar than that of non-twins.
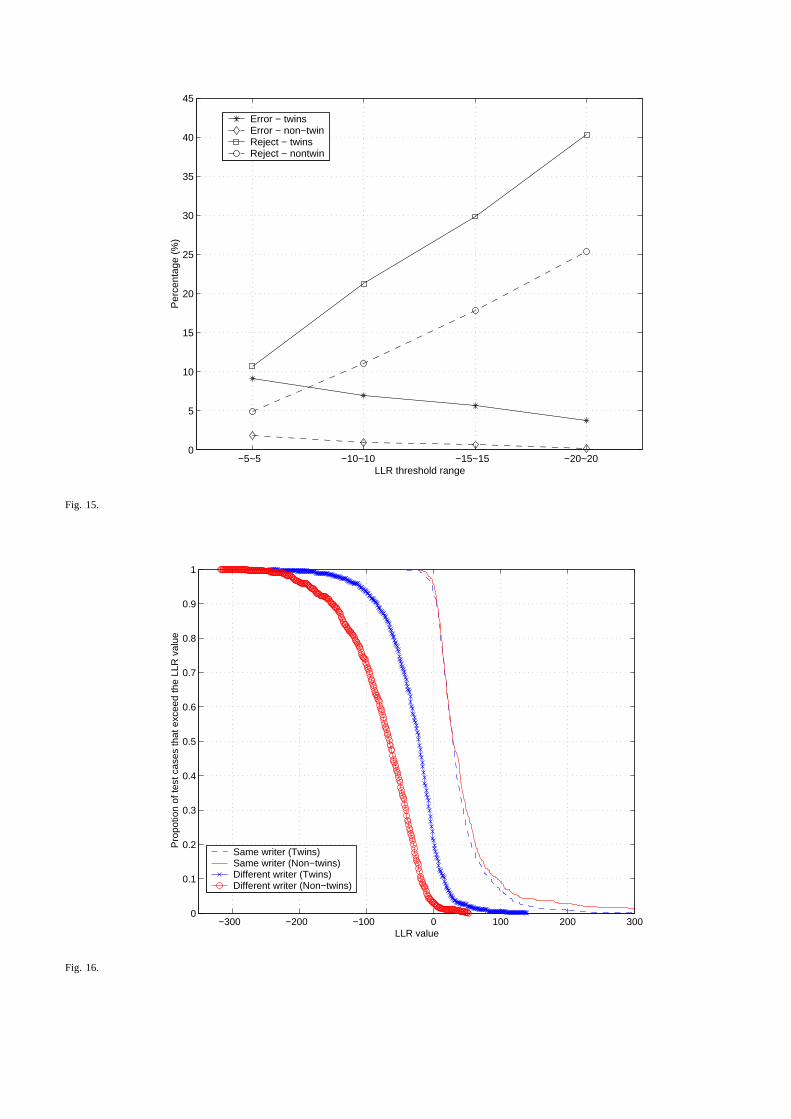
In this experiment, for different content testing, the rejection range was set to be from−20 to 20. Foreach rejection interval, the error and reject rates were calculated as shown in Table 10.
[Table 10 here]
Fig.15 shows the error rates with the increasing reject rates for twins as well as non-twins. Error ratefor twins can be reduced from 12.6% to 3.73% by rejecting 40% of the cases. Similarly the error rate fornon-twins can be reduced from 3.15% to 0.14% by rejecting about 25% of the test cases.
[Figure 15 here]
For same content testing, the rejection range was set to be from −45 to 45. For each rejection interval,the error and reject rates were shown in Table 11. Error rate for twins can be reduced from 13.22% to6.23% by rejecting 38% of the cases. Similarly the error ratefor non-twins can be reduced from 4.24% to1.04% by rejecting about 18% of the test cases. The error ratecan be further reduced but at the expenseof rejecting a higher number of cases.
[Table 11 here]
C. Verification accuracy for different writing styles
Each handwriting sample was assigned one of three styles: cursive, handprint or mixed. The followingthree categories were evaluated separately: cursive (bothtwins used cursive handwriting), hand-print (bothused hand-print), and mixed (twins used two different styles). The distribution of writing styles amongthe twin data was shown in Table 3.
Table 12 gives verification results based on writing style. The overall error rates of verifying cursive,hand-print and mixed handwriting using different content are 15.82%, 15.13% and 2.5% respectively.As seen in the table, the performance of hand-print is roughly the same (marginally better) than that ofcursive. In different writer different content testing, the error rate is zero for mixed style since the systemalways prefers a “different writer” answer when the styles of two documents are different. Such cases areusually rejected (offer no opinion) by QD examiners in practice. An automatic reject option can be putinto CEDAR-FOX to reject cases where there are mixed types of writing styles, particularly since it isalready able to make an assignment on the print-cursive scale.
[Table 12 here]
D. Verification accuracy for identical and fraternal twins
Identical and fraternal twins were tested separately to determine verification accuracy. The distributionof different types of twins was given in the previous section(31 identical, 169 fraternal and 6 unsure).Verification error rates for each test category are shown in Table 13.

[Table 13 here]
The average error rate for identical twins is 20.43% and the average for fraternal twins is 11.29%. Thusthe handwriting of identical twins is twice as likely to be similar than that of fraternal twins. An earlierstudy on twin handwriting on a much smaller sample set and human examination concluded that therewas no significant difference between identical and fraternal twins [18]. Our study indicates that theredoes exist a difference, with the caveats that we used an automatic method and the sample of identicaltwins considered was small (31).
E. Strength of Evidence
It is useful to look at the distribution of LLR values to determine the strength of evidence when we arecomparing the handwriting of twins and non-twins. The representation in Fig.16, called the Tippett plot,was proposed by Evett and Buckleton in the field of interpretation of the forensic DNA analysis [19].The Tippett plot, first used in forensic analysis of paints [20]. refers to “within-source comparison” and“between-sources comparison”. The functions in the Tippett plot represent the inverse CDFs (cumulativedistribution functions), and are also known as reliabilityfunctions.
The Tippett plot of Fig.16, whose x-axis consists of LLR values and y-axis the proportion of caseswhere the LLR values exceeds the x value, has two sets of two curves: one set for non-twins and anotherfor twins. The two curves in each set correspond to same and different writer cases. In interpreting theplot it has to be kept in mind that an LLR value greater than zero implies a decision of same-writer anda value less than zero implies different-writer. For any given LLR reading the Tippett plot informs us asto the strength of that evidence, i.e., for a given positive (negative) value, the proportion of the positive(negative) cases that had a higher (lower) value than the current reading.
For the same-writer case, the proportion of cases where the LLR value exceeds zero is about 96%and 95% for non-twins and twins respectively-which followsfrom the observation that a vertical lineat 0 on the x-axis intersects the twins and non-twins curves at 0.96 and 0.95. The error rates are thecomplementary values of 4% for non-twins and 5% for twins. For the different-writer case, the proportionof cases above zero is about 3% for non-twins and 18% for twins-which are the error rates. Thus itbecomes clear that the error rates for twins are higher than that for non-twins.
[Figure 16 here]
Another significant observation from the Tippet plot is thatthe separation between same and differentwriter curves is more for non-twin data than for twin data, i.e., the positive scores are more positive andthe negative scores are more negative for non-twins than fortwins. This is another indication that thattwin handwriting is more similar than non-twin handwriting.
V. COMPARISON WITH HUMAN PERFORMANCE
It is useful to compare performance of the system to that of the human examiners on the same set ofdata. Since document examination involves cognitive skills, human performance can be considered to bea goal of automation. Such a comparison is also useful to calibrate system performance with respect tohuman performance.
A test consisting of 824 cases was setup with an online interface. This test is available athttp://www.cedar.buffalo.edu/NIJ/test2/verifier2.php.The system gives a score obtained at the time the user exits from the test. The tests were randomly
generated where the two documents were the top and bottom half page images. The user has three optionsin each test case: same writer, different writer and reject.
Table 14 gives the performance of twelve humans taking the test. Examiners A, B and C were internsstudying to become QD examiners. Examiners D to L were lay persons (graduate students in computer
science and engineering). Since humans tend to reject borderline cases, the CEDAR-FOX system wasalso evaluated at the same rejection rates as those of human examiners and the results are shown in therightmost column.
[Table 14 here]
It is seen that examiners A-C had an average of overall error rate of 4.69%, which is better than that of thesystem error rate of 9.02% at the same rejection rates (errorrates of 2.31%, 7.4% and 4.37% compared to6.81%, 9.93% and 10.31% respectively). The average of overall error rate of the nine laypersons (examinersD-L) was 16.51%, which was 4.49% higher than that of the system. Individually only layperson F hada 1.5% lower error rate than the system. Thus system performance is better than that of lay persons butworse than that of QDEs.
Since professional QDEs have been shown to perform better than lay persons [21], we can also concludethat their performance would be superior to that of the current system. One caveat in our results comparingthe performance of humans and machines is that the present testing was on a small set of 12 individuals,a larger scale testing would be needed to compare the absolute performances of QDEs, lay persons andthe machine.
Although accuracy is not as high as that of QDEs, one advantage of using the system over humancomparison is the speed in performing the tests. While the system takes a few minutes to compare the812 sample pairs, human comparison can take several hours depending on the examiner. Another aspectof using an automated system is the objectivity of the resultin that it will provide the same result withthe same input data each time.
VI. COMPARISON WITH PREVIOUS STUDY
A. Previous study
In the earlier study on handwriting individuality the size of the combined training and testing setconsisted of1500 writers providing three samples each [6]. The handwriting sample consisted of a fullpage of text and matching was based on the same textual context in questioned and known documents.Writers in the previous study were not twins.
In the previous study verification was performed by a neural network classifier. This matching wasdone on same content writing. The verification accuracy was about 96% using macro features based onwhole documents and 10 manually cropped characters. When lesser content was used (a paragraph oftext), verification performance, using macro features, reduces from 95% to 88%. Since character croppingwas manual a perfect match between corresponding characters in the two documents was possible.
B. Current study
In the current study verification is done by the CEDAR-FOX system which uses a naive Bayes classifier,where each of the features was modeled either as Gamma-Gaussian distribution or using a probabilitytable. The testing was done using both different content data and same content data, and the length of thecontent became shorter since we only use half page documents. The characters for micro features wereobtained by using an automatic transcript-mapping based truthing which can introduce some errors intothe process. For different content testing, the verification correct rates were 87.4% for twins and 96.85%for non-twins. For same content testing, the resulting correct rates were 86.78% for twins and 95.76%for non-twins.
The current study uses a naive Bayes classifier, which is generally not as accurate as a neural networkclassifier that was used in the previous study. However it waschosen as the method of comparison in theCEDAR-FOX system because the features can be dynamically selected and each of their contributionsto classification can be individually listed, which is not possible for the neural network classifier. Yetthe results of both systems are comparable, as the current study shows an accuracy of about 96% fornon-twins, which is about the same as that of the previous study.

VII. SUMMARY AND DISCUSSION
The discriminability of the handwriting of twins is a usefulmeasure of the individuality of handwriting.Results of automated handwriting verification using handwriting specimens from twins and non-twinshave been presented. When no rejection is allowed, the verification error rate using different content, halfpage writing is 12.6% for twins and 3.15% for non-twins. By allowing rejection the verification error ratecan be reduced to less than 4% and less than 0.5% respectively. When comparing identical twins withfraternal twins with different writer testing cases, the difference of error rates shows that, handwriting ofidentical twins are more similar than that of fraternal twins.
The fact that error rate with twins is higher than with non-twins is probably consistent with biometricsthat is based purely on physiological factors such as fingerprints and DNA. Distinguishing between thehandwriting of twins is harder than that of non-twins since twins are more likely to have the same geneticand environmental influences than others. The results for non-twins are also consistent with the results ofa previous study of the general population. The error rate for non-twins was about the same as that of theprevious study, although the textual content of the pair of documents used in verification was different, thetextual passages were smaller (half pages), the charactersused in the matching process were automaticallydetermined (rather than manually, thus introducing some errors).
Comparison with human performance, on half-page of writing tests, shows that system performance isbetter than that of non-expert humans. From a system design point of view this is encouraging in thatreaching human performance has been the goal of most work in artificial intelligence. With further systemimprovements system performance can hope to reach the performance of QDEs. The current system isbased on a set of simple features. The use of better features,e.g. those with a cognitive basis such asthe ones used by questioned document examiners, and higher accuracy classification algorithms shouldfurther decrease the error rates. Since expert human performance has been shown to be significantly betterthat that of lay persons many sophisticated improvements are likely to be needed to reach the higher goal.
VIII. A CKNOWLEDGEMENT
We thank our research collaborators Kathleen Storer, TraciMoran and Rich Dusak as well as the studentinterns who provided us with the twin data and helped refine the CEDAR-FOX system. We also wish tothank Vivek Shah who contributed to this work.
REFERENCES
[1] A. S. Osborn,Questioned Documents. 2nd ED, Albany, NY: Boyd Printing Company. Reprinted, Chicogo: Nelson Hall Co., 1929.[2] E. W. Robertson,Fundamentals of Document Examination, Chicago: Nelson-Hall, 1991.[3] R. R. Bradford and R. Bradford,Introduction to Handwriting Examination and Identification, Chicago: Nelson-Hall, 1992.[4] R. Huber and A. Headrick,Handwriting Identification: Facts and Fundamentals, Boca Raton, FL: CRC Press, 1999.[5] O. Hilton, Scientific examination of questioned documents, Boca Raton, FL: CRC Press, 1993.[6] S. N. Srihari, S.-H. Cha, H. Arora, and S. Lee, “Individuality of handwriting,” in Journal of Forensic Sciences, 47(4), pp. 856–872, July 2002.[7] A. Evans, G. C. V. Baal, and e. a. P. McCarron, “The genetics of coronary heart disease: the contribution of twin studies,” in Twin Research, 6(5),
pp. 432–441, Oct. 2003.[8] S. Goldberg, M. Perrotta, K. Minde, and C. Corter, “Maternal behavior and attachment in low-birth-weight twins and singletons,” inChild Development,
57(1), pp. 34–46, Feb. 1986.[9] A. K. Jain, S. Prabhakar, and S. Pankanti, “On the similarity of identical twin fingerprints,” inPattern Recognition, 35(1), pp. 2653–2663, 2002.
[10] R. J. Rubocki, B. J. McCue, K. J. Duffy, K. L. Shepard, S. J. Shepherd, and J. L. Wisecarver, “Natural dna mixtures generated in fraternal twins inutero,” in Journal of Forensic Science, 46(1), pp. 120–125, Jan. 2001.
[11] D. J. Gamble, “The handwriting of identical twins.,” inCanadian Society of Forensic Science Journal, 13, pp. 11–30, 1980.[12] R. Plamondon and G. Lorette, “Automatic signature verification and writer identification - state of the art.,” inPattern Recognition, 22(2), pp. 107–131,
1989.[13] M. Balacu, L. Schumaker, and L. Vuurpijl, “Writer identification using edge-based directional features,” pp. 937–941, Proceedings of the 7th International
Conference on Document Analysis and Recognition (ICDAR), Aug. 2003.[14] M. Van-Erp, L. G. Vuurpijl, K. Franke, and L. R. Schumaker, “The wanda measurement tool for forensic document examination,” in Journal of Forensic
Document Examination, 16, pp. 103–118, 2005.[15] S. N. Srihari, B. Zhang, C. Tomai, S. Lee, Z. Shi, and Y. C. Shin, “A system for handwriting matching and recognition,” inProceedings of the Symposium
on Document Image Understanding Technology (SDIUT 03), Greenbelt, MD, pp. 67–75, 2003.[16] C. Huang and S. Srihari, “Mapping transcripts to handwritten text,” in Proceedings of the 10th International Workshop on Frontiers in Handwriting
Recognition, Oct. 2006.[17] B. Zhang and S. N. Srihari, “Binary vector dissimilaritymeasures for handwriting identification,” inDocument Recognition and Retrieval X, SPIE,
Bellingham, WA, 5010, pp. 28–38, 2003.[18] D. Boot, “An investigation into the degree of similarityin the handwriting of identical and fraternal twins in new zealand,” in Journal of American
Society of Questioned Document Examiners (ASQDE), 1(2), pp. 70–81, 1998.[19] I. W. Evett and J. S. Buckleton, “Statistical analysis of str data,” in Advances in Forensic Haemogenetics 6, pp. 79–86, Heidelberg, Berlin: Springer,
1996.[20] C. F. Tippett, V. J. Emerson, F. Lawton, and S. M. Lampert, “The evidential value of the comparison of paint flakes from sources other than vehicules,”
in Journal of Forensic Science Society, 8, pp. 61–65, 1968.[21] M. Kam, G. Fielding, and R. Conn, “Writer identification byprofessional document examiners,” inJournal of Forensic Science, 42(5), pp. 778–785,
1997.

IX. F IGURE LEGENDS
• FIG.1–Micro features for three handwritten letters. Each column gives the greyscale image, binaryimage, GSC binary feature vecter (512 bits), and color coded gradient, structural and concavity vectors.The correlation distance between (a) and (b) is0.16 while that between (a) and (c) is0.43 and between(b) and (c) is0.35. The LLR value between (a) and (b) is1.49 while that between (a) and (c) is−0.97and between (b) and (c) is−0.26.
• FIG.2–Transcript Mapping: (a) handwritten text, (b) typedtranscript and (c) transcript-mapped hand-written text.
• FIG.3–Word shapes: (a) and (b) are word samples from the samewriter while (c) is a word samplefrom a different writer. The correlation distance between (a) and (b) is0.2022 and between (a) and(c) is 0.3702. The LLR value between (a) and (b) is4.44 and between (a) and (c) is−0.35.
• FIG.4–Bigram shape: (a) and (b) are two bigram samples from the same writer while (c) is a bigramsample from a different writer. The correlation distance between (a) and (b) is0.1996 and between(a) and (c) is0.3735. The LLR value between (a) and (b) is4.35 and between (a) and (c) is−0.47.
• FIG.5–Histograms and parametric probability density functions: (a) same and different histogramsfor the “slant”(macro feature), (b) same and different histograms for the letter ‘e’(micro feature), (c)same and different pdfs for “slant” and (d) same and different pdfs for letter ‘e’.
• FIG.6–Scatter plot for 12 macro features.• FIG.7–Relationship betweenLLR value and the distance for letter ‘e’. (a) the original one and (b)
the adjusted one.• FIG.8–Age distribution among twins in database.• FIG.9–Similar handwriting samples of a pair of twins: (a) Twin 003a and (b) Twin 003b. The LLR
value between these two documents is7.15.• FIG.10–Dissimilar handwriting samples of a pair of twins: (a) Twin 006a and (b) Twin 006b. The
LLR value between these two documents is−98.36.• FIG.11–Example of Same-writer Different-content (SD) data obtained by dividing the full page of
the CEDAR letter (Twin 178a) into (a) upper half and (b) lower half. The LLR value between thesetwo documents is34.19.
• FIG.12–Generating test cases for (a) twin samples and (b) non-twin samples: each bidirectional arrowrepresents 206 test cases.
• FIG.13–Scatter plot for twins with different content (SD and DD). Same writer (SD) has a lowererror rate than different writer (DD).
• FIG.14–Scatter plot for different writers with same and different content (DS and DD). Same contentdata (DS) has a slightly higher error rate than different content data (DD).
• FIG.15–Verification Error-Reject rates for twins and non-twins using different content data.• FIG.16–Tippet plots for twins and non-twins: the twin plotsare less separated than the non- twin
plots.
(a) (b) (c)
(d) (e) (f)
0 0 0 0 0 0 1 1 0 1 1 0 0 0 0 0 0 0 0 1 1 0 0 0 0 0 0 0 0 0 0 0 1 1 0 0 1 1 0 0 0 0 0 0 0 0 1 0 0 0 00 0 0 0 0 0 0 1 0 0 1 1 0 0 0 0 0 0 0 0 1 1 0 0 0 1 00 1 1 1 0 0 0 0 0 0 0 1 0 1 0 0 0 0 0 0 1 1 0 1 0 0 0 1 0 1 0 0 0 0 0 0 0 1 0 1 0 0 0 0 0 0 1 1 0 0 00 0 0 0 1 1 1 0 0 0 0 0 1 0 1 0 0 0 0 0 1 0 0 0 0 0 00 0 1 1 1 1 0 0 0 0 0 0 0 0 0 0 1 1 0 1 0 0 0 0 1 1 0 0 1 1 1 1 0 0 0 0 0 0 0 0 0 0 1 1 1 1 0 0 0 0 01 0 1 1 1 0 1 1 0 0 0 0 0 0 0 0 0 1 1 1 1 1 1 0 0 0 01 1 0 0 0 1 0 1 0 0 0 0 0 0 0 1 1 0 0 1 1 0 0 0 0 1 1 1 0 0 0 0 0 0 0 0 0 0 0 0 0 1 0 0 0 1 0 0 0 0 01 1 0 0 0 0 0 0 0 0 1 0 0 0 0 0 0 0 0 1 0 0 1 1 1 1 01 0 0 0 1 1 0 0 0 1 1 1 0 0 0 1 0 0 0 0 0 1 0 0 0 1 1 0 0 0 0 1 0 0 0 0 0 1 0 1 0 1 0 0 0 1 0 1 0 0 00 1 0 0 0 0 0 0 1 0 1 1 0 0 0 0 1 0 0 0 1 1 1 0 0 1 10 0 0 0 0 1 0 0 0 0 0 0 0 0 0 0 0 0 0 0 0 0 0 0 0 0 0 0 0 0 0 1 0 0 0 0 0 0 0 0 0 0 0 0 0 0 0 0 0 0 00 1 0 0 0 0 0 0 0 0 1 0 1 0 1 1 0 0 0 0 0 0 0 0 0 0 00 1 0 0 0 1 1 0 0 0 0 0 0 0 0 0 0 1 0 0 0 1 0 0 0 0 0 1 1 0 0 1 1 0 0 0 0 0 0 0 0 0 0 1 0 0 1 1 0 0 01 0 1 0 1 0 1 1 1 0 0 0 0 0 0 0 0 0 0 0 0 0 1 0 0 0 10 1 0 0 0 1 1 0 0 0 1 1 0 0 0 0 0 0 0 0 0 0 0 0 0 0 1 1 0 0 0 1 1 0 0 1 0 1 0 0 0 0 0 0 0 0 0 0 0 0 00 1 1 0 0 0 1 1 0 0 0 0 0 0 0 0 0 0 0 0 0 0 0 0 0 0 00 1 0 0 1 0 1 1 0 0 0 1 1 0 0 0 0 0 0 0 0 0 1 0 0 0 0 0 0 0 1 1 1 1 0 0 0 1 1 0 0 0 0 0 0 0 0 0 0 0 00 0 0 0 0 0 1 0 0 0 0 0 1 1 0 0 0 0 0 0 0 0 0 1 0 0 00 0 0 0 0 0 1 1 0 1 0 0 0 0 0 0 0 0 0 0 0 1 0 0 0 0 0 0 0 0 0 0 0 1 0 0 0 0 0 0 0 0 0 0 0 0 0 1 0 0 00 0 0 0 0 0 0 0 0 0 0 0 0 0 0 0 0 0 0 0 0 0 0 0 0 0 00 0 0 1 1 1 1 0 1 0 0 0 0 0 0 0 0 0 1 1 0 0 0 0 0 0 1 0 0 1 1 1 1 0 0 1 0 0 0 0 0 0 0 0 1 1 0 0 0 0 00 1 1 0 0 1 0 0 0 0 0 0 0 0 0 0 0 0 0 0 0 0 0 0 0 0 00 0 1 0 1 0 0 0 0 0 0 0 0 0 0 0 1 1 0 0 0 0 0 0 1 0 0 0 0 0 0 0 0 0 0 0 0 0 0 0 0 0 1 1 0 0 0 0 0 0 10 0 0 0 1 0 1 0 0 1 0 0 1 0 0 0 0 0 0 0 0 1 1 1 1 1 10 0 1 0 0 1 0 0 0 0 0 0 0 0 0 0 0 0 0 0 0 0 0 0 0 0 0 0 1 0 0 0 0 0 0 0 0 0 0 0 0 0 0 0 0 0 0 0 0 0 00 0 0 0 0 0 0 0 0 1 0 0 0 0 0 0 0 0 0 0 0 0 0 0 1 1 01 1 0 0 0 1 0 0 0 0 0 1 0 0 0 0 0 0 0 0 0 1 0 0 0 1 1 0 0 0 0 1 0 0 0 0 0 1 0 0 0 0 0 0 0 0 1 1 0 0 11 1 1 0 0 0 0 0 0 0 0 0 0 0 0 0 0 0 0 0 0 1 0 0 0 1 10 0 0 0 0 0 0 0 0 0 0 0 0 0 0 0 0 0 0 1 0 1 1 1 0 1 0 0 0 0 0 0 0 0 0 0 0 0 0 0 0 0 0 0 1 1 0 1 1 1 01 0 0 0 0 0 1 0 0 0 0 0 0 0 0 0 0 0 0 1 1 0 1 1 0 0 11 1 1 1 1 1 0 0 0 1 0 1 1 1 0 0 1 0 0 0 0 0 0 0 0 0 1 1 1 1 1 1 0 0 1 1 0 0 1 0 0 0 0 0 0 0 0 0 0 0 00 1 0 1 1 1 1 0 0 1 0 0 0 1 0 0 0 0 0 0 0 0 0 0 0 0 00 1 0 1 0 1 0 1 0 0 0 1 0 0 0 1 0 1 1 1 0 0 1 0 1 1 0 1 1 1 0 1 0 0 0 0 0 1 0 0 0 1 0 1 1 0 0 0 1 0 11 0 1 1 0 0 1 0 0 0 0 0 0 0 0 1 0 0 0 0 0 0 0 1 0 1 11 1 0 0 1 0 0 0 0 0 0 0 0 0 0 1 1 0 0 1 1 1 0 0 0 0 1 1 0 0 1 0 0 0 0 0 0 0 0 0 0 1 1 0 0 1 1 1 0 0 00 1 1 0 0 1 0 0 0 0 0 0 0 0 0 0 0 0 0 0 1 1 0 0 0 0 00 0 0 0 0 0 0 0 0 0 0 0 0 0 0 0 0 0 0 0 0 0 0 0 0 0 0 0 0 0 0 0 0 0 0 0 0 0 0 0 0 0 0 0 0 0 0 0 0 0 00 0 0 0 0 1 1 0 0 0 0 0 0 0 0 0 0 0 0 0 0 0 0 1 1 0 0
0 0 0 0 0 0 0 0 0 0 0 0 0 0 0 0 0 0 0 0 0 0 0 0 0 0 0 0 0 0 0 0 0 0 0 0 0 0 0 0 0 0 0 0 0 0 0 0 0 0 00 0 0
(g) (h) (i)
(j) (k) (l)
Fig. 1.

(a)
(b)
(c)
Fig. 2.
(a) (b) (c)
Fig. 3.
(a) (b) (c)
Fig. 4.
0 5 10 15 20 25 30 35 400
20
40
60
80
100
120
Cou
nt
Same writer
0 5 10 15 20 25 30 35 400
50
100
150
Distance
Cou
nt
Different writer
0 0.1 0.2 0.3 0.4 0.5 0.6 0.70
0.5
1
1.5
2x 10
4
Cou
nt
Distance
Same writer
0 0.1 0.2 0.3 0.4 0.5 0.6 0.70
0.5
1
1.5
2x 10
4
Distance
Cou
ntDifferent writer
(a) (b)
0 5 10 15 20 25 30 35 400
0.05
0.1
0.15
0.2
0.25
0.3
0.35
0.4
0.45
Distance
Prob
abilit
y de
nsity
Same writerDifferent writer
0 0.1 0.2 0.3 0.4 0.5 0.6 0.70
1
2
3
4
5
6
Distance
Prob
abilit
y de
nsity
Same writerDifferent writer
(c) (d)
Fig. 5.
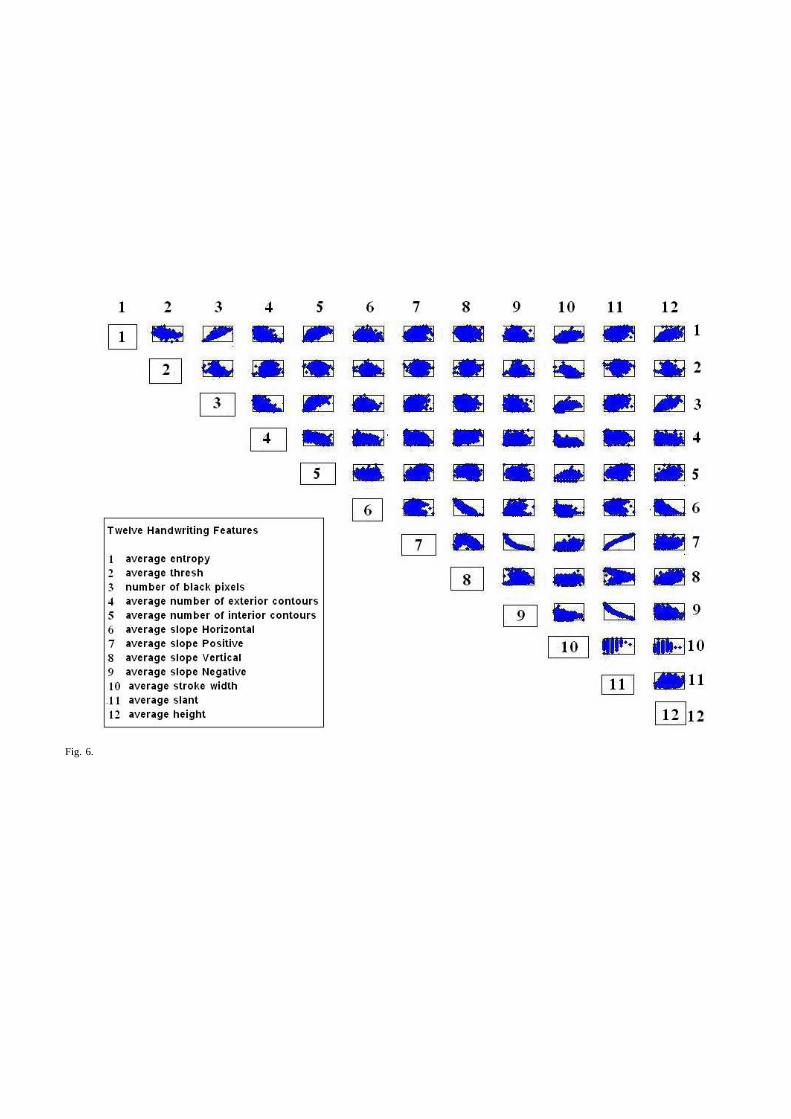
Fig. 6.
0 0.1 0.2 0.3 0.4 0.5 0.6 0.7−5
−4
−3
−2
−1
0
1
2
3
4
5
Distance
LLR
val
ue
Letter ’e’
0 0.1 0.2 0.3 0.4 0.5 0.6 0.7−5
−4
−3
−2
−1
0
1
2
3
4
5
Distance
LLR
val
ue
Letter ’e’
(a) (b)
Fig. 7.
0 10 20 30 40 50 60 70 800
5
10
15
20
25
30
35
40
45
50Twins age distribution
Age Region
Cou
nt o
f Tw
in P
airs
Fig. 8.
(a) (b)
Fig. 9.
(a) (b)
Fig. 10.

(a) (b)
Fig. 11.
(a) (b)
Fig. 12.
0 100 200 300 400 500 600 700 800 900−150
−100
−50
0
50
100
150
200
Test case number
LLR
val
ue
Same Writer Different ContentDifferent Writer Different Content
Fig. 13.
0 100 200 300 400 500 600 700 800 900−250
−200
−150
−100
−50
0
50
100
150
Test case number
LLR
val
ue
Different Writer Same ContentDifferent Writer Different Content
Fig. 14.
−5~5 −10~10 −15~15 −20~20 0
5
10
15
20
25
30
35
40
45
LLR threshold range
Per
cent
age
(%)
Error − twinsError − non−twinReject − twinsReject − nontwin
Fig. 15.
−300 −200 −100 0 100 200 3000
0.1
0.2
0.3
0.4
0.5
0.6
0.7
0.8
0.9
1
LLR value
Pro
potio
n of
test
cas
es th
at e
xcee
d th
e LL
R v
alue
Same writer (Twins)Same writer (Non−twins)Different writer (Twins)Different writer (Non−twins)
Fig. 16.
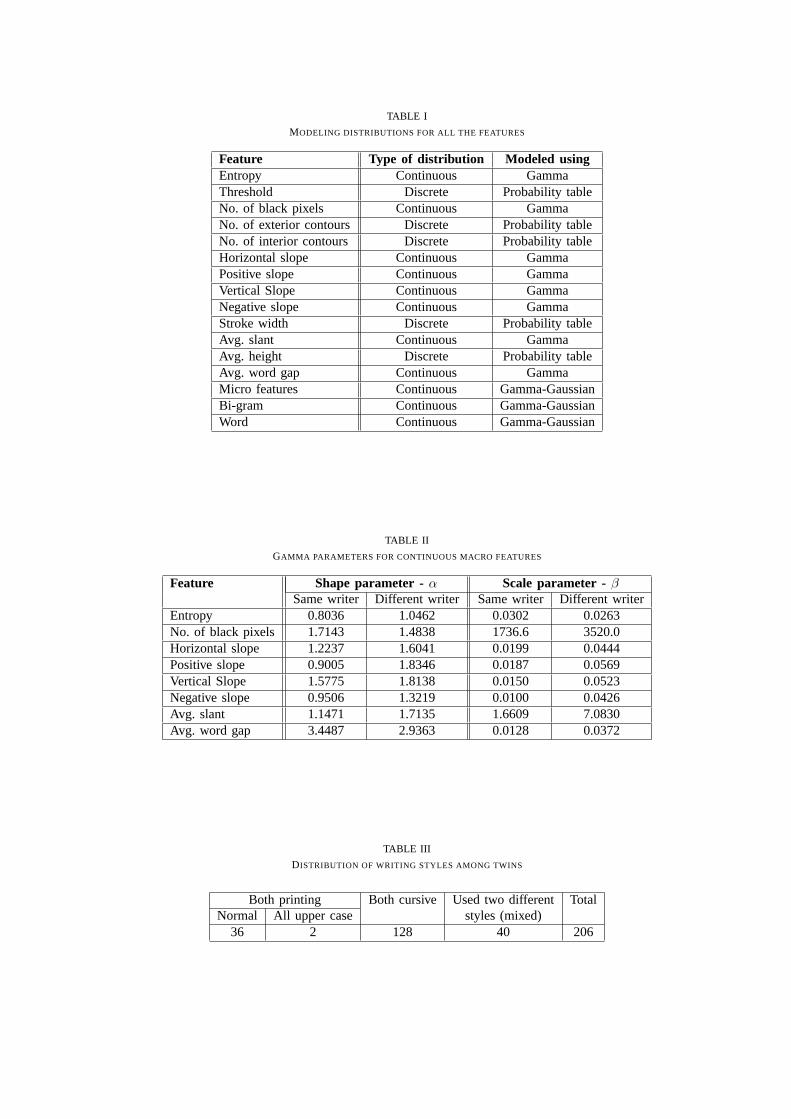
TABLE I
MODELING DISTRIBUTIONS FOR ALL THE FEATURES
Feature Type of distribution Modeled usingEntropy Continuous GammaThreshold Discrete Probability tableNo. of black pixels Continuous GammaNo. of exterior contours Discrete Probability tableNo. of interior contours Discrete Probability tableHorizontal slope Continuous GammaPositive slope Continuous GammaVertical Slope Continuous GammaNegative slope Continuous GammaStroke width Discrete Probability tableAvg. slant Continuous GammaAvg. height Discrete Probability tableAvg. word gap Continuous GammaMicro features Continuous Gamma-GaussianBi-gram Continuous Gamma-GaussianWord Continuous Gamma-Gaussian
TABLE II
GAMMA PARAMETERS FOR CONTINUOUS MACRO FEATURES
Feature Shape parameter - α Scale parameter - β
Same writer Different writer Same writer Different writerEntropy 0.8036 1.0462 0.0302 0.0263No. of black pixels 1.7143 1.4838 1736.6 3520.0Horizontal slope 1.2237 1.6041 0.0199 0.0444Positive slope 0.9005 1.8346 0.0187 0.0569Vertical Slope 1.5775 1.8138 0.0150 0.0523Negative slope 0.9506 1.3219 0.0100 0.0426Avg. slant 1.1471 1.7135 1.6609 7.0830Avg. word gap 3.4487 2.9363 0.0128 0.0372
TABLE III
DISTRIBUTION OF WRITING STYLES AMONG TWINS
Both printing Both cursive Used two different TotalNormal All upper case styles (mixed)
36 2 128 40 206

TABLE IV
THE SIMILARITY TABLE FOR TWO DOCUMENT SAMPLES: TWIN003A AND TWIN003B
Feature No. of comparisons Distance LLR valueThreshold N/A 1 0.49No. of exterior contours N/A 2 0.38No. of interior contours N/A 1 0.83Horizontal slope N/A 0.07 -1.43Positive slope N/A 0.06 -1.83Vertical Slope N/A 0.02 1.24Negative slope N/A 0.01 0.76Stroke width N/A 3 -5.11Avg. slant N/A 2.45 1.11Avg. height N/A 3 0.63Avg. word gap N/A 0.03 1.22Micro 10 N/A 2.68Bi-gram 0 N/A 0Word 9 N/A 6.17Total N/A N/A 7.15
TABLE V
THE SIMILARITY TABLE FOR TWO DOCUMENT SAMPLES: TWIN006A AND TWIN006B
Feature No. of comparisons Distance LLR valueThreshold N/A 0 1.44No. of exterior contours N/A 3 -0.09No. of interior contours N/A 8 -0.63Horizontal slope N/A 0.14 -3.63Positive slope N/A 0.1 -3.61Vertical Slope N/A 0.1 -3.14Negative slope N/A 0.15 -10.96Stroke width N/A 1 -0.41Avg. slant N/A 22.41 -9.35Avg. height N/A 10 -2.24Avg. word gap N/A 0.07 -0.14Micro 256 N/A -22.07Bi-gram 0 N/A 0Word 38 N/A -43.54Total N/A N/A -98.36
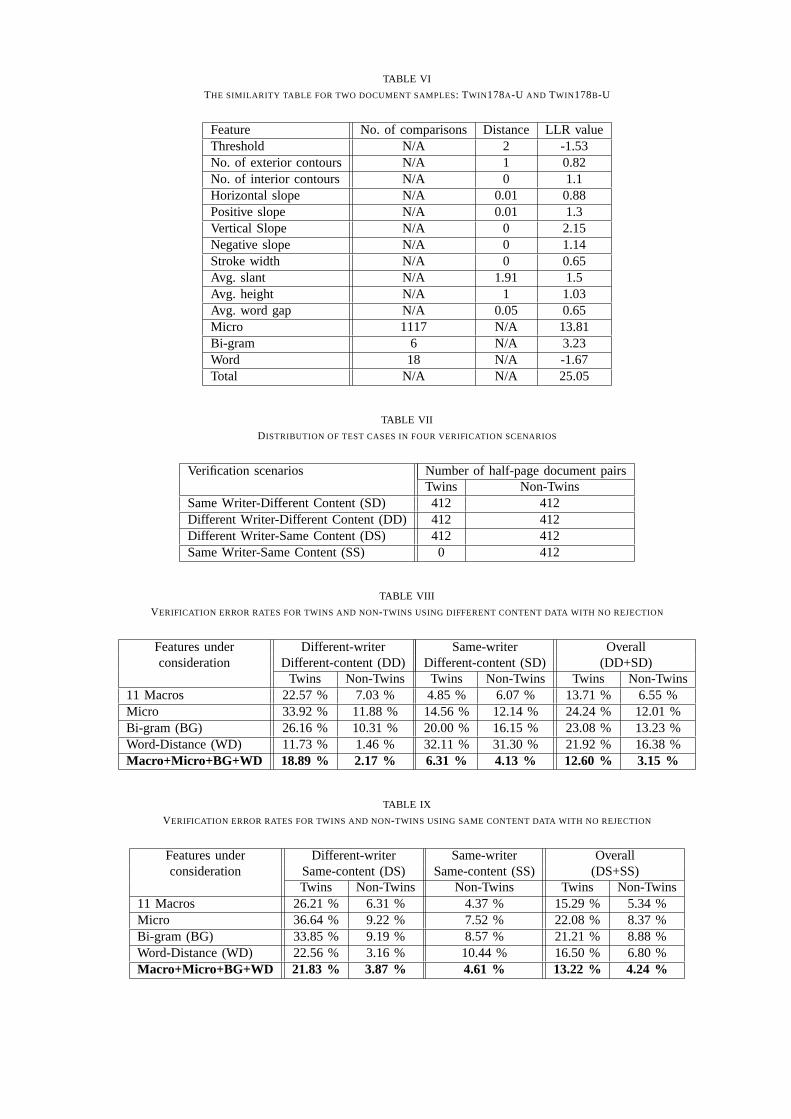
TABLE VI
THE SIMILARITY TABLE FOR TWO DOCUMENT SAMPLES: TWIN178A-U AND TWIN178B-U
Feature No. of comparisons Distance LLR valueThreshold N/A 2 -1.53No. of exterior contours N/A 1 0.82No. of interior contours N/A 0 1.1Horizontal slope N/A 0.01 0.88Positive slope N/A 0.01 1.3Vertical Slope N/A 0 2.15Negative slope N/A 0 1.14Stroke width N/A 0 0.65Avg. slant N/A 1.91 1.5Avg. height N/A 1 1.03Avg. word gap N/A 0.05 0.65Micro 1117 N/A 13.81Bi-gram 6 N/A 3.23Word 18 N/A -1.67Total N/A N/A 25.05
TABLE VII
DISTRIBUTION OF TEST CASES IN FOUR VERIFICATION SCENARIOS
Verification scenarios Number of half-page document pairsTwins Non-Twins
Same Writer-Different Content (SD) 412 412Different Writer-Different Content (DD) 412 412Different Writer-Same Content (DS) 412 412Same Writer-Same Content (SS) 0 412
TABLE VIII
VERIFICATION ERROR RATES FOR TWINS AND NON-TWINS USING DIFFERENT CONTENT DATA WITH NO REJECTION
Features under Different-writer Same-writer Overallconsideration Different-content (DD) Different-content (SD) (DD+SD)
Twins Non-Twins Twins Non-Twins Twins Non-Twins11 Macros 22.57 % 7.03 % 4.85 % 6.07 % 13.71 % 6.55 %Micro 33.92 % 11.88 % 14.56 % 12.14 % 24.24 % 12.01 %Bi-gram (BG) 26.16 % 10.31 % 20.00 % 16.15 % 23.08 % 13.23 %Word-Distance (WD) 11.73 % 1.46 % 32.11 % 31.30 % 21.92 % 16.38 %Macro+Micro+BG+WD 18.89 % 2.17 % 6.31 % 4.13 % 12.60 % 3.15 %
TABLE IX
VERIFICATION ERROR RATES FOR TWINS AND NON-TWINS USING SAME CONTENT DATA WITH NO REJECTION
Features under Different-writer Same-writer Overallconsideration Same-content (DS) Same-content (SS) (DS+SS)
Twins Non-Twins Non-Twins Twins Non-Twins11 Macros 26.21 % 6.31 % 4.37 % 15.29 % 5.34 %Micro 36.64 % 9.22 % 7.52 % 22.08 % 8.37 %Bi-gram (BG) 33.85 % 9.19 % 8.57 % 21.21 % 8.88 %Word-Distance (WD) 22.56 % 3.16 % 10.44 % 16.50 % 6.80 %Macro+Micro+BG+WD 21.83 % 3.87 % 4.61 % 13.22 % 4.24 %
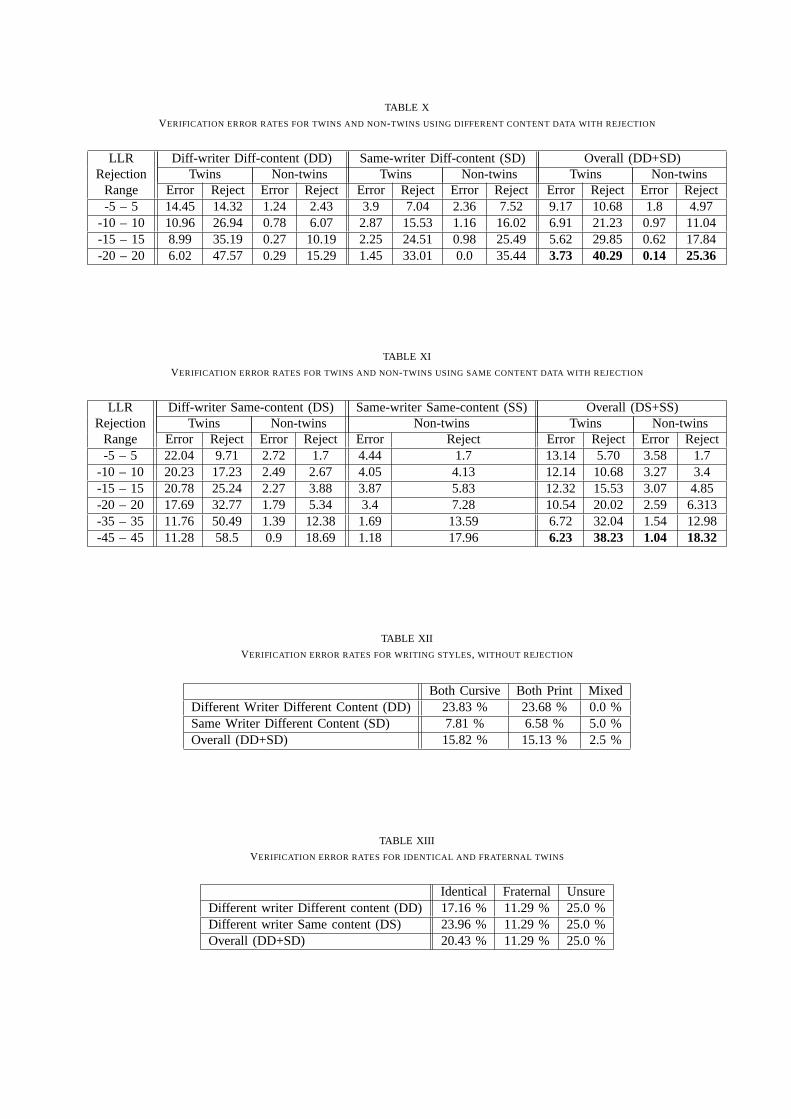
TABLE X
VERIFICATION ERROR RATES FOR TWINS AND NON-TWINS USING DIFFERENT CONTENT DATA WITH REJECTION
LLR Diff-writer Diff-content (DD) Same-writer Diff-content (SD) Overall (DD+SD)Rejection Twins Non-twins Twins Non-twins Twins Non-twins
Range Error Reject Error Reject Error Reject Error Reject Error Reject Error Reject-5 – 5 14.45 14.32 1.24 2.43 3.9 7.04 2.36 7.52 9.17 10.68 1.8 4.97
-10 – 10 10.96 26.94 0.78 6.07 2.87 15.53 1.16 16.02 6.91 21.23 0.97 11.04-15 – 15 8.99 35.19 0.27 10.19 2.25 24.51 0.98 25.49 5.62 29.85 0.62 17.84-20 – 20 6.02 47.57 0.29 15.29 1.45 33.01 0.0 35.44 3.73 40.29 0.14 25.36
TABLE XI
VERIFICATION ERROR RATES FOR TWINS AND NON-TWINS USING SAME CONTENT DATA WITH REJECTION
LLR Diff-writer Same-content (DS) Same-writer Same-content (SS) Overall (DS+SS)Rejection Twins Non-twins Non-twins Twins Non-twins
Range Error Reject Error Reject Error Reject Error Reject Error Reject-5 – 5 22.04 9.71 2.72 1.7 4.44 1.7 13.14 5.70 3.58 1.7
-10 – 10 20.23 17.23 2.49 2.67 4.05 4.13 12.14 10.68 3.27 3.4-15 – 15 20.78 25.24 2.27 3.88 3.87 5.83 12.32 15.53 3.07 4.85-20 – 20 17.69 32.77 1.79 5.34 3.4 7.28 10.54 20.02 2.59 6.313-35 – 35 11.76 50.49 1.39 12.38 1.69 13.59 6.72 32.04 1.54 12.98-45 – 45 11.28 58.5 0.9 18.69 1.18 17.96 6.23 38.23 1.04 18.32
TABLE XII
VERIFICATION ERROR RATES FOR WRITING STYLES, WITHOUT REJECTION
Both Cursive Both Print MixedDifferent Writer Different Content (DD) 23.83 % 23.68 % 0.0 %Same Writer Different Content (SD) 7.81 % 6.58 % 5.0 %Overall (DD+SD) 15.82 % 15.13 % 2.5 %
TABLE XIII
VERIFICATION ERROR RATES FOR IDENTICAL AND FRATERNAL TWINS
Identical Fraternal UnsureDifferent writer Different content (DD) 17.16 % 11.29 % 25.0 %Different writer Same content (DS) 23.96 % 11.29 % 25.0 %Overall (DD+SD) 20.43 % 11.29 % 25.0 %
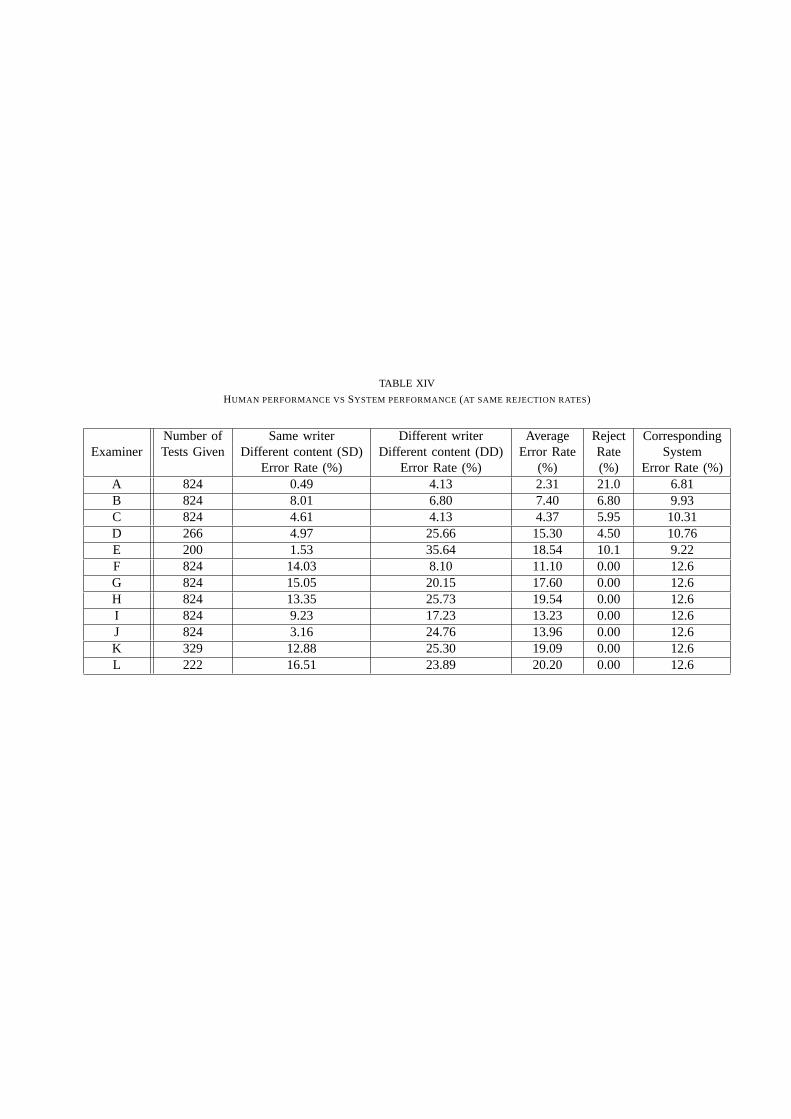
TABLE XIV
HUMAN PERFORMANCE VSSYSTEM PERFORMANCE(AT SAME REJECTION RATES)
Number of Same writer Different writer Average Reject CorrespondingExaminer Tests Given Different content (SD) Different content (DD) Error Rate Rate System
Error Rate (%) Error Rate (%) (%) (%) Error Rate (%)A 824 0.49 4.13 2.31 21.0 6.81B 824 8.01 6.80 7.40 6.80 9.93C 824 4.61 4.13 4.37 5.95 10.31D 266 4.97 25.66 15.30 4.50 10.76E 200 1.53 35.64 18.54 10.1 9.22F 824 14.03 8.10 11.10 0.00 12.6G 824 15.05 20.15 17.60 0.00 12.6H 824 13.35 25.73 19.54 0.00 12.6I 824 9.23 17.23 13.23 0.00 12.6J 824 3.16 24.76 13.96 0.00 12.6K 329 12.88 25.30 19.09 0.00 12.6L 222 16.51 23.89 20.20 0.00 12.6