Embed Size (px)
Citation preview

2
3
0
100
200
300
400
500
600
700
'94 '96 '98 '00 '02 '04 '06 '08 '10 '12 '14 '16 '18
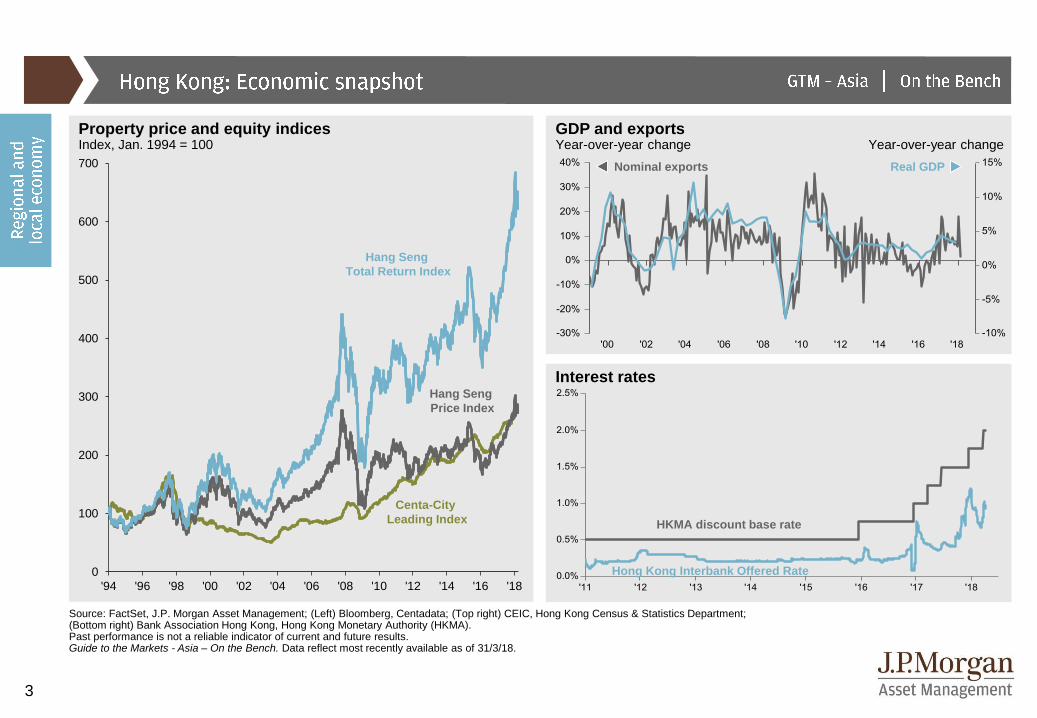
Property price and equity indicesIndex, Jan. 1994 = 100
GDP and exportsYear-over-year change Year-over-year change
Interest rates
Source: FactSet, J.P. Morgan Asset Management; (Left) Bloomberg, Centadata; (Top right) CEIC, Hong Kong Census & Statistics Department; (Bottom right) Bank Association Hong Kong, Hong Kong Monetary Authority (HKMA).Past performance is not a reliable indicator of current and future results. Guide to the Markets - Asia – On the Bench. Data reflect most recently available as of 31/3/18.
Hang Seng
Price Index
Centa-City
Leading Index
Hang Seng
Total Return Index
Real GDP Nominal exports
Hong Kong Interbank Offered Rate
HKMA discount base rate
4
0
20
40
60
80
100
1,700
1,800
1,900
2,000
2,100
2,200
2,300
2,400
2,500
2,600
'12 '13 '14 '15 '16 '17 '18
Real GDP
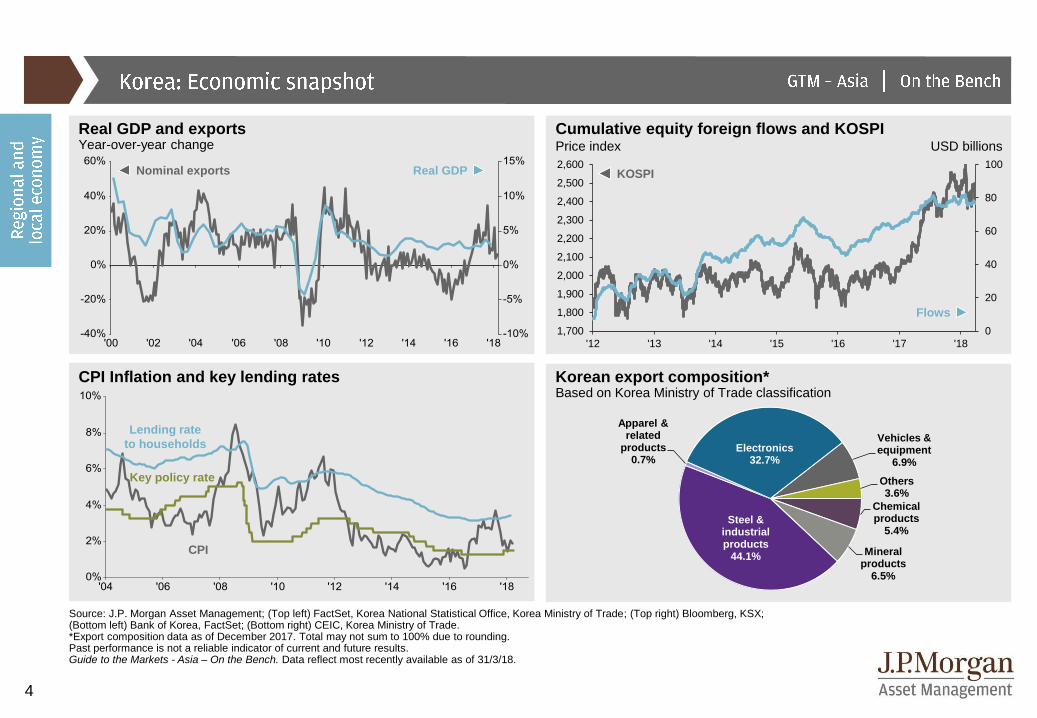
Cumulative equity foreign flows and KOSPIPrice index USD billions
Real GDP and exportsYear-over-year change
CPI Inflation and key lending rates Korean export composition*Based on Korea Ministry of Trade classification
Source: J.P. Morgan Asset Management; (Top left) FactSet, Korea National Statistical Office, Korea Ministry of Trade; (Top right) Bloomberg, KSX; (Bottom left) Bank of Korea, FactSet; (Bottom right) CEIC, Korea Ministry of Trade. *Export composition data as of December 2017. Total may not sum to 100% due to rounding. Past performance is not a reliable indicator of current and future results. Guide to the Markets - Asia – On the Bench. Data reflect most recently available as of 31/3/18.
Key policy rate
CPI
Lending rate
to households
Nominal exports
Flows
KOSPI
Chemical products
5.4%
Mineral products
6.5%
Steel & industrial products
44.1%
Apparel & related
products0.7%
Electronics32.7%
Vehicles & equipment
6.9%
Others3.6%
5
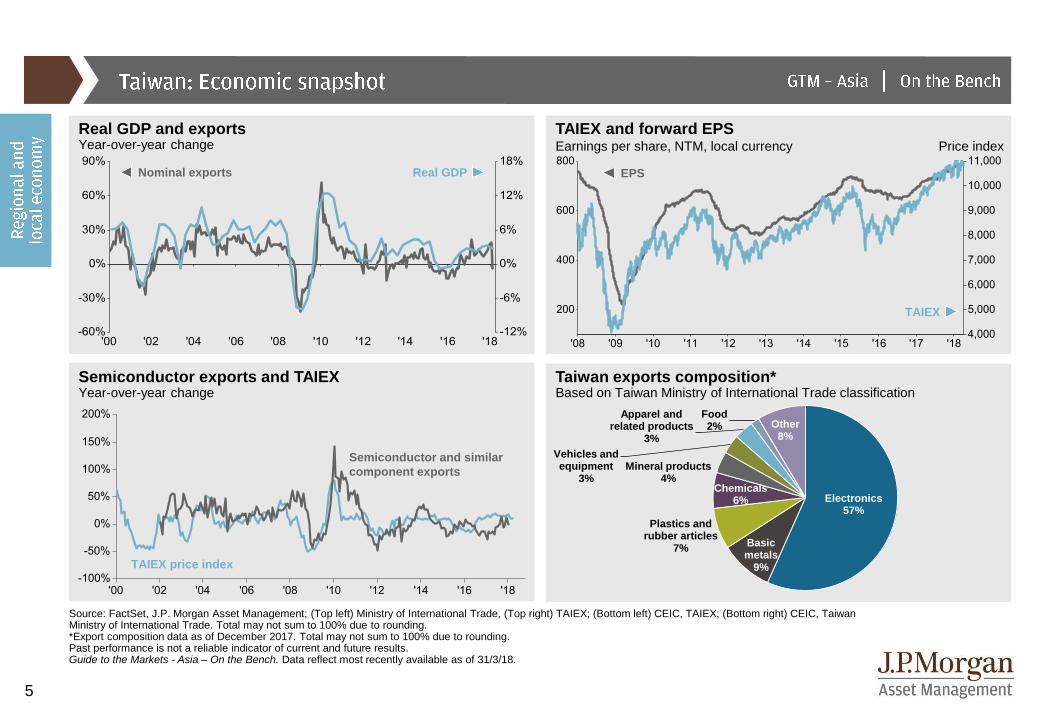
TAIEX and forward EPSEarnings per share, NTM, local currency Price index
Real GDP and exportsYear-over-year change
Semiconductor exports and TAIEXYear-over-year change
Taiwan exports composition*Based on Taiwan Ministry of International Trade classification
Source: FactSet, J.P. Morgan Asset Management; (Top left) Ministry of International Trade, (Top right) TAIEX; (Bottom left) CEIC, TAIEX; (Bottom right) CEIC, Taiwan Ministry of International Trade. Total may not sum to 100% due to rounding. *Export composition data as of December 2017. Total may not sum to 100% due to rounding.Past performance is not a reliable indicator of current and future results. Guide to the Markets - Asia – On the Bench. Data reflect most recently available as of 31/3/18.
Real GDP Nominal exports
TAIEX
EPS
TAIEX price index
Semiconductor and similar
component exports
Electronics57%
Basic metals
9%
Plastics and rubber articles
7%
Chemicals6%
Mineral products4%
Vehicles and equipment
3%
Apparel and related products
3%
Food2% Other
8%
6
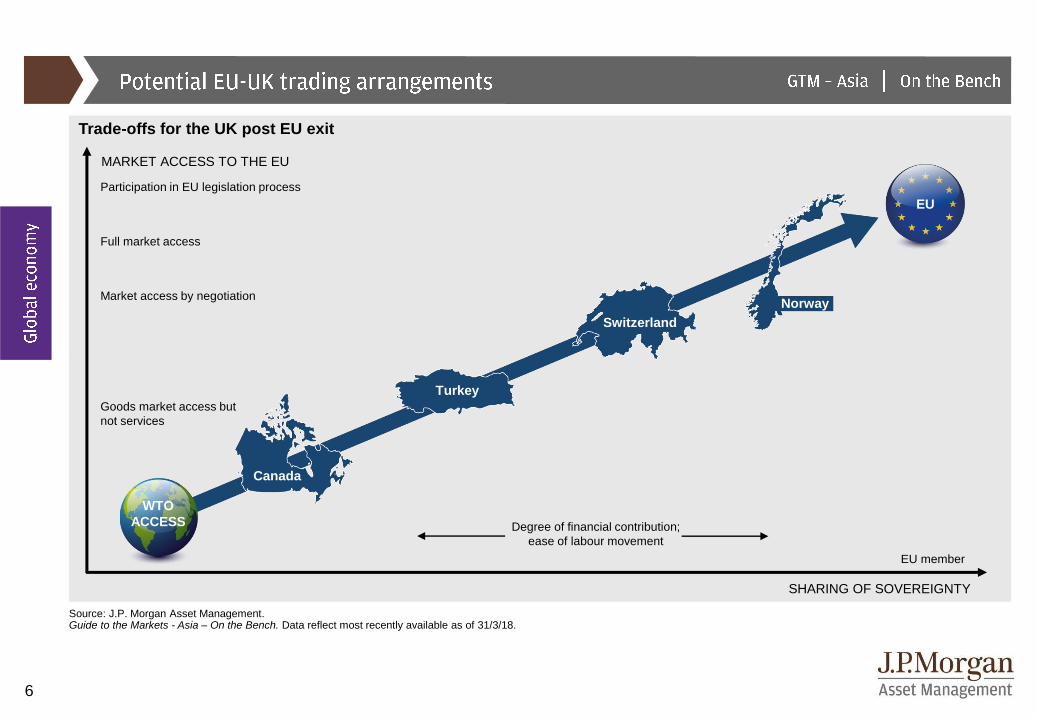
Trade-offs for the UK post EU exit
MARKET ACCESS TO THE EU
Participation in EU legislation process
Full market access
Market access by negotiation
Goods market access but
not services
Degree of financial contribution;
ease of labour movement
EU member
Source: J.P. Morgan Asset Management.Guide to the Markets - Asia – On the Bench. Data reflect most recently available as of 31/3/18.
SHARING OF SOVEREIGNTY
WTO
ACCESS
Canada
Turkey
Switzerland
Norway
EU
7
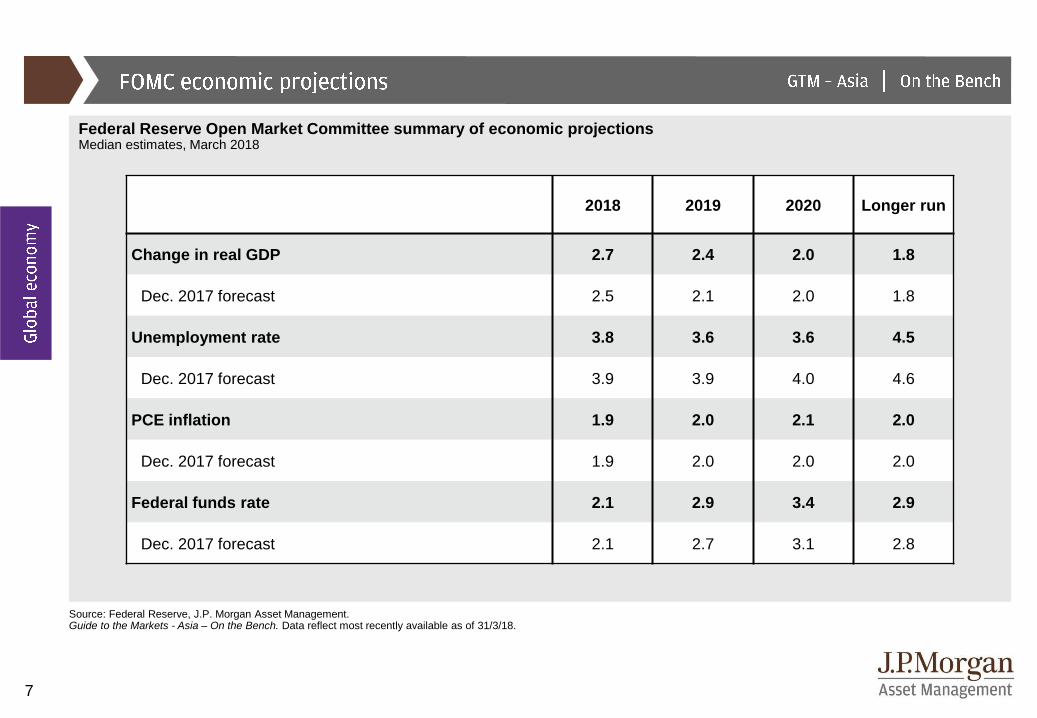
Federal Reserve Open Market Committee summary of economic projectionsMedian estimates, March 2018
Source: Federal Reserve, J.P. Morgan Asset Management.Guide to the Markets - Asia – On the Bench. Data reflect most recently available as of 31/3/18.
2018 2019 2020 Longer run
Change in real GDP 2.7 2.4 2.0 1.8
Dec. 2017 forecast 2.5 2.1 2.0 1.8
Unemployment rate 3.8 3.6 3.6 4.5
Dec. 2017 forecast 3.9 3.9 4.0 4.6
PCE inflation 1.9 2.0 2.1 2.0
Dec. 2017 forecast 1.9 2.0 2.0 2.0
Federal funds rate 2.1 2.9 3.4 2.9
Dec. 2017 forecast 2.1 2.7 3.1 2.8
8
50%
80%
110%
140%
170%
200%
230%
'00 '02 '04 '06 '08 '10 '12 '14 '16
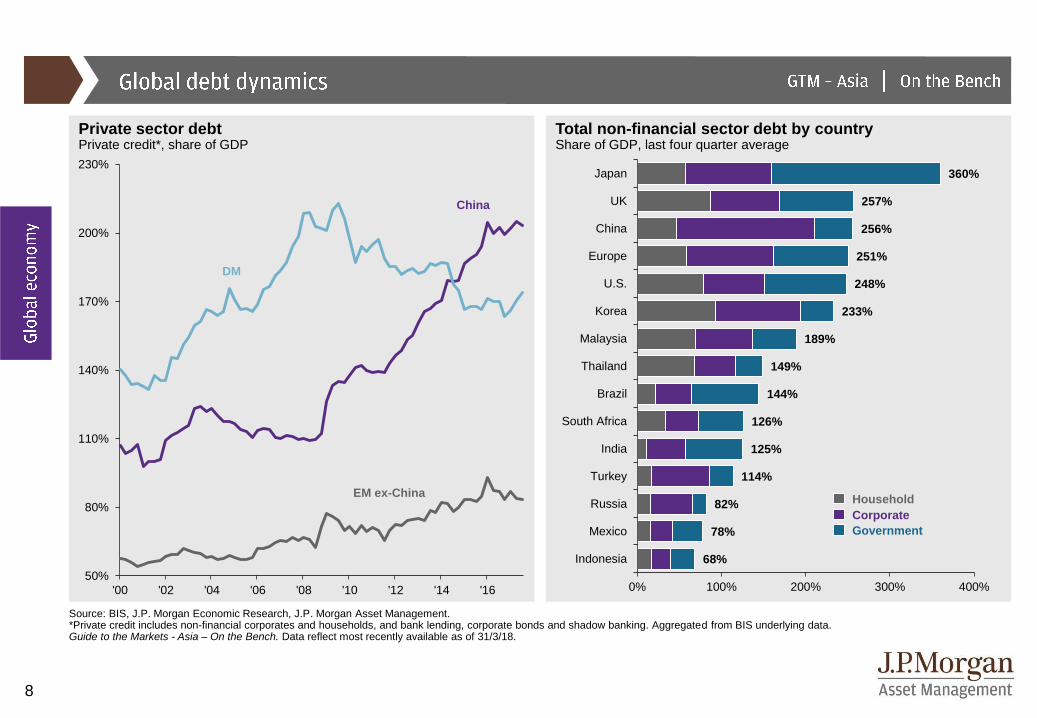
Private sector debtPrivate credit*, share of GDP
Total non-financial sector debt by countryShare of GDP, last four quarter average
Source: BIS, J.P. Morgan Economic Research, J.P. Morgan Asset Management.*Private credit includes non-financial corporates and households, and bank lending, corporate bonds and shadow banking. Aggregated from BIS underlying data.Guide to the Markets - Asia – On the Bench. Data reflect most recently available as of 31/3/18.
DM
China
EM ex-ChinaHousehold
Corporate
Government
68%
78%
82%
114%
125%
126%
144%
149%
189%
233%
248%
251%
256%
257%
360%
0% 100% 200% 300% 400%
Indonesia
Mexico
Russia
Turkey
India
South Africa
Brazil
Thailand
Malaysia
Korea
U.S.
Europe
China
UK
Japan
9
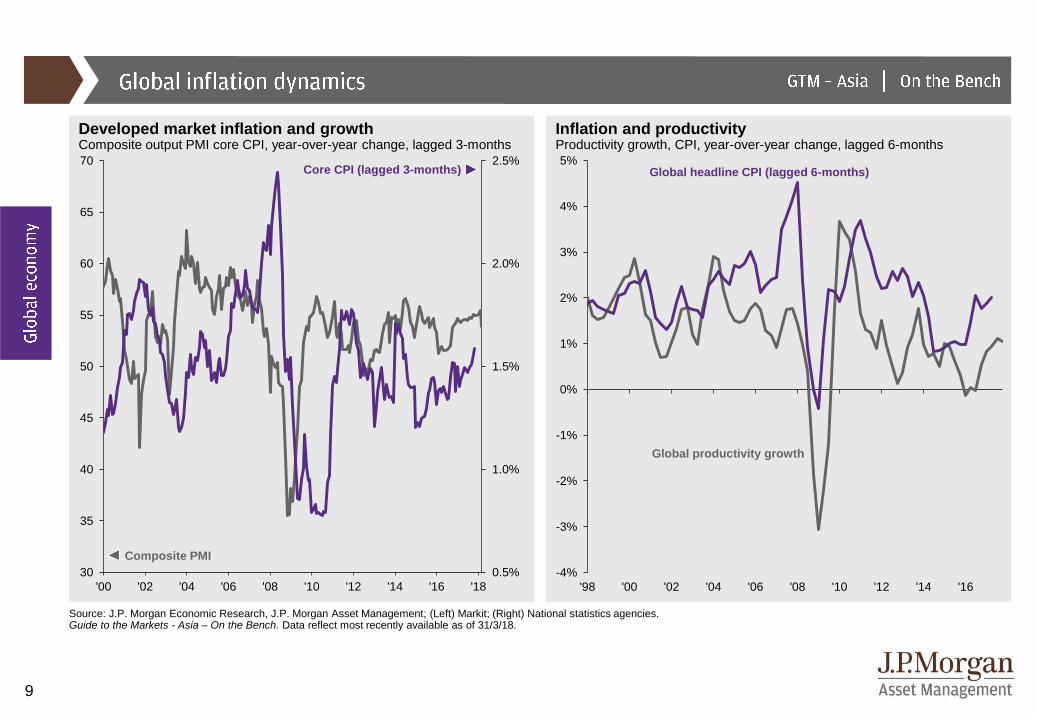
Developed market inflation and growthComposite output PMI core CPI, year-over-year change, lagged 3-months
Inflation and productivityProductivity growth, CPI, year-over-year change, lagged 6-months
Source: J.P. Morgan Economic Research, J.P. Morgan Asset Management; (Left) Markit; (Right) National statistics agencies. Guide to the Markets - Asia – On the Bench. Data reflect most recently available as of 31/3/18.
Composite PMI
Core CPI (lagged 3-months)
Global productivity growth
Global headline CPI (lagged 6-months)
0.5%
1.0%
1.5%
2.0%
2.5%
30
35
40
45
50
55
60
65
70
'00 '02 '04 '06 '08 '10 '12 '14 '16 '18
-4%
-3%
-2%
-1%
0%
1%
2%
3%
4%
5%
'98 '00 '02 '04 '06 '08 '10 '12 '14 '16
10
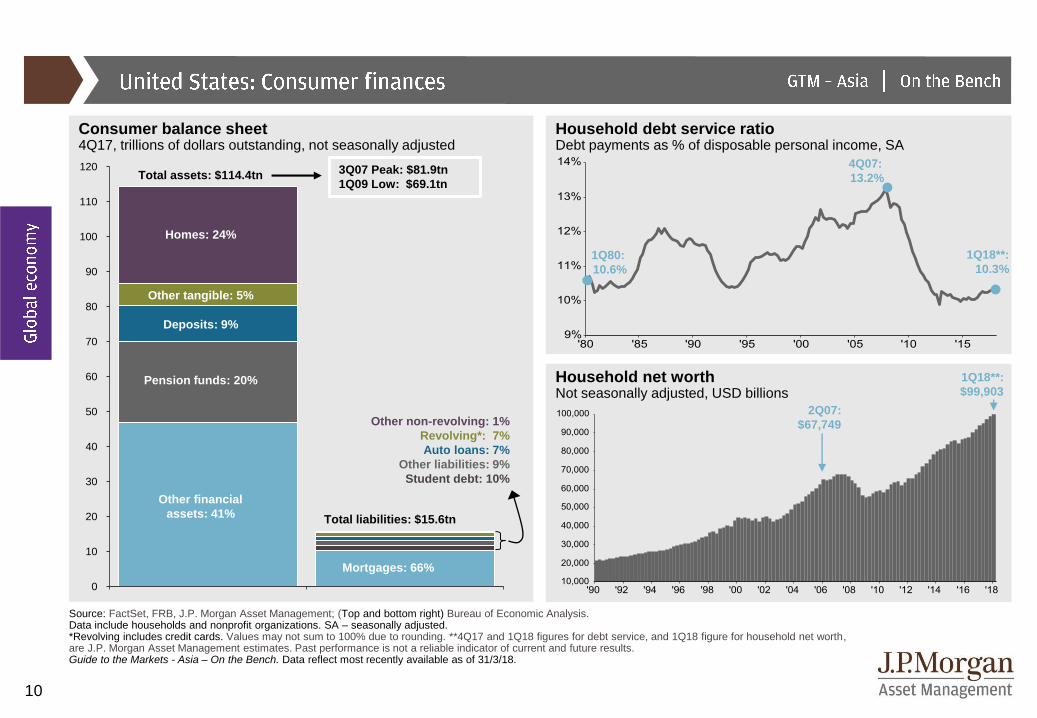
Consumer balance sheet4Q17, trillions of dollars outstanding, not seasonally adjusted
Household debt service ratioDebt payments as % of disposable personal income, SA
Household net worthNot seasonally adjusted, USD billions
Source: FactSet, FRB, J.P. Morgan Asset Management; (Top and bottom right) Bureau of Economic Analysis. Data include households and nonprofit organizations. SA – seasonally adjusted. *Revolving includes credit cards. Values may not sum to 100% due to rounding. **4Q17 and 1Q18 figures for debt service, and 1Q18 figure for household net worth, are J.P. Morgan Asset Management estimates. Past performance is not a reliable indicator of current and future results.Guide to the Markets - Asia – On the Bench. Data reflect most recently available as of 31/3/18.
0
10
20
30
40
50
60
70
80
90
100
110
120Total assets: $114.4tn
Total liabilities: $15.6tn
Homes: 24%
Deposits: 9%
Pension funds: 20%
Other financial
assets: 41%
Other tangible: 5%
Mortgages: 66%
Other non-revolving: 1%
Revolving*: 7%
Auto loans: 7%
Other liabilities: 9%
Student debt: 10%
3Q07 Peak: $81.9tn
1Q09 Low: $69.1tn
4Q07:
13.2%
1Q80:
10.6%
1Q18**:
10.3%
2Q07:
$67,749
1Q18**:
$99,903
11
40%
50%
60%
70%
80%
90%
100%
110%
'00 '02 '04 '06 '08 '10 '12 '14 '16
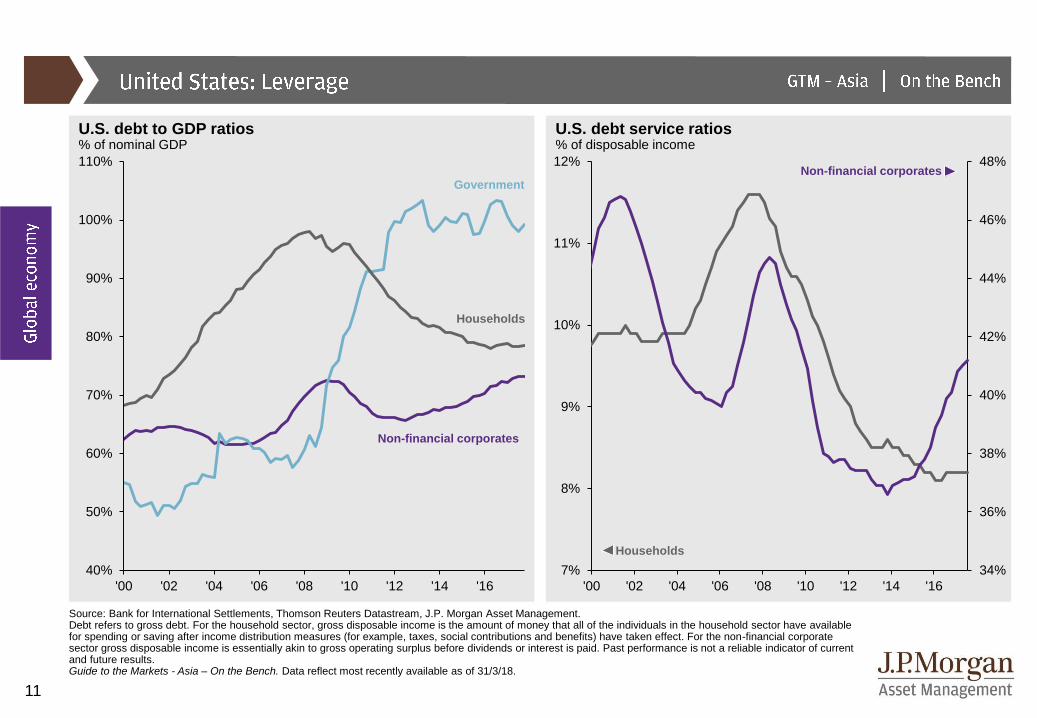
U.S. debt to GDP ratios% of nominal GDP
U.S. debt service ratios% of disposable income
Source: Bank for International Settlements, Thomson Reuters Datastream, J.P. Morgan Asset Management. Debt refers to gross debt. For the household sector, gross disposable income is the amount of money that all of the individuals in the household sector have available for spending or saving after income distribution measures (for example, taxes, social contributions and benefits) have taken effect. For the non-financial corporate sector gross disposable income is essentially akin to gross operating surplus before dividends or interest is paid. Past performance is not a reliable indicator of currentand future results.Guide to the Markets - Asia – On the Bench. Data reflect most recently available as of 31/3/18.
Households
Non-financial corporates
Households
Non-financial corporates
Government
34%
36%
38%
40%
42%
44%
46%
48%
7%
8%
9%
10%
11%
12%
'00 '02 '04 '06 '08 '10 '12 '14 '16
12
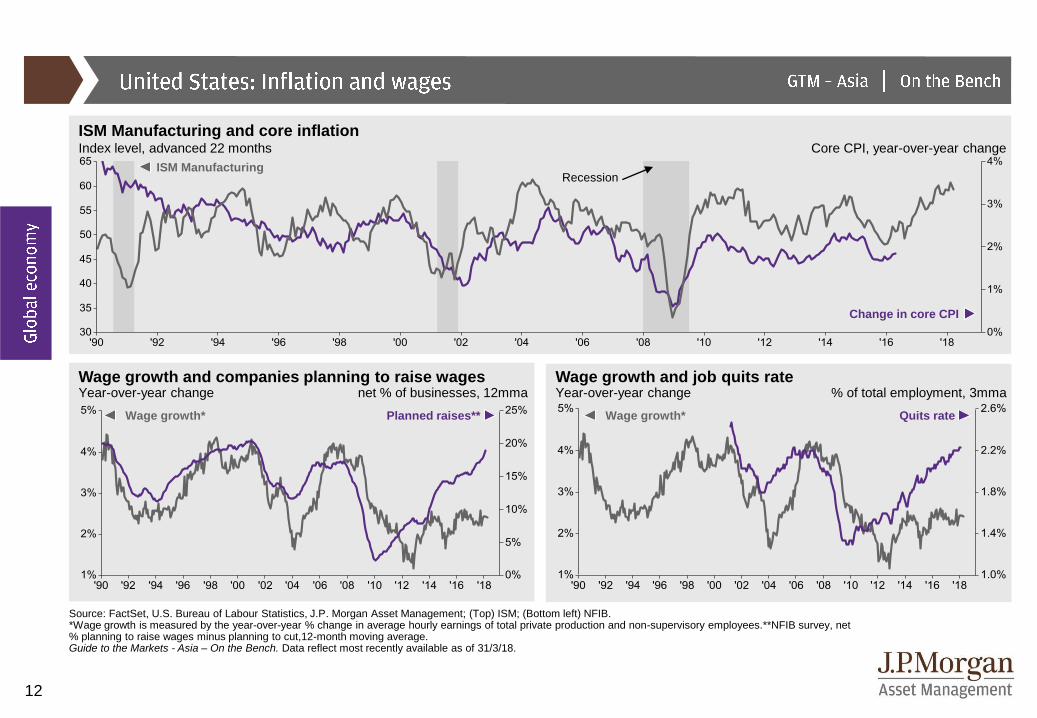
Wage growth and companies planning to raise wagesYear-over-year change net % of businesses, 12mma
Wage growth and job quits rateYear-over-year change % of total employment, 3mma
ISM Manufacturing and core inflationIndex level, advanced 22 months Core CPI, year-over-year change
Source: FactSet, U.S. Bureau of Labour Statistics, J.P. Morgan Asset Management; (Top) ISM; (Bottom left) NFIB. *Wage growth is measured by the year-over-year % change in average hourly earnings of total private production and non-supervisory employees.**NFIB survey, net % planning to raise wages minus planning to cut,12-month moving average. Guide to the Markets - Asia – On the Bench. Data reflect most recently available as of 31/3/18.
RecessionISM Manufacturing
Change in core CPI
Wage growth* Planned raises** Wage growth* Quits rate
13
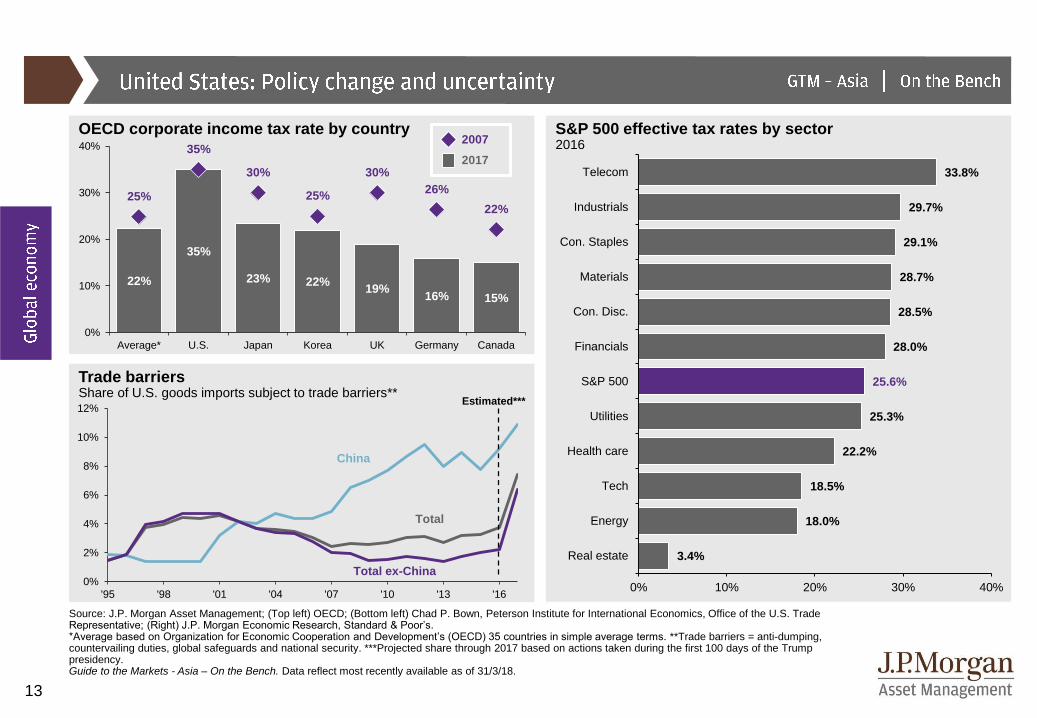
22%
35%
23% 22%19%
16% 15%
25%
35%
30%
25%
30%
26%
22%
0%
10%
20%
30%
40%
Average* U.S. Japan Korea UK Germany Canada
Source: J.P. Morgan Asset Management; (Top left) OECD; (Bottom left) Chad P. Bown, Peterson Institute for International Economics, Office of the U.S. Trade Representative; (Right) J.P. Morgan Economic Research, Standard & Poor’s. *Average based on Organization for Economic Cooperation and Development’s (OECD) 35 countries in simple average terms. **Trade barriers = anti-dumping, countervailing duties, global safeguards and national security. ***Projected share through 2017 based on actions taken during the first 100 days of the Trump presidency.Guide to the Markets - Asia – On the Bench. Data reflect most recently available as of 31/3/18.
S&P 500 effective tax rates by sector2016
Trade barriersShare of U.S. goods imports subject to trade barriers**
OECD corporate income tax rate by country2007
2017
0%
2%
4%
6%
8%
10%
12%
'95 '98 '01 '04 '07 '10 '13 '16
China
Total
Total ex-China
Estimated***
3.4%
18.0%
18.5%
22.2%
25.3%
25.6%
28.0%
28.5%
28.7%
29.1%
29.7%
33.8%
0% 10% 20% 30% 40%
Real estate
Energy
Tech
Health care
Utilities
S&P 500
Financials
Con. Disc.
Materials
Con. Staples
Industrials
Telecom
14
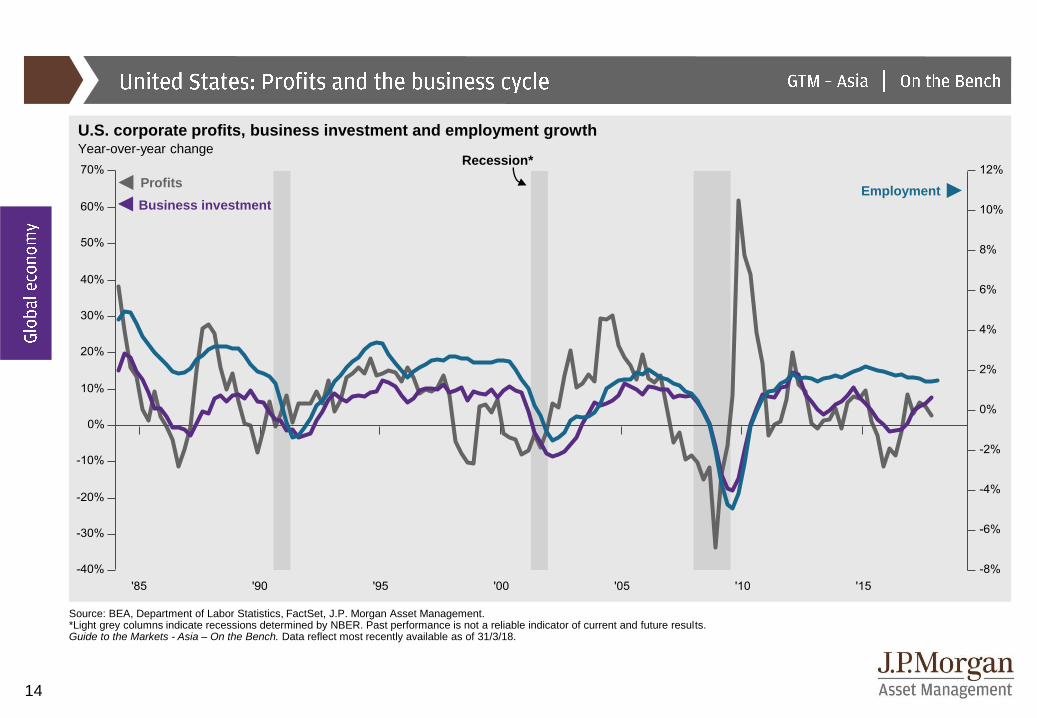
Source: BEA, Department of Labor Statistics, FactSet, J.P. Morgan Asset Management. *Light grey columns indicate recessions determined by NBER. Past performance is not a reliable indicator of current and future results.Guide to the Markets - Asia – On the Bench. Data reflect most recently available as of 31/3/18.
Business investment
U.S. corporate profits, business investment and employment growthYear-over-year change
ProfitsEmployment
Recession*
15
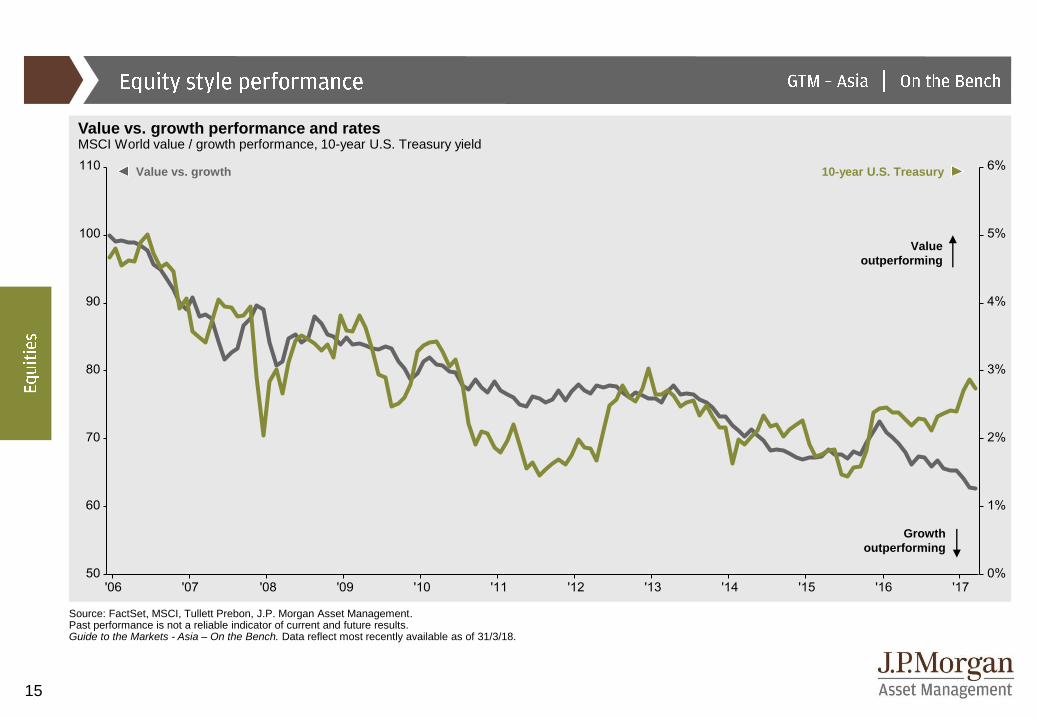
Source: FactSet, MSCI, Tullett Prebon, J.P. Morgan Asset Management.Past performance is not a reliable indicator of current and future results. Guide to the Markets - Asia – On the Bench. Data reflect most recently available as of 31/3/18.
Value vs. growth performance and ratesMSCI World value / growth performance, 10-year U.S. Treasury yield
Growth
outperforming
Value
outperforming
10-year U.S. TreasuryValue vs. growth
16
-0.8
-0.6
-0.4
-0.2
0.0
0.2
0.4
0.6
0.8
1.0
'08 '09 '10 '11 '12 '13 '14 '15 '16 '17
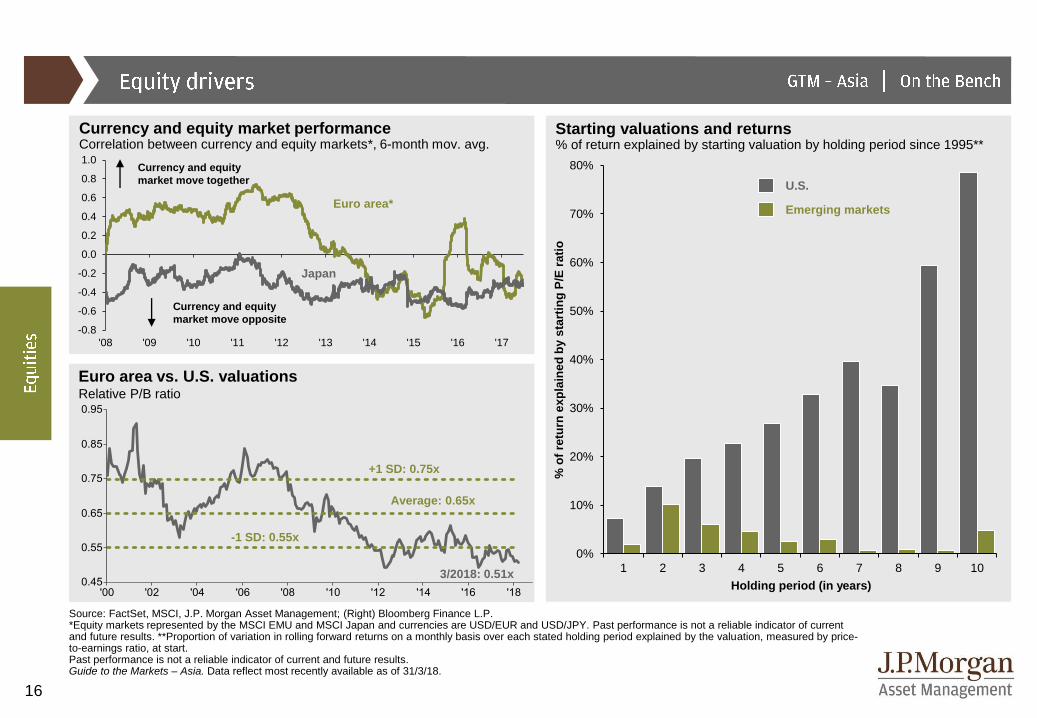
Source: FactSet, MSCI, J.P. Morgan Asset Management; (Right) Bloomberg Finance L.P.*Equity markets represented by the MSCI EMU and MSCI Japan and currencies are USD/EUR and USD/JPY. Past performance is not a reliable indicator of current and future results. **Proportion of variation in rolling forward returns on a monthly basis over each stated holding period explained by the valuation, measured by price-to-earnings ratio, at start. Past performance is not a reliable indicator of current and future results. Guide to the Markets – Asia. Data reflect most recently available as of 31/3/18.
Starting valuations and returns% of return explained by starting valuation by holding period since 1995**
U.S.
Emerging markets
Euro area vs. U.S. valuationsRelative P/B ratio
+1 SD: 0.75x
-1 SD: 0.55x
Average: 0.65x
3/2018: 0.51x
Currency and equity
market move together
Currency and equity
market move opposite
Euro area*
Japan
Currency and equity market performanceCorrelation between currency and equity markets*, 6-month mov. avg.
0%
10%
20%
30%
40%
50%
60%
70%
80%
1 2 3 4 5 6 7 8 9 10%
of
retu
rn e
xp
lain
ed
by s
tart
ing
P/E
rati
o
Holding period (in years)
17
-0.3
-0.2
-0.1
0.0
0.1
0.2
0.3
'15 '16 '17
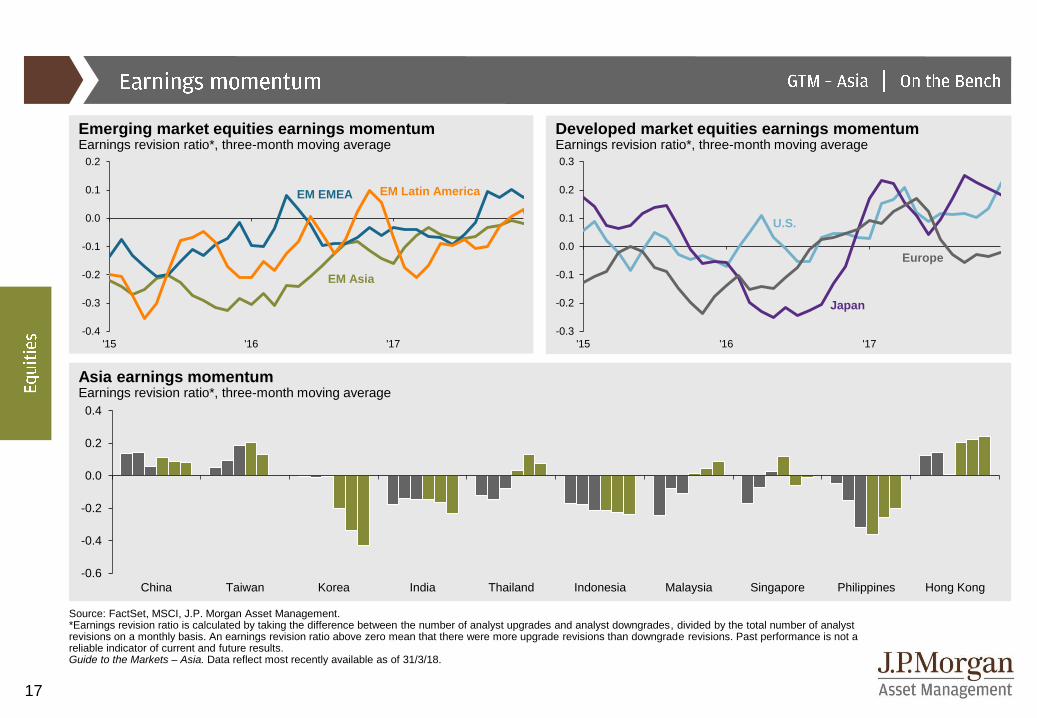
Source: FactSet, MSCI, J.P. Morgan Asset Management.*Earnings revision ratio is calculated by taking the difference between the number of analyst upgrades and analyst downgrades, divided by the total number of analyst revisions on a monthly basis. An earnings revision ratio above zero mean that there were more upgrade revisions than downgrade revisions. Past performance is not a reliable indicator of current and future results.Guide to the Markets – Asia. Data reflect most recently available as of 31/3/18.
Asia earnings momentumEarnings revision ratio*, three-month moving average
Emerging market equities earnings momentumEarnings revision ratio*, three-month moving average
Developed market equities earnings momentumEarnings revision ratio*, three-month moving average
Japan
U.S.
Europe
EM Asia
EM EMEA EM Latin America
-0.4
-0.3
-0.2
-0.1
0.0
0.1
0.2
'15 '16 '17
-0.6
-0.4
-0.2
0.0
0.2
0.4
China Taiwan Korea India Thailand Indonesia Malaysia Singapore Philippines Hong Kong
18
-50%
0%
50%
100%
150%
200%
250%
'89 '91 '93 '95 '97 '99 '01 '03 '05 '07 '09 '11 '13 '15 '17
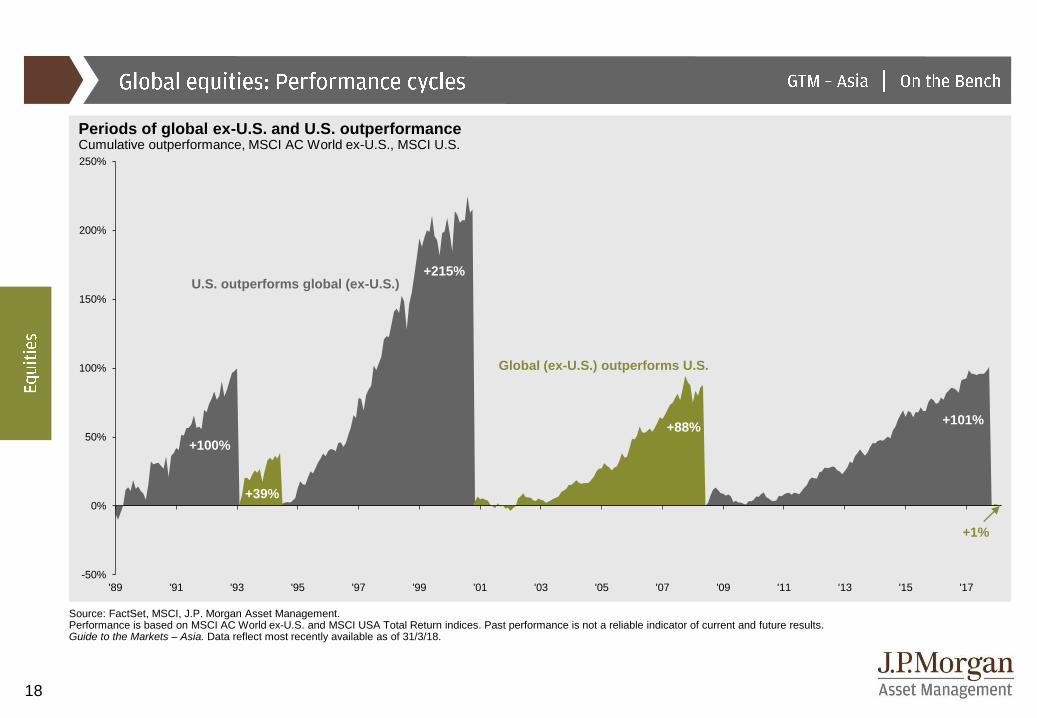
Source: FactSet, MSCI, J.P. Morgan Asset Management.Performance is based on MSCI AC World ex-U.S. and MSCI USA Total Return indices. Past performance is not a reliable indicator of current and future results.Guide to the Markets – Asia. Data reflect most recently available as of 31/3/18.
Periods of global ex-U.S. and U.S. outperformanceCumulative outperformance, MSCI AC World ex-U.S., MSCI U.S.
+100%
+215%
+39%
U.S. outperforms global (ex-U.S.)
+101%+88%
Global (ex-U.S.) outperforms U.S.
+1%
19
35
40
45
50
55
60
65
600
800
1,000
1,200
1,400
1,600
1,800
'99 '01 '03 '05 '07 '09 '11 '13 '15 '17
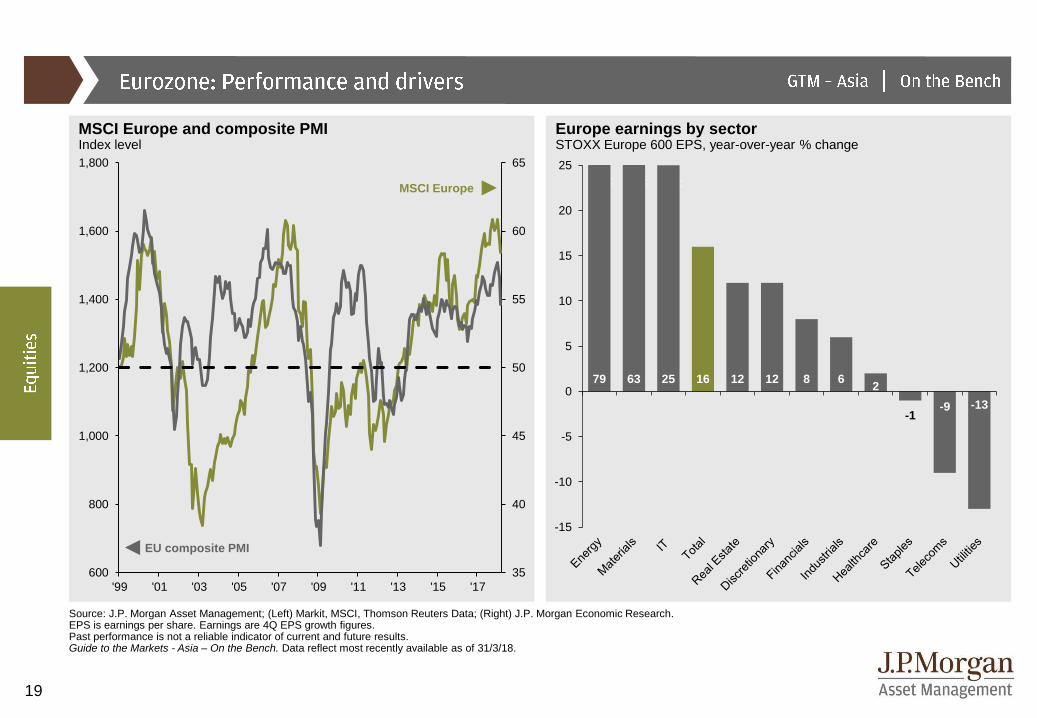
Source: J.P. Morgan Asset Management; (Left) Markit, MSCI, Thomson Reuters Data; (Right) J.P. Morgan Economic Research.EPS is earnings per share. Earnings are 4Q EPS growth figures.Past performance is not a reliable indicator of current and future results. Guide to the Markets - Asia – On the Bench. Data reflect most recently available as of 31/3/18.
Europe earnings by sectorSTOXX Europe 600 EPS, year-over-year % change
MSCI Europe and composite PMIIndex level
EU composite PMI
MSCI Europe
79 63 25 16 12 12 8 62
-1-9 -13
-15
-10
-5
0
5
10
15
20
25
20
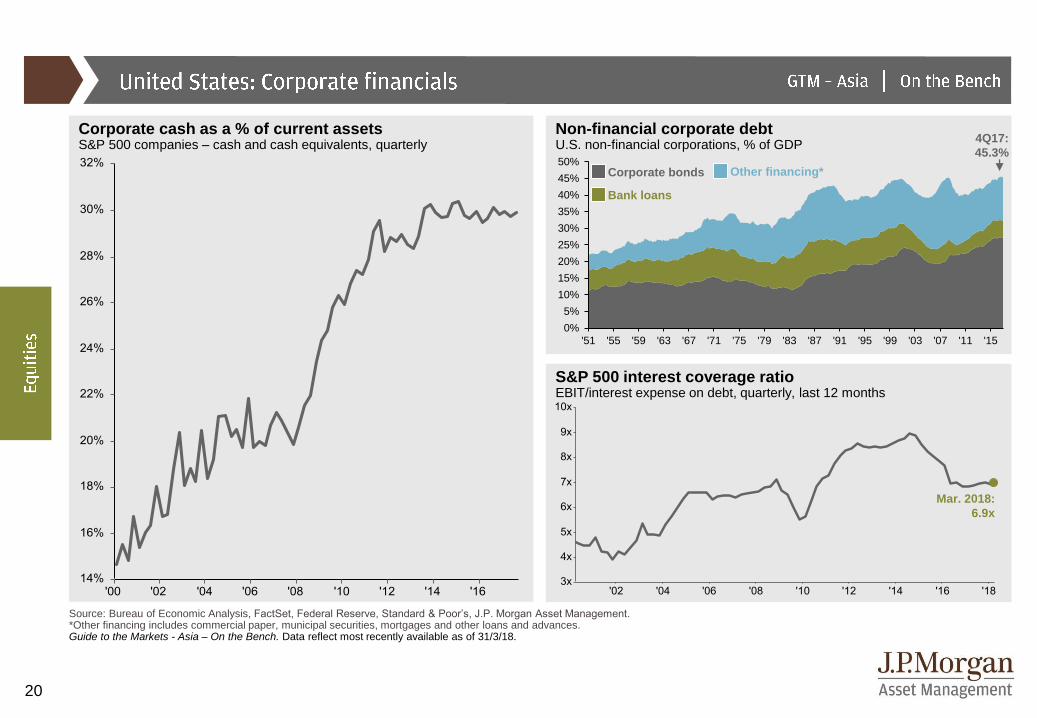
Non-financial corporate debtU.S. non-financial corporations, % of GDP
Source: Bureau of Economic Analysis, FactSet, Federal Reserve, Standard & Poor’s, J.P. Morgan Asset Management.*Other financing includes commercial paper, municipal securities, mortgages and other loans and advances.Guide to the Markets - Asia – On the Bench. Data reflect most recently available as of 31/3/18.
Corporate cash as a % of current assetsS&P 500 companies – cash and cash equivalents, quarterly
S&P 500 interest coverage ratioEBIT/interest expense on debt, quarterly, last 12 months
Mar. 2018:
6.9x
0%
5%
10%
15%
20%
25%
30%
35%
40%
45%
50%
'51 '55 '59 '63 '67 '71 '75 '79 '83 '87 '91 '95 '99 '03 '07 '11 '15
4Q17:
45.3%
Bank loans
Corporate bonds Other financing*
21
100
200
300
400
500
600
700
'97 '98 '99 '00 '01 '02 '03 '04 '05 '06 '07 '08 '09 '10 '11 '12 '13 '14 '15 '16 '17 '18
Source: FactSet, MSCI, Bloomberg, J.P. Morgan Asset Management.Positive yield does not imply positive return. Past performance is not a reliable indicator of current and future results. Guide to the Markets - Asia – On the Bench. Data reflect most recently available as of 31/3/18.
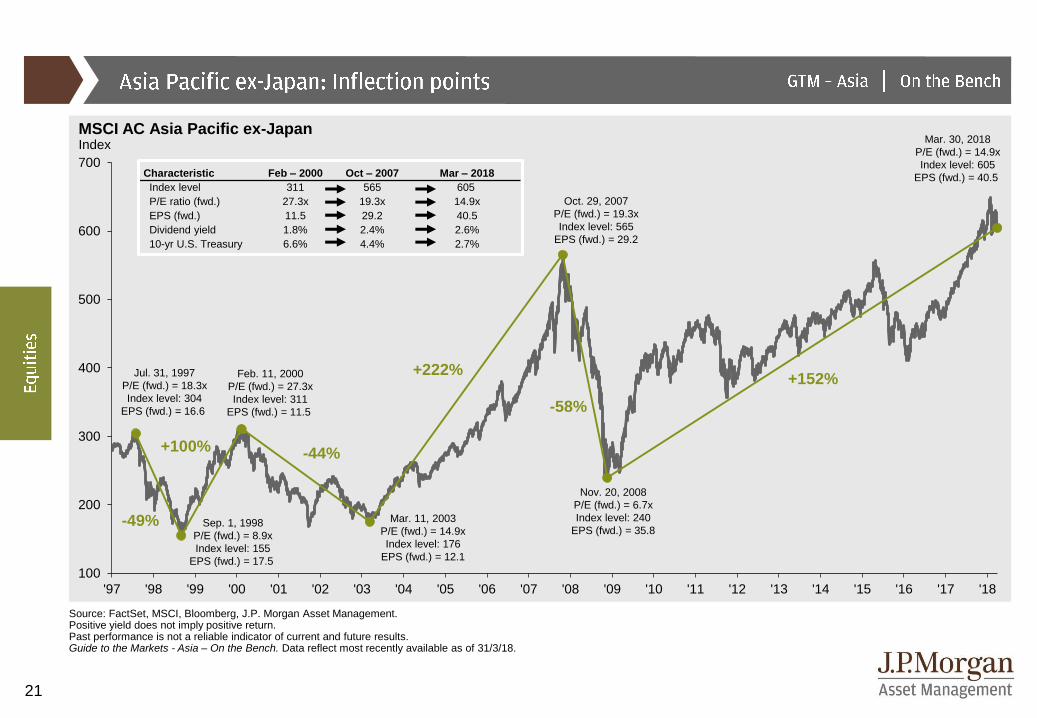
MSCI AC Asia Pacific ex-JapanIndex
-49%
+100%
+222%
-58%
Jul. 31, 1997
P/E (fwd.) = 18.3x
Index level: 304
EPS (fwd.) = 16.6
Feb. 11, 2000
P/E (fwd.) = 27.3x
Index level: 311
EPS (fwd.) = 11.5
Mar. 11, 2003
P/E (fwd.) = 14.9x
Index level: 176
EPS (fwd.) = 12.1
Oct. 29, 2007
P/E (fwd.) = 19.3x
Index level: 565
EPS (fwd.) = 29.2
Nov. 20, 2008
P/E (fwd.) = 6.7x
Index level: 240
EPS (fwd.) = 35.8
Characteristic Feb – 2000 Oct – 2007 Mar – 2018
Index level 311 565 605
P/E ratio (fwd.) 27.3x 19.3x 14.9x
EPS (fwd.) 11.5 29.2 40.5
Dividend yield 1.8% 2.4% 2.6%
10-yr U.S. Treasury 6.6% 4.4% 2.7%
Sep. 1, 1998
P/E (fwd.) = 8.9x
Index level: 155
EPS (fwd.) = 17.5
-44%
Mar. 30, 2018
P/E (fwd.) = 14.9x
Index level: 605
EPS (fwd.) = 40.5
+152%
22
0
50
100
150
200
250
'97 '98 '99 '00 '01 '02 '03 '04 '05 '06 '07 '08 '09 '10 '11 '12 '13 '14 '15 '16 '17 '18
Source: FactSet, MSCI, J.P. Morgan Asset Management.Returns are cumulative and based on price movement only, and do not include the reinvestment of dividends. Past performance is not a reliable indicator of current and future results.Guide to the Markets - Asia – On the Bench. Data reflect most recently available as of 31/3/18.
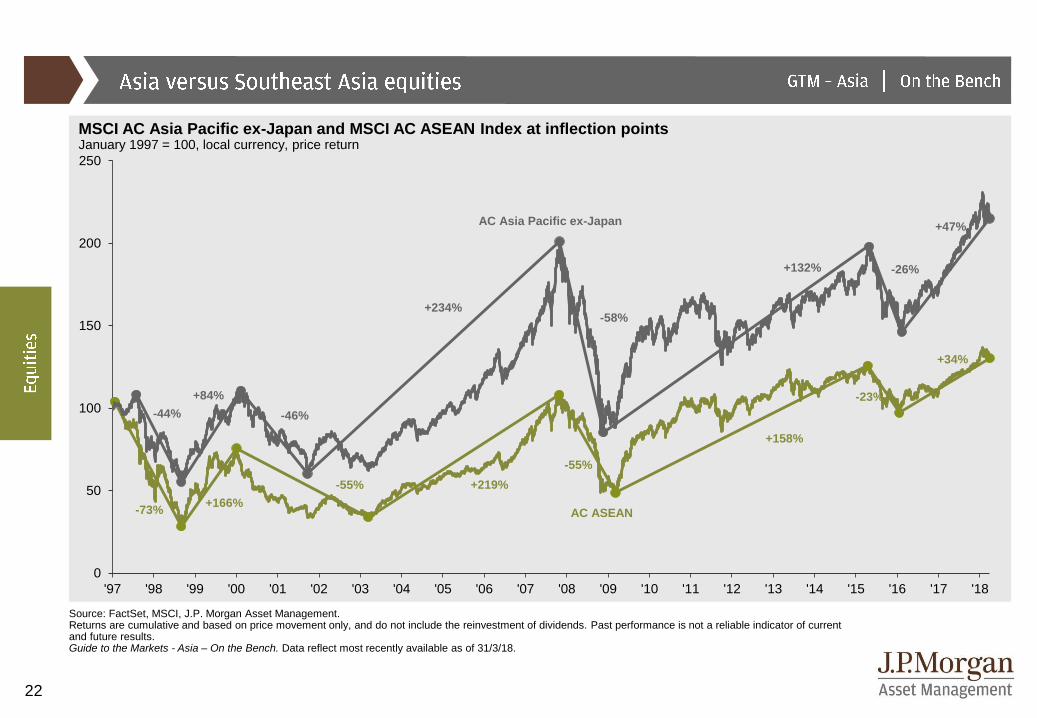
MSCI AC Asia Pacific ex-Japan and MSCI AC ASEAN Index at inflection pointsJanuary 1997 = 100, local currency, price return
+84%
AC Asia Pacific ex-Japan
+234%
+132%
+47%
-44% -46%
-58%
-26%
+166%-73%
-55%
-55%
+219%
+158%
+34%
-23%
AC ASEAN
23
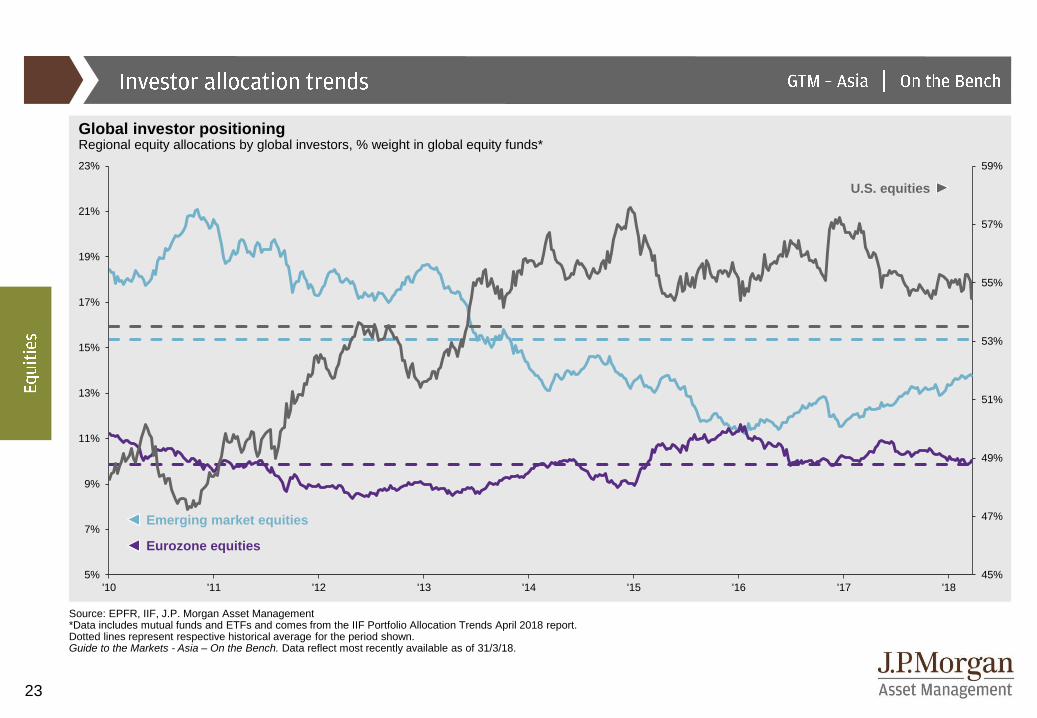
Source: EPFR, IIF, J.P. Morgan Asset Management*Data includes mutual funds and ETFs and comes from the IIF Portfolio Allocation Trends April 2018 report.Dotted lines represent respective historical average for the period shown.Guide to the Markets - Asia – On the Bench. Data reflect most recently available as of 31/3/18.
Global investor positioningRegional equity allocations by global investors, % weight in global equity funds*
Emerging market equities
Eurozone equities
U.S. equities
45%
47%
49%
51%
53%
55%
57%
59%
5%
7%
9%
11%
13%
15%
17%
19%
21%
23%
'10 '11 '12 '13 '14 '15 '16 '17 '18
24
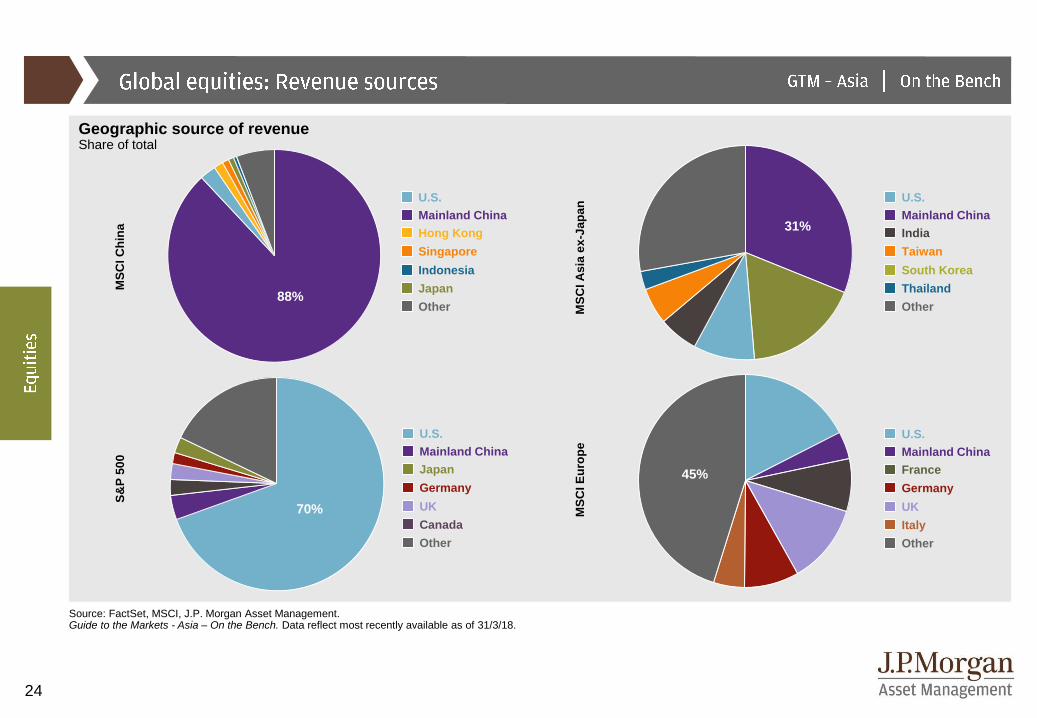
Source: FactSet, MSCI, J.P. Morgan Asset Management. Guide to the Markets - Asia – On the Bench. Data reflect most recently available as of 31/3/18.
Geographic source of revenueShare of total
MS
CI C
hin
aS
&P
50
0
MS
CI A
sia
ex
-Ja
pa
nM
SC
I E
uro
pe
Mainland China
Hong Kong
U.S.
Singapore
Indonesia
Japan
Other
Mainland China
Japan
U.S.
Germany
UK
Canada
Other
Mainland China
India
U.S.
Taiwan
South Korea
Thailand
Other
Mainland China
France
U.S.
Germany
UK
Italy
Other
70%
31%
45%
88%
25
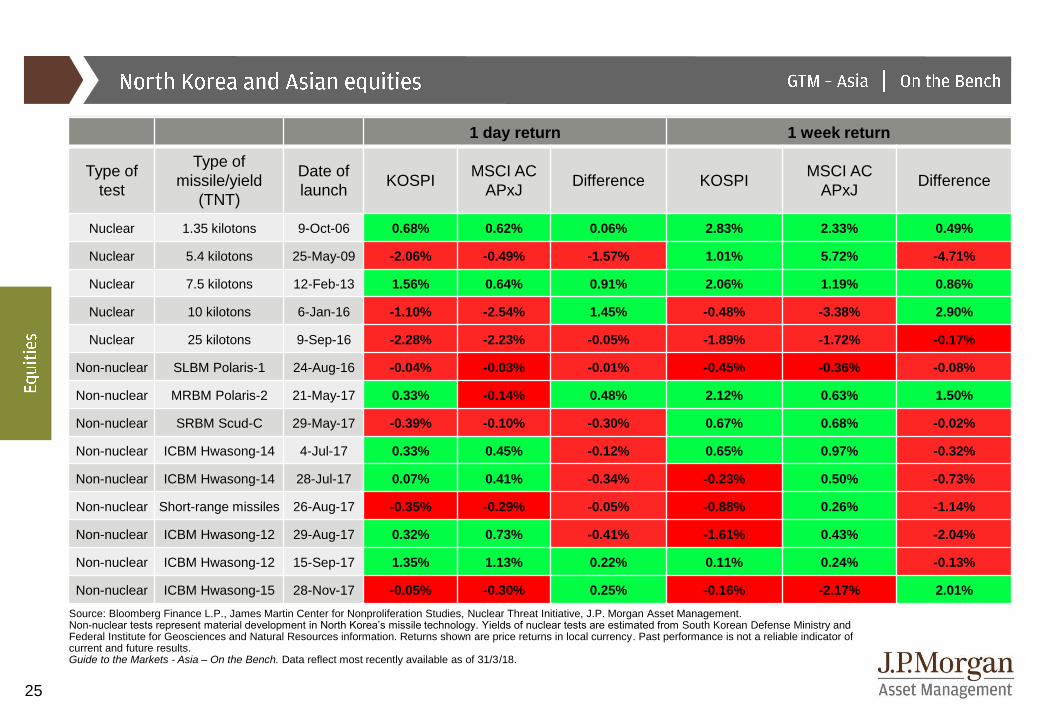
Source: Bloomberg Finance L.P., James Martin Center for Nonproliferation Studies, Nuclear Threat Initiative, J.P. Morgan Asset Management. Non-nuclear tests represent material development in North Korea’s missile technology. Yields of nuclear tests are estimated from South Korean Defense Ministry and Federal Institute for Geosciences and Natural Resources information. Returns shown are price returns in local currency. Past performance is not a reliable indicator of current and future results. Guide to the Markets - Asia – On the Bench. Data reflect most recently available as of 31/3/18.
1 day return 1 week return
Type of
test
Type of
missile/yield
(TNT)
Date of
launchKOSPI
MSCI AC
APxJDifference KOSPI
MSCI AC
APxJDifference
Nuclear 1.35 kilotons 9-Oct-06 0.68% 0.62% 0.06% 2.83% 2.33% 0.49%
Nuclear 5.4 kilotons 25-May-09 -2.06% -0.49% -1.57% 1.01% 5.72% -4.71%
Nuclear 7.5 kilotons 12-Feb-13 1.56% 0.64% 0.91% 2.06% 1.19% 0.86%
Nuclear 10 kilotons 6-Jan-16 -1.10% -2.54% 1.45% -0.48% -3.38% 2.90%
Nuclear 25 kilotons 9-Sep-16 -2.28% -2.23% -0.05% -1.89% -1.72% -0.17%
Non-nuclear SLBM Polaris-1 24-Aug-16 -0.04% -0.03% -0.01% -0.45% -0.36% -0.08%
Non-nuclear MRBM Polaris-2 21-May-17 0.33% -0.14% 0.48% 2.12% 0.63% 1.50%
Non-nuclear SRBM Scud-C 29-May-17 -0.39% -0.10% -0.30% 0.67% 0.68% -0.02%
Non-nuclear ICBM Hwasong-14 4-Jul-17 0.33% 0.45% -0.12% 0.65% 0.97% -0.32%
Non-nuclear ICBM Hwasong-14 28-Jul-17 0.07% 0.41% -0.34% -0.23% 0.50% -0.73%
Non-nuclear Short-range missiles 26-Aug-17 -0.35% -0.29% -0.05% -0.88% 0.26% -1.14%
Non-nuclear ICBM Hwasong-12 29-Aug-17 0.32% 0.73% -0.41% -1.61% 0.43% -2.04%
Non-nuclear ICBM Hwasong-12 15-Sep-17 1.35% 1.13% 0.22% 0.11% 0.24% -0.13%
Non-nuclear ICBM Hwasong-15 28-Nov-17 -0.05% -0.30% 0.25% -0.16% -2.17% 2.01%
26
0.0%
0.2%
0.4%
0.6%
0.8%
1.0%
1.2%
1.4%
1.6%
-0.2%
-0.2%
-0.1%
-0.1%
0.0%
0.1%
0.1%
-0.8%
-0.6%
-0.4%
-0.2%
0.0%
0.2%
0.4%
0.6%
0.0%
0.5%
1.0%
1.5%
2.0%
2.5%
3.0%
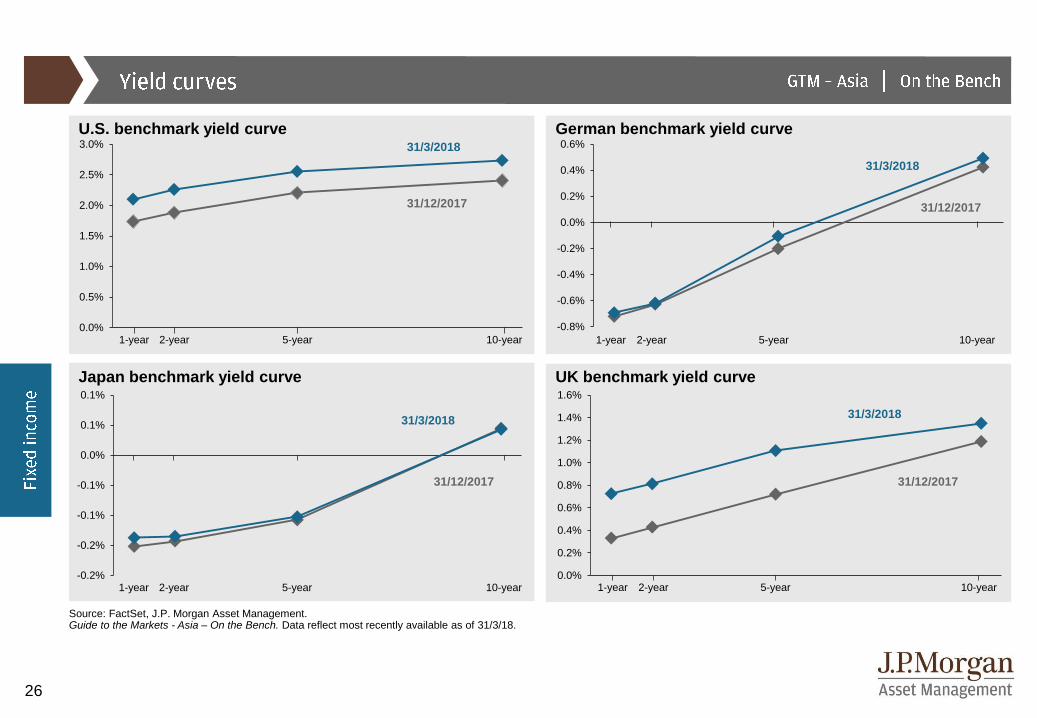
Source: FactSet, J.P. Morgan Asset Management.Guide to the Markets - Asia – On the Bench. Data reflect most recently available as of 31/3/18.
German benchmark yield curveU.S. benchmark yield curve
Japan benchmark yield curve UK benchmark yield curve
31/3/2018
31/12/2017
31/3/2018
31/3/201831/3/2018
31/12/2017 31/12/2017
31/12/2017
1-year 2-year 5-year 10-year
1-year 2-year 5-year 10-year 1-year 2-year 5-year 10-year
1-year 2-year 5-year 10-year
27
-1.2%
-0.1%
6.2%
-4.9%
-3.1%
-0.8%
-1.4%
-0.6%
-1.6%
-3.0%
-4.6%
-2.2%
-2.4%
-2.4%
-1.7%
-1.9%
-10% 0% 10% 20%
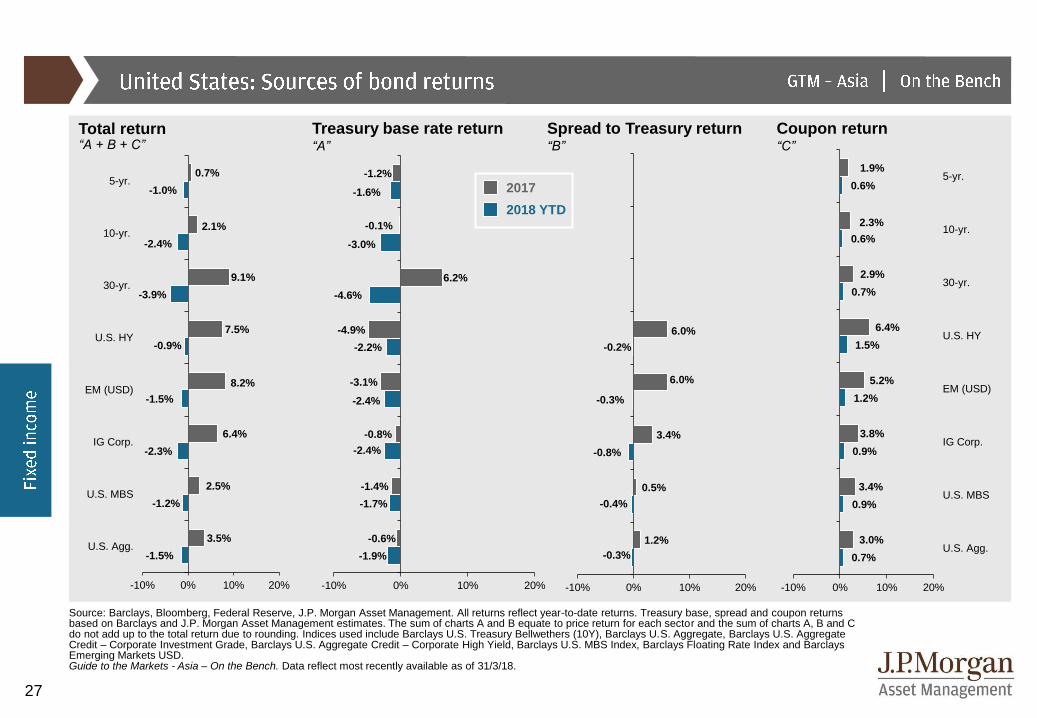
Source: Barclays, Bloomberg, Federal Reserve, J.P. Morgan Asset Management. All returns reflect year-to-date returns. Treasury base, spread and coupon returns based on Barclays and J.P. Morgan Asset Management estimates. The sum of charts A and B equate to price return for each sector and the sum of charts A, B and C do not add up to the total return due to rounding. Indices used include Barclays U.S. Treasury Bellwethers (10Y), Barclays U.S. Aggregate, Barclays U.S. Aggregate Credit – Corporate Investment Grade, Barclays U.S. Aggregate Credit – Corporate High Yield, Barclays U.S. MBS Index, Barclays Floating Rate Index and Barclays Emerging Markets USD. Guide to the Markets - Asia – On the Bench. Data reflect most recently available as of 31/3/18.
Total return“A + B + C”
2017
2018 YTD
Treasury base rate return“A”
Spread to Treasury return“B”
Coupon return“C”
0.7%
2.1%
9.1%
7.5%
8.2%
6.4%
2.5%
3.5%
-1.0%
-2.4%
-3.9%
-0.9%
-1.5%
-2.3%
-1.2%
-1.5%
-10% 0% 10% 20%
5-yr.
10-yr.
30-yr.
U.S. HY
EM (USD)
IG Corp.
U.S. MBS
U.S. Agg.
6.0%
6.0%
3.4%
0.5%
1.2%
-0.2%
-0.3%
-0.8%
-0.4%
-0.3%
-10% 0% 10% 20%
1.9%
2.3%
2.9%
6.4%
5.2%
3.8%
3.4%
3.0%
0.6%
0.6%
0.7%
1.5%
1.2%
0.9%
0.9%
0.7%
-10% 0% 10% 20%
5-yr.
10-yr.
30-yr.
U.S. HY
EM (USD)
IG Corp.
U.S. MBS
U.S. Agg.
28
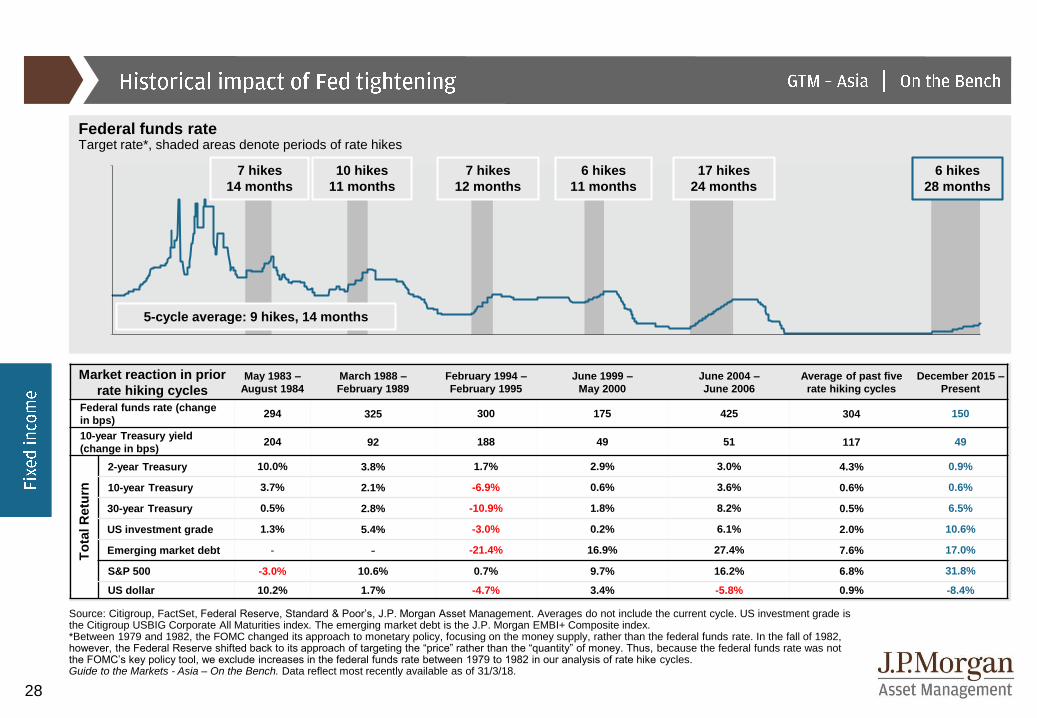
Market reaction in prior
rate hiking cyclesMay 1983 –
August 1984
March 1988 –
February 1989
February 1994 –
February 1995
June 1999 –
May 2000
June 2004 –
June 2006
Average of past five
rate hiking cycles
December 2015 –
Present
Federal funds rate (change
in bps)294 325 300 175 425 304 150
10-year Treasury yield
(change in bps)204 92 188 49 51 117 49
2-year Treasury 10.0% 3.8% 1.7% 2.9% 3.0% 4.3% 0.9%
10-year Treasury 3.7% 2.1% -6.9% 0.6% 3.6% 0.6% 0.6%
30-year Treasury 0.5% 2.8% -10.9% 1.8% 8.2% 0.5% 6.5%
US investment grade 1.3% 5.4% -3.0% 0.2% 6.1% 2.0% 10.6%
Emerging market debt - - -21.4% 16.9% 27.4% 7.6% 17.0%
S&P 500 -3.0% 10.6% 0.7% 9.7% 16.2% 6.8% 31.8%
US dollar 10.2% 1.7% -4.7% 3.4% -5.8% 0.9% -8.4%
Source: Citigroup, FactSet, Federal Reserve, Standard & Poor’s, J.P. Morgan Asset Management. Averages do not include the current cycle. US investment grade is the Citigroup USBIG Corporate All Maturities index. The emerging market debt is the J.P. Morgan EMBI+ Composite index. *Between 1979 and 1982, the FOMC changed its approach to monetary policy, focusing on the money supply, rather than the federal funds rate. In the fall of 1982, however, the Federal Reserve shifted back to its approach of targeting the “price” rather than the “quantity” of money. Thus, because the federal funds rate was not the FOMC’s key policy tool, we exclude increases in the federal funds rate between 1979 to 1982 in our analysis of rate hike cycles.Guide to the Markets - Asia – On the Bench. Data reflect most recently available as of 31/3/18.
Federal funds rateTarget rate*, shaded areas denote periods of rate hikes
7 hikes
14 months
10 hikes
11 months
7 hikes
12 months
6 hikes
11 months
17 hikes
24 months
5-cycle average: 9 hikes, 14 months
6 hikes
28 months
To
tal R
etu
rn
29
-20%
-10%
0%
10%
20%
'06 '09 '12 '15
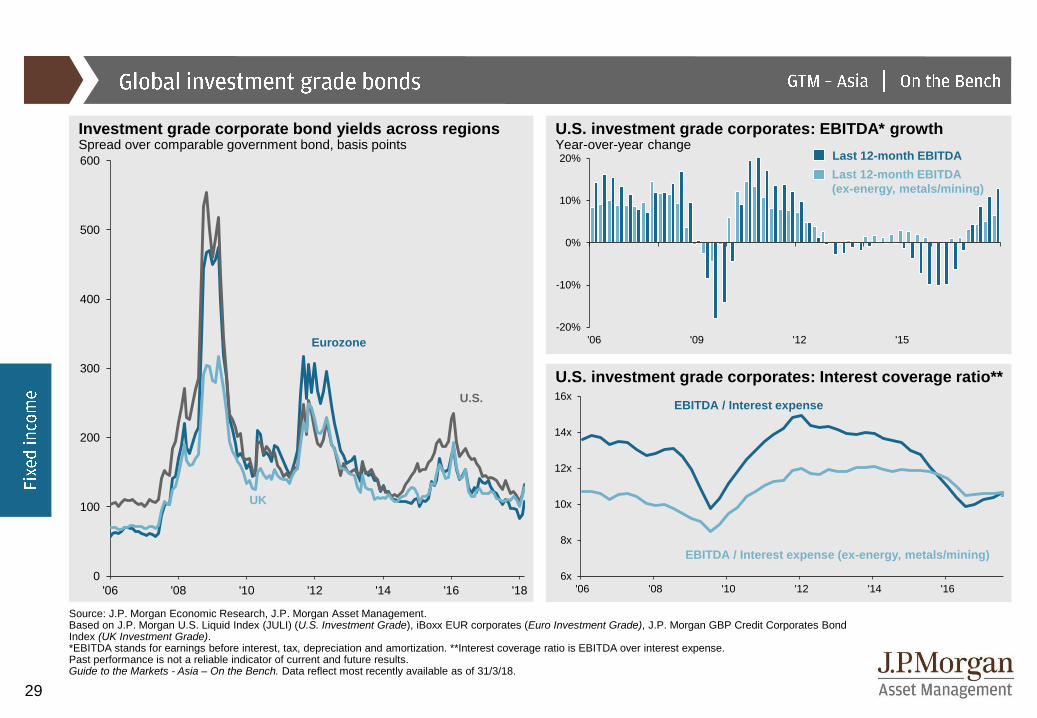
U.S. investment grade corporates: EBITDA* growthYear-over-year change
Source: J.P. Morgan Economic Research, J.P. Morgan Asset Management.Based on J.P. Morgan U.S. Liquid Index (JULI) (U.S. Investment Grade), iBoxx EUR corporates (Euro Investment Grade), J.P. Morgan GBP Credit Corporates Bond Index (UK Investment Grade).*EBITDA stands for earnings before interest, tax, depreciation and amortization. **Interest coverage ratio is EBITDA over interest expense. Past performance is not a reliable indicator of current and future results.Guide to the Markets - Asia – On the Bench. Data reflect most recently available as of 31/3/18.
Investment grade corporate bond yields across regionsSpread over comparable government bond, basis points
U.S. investment grade corporates: Interest coverage ratio**
U.S.
UK
Eurozone
Last 12-month EBITDA
Last 12-month EBITDA
(ex-energy, metals/mining)
EBITDA / Interest expense
EBITDA / Interest expense (ex-energy, metals/mining)
0
100
200
300
400
500
600
'06 '08 '10 '12 '14 '16 '18
6x
8x
10x
12x
14x
16x
'06 '08 '10 '12 '14 '16
30
0%
5%
10%
15%
20%
'98 '99 '00 '01 '02 '03 '04 '05 '06 '07 '08 '09 '10 '11 '12 '13 '14 '15 '16 '17 '18
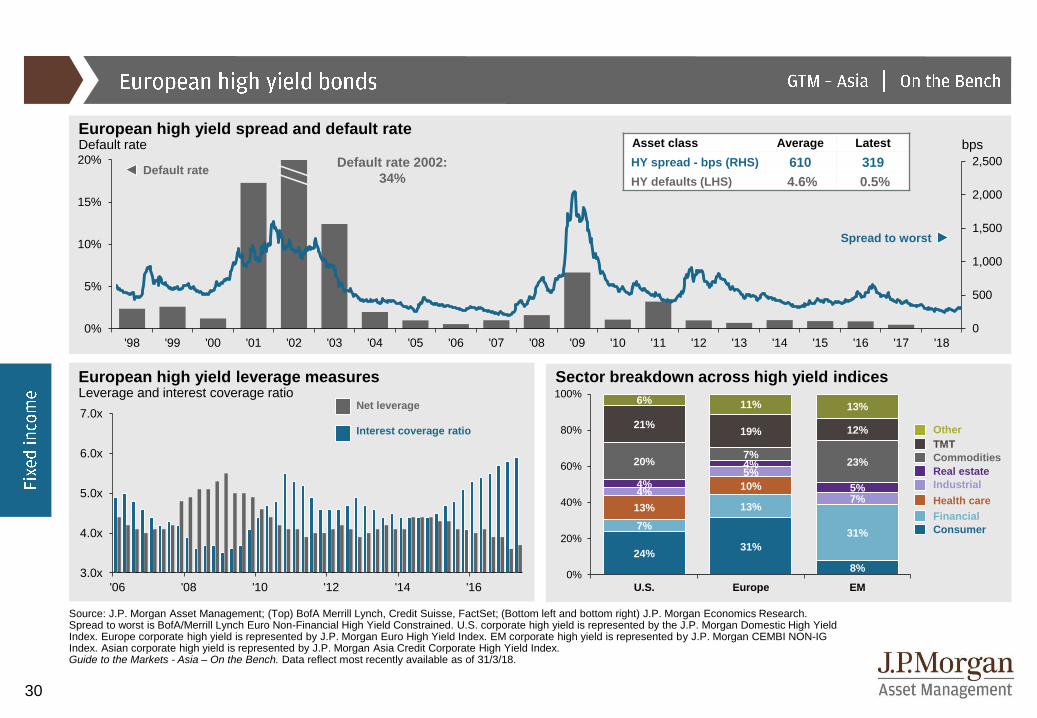
Source: J.P. Morgan Asset Management; (Top) BofA Merrill Lynch, Credit Suisse, FactSet; (Bottom left and bottom right) J.P. Morgan Economics Research.Spread to worst is BofA/Merrill Lynch Euro Non-Financial High Yield Constrained. U.S. corporate high yield is represented by the J.P. Morgan Domestic High Yield Index. Europe corporate high yield is represented by J.P. Morgan Euro High Yield Index. EM corporate high yield is represented by J.P. Morgan CEMBI NON-IG Index. Asian corporate high yield is represented by J.P. Morgan Asia Credit Corporate High Yield Index. Guide to the Markets - Asia – On the Bench. Data reflect most recently available as of 31/3/18.
European high yield leverage measuresLeverage and interest coverage ratio
Sector breakdown across high yield indices
European high yield spread and default rateDefault rate bps
Default rate 2002:
34%
Spread to worst
Default rate
Commodities
Other
TMT
Health care
Industrial
Real estate
Consumer
Financial
3.0x
4.0x
5.0x
6.0x
7.0x
'06 '08 '10 '12 '14 '16
Interest coverage ratio
Net leverage
0
500
1,000
1,500
2,000
2,500
24%31%
8%
7%
13%
31%
13%
10%4%
5%
7%
4%
4%
5%
20%7%
23%
21%19% 12%
6% 11% 13%
0%
20%
40%
60%
80%
100%
U.S. Europe EM
Asset class Average Latest
HY spread - bps (RHS) 610 319
HY defaults (LHS) 4.6% 0.5%
31
0
20
40
60
80
100
120
140
< -2% < -1% < -0.5% < 0% < 0.5% < 1% < 2% < 4% > 4%
0.0%
0.2%
0.4%
0.6%
0.8%
1.0%
1.2%
0%
1%
2%
3%
4%
5%
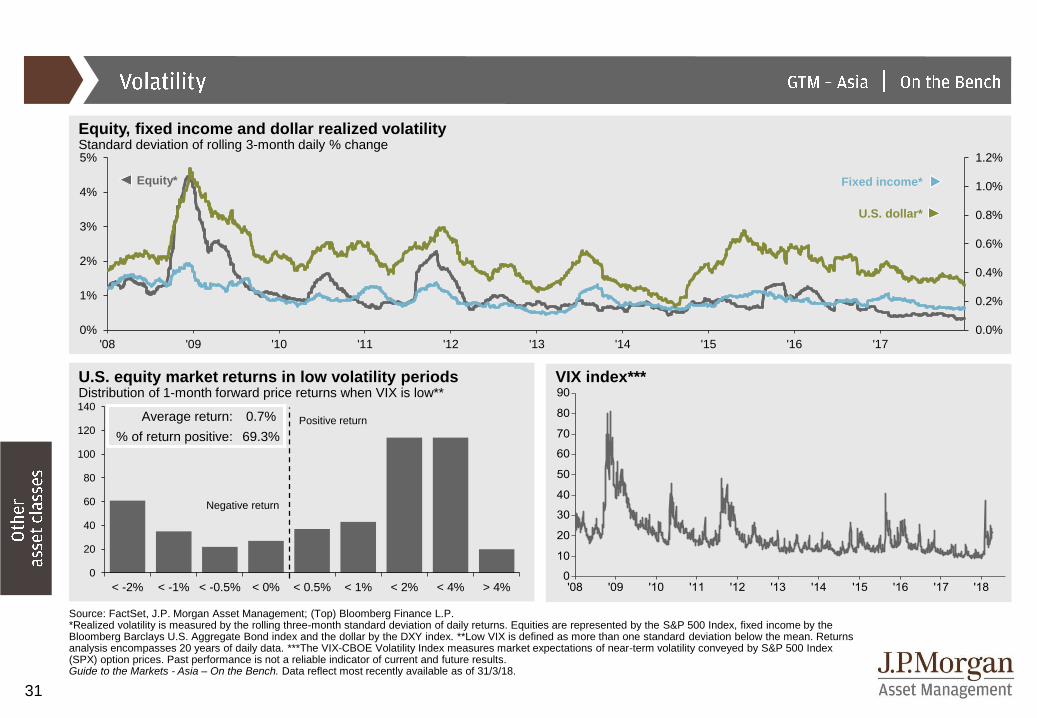
'08 '09 '10 '11 '12 '13 '14 '15 '16 '17
Equity* Fixed income*
Source: FactSet, J.P. Morgan Asset Management; (Top) Bloomberg Finance L.P.*Realized volatility is measured by the rolling three-month standard deviation of daily returns. Equities are represented by the S&P 500 Index, fixed income by the Bloomberg Barclays U.S. Aggregate Bond index and the dollar by the DXY index. **Low VIX is defined as more than one standard deviation below the mean. Returns analysis encompasses 20 years of daily data. ***The VIX-CBOE Volatility Index measures market expectations of near-term volatility conveyed by S&P 500 Index (SPX) option prices. Past performance is not a reliable indicator of current and future results.Guide to the Markets - Asia – On the Bench. Data reflect most recently available as of 31/3/18.
U.S. equity market returns in low volatility periodsDistribution of 1-month forward price returns when VIX is low**
VIX index***
Equity, fixed income and dollar realized volatilityStandard deviation of rolling 3-month daily % change
U.S. dollar*
Negative return
Positive returnAverage return: 0.7%
% of return positive: 69.3%
32
-4 -3 -2 -1 0 1 2 3 4
Commodity Index
Agriculture
Natural Gas
Oil
Precious Metals
Industrial Metals
Gold
Example
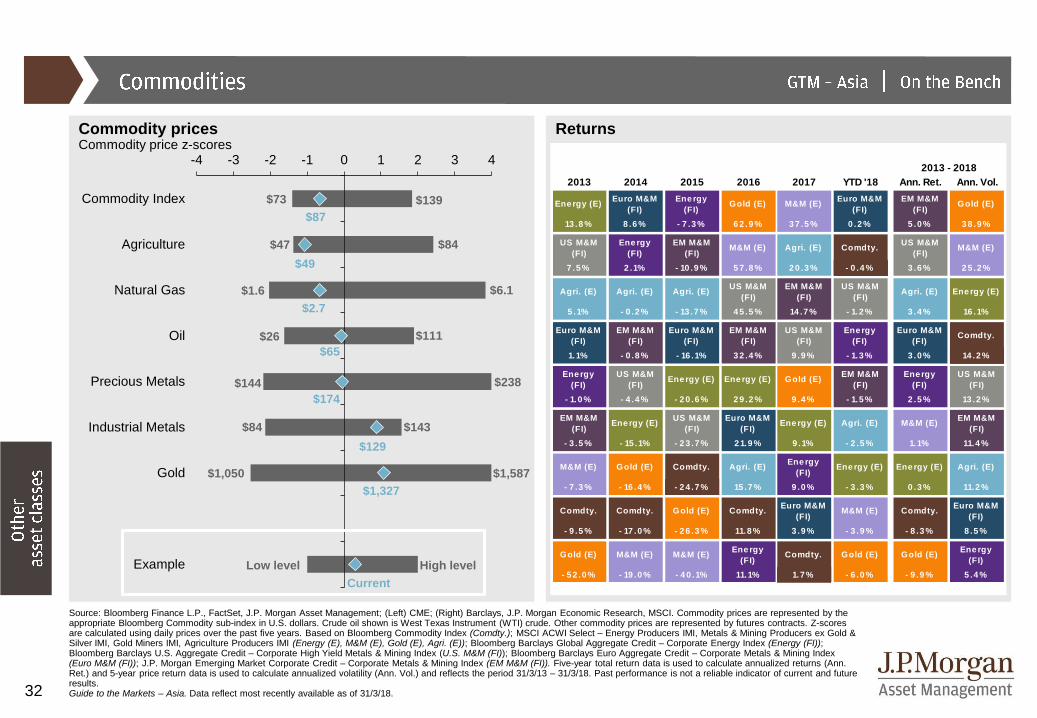
Source: Bloomberg Finance L.P., FactSet, J.P. Morgan Asset Management; (Left) CME; (Right) Barclays, J.P. Morgan Economic Research, MSCI. Commodity prices are represented by the appropriate Bloomberg Commodity sub-index in U.S. dollars. Crude oil shown is West Texas Instrument (WTI) crude. Other commodity prices are represented by futures contracts. Z-scores are calculated using daily prices over the past five years. Based on Bloomberg Commodity Index (Comdty.); MSCI ACWI Select – Energy Producers IMI, Metals & Mining Producers ex Gold & Silver IMI, Gold Miners IMI, Agriculture Producers IMI (Energy (E), M&M (E), Gold (E), Agri. (E)); Bloomberg Barclays Global Aggregate Credit – Corporate Energy Index (Energy (FI)); Bloomberg Barclays U.S. Aggregate Credit – Corporate High Yield Metals & Mining Index (U.S. M&M (FI)); Bloomberg Barclays Euro Aggregate Credit – Corporate Metals & Mining Index (Euro M&M (FI)); J.P. Morgan Emerging Market Corporate Credit – Corporate Metals & Mining Index (EM M&M (FI)). Five-year total return data is used to calculate annualized returns (Ann. Ret.) and 5-year price return data is used to calculate annualized volatility (Ann. Vol.) and reflects the period 31/3/13 – 31/3/18. Past performance is not a reliable indicator of current and future results.Guide to the Markets – Asia. Data reflect most recently available as of 31/3/18.
Commodity pricesCommodity price z-scores
Returns
High level
Current
Low level
$2.7
$49
$1,327
$174
$1.6 $6.1
$84
$1,587
$238$144
$1,050
$47
$111$26
$65
$143$84
$129
$139$73
$87
2013 2014 2015 2016 2017 YTD '18 Ann. Ret. Ann. Vol.
Ene rgy (E)Euro M&M
(FI)
Ene rgy
(FI)Gold (E) M&M (E)
Euro M&M
(FI)
EM M&M
(FI)Gold (E)
13 .8 % 8 .6 % - 7 .3 % 6 2 .9 % 3 7 .5 % 0 .2 % 5 .0 % 3 8 .9 %
US M&M
(FI)
Ene rgy
(FI)
EM M&M
(FI)M&M (E) Agri. (E) Comdty.
US M&M
(FI)M&M (E)
7 .5 % 2 .1% - 10 .9 % 5 7 .8 % 2 0 .3 % - 0 .4 % 3 .6 % 2 5 .2 %
Agri. (E) Agri. (E) Agri. (E)US M&M
(FI)
EM M&M
(FI)
US M&M
(FI)Agri. (E) Ene rgy (E)
5 .1% - 0 .2 % - 13 .7 % 4 5 .5 % 14 .7 % - 1.2 % 3 .4 % 16 .1%
Euro M&M
(FI)
EM M&M
(FI)
Euro M&M
(FI)
EM M&M
(FI)
US M&M
(FI)
Ene rgy
(FI)
Euro M&M
(FI)Comdty.
1.1% - 0 .8 % - 16 .1% 3 2 .4 % 9 .9 % - 1.3 % 3 .0 % 14 .2 %
Ene rgy
(FI)
US M&M
(FI)Ene rgy (E) Ene rgy (E) Gold (E)
EM M&M
(FI)
Ene rgy
(FI)
US M&M
(FI)
- 1.0 % - 4 .4 % - 2 0 .6 % 2 9 .2 % 9 .4 % - 1.5 % 2 .5 % 13 .2 %
EM M&M
(FI)Ene rgy (E)
US M&M
(FI)
Euro M&M
(FI)Ene rgy (E) Agri. (E) M&M (E)
EM M&M
(FI)
- 3 .5 % - 15 .1% - 2 3 .7 % 2 1.9 % 9 .1% - 2 .5 % 1.1% 11.4 %
M&M (E) Gold (E) Comdty. Agri. (E)Ene rgy
(FI)Ene rgy (E) Ene rgy (E) Agri. (E)
- 7 .3 % - 16 .4 % - 2 4 .7 % 15 .7 % 9 .0 % - 3 .3 % 0 .3 % 11.2 %
Comdty. Comdty. Gold (E) Comdty.Euro M&M
(FI)M&M (E) Comdty.
Euro M&M
(FI)
- 9 .5 % - 17 .0 % - 2 6 .3 % 11.8 % 3 .9 % - 3 .9 % - 8 .3 % 8 .5 %
Gold (E) M&M (E) M&M (E)Ene rgy
(FI)Comdty. Gold (E) Gold (E)
Ene rgy
(FI)
- 5 2 .0 % - 19 .0 % - 4 0 .1% 11.1% 1.7 % - 6 .0 % - 9 .9 % 5 .4 %
2013 - 2018
33
-500
0
500
1,000
1,500
2,000
2,500
Jewellery Total bar & coindemand
ETFs & similarproducts
Central banks &other inst.
Technology
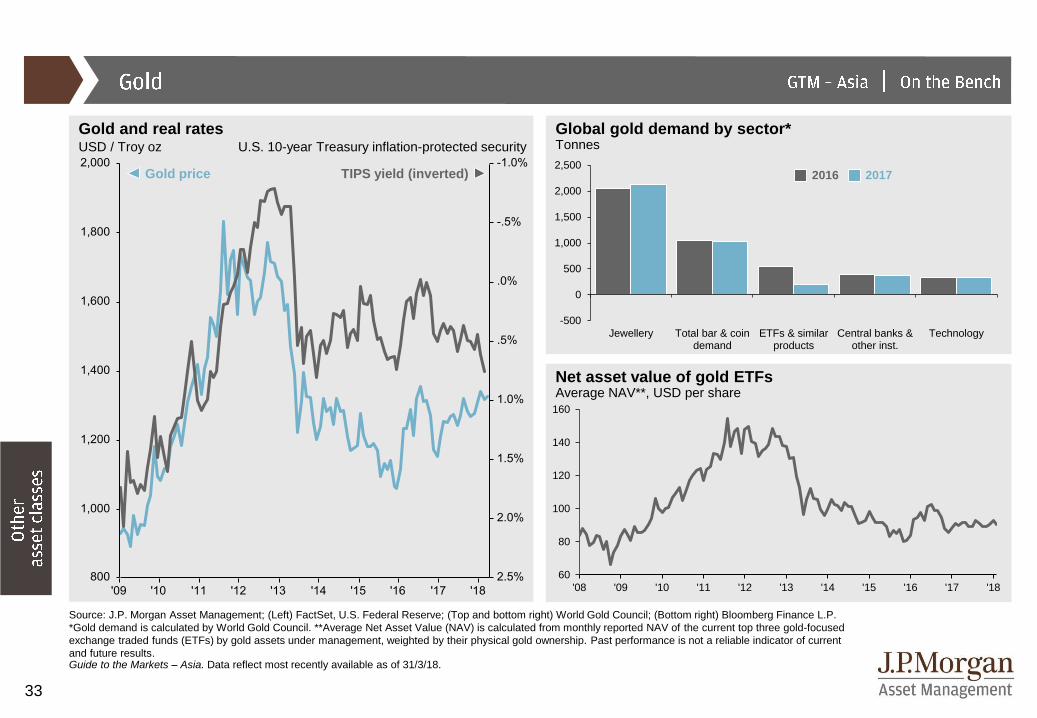
Gold price TIPS yield (inverted)
Global gold demand by sector*Tonnes
Source: J.P. Morgan Asset Management; (Left) FactSet, U.S. Federal Reserve; (Top and bottom right) World Gold Council; (Bottom right) Bloomberg Finance L.P.
*Gold demand is calculated by World Gold Council. **Average Net Asset Value (NAV) is calculated from monthly reported NAV of the current top three gold-focused
exchange traded funds (ETFs) by gold assets under management, weighted by their physical gold ownership. Past performance is not a reliable indicator of current
and future results.Guide to the Markets – Asia. Data reflect most recently available as of 31/3/18.
Gold and real rates USD / Troy oz U.S. 10-year Treasury inflation-protected security
Net asset value of gold ETFsAverage NAV**, USD per share
20172016
60
80
100
120
140
160
'08 '09 '10 '11 '12 '13 '14 '15 '16 '17 '18
34
3%
-3%
10%
6%8%
11%
7%
-5%
0%
5%
10%
15%
20%
25%
30%
Low and rising inflationOccurred in 10 years since 1972
7%
1%
16%
13% 14%
28%
10%
-5%
0%
5%
10%
15%
20%
25%
30%
2%
13%
16%
5%
11% 12% 11%
-5%
0%
5%
10%
15%
20%
25%
30%
7%
25%
-2%
8%
-2% -1%
11%
-5%
0%
5%
10%
15%
20%
25%
30%
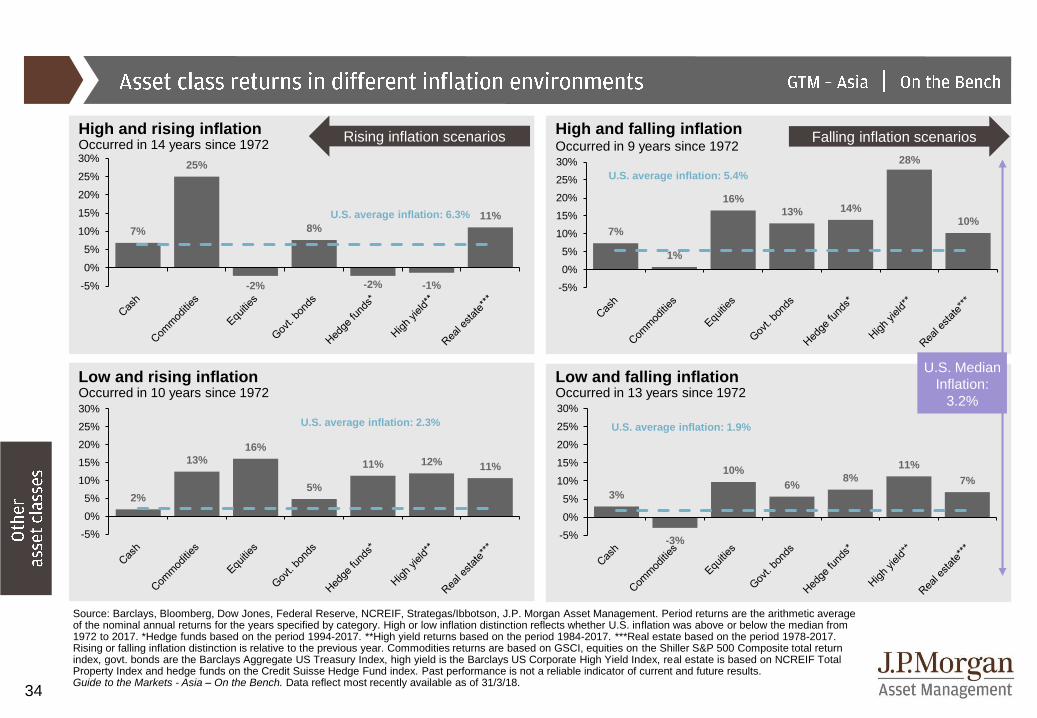
Source: Barclays, Bloomberg, Dow Jones, Federal Reserve, NCREIF, Strategas/Ibbotson, J.P. Morgan Asset Management. Period returns are the arithmetic average of the nominal annual returns for the years specified by category. High or low inflation distinction reflects whether U.S. inflation was above or below the median from 1972 to 2017. *Hedge funds based on the period 1994-2017. **High yield returns based on the period 1984-2017. ***Real estate based on the period 1978-2017. Rising or falling inflation distinction is relative to the previous year. Commodities returns are based on GSCI, equities on the Shiller S&P 500 Composite total return index, govt. bonds are the Barclays Aggregate US Treasury Index, high yield is the Barclays US Corporate High Yield Index, real estate is based on NCREIF Total Property Index and hedge funds on the Credit Suisse Hedge Fund index. Past performance is not a reliable indicator of current and future results. Guide to the Markets - Asia – On the Bench. Data reflect most recently available as of 31/3/18.
High and falling inflationOccurred in 9 years since 1972
High and rising inflationOccurred in 14 years since 1972
Low and falling inflationOccurred in 13 years since 1972
Falling inflation scenariosRising inflation scenarios
U.S. average inflation: 6.3%
U.S. average inflation: 2.3% U.S. average inflation: 1.9%
U.S. average inflation: 5.4%
U.S. Median
Inflation:
3.2%
35
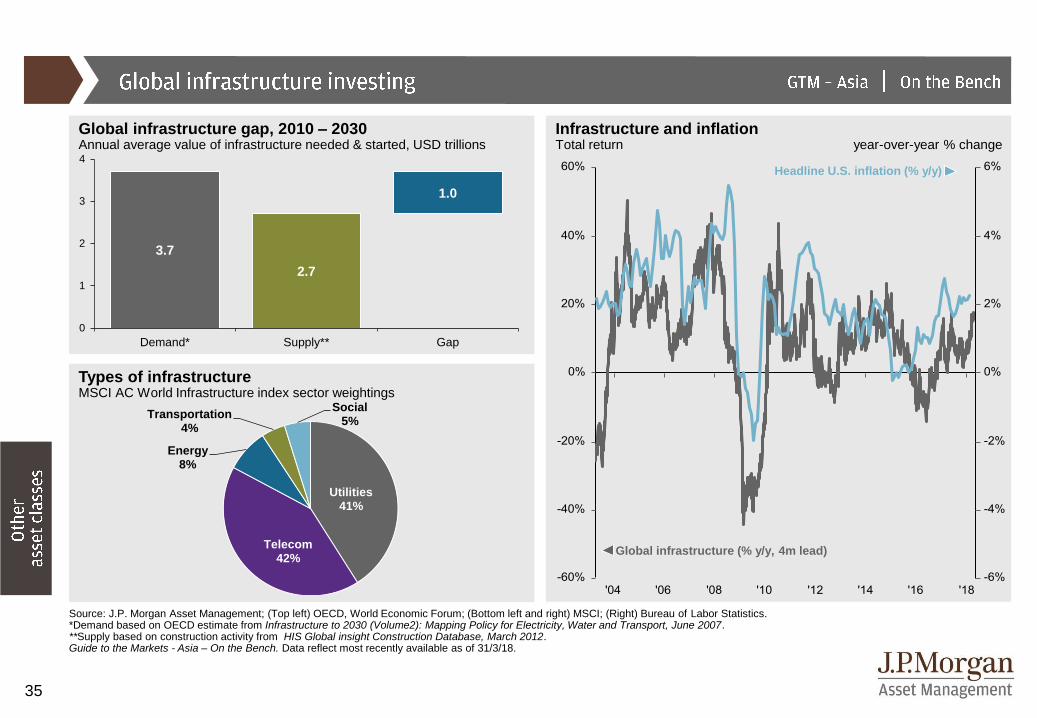
Source: J.P. Morgan Asset Management; (Top left) OECD, World Economic Forum; (Bottom left and right) MSCI; (Right) Bureau of Labor Statistics.*Demand based on OECD estimate from Infrastructure to 2030 (Volume2): Mapping Policy for Electricity, Water and Transport, June 2007.**Supply based on construction activity from HIS Global insight Construction Database, March 2012.Guide to the Markets - Asia – On the Bench. Data reflect most recently available as of 31/3/18.
Infrastructure and inflationTotal return year-over-year % change
Types of infrastructureMSCI AC World Infrastructure index sector weightings
Global infrastructure gap, 2010 – 2030 Annual average value of infrastructure needed & started, USD trillions
Global infrastructure (% y/y, 4m lead)
Headline U.S. inflation (% y/y)
3.7
2.7
1.0
0
1
2
3
4
Demand* Supply** Gap
Utilities41%
Telecom42%
Energy8%
Transportation4%
Social5%
36
-60
-40
-20
0
20
40
60
'05 '06 '07 '08 '09 '10 '11 '12 '13 '14 '15 '16 '17 '18
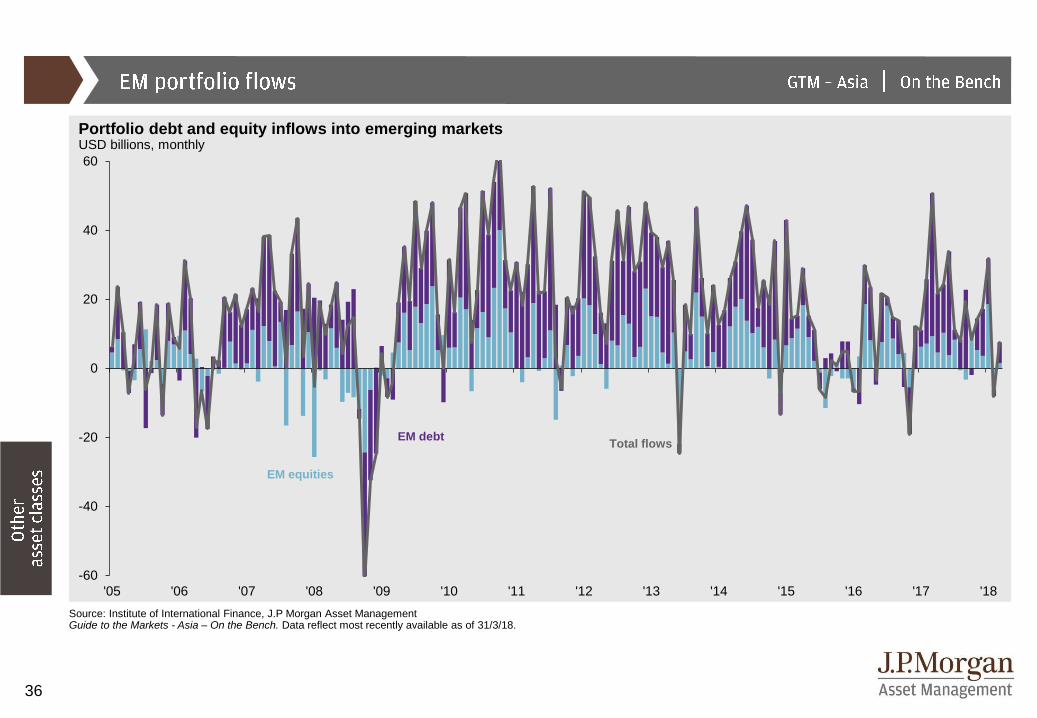
Source: Institute of International Finance, J.P Morgan Asset ManagementGuide to the Markets - Asia – On the Bench. Data reflect most recently available as of 31/3/18.
Portfolio debt and equity inflows into emerging marketsUSD billions, monthly
EM debt
EM equities
Total flows
37
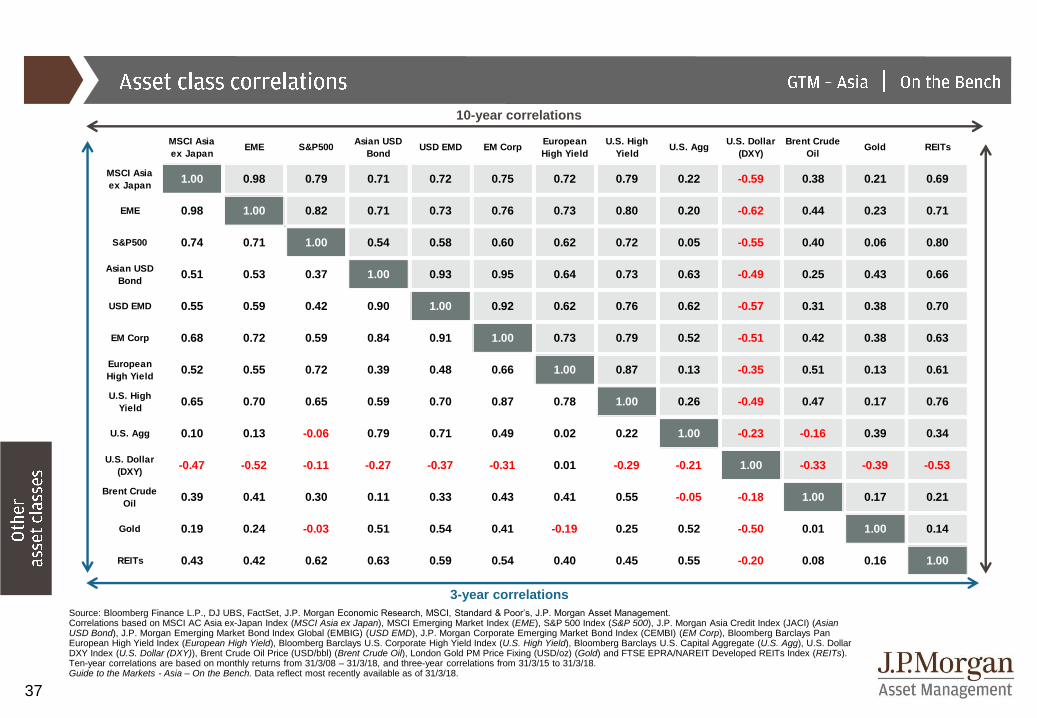
Source: Bloomberg Finance L.P., DJ UBS, FactSet, J.P. Morgan Economic Research, MSCI, Standard & Poor’s, J.P. Morgan Asset Management.Correlations based on MSCI AC Asia ex-Japan Index (MSCI Asia ex Japan), MSCI Emerging Market Index (EME), S&P 500 Index (S&P 500), J.P. Morgan Asia Credit Index (JACI) (Asian USD Bond), J.P. Morgan Emerging Market Bond Index Global (EMBIG) (USD EMD), J.P. Morgan Corporate Emerging Market Bond Index (CEMBI) (EM Corp), Bloomberg Barclays Pan European High Yield Index (European High Yield), Bloomberg Barclays U.S. Corporate High Yield Index (U.S. High Yield), Bloomberg Barclays U.S. Capital Aggregate (U.S. Agg), U.S. Dollar DXY Index (U.S. Dollar (DXY)), Brent Crude Oil Price (USD/bbl) (Brent Crude Oil), London Gold PM Price Fixing (USD/oz) (Gold) and FTSE EPRA/NAREIT Developed REITs Index (REITs). Ten-year correlations are based on monthly returns from 31/3/08 – 31/3/18, and three-year correlations from 31/3/15 to 31/3/18. Guide to the Markets - Asia – On the Bench. Data reflect most recently available as of 31/3/18.
10-year correlations
3-year correlations
MSCI Asia
ex JapanEME S&P500
Asian USD
BondUSD EMD EM Corp
European
High Yield
U.S. High
YieldU.S. Agg
U.S. Dollar
(DXY)
Brent Crude
OilGold REITs
MSCI Asia
ex Japan1.00 0.98 0.79 0.71 0.72 0.75 0.72 0.79 0.22 -0.59 0.38 0.21 0.69
EME 0.98 1.00 0.82 0.71 0.73 0.76 0.73 0.80 0.20 -0.62 0.44 0.23 0.71
S&P500 0.74 0.71 1.00 0.54 0.58 0.60 0.62 0.72 0.05 -0.55 0.40 0.06 0.80
Asian USD
Bond0.51 0.53 0.37 1.00 0.93 0.95 0.64 0.73 0.63 -0.49 0.25 0.43 0.66
USD EMD 0.55 0.59 0.42 0.90 1.00 0.92 0.62 0.76 0.62 -0.57 0.31 0.38 0.70
EM Corp 0.68 0.72 0.59 0.84 0.91 1.00 0.73 0.79 0.52 -0.51 0.42 0.38 0.63
European
High Yield0.52 0.55 0.72 0.39 0.48 0.66 1.00 0.87 0.13 -0.35 0.51 0.13 0.61
U.S. High
Yield0.65 0.70 0.65 0.59 0.70 0.87 0.78 1.00 0.26 -0.49 0.47 0.17 0.76
U.S. Agg 0.10 0.13 -0.06 0.79 0.71 0.49 0.02 0.22 1.00 -0.23 -0.16 0.39 0.34
U.S. Dollar
(DXY)-0.47 -0.52 -0.11 -0.27 -0.37 -0.31 0.01 -0.29 -0.21 1.00 -0.33 -0.39 -0.53
Brent Crude
Oil0.39 0.41 0.30 0.11 0.33 0.43 0.41 0.55 -0.05 -0.18 1.00 0.17 0.21
Gold 0.19 0.24 -0.03 0.51 0.54 0.41 -0.19 0.25 0.52 -0.50 0.01 1.00 0.14
REITs 0.43 0.42 0.62 0.63 0.59 0.54 0.40 0.45 0.55 -0.20 0.08 0.16 1.00
38
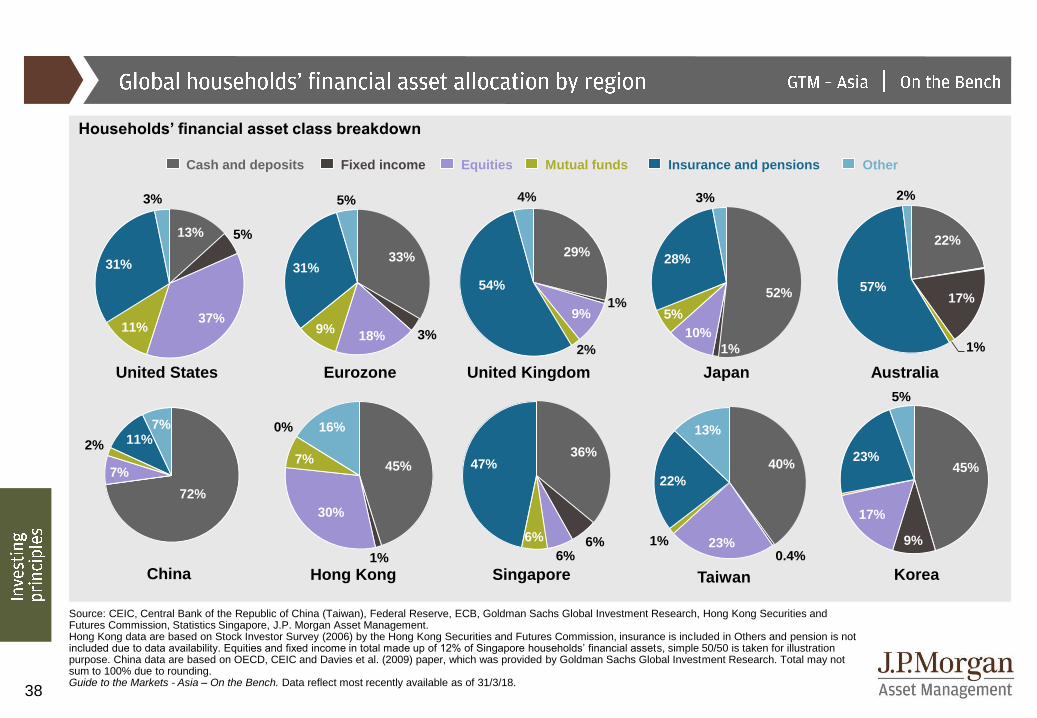
Source: CEIC, Central Bank of the Republic of China (Taiwan), Federal Reserve, ECB, Goldman Sachs Global Investment Research, Hong Kong Securities and Futures Commission, Statistics Singapore, J.P. Morgan Asset Management. Hong Kong data are based on Stock Investor Survey (2006) by the Hong Kong Securities and Futures Commission, insurance is included in Others and pension is not included due to data availability. Equities and fixed income in total made up of 12% of Singapore households’ financial assets, simple 50/50 is taken for illustration purpose. China data are based on OECD, CEIC and Davies et al. (2009) paper, which was provided by Goldman Sachs Global Investment Research. Total may not sum to 100% due to rounding.Guide to the Markets - Asia – On the Bench. Data reflect most recently available as of 31/3/18.
Households’ financial asset class breakdown
TaiwanHong Kong Singapore Korea
JapanUnited States Eurozone AustraliaUnited Kingdom
Cash and deposits Fixed income Equities Mutual funds Insurance and pensions Other
45%
1%
30%
7%
0% 16%
45%
9%
17%
23%
5%
72%
7%
2% 11%7%
China
36%
6%6%
6%
47% 40%
0.4%23%1%
22%
13%
29%
1%9%
2%
54%
4%
22%
17%
1%
57%
2%
13% 5%
37%11%
31%
3%
52%
1%
10%
5%
28%
3%
33%
3%18%9%
31%
5%
39
All indexes are unmanaged and an individual cannot invest directly in an index. Index returns do not include fees or expenses.
The S&P 500 Index is widely regarded as the best single gauge of the U.S. equities market. This world-renowned index includes a representative sample of 500 leading companies in leading industries of the U.S. economy. Although the S&P 500 Index focuses on the large-cap segment of the market, with approximately 75% coverage of U.S. equities, it is also an ideal proxy for the total market. An investor cannot invest directly in an index.
The Tokyo Stock Price Index ('TOPIX') is a composite index of all common stocks listed on the First Section of Tokyo Stock Exchange (TSE).The index is basically a measure of the changes in aggregate market value of TSE common stocks. The base for the index is the aggregate market value of its component stocks as of the close on January 4, 1968. The aggregate market value is calculated by multiplying the number of listed shares of each component stock by its price and totaling the products derived there from.
The Bombay Exchange Sensitive Index (‘SENSEX), first compiled in 1986, was calculated on a "Market Capitalization-Weighted" methodology of 30 component stocks representing large, well-established and financially sound companies across key sectors. The base year of SENSEX was taken as 1978-79. SENSEX today is widely reported in both domestic and international markets through print as well as electronic media. It is scientifically designed and is based on globally accepted construction and review methodology. Since September 1, 2003, SENSEX is being calculated on a free-float market capitalization methodology.
The Korea Composite Stock Price Index (‘KOSPI) is market capitalization based index on all common stocks listed on the Stock Market Division of the Korea Exchange (KRX) and excludes preferred stocks. The stock price index is calculated using the actual price traded on the market and not the “base price” used for market management such as establishment of price change limits. When no market price is available for issues that are not being traded or have halted trading, the latest closing price is used. KOSPI was a assigned a base index of 100 set to January 4, 1980.
The China Shenzhen Composite Index is an actual market-cap weighted index that tracks the stock performance of all the A-share and B-share lists on Shenzhen Stock Exchange. The index was developed on April 3, 1991 with a base price of 100.
The Euro Stoxx 600 Index represents large, mid and small capitalization companies across 18 European countries.
The MSCI® EAFE (Europe, Australia, Far East) Net Index is recognized as the pre-eminent benchmark in the United States to measure international equity performance. It comprises 21 MSCI country indexes, representing the developed markets outside of North America.
The MSCI Emerging Markets IndexSM is a free float-adjusted market capitalization index that is designed to measure equity market performance in the global emerging markets. As of June 2007, the MSCI Emerging Markets Index consisted of the following 25 emerging market country indices: Argentina, Brazil, Chile, China, Colombia, Czech Republic, Egypt, Hungary, India, Indonesia, Israel, Jordan, Korea, Malaysia, Mexico, Morocco, Pakistan, Peru, Philippines, Poland, Russia, South Africa, Taiwan, Thailand, and Turkey.
The MSCI ACWI (All Country World Index) Index is a free float-adjusted market capitalization weighted index that is designed to measure the equity market performance of developed and emerging markets. As of June 2009 the MSCI ACWI consisted of 45 country indices comprising 23 developed and 22 emerging market country indices.
The following MSCI Total Return IndicesSM are calculated with gross dividends:This series approximates the maximum possible dividend reinvestment. The amount reinvested is the dividend distributed to individuals resident in the country of the company, but does not include tax credits.
The MSCI Europe IndexSM is a free float-adjusted market capitalization index that is designed to measure developed market equity performance in Europe. As of June 2007, the MSCI Europe Index consisted of the following 16 developed market country indices: Austria, Belgium, Denmark, Finland, France, Germany, Greece, Ireland, Italy, the Netherlands, Norway, Portugal, Spain, Sweden, Switzerland and the United Kingdom.
The MSCI Pacific IndexSM is a free float-adjusted market capitalization index that is designed to measure equity market performance in the Pacific region. As of June 2007, the MSCI Pacific Index consisted of the following 5 Developed Market countries: Australia, Hong Kong, Japan, New Zealand, and Singapore.
The MSCI Europe ex UK IndexSM is a free float-adjusted market capitalization weighted index that is designed to measure the equity market performance of the developed markets in Europe, excluding the United Kingdom. The
MSCI Europe ex UK Index consists of the following 15 developed market country indices: Austria, Belgium, Denmark, Finland, France, Germany, Greece, Ireland, Italy, the Netherlands, Norway, Portugal, Spain, Sweden, and Switzerland.
The MSCI Pacific ex Japan IndexSM is a free float-adjusted market capitalization index that is designed to measure equity market performance in the Pacific region, excluding Japan. As of June 2007, the MSCI Pacific Index consisted of the following 4 Developed Market countries: Australia, Hong Kong, New Zealand, and Singapore.
The MSCI USA IndexSM is designed to measure the performance of the large and mid cap segments of the U.S. market. With 586 constituents, the index covers approximately 84% of the free float-adjusted market capitalization in the U.S.. The MSCI USA Index was launched on Dec ember 31, 1969.
The MSCI China IndexSM captures large and mid cap representation across China H shares, B shares, Red chips and P chips. With 148 constituents, the index covers about 84% of this China equity universe. The MSCI China Index was launched on December 31, 1992.
The MSCI Indonesia IndexSM is designed to measure the performance of the large and mid cap segments of the Indonesian market. With 25 constituents, the index covers about 84% of the Indonesian equity universe. The MSCI Indonesia Index was launched on December 31, 1990.
The MSCI Korea IndexSM is designed to measure the performance of the large and mid cap segments of the South Korean market. With 105 constituents, the index covers about 84% of the Korean equity universe. The MSCI Korea Index was launched on December 31, 1989.
The MSCI India IndexSM is designed to measure the performance of the large and mid cap segments of the Indian market. With 71 constituents, the index covers about 84% of the Indian equity universe. The MSCI India Index was launched on December 31, 1993.
The MSCI Japan IndexSM is designed to measure the performance of the large and mid cap segments of the Japan market. With 315 constituents, the index covers approximately 84% of the free float-adjusted market capitalization in Japan. The MSCI Japan Index was launched on December 31, 1969.
The MSCI Hong Kong IndexSM is designed to measure the performance of the large and mid cap segments of the Hong Kong market. With 42 constituents, the index covers approximately 84% of the free float-adjusted market capitalization of the Hong Kong equity universe. The MSCI Hong Kong Index was launched on December 31, 1972.
The MSCI Taiwan IndexSM is designed to measure the performance of the large and mid cap segments of the Taiwan market. With 113 constituents, the index covers approximately 84% of the free float-adjusted market capitalization in Taiwan. The MSCI Taiwan Index was launched on December 31, 1989.
The MSCI Environmental, Social and Governance (ESG) Universal Indices are designed to address the needs of asset owners who may look to enhance their exposure to ESG while maintaining a broad and diversified universe to invest in. By re-weighting free-float market cap weights based upon certain ESG metrics tilting away from free-float market cap weights, the indices enhance exposure to those companies that demonstrate both a higher MSCI ESG Rating and a positive ESG trend, while maintaining a broad and diversified investment universe.
40
West Texas Intermediate (WTI) is the underlying commodity for the New York Mercantile Exchange's oil futures contracts.
The Bloomberg Commodity Index is calculated on an excess return basis and reflects commodity futures price movements. The index rebalances annually weighted 2/3 by trading volume and 1/3 by world production and weight-caps are applied at the commodity, sector and group level for diversification. Roll period typically occurs from 6th-10th business day based on the roll schedule.
The Bloomberg Commodity Subindexes represent commodity groups and sectors, as well as single commodities, that make up the Bloomberg Commodity Index. The subindexes track exchange-traded futures of physical commodities, and the commodity groups and sectors, like in the case of the broad index, are weighted to account for economic significance and market liquidity. The various subindexes include Agriculture, Energy, Livestock, Grains, Industrial Metals, Precious Metals and Softs.
The Bloomberg Barclays High Yield Index covers the universe of fixed rate, non-investment grade debt. Pay-in-kind (PIK) bonds, Eurobonds, and debt issues from countries designated as emerging markets (e.g., Argentina, Brazil, Venezuela, etc.) are excluded, but Canadian and global bonds (SEC registered) of issuers in non-EMG countries are included. Original issue zeroes, step-up coupon structures, and 144-As are also included.
The Bloomberg Barclays 1-3 Month U.S. Treasury Bill Index includes all publicly issued zero-coupon U.S. Treasury Bills that have a remaining maturity of less than 3 months and more than 1 month, are rated investment grade, and have $250 million or more of outstanding face value. In addition, the securities must be denominated in U.S. dollars and must be fixed rate and non convertible.
The Bloomberg Barclays Corporate Bond Index is the Corporate component of the U.S. Credit index.
The Bloomberg Barclays TIPS Index consists of Inflation-Protection securities issued by the U.S. Treasury.
The J.P. Morgan EMBI Global Index includes U.S. dollar denominated Brady bonds, Eurobonds, traded loans and local market debt instruments issued by sovereign and quasi-sovereign entities.
The J.P. Morgan GBI-EM Global Diversified consists of regularly traded, liquid fixed-rate, domestic currency government bonds to which international investors can gain exposure. The weightings among the countries are more evenly distributed within this index.
The J.P. Morgan Corporate Emerging Markets Bond Index (CEMBI): The CEMBI tracks total returns of US dollar-denominated debt instruments issued by corporate entities in Emerging Markets countries, and consists of an investable universe of corporate bonds.
The J.P. Morgan Domestic High Yield Index is designed to mirror the investable universe of the U.S. dollar domestic high yield corporate debt market.
The VIX-CBOE Volatility Index measures market expectations of near-term volatility conveyed by S&P 500 Index (SPX) option prices.
The MOVE-Merrill Lynch Option Volatility Index is a blended implied normal volatility for constant one-month at-the-money options on U.S. Treasuries.
Price to forward earnings is a measure of the price-to-earnings ratio (P/E) using forecasted earnings. Price to book value compares a stock's market value to its book value. Price to cash flow is a measure of the market's expectations of a firm's future financial health. Price to dividends is the ratio of the price of a share on a stock exchange to the dividends per share paid in the previous year, used as a measure of a company's potential as an investment.
Bonds are subject to interest rate risks. Bond prices generally fall when interest rates rise.
The price of equity securities may rise, or fall because of changes in the broad market or changes in a company’s financial condition, sometimes rapidly or unpredictably. These price movements may result from factors affecting individual companies, sectors or industries, or the securities market as a whole, such as changes in economic or political conditions. Equity securities are subject to “stock market risk” meaning that stock prices in general may decline over short or extended periods of time.
Small-capitalization investing typically carries more risk than investing in well-established "blue-chip" companies since smaller companies generally have a higher risk of failure. Historically, smaller companies' stock has experienced a greater degree of market volatility than the average stock.
Mid-capitalization investing typically carries more risk than investing in well-established "blue-chip" companies. Historically, mid-cap companies' stock has experienced a greater degree of market volatility than the average stock.
Real estate investments may be subject to a higher degree of market risk because of concentration in a specific industry, sector or geographical sector. Real estate investments may be subject to risks including, but not limited to, declines in the value of real estate, risks related to general and economic conditions, changes in the value of the underlying property owned by the trust and defaults by borrower.
International investing involves a greater degree of risk and increased volatility. Changes in currency exchange rates and differences in accounting and taxation policies can raise or lower returns. Also, some markets may not be as politically and economically stable as other nations. Investments in emerging markets can be more volatile. The normal risks of international investing are heightened when investing in emerging markets. In addition, the small size of securities markets and the low trading volume may lead to a lack of liquidity, which leads to increased volatility. Also, emerging markets may not provide adequate legal protection for private or foreign investment or private property.
Investments in commodities may have greater volatility than investments in traditional securities, particularly if the instruments involve leverage. The value of commodity-linked derivative instruments may be affected by changes in overall market movements, commodity index volatility, changes in interest rates, or factors affecting a particular industry or commodity, such as drought, floods, weather, livestock disease, embargoes, tariffs and international economic, political and regulatory developments. Use of leveraged commodity-linked derivatives creates an opportunity for increased return but, at the same time, creates the possibility for greater loss.
Derivatives may be riskier than other types of investments because they may be more sensitive to changes in economic or market conditions than other types of investments and could result in losses that significantly exceed the original investment. The use of derivatives may not be successful, resulting in investment losses, and the cost of such strategies may reduce investment returns.
There is no guarantee that the use of long and short positions will succeed in limiting an investor's exposure to domestic stock market movements, capitalization, sector swings or other risk factors. Investing using long and short selling strategies may have higher portfolio turnover rates. Short selling involves certain risks, including additional costs associated with covering short positions and a possibility of unlimited loss on certain short sale positions.
41
The Market Insights program provides comprehensive data and commentary on global markets without reference to products. Designed as a tool to help clients understand the markets and support investment decision-making, the program explores the implications of current economic data and changing market conditions.
For the purposes of MiFID II, the JPM Market Insights and Portfolio Insights programmes are marketing communications and are not in scope for any MiFID II / MiFIR requirements specifically related to investment research. Furthermore, the J.P. Morgan Asset Management Market Insights and Portfolio Insights programmes, as non-independent research, have not been prepared in accordance with legal requirements designed to promote the independence of investment research, nor are they subject to any prohibition on dealing ahead of the dissemination of investment research.
This document is a general communication being provided for informational purposes only. It is educational in nature and not designed to be taken as advice or a recommendation for any specific investment product, strategy, plan feature or other purpose in any jurisdiction, nor is it a commitment from J.P. Morgan Asset Management or any of its subsidiaries to participate in any of the transactions mentioned herein. Any examples used are generic, hypothetical and for illustration purposes only. This material does not contain sufficient information to support an investment decision and it should not be relied upon by you in evaluating the merits of investing in any securities or products. In addition, users should make an independent assessment of the legal, regulatory, tax, credit, and accounting implications and determine, together with their own professional advisers, if any investment mentioned herein is believed to be suitable to their personal goals. Investors should ensure that they obtain all available relevant information before making any investment. Any forecasts, figures, opinions or investment techniques and strategies set out are for information purposes only, based on certain assumptions and current market conditions and are subject to change without prior notice. All information presented herein is considered to be accurate at the time of production, but no warranty of accuracy is given and no liability in respect of any error or omission is accepted. It should be noted that investment involves risks, the value of investments and the income from them may fluctuate in accordance with market conditions and taxation agreements and investors may not get back the full amount invested. Both past performance and yields are not a reliable indicator of current and future results.
J.P. Morgan Asset Management is the brand for the asset management business of JPMorgan Chase & Co. and its affiliates worldwide. This communication is issued by the following entities: in the United Kingdom by JPMorgan Asset Management (UK) Limited, which is authorized and regulated by the Financial Conduct Authority; in other European jurisdictions by JPMorgan Asset Management (Europe) S.à r.l.; in Hong Kong by JF Asset Management Limited, or JPMorgan Funds (Asia) Limited, or JPMorgan Asset Management Real Assets (Asia) Limited; in Singapore by JPMorgan Asset Management (Singapore) Limited (Co. Reg. No. 197601586K), or JPMorgan Asset Management Real Assets (Singapore) Pte Ltd (Co. Reg. No. 201120355E); in Taiwan by JPMorgan Asset Management (Taiwan) Limited; in Japan by JPMorgan Asset Management (Japan) Limited which is a member of the Investment Trusts Association, Japan, the Japan Investment Advisers Association, Type II Financial Instruments Firms Association and the Japan Securities Dealers Association and is regulated by the Financial Services Agency (registration number “Kanto Local Finance Bureau (Financial Instruments Firm) No. 330”); in Korea by JPMorgan Asset Management (Korea) Company Limited; in Australia to wholesale clients only as defined in section 761A and 761G of the Corporations Act 2001 (Cth) by JPMorgan Asset Management (Australia) Limited (ABN 55143832080) (AFSL 376919); in Brazil by Banco J.P. Morgan S.A.; in Canada for institutional clients’ use only by JPMorgan Asset Management (Canada) Inc., and in the United States by JPMorgan Distribution Services Inc. and J.P. Morgan Institutional Investments, Inc., both members of FINRA/SIPC.; and J.P. Morgan Investment Management Inc.
In APAC, distribution is for Hong Kong, Taiwan, Japan and Singapore. For all other countries in APAC, to intended recipients only.
Copyright 2018 JPMorgan Chase & Co. All rights reserved.
Prepared by: David Kelly, Tai Hui, Kerry Craig,Yoshinori Shigemi, Jasslyn Yeo, Marcella Chow, Ian Hui, Shogo Maekawa, Chaoping Zhu and Hannah Anderson.
Unless otherwise stated, all data are as of March 31, 2018 or most recently available.
MI-GTMASIA-E MARCH 2018
Material ID: 0903c02a820d1619