Embed Size (px)
Citation preview
Short Notes K177
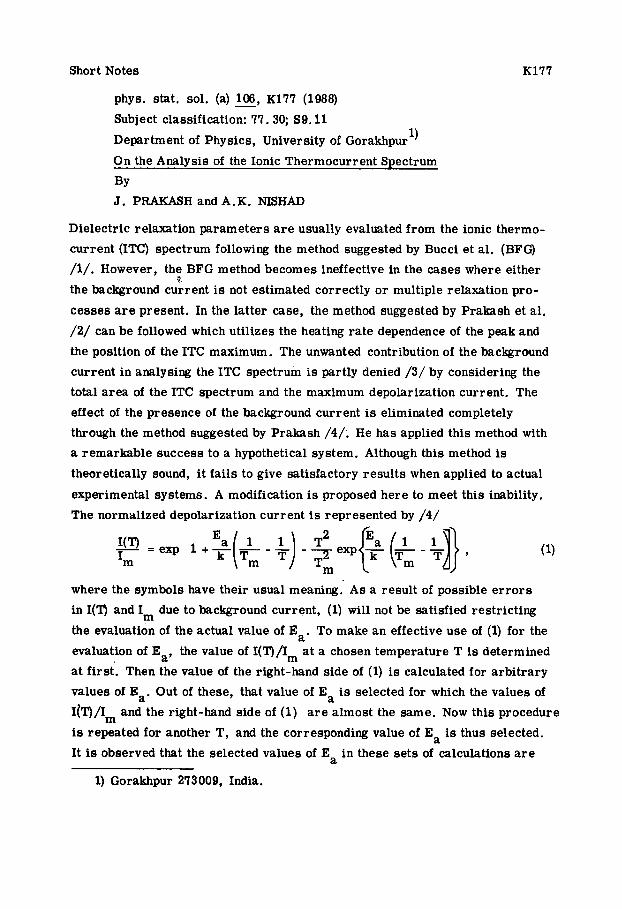
phys. stat. sol. (a) - 106, K177 (1988) Subject classification: 77.30; S9.11 Department of Physics, University of Gorakhpur 1)
On the Analysis of the Ionic Thermocurrent Spectrum
BY J. PRAKASH and A.K. NISHAD
Dielectric relaxation parameters are usually evaluated from the ionic thermo- current (ITC) spectrum following the method suggested by Bucci et al. (BFG) /l/. However, the BFG method becomes ineffective in the cases where either the background current is not estimated correctly o r multiple relaxation pro- cesses are present, In the latter case, the method suggested by Prakash et al. /2/ can be followed which utilizes the heating rate dependence of the peak and the position of the ITC maximum. The unwanted contribution of the background current in analysing the ITC spectrum is partly denied /3/ by considering the total area of the ITC spectrum and the maximum depolarization current. The effect of the presence of the background current is eliminated completely through the method suggested by Prakash /4/. He has applied this method with a remarkable success to a hypothetical system. Although this method is theoretically sound, it fails to give satisfactory results when applied to actual experimental systems. A modification is proposed here to meet this inability. The normalized depolarization current is represented by /4/
d
where the symbols have their usual meaning. A s a result of possible e r ro r s in I(T) and Im due to background current, (1) will not be satisfied restricting the evaluation of the actual value of Ea. To make an effective use of (1) for the evaluation of Ea, the value of I(T)/Im at a chosen temperature T is determined at first. Then the value of the right-hand side of (1) is calculated for arbitrary values of Ea. Out of these, that value of Ea is selected for which the values of I(T)/Im and the right-hand side of (1) are almost the same. Now this procedure is repeated for another T, and the corresponding value of Ea is thus selected. It is observed that the selected values of Ea in these sets of calculations are
1) Gorakhpur 273009, India.

Fi T
ab
le
1
c 4
Val
ues
of I
(T)/
Im a
t dif
fere
nt t
empe
ratu
res
for
arbi
trar
ily
chos
en v
alue
s of
Ea
in t
he K
C1:
Ca2
+ sy
stem
. R
epor
ted
para
met
ers
/5/
are
Ea
= 0
.61
eV,
z =
3.0
3~
10
-1
3 -1
s,
Tm
= 2
10.7
K,
I m =
90
arb.
uni
ts,
and
b =
0.1
K s
0
Ea(
eV)
T=
204K
, I(T
) =59
.5ar
b.un
its,
I(T
)/Im
=0.
661
0.50
0.
753
0.60
0.
669
0.70
0.
588
0.61
0.
661
T=
203.
1K, I
(T) =
53ar
b.un
its,
I(T
)/Im
=o.
589
0.50
0.
690
0.60
0.
594
0.70
0.
508
0.60
7 0.
589
T=
202K
, I(T
) =
46.5
arb.
unit
s, I
(T)/
Im=
0.51
7 0.
50
0.62
7 0.
60
0.52
5 0.
70
0.43
4 0.
608
0.51
7
T=
201K
, I(T
) =40
.5ar
b.un
its,
I(T
)/Im
=0.
450
0.50
0.
566
0.60
0.
459
0.70
0.
367
0.60
9 0.
450
I(T)
/Im
fr
om (1
)

Short Notes K179
the same as shown in Table 1. T o a r r i v e a t a most common value of Ea, the data at different T are considered. I t is obvious from s e t s (i) to (v) of the table
that the selected value of Ea is i n good agreement with the reported value /5/. However, when the value of I(T)/Im is either less than 0.30 or g rea t e r than 0.70, the selected value of E deviates f rom the reported one as obvious from
sets (vi) t o (ix). The r eason for the deviation lies in the presence of the uncer- tain background current when I(T)/Im< 0.30 and a slow change in the de- polarization current around Im when I(T)/Im > 0.70. The higher-temperature end of the ITC spectrum is not considered for the evaluation of Ea because of the sha rp fall off of the depolarization current which may introduce a n e r r o r i n I(T)/Im. Thus, the activation energy can be evaluated following the modified method of analysis considering the data i n the range 0.30 < I(T)/Im< 0.70. Once the value of E is known, z can be evaluated with the help of
a
a 0
It is obvious, therefore, that Ea and ‘I: can be evaluated conveniently and
The authors are thankful t o Prof. N.K. Sanyal for h i s interest i n the work
0 accurately following the suggested procedure.
and to Prof. F. F i sche r (Munster, FRG) for valuable suggestions. One of u s (A. K. N.) is thankful t o CSIR (New Ifelhi) for financial assistance.
References /1/ C. BUCCI, R. FIESCHI, and G. GUIDI, Phys. Rev. 148, 816 (1966). /2/ J. PRAKASH, RAHUL, and A.K. NISHAD, phys. stat. sol. (a) 91, 685
/3/ J. PRAKASH, RAHUL, and A.K. NISHAD, J. appl. Phys. 59, 2129 (1986). /4/ J. PRAKASH, phys. stat. sol. (a) - 98, 247 (1986). /5/ A. BRUN, P. DANSAS, and P, SMOU, Solid State Commun. 8, 613 (1970).
- (1985).
-
- (Received December 16, 1987)