Embed Size (px)
Citation preview
JOURNAL OF CHROMATOGRAPHY A
ELSEVIER Journal of Chromatography A, 683 (1994) 151-155
On-line liquid chromatography-gas chromatography for determination of fenarimol in fruiting vegetables
Rian Rietveld, Jan Quirijns* TN0 Nutrition and Food Research, P.O. Box 340, 371xI AJ Zeist, Netherlands
Abstract
The fungicide fenarimol was determined in fruiting vegetables such as cucumbers, tomatoes and sweet peppers by an on-line LC-GC method. The sample was extracted with ethyl acetate and the extract cleaned by a LiChrosorb Si 50 HPLC column. Pre-treatment of the silica column with ethyl acetate, saturated with water, provided separation between fenarimol and matrix components and gave a reproducible retention behaviour of fenarimol. Introduction into the gas chromatograph was achieved via the loop-type interface technique. After effluent splitting, fenarimol was detected with flame ionisation detection (FID) and electron-capture detection (ECD). The linearity range of fenarimol was 0.02-0.45 mg/kg with FID. Owing to insufficient linearity ECD was used only for confirmation. The detection limit was 0.02 mg/kg, the average recovery 93% (76-110%) and the relative standard deviation 4%. The results of the LC-GC method were comparable with the present off-line method, but less toxic solvent was needed and the on-line LC-GC method was less time-intensive.
1. Introduction
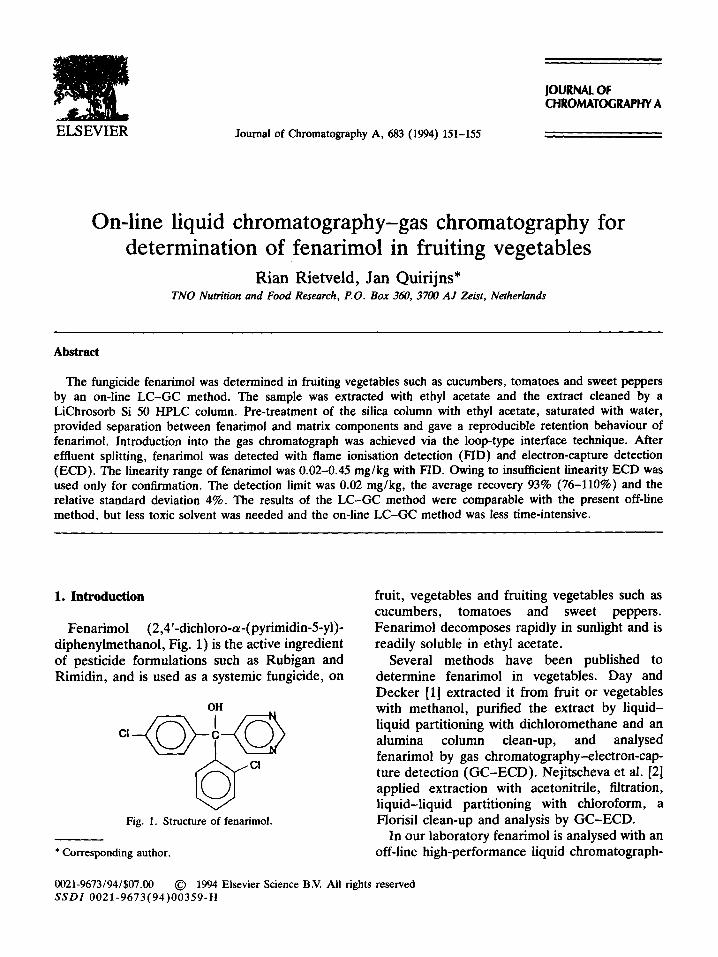
Fenarimol (2,4’-dichloro-cY-(pyrimidin-5-yl)- diphenylmethanol, Fig. 1) is the active ingredient of pesticide formulations such as Rubigan and Rimidin, and is used as a systemic fungicide, on
Fig. 1. Structure of fenarimol.
* Corresponding author,
fruit, vegetables and fruiting vegetables such as cucumbers, tomatoes and sweet peppers. Fenarimol decomposes rapidly in sunlight and is readily soluble in ethyl acetate.
Several methods have been published to determine fenarimol in vegetables. Day and Decker [l] extracted it from fruit or vegetables with methanol, purified the extract by liquid- liquid partitioning with dichloromethane and an alumina column clean-up, and analysed fenarimol by gas chromatography-electron-cap- ture detection (GC-ECD). Nejitscheva et al. [2] applied extraction with acetonitrile, filtration, liquid-liquid partitioning with chloroform, a Florisil clean-up and analysis by GC-ECD.
In our laboratory fenarimol is analysed with an off-line high-performance liquid chromatograph-
0021-9673/94/$07.00 @ 1994 Elsevier Science B.V. All rights reserved SSDI 0021-9673(94)00359-H
152 R. Rietveld, .I. Quirijns I J. Chromatogr. A 683 (1994) 151-155
ic (HPLC) method [3]. The sample is extracted with dichloromethane-n-hexane, centrifuged, concentrated and cleaned on a SEP-PAK silica column. After solvent changing to methanol fenarimol is analysed via reversed-phase HPLC with ultra-violet (UV) detection. Results of this off-line method for fenarimol are: detection limit 0.02 mg/kg, average recovery 93% (82-105%), and linearity range 0.02-1.6 mg/kg.
serving as a retaining pre-column, a solvent vapour exit and a CP-Si15 CB analytical column, 22 m x 0.25 mm I.D., 0.4 pm film thickness (Chrompack, Middelburg, Netherlands). The effluent of the analytical column was split to a flame ionization detector (FID) and an ECD. Connections in the GC and T-pieces were of press-fit type (Interscience).
This study describes the development of an on-line LC-GC method for the same analysis with a commercially available instrument, and is the first result of our study on the applicability of this technique in residue analysis. We expected to save time and solvent using the on-line meth- od.
2.3. Sample preparation
2. Experimental
A sample was homogenized in a food cutter and 50 g of subsample was blended in a beaker for 1 min with 100 ml of ethyl acetate in the presence of 25 g of sodium sulphate. The beaker with the extract was left for 5 min to clear. A portion of the organic layer was decanted in a glass-stoppered tube which could be stored in a refrigerator and 20 ~1 of this extract was injected onto the LC column.
2.1. Materials 2.4. Pre-treatment of the LC column
Ethyl acetate (resi-analyzed) was obtained from J.T. Baker (Phillipsburg, NJ, USA) and sodium sulphate p.a, from Merck (Darmstadt, Germany). n-Hexane and fenarimol (C134300) were from Promochem (Wesel, Germany). Water was tap water. Standard solutions for calibration and linearity determinations were made in ethyl acetate-3% water. The eluent for HPLC was ethyl acetate-n-hexane-water (50:50:0.1, v/v/v).
The silica gel column was pretreated with ethyl acetate-3% water at a flow-rate of 500 $/min for two h. Then the column was stabilized with ethyl acetate-n-hexane-water 50:50:0.1 until the UV signal at 270 nm was stable.
2.5. LC method
2.2. Znstrumentation
Experiments were carried out with an auto- mated LC-GC instrument Dualchrom 3000 (Fisons, Milan, Italy), equipped with a LC-auto- sampler, a LC-column heater, a UV detector, two syringe pumps, as well as a 6-port and a lo-port valve (with a backflush loop) for LC. The 12.5 cm x 4.6 mm I.D. LC column was packed with LiChrosorb Si 50, 5 pm. The loop- type interface was equipped with a 500 ~1 loop.
The water content in the calibration solution was adjusted to that of the sample extract by addition of 3% water. 20 ~1 of the sample extract was injected and eluted at a flow-rate of 500 pl/min. After starting the transfer to GC, the LC column was backflushed with 1 ml ethyl of acetate-3% water, at a flow-rate of 500 ~11 min, and reconditioned with mobile phase up to the next injection. The LC column heater was kept well above room temperature (35°C).
2.6. LC-GC transfer and GC method
The GC configuration comprised a diphenyl- The transfer of the LC fraction into the GC tetramethyldisilazane-deactivated 3 m X 0.53 mm was carried out with a loop-type interface using I.D. retention gap, (Interscience, Breda, Nether- concurrent eluent evaporation [4]. 12 min after lands), a 3-m section of the analytical column HPLC injection, a 500-~1 LC fraction was trans-
R. Rietveld, J. Quirijns I J. Chromatogr. A 683 (1994) 151-155 153
ferred into the GC at an oven temperature of 130°C.
Helium was used as the carrier gas with a constant flow-rate of 2 ml/min, measured at 25°C. During transfer the interface pressure increased to 200 kPa. The solvent vapour exit was closed 4 min after solvent evaporation had ended, the oven heated at a rate of 8”C/min to 300°C and kept there for 5 min.
3. Results and discussion
3.1. Extraction
Ethyl acetate is a popular extraction solvent in analysis methods for residues of pesticides in all kinds of samples, such as food, fruit, vegetables, water and soil. It is moderately polar and yields good recoveries even for more polar compounds
151. Anhydrous sodium sulphate was added during
extraction to reduce the amount of free water, to realize a certain desalting effect, and to achieve disintegration of the matrix. Except if an excess of sodium sulphate is added, the extracts are saturated with water.
In order to restrict the number of additional treatments, we used the untreated extracts.
3.2. Development of the HPLC clean-up
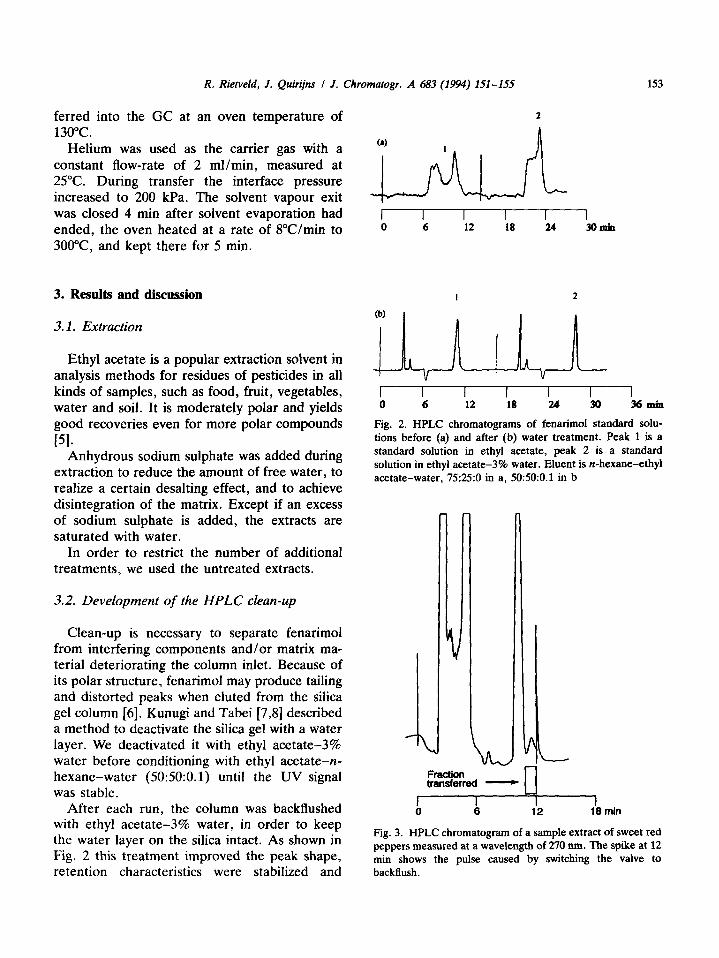
Clean-up is necessary to separate fenarimol from interfering components and/or matrix ma- terial deteriorating the column inlet. Because of its polar structure, fenarimol may produce tailing and distorted peaks when eluted from the silica gel column [6]. Kunugi and Tabei [7,8] described a method to deactivate the silica gel with a water layer. We deactivated it with ethyl acetate-3% water before conditioning with ethyl acetate-n- hexane-water (50:50:0.1) until the UV signal was stable.
After each run, the column was backflushed with ethyl acetate-3% water, in order to keep the water layer on the silica intact. As shown in Fig. 2 this treatment improved the peak shape, retention characteristics were stabilized and
5
r I I I I I I 0 6 12 18 24 30 36min
Fig. 2. HPLC chromatograms of fenarimol standard solu- tions before (a) and after (b) water treatment. Peak 1 is a standard solution in ethyl acetate, peak 2 is a standard solution in ethyl acetate-3% water. Eluent is n-hexane-ethyl acetate-water, 75250 in a, 5Oz5O:O.l in b
L
2 Il* min
Fig. 3. HPLC chromatogram of a sample extract of sweet red peppers measured at a wavelength of 270 nm. The spike at 12 min shows the pulse caused by switching the valve to backflush.
154
Table 1
R. Rietveld, J. Quirijns I J. Chromatogr. A 683 (1994) 151-155
Sensitivity and linear range of fenarimol on three GC detectors
Detector NPD FID ECD
Sensitivity in pg (S/N = 3) 250 50 10 Linear range ’ in mg/ kg sample 0.1-1.5 0.02-0.45 0.019-0.11
’ Based on a calibration solution of 0.0193 nglpl fenarimol and 20 ~1 injections on the HPLC
separation between fenarimol and the matrix components improved. Peak shape was also improved by the presence of water in the extract, so we added water to the standard solution to obtain the same water influence in both solu- tions, instead of drying the extract, in order to restrict the number of treatments.
To avoid shifting of retention times by tem- perature fluctuations in the lab the LC column was kept at 35°C. Fig. 3 shows a representative HPLC chromatogram.
3.3. Development of the GC method
Fenarimol is eluted at a column temperature of around 260°C which enables transfer by the loop-type interface. A major concern was dam- age of the retention gap by injecting water- containing LC-fractions. No deterioration of the retention gap or of the analytical column was observed however, after more than 50 injections of standards or extracts.
ri Concentratbn In nplrl
Fig. 4. Response curves of fenarimol (n = 3). n = FID, A = ECD.
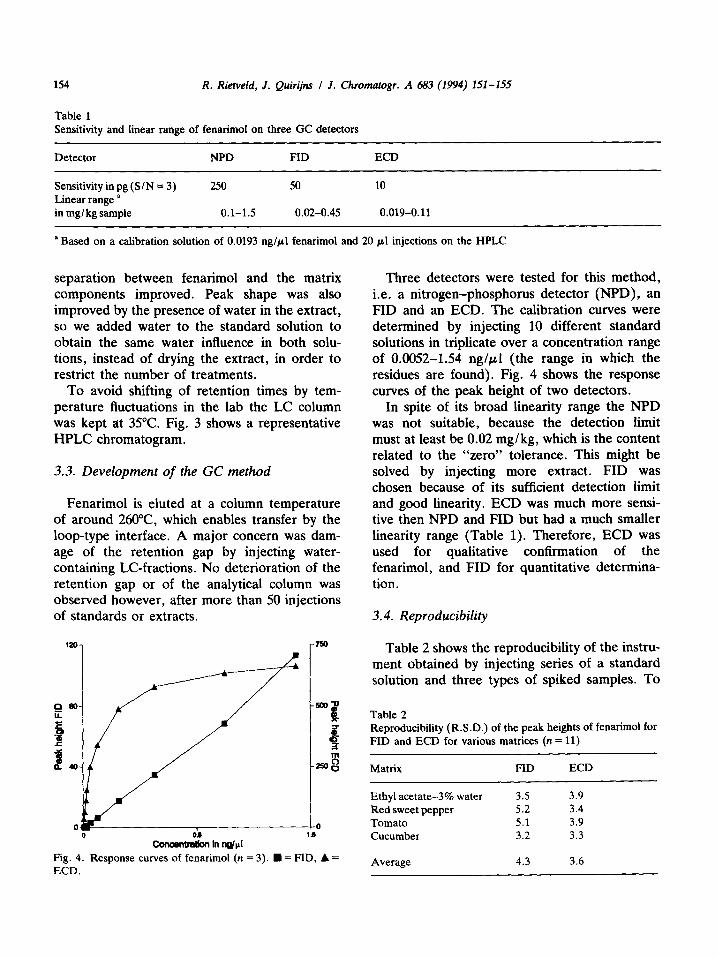
Three detectors were tested for this method, i.e. a nitrogen-phosphorus detector (NPD), an FID and an ECD. The calibration curves were determined by injecting 10 different standard solutions in triplicate over a concentration range of 0.0052-1.54 ng/pl (the range in which the residues are found). Fig. 4 shows the response curves of the peak height of two detectors.
In spite of its broad linearity range the NPD was not suitable, because the detection limit must at least be 0.02 mg/kg, which is the content related to the “zero” tolerance. This might be solved by injecting more extract. FID was chosen because of its sufficient detection limit and good linearity. ECD was much more sensi- tive then NPD and FID but had a much smaller linearity range (Table 1). Therefore, ECD was used for qualitative confirmation of the fenarimol, and FID for quantitative determina- tion.
3.4. Reproducibility
Table 2 shows the reproducibility of the instru- ment obtained by injecting series of a standard solution and three types of spiked samples. To
Table 2 Reproducibility (R.S.D.) of the peak heights of fenarimol for FID and ECD for various matrices (n = 11)
Matrix FID ECD
Ethyl acetate-3% water 3.5 3.9 Red sweet pepper 5.2 3.4 Tomato 5.1 3.9 Cucumber 3.2 3.3
Average 4.3 3.6
R. Rietveld, J. Quirijns f J. Chromatogr. A 683 (1994) 151-155
Table 3 Mean recoveries and R.S.D.s of fenarimol in fruiting vegetables (n = 2)
Fortification level 0.019 mglkg 0.039 mg/kg 0.19 mglkg
Dectector FID ECD FID ECD FID ECD’
155
Red sweet pepper 89 103 89 93 92 60 Tomato 90 104 110 111 103 67 Cucumber 76 % 95 99 96 62 Average 85 101 98 101 97 63 RSD 11 6 12 10 7 7
‘Beyond the linear range
1480 ~1 of ethyl acetate-3% water or extract, 20 ~1 of 3.86 nglpl fenarimol in n-hexane was added in an autosampler vial; this corresponds to 0.1 mg/kg fenarimol in a sample. R.S.D. values of 3-5% are good, especially if it is taken into account that the reported figures also include variation upon preparing the solutions in the vials.
FID
15 20 Time (min)
i 5 10 15 20 25 30
Time (min)
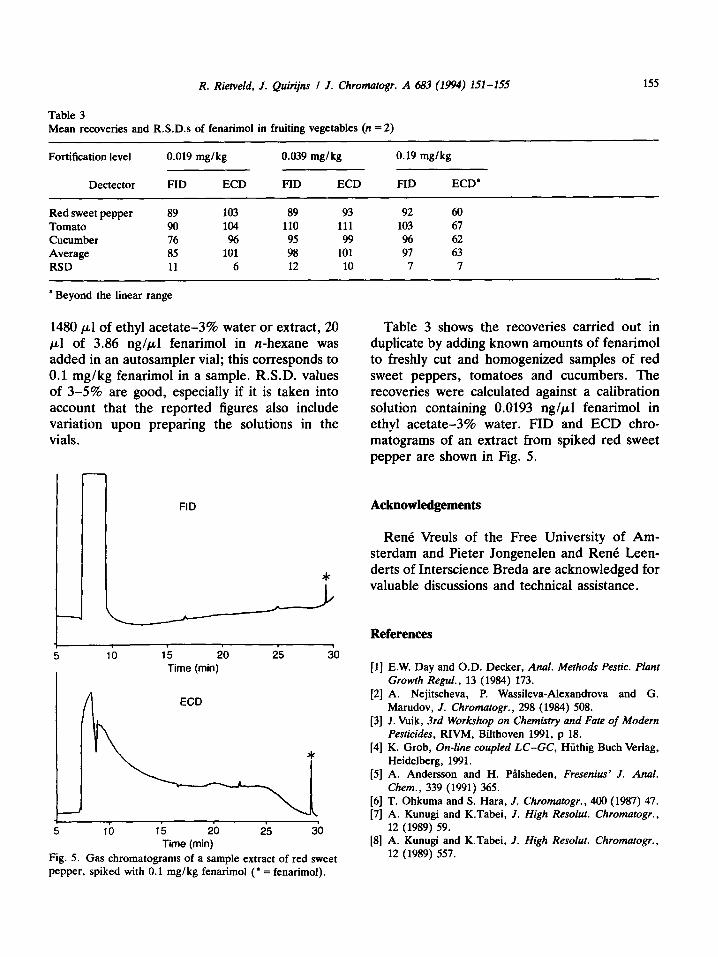
Fig. 5. Gas chromatograms of a sample extract of red sweet pepper, spiked with 0.1 mg/kg fenarimol (* = fenarimol).
Table 3 shows the recoveries carried out in duplicate by adding known amounts of fenarimol to freshly cut and homogenized samples of red sweet peppers, tomatoes and cucumbers. The recoveries were calculated against a calibration solution containing 0.0193 nglpl fenarimol in ethyl acetate-3% water. FID and ECD chro- matograms of an extract from spiked red sweet pepper are shown in Fig. 5.
Acknowledgements
RenC Vreuls of the Free University of Am- sterdam and Pieter Jongenelen and RenC Leen- derts of Interscience Breda are acknowledged for valuable discussions and technical assistance.
References
VI
121
[31
[41
PI
;;I
PI
E.W. Day and O.D. Decker, Anal. Methods Pestic. Plant Growth Regul., 13 (1984) 173. A. Nejitscheva, P. Wassileva-Alexandrova and G. Marudov, J. Chromatogr., 298 (1984) 508. J. Vuik, 3rd Workshop on Chemistry and Fate of Modern Pesticides, RIVM, Bihhoven 1991, p 18. K. Grob, On-line coupled LC-GC, Hiithig Buch Verlag, Heidelberg, 1991. A. Andersson and H. PHlsheden, Fresenius’ J. Anal. Chem., 339 (1991) 365. T. Ohkuma and S. Hara, J. Chromatogr., 400 (1987) 47. A. Kunugi and K.Tabei, J. High Resolut. Chromatogr., 12 (1989) 59. A. Kunugi and K.Tabei, J. High Resolut. Chromatogr., 12 (1989) 557.