Embed Size (px)
Citation preview
© Erik Hollnagel, 2010
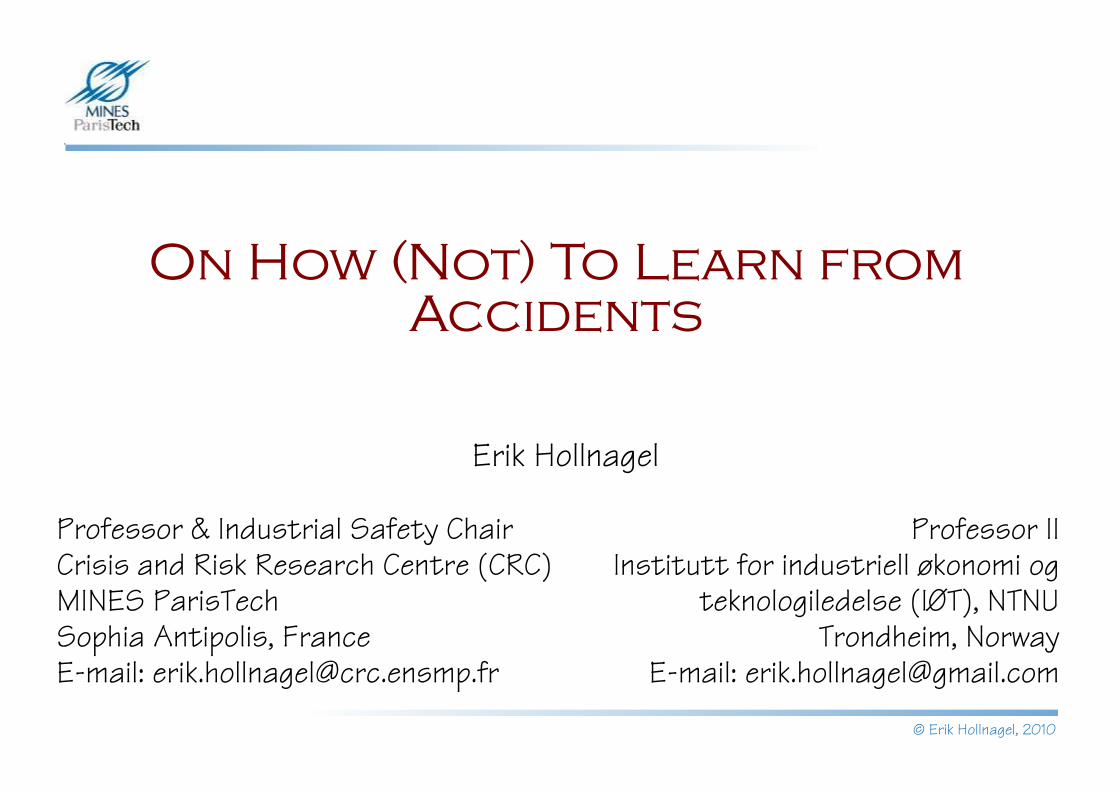
On How (Not) To Learn from Accidents
Professor & Industrial Safety ChairCrisis and Risk Research Centre (CRC)MINES ParisTechSophia Antipolis, FranceE-mail: [email protected]
Erik Hollnagel
Professor IIInstitutt for industriell økonomi og
teknologiledelse (IØT), NTNUTrondheim, Norway
E-mail: [email protected]
© Erik Hollnagel, 2010
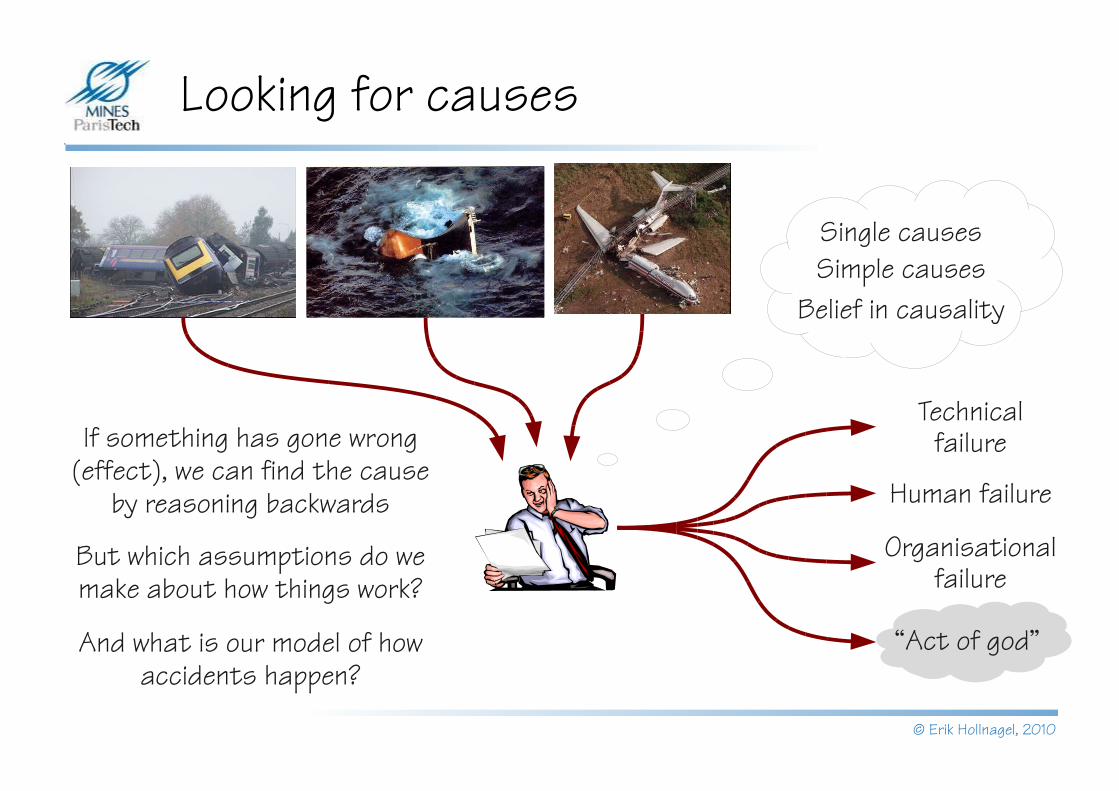
Looking for causes
Technical failure
Human failure
Organisational failure
“Act of god”
If something has gone wrong (effect), we can find the cause
by reasoning backwards
But which assumptions do we make about how things work?
Single causesSimple causes
Belief in causality
And what is our model of how accidents happen?
© Erik Hollnagel, 2010
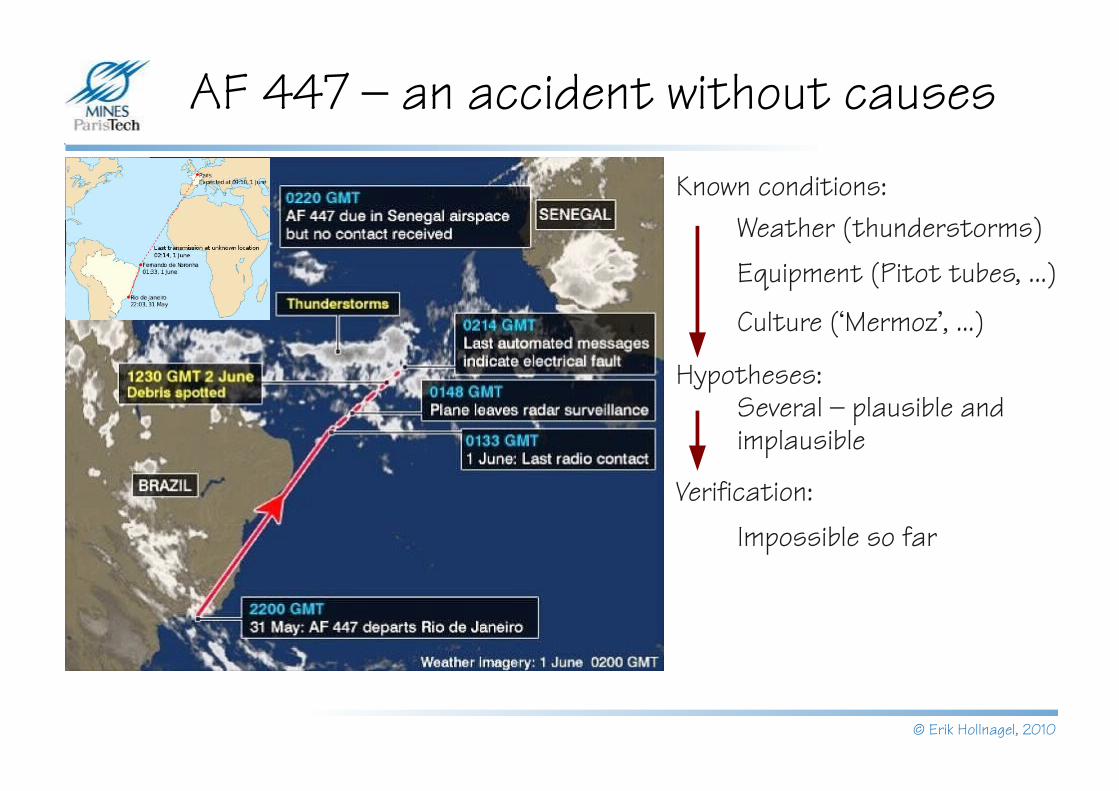
AF 447 – an accident without causes
Known conditions:Weather (thunderstorms)Equipment (Pitot tubes, ...)
Culture (‘Mermoz’, ...)
Hypotheses:Several – plausible and implausible
Verification:Impossible so far
© Erik Hollnagel, 2010
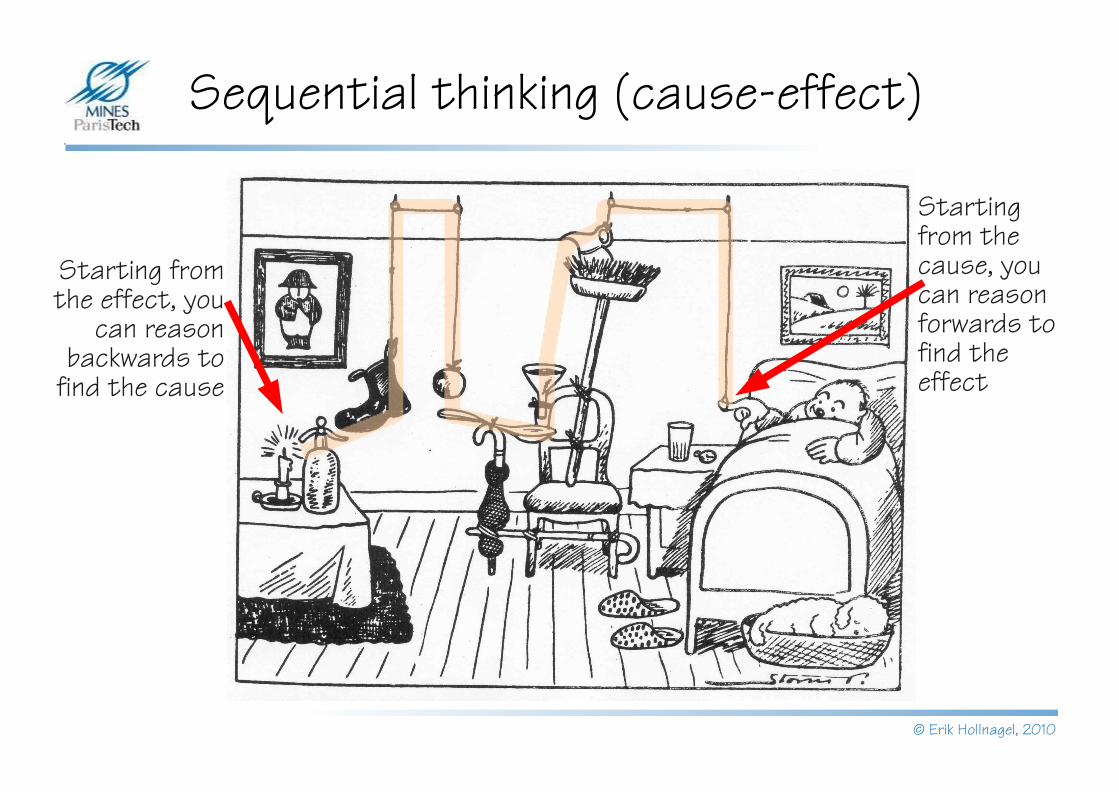
Sequential thinking (cause-effect)
Starting from the effect, you
can reason backwards to
find the cause
Starting from the cause, you can reason forwards to find the effect

© Erik Hollnagel, 2010
Causality in simple systems
If a physician make a large incision with an operating knife and cure it, or if he open a tumor (over the eye) with an operating knife, and saves the eye, he shall receive ten shekels in money. If the patient be a freed man, he receives five shekels. If he be the slave of some one, his owner shall give the physician two shekels.
If a physician make a large incision with the operating knife, and kill him, or open a tumor with the operating knife, and cut out the eye, his hands shall be cut off. If a physician make a large incision in the slave of a freed man, and kill him, he shall replace the slave with another slave. If he had opened a tumor with the operating knife, and put out his eye, he shall pay half his value.
If a physician heal the broken bone or diseased soft part of a man, the patient shall pay the physician five shekels in money. If he were a freed man he shall pay three shekels. If he were a slave his owner shall pay the physician two shekels.
© Erik Hollnagel, 2010
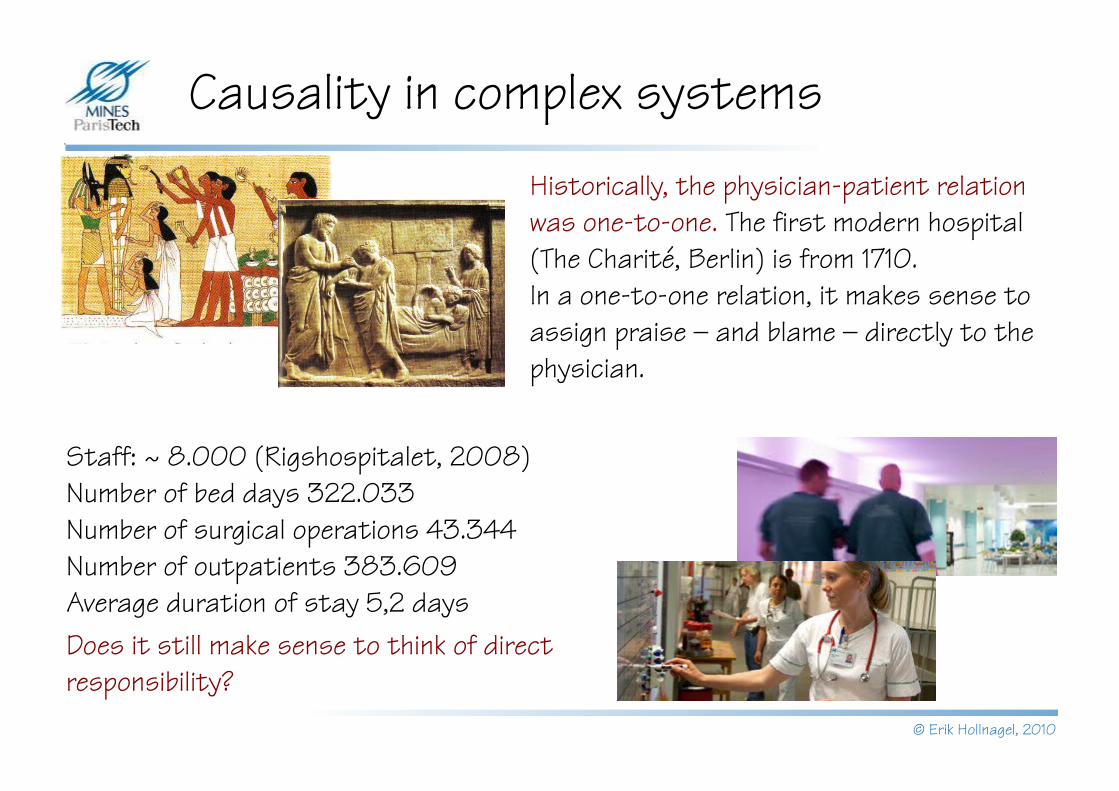
Causality in complex systems
Historically, the physician-patient relation was one-to-one. The first modern hospital (The Charité, Berlin) is from 1710. In a one-to-one relation, it makes sense to assign praise – and blame – directly to the physician.
Staff: ~ 8.000 (Rigshospitalet, 2008)Number of bed days 322.033Number of surgical operations 43.344Number of outpatients 383.609Average duration of stay 5,2 daysDoes it still make sense to think of direct responsibility?
© Erik Hollnagel, 2010
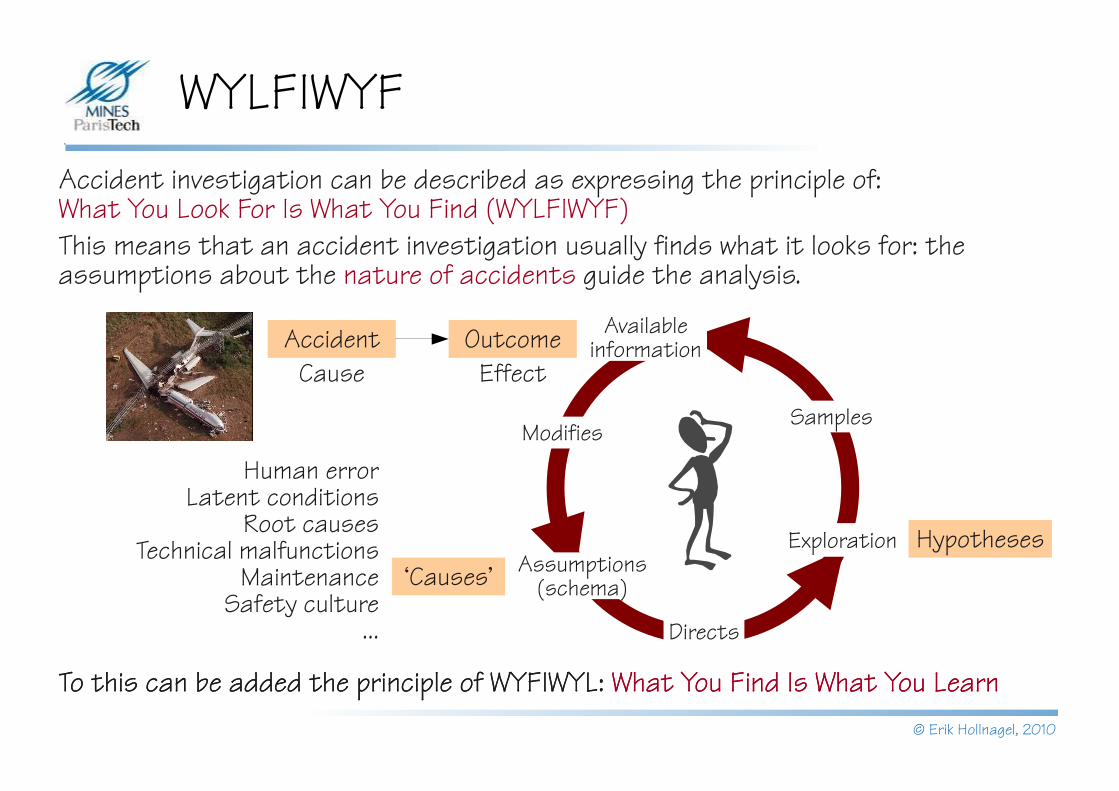
WYLFIWYFAccident investigation can be described as expressing the principle of: What You Look For Is What You Find (WYLFIWYF)This means that an accident investigation usually finds what it looks for: the assumptions about the nature of accidents guide the analysis.
To this can be added the principle of WYFIWYL: What You Find Is What You Learn
Outcome
Directs
SamplesModifies
Assumptions (schema)
Exploration
Available information
Hypotheses‘Causes’
Human errorLatent conditions
Root causesTechnical malfunctions
MaintenanceSafety culture
...
To this can be added the principle of WYFIWYL: What You Find Is What You Learn
AccidentEffectCause
© Erik Hollnagel, 2010
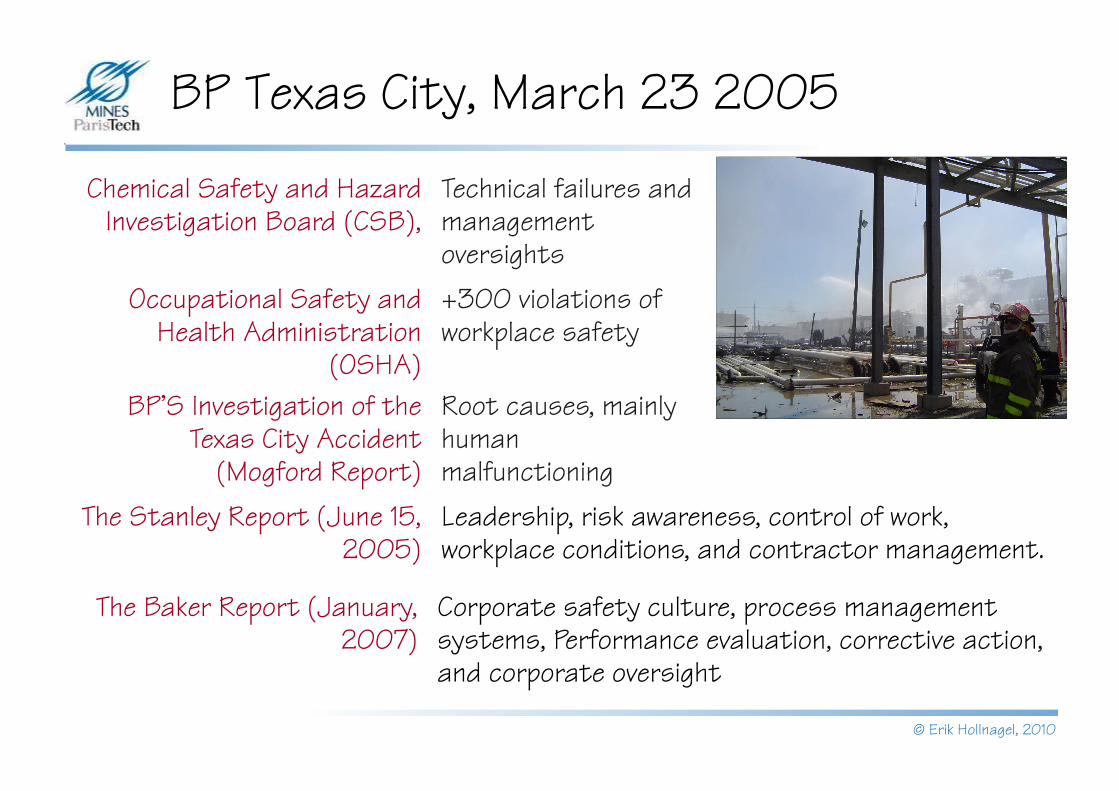
BP Texas City, March 23 2005
Chemical Safety and Hazard Investigation Board (CSB),
Technical failures and management oversights
Occupational Safety and Health Administration
(OSHA)
+300 violations of workplace safety
BP'S Investigation of the Texas City Accident
(Mogford Report)
Root causes, mainly human malfunctioning
The Stanley Report (June 15, 2005)
Leadership, risk awareness, control of work, workplace conditions, and contractor management.
The Baker Report (January, 2007)
Corporate safety culture, process management systems, Performance evaluation, corrective action, and corporate oversight
© Erik Hollnagel, 2010
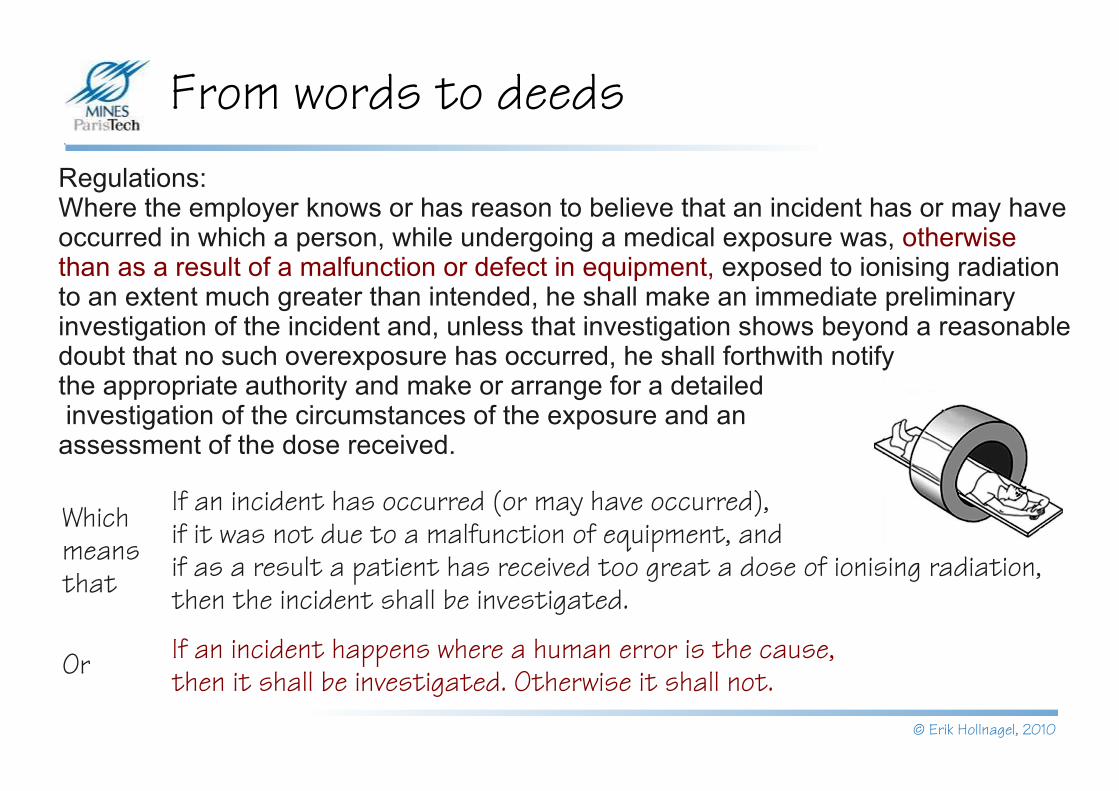
From words to deedsRegulations:Where the employer knows or has reason to believe that an incident has or may have occurred in which a person, while undergoing a medical exposure was, otherwise than as a result of a malfunction or defect in equipment, exposed to ionising radiation to an extent much greater than intended, he shall make an immediate preliminary investigation of the incident and, unless that investigation shows beyond a reasonable doubt that no such overexposure has occurred, he shall forthwith notify the appropriate authority and make or arrange for a detailed investigation of the circumstances of the exposure and an assessment of the dose received.
If an incident has occurred (or may have occurred),if it was not due to a malfunction of equipment, andif as a result a patient has received too great a dose of ionising radiation, then the incident shall be investigated.
Which means that
If an incident happens where a human error is the cause, then it shall be investigated. Otherwise it shall not.Or

© Erik Hollnagel, 2010
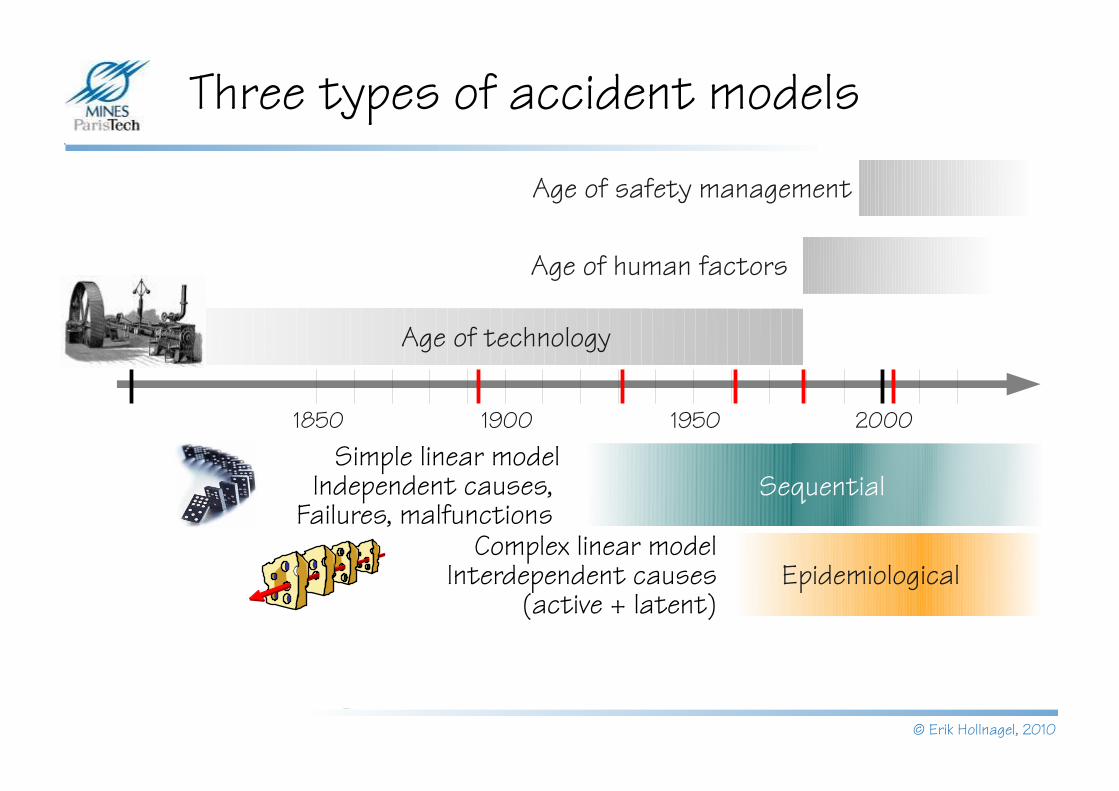
Three types of accident models
2000195019001850
Age of technology
Age of human factors
Age of safety management
Sequential
Non-linear modelTight couplings, coincidences,
resonance, emergence
EpidemiologicalComplex linear model
Interdependent causes (active + latent)
Simple linear modelIndependent causes,
Failures, malfunctions
SystemicCertificationI
P
C
O
R
TFAA
LubricationI
P
C
O
R
T
Mechanics
High workload
Grease
Maintenance oversight
I
P
C
O
R
T
Interval approvals
Horizontal stabilizer
movementI
P
C
O
R
TJackscrew up-down
movementI
P
C
O
R
T
Expertise
Controlledstabilizer
movement
Aircraft design
I
P
C
O
R
T
Aircraft design knowledge
Aircraft pitch controlI
P
C
O
R
T
Limiting stabilizer
movementI
P
C
O
R
T
Limitedstabilizer
movement
Aircraft
Lubrication
End-play checking
I
P
C
O
R
T
Allowableend-play
Jackscrew replacement
I
P
C
O
R
T
Excessiveend-play
High workload
Equipment Expertise
Interval approvals
Redundantdesign
Procedures
Procedures
© Erik Hollnagel, 2010
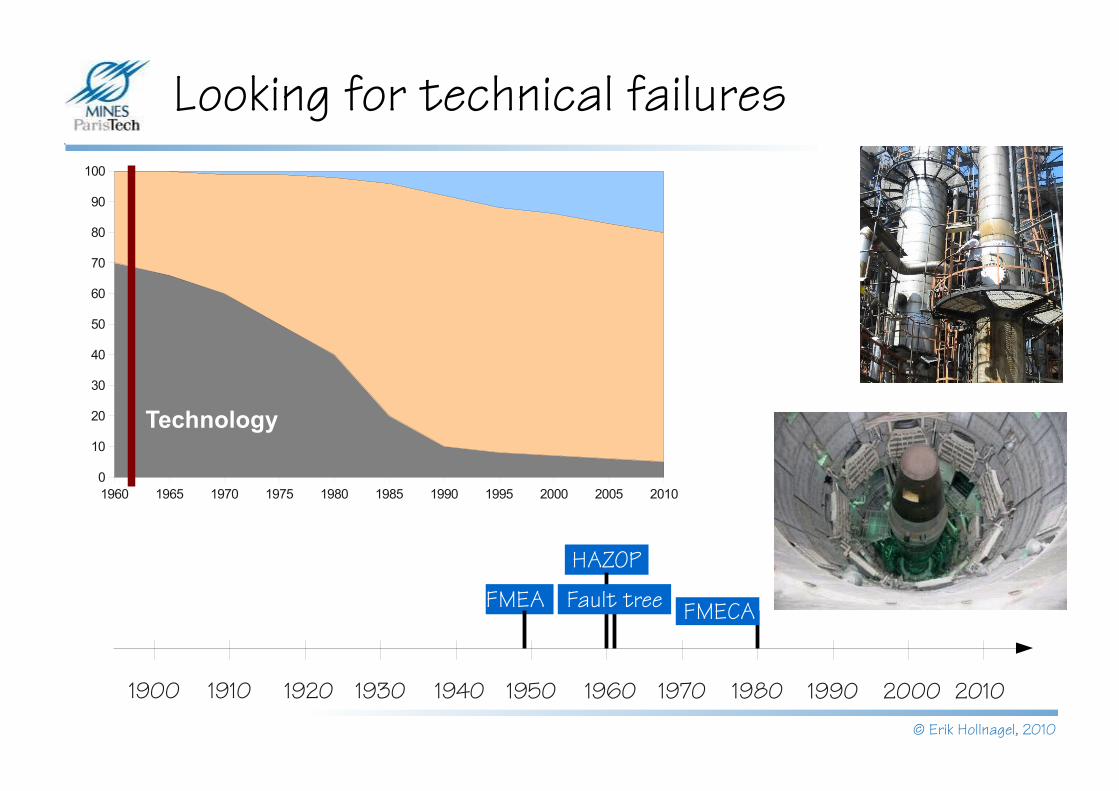
Looking for technical failures
1900 1910 1920 1930 1940 1950 1960 1970 1980 1990 2000 2010
FMEA
HAZOP
Fault tree FMECA
1960 1965 1970 1975 1980 1985 1990 1995 2000 2005 20100
10
20
30
40
50
60
70
80
90
100
Technology
© Erik Hollnagel, 2010
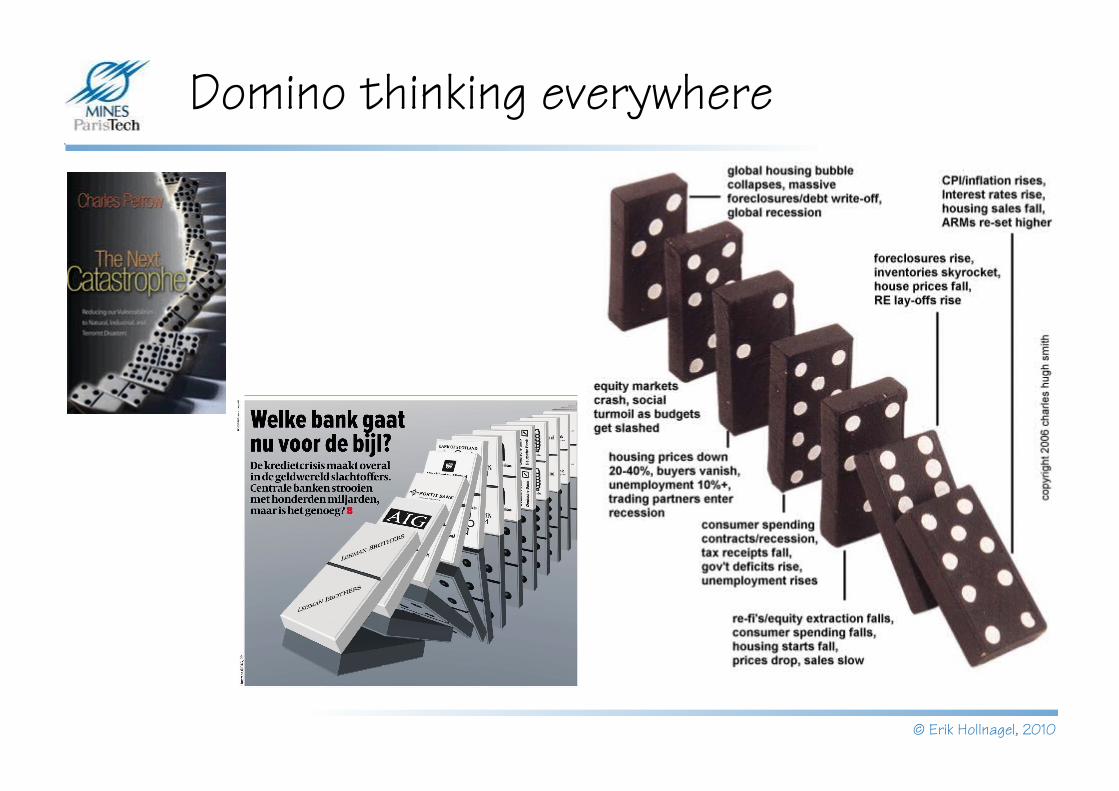
Domino thinking everywhere
© Erik Hollnagel, 2010
SystemicNon-linear model
Tight couplings, coincidences, resonance, emergence
CertificationI
P
C
O
R
TFAA
LubricationI
P
C
O
R
T
Mechanics
High workload
Grease
Maintenance oversight
I
P
C
O
R
T
Interval approvals
Horizontal stabilizer
movementI
P
C
O
R
TJackscrew up-down
movementI
P
C
O
R
T
Expertise
Controlledstabilizer
movement
Aircraft design
I
P
C
O
R
T
Aircraft design knowledge
Aircraft pitch controlI
P
C
O
R
T
Limiting stabilizer
movementI
P
C
O
R
T
Limitedstabilizer
movement
Aircraft
Lubrication
End-play checking
I
P
C
O
R
T
Allowableend-play
Jackscrew replacement
I
P
C
O
R
T
Excessiveend-play
High workload
Equipment Expertise
Interval approvals
Redundantdesign
Procedures
Procedures
Three types of accident models
2000195019001850
Age of technology
Age of human factors
Age of safety management
Sequential
EpidemiologicalComplex linear model
Interdependent causes (active + latent)
Simple linear modelIndependent causes,
Failures, malfunctions
© Erik Hollnagel, 2010
FMEA
HAZOP
Fault tree FMECA
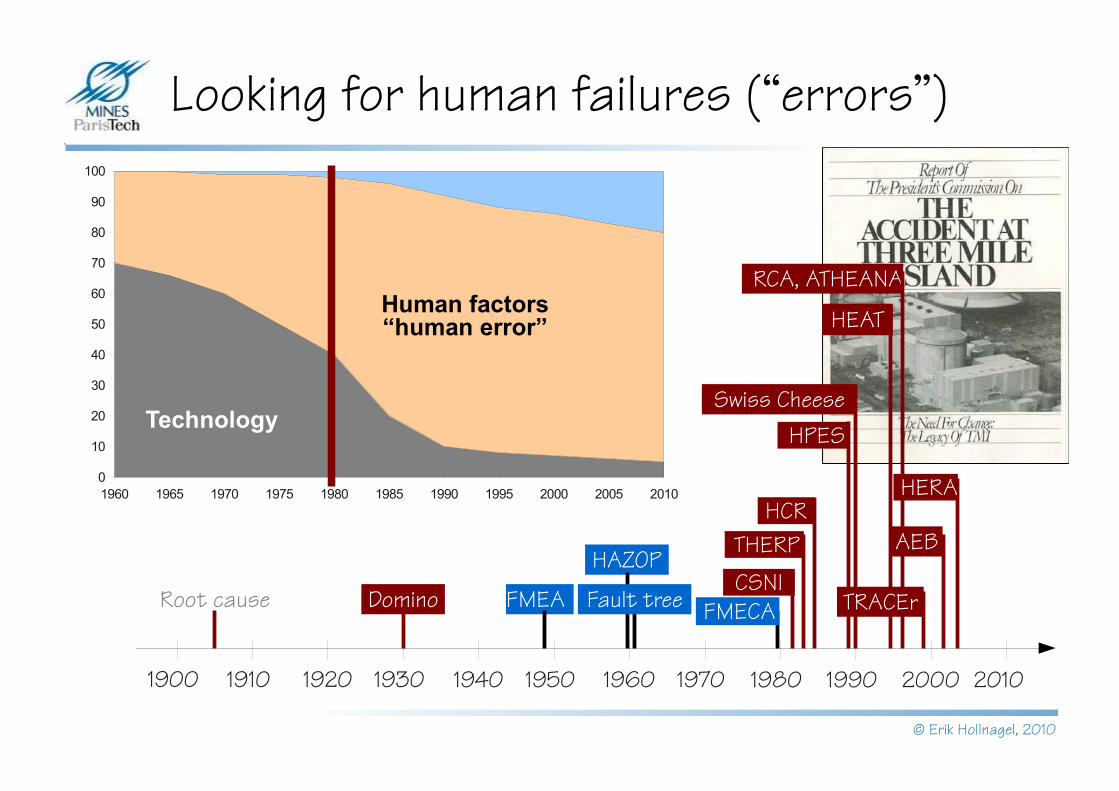
Looking for human failures (“errors”)
Root causeCSNI
HCRTHERP
Domino
HPESSwiss Cheese
RCA, ATHEANA
HEAT
AEB
HERA
TRACEr
1960 1965 1970 1975 1980 1985 1990 1995 2000 2005 20100
10
20
30
40
50
60
70
80
90
100
Technology
Human factors“human error”
1900 1910 1920 1930 1940 1950 1960 1970 1980 1990 2000 2010
© Erik Hollnagel, 2010
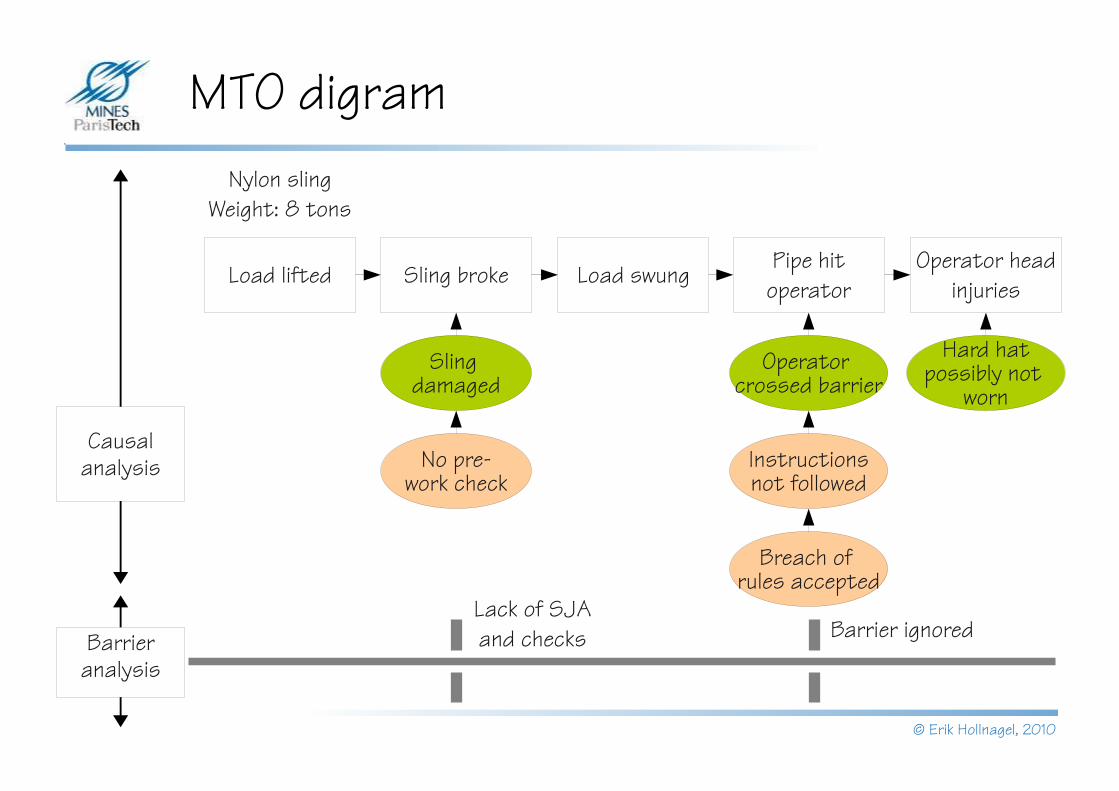
MTO digram
Load lifted Sling broke Load swung Pipe hit operator
Operator head injuries
Sling damaged
No pre-work check
Operator crossed barrier
Instructionsnot followed
Hard hatpossibly not
worn
Breach of rules accepted
Nylon slingWeight: 8 tons
Causal analysis
Lack of SJA and checks Barrier ignoredBarrier
analysis

© Erik Hollnagel, 2010
SystemicNon-linear model
Tight couplings, coincidences, resonance, emergence
CertificationI
P
C
O
R
TFAA
LubricationI
P
C
O
R
T
Mechanics
High workload
Grease
Maintenance oversight
I
P
C
O
R
T
Interval approvals
Horizontal stabilizer
movementI
P
C
O
R
TJackscrew up-down
movementI
P
C
O
R
T
Expertise
Controlledstabilizer
movement
Aircraft design
I
P
C
O
R
T
Aircraft design knowledge
Aircraft pitch controlI
P
C
O
R
T
Limiting stabilizer
movementI
P
C
O
R
T
Limitedstabilizer
movement
Aircraft
Lubrication
End-play checking
I
P
C
O
R
T
Allowableend-play
Jackscrew replacement
I
P
C
O
R
T
Excessiveend-play
High workload
Equipment Expertise
Interval approvals
Redundantdesign
Procedures
Procedures
Three types of accident models
2000195019001850
Age of technology
Age of human factors
Age of safety management
Sequential
EpidemiologicalComplex linear model
Interdependent causes (active + latent)
Simple linear modelIndependent causes,
Failures, malfunctions
© Erik Hollnagel, 2010
CSNI
HCRTHERP
Domino
HPESSwiss Cheese
RCA, ATHEANA
HEAT
AEB
HERA
TRACEr
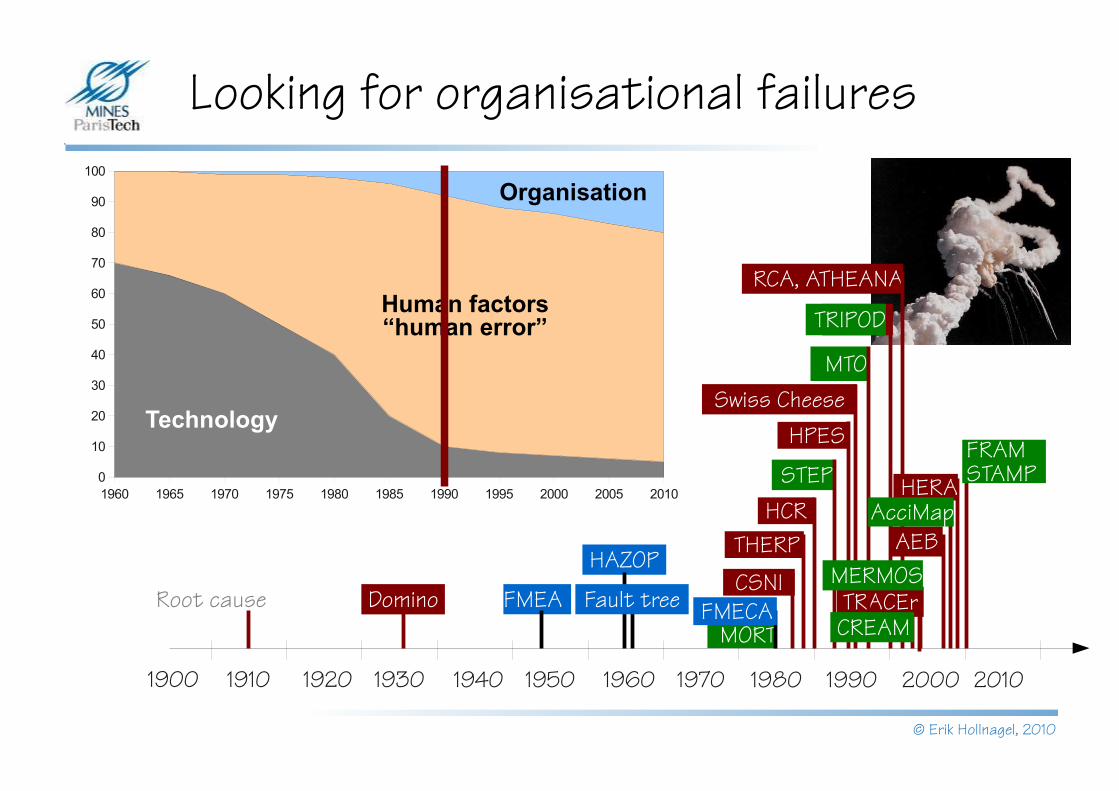
Looking for organisational failures
Root cause
MTO
TRIPOD
MORT
STEPFRAMSTAMP
CREAM
MERMOS
AcciMap1960 1965 1970 1975 1980 1985 1990 1995 2000 2005 20100
10
20
30
40
50
60
70
80
90
100
Technology
Human factors“human error”
Organisation
1900 1910 1920 1930 1940 1950 1960 1970 1980 1990 2000 2010
FMEA
HAZOP
Fault tree FMECA
© Erik Hollnagel, 2010
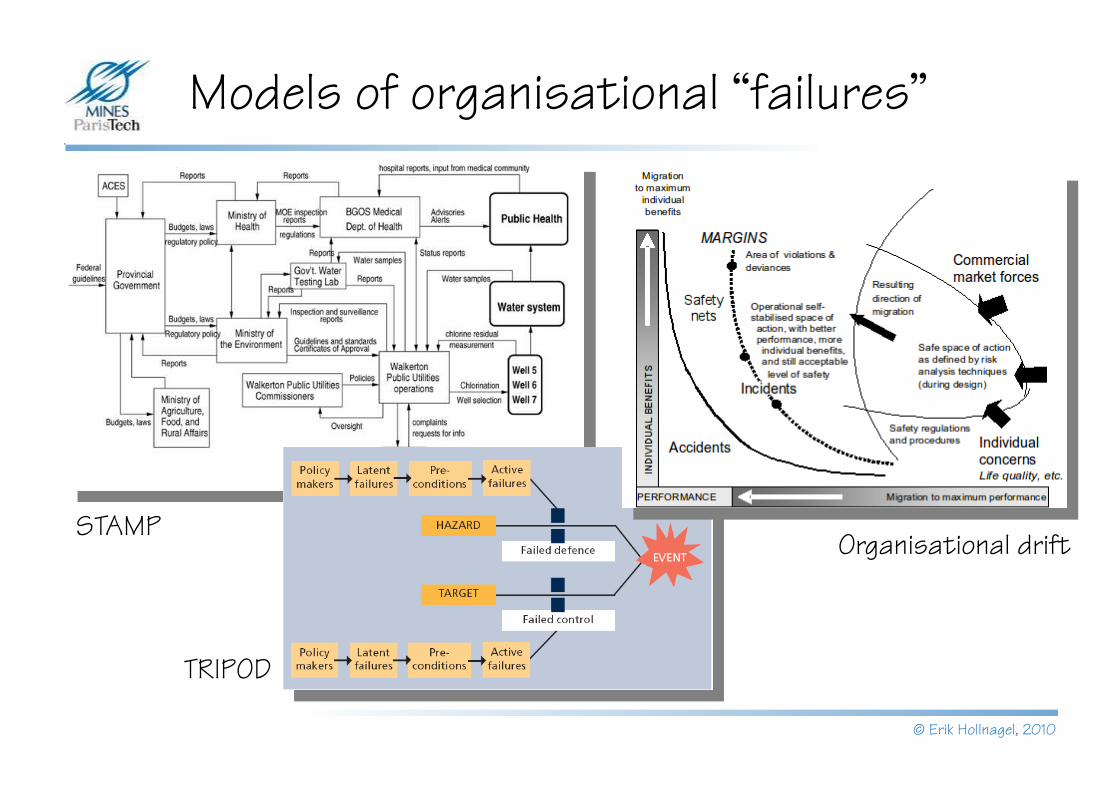
Models of organisational “failures”
STAMP
TRIPOD
Organisational drift

© Erik Hollnagel, 2010
Normal accident theory (1984)
“On the whole, we have complex systems because we don’t know how to produce the output through linear systems.”
© Erik Hollnagel, 2010
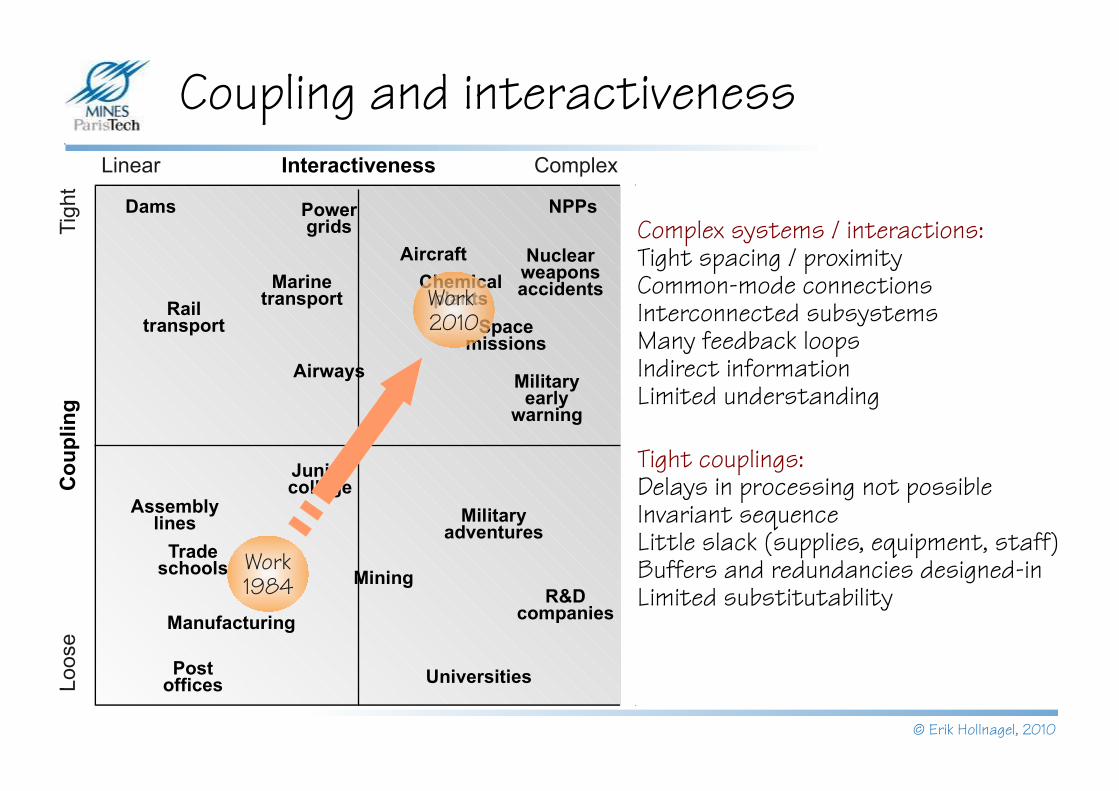
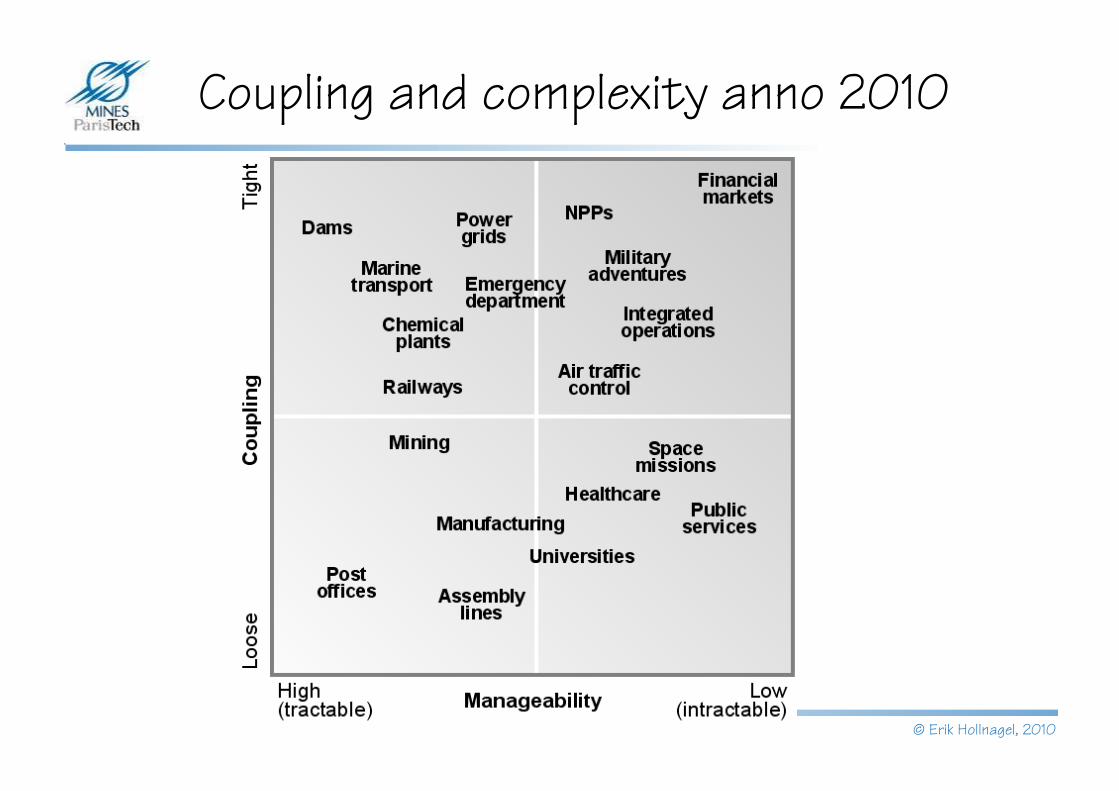
Coupling and interactiveness
Dams Power grids
NPPs
Rail transport
Aircraft
Space missions
Nuclear weapons accidentsChemical
plantsMarine
transport
Airways Military early
warning
Military adventures
Mining
Universities
R&D companies
Assembly lines
Junior college
Trade schools
Post offices
Manufacturing
Interactiveness
Co
up
ling
Linear Complex
Tig
htLo
ose
Complex systems / interactions:Tight spacing / proximityCommon-mode connectionsInterconnected subsystemsMany feedback loopsIndirect informationLimited understanding
Tight couplings:Delays in processing not possibleInvariant sequenceLittle slack (supplies, equipment, staff)Buffers and redundancies designed-inLimited substitutability
Work 1984
Work 2010
© Erik Hollnagel, 2010
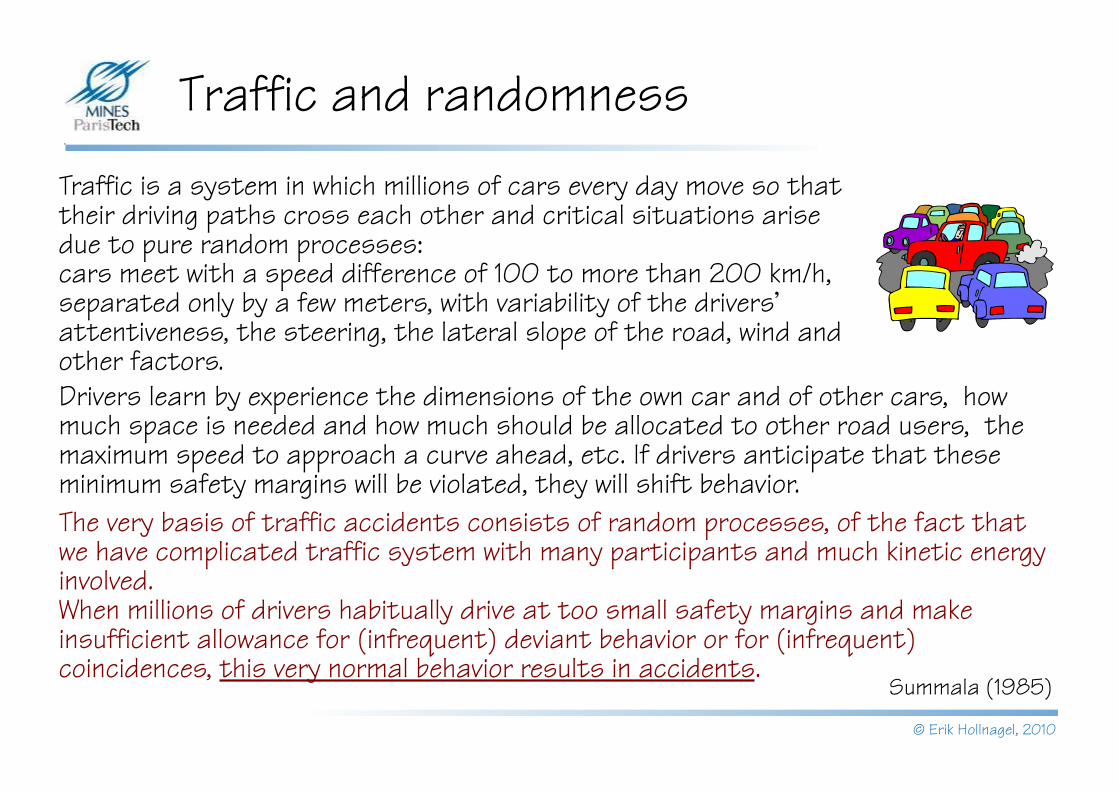
Traffic and randomness
Traffic is a system in which millions of cars every day move so that their driving paths cross each other and critical situations arise due to pure random processes:cars meet with a speed difference of 100 to more than 200 km/h, separated only by a few meters, with variability of the drivers' attentiveness, the steering, the lateral slope of the road, wind and other factors. Drivers learn by experience the dimensions of the own car and of other cars, how much space is needed and how much should be allocated to other road users, the maximum speed to approach a curve ahead, etc. If drivers anticipate that these minimum safety margins will be violated, they will shift behavior.The very basis of traffic accidents consists of random processes, of the fact that we have complicated traffic system with many participants and much kinetic energy involved. When millions of drivers habitually drive at too small safety margins and make insufficient allowance for (infrequent) deviant behavior or for (infrequent) coincidences, this very normal behavior results in accidents.
Summala (1985)
© Erik Hollnagel, 2010
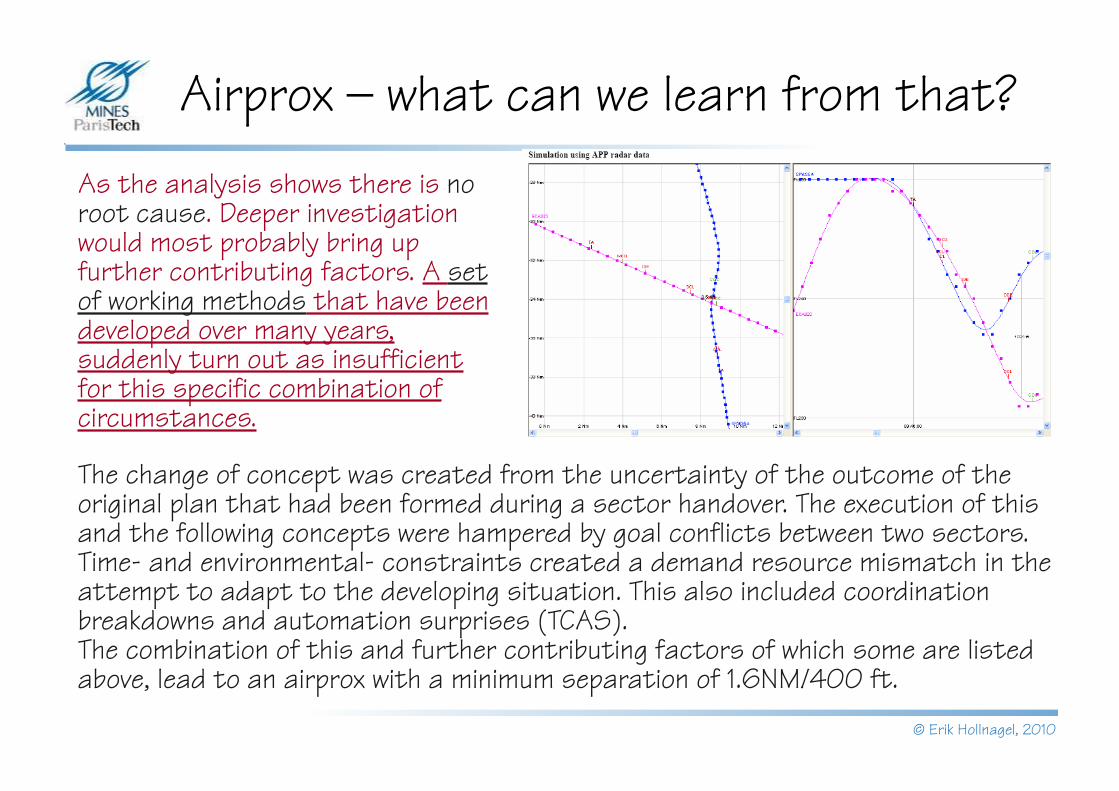
Airprox – what can we learn from that?As the analysis shows there is no root cause. Deeper investigation would most probably bring up further contributing factors. A set of working methods that have been developed over many years, suddenly turn out as insufficient for this specific combination of circumstances.
The change of concept was created from the uncertainty of the outcome of the original plan that had been formed during a sector handover. The execution of this and the following concepts were hampered by goal conflicts between two sectors. Time- and environmental- constraints created a demand resource mismatch in the attempt to adapt to the developing situation. This also included coordination breakdowns and automation surprises (TCAS).The combination of this and further contributing factors of which some are listed above, lead to an airprox with a minimum separation of 1.6NM/400 ft.
© Erik Hollnagel, 2010
Coupling and complexity anno 2010
© Erik Hollnagel, 2010
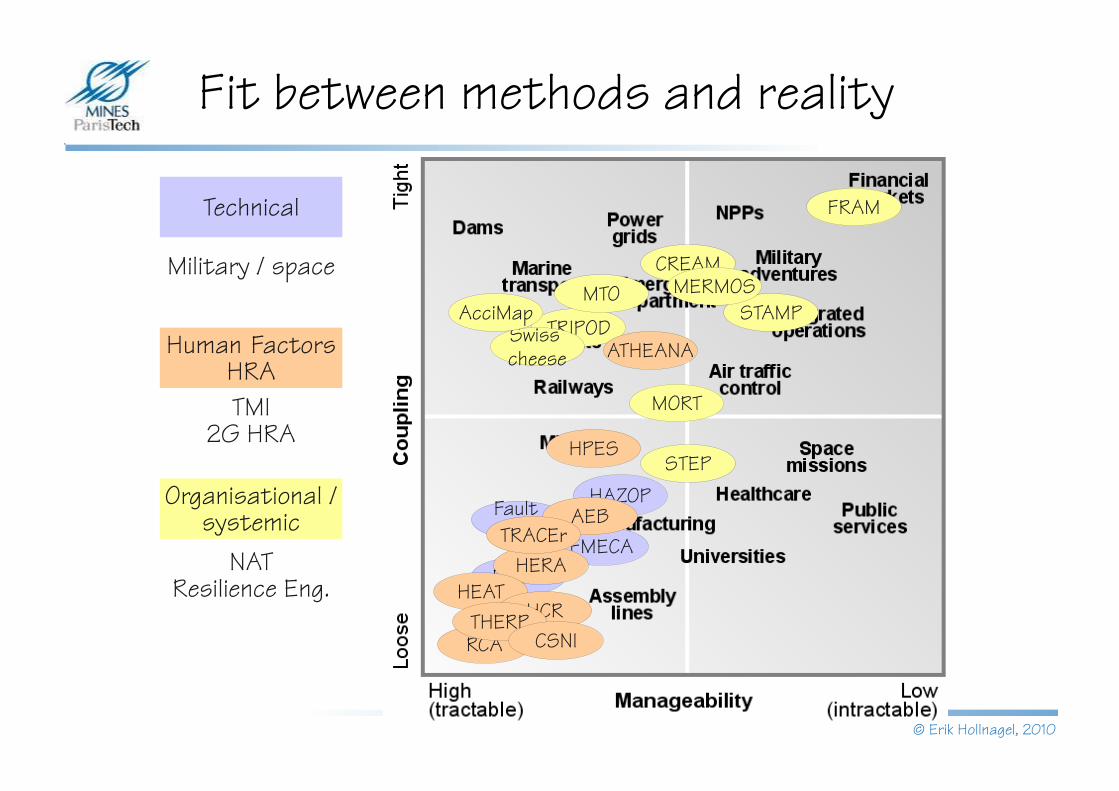
Fit between methods and reality
FMECA
Fault tree
HAZOP
FMEA
STEP
MORT
TRIPOD
MTO
Swiss cheese
AcciMap
CREAM
FRAM
STAMPMERMOS
HERA
AEB
RCA
ATHEANA
HEATHCR
HPES
THERPCSNI
TRACEr
Technical
Human FactorsHRA
Organisational / systemic
Military / space
TMI2G HRA
NATResilience Eng.
© Erik Hollnagel, 2010
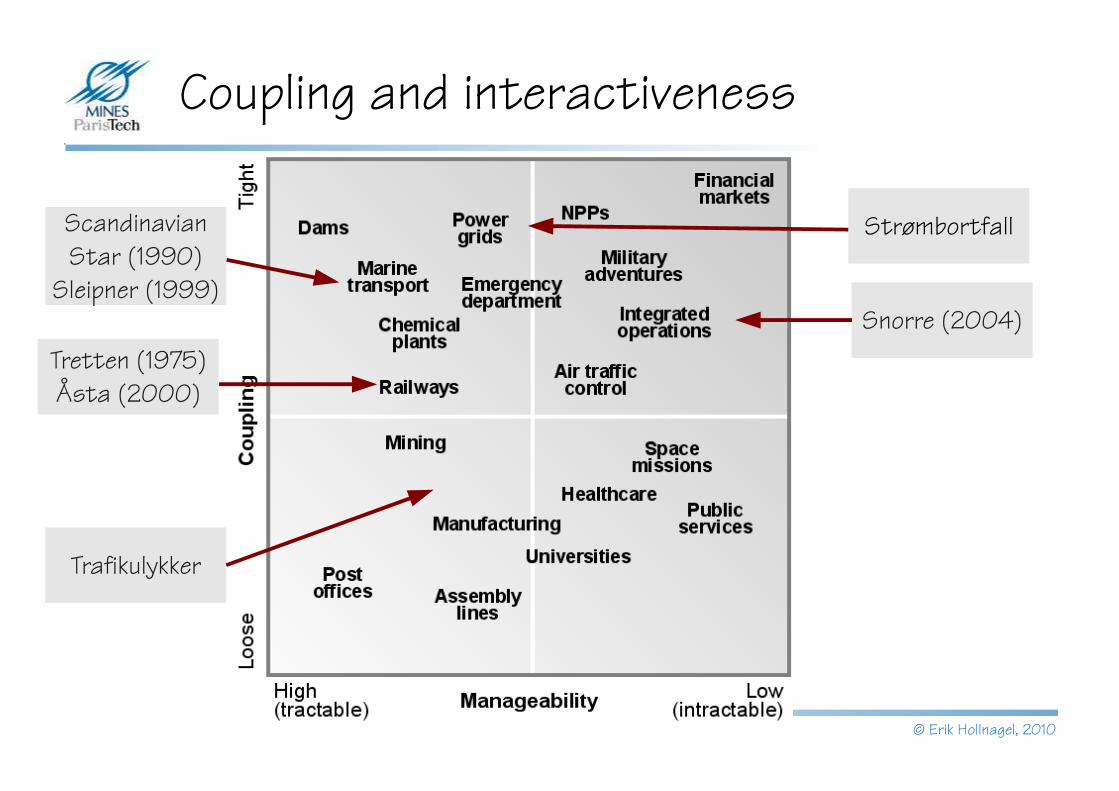
Coupling and interactiveness
Snorre (2004)
Scandinavian Star (1990)
Sleipner (1999)
Strømbortfall
Tretten (1975)Åsta (2000)
Trafikulykker

© Erik Hollnagel, 2010
Non-linear accident models
Accident models go beyond simple cause-
effect relations
Causes are not found but
constructed
Systems try to balance efficiency
and thoroughness
Accidents result from alignment of conditions and occurrences.Human actions cannot be understood in isolation
More important to understand nature of system dynamics (variability) than to model individual technological or human failures.
System as a whole adjusts to absorb normal performance adjustments (dynamic accommodation) based on experience.
Accidents are consequences of normal adjustments, rather than of failures. Without such adjustments, systems would not work
Accidents are emergent
CertificationI
P
C
O
R
TFAA
LubricationI
P
C
O
R
T
Mechanics
High workload
Grease
Maintenance oversight
I
P
C
O
R
T
Interval approvals
Horizontal stabilizer
movementI
P
C
O
R
TJackscrew up-down
movementI
P
C
O
R
T
Expertise
Controlledstabilizer
movement
Aircraft design
I
P
C
O
R
T
Aircraft design knowledge
Aircraft pitch control
I
P
C
O
R
T
Limiting stabilizer
movementI
P
C
O
R
T
Limitedstabilizer
movement
Aircraft
Lubrication
End-play checking
I
P
C
O
R
T
Allowableend-play
Jackscrew replacement
I
P
C
O
R
T
Excessiveend-play
High workload
Equipment Expertise
Interval approvals
Redundantdesign
Procedures
Procedures
© Erik Hollnagel, 2010
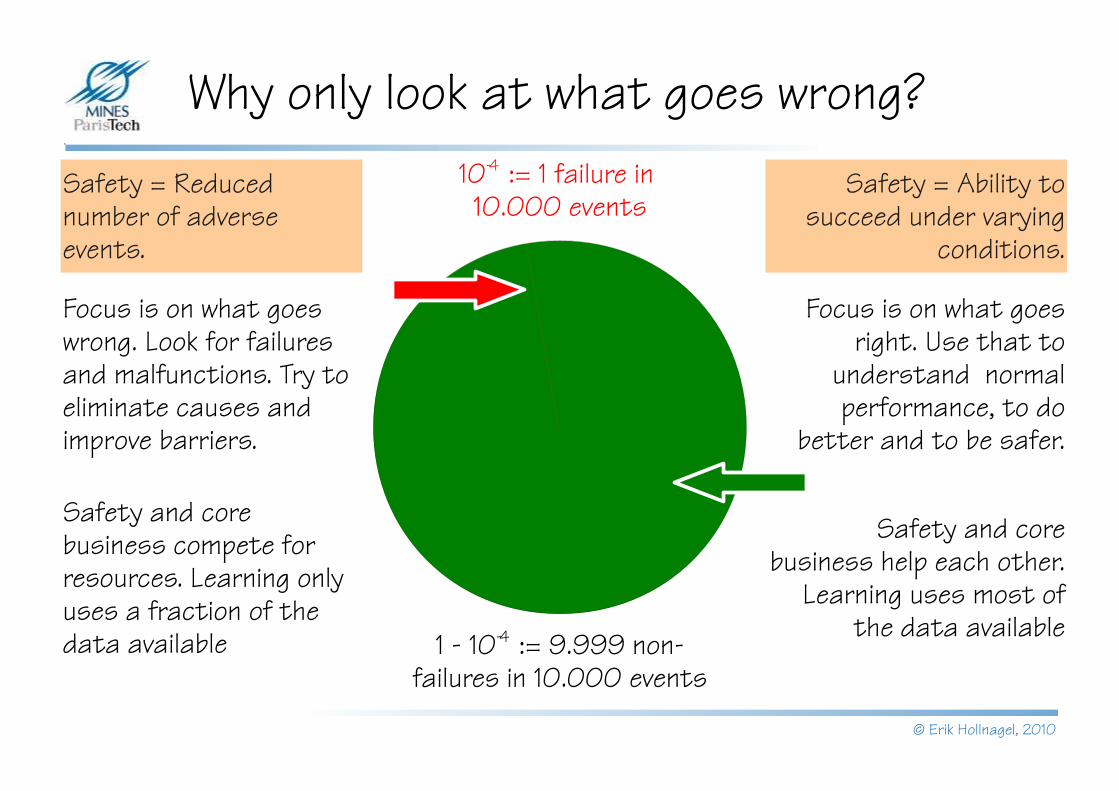
Why only look at what goes wrong?
Focus is on what goes wrong. Look for failures and malfunctions. Try to eliminate causes and improve barriers.
Focus is on what goes right. Use that to
understand normal performance, to do
better and to be safer.
Safety = Reduced number of adverse events.
10-4 := 1 failure in 10.000 events
1 - 10-4 := 9.999 non-failures in 10.000 events
Safety and core business help each other.
Learning uses most of the data available
Safety and core business compete for resources. Learning only uses a fraction of the data available
Safety = Ability to succeed under varying
conditions.
© Erik Hollnagel, 2010
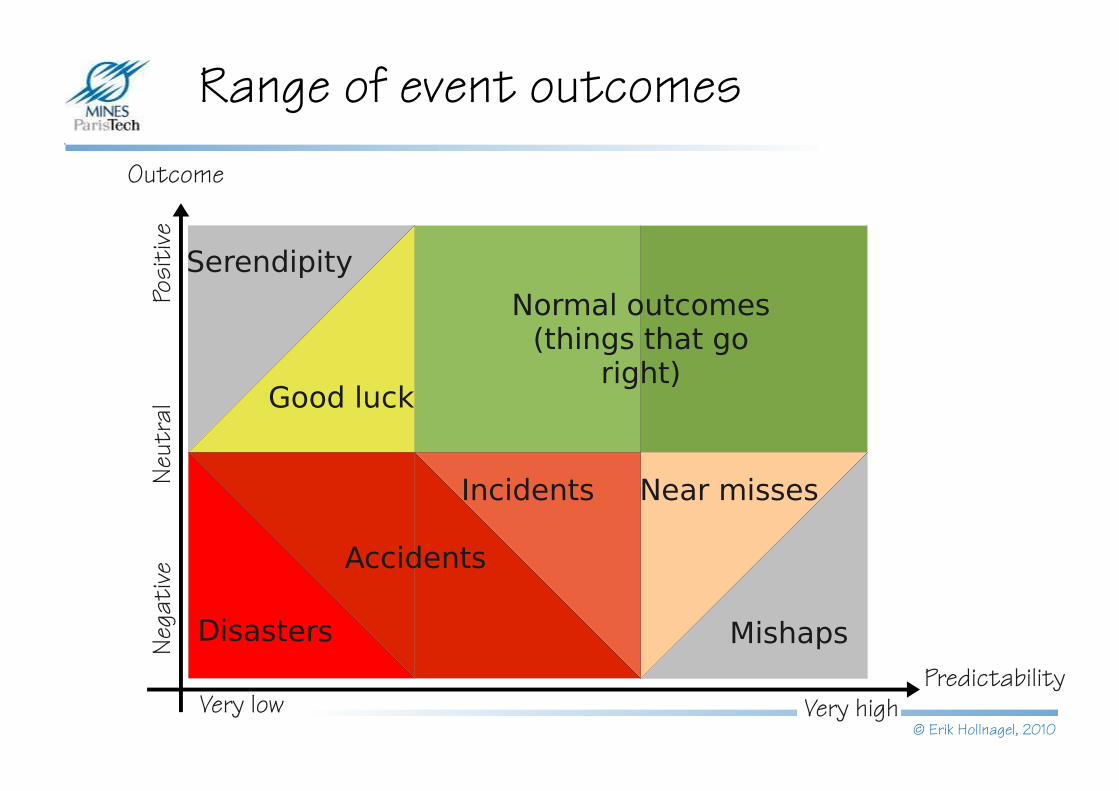
Normal outcomes(things that go
right)
Serendipity
Very highPredictability
Range of event outcomesOutcome
Very low
Posi
tive
Nega
tiv e
Neut
ral
Disasters
Near misses
Accidents
Incidents
Good luck
Mishaps
© Erik Hollnagel, 2010
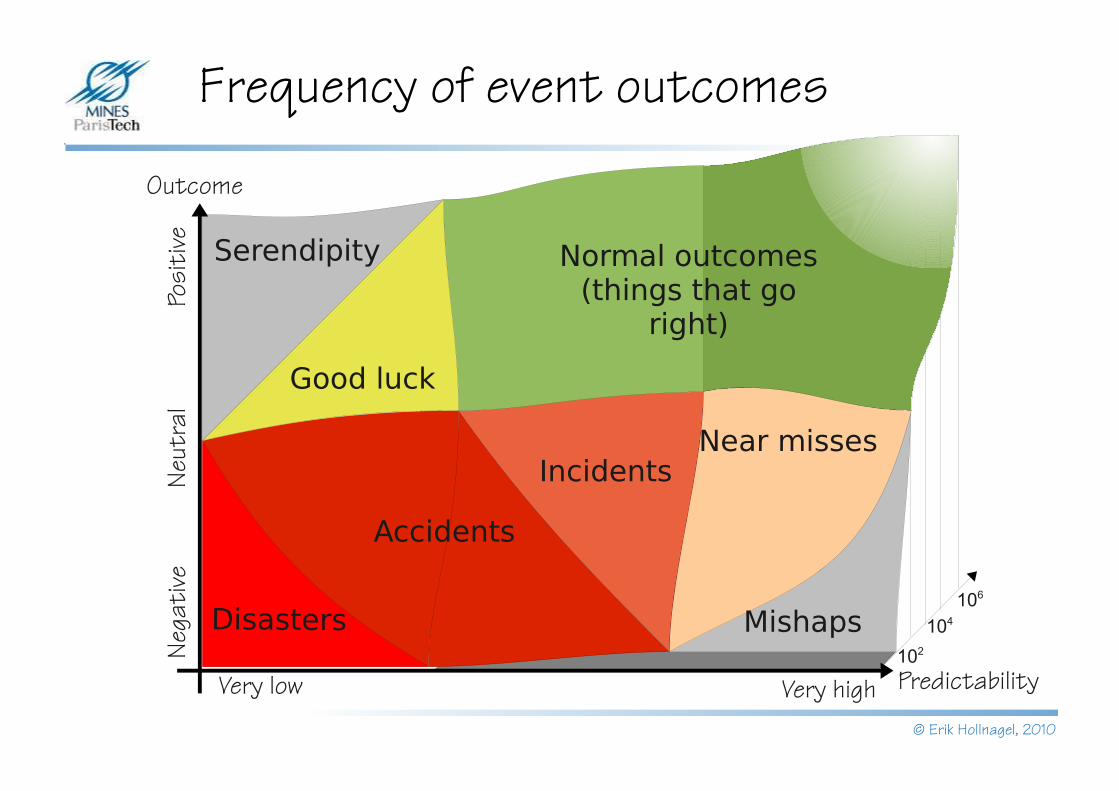
Normal outcomes(things that go
right)
Serendipity
Very high Predictability
Frequency of event outcomes
Outcome
Very low
Posi
tive
Nega
tiv e
Neut
ral
Disasters
Accidents
Good luck
Mishaps
IncidentsNear misses
102
104
106

© Erik Hollnagel, 2010
Normal outcomes(things that go
right)
Serendipity
Very high Predictability
More safe or less unsafe?
Outcome
Very low
Posi
tive
Nega
tiv e
Neut
ral
Disasters
Accidents
Good luck
Mishaps
IncidentsNear misses
102
104
106
Safe Safe Functioning Functioning
(invisible)(invisible)
Unsafe Unsafe Functioning Functioning
(visible)(visible)
© Erik Hollnagel, 2010
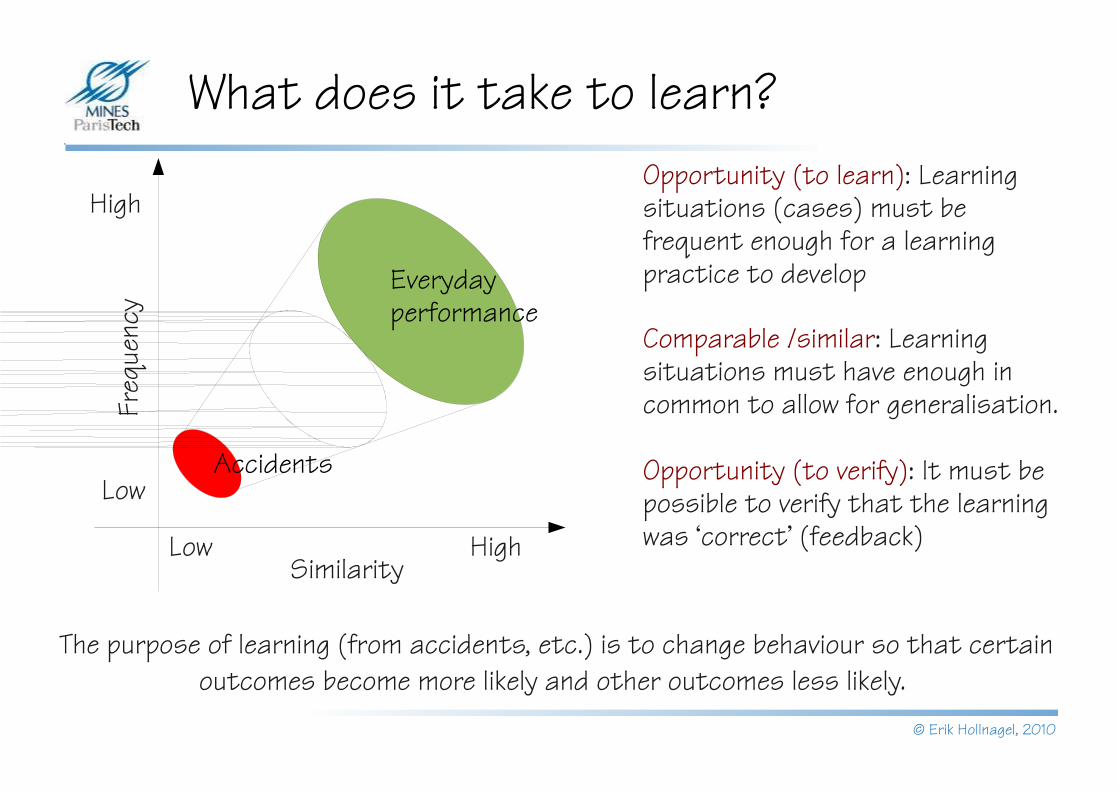
What does it take to learn?
Similarity
Freq
uenc
y
HighLow
High
Low
Opportunity (to learn): Learning situations (cases) must be frequent enough for a learning practice to develop
Comparable /similar: Learning situations must have enough in common to allow for generalisation.
Opportunity (to verify): It must be possible to verify that the learning was ‘correct’ (feedback)
Accidents
The purpose of learning (from accidents, etc.) is to change behaviour so that certain outcomes become more likely and other outcomes less likely.
Everyday performance
© Erik Hollnagel, 2010
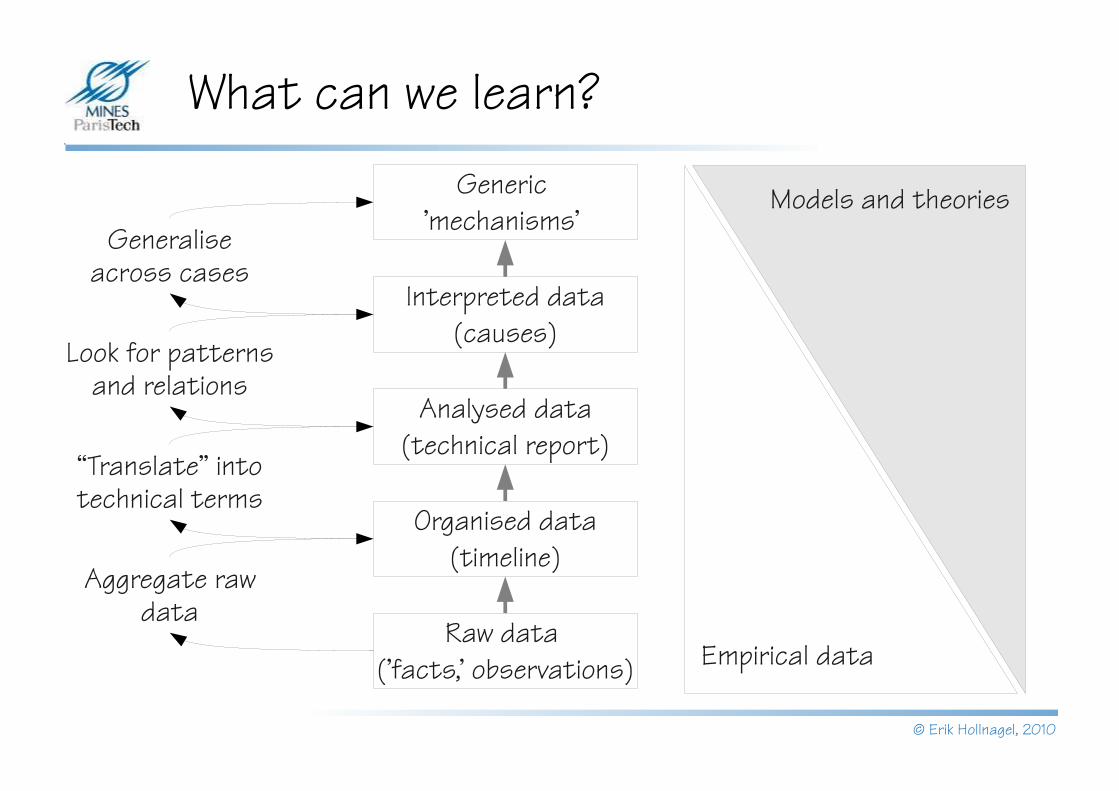
What can we learn?
Generic 'mechanisms'
Interpreted data (causes)
Look for patterns and relations
Aggregate raw data
Generalise across cases
“Translate” into technical terms
Models and theories
Empirical data
Analysed data (technical report)
Organised data (timeline)
Raw data ('facts,' observations)
© Erik Hollnagel, 2010
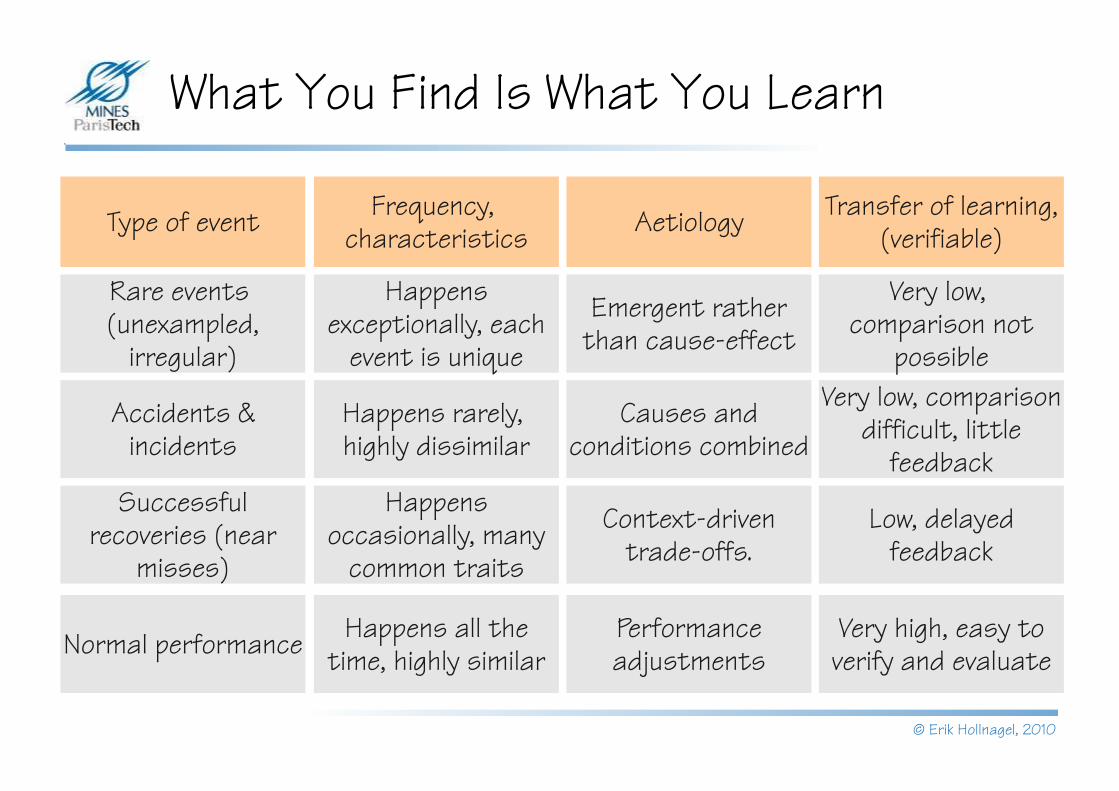
What You Find Is What You Learn
Happens exceptionally, each
event is unique
Very low, comparison not
possible
Happens rarely, highly dissimilar
Very low, comparison difficult, little
feedbackHappens
occasionally, many common traits
Low, delayed feedback
Happens all the time, highly similar
Very high, easy to verify and evaluate
Rare events (unexampled,
irregular)
Accidents & incidents
Successful recoveries (near
misses)
Normal performance
Type of event Frequency, characteristics
Transfer of learning, (verifiable)
Emergent rather than cause-effect
Causes and conditions combined
Context-driven trade-offs.
Performance adjustments
Aetiology
© Erik Hollnagel, 2010
Thank you for your attention