Embed Size (px)
Citation preview

Cold Regions Science and Technology 59 (2009) 234–241
Contents lists available at ScienceDirect
Cold Regions Science and Technology
j ourna l homepage: www.e lsev ie r.com/ locate /co ld reg ions
On forecasting large and infrequent snow avalanches
Jürg Schweizer ⁎, Christoph Mitterer, Lukas StoffelWSL Institute for Snow and Avalanche Research SLF, Davos, Switzerland
⁎ Corresponding author.WSL Institute for Snowand Avala11, CH-7260 Davos Dorf, Switzerland. Tel.: +41 81 4170164;
E-mail address: [email protected] (J. Schweizer).
0165-232X/$ – see front matter © 2009 Elsevier B.V. Adoi:10.1016/j.coldregions.2009.01.006
a b s t r a c t
a r t i c l e i n f oArticle history:
Snow avalanches that threa Received 4 November 2008Accepted 28 January 2009Keywords:Snow avalancheSnow stability evaluationAvalanche forecastingAvalanche frequency
ten a highway or a residential area are often large avalanches that have a returnperiod N1 year. Danger assessment strongly relies on precipitation data since these avalanches are typicallytriggered by major snow storms. Given the extensive protection work that is in place in the European Alps,the avalanche control service (also called avalanche commission) responsible for danger assessment willusually monitor the avalanche situation throughout the winter, but only become active in case of a majorsnow fall. Related safety concepts describing the procedures and measures to be taken in a given dangersituation are therefore often based on threshold values for new snow. By analysing the avalanche occurrenceof a major avalanche path, we show that forecasting based on new snow amounts involves high uncertainty.Whereas the return period of an avalanche to, for example, the road was about 5 years, the return period forthe corresponding new snow depth was substantially smaller, in our case slightly less than 2 years. Similarproportions were found for a number of other avalanche paths with different snow climate. The return periodof the critical new snow depth was about 2–5 times smaller than the return period of the avalanche. Thisproportion is expected to increase with increasing return period. Hence, based on the return period of anavalanche path a first estimate for the critical new snow depth can be made. With a return period of thecritical new snow depth of 1–2 years, avalanche prediction for individual avalanche path becomes verychallenging since the false alarm ratio is expected to be high.
© 2009 Elsevier B.V. All rights reserved.
1. Introduction
In theEuropeanAlpsmostof the severe avalancheproblemshavebeenmitigated in the past decades by permanent protection measures such assupporting structures in the starting zone, or dams and sheds in the run-out zone. Still, there remain very many avalanche paths that threaten ahighway or road section, or a residential area, without permanentprotection work in place. They either produce infrequent events orpermanent protectionworks are technically difficult to implement and/ortoo costly (poor cost-to-benefit ratio). In particular for economic reasons,avalanche forecasting (i.e. preventive closures) — often combined withartificial avalanche release is now frequently favoured over permanentprotectionworks (e.g. Bründl et al., 2006; Wilhelm, 1998).
Avalanche control by temporary preventive measures (based onavalanche forecasting) requires awell organized local avalanche controlservice. As critical situations are infrequent and the avalanche servicehas to assess the situation and take action only occasionally during thewinter there is no full-time professional forecaster on duty. Instead thepersonnel consists of some part time contracted forecasters andobservers. Although it is recommended that they closely follow theavalanche situation during the winter, it is common that a service onlystarts workingwhen amajor snow storm is pre-announced (Stoffel and
nche Research SLF, Flüelastrassefax: +4181 4170110.
ll rights reserved.
Schweizer, 2008). Ideally, the avalanche service has established aconcept that connects a given avalanche situation to some temporaryprotectionmeasures. The avalanche situation in such a safety concept isoften characterized by the amountof snow loading. Threshold values arecommonly determined based on past events. Often the non-events arenot considered in this type of analysis. These critical values should beconsidered as a first guess and always be adapted to the actual situation.After anunexpected avalanche event that e.g. hit an open road, the snowaccumulation before the release is often considered as relatively minorcompared to the large extent of the unexpected avalanche. In otherwords, people are surprised by the discrepancy between the amount ofsnow accumulation and the extent of the avalanche event.
Snow avalanches — a type of fast-moving mass movement — canbe considered as a weather-related natural hazard. In the context ofrisk assessment, avalanche events are characterised by their frequencyof occurrence and their extent or magnitude. The event frequencyexpressed as return period is central to avalanche hazard mapping(e.g. Ancey et al., 2004; Burkard and Salm, 1992; McClung, 1999). Intheir pioneering work Föhn and Meister (1982) made a first attemptto combine this approach with local avalanche prediction.
Avalanche forecasting tools for one or more individual avalanchepath do not exist to our knowledge. Statistical forecasting of large andinfrequent avalanche events in a single avalanche path seemsparticularly difficult since the events are rare and it is not quite clearwhich variables are best related to the release probability. In principal,the probability of release, for example for a given amount of new snow,
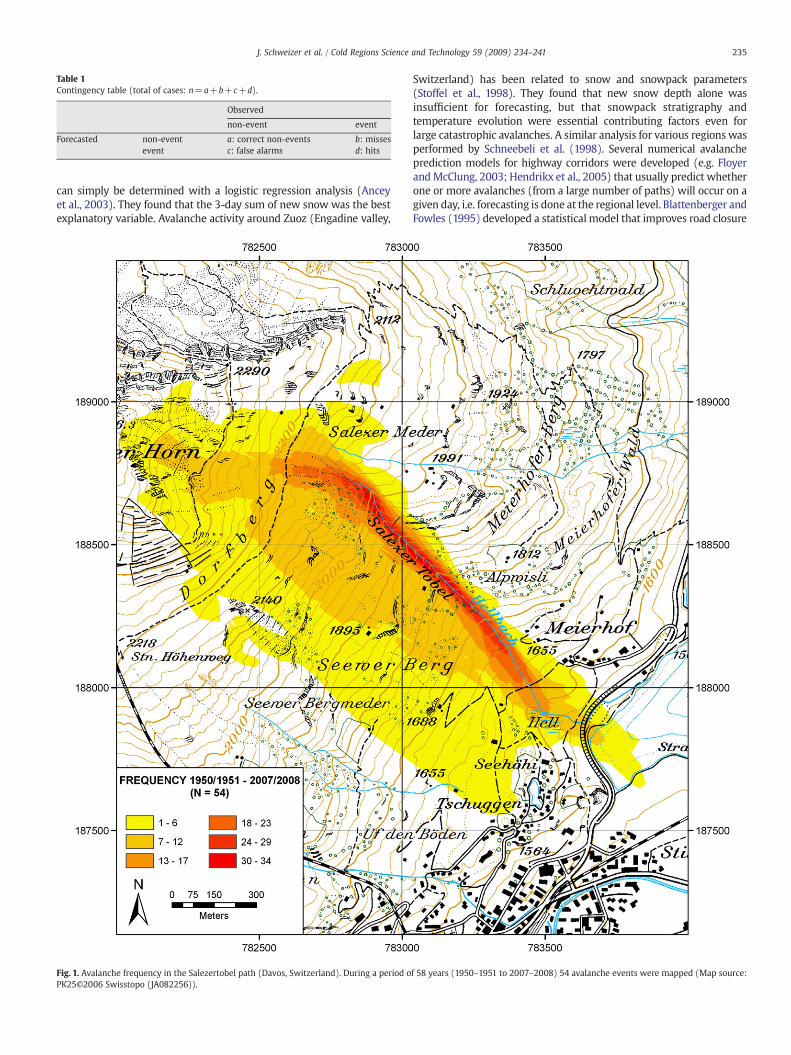
Table 1Contingency table (total of cases: n=a+b+c+d).
Observed
non-event event
Forecasted non-event a: correct non-events b: missesevent c: false alarms d: hits
235J. Schweizer et al. / Cold Regions Science and Technology 59 (2009) 234–241
can simply be determined with a logistic regression analysis (Anceyet al., 2003). They found that the 3-day sum of new snow was the bestexplanatory variable. Avalanche activity around Zuoz (Engadine valley,
Fig. 1. Avalanche frequency in the Salezertobel path (Davos, Switzerland). During a period oPK25©2006 Swisstopo (JA082256)).
Switzerland) has been related to snow and snowpack parameters(Stoffel et al., 1998). They found that new snow depth alone wasinsufficient for forecasting, but that snowpack stratigraphy andtemperature evolution were essential contributing factors even forlarge catastrophic avalanches. A similar analysis for various regions wasperformed by Schneebeli et al. (1998). Several numerical avalancheprediction models for highway corridors were developed (e.g. FloyerandMcClung, 2003; Hendrikx et al., 2005) that usually predict whetherone or more avalanches (from a large number of paths) will occur on agiven day, i.e. forecasting is done at the regional level. Blattenberger andFowles (1995) developed a statistical model that improves road closure
f 58 years (1950–1951 to 2007–2008) 54 avalanche events were mapped (Map source:
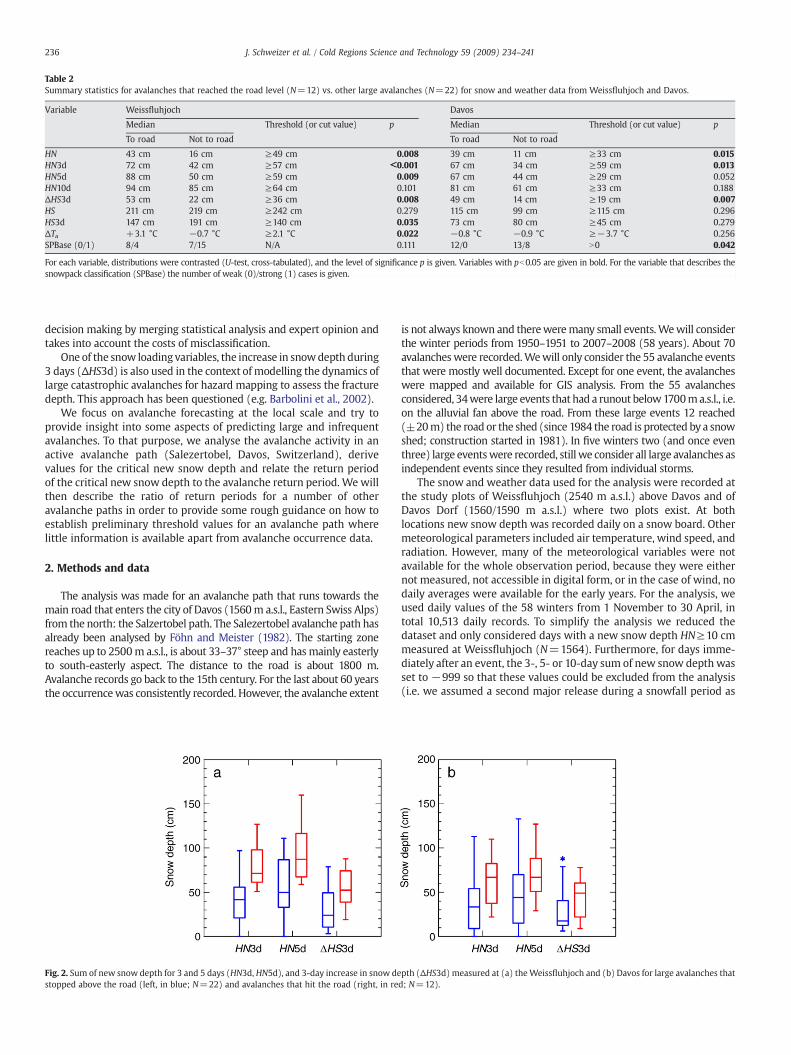
Table 2Summary statistics for avalanches that reached the road level (N=12) vs. other large avalanches (N=22) for snow and weather data from Weissfluhjoch and Davos.
Variable Weissfluhjoch Davos
Median Threshold (or cut value) p Median Threshold (or cut value) p
To road Not to road To road Not to road
HN 43 cm 16 cm ≥49 cm 0.008 39 cm 11 cm ≥33 cm 0.015HN3d 72 cm 42 cm ≥57 cm bbb0.001 67 cm 34 cm ≥59 cm 0.013HN5d 88 cm 50 cm ≥59 cm 0.009 67 cm 44 cm ≥29 cm 0.052HN10d 94 cm 85 cm ≥64 cm 0.101 81 cm 61 cm ≥33 cm 0.188ΔHS3d 53 cm 22 cm ≥36 cm 0.008 49 cm 14 cm ≥19 cm 0.007HS 211 cm 219 cm ≥242 cm 0.279 115 cm 99 cm ≥115 cm 0.296HS3d 147 cm 191 cm ≥140 cm 0.035 73 cm 80 cm ≥45 cm 0.279ΔTa +3.1 °C −0.7 °C ≥2.1 °C 0.022 −0.8 °C −0.9 °C ≥−3.7 °C 0.256SPBase (0/1) 8/4 7/15 N/A 0.111 12/0 13/8 N0 0.042
For each variable, distributions were contrasted (U-test, cross-tabulated), and the level of significance p is given. Variables with pb0.05 are given in bold. For the variable that describes thesnowpack classification (SPBase) the number of weak (0)/strong (1) cases is given.
236 J. Schweizer et al. / Cold Regions Science and Technology 59 (2009) 234–241
decision making by merging statistical analysis and expert opinion andtakes into account the costs of misclassification.
One of the snow loading variables, the increase in snowdepth during3 days (ΔHS3d) is also used in the context of modelling the dynamics oflarge catastrophic avalanches for hazard mapping to assess the fracturedepth. This approach has been questioned (e.g. Barbolini et al., 2002).
We focus on avalanche forecasting at the local scale and try toprovide insight into some aspects of predicting large and infrequentavalanches. To that purpose, we analyse the avalanche activity in anactive avalanche path (Salezertobel, Davos, Switzerland), derivevalues for the critical new snow depth and relate the return periodof the critical new snow depth to the avalanche return period. We willthen describe the ratio of return periods for a number of otheravalanche paths in order to provide some rough guidance on how toestablish preliminary threshold values for an avalanche path wherelittle information is available apart from avalanche occurrence data.
2. Methods and data
The analysis was made for an avalanche path that runs towards themain road that enters the city of Davos (1560m a.s.l., Eastern Swiss Alps)from the north: the Salzertobel path. The Salezertobel avalanche path hasalready been analysed by Föhn and Meister (1982). The starting zonereaches up to 2500m a.s.l., is about 33–37° steep and hasmainly easterlyto south-easterly aspect. The distance to the road is about 1800 m.Avalanche records go back to the 15th century. For the last about 60 yearsthe occurrencewas consistently recorded. However, the avalanche extent
Fig. 2. Sum of new snow depth for 3 and 5 days (HN3d, HN5d), and 3-day increase in snow destopped above the road (left, in blue; N=22) and avalanches that hit the road (right, in re
is not always known and thereweremany small events.Wewill considerthe winter periods from 1950–1951 to 2007–2008 (58 years). About 70avalancheswere recorded.Wewill only consider the 55 avalanche eventsthat were mostly well documented. Except for one event, the avalancheswere mapped and available for GIS analysis. From the 55 avalanchesconsidered, 34were large events that had a runout below1700ma.s.l., i.e.on the alluvial fan above the road. From these large events 12 reached(±20m) the road or the shed (since 1984 the road is protected by a snowshed; construction started in 1981). In five winters two (and once eventhree) large eventswere recorded, still we consider all large avalanches asindependent events since they resulted from individual storms.
The snow and weather data used for the analysis were recorded atthe study plots of Weissfluhjoch (2540 m a.s.l.) above Davos and ofDavos Dorf (1560/1590 m a.s.l.) where two plots exist. At bothlocations new snow depth was recorded daily on a snow board. Othermeteorological parameters included air temperature, wind speed, andradiation. However, many of the meteorological variables were notavailable for the whole observation period, because they were eithernot measured, not accessible in digital form, or in the case of wind, nodaily averages were available for the early years. For the analysis, weused daily values of the 58 winters from 1 November to 30 April, intotal 10,513 daily records. To simplify the analysis we reduced thedataset and only considered days with a new snow depth HN≥10 cmmeasured at Weissfluhjoch (N=1564). Furthermore, for days imme-diately after an event, the 3-, 5- or 10-day sum of new snow depth wasset to −999 so that these values could be excluded from the analysis(i.e. we assumed a second major release during a snowfall period as
pth (ΔHS3d) measured at (a) theWeissfluhjoch and (b) Davos for large avalanches thatd; N=12).
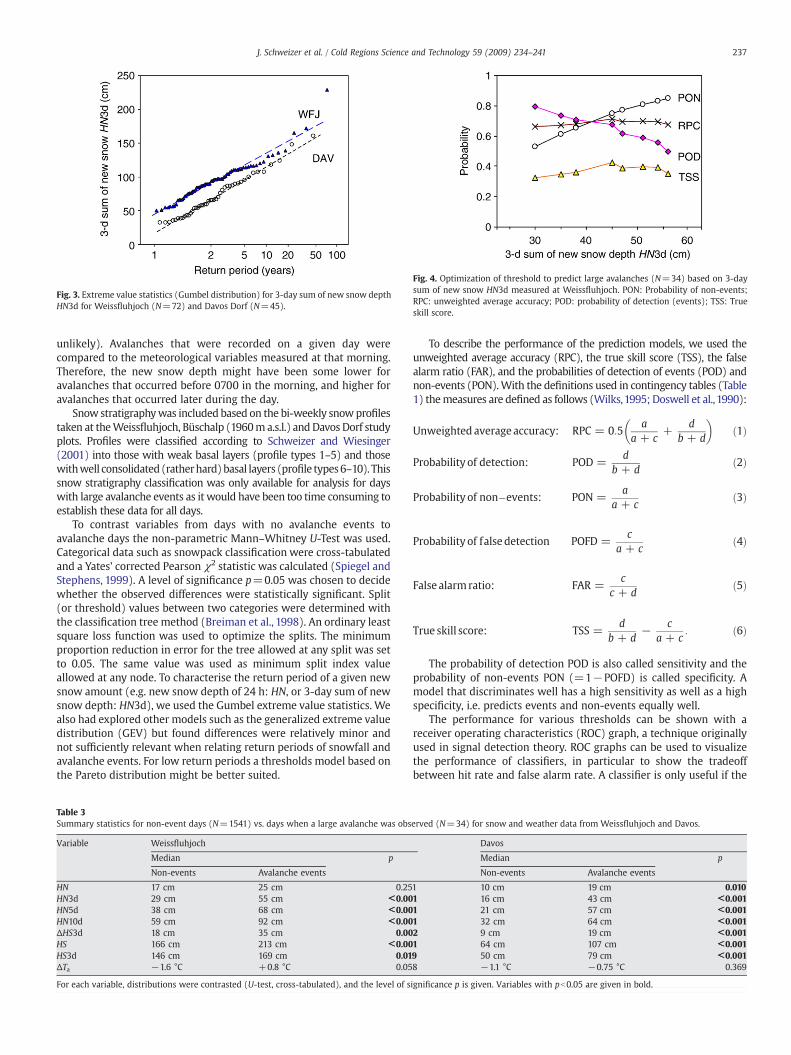
Fig. 3. Extreme value statistics (Gumbel distribution) for 3-day sum of new snow depthHN3d for Weissfluhjoch (N=72) and Davos Dorf (N=45).
Fig. 4. Optimization of threshold to predict large avalanches (N=34) based on 3-daysum of new snow HN3d measured at Weissfluhjoch. PON: Probability of non-events;RPC: unweighted average accuracy; POD: probability of detection (events); TSS: Trueskill score.
237J. Schweizer et al. / Cold Regions Science and Technology 59 (2009) 234–241
unlikely). Avalanches that were recorded on a given day werecompared to the meteorological variables measured at that morning.Therefore, the new snow depth might have been some lower foravalanches that occurred before 0700 in the morning, and higher foravalanches that occurred later during the day.
Snow stratigraphywas included based on the bi-weekly snowprofilestaken at theWeissfluhjoch, Büschalp (1960ma.s.l.) andDavos Dorf studyplots. Profiles were classified according to Schweizer and Wiesinger(2001) into those with weak basal layers (profile types 1–5) and thosewithwell consolidated(ratherhard)basal layers (profile types6–10). Thissnow stratigraphy classification was only available for analysis for dayswith large avalanche events as it would have been too time consuming toestablish these data for all days.
To contrast variables from days with no avalanche events toavalanche days the non-parametric Mann–Whitney U-Test was used.Categorical data such as snowpack classification were cross-tabulatedand a Yates' corrected Pearson χ2 statistic was calculated (Spiegel andStephens, 1999). A level of significance p=0.05 was chosen to decidewhether the observed differences were statistically significant. Split(or threshold) values between two categories were determined withthe classification tree method (Breiman et al., 1998). An ordinary leastsquare loss function was used to optimize the splits. The minimumproportion reduction in error for the tree allowed at any split was setto 0.05. The same value was used as minimum split index valueallowed at any node. To characterise the return period of a given newsnow amount (e.g. new snow depth of 24 h: HN, or 3-day sum of newsnow depth: HN3d), we used the Gumbel extreme value statistics. Wealso had explored other models such as the generalized extreme valuedistribution (GEV) but found differences were relatively minor andnot sufficiently relevant when relating return periods of snowfall andavalanche events. For low return periods a thresholds model based onthe Pareto distribution might be better suited.
Table 3Summary statistics for non-event days (N=1541) vs. days when a large avalanche was obs
Variable Weissfluhjoch
Median p
Non-events Avalanche events
HN 17 cm 25 cm 0.25HN3d 29 cm 55 cm bbb0.00HN5d 38 cm 68 cm bbb0.00HN10d 59 cm 92 cm bbb0.00ΔHS3d 18 cm 35 cm 0.00HS 166 cm 213 cm bbb0.00HS3d 146 cm 169 cm 0.01ΔTa −1.6 °C +0.8 °C 0.05
For each variable, distributions were contrasted (U-test, cross-tabulated), and the level of s
To describe the performance of the prediction models, we used theunweighted average accuracy (RPC), the true skill score (TSS), the falsealarm ratio (FAR), and the probabilities of detection of events (POD) andnon-events (PON).With the definitions used in contingency tables (Table1) themeasures are defined as follows (Wilks,1995; Doswell et al.,1990):
Unweighted average accuracy: RPC = 0:5a
a + c+
db + d
� �ð1Þ
Probability of detection: POD =d
b + dð2Þ
Probability of non�events: PON =a
a + cð3Þ
Probability of false detection POFD =c
a + cð4Þ
False alarm ratio: FAR =c
c + dð5Þ
True skill score: TSS =d
b + d− c
a + c: ð6Þ
The probability of detection POD is also called sensitivity and theprobability of non-events PON (=1−POFD) is called specificity. Amodel that discriminates well has a high sensitivity as well as a highspecificity, i.e. predicts events and non-events equally well.
The performance for various thresholds can be shown with areceiver operating characteristics (ROC) graph, a technique originallyused in signal detection theory. ROC graphs can be used to visualizethe performance of classifiers, in particular to show the tradeoffbetween hit rate and false alarm rate. A classifier is only useful if the
erved (N=34) for snow and weather data from Weissfluhjoch and Davos.
Davos
Median p
Non-events Avalanche events
1 10 cm 19 cm 0.0101 16 cm 43 cm bbb0.0011 21 cm 57 cm bbb0.0011 32 cm 64 cm bbb0.0012 9 cm 19 cm bbb0.0011 64 cm 107 cm bbb0.0019 50 cm 79 cm bbb0.0018 −1.1 °C −0.75 °C 0.369
ignificance p is given. Variables with pb0.05 are given in bold.

Fig. 5. Receiver operating characteristics (ROC) graph forHN3dmeasured at Davos (⁎) andWeissfluhjoch (○) for varying discriminating thresholds (the threshold decreases withincreasing sensitivity). The optimal threshold values are 33 cm and 45 cm forHN3d Davosand Weissfluhjoch, respectively. These points on the ROC graphs are those where thetangent with slope 1 meets the ROC curve.
Table 4Optimal threshold values based on unweighted average accuracy to discriminatebetween days when a large avalanche occurred and non-event days.
Variable Thresholdvalue (cm)
Probabilityof detection(POD) (%)
True skillscore (TSS)(%)
Unweightedaverageaccuracy (%)
False alarmratio (FAR)(%)
WeissfluhjochHN_WFJ ≥25 52.9 29.2 64.6 95.3HN3d_WFJ ≥45 67.6 42.6 71.3 94.4HN5d_WFJ ≥54 67.6 38.3 69.1 95.2
DavosHN_DAV ≥19 52.9 33.9 66.7 94.4HN3d_DAV ≥33 64.7 45.0 72.5 93.3HN5d_DAV ≥38 67.6 45.4 72.7 93.7
CombinationsHN3d_WFJand HS_DAV
≥45 67.6 47.7 73.9 93.0≥48
HN3d_WFJand HS_DAV
≥45 64.7 50.4 75.2 90.9≥76
HN3d_WFJand HS_DAV
≥54 52.9 42.8 71.4 89.7≥76
HN3d_DAVand HS_DAV
≥33 64.7 51.9 75.9 90.0≥76
HN5d_DAVand HS_DAV
≥38 67.6 53.8 76.9 90.3≥76
238 J. Schweizer et al. / Cold Regions Science and Technology 59 (2009) 234–241
probability of detection is always larger than the probability of falsedetection, i.e. the classifier has to appear in the upper left triangleabove the 1:1 line in the ROC graph (e.g. Fawcett 2006; Kantz et al.,2006).
3. Results
Fig. 1 shows the avalanche frequency in the Salezertobel path forthe 54 avalanches mapped from 1950–1951 to 2007–2008. During the58 years considered, 12 avalanches reached the road (±20 m) so thatthe return period for an avalanche to the road is about 5 years.
We will first consider the meteorological situation for the 12avalanches that reached the road. The new snow amount prior to therelease varied widely. For example, the 3-day sum of new snow depthat Weissfluhjoch varied between 51 cm and 127 cm, with a medianvalue of 68 cm. For nine out of 12 avalanches HN3d measured atWeissfluhjoch was at least 64 cm (1st quartile). Considering the newsnow measurements at the valley bottom showed that the medianHN3d was 67 cm with a range of 22 cm to 110 cm. For nine out of12 avalanches HN3d measured at Davos was at least 41 cm. The airtemperature change to the previous dayΔTawas inmost cases positiveat Weissfluhjoch, i.e. about +3 °C. There was no comparable trend forthe temperature measured at Davos. Analysing the snow stratigraphyshowed that the profiles taken prior to the release at the lowerelevation study plots (Davos and Büschalp) had almost exclusivelyweak basal snowpack layers; at the elevation of the Weissfluhjocheight out of twelve profiles had a weak base.
In the following, we compare the above described conditions forthe avalanches that hit the road to those of the other 22 rather largeevents (Table 2). All variables related to snow loading (HN, HN3d,HN5d, ΔHS3d) showed larger median values for the avalanches thathit the road compared to the other large events (either measured atWeissfluhjoch or at Davos) (Fig. 2); the differences were statisticallysignificant (Mann–Whitney U-test; p≤0.015) except for HN5dmeasured at Davos (p=0.052). The level of significance p was ingeneral lower for the values measured at Davos. Based on univariatetree statistics, a threshold value for an avalanche to the road of≥57 cmand ≥59 cm for HN3d was found, measured at Weissfluhjoch andDavos, respectively. Also significant variables were ΔTa at Weiss-fluhjoch (≥2.1 °C, p=0.022) and the snow depth 3 days before theevent (HS3d) at Weissfluhjoch (≥140 cm, p=0.035). The proportionof profiles (taken at either Büschalp or Davos) with weak base was
significantly larger for days with avalanches that hit the road.Whereasa strong base suggests that an avalanche will not reach the road, aweak base has no discriminating power. Though, for almost allavalanches that reached the road a snowpackwith aweak base existed— but weak snowpack basal layers existed alsowhenmany of the largeavalanches stopped above the road.
Based on the analysis of the events only, a new snow amount ofabout 55–60 cm (measured either on the level of the starting zone atthe Weissfluhjoch or in the valley bottom at Davos) seems to indicatethat an avalanche might reach the road. The return period of a newsnow depth of about 55–60 cm in 3 days at Davos is about 1.5–2 years,at Weissfluhjoch it is about 1 year (Fig. 3).
Next, we will consider if it is possible to forecast whether a largeavalanche has to be expected. We compared the snow and weathersituation at days (N=34) when a large avalanche occurred to thosedays when there was no avalanche (Table 3). All loading parameterswere significant variables (p≤0.01) except for the 24 h new snowdepth (HN) measured at Weissfluhjoch (p=0.251). Also significantvariables were the snow depth variables (HS, HS3d). The difference inair temperature to the previous day ΔTa measured at Weissfluhjochwas not a significant variable (p=0.058). Tree statistics with standardparameters did not suggest any split value for any of the snow loadingparameters, except for HN measured at Davos (≥49 cm). However, asthe dataset was very unbalanced it is not surprising that no splitvalues were found, and the one found is questionable (POD≈21%),but even when using priors and giving equal weight to events andnon-events tree statistics did not provide useful results. Hence, weoptimized the thresholds to reach the highest unweighted averageaccuracy or the highest true skill score (Fig. 4). Alternatively, the ROCgraph can be considered (Fig. 5). This shows that HN3d measured ateither Davos or theWeissfluhjoch are useful classifiers but yield ratherconservative results. Classifying results for the various variables aresummarized in Table 4. The unweighted average accuracy can beincreased to 75% if in addition to HN3d or HN5d at Davos also thesnow depth HS (≥76 cm) is considered. However, the probability ofdetection (correct avalanche events) is only about 65%, whereas thefalse alarm ratio is about 90%. Introducing additional variables such asthe ΔTa or HN did not improve the performance of the models thatincluded the 3- or 5-day sum of new depth and the snow depth.Despite the high false alarm ratio that is questioning the applicability
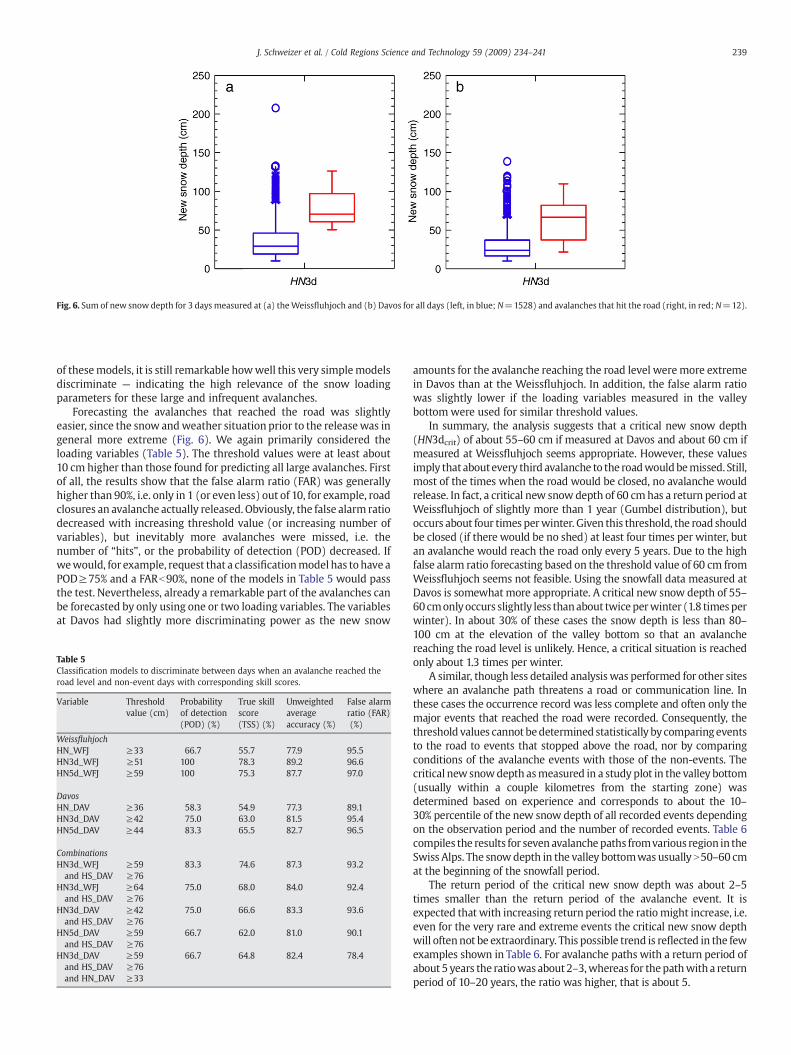
Fig. 6. Sum of new snow depth for 3 days measured at (a) theWeissfluhjoch and (b) Davos for all days (left, in blue; N=1528) and avalanches that hit the road (right, in red;N=12).
239J. Schweizer et al. / Cold Regions Science and Technology 59 (2009) 234–241
of thesemodels, it is still remarkable howwell this very simplemodelsdiscriminate — indicating the high relevance of the snow loadingparameters for these large and infrequent avalanches.
Forecasting the avalanches that reached the road was slightlyeasier, since the snow andweather situation prior to the releasewas ingeneral more extreme (Fig. 6). We again primarily considered theloading variables (Table 5). The threshold values were at least about10 cm higher than those found for predicting all large avalanches. Firstof all, the results show that the false alarm ratio (FAR) was generallyhigher than 90%, i.e. only in 1 (or even less) out of 10, for example, roadclosures an avalanche actually released. Obviously, the false alarm ratiodecreased with increasing threshold value (or increasing number ofvariables), but inevitably more avalanches were missed, i.e. thenumber of “hits”, or the probability of detection (POD) decreased. Ifwewould, for example, request that a classificationmodel has tohave aPOD≥75% and a FARb90%, none of the models in Table 5 would passthe test. Nevertheless, already a remarkable part of the avalanches canbe forecasted by only using one or two loading variables. The variablesat Davos had slightly more discriminating power as the new snow
Table 5Classification models to discriminate between days when an avalanche reached theroad level and non-event days with corresponding skill scores.
Variable Thresholdvalue (cm)
Probabilityof detection(POD) (%)
True skillscore(TSS) (%)
Unweightedaverageaccuracy (%)
False alarmratio (FAR)(%)
WeissfluhjochHN_WFJ ≥33 66.7 55.7 77.9 95.5HN3d_WFJ ≥51 100 78.3 89.2 96.6HN5d_WFJ ≥59 100 75.3 87.7 97.0
DavosHN_DAV ≥36 58.3 54.9 77.3 89.1HN3d_DAV ≥42 75.0 63.0 81.5 95.4HN5d_DAV ≥44 83.3 65.5 82.7 96.5
CombinationsHN3d_WFJ ≥59 83.3 74.6 87.3 93.2and HS_DAV ≥76
HN3d_WFJ ≥64 75.0 68.0 84.0 92.4and HS_DAV ≥76
HN3d_DAV ≥42 75.0 66.6 83.3 93.6and HS_DAV ≥76
HN5d_DAV ≥59 66.7 62.0 81.0 90.1and HS_DAV ≥76
HN3d_DAVand HS_DAVand HN_DAV
≥59 66.7 64.8 82.4 78.4≥76≥33
amounts for the avalanche reaching the road level weremore extremein Davos than at the Weissfluhjoch. In addition, the false alarm ratiowas slightly lower if the loading variables measured in the valleybottom were used for similar threshold values.
In summary, the analysis suggests that a critical new snow depth(HN3dcrit) of about 55–60 cm if measured at Davos and about 60 cm ifmeasured at Weissfluhjoch seems appropriate. However, these valuesimply that aboutevery third avalanche to the roadwouldbemissed. Still,most of the times when the road would be closed, no avalanche wouldrelease. In fact, a critical new snow depth of 60 cmhas a return period atWeissfluhjoch of slightly more than 1 year (Gumbel distribution), butoccurs about four times perwinter. Given this threshold, the road shouldbe closed (if there would be no shed) at least four times per winter, butan avalanche would reach the road only every 5 years. Due to the highfalse alarm ratio forecasting based on the threshold value of 60 cm fromWeissfluhjoch seems not feasible. Using the snowfall data measured atDavos is somewhat more appropriate. A critical new snow depth of 55–60cmonlyoccurs slightly less thanabout twiceperwinter (1.8 timesperwinter). In about 30% of these cases the snow depth is less than 80–100 cm at the elevation of the valley bottom so that an avalanchereaching the road level is unlikely. Hence, a critical situation is reachedonly about 1.3 times per winter.
A similar, though less detailed analysis was performed for other siteswhere an avalanche path threatens a road or communication line. Inthese cases the occurrence record was less complete and often only themajor events that reached the road were recorded. Consequently, thethreshold values cannot bedetermined statistically bycomparingeventsto the road to events that stopped above the road, nor by comparingconditions of the avalanche events with those of the non-events. Thecritical new snowdepth asmeasured in a study plot in the valley bottom(usually within a couple kilometres from the starting zone) wasdetermined based on experience and corresponds to about the 10–30% percentile of the new snow depth of all recorded events dependingon the observation period and the number of recorded events. Table 6compiles the results for seven avalanchepaths fromvarious region in theSwiss Alps. The snowdepth in the valley bottomwas usually N50–60 cmat the beginning of the snowfall period.
The return period of the critical new snow depth was about 2–5times smaller than the return period of the avalanche event. It isexpected that with increasing return period the ratiomight increase, i.e.even for the very rare and extreme events the critical new snow depthwill oftennot be extraordinary. This possible trend is reflected in the fewexamples shown in Table 6. For avalanche paths with a return period ofabout 5 years the ratiowas about2–3,whereas for thepathwith a returnperiod of 10–20 years, the ratio was higher, that is about 5.
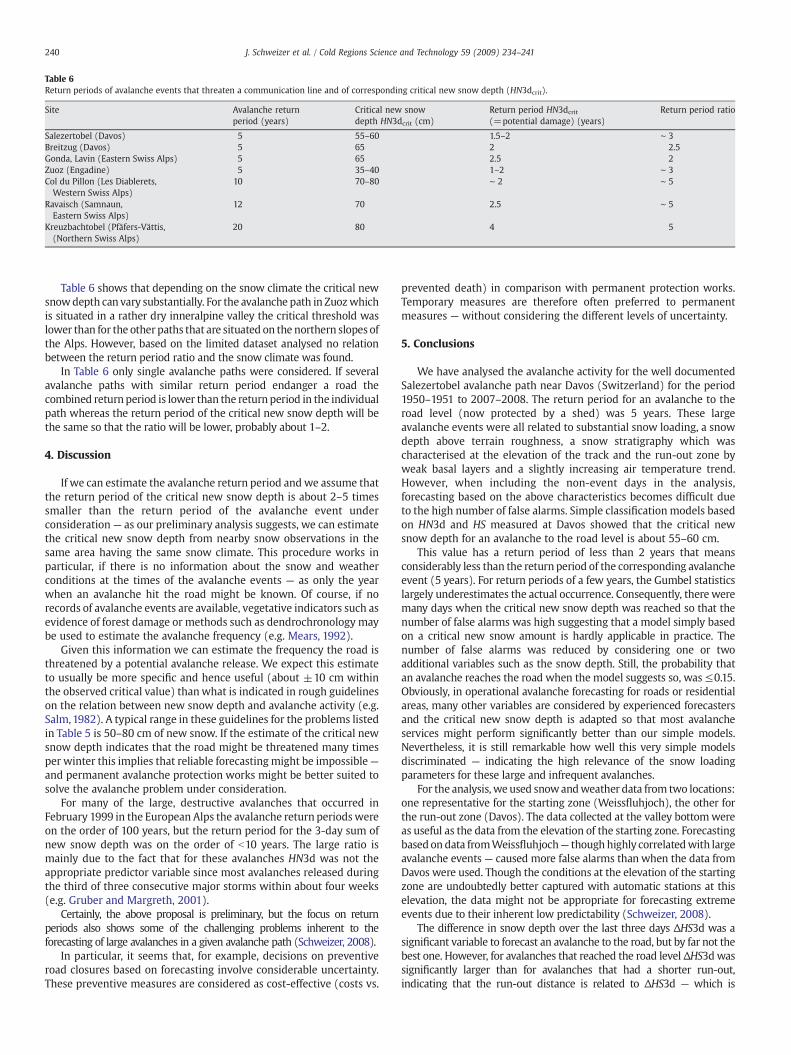
Table 6Return periods of avalanche events that threaten a communication line and of corresponding critical new snow depth (HN3dcrit).
Site Avalanche returnperiod (years)
Critical new snowdepth HN3dcrit (cm)
Return period HN3dcrit(=potential damage) (years)
Return period ratio
Salezertobel (Davos) 5 55–60 1.5–2 ∼ 3Breitzug (Davos) 5 65 2 2.5Gonda, Lavin (Eastern Swiss Alps) 5 65 2.5 2Zuoz (Engadine) 5 35–40 1–2 ∼ 3Col du Pillon (Les Diablerets,Western Swiss Alps)
10 70–80 ∼ 2 ∼ 5
Ravaisch (Samnaun,Eastern Swiss Alps)
12 70 2.5 ∼ 5
Kreuzbachtobel (Pfäfers-Vättis,(Northern Swiss Alps)
20 80 4 5
240 J. Schweizer et al. / Cold Regions Science and Technology 59 (2009) 234–241
Table 6 shows that depending on the snow climate the critical newsnowdepth can vary substantially. For the avalanche path in Zuozwhichis situated in a rather dry inneralpine valley the critical threshold waslower than for the other paths that are situated on the northern slopes ofthe Alps. However, based on the limited dataset analysed no relationbetween the return period ratio and the snow climate was found.
In Table 6 only single avalanche paths were considered. If severalavalanche paths with similar return period endanger a road thecombined returnperiod is lower than the returnperiod in the individualpath whereas the return period of the critical new snow depth will bethe same so that the ratio will be lower, probably about 1–2.
4. Discussion
If we can estimate the avalanche return period andwe assume thatthe return period of the critical new snow depth is about 2–5 timessmaller than the return period of the avalanche event underconsideration— as our preliminary analysis suggests, we can estimatethe critical new snow depth from nearby snow observations in thesame area having the same snow climate. This procedure works inparticular, if there is no information about the snow and weatherconditions at the times of the avalanche events — as only the yearwhen an avalanche hit the road might be known. Of course, if norecords of avalanche events are available, vegetative indicators such asevidence of forest damage or methods such as dendrochronology maybe used to estimate the avalanche frequency (e.g. Mears, 1992).
Given this information we can estimate the frequency the road isthreatened by a potential avalanche release. We expect this estimateto usually be more specific and hence useful (about ±10 cm withinthe observed critical value) thanwhat is indicated in rough guidelineson the relation between new snow depth and avalanche activity (e.g.Salm,1982). A typical range in these guidelines for the problems listedin Table 5 is 50–80 cm of new snow. If the estimate of the critical newsnow depth indicates that the road might be threatened many timesper winter this implies that reliable forecastingmight be impossible—and permanent avalanche protection works might be better suited tosolve the avalanche problem under consideration.
For many of the large, destructive avalanches that occurred inFebruary 1999 in the European Alps the avalanche return periodswereon the order of 100 years, but the return period for the 3-day sum ofnew snow depth was on the order of b10 years. The large ratio ismainly due to the fact that for these avalanches HN3d was not theappropriate predictor variable since most avalanches released duringthe third of three consecutive major storms within about four weeks(e.g. Gruber and Margreth, 2001).
Certainly, the above proposal is preliminary, but the focus on returnperiods also shows some of the challenging problems inherent to theforecasting of large avalanches in a given avalanche path (Schweizer, 2008).
In particular, it seems that, for example, decisions on preventiveroad closures based on forecasting involve considerable uncertainty.These preventive measures are considered as cost-effective (costs vs.
prevented death) in comparison with permanent protection works.Temporary measures are therefore often preferred to permanentmeasures — without considering the different levels of uncertainty.
5. Conclusions
We have analysed the avalanche activity for the well documentedSalezertobel avalanche path near Davos (Switzerland) for the period1950–1951 to 2007–2008. The return period for an avalanche to theroad level (now protected by a shed) was 5 years. These largeavalanche events were all related to substantial snow loading, a snowdepth above terrain roughness, a snow stratigraphy which wascharacterised at the elevation of the track and the run-out zone byweak basal layers and a slightly increasing air temperature trend.However, when including the non-event days in the analysis,forecasting based on the above characteristics becomes difficult dueto the high number of false alarms. Simple classification models basedon HN3d and HS measured at Davos showed that the critical newsnow depth for an avalanche to the road level is about 55–60 cm.
This value has a return period of less than 2 years that meansconsiderably less than the return period of the corresponding avalancheevent (5 years). For return periods of a few years, the Gumbel statisticslargely underestimates the actual occurrence. Consequently, there weremany days when the critical new snow depth was reached so that thenumber of false alarms was high suggesting that a model simply basedon a critical new snow amount is hardly applicable in practice. Thenumber of false alarms was reduced by considering one or twoadditional variables such as the snow depth. Still, the probability thatan avalanche reaches the road when the model suggests so, was≤0.15.Obviously, in operational avalanche forecasting for roads or residentialareas, many other variables are considered by experienced forecastersand the critical new snow depth is adapted so that most avalancheservices might perform significantly better than our simple models.Nevertheless, it is still remarkable how well this very simple modelsdiscriminated — indicating the high relevance of the snow loadingparameters for these large and infrequent avalanches.
For the analysis, we used snowandweather data from two locations:one representative for the starting zone (Weissfluhjoch), the other forthe run-out zone (Davos). The data collected at the valley bottomwereas useful as the data from the elevation of the starting zone. Forecastingbased on data fromWeissfluhjoch— though highly correlatedwith largeavalanche events — caused more false alarms than when the data fromDavos were used. Though the conditions at the elevation of the startingzone are undoubtedly better captured with automatic stations at thiselevation, the data might not be appropriate for forecasting extremeevents due to their inherent low predictability (Schweizer, 2008).
The difference in snow depth over the last three days ΔHS3d was asignificant variable to forecast an avalanche to the road, but by far not thebest one. However, for avalanches that reached the road levelΔHS3dwassignificantly larger than for avalanches that had a shorter run-out,indicating that the run-out distance is related to ΔHS3d — which is

241J. Schweizer et al. / Cold Regions Science and Technology 59 (2009) 234–241
commonly assumed in avalanche dynamics calculations. As mentionedabove, for the largest avalanche events that reached the road level, snowstratigraphy at the elevation of the track and run-out zone wascharacterised by weak basal layers. Thus, we suggest that these snowstratigraphy conditionswere favourable for snow entrainment and hencemight have contributed to the large run-out (Sovilla et al., 2006).
The ratio of the return period of the critical new snow depth to theavalanche returnperiodwas evaluated for sixmore avalanche paths andvalues in the range of 2 to 5 were found. This findingmight be useful topreliminarily assess the critical new snow depth for an avalanche pathfor which only the avalanche return period might be known.
Though avalanche control services are in general probably moresuccessful than a simple model based on a critical new snow depth, thegenerally low predictability makes the prediction of an avalanche eventin a specific avalanche path highly uncertain. Therefore, avalancheforecasting (i.e. for example, by preventive road closures)— evenwhencombinedwith explosive control—might not always be the best optionwhen evaluating the cost effectiveness of potential avalanche protectionmeasures (costs vs. prevented death).
Acknowledgements
We would like to thank Roland Meister for sharing his expertiseand data on the Salezertobel avalanche path and Stephan Margrethand Michael Schirmer for valuable input.
References
Ancey, C., Meunier, M., Richard, D., 2003. Inverse problem in avalanche dynamicsmodels. Water Resour. Res. 39 (4), 1099. doi:10.1029/2002WR001749.
Ancey, C., Gervasoni, C., Meunier, M., 2004. Computing extreme avalanches. Cold Reg.Sci. Technol. 39 (2–3), 161–180.
Barbolini, M., Natale, L., Savi, F., 2002. Effects of release conditions uncertainty onavalanche hazard mapping. Nat. Hazards 25, 225–244.
Blattenberger, G., Fowles, R., 1995. Road closure to mitigate avalanche danger: a casestudy for Little Cottonwood Canyon. Int. J. Forecast. 11 (1), 159–174.
Breiman, L., Friedman, J.H., Olshen, R.A., Stone, C.J., 1998. Classification and RegressionTrees. CRC Press, Boca Raton, U.S.A. 368 pp.
Bründl, M., McAlpin, M.C., Gruber, U., Fuchs, S., 2006. Application of the marginal costapproach and cost–benefit analysis to measures for avalanche risk reduction — a casestudy fromDavos, Switzerland. In:Ammann,W.J., Dannenmann, S., Vulliet, L. (Eds.), RISK21—Copingwith Risks due toNatural Hazards in the 21th Century, Ascona, Switzerland,28 November – 3 December 2004. Taylor & Francis Group, London, pp. 155–168.
Burkard, A., Salm, B., 1992. Die Bestimmung der mittleren Anrissmächtigkeit d0 zurBerechnung von Fliesslawinen. Interner Bericht, vol. 668. Eidg. Institut für Schnee-und Lawinenforschung. 16 pp.
Doswell, C.A., Davie-Jones, R., Keller, D.L., 1990. On summary measures of skill in rareevent forecasting based on contingency-tables. Weather Forecast. 5 (4), 576–585.
Fawcett, T., 2006. An introduction to ROC analysis. Pattern Recogn. Lett. 27 (8), 861–874.Föhn, P., Meister, R., 1982. Determination of avalanche magnitude and frequency by
direct observations and/or with aid of indirect snowcover data. Proceedings IUFRO/FAO Colloquium on Research on Small Torrential Watersheds (incl. Avalanches),Grenoble, France, June 1981. Mitteilungen der forstlichen Bundesversuchsanstalt,Vienna, Austria, vol. 144, pp. 207–228.
Floyer, J.A., McClung, D.M., 2003. Numerical avalanche prediction: Bear Pass, BritishColumbia, Canada. Cold Reg. Sci. Technol. 37 (3), 333–342.
Gruber, U., Margreth, S., 2001. Winter 1999: a valuable test of the avalanche-hazardmapping procedure in Switzerland. Ann. Glaciol. 32, 328–332.
Hendrikx, J., Owens, I., Carran, W., Carran, A., 2005. Avalanche activity in an extrememaritime climate: the application of classification trees for forecasting. Cold Reg.Sci. Technol. 43 (1–2), 104–116.
Kantz,H., Altmann, E.G., Hallerberg, S., Holstein,D., Riegert, A., 2006.Dynamical interpretationof extreme events: predictability and predictions. In: Jentsch, V., Kantz, H., Albeverio, S.(Eds.), Extreme Events in Nature and Society. Springer, Berlin, Germany, pp. 69–93.
McClung, D.M., 1999. The encounter probability for mountain slope hazards. Can.Geotech. J. 36, 1195–1196.
Mears, A.I., 1992. Snow-avalanche hazard analysis for land-use planning andengineering. Bulletin. Colorado Geological Survey, vol. 59. Department of NaturalResources, Denver CO, U.S.A. 55 pp.
Salm, B., 1982. Lawinenkunde für den Praktiker. Verlag des Schweizer Alpen-Club SAC,Bern, Switzerland. 148 pp.
Schneebeli, M., Laternser, M., Föhn, P., Ammann, W., 1998. Wechselwirkungen zwischenKlima, Lawinen und technischen Massnahmen. Nationales Forschungsprogramm“Klimaänderungen und Naturkatastrophen” (NFP 31), Schlussbericht. vdfHochschulverlag an der ETH Zürich, Zurich, Switzerland. 134 pp.
Schweizer, J., 2008. On the predictability of snowavalanches. In: Campbell, C., Conger, S.,Haegeli, P. (Eds.), Proceedings ISSW 2008, International Snow Science Workshop,Whistler, Canada, 21–27 September 2008, pp. 688–692.
Schweizer, J., Wiesinger, T., 2001. Snow profile interpretation for stability evaluation.Cold Reg. Sci. Technol. 33 (2–3), 179–188.
Sovilla, B., Burlando, P., Bartelt, P., 2006. Field experiments and numerical modeling ofmass entrainment in snow avalanches. J. Geophys. Res. 111 (F3), F03007.
Spiegel, M.R., Stephens, L.J., 1999. Schaum's Outline of Theory and Problems of Statistics.Schaum's Outline Series. McGraw-Hill, New York. 538 pp.
Stoffel, A., Meister, R., Schweizer, J., 1998. Spatial characteristics of avalanche activity inan alpine valley — a GIS approach. Ann. Glaciol. 26, 329–336.
Stoffel, L., Schweizer, J., 2008. Guidelines for avalanche control services: organization,hazard assessment and documentation — an example from Switzerland. In:Campbell, C., Conger, S., Haegeli, P. (Eds.), Proceedings ISSW 2008, InternationalSnow Science Workshop, Whistler, Canada, 21–27 September 2008, pp. 483–489.
Wilhelm, C., 1998. Quantitative risk analysis for evaluation of avalanche protectionprojects. In: Hestnes, E. (Ed.), 25 Years of Snow Avalanche Research, Voss, Norway,12–16 May 1998. Norwegian Geotechnical Institute, Oslo, Norway, pp. 288–293.
Wilks, D.S., 1995. Statistical methods in the atmospheric sciences: an introduction.International Geophysics, 59. Academic Press, San Diego CA, U.S.A. 467 pp.