Embed Size (px)
Citation preview
Front and internal velocity distribution in powder snow avalanches
Jan-Thomas Fischer∗,a, Anselm Kohlerb,c, Andreas Koflera, Betty Sovillab, Jim McElwainec
aAustrian Research Centre for Forests (BFW), Innsbruck, AustriabWSL Institute for Snow and Avalanche Research SLF, Davos, Switzerland
cUniversity of Durham, Durham, United Kingdom
ABSTRACT: Accurate velocity measurements of avalanches are essential for testing simulation tools andfor performing risk mitigating studies. However, the flow of avalanches is complicated and not described byone unique velocity. In particular frontal approach velocities may not be representative for the internal flowdynamics. Furthermore measured velocities vary greatly not only with avalanche size and type but also withthe instrument used. Optical methods, such as videogrammetry and photogrammetry can provide accuratemeasurements, but only of the outermost boundary and for large avalanches the inner core of the avalancheis nearly always concealed by a powder cloud. Radar of the appropriate wavelength can penetrate throughthe overlying cloud and directly measure this inner core, which is usually the most destructive part of theavalanche. In this work we investigate the velocity distribution of the inner avalanche core by combining radardata from two different systems, both installed at the Vallee de la Sionne avalanche test site, in Switzerland.Both systems operate at a frequency of 5-6 GHz which penetrates through the cloud and reflects of denseflow structures or lumps larger than around 50 mm. One radar is a phased array FMCW system, that can trackfronts and internal surges with unprecedented spatial resolution but does not directly measure velocities. Theother system is a pulsed Doppler system that directly measures velocity distributions in a coarse spatialresolution of around 50 m. By combining the data from both systems we can describe the velocity distributionalong the length of the avalanche. Our measurements show that main material velocities in the avalanchehead, can reach up to approximately two times the approach velocity.
Key words: avalanche dynamics, radar measurement, velocity, avalanche head dynamics
1. INTRODUCTION
Doppler radar measurements of avalanche veloci-ties have been performed since the 1980s (Salmand Gubler, 1985). Over the years measurementtechniques have been improved and pulsed Dopplerradar systems have been used to measure thevelocity of a moving avalanche along its track(Randeu et al., 1990; Schreiber et al., 2001). Adetailed review can be found in Gauer et al. (2007b).Pulsed Doppler radar measurements are non-intrusive and provide information of the velocitiesof the avalanche body. Measurements have beenperformed at various test sites including Ryggfonn(Rgf), Norway (Gauer et al., 2007b,a) and the Valleede la Sionne (VdlS), Switzerland (Rammer et al.,2007, figure 1). Next generation radar measure-ment techniques such as phased array frequencymodulated continuous wave (FMCW) radar systemsprovide unprecedented spatial resolution (Vriend
∗Corresponding author address: Austrian Research Centre forForests (BFW), Department of Natural Hazards, Rennweg 1, A-6020 Innsbruck, Austria; Tel.: +43-512 573933 5102
Email address: [email protected] (Jan-ThomasFischer)
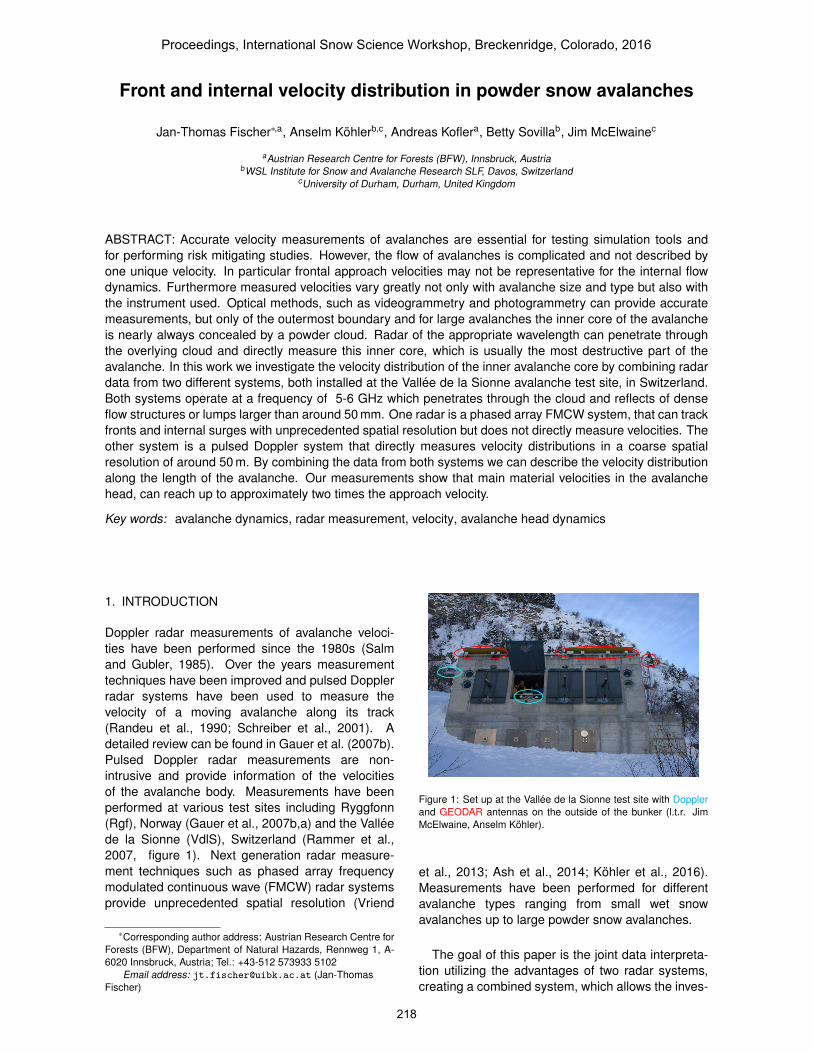
Figure 1: Set up at the Vallee de la Sionne test site with Dopplerand GEODAR antennas on the outside of the bunker (l.t.r. JimMcElwaine, Anselm Kohler).
et al., 2013; Ash et al., 2014; Kohler et al., 2016).Measurements have been performed for differentavalanche types ranging from small wet snowavalanches up to large powder snow avalanches.
The goal of this paper is the joint data interpreta-tion utilizing the advantages of two radar systems,creating a combined system, which allows the inves-
Proceedings, International Snow Science Workshop, Breckenridge, Colorado, 2016
218
tigation of avalanche velocities from a new point ofview. To achieve this we compare detailed measure-ments of frontal approach velocities obtained fromGEODAR with Doppler velocity distributions in theavalanche head. The velocity distribution in the fore-most part, i.e. the avalanche head, is of particularinterest for the flow dynamics and to interpret impactscenarios of the avalanche with obstacles.
2. AVALANCHE PATH AND DATA
On the 3 February 2015 five avalanches were arti-ficially triggered in Vallee de la Sionne (VdlS) testsite. During the five preceding days nearly 1 m ofnew snow had fallen on a 1.35 m thick snow-coverwhich consisted of weakly bonded faced crystals atthe surface and unstable layer of depth hoar on theground (SLF, 2015).
The weather station “Donin du Jour” (VDS2)at 2390 m asl in the close proximity north of theavalanche path showed the prevailing strong west-erly winds with peak velocities higher than 40 km/hthat loaded the release areas with wind packedsnow. The air temperature stayed below -10 ◦C, pre-venting the consolidation of the cold new snow andresulting in an unstable snow pack.
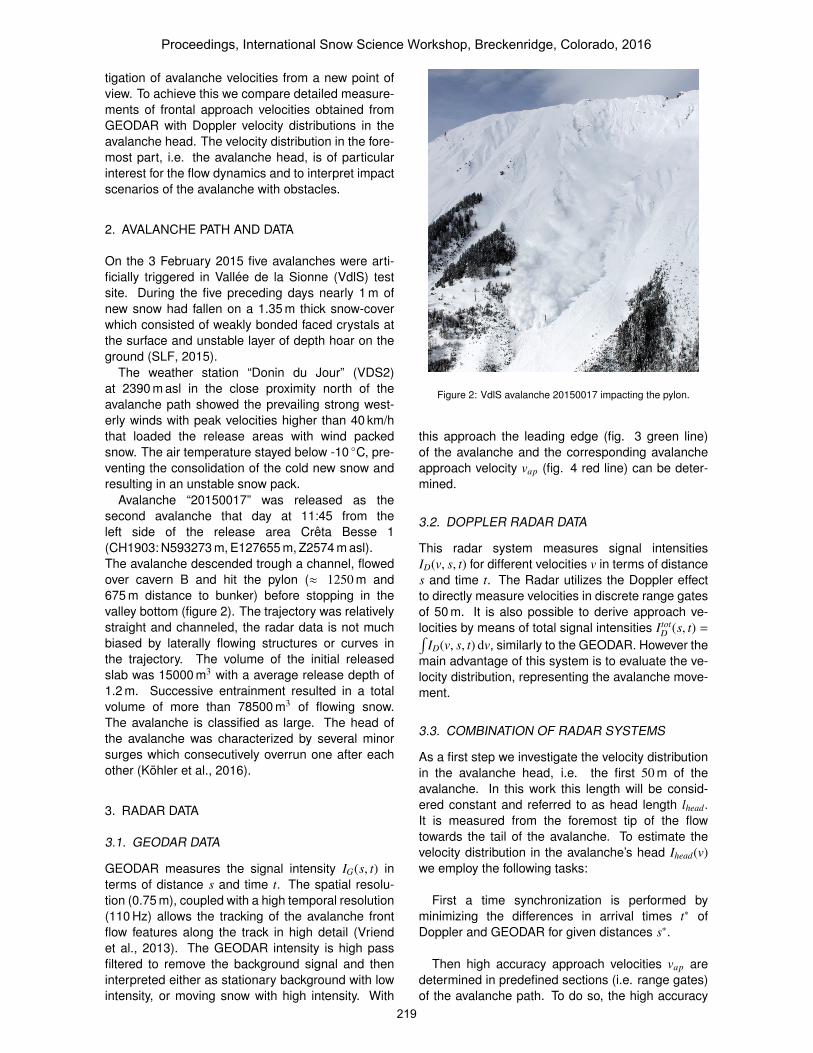
Avalanche “20150017” was released as thesecond avalanche that day at 11:45 from theleft side of the release area Creta Besse 1(CH1903: N593273 m, E127655 m, Z2574 m asl).The avalanche descended trough a channel, flowedover cavern B and hit the pylon (≈ 1250 m and675 m distance to bunker) before stopping in thevalley bottom (figure 2). The trajectory was relativelystraight and channeled, the radar data is not muchbiased by laterally flowing structures or curves inthe trajectory. The volume of the initial releasedslab was 15000 m3 with a average release depth of1.2 m. Successive entrainment resulted in a totalvolume of more than 78500 m3 of flowing snow.The avalanche is classified as large. The head ofthe avalanche was characterized by several minorsurges which consecutively overrun one after eachother (Kohler et al., 2016).
3. RADAR DATA
3.1. GEODAR DATA
GEODAR measures the signal intensity IG(s, t) interms of distance s and time t. The spatial resolu-tion (0.75 m), coupled with a high temporal resolution(110 Hz) allows the tracking of the avalanche frontflow features along the track in high detail (Vriendet al., 2013). The GEODAR intensity is high passfiltered to remove the background signal and theninterpreted either as stationary background with lowintensity, or moving snow with high intensity. With
Figure 2: VdlS avalanche 20150017 impacting the pylon.
this approach the leading edge (fig. 3 green line)of the avalanche and the corresponding avalancheapproach velocity vap (fig. 4 red line) can be deter-mined.
3.2. DOPPLER RADAR DATA
This radar system measures signal intensitiesID(v, s, t) for different velocities v in terms of distances and time t. The Radar utilizes the Doppler effectto directly measure velocities in discrete range gatesof 50 m. It is also possible to derive approach ve-locities by means of total signal intensities Itot
D (s, t) =∫ID(v, s, t) dv, similarly to the GEODAR. However the
main advantage of this system is to evaluate the ve-locity distribution, representing the avalanche move-ment.
3.3. COMBINATION OF RADAR SYSTEMS
As a first step we investigate the velocity distributionin the avalanche head, i.e. the first 50 m of theavalanche. In this work this length will be consid-ered constant and referred to as head length lhead.It is measured from the foremost tip of the flowtowards the tail of the avalanche. To estimate thevelocity distribution in the avalanche’s head Ihead(v)we employ the following tasks:
First a time synchronization is performed byminimizing the differences in arrival times t∗ ofDoppler and GEODAR for given distances s∗.
Then high accuracy approach velocities vap aredetermined in predefined sections (i.e. range gates)of the avalanche path. To do so, the high accuracy
Proceedings, International Snow Science Workshop, Breckenridge, Colorado, 2016
219
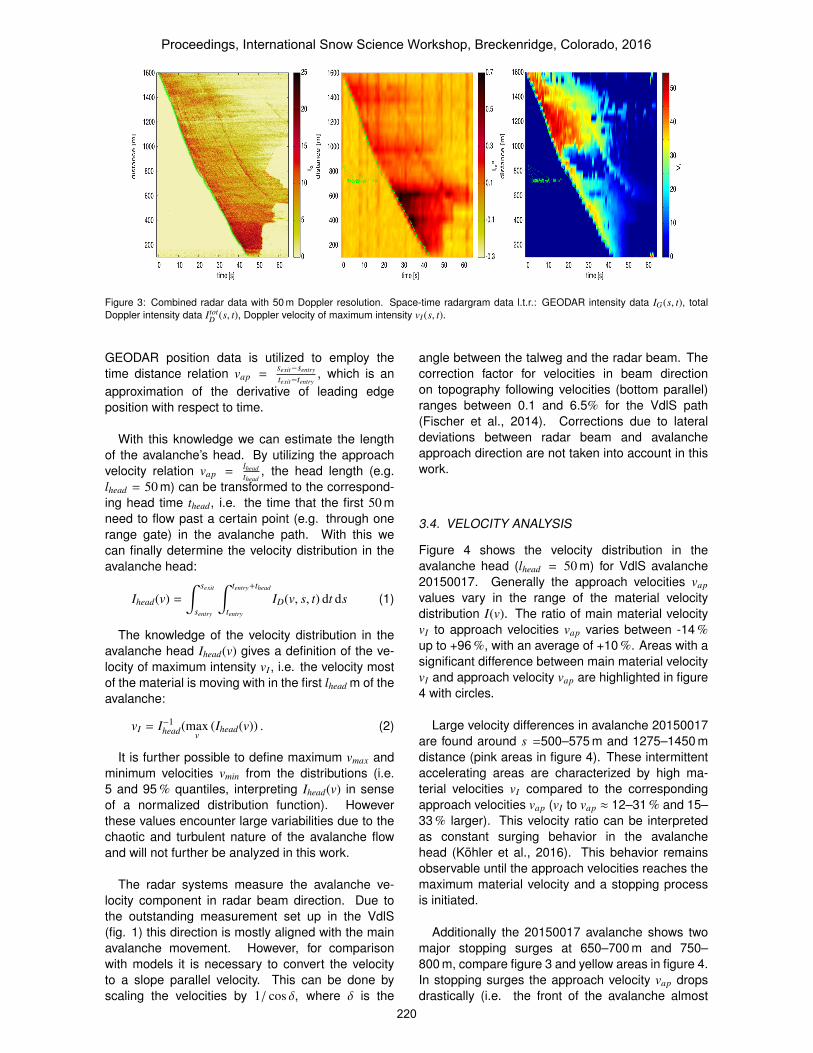
Figure 3: Combined radar data with 50 m Doppler resolution. Space-time radargram data l.t.r.: GEODAR intensity data IG(s, t), totalDoppler intensity data Itot
D (s, t), Doppler velocity of maximum intensity vI (s, t).
GEODAR position data is utilized to employ thetime distance relation vap =
sexit−sentry
texit−tentry, which is an
approximation of the derivative of leading edgeposition with respect to time.
With this knowledge we can estimate the lengthof the avalanche’s head. By utilizing the approachvelocity relation vap =
lheadthead
, the head length (e.g.lhead = 50 m) can be transformed to the correspond-ing head time thead, i.e. the time that the first 50 mneed to flow past a certain point (e.g. through onerange gate) in the avalanche path. With this wecan finally determine the velocity distribution in theavalanche head:
Ihead(v) =∫ sexit
sentry
∫ tentry+thead
tentry
ID(v, s, t) dt ds (1)
The knowledge of the velocity distribution in theavalanche head Ihead(v) gives a definition of the ve-locity of maximum intensity vI , i.e. the velocity mostof the material is moving with in the first lhead m of theavalanche:
vI = I−1head(max
v(Ihead(v)) . (2)
It is further possible to define maximum vmax andminimum velocities vmin from the distributions (i.e.5 and 95 % quantiles, interpreting Ihead(v) in senseof a normalized distribution function). Howeverthese values encounter large variabilities due to thechaotic and turbulent nature of the avalanche flowand will not further be analyzed in this work.
The radar systems measure the avalanche ve-locity component in radar beam direction. Due tothe outstanding measurement set up in the VdlS(fig. 1) this direction is mostly aligned with the mainavalanche movement. However, for comparisonwith models it is necessary to convert the velocityto a slope parallel velocity. This can be done byscaling the velocities by 1/ cos δ, where δ is the
angle between the talweg and the radar beam. Thecorrection factor for velocities in beam directionon topography following velocities (bottom parallel)ranges between 0.1 and 6.5% for the VdlS path(Fischer et al., 2014). Corrections due to lateraldeviations between radar beam and avalancheapproach direction are not taken into account in thiswork.
3.4. VELOCITY ANALYSIS
Figure 4 shows the velocity distribution in theavalanche head (lhead = 50 m) for VdlS avalanche20150017. Generally the approach velocities vap
values vary in the range of the material velocitydistribution I(v). The ratio of main material velocityvI to approach velocities vap varies between -14 %up to +96 %, with an average of +10 %. Areas with asignificant difference between main material velocityvI and approach velocity vap are highlighted in figure4 with circles.
Large velocity differences in avalanche 20150017are found around s =500–575 m and 1275–1450 mdistance (pink areas in figure 4). These intermittentaccelerating areas are characterized by high ma-terial velocities vI compared to the correspondingapproach velocities vap (vI to vap ≈ 12–31 % and 15–33 % larger). This velocity ratio can be interpretedas constant surging behavior in the avalanchehead (Kohler et al., 2016). This behavior remainsobservable until the approach velocities reaches themaximum material velocity and a stopping processis initiated.
Additionally the 20150017 avalanche shows twomajor stopping surges at 650–700 m and 750–800 m, compare figure 3 and yellow areas in figure 4.In stopping surges the approach velocity vap dropsdrastically (i.e. the front of the avalanche almost
Proceedings, International Snow Science Workshop, Breckenridge, Colorado, 2016
220
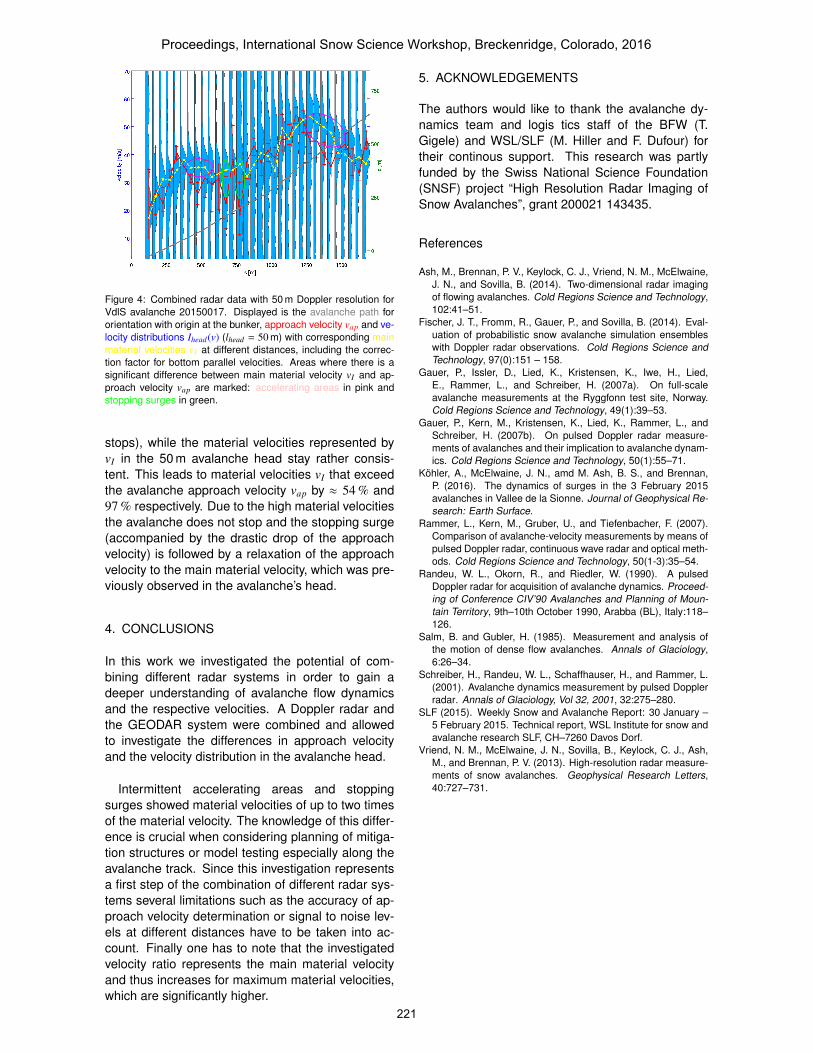
Figure 4: Combined radar data with 50 m Doppler resolution forVdlS avalanche 20150017. Displayed is the avalanche path fororientation with origin at the bunker, approach velocity vap and ve-locity distributions Ihead(v) (lhead = 50 m) with corresponding mainmaterial velocities vI at different distances, including the correc-tion factor for bottom parallel velocities. Areas where there is asignificant difference between main material velocity vI and ap-proach velocity vap are marked: accelerating areas in pink andstopping surges in green.
stops), while the material velocities represented byvI in the 50 m avalanche head stay rather consis-tent. This leads to material velocities vI that exceedthe avalanche approach velocity vap by ≈ 54 % and97 % respectively. Due to the high material velocitiesthe avalanche does not stop and the stopping surge(accompanied by the drastic drop of the approachvelocity) is followed by a relaxation of the approachvelocity to the main material velocity, which was pre-viously observed in the avalanche’s head.
4. CONCLUSIONS
In this work we investigated the potential of com-bining different radar systems in order to gain adeeper understanding of avalanche flow dynamicsand the respective velocities. A Doppler radar andthe GEODAR system were combined and allowedto investigate the differences in approach velocityand the velocity distribution in the avalanche head.
Intermittent accelerating areas and stoppingsurges showed material velocities of up to two timesof the material velocity. The knowledge of this differ-ence is crucial when considering planning of mitiga-tion structures or model testing especially along theavalanche track. Since this investigation representsa first step of the combination of different radar sys-tems several limitations such as the accuracy of ap-proach velocity determination or signal to noise lev-els at different distances have to be taken into ac-count. Finally one has to note that the investigatedvelocity ratio represents the main material velocityand thus increases for maximum material velocities,which are significantly higher.
5. ACKNOWLEDGEMENTS
The authors would like to thank the avalanche dy-namics team and logis tics staff of the BFW (T.Gigele) and WSL/SLF (M. Hiller and F. Dufour) fortheir continous support. This research was partlyfunded by the Swiss National Science Foundation(SNSF) project “High Resolution Radar Imaging ofSnow Avalanches”, grant 200021 143435.
References
Ash, M., Brennan, P. V., Keylock, C. J., Vriend, N. M., McElwaine,J. N., and Sovilla, B. (2014). Two-dimensional radar imagingof flowing avalanches. Cold Regions Science and Technology,102:41–51.
Fischer, J. T., Fromm, R., Gauer, P., and Sovilla, B. (2014). Eval-uation of probabilistic snow avalanche simulation ensembleswith Doppler radar observations. Cold Regions Science andTechnology, 97(0):151 – 158.
Gauer, P., Issler, D., Lied, K., Kristensen, K., Iwe, H., Lied,E., Rammer, L., and Schreiber, H. (2007a). On full-scaleavalanche measurements at the Ryggfonn test site, Norway.Cold Regions Science and Technology, 49(1):39–53.
Gauer, P., Kern, M., Kristensen, K., Lied, K., Rammer, L., andSchreiber, H. (2007b). On pulsed Doppler radar measure-ments of avalanches and their implication to avalanche dynam-ics. Cold Regions Science and Technology, 50(1):55–71.
Kohler, A., McElwaine, J. N., amd M. Ash, B. S., and Brennan,P. (2016). The dynamics of surges in the 3 February 2015avalanches in Vallee de la Sionne. Journal of Geophysical Re-search: Earth Surface.
Rammer, L., Kern, M., Gruber, U., and Tiefenbacher, F. (2007).Comparison of avalanche-velocity measurements by means ofpulsed Doppler radar, continuous wave radar and optical meth-ods. Cold Regions Science and Technology, 50(1-3):35–54.
Randeu, W. L., Okorn, R., and Riedler, W. (1990). A pulsedDoppler radar for acquisition of avalanche dynamics. Proceed-ing of Conference CIV’90 Avalanches and Planning of Moun-tain Territory, 9th–10th October 1990, Arabba (BL), Italy:118–126.
Salm, B. and Gubler, H. (1985). Measurement and analysis ofthe motion of dense flow avalanches. Annals of Glaciology,6:26–34.
Schreiber, H., Randeu, W. L., Schaffhauser, H., and Rammer, L.(2001). Avalanche dynamics measurement by pulsed Dopplerradar. Annals of Glaciology, Vol 32, 2001, 32:275–280.
SLF (2015). Weekly Snow and Avalanche Report: 30 January –5 February 2015. Technical report, WSL Institute for snow andavalanche research SLF, CH–7260 Davos Dorf.
Vriend, N. M., McElwaine, J. N., Sovilla, B., Keylock, C. J., Ash,M., and Brennan, P. V. (2013). High-resolution radar measure-ments of snow avalanches. Geophysical Research Letters,40:727–731.
Proceedings, International Snow Science Workshop, Breckenridge, Colorado, 2016
221