Embed Size (px)
Citation preview
2003 Proceedings of the Midwest Business Economics Association 16
ON ENTREPRENEURS’ RISK ATTITUDES
Mohammed Khayum, University of Southern Indiana Joy Peluchette, University of Southern Indiana
ABSTRACT It is widely accepted that there is a direct relationship between entrepreneurial activity and risk bearing. An extension of this view is that individuals who opt to be entrepreneurs are likely to exhibit a relatively low degree of risk aversion. Data from the 1998 Survey of Consumer Finances are used to examine the extent of heterogeneity in risk preferences among entrepreneurs. Findings suggest that there are statistically significant differences among entrepreneurs with regard to risk attitudes and risk taking behavior.
INTRODUCTION This paper provides an empirical investigation of heterogeneity in risk attitudes among entrepreneurs using U.S. cross-sectional data. The motivation for the paper comes from several sources. First, there is increasing recognition that there are few insights about heterogeneity among entrepreneurs in the entrepreneurship literature (Morris, 2002; Shane & Venkataraman, 2000). Second, previous empirical work on differences among entrepreneurs has been limited to characteristics such as gender (Masters & Meier, 1988; Perry, 2002), race (Robb, 2002), national culture (Mitchell, Smith, Morse, & Seawright, 2002), and equity returns (Moskowitz and Vissing-Jorgensen, 2002). Third, evidence of considerable wealth dispersion among U.S. entrepreneurs1 may be linked to differences in risk preferences according to the major theories of wealth distribution.
This paper differs from previous studies in two important aspects. First, it explores differences in risk preferences and behavior among entrepreneurs, in contrast to many previous studies, which start with the premise that it is the relatively low degree of risk aversion of entrepreneurs that differentiates them from other individuals (Cramer, Hartog, Jonker, & Van
1 Data from the Surveys of Consumer Finances (various years) indicate that the variance of networth among self-employed households is of comparable magnitude to the variance of networth for households that are employed by others. A comparison of the median and mean values of networth for entrepreneurs also indicates significant positive skewness in their wealth distribution.
Praag, 2002; Douglas & Shepherd, 1999, 2002). Second, it examines heterogeneity in risk preferences among entrepreneurs’ in relation to their investment horizons, willingness to defer consumption, motives for saving, their perceptions of how lucky they are relative to others, and the amount of equity the entrepreneur has in the business. The focus on risk attitudes as the basis for establishing heterogeneity among entrepreneurs reflects contributions from models of lifetime consumption and portfolio choice and expected utility theory. Lifetime consumption and portfolio choice models (Samuelson, 1969; Merton, 1969; 1971) predict that savings decisions and allocations across different types of assets (e.g. risk free versus risky assets) will vary across households according to preferences, wealth, and investment horizon.2 Standard and state dependent expected utility models predict that the risk preferences of economic agents can also vary depending on whether they are more responsive to changes in the size or the probability of receiving the ‘prize’ involved (Becker, 1968; Neilson and Winter, 1997). These theoretical results suggest that savings decisions and risk propensities are contingent upon agent characteristics and situations. Therefore, a primary purpose of this paper is to investigate the relationship between the circumstances of entrepreneurs and their attitudes towards risk.
Risk attitude is a key preference feature which affects household welfare based on the proposition that in the long run a higher rate of return is obtained by higher risk taking. Thus, households that are less willing to undertake high-risk investments are viewed to be less likely to achieve more than an average growth in networth. To the extent that there is a positive correlation between households’ networth and their
2 Brinson, Hood and Beebower (1986) provide evidence of the impact of asset allocation decisions by showing that over 90 percent of the variability of portfolio returns can be explained by asset allocation.
2003 Proceedings of the Midwest Business Economics Association 17
willingness to incur risk, the distribution of networth is affected. Thus, larger networth households are more likely to achieve higher returns on their portfolios than smaller networth households. Since entrepreneurs on average, are in the upper end of the wealth distribution, the implication is that greater understanding of savings decisions made by entrepreneurs can help to explain the generation of wealth differences (Quadrini and Rios-Rull, 1997). Consequently, this paper will examine the risk attitudes and behavior of entrepreneurs at varying wealth levels. In addition, we will examine whether indicators of risk propensity for entrepreneurs correlate with choices in other areas involving risk such as health and retirement.
The rest of the paper proceeds as follows. Section 2 discusses some results from the literature regarding risk propensities and behavior. Section 3 discusses the data and methods used in the study. Section 4 presents summary statistics on demographic, behavioral, and attitudinal variables for entrepreneurs and other households. Statistical tests and the results of econometric modeling are also discussed in this section. The paper concludes with a discussion of the implications of the results and direction for future research.
LITERATURE REVIEW AND PROPOSITIONS Recognizing the importance of risk preferences in understanding the economic behavior of households, Pratt (1964) and Arrow (1965), developed the concepts of absolute and relative risk aversion as measures of the unwillingness of households to incur risk. Linking risk aversion to actual behavior, however, has been problematic, as illustrated by the considerable variation in risk aversion estimates.3 Two distinct approaches are used to assess risk attitudes and obtain risk aversion estimates. One approach uses information on the composition of individuals’ wealth portfolios and the other utilizes information from individual’s responses to choices over lotteries.
A commonly used framework in the portfolio composition approach is that provided by Friend and Blume (1975). In their study they provide a measurable expression that links the concept of relative risk aversion to an individual’s behavior in terms of portfolio allocation between risky and risk-free assets.4
3 In the literature risk aversion estimates range from below zero to above 7. 4 This result is obtained within an intertemporal choice setting consistent with expected utility maximization under a set of
Specifically, the proportion of total wealth held as risky assets is a function of the excess rate of return from holding risky assets and the individual’s relative risk aversion as follows:5
⎟⎟⎠
⎞⎜⎜⎝
⎛⎟⎟⎠
⎞⎜⎜⎝
⎛ −=
im
fmi C
rrE 1)(2σ
α (1)
where iα is the proportion risky assets in the individual’s portfolio, mr is the rate of return on a market portfolio of all risky assets, fr is the rate
of return on the risk-free asset, 2mσ is the variance
of the market portfolio, and iC is individual 'i s coefficient of relative risk aversion.
A testable proposition from equation (1) is that there is a positive relationship between the share of risky assets in an individual’s wealth portfolio and the individual’s willingness to incur risk. Another issue that calculations based on equation (1) can allow to address is: what explains relative risk aversion? In particular, are entrepreneurs’ risk attitudes significant influences on their coefficients of relative risk aversion? To conduct this type of analysis equation (1) is used to compute the coefficient of relative risk aversion based on estimates of the ratio of the expected risk premium on risky assets to the variance of the risk portfolio returns (first bracketed term in equation (1))6 and the proportion of wealth held as risky assets by individuals.
Another strand in the literature related to the assessment of risk attitudes utilizes the expected utility framework. Within the standard expected utility framework, two conditions establish the risk preference of an economic agent (Becker, 1968). These are the responsiveness of individuals to changes in the magnitude and the probability of receiving the ‘prize’ associated with the situation under consideration. Since Becker’s
assumptions including homogeneity of expectations and a frictionless capital market. 5 This result is the most basic formulation provided by Friend and Blume (1975) since it ignores the role of taxes and measures of wealth that incorporates human capital. 6 Studies that use equation (1) or a variant of this approach (e.g. Hariharan, 2000) tend to assume that this estimate is the same for all households. One estimate of this ratio is 2.35 for the 1922-1999 period based on the average return and the variance of the returns for large company stocks (risky assets) and average return for T-bills (risk free returns).
2003 Proceedings of the Midwest Business Economics Association 18
analysis dealt with the risk preference of criminals, responsiveness was considered in relation to changes in the certainty and severity of punishment. Analogously, for entrepreneurs the conditions would be their responsiveness to changes in the certainty of business failure versus responsiveness to changes in the magnitude of the losses associated with business failures. The prediction from this type of model would be that an entrepreneur would be risk preferring when he/she is more responsive to a change in the probability of business failure than to a change in the magnitude of business losses.7 In contrast to the predictions of the standard expected utility model, Neilson and Winter (1997) show that the state-dependent utility framework predicts that an individual can be risk averse and yet be more sensitive to changes in the certainty than to the severity of the cost involved in an activity. 7This result is obtained in the context of an expected utility maximizing entrepreneur who engages in risk taking and faces rewards amounting to total networth, y . The entrepreneur can fail with probability p and face a loss
yl ≤ . The entrepreneur’s expected utility is given by the expression
)()1()( yUplypUEU −+−= , (2) where the entrepreneur’s von Neumann-Morgenstern utility function isU . Based on (1) the elasticity of expected utility with respect to the probability of failure is
EUplyUyU
EUp
pEUEU
p )]()([ −−=⋅∂
∂≡η
and the elasticity of expected utility with respect to the loss is
.)('EUllypU
EUl
lEUEU
l −=⋅∂
∂−≡η
Note that lp ηη > if
)(')()( lyUl
lyUyU−>
−− (3)
which cannot hold if U is risk averse, that is, if .0'' <U Accordingly, a risk averse expected utility maximizing entrepreneur cannot respond more to changes in the probability of failure than to changes in the severity of losses.
Consequently, under state-dependent utility, it is not inconsistent for a risk averse entrepreneur to be more sensitive to changes in the probability of business failure than to changes in the severity of business losses Alternatively, an entrepreneur whose behavior conforms to the proposition from the prospect theory literature that individuals tend to respond more to magnitudes than to probabilities, would exhibit a greater tolerance for risk.
A priori, there is no compelling reason to believe that either the expected utility or the state-dependent utility model best describes entrepreneurs’ preferences. Therefore, another approach to assessing entrepreneurs’ risk attitudes would be to examine characteristics and behavior of entrepreneurs that can provide insights about their responsiveness to the probability of failure and to the size of business losses. The other major approach to eliciting information about risk attitudes is to obtain answers from individuals about their choices over lotteries (Warneryd, 1996). However, inconsistent findings among the alternative ways of framing hypothetical choices are a source of difficulty with this approach. Consequently, there are ongoing efforts to uncover information from which risk attitudes can be inferred including making inferences from a wide. The following provides the logic behind a number of propositions found in the literature.
In the context of financial planning, the standard advice is for older investors to adopt more conservative portfolio strategies than younger investors. One justification is that younger individuals have a longer investment horizon than older individuals which makes it more feasible to “ride out the ups and downs of the market” (Campbell and Viceira, 2001). This implies that the length of an individual’s horizon affects the riskiness of his/her portfolio. In the context of this paper a testable proposition is those entrepreneurs with relatively longer saving and investment horizons are more likely to hold a larger share of their portfolio in risky assets than entrepreneurs with shorter investment horizons.
While there is an extensive literature on why individuals choose to become entrepreneurs, there are few insights about the dispersion of their risk preferences. One reason is that few empirical measures of entrepreneurs’ willingness to incur risk exist. A contributory factor to this
2003 Proceedings of the Midwest Business Economics Association 19
circumstance is the widely accepted premise that because entrepreneurs bear substantial risk, it is their low degree of risk aversion that differentiates them as a group from other households. In this context, it is less likely that heterogeneity of risk preferences among entrepreneurs would be seen as a primary area of study. It is generally viewed that higher levels of education are associated with a greater capacity to process information, a higher tolerance for ambiguity, and the ability to integrate complex stimuli (Hambrink & Mason, 1984). These qualities are typically associated with a capacity to cope with some types of uncertainty. Hence, another proposition to be examined is the relationship between education and the risk attitudes of entrepreneurs.
Based on these strands and propositions in the literature this paper will attempt to provide answers to the following questions using a database that provides information on the portfolio allocations of entrepreneurs as well as their responses related to their risk attitudes. One, do indicators of risk propensity correlate with the risk taken in portfolio investments? Two, do the indicators of risk propensity correlate with choices that involve risk taking or covering risks in other areas such as health and retirement? The starting hypothesis is the null hypothesis that entrepreneurs are not different from each other in relation to their risk preferences and behavior. Incorporating propositions from the literature related to risk preferences, the following specific hypotheses will be used to conduct the empirical test:
(A) There are no significant differences among entrepreneurs with regard to: ( i ) wealth; (ii) risk taking behavior; and (iii) risk attitudes.
(B) There is no significant (positive) relationship between the share of risky assets in an entrepreneur’s wealth portfolio and the entrepreneur’s willingness to incur risk.
(C) There is no significant (positive) relationship between an entrepreneur’s willingness to incur risk and the entrepreneur’s willingness to delay consumption.
(D) There is no significant (positive) relationship between an entrepreneur’s willingness to incur risk and the length of the saving and investment horizon of entrepreneurs.
(E) There is no significant (inverse) relationship between an entrepreneur’s willingness to incur risk and the entrepreneur’s emphasis on the precautionary motive for saving.
(F) There is no significant (positive) relationship between an entrepreneur’s willingness to incur risk and the entrepreneur’s perception of how lucky they are compared to others.
(G) There is no significant (positive) relationship between an entrepreneur’s willingness to incur risk and the amount of equity the entrepreneur holds in his/her business.
DATA AND METHODS The dataset used is obtained from the 1998 Survey of Consumer Finances (SCF). The SCF is known as a comprehensive source of household-level balance sheet, income, and socio-economic information for a representative sample 8 of the U.S. population. Since 1983, the Federal Reserve Board, in cooperation with the Statistics of Income Division of the Internal Revenue Service, has conducted the SCF every three years. A total of 4,305 households were interviewed in 1998. Since the networth variable is defined as net worth, and the difference between total asset holdings and total indebtedness can result in negative values, only households with non-negative networth are included in the dataset used for this paper. As a result, the final dataset consisted of 4059 households including 1,088 entrepreneurs and 2,971other households. The SCF final nonresponse-adjusted sampling weight
8 A total of 4,309 households were interviewed in the 1998 SCF – 2,813 from the area probability sample and 1,496 from a special list sample. The special list sample over-samples networthy households in order to provide a larger basis for estimates of assets held by such households since they tend to underreport compared to other households. Sample weights are provided with the database to adjust each household to an estimate of its representation in the set of all U.S. households. Descriptive statistics are calculated using the SCF weight variable to produce estimates that are representative of the 102.6 households in the U.S. in 1998.
2003 Proceedings of the Midwest Business Economics Association 20
(X42001) accounts for both the systematic properties of the sample design and differential patterns of nonresponse. The descriptive statistics reported in this paper are calculated using the SCF weight variables to produce estimates that are representative of the nearly 103 million households in the U.S. in 1998.
DESCRIPTIVE STATISTICS AND STATISTICAL TESTS
Data analysis proceeds in two stages. First, descriptive statistics are discussed and second, parametric and non-parametric tests are used to investigate statistical differences among entrepreneurs. In particular, measures of risk propensity and risky behavior are estimated against demographic, economic, behavioral, and attitudinal characteristics.
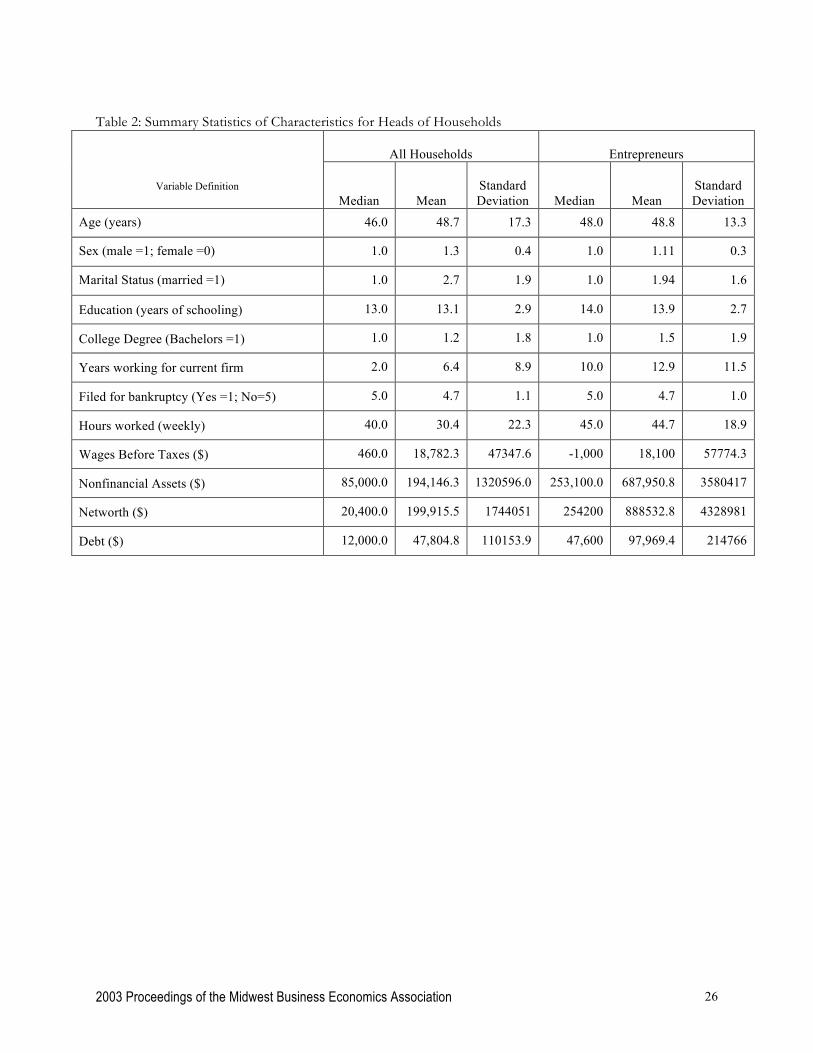
Based on the sample results from the 1998 SCF, entrepreneurs accounted for approximately 11.2 percent of the 102.5 million U.S. households in 1998. Within the group of entrepreneurs 89 percent were males and 11 percent female. As Table 2 shows, the average age of entrepreneurs was 48.8 years and the average years of schooling was 13.9 years. Compared to the rest of households, a relatively higher proportion of entrepreneurs are married while a slightly lower proportion has a college degree. Entrepreneurs were involved in the same firm for about 12.9 years on average compared to the rest of households working an average of 5.5 years with their current firm. While entrepreneurs worked an average of 44.7 hours per week, other households worked an average of 30.4 hours per week. An average annual pre-tax income of 18,100 dollars for entrepreneurs is below the average of 18,868 dollars for the rest of households.
With regard to other monetary and financial variables the differences between entrepreneurs and the other households are quite evident. Entrepreneurs have on average more than five times the value of the nonfinancial assets and more than twice the debt of other households. Risky assets as a proportion of total assets for entrepreneurs are about 1.8 times the corresponding ratio for other households and entrepreneurs on average are more willing to bear above average financial risks than the rest of households.
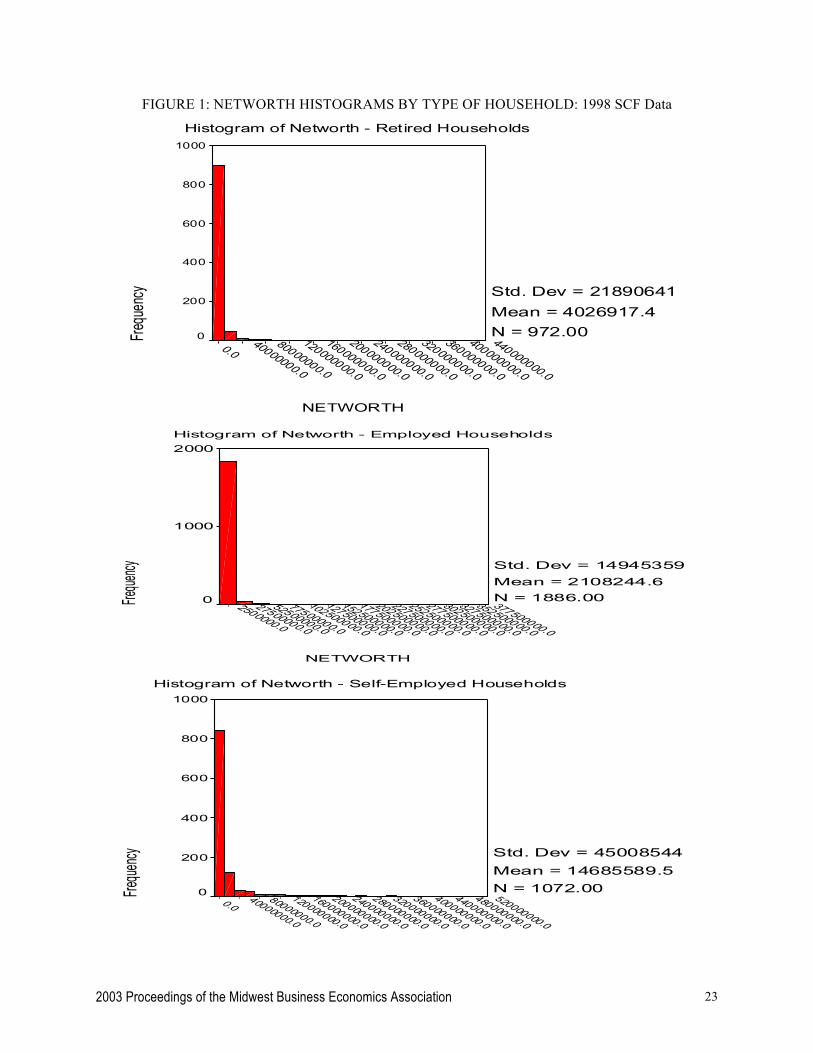
In addition, entrepreneurs’ networth is almost seven times that of workers even though the average earnings of entrepreneurs was not more than twice that of workers. The variances of networth of the self-employed and workers indicate that the level of net
worth varies widely among entrepreneurs as among other U.S. households. While 42.2 percent of all U.S. households had net assets between $100,000 and $999,999 in the case of entrepreneurs the corresponding figure is 50.5 percent. Whereas 4.5 percent of all U.S. households had net worth in excess $1,000,000, for entrepreneurs it is 17.4 percent. About 43 percent of all households have networth below $50,000 while the corresponding proportion for self-employed households is about 20 percent.
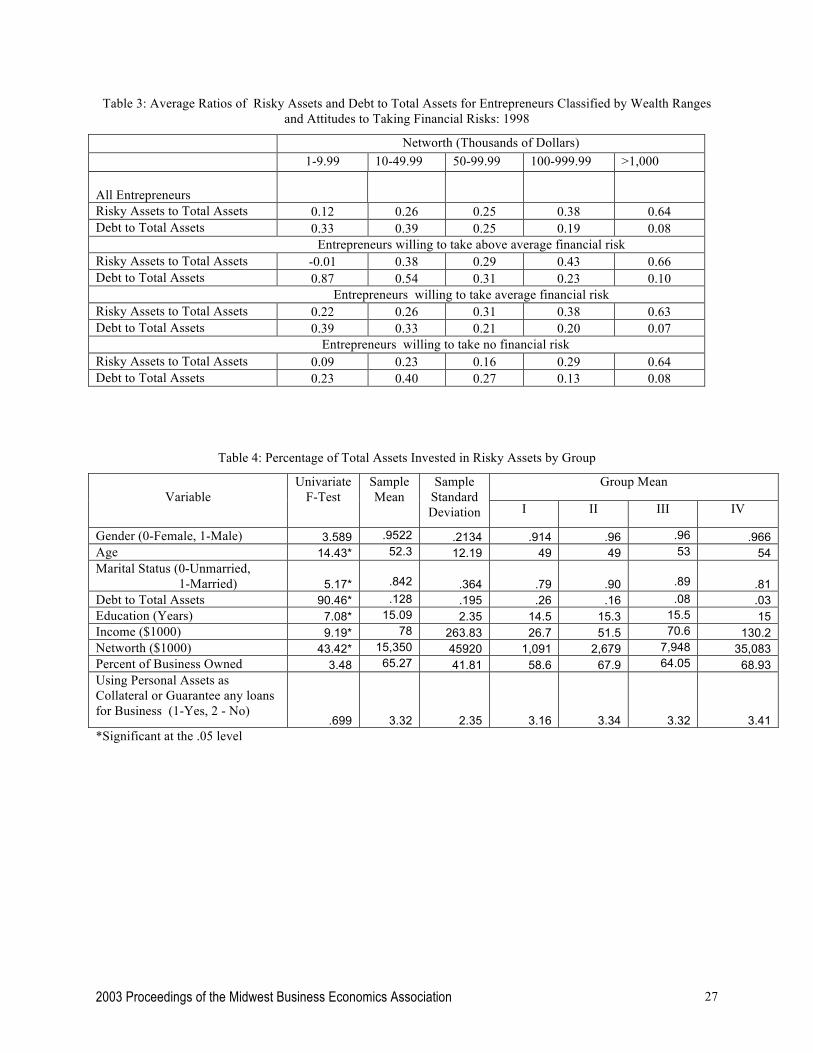
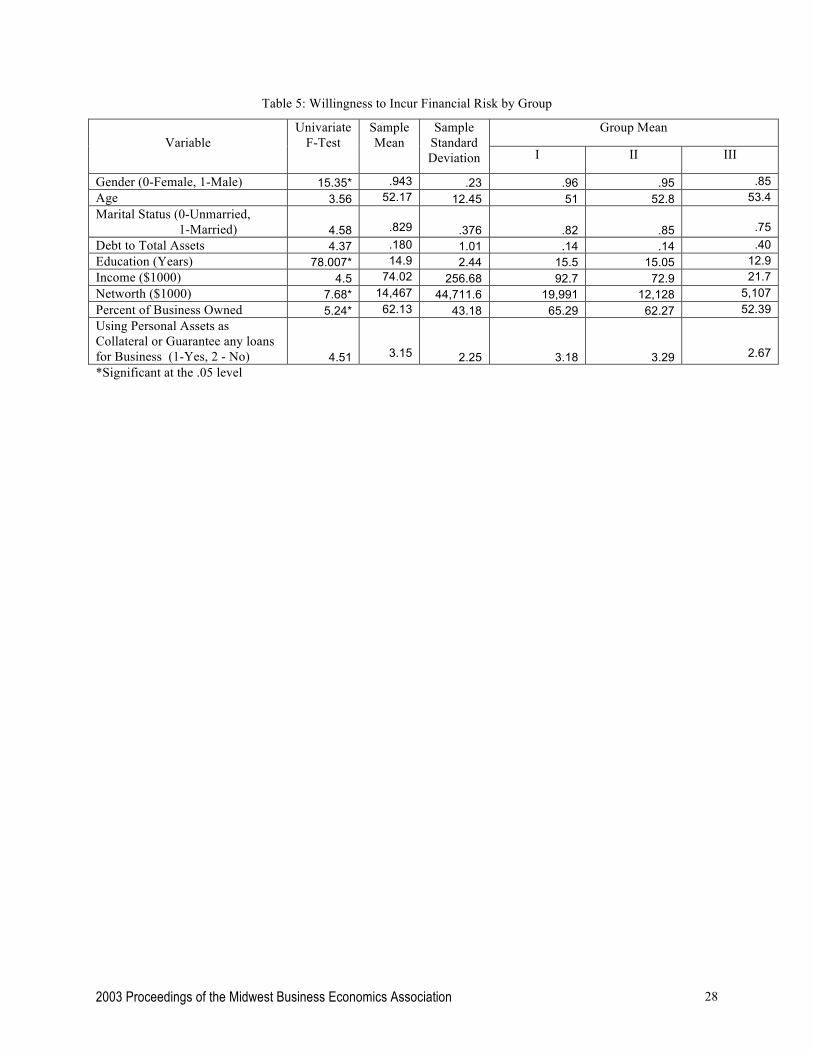
With regard to the risk attitude variable, there is a right skewed distribution, and based on the coding of this variable a right skewed distribution indicates a relatively higher concentration of households that would be willing to take financial risk. Table 3 presents ratios of risky assets and debt to total assets by various networth categories.9 As the table indicates, in general, there is a direct relationship between the share of risky assets held and networth for entrepreneurs, which is consistent with decreasing relative risk aversion. Tests across the three groups shown in Table 3 indicate that the statistical difference is between those willing to incur above average financial risk and other entrepreneurs for wealth levels between $50,000 and $99,999. At levels above $1 million, the significant difference in the ratio variable is between those willing to take above average risks and others who are willing to take only average risk. Tables 4 and 5 present the results of analysis of variance (ANOVA) tests conducted for a risk behavior variable (ratio of risky assets to total assets) and a risk attitude variable (willingness to incur financial risk). For the risky assets ratio variable the sample was divided into four groups according to the following values: 0 to less than 40 percent; 40 percent to less than 60 percent; 60 percent to less than 75 percent, and from 75 percent to 100 percent. In the case of the risk attitude variable the sample is divided into three groups. The first group represents those entrepreneurs who are willing to incur above average and substantial financial risks. The second group includes those entrepreneurs who are willing to take average risk, and the third group
9 Only households with net worth starting at $1,000 are included in the table. This restriction ensures that positive ratios of risky to total assets are considered.
2003 Proceedings of the Midwest Business Economics Association 21
represents those who are unwilling to take any financial risk.
The results in Table 4 indicate that the equality of mean values for age, marital status, the ratio of debt to total assets, education, and networth are statistically different across the subgroups 0.05 level. With regard to networth for example, there is a significant difference between each group pairing. In the case of education the difference is between group one and group two as well as between group one and group three.
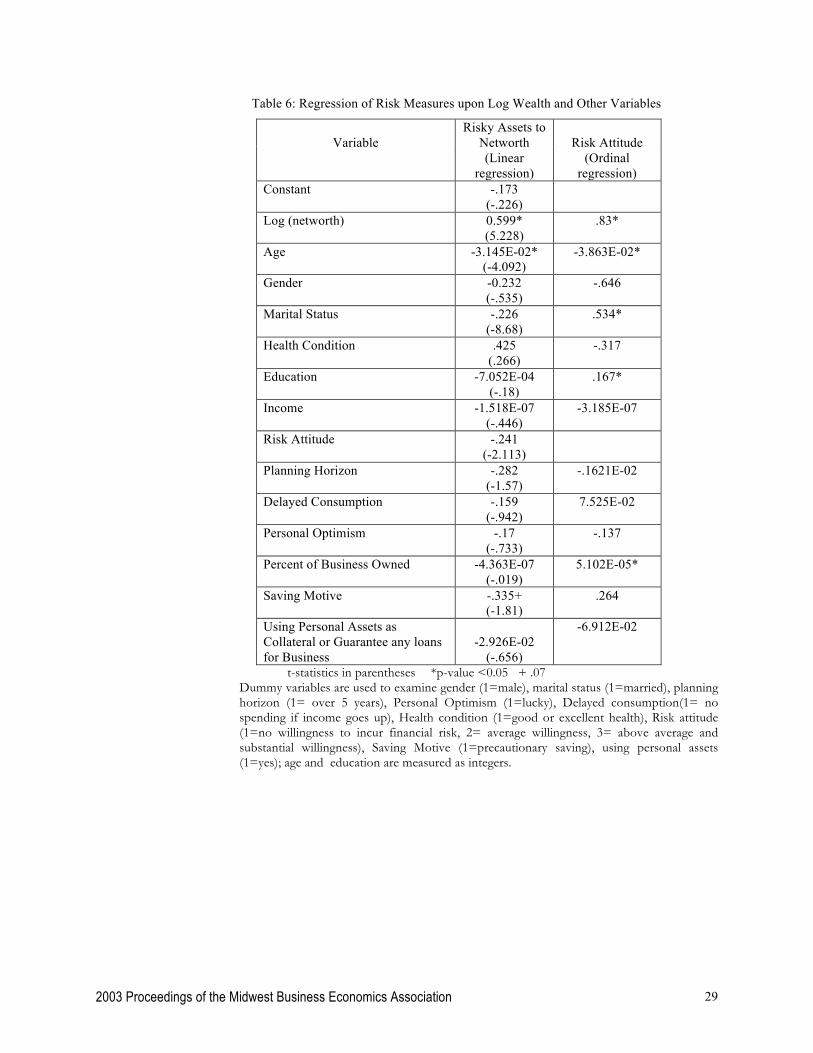
Table 5 shows that in the case of groups based on risk attitudes, significant differences exist for the followng variables: gender, education, networth, the equity held by an entrepreneur in his/her business. Table 6 presents results of regressing the risk attitude and risk taking measures on a number of background variables. For the risk attitude variable the method of analysis is ordered probit while for the calculated measure of risk aversion linear regression analysis is used. The results show that age is significant in the behavioral but not the attitudinal risk measure. Networth is significant in both instances and suggests decreasing risk aversion with increasing wealth. Mean difference t-test shows that there is no statistical difference between workers and self-employed with regard to deferral of consumption. Further, Spearman’s correlation coefficient estimates indicate that among entrepreneurs: (1) there is insignificant correlation between increased unwillingness to incur financial risk and a willingness to defer current consumption. Also, the sign of the correlation coefficient is positive though the hypothesized association is negative based on the idea that higher returns would induce deferred consumption and higher returns are positively associated with less unwillingness to incur financial risk. (2) there is significant correlation (at the 0.01 level) between increased unwillingness to incur financial risk and the saving and investment horizons of entrepreneurs. The sign of the correlation coefficient, which is negative, is consistent with the hypothesized association based on the idea that people with longer investment horizons can adopt a more risky strategy, therefore, those who are less willing to incur risk are more likely to be associated with shorter investment horizons. (3) there is insignificant correlation between increased unwillingness to incur financial risk and a precautionary
saving motive. The sign of the correlation coefficient is positive which is consistent with the idea that those who have a precautionary motive for saving are likely to be more unwilling to incur financial risk. (4) there is significant correlation (at .01 level) between increased unwillingness to incur financial risk (riskatt3) and individuals who perceive themselves to be unlucky relative to others. Sign of correlation coefficient which is positive is consistent with the hypothesized association based on the idea that people who perceive themselves to be more unlucky than others would be less willing to incur financial risk. (5) there is a significant correlation (at the 0.01 level) between increased unwillingness to incur financial risk and the ratio of risky assets to networth. The sign of the correlation coefficient, which is negative, is consistent with the hypothesized association based on the idea that as people become more unwilling to incur financial risk they are less likely to hold an increased share of their networth in risky assets. Further statistical tests indicate that there is no significant difference in the ratio of risky assets to networth between those entrepreneurs who are likely to spend more if they experience an increase in their income and those who would defer consumption when they experience an increase in income. Similarly, there is no statistical difference in risk attitude between those who defer consumption and those who do not. There is no significant difference in the ratio of risky assets to networth between those entrepreneurs who have an investment horizon in excess of five years and those who do not. There is no significant difference in the ratio of risky assets to networth between those entrepreneurs who perceive themselves to be lucky and those who do not. There is no significant difference in the ratio of risky assets to networth between those entrepreneurs whose primary saving motive was precautionary versus those whose primary saving motive was not.
Among those entrepreneurs who defer consumption, there is significant difference in the ratio of risky assets to networth between those who are willing to incur average risk and those who are who are unwilling to incur any financial risk.
2003 Proceedings of the Midwest Business Economics Association 22
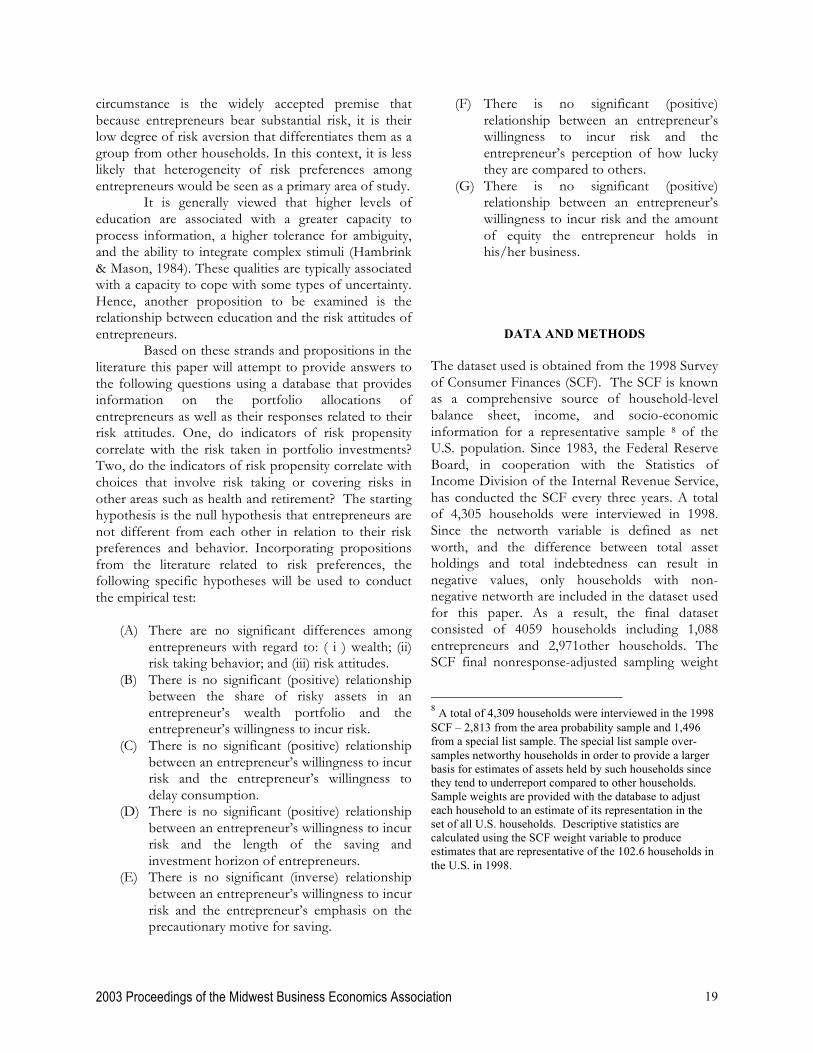
NONPARAMETRIC TESTS Chi-square test show that there is no significant relationship between consumption response to increases in income and (1) risk attitude (2) the ratio of risky assets to total wealth.
Test Statisticsa,b
3.048 .0301 1
.081 .862
Chi-SquaredfAsymp. Sig.
RISKATT3 RISKGR
Kruskal Wallis Testa.
Grouping Variable: DELAYEDb.
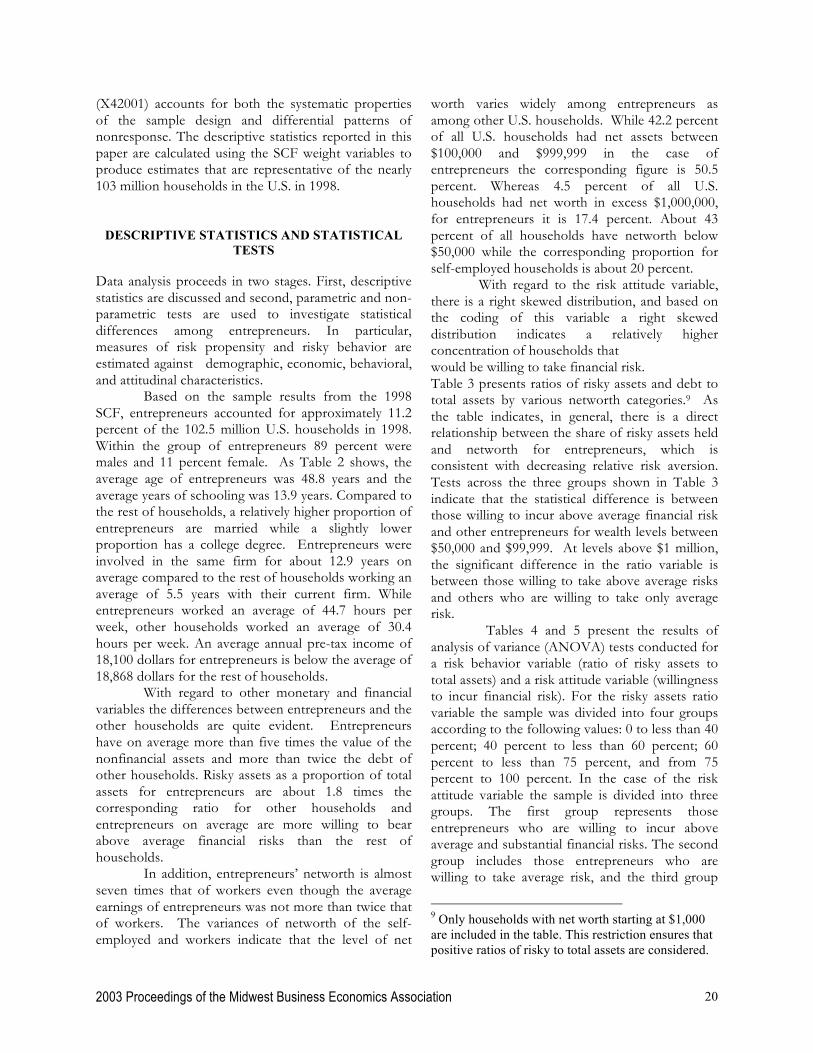
Chi-square tests of independence show that there is a significant relationship between entrepreneurs’ saving and investment horizons and (1) risk attitudes and (2) ratio of risky assets to networth
Test Statisticsa,b
17.948 5.8521 1
.000 .016
Chi-SquaredfAsymp. Sig.
RISKATT3 RISKGR
Kruskal Wallis Testa.
Grouping Variable: PLANb.
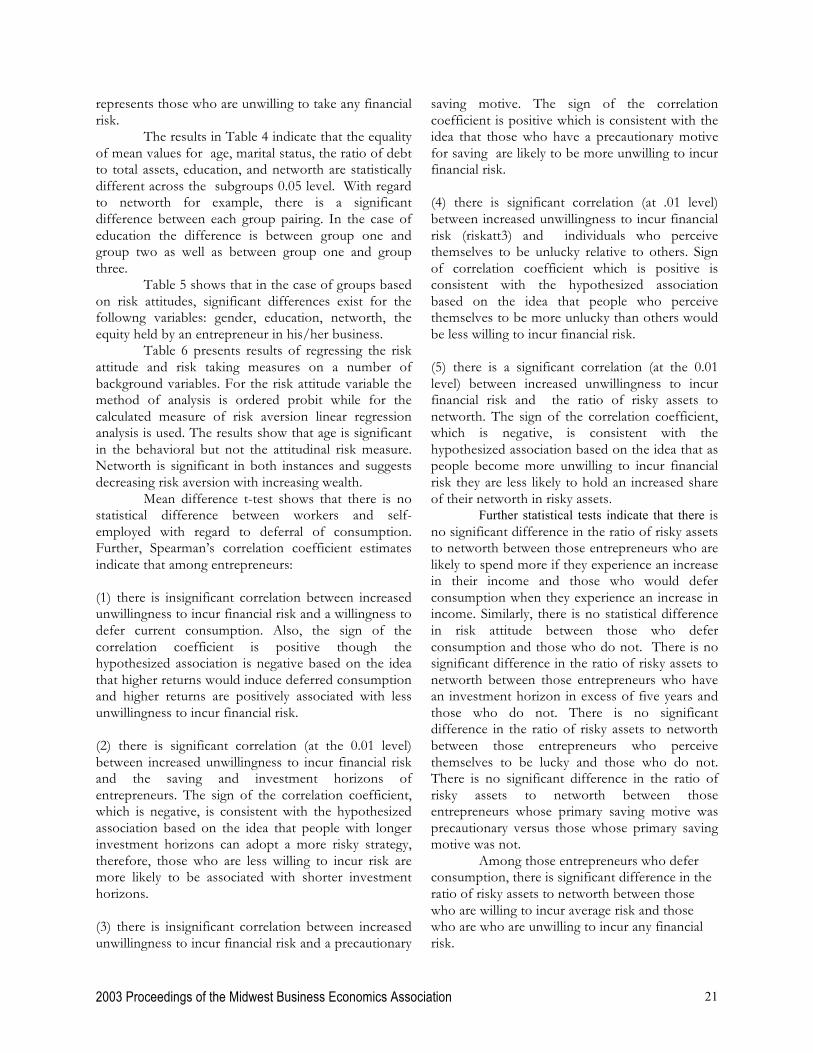
Chi-square tests of independence show that there is a significant relationship between entrepreneurs’ perceptions about how lucky or unlucky they are relative to others and (1) risk attitudes and (2) ratio of risky assets to networth
Test Statisticsa,b
18.764 24.6371 1
.000 .000
Chi-SquaredfAsymp. Sig.
RISKATT3 RISKGR
Kruskal Wallis Testa.
Grouping Variable: LUCKYb.
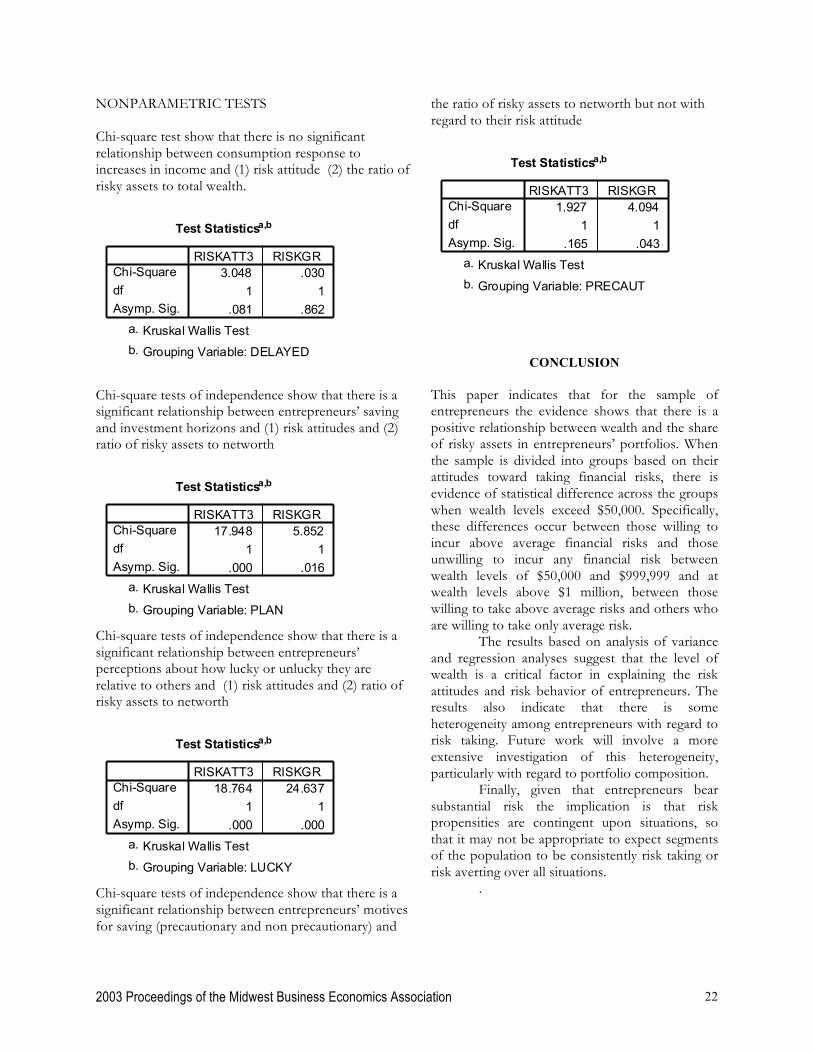
Chi-square tests of independence show that there is a significant relationship between entrepreneurs’ motives for saving (precautionary and non precautionary) and
the ratio of risky assets to networth but not with regard to their risk attitude
Test Statisticsa,b
1.927 4.0941 1
.165 .043
Chi-SquaredfAsymp. Sig.
RISKATT3 RISKGR
Kruskal Wallis Testa.
Grouping Variable: PRECAUTb.
CONCLUSION This paper indicates that for the sample of entrepreneurs the evidence shows that there is a positive relationship between wealth and the share of risky assets in entrepreneurs’ portfolios. When the sample is divided into groups based on their attitudes toward taking financial risks, there is evidence of statistical difference across the groups when wealth levels exceed $50,000. Specifically, these differences occur between those willing to incur above average financial risks and those unwilling to incur any financial risk between wealth levels of $50,000 and $999,999 and at wealth levels above $1 million, between those willing to take above average risks and others who are willing to take only average risk. The results based on analysis of variance and regression analyses suggest that the level of wealth is a critical factor in explaining the risk attitudes and risk behavior of entrepreneurs. The results also indicate that there is some heterogeneity among entrepreneurs with regard to risk taking. Future work will involve a more extensive investigation of this heterogeneity, particularly with regard to portfolio composition.
Finally, given that entrepreneurs bear substantial risk the implication is that risk propensities are contingent upon situations, so that it may not be appropriate to expect segments of the population to be consistently risk taking or risk averting over all situations.
.
2003 Proceedings of the Midwest Business Economics Association 23
FIGURE 1: NETWORTH HISTOGRAMS BY TYPE OF HOUSEHOLD: 1998 SCF Data
NETWORTH
440000000.0
400000000.0
360000000.0
320000000.0
280000000.0
240000000.0
200000000.0
160000000.0
120000000.0
80000000.0
40000000.0
0.0
Histogram of Networth - Retired HouseholdsFre
quen
cy1000
800
600
400
200
0
Std. Dev = 21890641 Mean = 4026917.4N = 972.00
NETWORTH
377500000.0
352500000.0
327500000.0
302500000.0
277500000.0
252500000.0
227500000.0
202500000.0
177500000.0
152500000.0
127500000.0
102500000.0
77500000.0
52500000.0
27500000.0
2500000.0
Histogram of Networth - Employed Households
Freque
ncy
2000
1000
0
Std. Dev = 14945359 Mean = 2108244.6N = 1886.00
520000000.0
480000000.0
440000000.0
400000000.0
360000000.0
320000000.0
280000000.0
240000000.0
200000000.0
160000000.0
120000000.0
80000000.0
40000000.0
0.0
Histogram of Networth - Self-Employed Households
Freque
ncy
1000
800
600
400
200
0
Std. Dev = 45008544 Mean = 14685589.5N = 1072.00
2003 Proceedings of the Midwest Business Economics Association 24
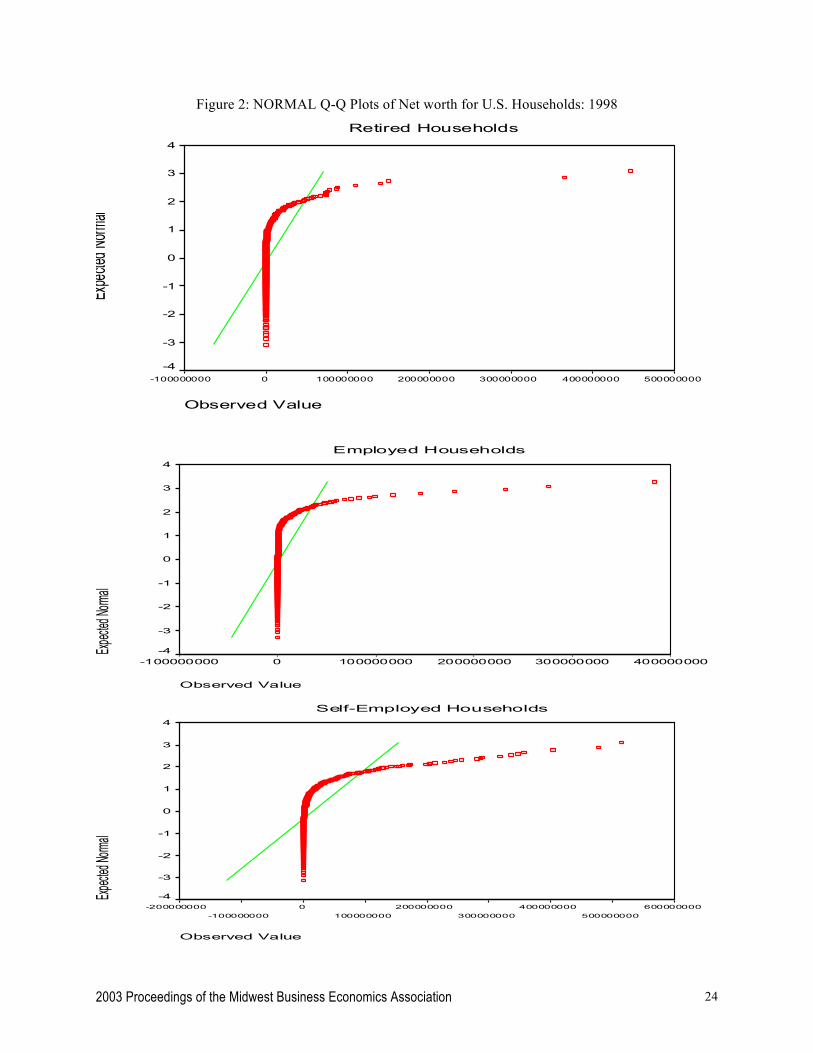
Figure 2: NORMAL Q-Q Plots of Net worth for U.S. Households: 1998 Retired Households
Observed Value
5000000004000000003000000002000000001000000000-100000000
Expe
cted N
ormal
4
3
2
1
0
-1
-2
-3
-4
Employed Households
Observed Value
4000000003000000002000000001000000000-100000000
Expect
ed Nor
mal
4
3
2
1
0
-1
-2
-3
-4
Self-Employed Households
Observed Value
600000000500000000
400000000300000000
200000000100000000
0-100000000
-200000000
Expecte
d Norm
al
4
3
2
1
0
-1
-2
-3
-4

2003 Proceedings of the Midwest Business Economics Association 25
Table 1: Variable Definitions Variable Definition Age Number of years Gender Male =1; Female = 0 Marital Status Married=1; Other=0 Networth Total Assets – Total Liabilities Education Years of Schooling Risky Assets Stocks + Mutual Funds + Bonds + Other Assets Income Earnings Before Taxes Share in Business Percentage ownership share in the business Risk Attitude Willingness to take financial risk:
None = 0; Average =1; Above Average=2 Substantial = 3
Risk Attitude (3) Willingness to take financial risk: Substantial & Above average = 1 Average = 2; None = 3
Ratio of Risky Assets Ratio of Risky Assets to Networth Health Poor Health =1
2003 Proceedings of the Midwest Business Economics Association 26
Table 2: Summary Statistics of Characteristics for Heads of Households
Variable Definition
All Households
Entrepreneurs
Median
Mean
Standard Deviation
Median
Mean
Standard Deviation
Age (years) 46.0 48.7 17.3 48.0 48.8 13.3
Sex (male =1; female =0) 1.0 1.3 0.4 1.0 1.11 0.3
Marital Status (married =1) 1.0 2.7 1.9 1.0 1.94 1.6
Education (years of schooling) 13.0 13.1 2.9 14.0 13.9 2.7
College Degree (Bachelors =1) 1.0 1.2 1.8 1.0 1.5 1.9
Years working for current firm 2.0 6.4 8.9 10.0 12.9 11.5
Filed for bankruptcy (Yes =1; No=5) 5.0 4.7 1.1 5.0 4.7 1.0
Hours worked (weekly) 40.0 30.4 22.3 45.0 44.7 18.9
Wages Before Taxes ($) 460.0 18,782.3 47347.6 -1,000 18,100 57774.3
Nonfinancial Assets ($) 85,000.0 194,146.3 1320596.0 253,100.0 687,950.8 3580417
Networth ($) 20,400.0 199,915.5 1744051 254200 888532.8 4328981
Debt ($) 12,000.0 47,804.8 110153.9 47,600 97,969.4 214766
2003 Proceedings of the Midwest Business Economics Association 27
Table 3: Average Ratios of Risky Assets and Debt to Total Assets for Entrepreneurs Classified by Wealth Ranges and Attitudes to Taking Financial Risks: 1998
Networth (Thousands of Dollars) 1-9.99 10-49.99 50-99.99 100-999.99 >1,000
All Entrepreneurs
Risky Assets to Total Assets 0.12 0.26 0.25 0.38 0.64 Debt to Total Assets 0.33 0.39 0.25 0.19 0.08
Entrepreneurs willing to take above average financial risk Risky Assets to Total Assets -0.01 0.38 0.29 0.43 0.66 Debt to Total Assets 0.87 0.54 0.31 0.23 0.10
Entrepreneurs willing to take average financial risk Risky Assets to Total Assets 0.22 0.26 0.31 0.38 0.63 Debt to Total Assets 0.39 0.33 0.21 0.20 0.07 Entrepreneurs willing to take no financial risk Risky Assets to Total Assets 0.09 0.23 0.16 0.29 0.64 Debt to Total Assets 0.23 0.40 0.27 0.13 0.08
Table 4: Percentage of Total Assets Invested in Risky Assets by Group
Variable
Univariate F-Test
Sample Mean
Sample Standard Deviation
Group Mean
I II III IV
Gender (0-Female, 1-Male) 3.589 .9522 .2134 .914 .96 .96 .966 Age 14.43* 52.3 12.19 49 49 53 54 Marital Status (0-Unmarried, 1-Married) 5.17*
.842 .364 .79 .90
.89 .81
Debt to Total Assets 90.46* .128 .195 .26 .16 .08 .03 Education (Years) 7.08* 15.09 2.35 14.5 15.3 15.5 15 Income ($1000) 9.19* 78 263.83 26.7 51.5 70.6 130.2 Networth ($1000) 43.42* 15,350 45920 1,091 2,679 7,948 35,083 Percent of Business Owned 3.48 65.27 41.81 58.6 67.9 64.05 68.93 Using Personal Assets as Collateral or Guarantee any loans for Business (1-Yes, 2 - No)
.699
3.32 2.35 3.16 3.34
3.32 3.41 *Significant at the .05 level
2003 Proceedings of the Midwest Business Economics Association 28
Table 5: Willingness to Incur Financial Risk by Group
Variable
Univariate F-Test
Sample Mean
Sample Standard Deviation
Group Mean
I II III
Gender (0-Female, 1-Male) 15.35* .943 .23 .96 .95 .85 Age 3.56 52.17 12.45 51 52.8 53.4 Marital Status (0-Unmarried, 1-Married) 4.58
.829 .376 .82 .85
.75
Debt to Total Assets 4.37 .180 1.01 .14 .14 .40 Education (Years) 78.007* 14.9 2.44 15.5 15.05 12.9 Income ($1000) 4.5 74.02 256.68 92.7 72.9 21.7 Networth ($1000) 7.68* 14,467 44,711.6 19,991 12,128 5,107 Percent of Business Owned 5.24* 62.13 43.18 65.29 62.27 52.39 Using Personal Assets as Collateral or Guarantee any loans for Business (1-Yes, 2 - No) 4.51
3.15 2.25 3.18 3.29
2.67
*Significant at the .05 level
2003 Proceedings of the Midwest Business Economics Association 29
Table 6: Regression of Risk Measures upon Log Wealth and Other Variables
Variable
Risky Assets to Networth (Linear
regression)
Risk Attitude
(Ordinal regression)
Constant -.173 (-.226)
Log (networth) 0.599* (5.228)
.83*
Age -3.145E-02* (-4.092)
-3.863E-02*
Gender -0.232 (-.535)
-.646
Marital Status -.226 (-8.68)
.534*
Health Condition .425 (.266)
-.317
Education -7.052E-04 (-.18)
.167*
Income -1.518E-07 (-.446)
-3.185E-07
Risk Attitude -.241 (-2.113)
Planning Horizon -.282 (-1.57)
-.1621E-02
Delayed Consumption -.159 (-.942)
7.525E-02
Personal Optimism -.17 (-.733)
-.137
Percent of Business Owned -4.363E-07 (-.019)
5.102E-05*
Saving Motive -.335+ (-1.81)
.264
Using Personal Assets as Collateral or Guarantee any loans for Business
-2.926E-02 (-.656)
-6.912E-02
t-statistics in parentheses *p-value <0.05 + .07 Dummy variables are used to examine gender (1=male), marital status (1=married), planning horizon (1= over 5 years), Personal Optimism (1=lucky), Delayed consumption(1= no spending if income goes up), Health condition (1=good or excellent health), Risk attitude (1=no willingness to incur financial risk, 2= average willingness, 3= above average and substantial willingness), Saving Motive (1=precautionary saving), using personal assets (1=yes); age and education are measured as integers.
2003 Proceedings of the Midwest Business Economics Association 30
REFERENCES Arrow, K. (1965), Aspects of the Theory of Risk
Bearing. Helsinki:Yrjo Jahnsson Foundation. Becker, G.S. (1968), “Crime and Punishment: An
Ecoonomic Approach,” Journal of Political Economy, 76(2), 169-217.
Blanchflower, D., and Oswald , A. (1998), “What Makes an Entrepreneur?”, Journal of Labor Economics, 16, 26-60.
Brinson, G., Hood, L., and Beebower, G. (1986), “Determinants of Portfolio Performance”, Financial Analysts Journal, 42, 39-44.
Campbell J. and Viceira, L. (2001), “Who Should Buy Long-Term Bonds?” American Economic Review, 91, 99-127.
Cramer, J., Hartog, J., Jonker, N., and Van Praag, C. (2002), “Low Risk Aversion Encourages the Choice for Entrepreneurship: An Empirical Test of a Truism”, Journal of Economic Behavior & Organization, 48, 29-36.
DeWit, G. (1993), Determinants of Self-employment. Physica Verlag, Heidleburg, Germany.
Douglas, E., and Sheperd, D. (2002), “Self-employment as a Career Choice: Attitudes, Entrepreneurial Intentions, and Utility Maximization”, Entrepreneurship Theory and Practice, 26, 81-90.
Douglas, E., and Sheperd, D. (1999), “Entrepreneurship as a Utility Maximizing Response”, Journal of Business Venturing, 15, 231-251.
Friend, I. and Blume, E. (1975), “The Demand for Risky Assets,” American Economic Review, 65, 900-922.
Hariharan, G, Chapman, K, and Domian, D. (200), “Risk Tolerance and Asset Allocation fro Investors nearing Retirement,” Financial Service Review, 9, 159-170.
Hopenhayn, H. (2002), “Risk Taking by Entrepreneurs”, Working Paper, University of Rochester and Universidada Torcuato Di Tella.
Kihlstrom, R. and Laffont, J. (1979), “A General Equilibrium Entrepreneurial Theory of Firm Formation Based on Risk Aversion” The Journal of Political Economy, 87, 719-749.
Masters, R. and Meier, R. (1988). “Sex Differences and Risk-taking Propensity of Entrepreneurs” Journal of Small Business Management, 26, 31.
McCrimmon, K., and Wehring, D. (1986), Taking Risks: The Management of Uncertainty. The Free Press, New York.
Merton, R. (1971),”Optimum Consumption and Portfolio Rules in a Continuous-Time Model”, Journal of Economic Theory, 3.
Merton, R. (1969), “Lifetime Portfolio Selection
Under Uncertainty: The Continuous-Time Case”, Review of Economic and Statistics, 67, 353-362.
Mitchell, R., Smith, B., Morse, E., and Seawright, K. (2002), “Are Entrepreneurial Cognitions Universal? Assessing Entrepreneurial Cognitions Across Cultures”, Entrepreneurship Theory and Practice, 26, 9-32.
Morris, M. (2002). “From the Editor: Revisiting “Who” is the Entrepreneur”, Journal of Developmental Entrepreneurship, 7, 1.
Moskowitz, T. and Vissing-Jorgensen, A. (2002), “The Returns to Entrepreneurial Investment: A Private Equity Premium Puzzle?” American Economic Review (Forthcoming).
Neilson, W.S. and Winter, H. (1997), “On Criminals’ risk Attitudes,” Economics Letters, 55, 97-102.
Perry, S. (2002), “A Comparison of Failed and Un-Failed Small Businesses in the United States: Do Men and Women use Different Planning and Decision-making Strategies?” Journal of Developmental Entrepreneurship, 7, 415.
Pratt, J. (1964). “Risk Aversion in the Small and in the Large”, Econometrica, January-April.
Quadrini, V. and Rios-Rull, J. (1997), “Understanding the U.S. Distribution of Wealth”, Federal Reserve Bank of Minneapolis Quarterly Review, 21, 22-36.
Robb, A. (2002). Entrepreneurial Performance by Women and Minorities: The Case of New Firms”, Journal of Developmental Entrepreneurship, 7, 383.
Samuelson, P. (1969), “Lifetime Portfolio Selection by Dynamic Stochastic Programming”, Review of Economic and Statistics, 51, 239-246.
Shane, S. and Venkataraman, S. (2000), “The Promise of Entrepreneurship as a Field of Research”, Academy of Management, 25, 217-226.
Ucbasaran, D., Westhead, P., and Wright, M. (2001). The Focus of Entrepreneurial Research: Contextual and Process Issues” Entrepreneurship Theory and Practice, 25, 57-80.
Van Praag, C. (1996), Determinants of Successful Entrepreneurship. PhD Dissertation, University of Amsterdam, The Netherlands.
Warneryd, K-E. (1996), “Risk Attitudes and Risky Behavior,” Journal of Economic Psychology, 17, 749-770.