Embed Size (px)
Citation preview

Pak. J. Commer. Soc. Sci. 2011 Vol. 5 (1), 12-46
Entrepreneurial Attitudes among Potential Entrepreneurs
Akhtar Ali (Corresponding author)
Assistant Professor Department of Education, The Islamia University of Bahawalpur, Pakistan
E-mail: [email protected]
Keith J. Topping Professor of Educational and Social Research, School of Education
University of Dundee, Nethergate, Dundee DD1 4HN, Scotland, UK
Riaz H. Tariq Professor, Department of Education, Bahauddin Zakariya University
Multan, Pakistan Abstract This article explores entrepreneurial attitudes among potential entrepreneurs in Pakistan. Multi-stage sampling maximized representation. Four hundred and eighty masters of business administration (MBA) students (potential entrepreneurs) from six public sector Pakistani universities returned completed questionnaires. Three factors emerged: entrepreneurial acceptability, entrepreneurial intentions and personal factors. Moreover, the perceptions of the potential entrepreneurs on locus of control, self efficacy, subjective norms and instrumental readiness were also analyzed. The majority of students showed generally positive attitudes towards entrepreneurship at all six universities. Overall there was a significant difference between negative and positive attitudes (negative mean 184, positive mean 284). There was also some impact of demographic variables, such as university, parental income and profession. Both genders exhibited similar attitudes at most of the sample institutions. The implications for practice and policy are discussed. Keywords: Entrepreneurial attitude, Masters of Business Administration, Entrepreneurial acceptability, Entrepreneurial intentions, Pakistan. 1. Introduction Entrepreneurship has emerged as the most potent economic force the world has ever experienced (Kuratko, 2005). The entrepreneurial interest has acquired its intensive level almost everywhere in the world. The developed economies consider it as a revitalizing socioeconomic agent, a way of coping with unemployment problems, a potential catalyst and incubator for technological progress, product and market innovation. At most of the developing countries, it is seen as an engine of economic progress, job creation and social adjustment (Mohar, Singh and Kamal, 2007). Most recent socioeconomic crises like rapid increase in fuel and food prices, serious threats to social peace and security etc. added to the need of entrepreneurial expansion everywhere in the world particularly at developing countries (Levenburg, 2008).
Ali, Topping and Tariq
13
This is due to the fact that entrepreneurs are the persons who usually organize and develop their own businesses and benefit from a range of fields, including various knowledge areas, hands on experience, creative visions and insights, network support, and risk taking (Lope Pihie 2008). They have a heightened ability and awareness for recognising and audaciously exploiting business opportunities. They persistently and continually seek opportunity-laden information in order to satisfy internal motivators such as need for achievement and the fulfilment of competitive urges (Pech and Cameron, 2006). They act as catalysts of economic activity for the entire economy (Bygrave and Minniti, 2000). The past experiences signify that activities of entrepreneurs bring in overall economic prosperity to the nations. Entrepreneurial ability, innovative potential, and entrepreneurial human capital boosted up many developing economies. Beugelsdijk and Noorderhaven (2004) found a strong positive correlation between the entrepreneurial characteristics of the persons and a rate of regional economic growth. This characterised entrepreneur as the visible hand of the market process who, by engaging in the pursuit of entrepreneurial profits, inadvertently improves the economic welfare of others. S/he is engaged in riskier behaviour than non-entrepreneurial persons (Norton and Moore, 2006). Recognition of the importance of entrepreneurship to modern economies, coupled with a post-modern culture of individualism, has upheld the promotion of enterprise and entrepreneurship at both intellectual and policy levels (Frith and McElwee, 2008). Entrepreneurs mainly depend on potential for entrepreneurship that requires potential entrepreneurs (Kruegel and Brazeal 1994). The entrepreneurial potential of potential entrepreneurs has emerged as a frontline national agenda item and succeeded to attract the interest of policy makers, educationists and development agencies all over the world (Mclarty, 2005, Sobel and King, 2008). Empirical results based on 365 Italian potential business founders indicate that entrepreneurial projects based on a rich information set, a first-best choice and on self commitment are more likely to develop into actual start-ups and better post-entry performances (Vivarelli, 2004). It was confirmed through research that the entrepreneurial intentions and attitudes lead potential entrepreneurs towards entrepreneurial activity. Guerrero, Rialp and Urbano (2008) found that attitudes towards entrepreneurship are determinant factors to decide to be an entrepreneur. This indicates that entrepreneurship is an intentional process that emphasizes opportunities over threats. In the psychological literature, intentions have proven the best predictor of planned behaviour, particularly when that behaviour is rare, hard to observe, or involves unpredictable time lags. Ajzan and Shapero intention models prove useful in understanding business venture formation intentions as they offer a coherent, cost-conscious, highly-generalizable and robust theoretical framework for understanding and prediction. Ajzen model argues that intentions in general depend on perceptions of personal attractiveness, social norms, and feasibility whereas according to Shapero model entrepreneurial intentions depend on perceptions of personal desirability, feasibility, and propensity to act. Both the models prove that intentions are the single best predictor of any planned behaviour, including entrepreneurship. The above evidence supports the idea that attitudes influence behaviour by their impact on intentions. Intentions and attitudes further depend on the market situation and personal
Entrepreneurial Attitudes among Potential Entrepreneurs
14
variables. Accordingly, intentions models predict behaviour better than either individual (for example, personality) or situational (for example, employment status) variables. The predictive power is critical to better post hoc explanations of entrepreneurial behaviour; intentions models provide superior predictive validity (Krueger,Reilly and Carsrud,2000). Moreover, a strong link was identified between the psychological characteristics of both the potential and the successful entrepreneurs and the business success (Taormina and Lao, 2007). It was found that tolerance for risk, perceived feasibility and net desirability significantly predicted entrepreneurial intentions, with an adjusted R2 of 0.528(Segal, Borgia and Schoenfeld, 2005). Cachon and Cotton, (2008) explored some strong relationship between entrepreneurial orientation and the personal attitudes of potential entrepreneurs. A strong entrepreneurial Orientation will ultimately lead to increase entrepreneurship and global competitiveness (Lee and Peterson, 2000). Personality traits and parenting styles may also affect entrepreneurial competence (EC) and entrepreneurial interests (Rodermund, 2004). A study on Romanian students confirms that self-efficacy and the desirability associated with creating a venture were positively related to entrepreneurial intent (Shook and Bratianu, 2008). Entrepreneurial self efficacy refers to the strength of a person's belief that he or she is capable of successfully performing the various roles and tasks of entrepreneurship. It consists of five factors: marketing, innovation, management, risk-taking, and financial control. According to Chen, Greene and Crick (1998) entrepreneurial self efficacy was positively related to the intention to set up one's own business. It was found through research that the total entrepreneurial self efficacy score differentiated entrepreneurship students from other groups. Entrepreneurship students have higher self-efficacy in marketing, management, and financial control than the management and psychology students. It was found that business founders had higher self-efficacy in innovation and risk-taking than did non-founders. The results of this study demonstrate the potential of entrepreneurial self-efficacy as a distinct characteristic of the entrepreneur (Chen, Greene and Crick, 1998). The identification of the entrepreneurs' characteristics and the knowledge of the entrepreneurial profile of potential entrepreneurs have been gaining a growing importance in the development of entrepreneurially oriented educational programs and start-up processes. Research findings indicate that entrepreneurship education is the most relevant factor in what concerns the propensity to business creation. On the other side, personal characteristics have an important role in shaping motivation to start-up a business (Raposo, Matos Ferreira, Finisterra do Poo and Gouveja Roderigues, 2008). A study on Malaysian potential entrepreneurs indicates that demographic characteristics do not have a significant impact, but the personality dimensions positively correlate with entrepreneurial inclination (Othman, Mutalib and Ismail, 2008). The entrepreneurial potential of the potential entrepreneurs can be enhanced through educational programmes. Parker and Van Praag (2006) found that education enhances entrepreneurs' performance both directly - with a rate of return of 13.7% - and indirectly, because each extra year of schooling decreases capital constraints by 1.18 percentage points. The indirect effect of education on entrepreneurs' performance is estimated to be 3.0-4.6 %. The study concluded those entrepreneurial capacity factors, such as personality traits, learning, experiences, social factors and culture; enhancing factors,
Ali, Topping and Tariq
15
such as information technology development and education system have influenced the favourable attitude of the potential entrepreneurs towards entrepreneurship (Dionco-Adetayo, 2006). Educational programmes also have significant impact on the entrepreneurial attitudes of potential entrepreneurs. After participation in such programmes, German potential entrepreneurs shifted their interest towards a higher entrepreneurial level (Schroder and Rodermund, 2006). Similar results have been reported from the US, UK and France (Soutaris, Zerbinati & Al-Laham 2007; Zhao, Seibert, & Hills, 2005). According to their findings educational programmes enhanced the entrepreneurial intentions and attitudes of science & engineering potential entrepreneurs in terms of learning, inspiration & resource utilization. This indicates that educational programmes can play an important role in stimulating the entrepreneurial potential of potential entrepreneurs. The development of entrepreneurial talent is important in sustaining a competitive advantage in a global economy that is brought about by innovation. Empirical evidence confirms that entrepreneurial programs have successfully imparted relatively higher confidence among the potential entrepreneurs to pursue their own line of entrepreneurial activities. Moreover, academic experience of entrepreneurs significantly predicts their entrepreneurial attributes and motivation (Lope Pihie 2008). University equips the potential entrepreneurs with those attitudes that help them to take responsibility of their own actions, be creative and innovative, and also to develop their creativity in their lives. Universities enhance entrepreneurial potential of the potential entrepreneurs (Van Burg, Romme, Gilsing and Reymen, 2008). Now entrepreneurship has become a prime university function (Fitzkowitz, 2004).The common perception of universities as merely institutions of higher learning is giving way to one where universities are viewed as engines of economic growth and development (Chrisman, Hynes and Fraser, 1995).
Almost everywhere in the world universities are trying to focus on entrepreneurship – not least because future pool of the entrepreneurs mainly consists of university students (potential entrepreneurs). Academic researchers have begun to explore the entrepreneurial interests of potential entrepreneurs. As a result of an exploratory study, Rodermund (2004) felt able to generalize that in Germany an entrepreneurial personality (low agreeableness and neuroticism, high extraversion, openness, and conscientiousness) and authoritative parenting styles were linked to the entrepreneurial competence of future entrepreneurs. According to him entrepreneurial competence could predict entrepreneurial interest which in turn related to entrepreneurial career development in the potential entrepreneurs. By contrast, other researchers found an entrepreneurial personality profile mainly consisted of the following: a high need for achievement, high entrepreneurial intention, instrumental readiness, high entrepreneurial acceptability, creative behaviour, initiative taking, taking responsibilities, involvement in various types of risks, self efficacy, an internal locus of control, need for independence and autonomy, accomplishment of tasks with energy and commitment, team building, working in teams and independently, working under pressure, leading others, analytical competencies and persistency in following the aims (Martinez, Mora & Vila, 2007; Ramayah & Harun, 2005). More substantial research work saw other investigators exploring in other directions. Linan, Rodriguez-Cohard & Rueda-Cantuche (2005) found that the intention to become
Entrepreneurial Attitudes among Potential Entrepreneurs
16
an entrepreneur mainly depended on personal attraction towards entrepreneurship, perceived social norms and perceived feasibility (self-efficacy). Achievement motivation and self image have likewise emerged as major contributory factors (Pillis & Reardon, 2007). Moreover, demographic variables like parental profession, academic qualifications of parents, their attitude towards entrepreneurship and the university environment have received considerable attention (from Gurol & Atson, 2006, and Zampetakis & Moustakis, 2006). Schroeder and Rodermund (2006) reported that family background, parenting style and educational background can predict different patterns of entrepreneurial interest development. These demographic factors also appeared to have a significant impact in building an entrepreneurial type of personality. By contrast, other researchers report three factors (gender, family experience with business and educational level) affect entrepreneurial interests (but not family income status, ethnicity or citizenship) (Wang & Wong, 2004). Less research has focused on the factors which deter students from engaging in entrepreneurial interests. High level entrepreneurial interest exists among university students in Singapore, but the deterrents here seem to be inadequate business knowledge and perceived risk (Wang and Wong, 2004). Additionally, lack of finance has appeared as a major entrepreneurship barrier in many cases (Wilson, Brown, Anderson & Galloway, 2003). 2. Research in Pakistan No considerable work of substance on entrepreneurial attitudes of potential entrepreneurs has so far been reported from Pakistan. A major frustration for most policy researchers in the small to medium-sized enterprise area in Pakistan is the virtual non-existence of scientific data on this sector in the country. A survey of 651 small to medium sized enterprises from the manufacturing sector of Pakistan was conducted in 2003 by Bhutta, Rana and Asad, 2008. Some relationships between the health indicators namely, sales/employee, increase/decrease in sales, and investment plans and the different personal characteristics of the owner/entrepreneur were found. This analysis suggests that education, generation setting up the business, and number of partners have a significant relationship with the health of small and medium-sized enterprises. Health of the firm is also dependent on owner habits like watching television, reading newspapers and using computers for office work. Other factors like caste of the owner and occupation of the owner's relatives were also analyzed, but no significant relationship with the health of small and medium-sized enterprises was observed. To date no other such study has been carried out in Pakistan. Similar studies on owner profiles have previously been carried out in other countries such as the UK and USA (Bhutta, Rana and Asad, 2008). The present socioeconomic scenario there indicates high demand for promoting entrepreneurial activities in the country. The gap between the rich and the poor has widened in recent years. The latest estimate of the inflation-adjusted poverty line is Rupees (Rs) 944.47 per adult equivalent per month. The headcount percentage of the population below the poverty line stands at 22.32 percent (Khan, 2008). Pakistan is passing through a socioeconomic crisis. According to the economic survey for 2007-08, there were failures in major areas, particularly GDP growth rate, agriculture,
Ali, Topping and Tariq
17
overall manufacturing, large scale manufacturing, inflation, fiscal policy, exports, imports, current account deficit and trade balance. Pakistan missed major economic targets set for the outgoing financial year, for example, the Pakistan economy grew by 5.8% against the original target of 7.2%. The recently reported average per capita income of US $1085 was still 27 times lower than the UK. Food inflation was estimated at 15% (Haq, 2008). A 4.7% deficit of the GDP (459 billion Rs) has been shown in the recently released budget 2008-09 estimates (Qamar, 2008). Only half of one percent of the GDP is being spent on universities. Public spending per student (at present about US$670) remains well below the average found in fast-growing developing countries such as OECD member states (Government of Pakistan, 2006; Higher Education Commission, Pakistan, 2008a). At present none of the public sector universities in the country offers an independent course on entrepreneurship. However, the University of the Punjab Lahore, the University of Sindh Hyderabad and Bahauddin Zakariya University Multan offer either a compulsory or an elective entrepreneurship course unit to their master level business students (Higher Education Commission, 2008b). Only two PhD studies on entrepreneurship have so far been reported by the Higher Education Commission, to the credit of Bahauddin Zakariya University Multan (Higher Education Commission, 2008c). However, there is high demand for Pakistani universities to promote a culture of entrepreneurship among students, faculty and staff (Mian, 2006). Policy-making agencies have shown increased concern about entrepreneurial promotion. The Higher Education Commission emphasized that universities should not only develop mastery of subject matter, but also the abilities to think critically, innovate, communicate, work effectively in teams, and develop entrepreneurship opportunities and flexibility among their graduates. Universities are expected to play a key role in the national development process by creating, using, and diffusing new knowledge through the establishment of technology parks and business incubators, making possible access to venture capital, and other such schemes (Rehman, 2008). As active members of the future entrepreneurial pool, the contribution of potential entrepreneurs is obviously important. This article will focus the entrepreneurial attitudes of potential entrepreneurs in the country.
3. Methodology 3.1 Sampling Multi-stage sampling was employed to maximize representation. In 2007, there were 111 universities and degree-awarding institutions functioning in Pakistan in both the public and private sectors (Higher Education Commission, 2008d). The Task Force report (2002) noted that 85% of university students are enrolled in public sector institutions. Thus the public sector universities are mainly responsible for controlling the quality of higher education. Therefore, it was decided to use this important group. Among the various types of public sector universities, the general universities (rather than those specialising in particular subjects) represented the largest group of population, and these were focused upon. Cluster sampling was then used, according to the size of the university. Within these clusters, a random selection of six universities was made. Then the business departments were selected from the sample universities. Then there was
Entrepreneurial Attitudes among Potential Entrepreneurs
18
random sampling within the strata of male and female students, ensuring proportional representation of these groups. The consequent sample consisted of 600 students. 3.2 Questionnaire After a wide literature review a number of sample questionnaires regarding entrepreneurial attitudes of university students were downloaded or received from colleagues (mainly from US, Germany, Spain, China and Malaysia). From consideration of these possibilities, a 45 item questionnaire was developed, featuring an 8-point Likert scale for responses (see Appendix). The questionnaire was mainly adapted from the Ramayah and Harren (2005) 7-point agree-disagree Likert type scale for assessing entrepreneurial intention among the students of University Sains Malaysia. This scale was largely concerned with need for achievement, locus of control, self efficacy, instrumental readiness, subjective norms and entrepreneurial intentions. The reported reliability value for the scale was 0.85. Keeping in mind the local requirements, the language and content of the items were adapted. Cross validation of items was made by (1) adding conditional items (item numbers 12, 20 and 30), (2) adding negative items (e.g. item number 6, 8 and 11), and (3) putting the items in random order. Responding to the suggestion of Boone (1997), another modification was the change to an eight point Likert scale. The scale points one and eight were labelled respectively with strongly disagree and strongly agree options while the intermediate points were left uncharacterized. According to Boone (1997), the tendency to pick the neutral response in such inventories is more common in Asian cultures. The neutral option therefore needed to be eliminated. The questionnaire was then translated into Urdu. A panel of two experts was requested to consider the content validity and face validity of the instruments in both the languages. Items obtaining approval from 80% or more of the experts were retained. Inappropriate items were revised in the light of the critical comments of the experts. The final questionnaire consequently consisted of 45 items. A Cronbach alpha of .80 indicated high reliability. The questionnaire was then piloted on a sample of 20 students. This led to some further adaptations. The Urdu and the English versions of the questionnaire were subsequently used together for data collection. 3.3 Response rate and analysis The questionnaire was distributed among one hundred students from each of the six departments contacted, with proportionate numbers of male and female. Participation was voluntary. The return rate for the questionnaire varied from university to university. A total of 480 students responded within the scheduled period of two months. The response rate was thus 80%. Sixty eight percent of the respondents were males, reflecting the larger number of males in university in Pakistan. The data were analyzed in two steps. In the first step, a factor analysis was conducted on questionnaire responses. In the second step, descriptive statistical techniques were applied to the data, and on occasion where discrepancies seemed large, inferential statistical analysis was applied.
Ali, Topping and Tariq
19
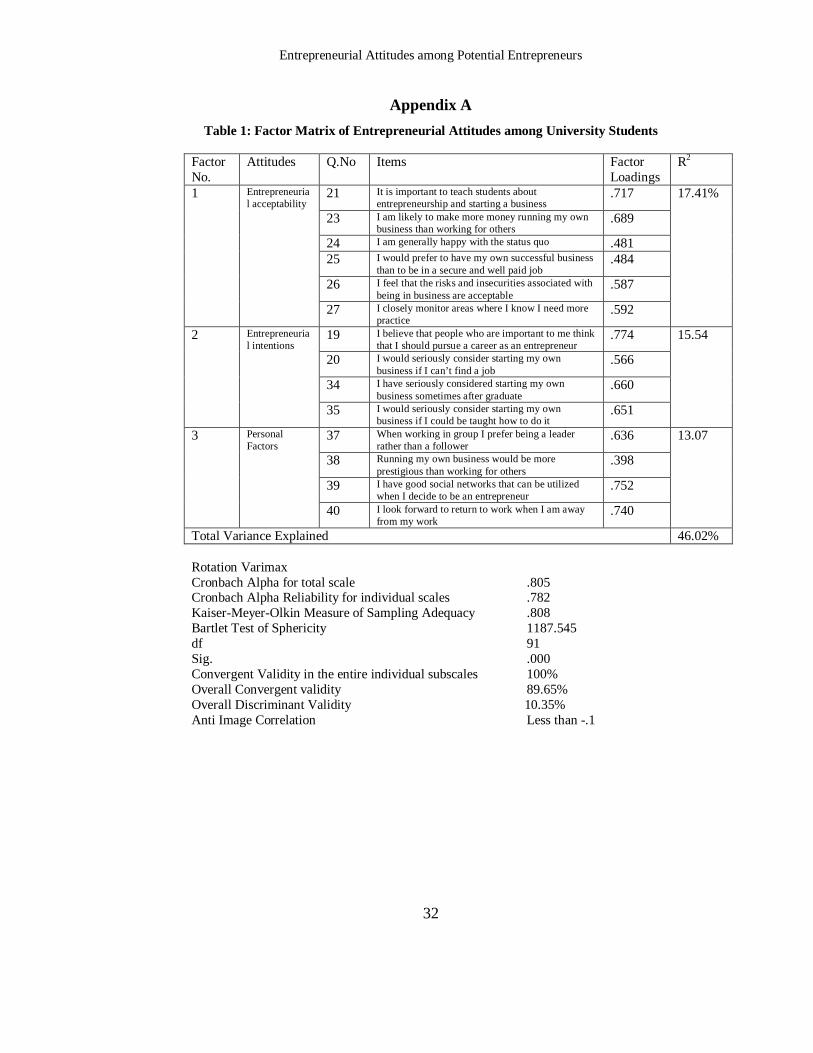
4. Results 4.1 Factor analysis A Principal Components Analysis followed by Varimax rotation was conducted for the data set. Kaiser Mayer-Olkin Measure of Sampling Adequacy, Bartlett Test of Sphericity, and Anti-image Correlation were calculated. A high value of Kaiser Mayer-Olkin Measure of Sampling Adequacy (.80), highly significant Bartlett Test of Sphericity (Chi Square 1187.54; Significance p<0.000) and less than .1 value of the Anti-image correlation indicate that the data exhibited normal behaviour and were interpretable. Hence it was safe to apply Factor Analysis to the data. A three-factor solution was accepted for the data set. This accounted for 46.03% of the common variance. The six (21,23,24,25,26,27), four (19,20,34,35) and four (37,38,39,40) items, loaded respectively on entrepreneurial acceptability, entrepreneurial intention and personal factors (see Table 1).
[INSERT TABLE 1 HERE] Convergent validity and discriminant validity of the three dimensions were also calculated. The measuring instrument had more than 80% content validity. The convergent validity of the research tool was 89.65%, whereas all the subscales (entrepreneurial acceptability, entrepreneurial intentions and personal factors) had 100% convergent validity. Discriminant validity of the questionnaire was calculated as 10.35%, a satisfactorily low figure. Reliability of the measuring instrument was .80. The reliability of all the subscales of the research tool was no less than .78. 4.2 Main analysis The opinion of students on entrepreneurial acceptability, entrepreneurial intentions and personal factors were summed by adding up the frequency of items under each subscale and calculating the positive and the negative frequencies, with the percentage and mean of the responses within each category. Responses from 1-4 points were taken to indicate negative attitude, whereas responses from 5-8 points were treated as positive attitude. Apart from valency, each response was treated equally. The students’ entrepreneurial attitude on each factor was determined. Then the overall entrepreneurial attitude at each university and the overall entrepreneurial attitude for all universities were calculated. The effects of the demographic variables were also analysed, first at each university and then for all the institutions together. 4.3 Individual university response The following reports students’ perceptions regarding entrepreneurial acceptability, entrepreneurial intentions and personal factors at each of the six universities. This is then summarised for all six universities together. 4.3.1 University of Sindh Hyderabad Sixty four percent of students have a positive attitude to accept entrepreneurship as a career. However, 58% of respondents revealed negative attitudes regarding entrepreneurial intentions. Fifty five percent of informants indicated positive attitudes towards personal factors vital for entrepreneurial activity. As a whole, 53% of students indicated positive entrepreneurial attitudes. There was no significant effect of gender, parents’ education, income of fathers’ occupation on entrepreneurial acceptability at this
Entrepreneurial Attitudes among Potential Entrepreneurs
20
university. It appeared that rural area students were more willing to take risks than their urban classmates (urban mean 4.66, rural mean 6.30, df 82, t=3.35, sig .000). Students from the parental qualification at secondary or higher secondary level group, when compared with respondents from illiterate families, indicated a stronger intention for an entrepreneurial career (mean difference .44, F 3.19, df 83, sig. .01). However, no significant effect of parents’ income, fathers’ occupation or mothers’ education was found on entrepreneurial intentions. It was evident that male students had higher entrepreneurial intentions compared to female respondents (male mean 4.85, female mean 3.59, df 82; t=3.08, sig. .003). There was also a significant difference in entrepreneurial intentions of rural and urban students, rural being stronger (rural mean 5.30, urban mean 3.21, df 82, t=3.45, sig. .001). If properly trained, rural students had stronger intentions than their urban counterparts (rural mean 5.84, urban mean 4.19, df 82, t=3.83, sig. .000). Income and gender had significant impact on entrepreneurship. It was clear that the students of the Rs 20000-30000 income group had better social networks compared to the Rs 10000-20000 income band (Rs 20000-30000 - Rs 10000-2000, mean difference 2.18, df 83, F 2.90, sig. .019). Likewise male respondents had better social network connections compared to female participants (male mean 5.35, female mean 4.18, df 82, t=4.42, sig. .017). There was no significant effect of parents’ education, occupation or residence on personal entrepreneurial factors. 4.3.2 University of Karachi Sixty five percent of students had positive attitudes towards entrepreneurial acceptability. However, 51% of respondents indicated negative attitudes towards entrepreneurial intentions. Fifty seven percent of students revealed positive attitudes towards personal entrepreneurial factors. As a whole, 57% of respondents showed positive entrepreneurial attitudes at this university. There was significant impact of parents’ income on entrepreneurial acceptability. The respondents in income bracket Rs 40000-50000 exhibited a higher desire for teaching entrepreneurship at the university compared to students of the Rs 20000-30000 income group (Rs 40000-50000 - Rs 20000-30000, mean difference 2.19, f 2.89, df 81, sig. .014). Respondents from the Rs 40000-50000 income band were found more conscious in terms of personal improvements as compared to the higher income groups (Rs 40000-50000 - Rs 50000-100000, mean difference 1.40, F 3.91, df 81, sig. .046; Rs 40000-50000 - Rs 50000-over 100000, mean difference 1.68, F 3.91, df 81, sig. .022). There was no significant effect of gender, residence, parents’ education or occupation on entrepreneurial acceptability at this university. However, respondents of the Rs 30000-40000 income group showed a stronger desire for an entrepreneurial career as compared to the participants of the Rs 40000-50000 income bracket (Rs 30000-40000 - Rs 40000-50000, mean difference 3.77, F 3.76, df 81, sig. .007). Respondents of the Rs 50000-100000 income bracket were more enthusiastic to see themselves in the entrepreneurial profession as compared to those in Rs 40000-50000 (Rs 50000-100000 - Rs 40000-30000, mean difference 2.49, F 3.76, df 81, sig. .004). Another significant difference in entrepreneurial career choice was between the income bands of Rs 10000-20000 and Rs 40000-50000 in favour of the former (Rs 10000-20000 – Rs 40000-50000, mean difference 2.33, F 2.52, df 81, sig. .036). Public sector
Ali, Topping and Tariq
21
employees had a stronger entrepreneurial wish for their children compared to retired people (Public employed - retired, mean difference, 1.83, F 3.13, df 81, sig. .039). There was no significant impact of gender, residence or parents’ education on entrepreneurial intentions of the students of this university. The data analysis showed that there was a significantly stronger tendency to engage with group leadership roles among the students of the entrepreneurial families as compared to others (entrepreneurial - private employee, mean difference 1.42, F 8.35, df 81, sig. .008). Respondents in the entrepreneurial group were significantly better on leadership preference roles compared to others (entrepreneurial - public sector employees, mean difference 1.71, F 8.35, df 81, sig. .001). A similar difference was evident among the students whose parents were retired versus private employees and retired versus public sector employees families (retired - private employee, mean difference 1.29, F 8.35, df 82, sig. .037; retired - public employee, mean difference 1.58, F 8.35, df 81, sig. .004). Respondents from the over Rs 100000 income bracket showed a stronger tendency to perform group leadership roles as compared to participants of the Rs 50000-100000 income group (over 100000 Rs - Rs 50000-100000, mean difference 1.52, df 81, F 2.61, sig. .045). There was no significant effect of gender, residence or parents’ education on entrepreneurially related personal factors. 4.3.3 University of Baloshistan Quetta Seventy percent of students exhibited positive attitudes towards entrepreneurial acceptability. Sixty five percent of students indicated positive attitudes towards entrepreneurial intention. Fifty seven per cent of participants had positive attitudes towards entrepreneurially related personal factors. As a whole fifty seven percent of respondents revealed positive attitudes towards entrepreneurship. There was significant impact of parents’ income on the entrepreneurial acceptability of the students in this university. Students of the income bands Rs 20000-30000, Rs 30000-40000 and Rs 50000-100000 exposed a stronger wish for the teaching of entrepreneurship than those of the income range Rs 6000-10000 (Rs 20000-30000 - Rs6000-10000, mean difference 2.61, df 85, F 6.75, sig. .033; Rs 30000-40000 - Rs 6000-10000, mean difference 2.61, df 85, F 6.75, sig. .022; Rs 50000-100000 - Rs 6000-10000, mean difference 2.49, df 85, F 6.75, sig. .007). It was clear that the students of higher income groups had higher demand for teaching entrepreneurship and ways of starting business at this university than their counterparts in the income band of Rs 10000-20000 (Rs 20000-30000 – Rs 10000-20000, mean difference 1.82, df 85, F 6.75, sig. .003; Rs 30000-40000 – Rs 10000-20000, mean difference 2.43, df 85, F 6.75, sig. .007, Rs 50000-100000 - Rs 10000-20000, mean difference 2.49, df 85, F 6.75, sig. .001). Respondents of the income bracket Rs 30000-40000 were generally happier with the status quo than the participants of the Rs 6000-10000 income group (Rs 30000-40000 - Rs 6000-10000, mean difference 3.20, df 85, F 2.37, sig. .025). There was no significant effect of parents’ education, occupation, gender or residence on entrepreneurial acceptability at this university. Male students if properly taught about entrepreneurship would more seriously consider starting their own business as compared to females (male mean 6.16, female mean 5.30, df 84, t=2.13, sig. .036). The higher income group Rs 20000-30000 said they were more likely to start their own business in case of failure in getting an appropriate job than the
Entrepreneurial Attitudes among Potential Entrepreneurs
22
lower income band Rs 6000-10000 (Rs 20000-30000 - Rs 6000-10000, mean difference 2.77, df 85, F 3.09, sig. .024). Participants of the income bracket Rs 30000-40000 would more seriously consider starting a business as compared to the students of the lowest income range (Rs 30000-40000 - Rs 6000-10000, mean difference 3.97, df 85, F 2.77, sig. .004). There was no significant impact of gender, residence, parents’ occupation or education on entrepreneurial intentions. The higher income groups (ranging from Rs 30000-40000 to Rs 40000-50000) preferred personal businesses over working for others compared to the lower income bands (cf. Rs 30000-40000, mean difference 3.06, df 85, F 3.91, sig. .013; cf. Rs 40000-50000; mean difference 4.50, df 85, F 3.33, sig. .043). Participants with over Rs100000 monthly income had good social networks that could be utilized if they decided to start in business, compared to respondents of the Rs 30000-40000 income band (Rs over 100000-Rs 30000-40000, mean difference 3.71, df 85, F 3.33, sig. .043). There was no significant impact of parents’ education, profession, gender or residence on the entrepreneurial attitudes of the students at this university. 4.3.4 Gomal University D.I.Khan Fifty three percent of students had positive attitude towards entrepreneurial acceptability. However, 54% of respondents had negative attitudes towards entrepreneurial intentions. Fifty five percent of participants had positive attitudes towards personal entrepreneurial factors. As a whole, 51% students had positive attitudes towards entrepreneurship. There was a significant impact of mothers’ education on entrepreneurial acceptability. Students of higher qualified (graduate or postgraduate) mothers were more willing to accept the risks and insecurities associated with being in business than the respondents from the cluster of secondary education mothers (Other-Secondary Education, mean difference 2.70, df 73, F 3.04, sig. .038). Similarly, fathers’ occupation had significant impact on accepting entrepreneurship as a profession. Students whose fathers were employed, unemployed or retired were less willing to accept entrepreneurship as a career than those who had entrepreneurial fathers (Other-Entrepreneur, mean difference 3.08, df 73, F 3.35, sig. .044). The students falling in the Rs 50000-100000 income group had higher demand for teaching entrepreneurship than those of Rs 30000-40000 (Rs 50000-100000 - Rs 30000-40000, mean difference 4.26, df 73, F 3.44, sig. .021). It appeared that the demand for teaching entrepreneurship at university level is higher in the Rs 50000-100000 income group than the Rs over 100000 bracket (Rs 50000-100000 - over 100000, mean difference 4.00, df 73, F 3.44, sig. .026). The income group Rs 50000-100000 was more willing to see entrepreneurship as a future profession than those of the Rs 20000-30000 and over 100000 income bands (Rs 50000-100000 - Rs 20000-30000, mean difference 2.95, df 73, F 3.83, sig. .040; Rs 50000-10000 - Rs over 100000, mean difference 4.00, df 73, F 3.83, sig. .002). There was no significant impact of gender, fathers’ education or residence on entrepreneurial acceptability of students at this university. The respondents of the income group Rs 50000-100000 had higher entrepreneurial intention than those of the Rs 30000-40000 range (Rs 50000-100000 - Rs30000-40000, mean difference 4.73, df 73, F 2.81, sig. .006). The rest of the demographic variables (gender, residence, parents’ education and occupation) had no significant effect on entrepreneurial intentions of the students at this university. The Rs 50000-100000 income
Ali, Topping and Tariq
23
group had better social networks that could be utilized if they decided to become entrepreneurs than those of participants of the Rs 30000-40000 range (Rs 50000-100000 - Rs 30000-40000, mean difference 3.90, df 73, F 2.90, sig .01). Participants of the graduate/higher qualified mothers’ group also had well developed social networks that could be utilized compared to the higher secondary qualified group (Mother education: graduate/higher qualified - higher secondary, mean difference 3.76, df 73, F 3.75, sig. .004). All the other demographic variables such as gender, residence, fathers’ education or fathers’ occupation did not show any significant impact on personal factors that might influence entrepreneurial attitude. 4.3.5 University of the Punjab Lahore Sixty seven percent students were willing to accept the entrepreneurial profession. The data showed that 73% of respondents revealed positive intentions to start as entrepreneurs. Seventy-six percent of participants indicated positive inclinations towards personal entrepreneurial factors. As a whole 72% of respondents had positive attitudes towards entrepreneurship. The students of highly qualified mothers’ group would prefer successful business over secured/well paid jobs compared to the respondents having mothers with higher secondary qualifications (Mother education other - higher secondary, mean difference 4.06, df 70, F 2.69, sig. .036). The rest of the demographic variables (residence, gender, fathers’ education and occupation and fathers’ income) had no impact on accepting entrepreneurship at this university. None of the demographic variables (gender, residence, parents’ qualification, income and professions) had any significant effect on entrepreneurial intentions. However, male students had good social networks that could be utilized in future business careers (male mean 6.17, female mean 5.25, df 69, t=2.19, sig. .032). There was no significant effect of residence, parents’ qualification, income and occupation on the development of entrepreneurial personal factors among university students. 4.3.6 Bahauddin Zakariya University Multan Seventy three percent of students showed positive attitudes towards entrepreneurial acceptability. Seventy eight percent of respondents indicated positive intentions towards entrepreneurship. However, 63% of participants revealed negative attitudes towards personal factors. As a whole 62% respondents had positive attitude towards entrepreneurship. Rural students showed more desire to be taught about entrepreneurship and starting a business than urban participants (rural mean 6.35, urban mean 5.30, df 79, t=2.13, sig. .036). The rural respondents wanted to take the business option for earning more money compared to urban participants (rural mean 6.16, urban mean 4.74, df 79, t=2.79, sig. .007). The rural participants more closely monitored the areas where they needed more practice, compared to their urban counterparts (rural mean 6.67, urban mean 4.38, df 78, t=5.61, sig. .000). There was no significant impact of gender, parents’ qualification, occupation or income on the entrepreneurial acceptability of the students at this university. The people who rural students value in their life were perceived to have a stronger need for them to pursue entrepreneurship as a career as compared to the people of urban
Entrepreneurial Attitudes among Potential Entrepreneurs
24
students (rural mean 7.22, urban mean 6.02, df 79, t=3.04, sig. .003). The rural students seemed more serious in taking entrepreneurial option (rural mean 6.67, urban mean 3.38, df 78, t=5.61, sig. .000). There was no significant impact of gender, parents’ education, occupation or income on the entrepreneurial intentions of the students at this university. Rural students preferred personal businesses over jobs compared to their counterparts in urban areas (rural mean 4.83, urban mean 4.01, df 81, t=4.27, sig. .000). There was no significant effect of gender, parents’ education, profession or income on personal factors. 6. Overall Findings
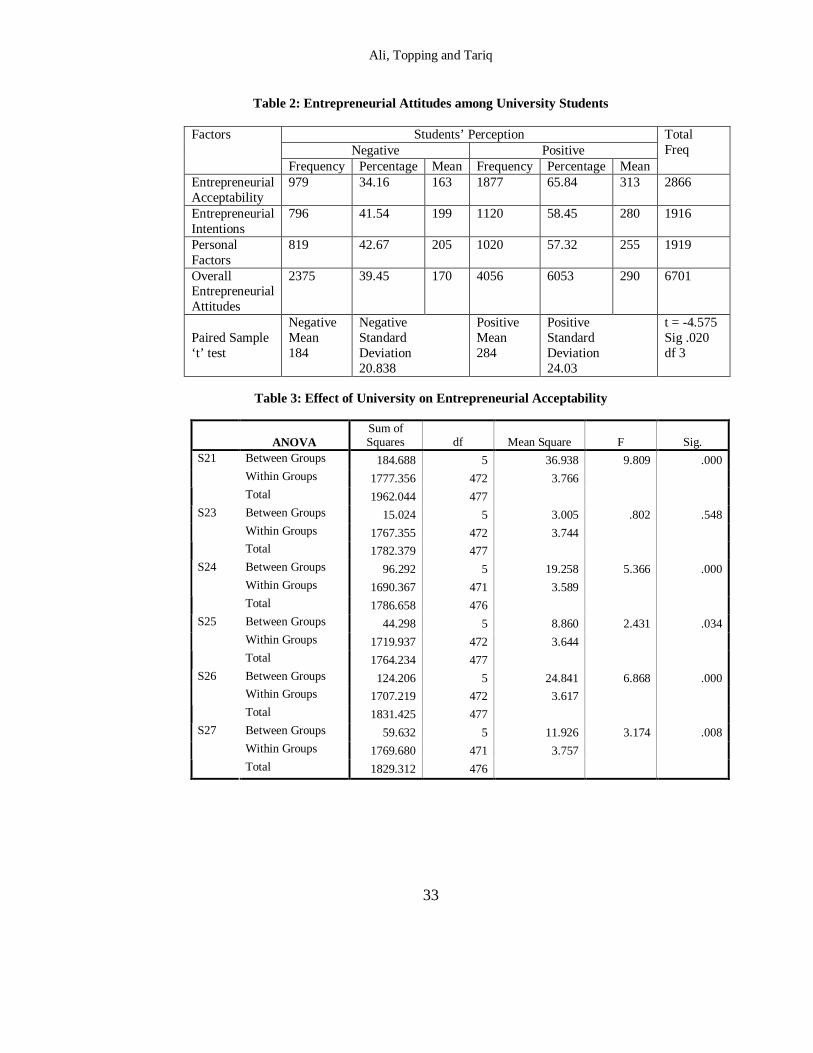
[INSERT TABLE 2 ABOUT HERE] Sixty five percent of university students overall were positive in their attitudes regarding accepting entrepreneurship as a profession (Table 2). Fifty eight percent of participants intended to pursue entrepreneurship as a career. Fifty seven percent of respondents had positive personal entrepreneurial factors. As a whole, 60% of students showed positive attitudes towards entrepreneurship.
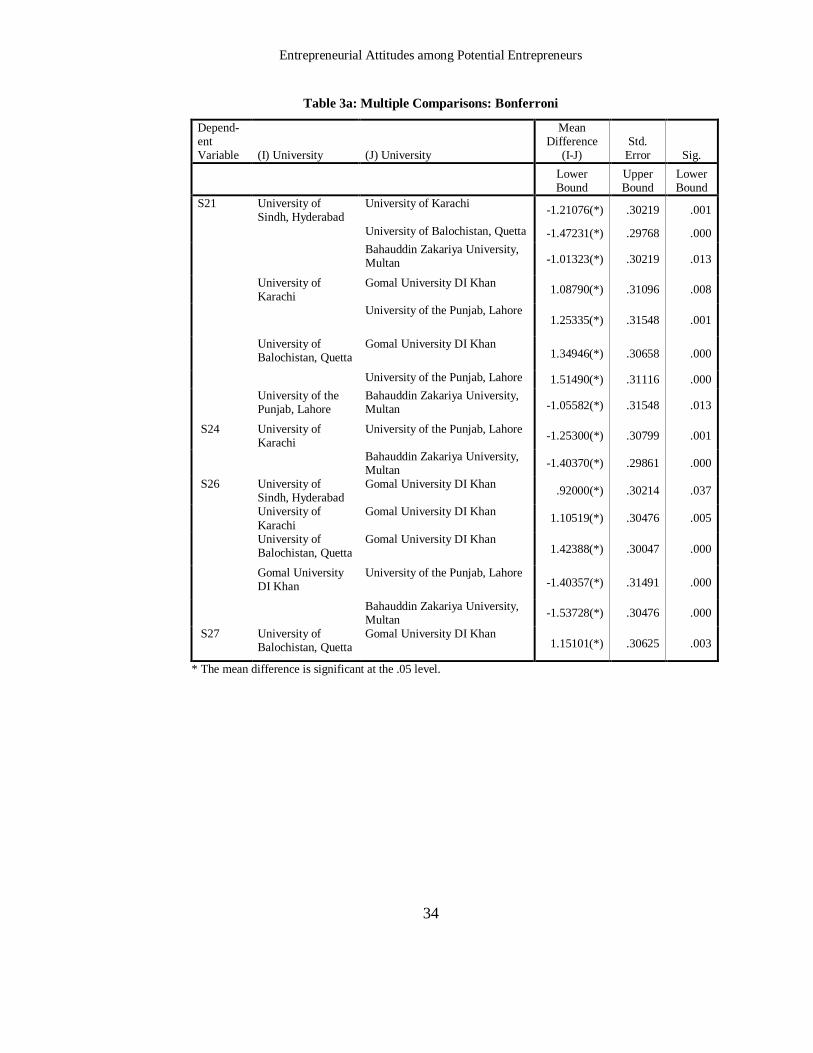
[INSERT TABLE 3 ABOUT HERE] There were significant effects of university on entrepreneurial acceptability (Table 3). The students at University of Karachi, University of Balochistan Quetta and Bahauddin Zakariya University Multan University had higher demand for the teaching of entrepreneurship than their counterparts at the University of Sindh Hyderabad. There was a higher demand for teaching entrepreneurship at University of Karachi than Gomal University D I Khan and University of the Punjab Lahore. The University of Balochistan Quetta had higher demand for entrepreneurial courses than Gomal University D I Khan and University of the Punjab Lahore. The students at Bahauddin Zakariya University Multan had higher demand for entrepreneurial courses than their counterparts at University of the Punjab Lahore. The respondents at University of the Punjab Lahore and Bahauddin Zakariya University Multan were happier with the existing situation than the University of Karachi. The respondents at University of Sindh Hyderabad, University of Karachi, University of Balochistan Quetta, University of the Punjab Lahore and Bahauddin Zakariya University Multan were more willing to accept business associated risks than their counterparts at Gomal University D I Khan. The students at University of Balochistan Quetta more closely monitor areas where they need more practice than their counterparts at Gomal University D I Khan.
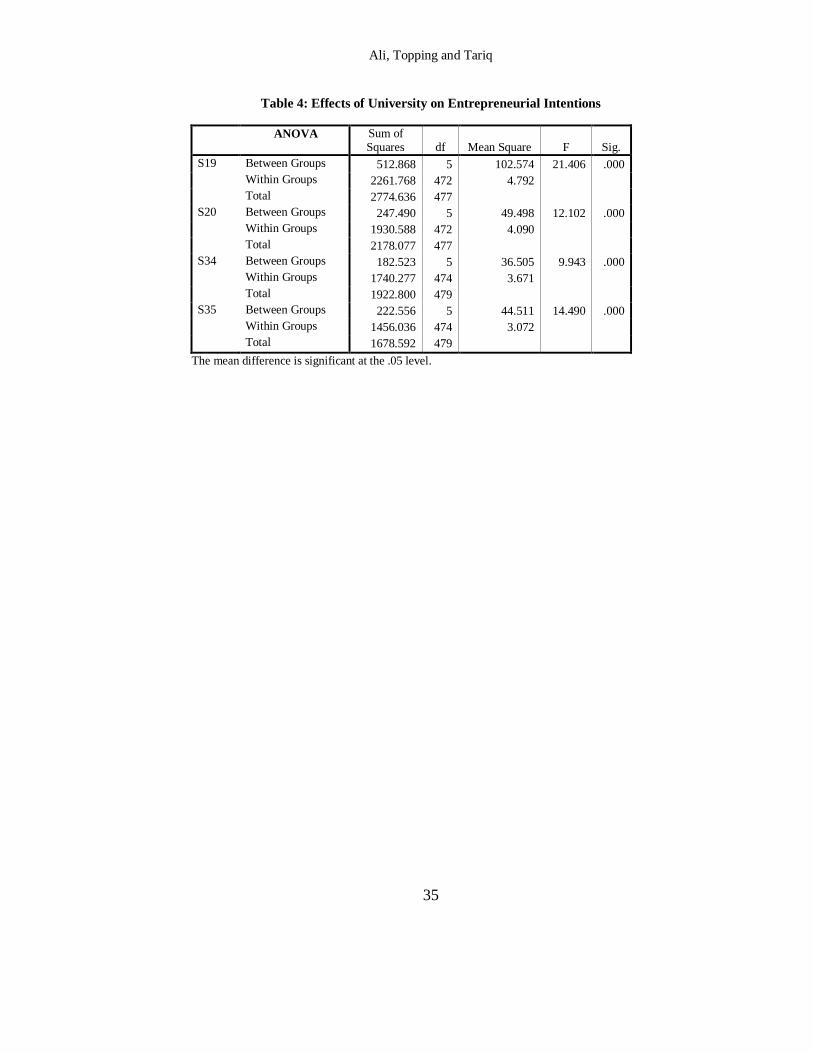
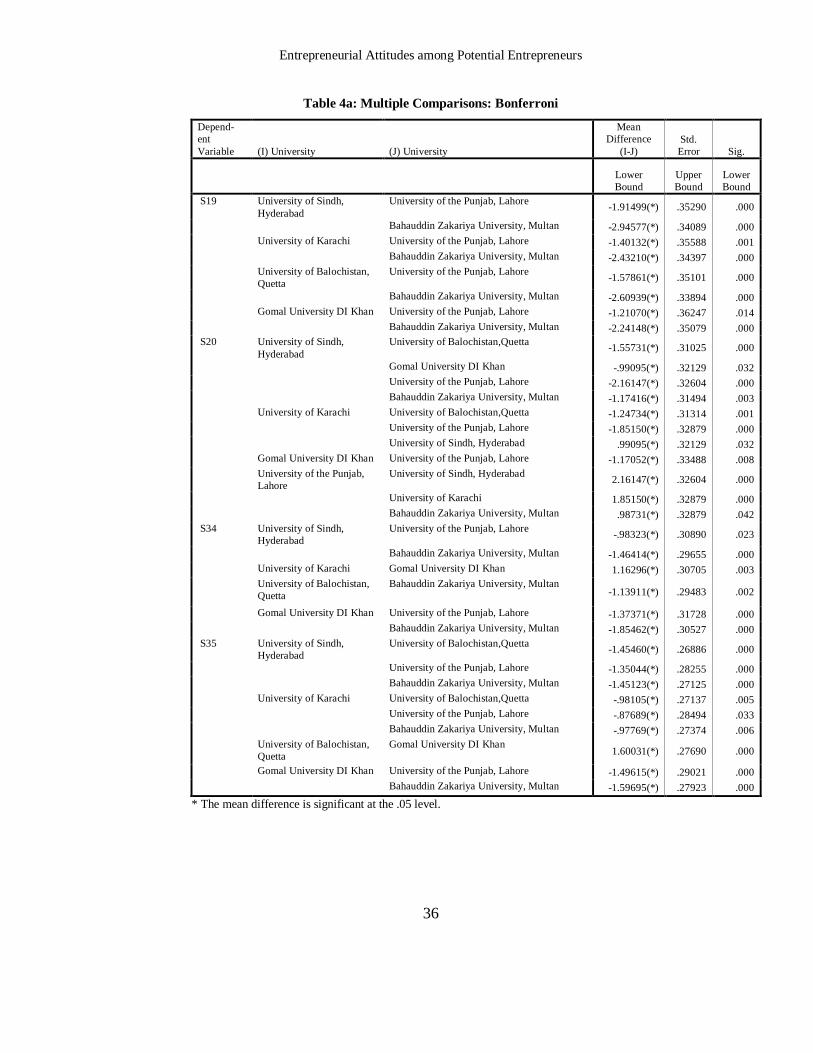
[INSERT TABLE 4 ABOUT HERE] Students at University of the Punjab Lahore and Bahauddin Zakariya University Multan believed that the people whom they considered important in their life had a stronger business wish for them than was the case at University of Sindh Hyderabad, University of Karachi, University of Balochistan Quetta and Gomal University D I Khan (Table 4). The students at University of Balochistan Quetta, Gomal University D I Khan, University of Karachi, University of the Punjab Lahore and Bahauddin Zakariya University Multan were more serious in starting as entrepreneurs if they could not find a job than the respondents at University of Sindh Hyderabad. The participants at University of Balochistan Quetta and University of the Punjab Lahore were more serious in business initiation if could not get a job than their colleagues at University of Karachi. The students at University of the Punjab Lahore and Bahauddin Zakariya University Multan
Ali, Topping and Tariq
25
were more serious about doing business than their classmates at University of Sindh Hyderabad, Gomal University D I Khan and University of Balochistan Quetta. Similarly, the University of Karachi was better than Gomal University D I Khan. The students at University of Balochistan Quetta, University of the Punjab Lahore and Bahauddin Zakariya University Multan were more confident to start their businesses if taught properly than were their counterparts at University of Sindh Hyderabad, University of Karachi and Gomal University D I Khan. University of Balochistan Quetta seemed better in terms of business initiation with proper training than Gomal University D I Khan.
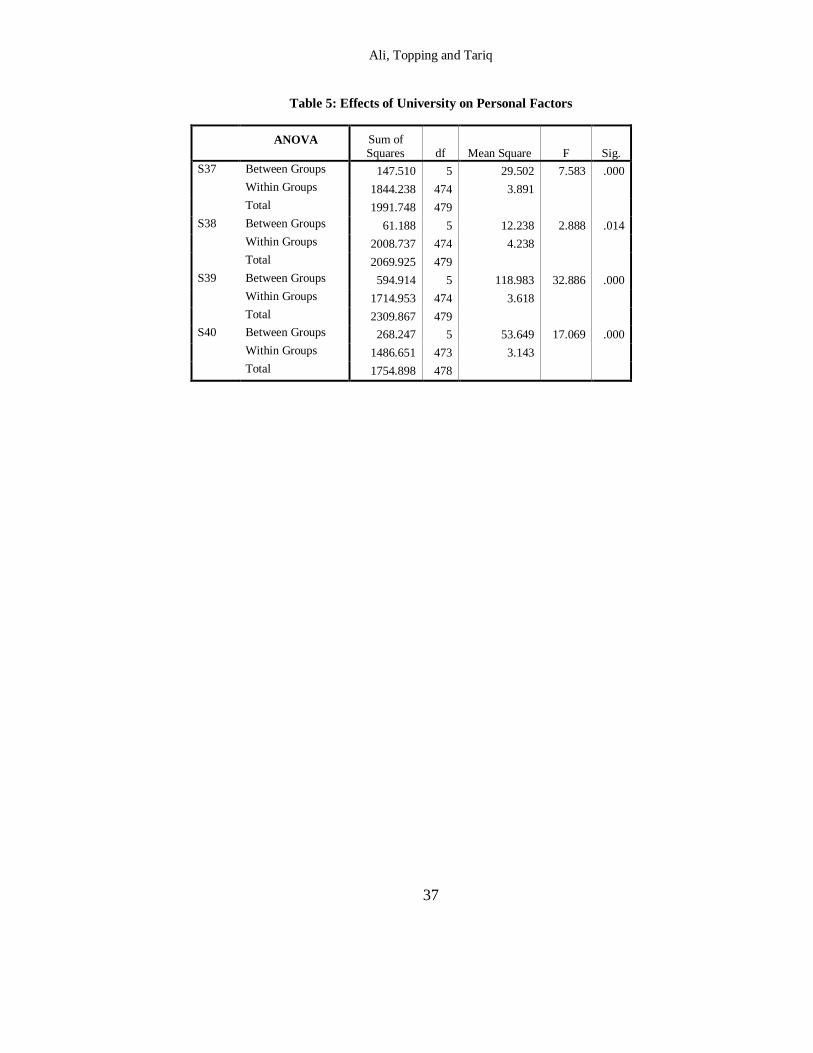
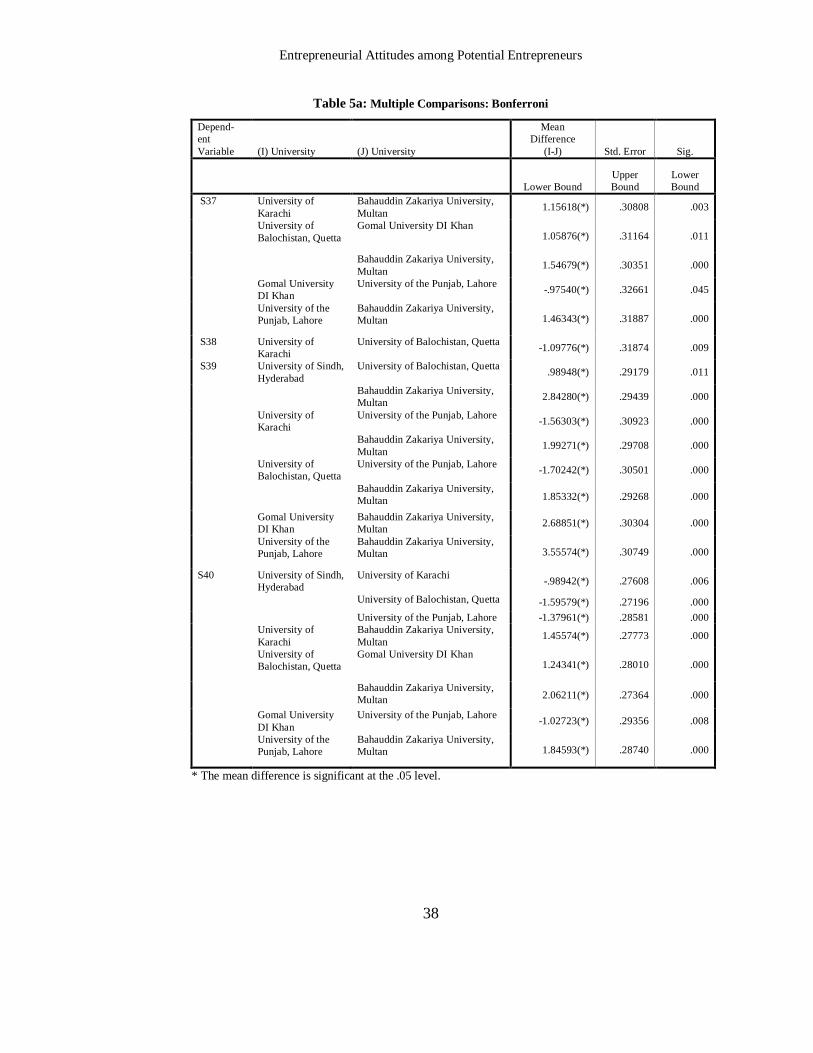
INSERT TABLE 5 ABOUT HERE The students at University of Karachi, University of Balochistan Quetta and University of the Punjab Lahore preferred to play group leadership roles than their classmates at Bahauddin Zakariya University Multan and Gomal University D I Khan (Table 5). To the students of University of Balochistan Quetta running a business was more prestigious than for their counterparts at University of Karachi. The students at University of Sindh Hyderabad, University of Punjab, University of Karachi and Gomal University D I Khan had better social networks for any future entrepreneurial activity than their classmates at University of Balochistan Quetta and Bahauddin Zakariya University Multan. The respondents at University of Karachi, University of Balochistan Quetta and University of the Punjab Lahore showed more commitment to work than their counterparts at University of Sindh Hyderabad, Bahauddin Zakariya University Multan and Gomal University D I Khan.
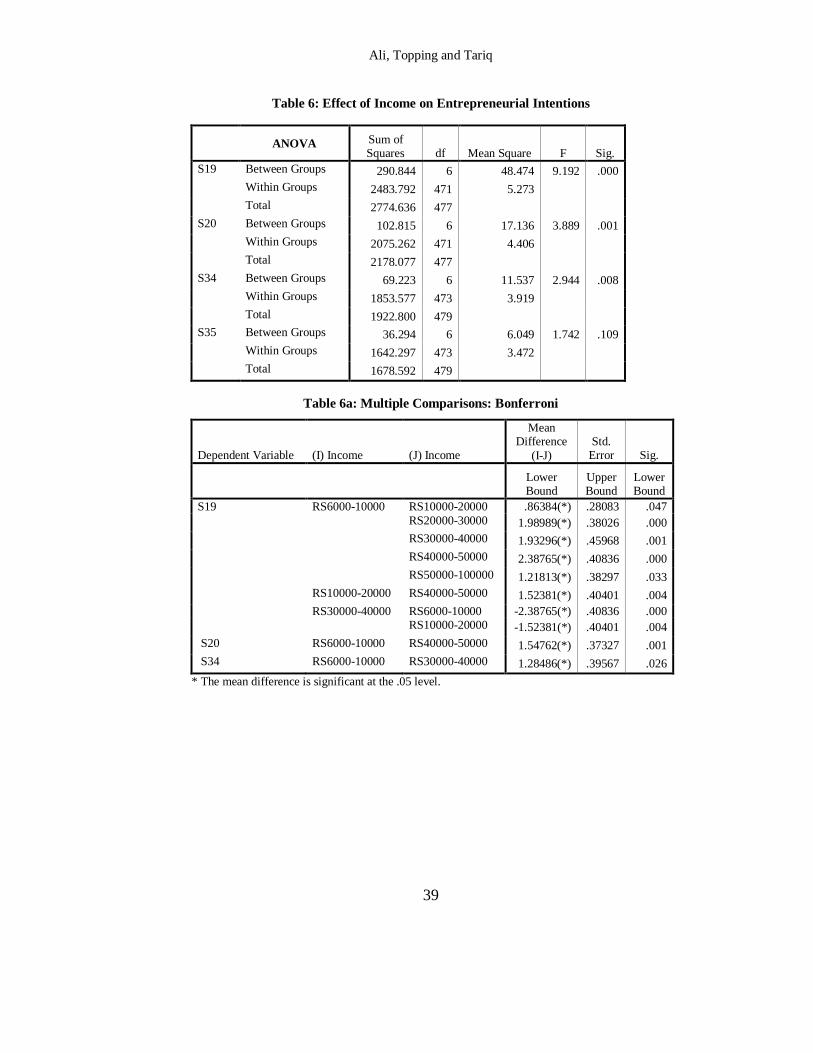
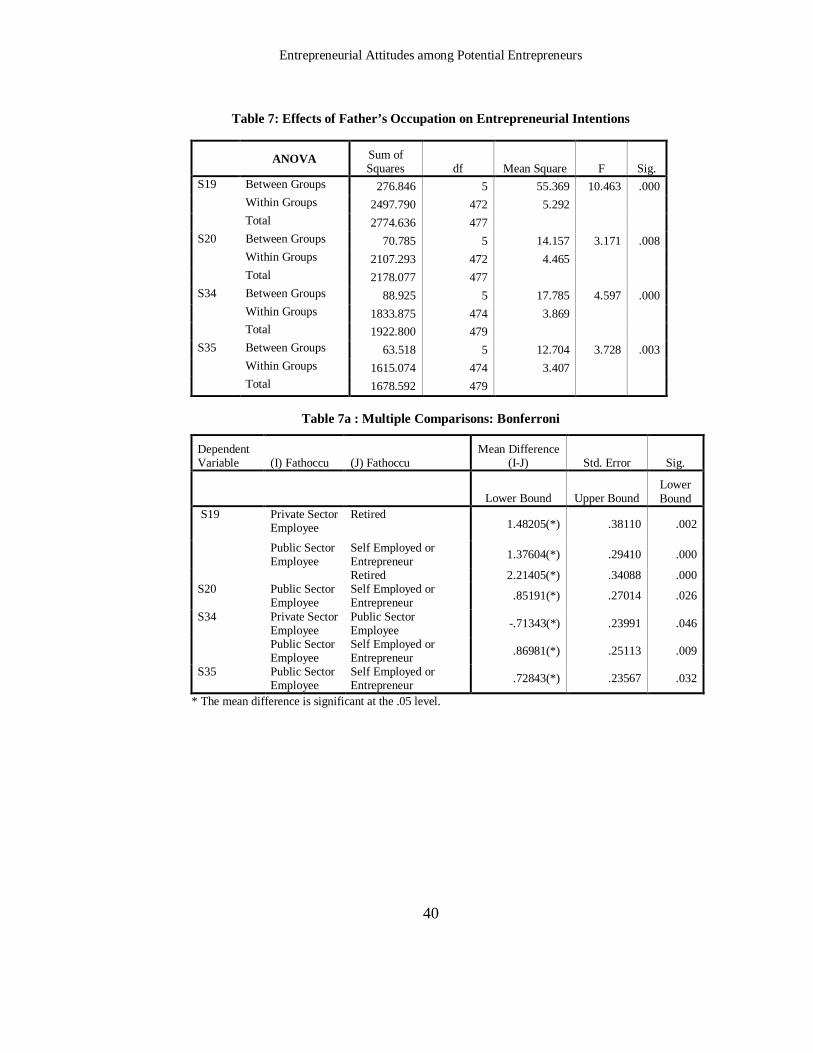
INSERT TABLES 6 & 7 ABOUT HERE The income group Rs 6000-10000 had higher entrepreneurial intentions than the Rs 10000-20000 up to Rs 50000-100000 income brackets (Table 6). Another significant entrepreneurial intention difference emerged between Rs 10000-20000 and Rs 30000-40000 income bands. The respondents of Rs 10000-20000 income range exhibited higher entrepreneurial intentions than their classmates of Rs 30000-40000 income bracket. The students whose fathers’ were employed in either the private or public sector had higher entrepreneurial intentions than those having retired or entrepreneurial fathers (Table 7). The public sector employee group was at the highest level of entrepreneurial intention, whereas retired employees expressed the lowest interest in the field. 7. Discussions and Conclusion Students at all the universities seemed positive in accepting entrepreneurship as a profession. There was significant impact of residence on entrepreneurial acceptability at the University of Sindh Hyderabad and Bahauddin Zakariya University Multan. The rural students of both these universities wanted to accept entrepreneurship for earning more money, as compared to the respondents at urban areas. They had a high desire for attending courses on entrepreneurship and seemed ready to take risks in this regard. This situation prevailed more at Bahauddin Zakariya University Multan. In general the students at University of Karachi, University of Balochistan Quetta and Bahuddin Zakariya University Multan had higher demands for teaching entrepreneurial courses at their respective institutions than the rest of the universities. There was a significant effect of parents’ income on entrepreneurial acceptability for students at University of Karachi, University of Balochistan Quetta and Gomal University D I Khan. Generally the higher income group up to Rs 50000-100000 in
Entrepreneurial Attitudes among Potential Entrepreneurs
26
comparison with their respective low income band respondents had a higher demand for teaching entrepreneurship. However, the students from the over 100000 income band had significantly lower acceptability for entrepreneurship as a future profession, compared to Rs 50000-100000 income bracket respondents. For achieving this objective they continuously reviewed the areas where they needed improvement. At University of Balochistan Quetta the respondents from middle income bracket (Rs 30000-40000) seem happier with the status quo than the lowest income group participants (Rs 6000-10000). At Gomal University D I Khan and University of the Punjab Lahore mothers’ education had a significant impact on accepting entrepreneurship as a future career choice. This was true for fathers’ profession only at Gomal University D I Khan. Generally the respondents who had graduate or postgraduate mothers compared to those having mothers with secondary level education seemed more willing to accept entrepreneurship as a future profession. Moreover, the students with all the parental professions except entrepreneurship would like to take entrepreneurship as a future career. Rural respondents at Bahauddin Zakariya University Multan are more willing to accept an entrepreneurial option as compared to their urban counterparts. Gender and fathers’ education did not have any effect on entrepreneurial acceptability at any of the universities under investigation. The respondents at University of Balochistan Quetta, University of the Punjab Lahore and Bahauddin Zakariya University exhibited higher level entrepreneurial intentions. On the other hand, respondents at University of Sindh Hyderabad, University of Karachi and Gomal University D I Khan indicated a negative attitude towards entrepreneurial intentions. However, the overall situation regarding entrepreneurial intentions was positive. There was partial impact of demographic variables (parents’ education, income, gender and residence) on the entrepreneurial intentions of university students. The parents’ income at University of Karachi, University of Balochistan Quetta and Gomal University D I Khan had a significant effect on the entrepreneurial intentions of the students. Generally the respondents of the lower income group compared to the higher income band have relatively higher entrepreneurial intentions. As a whole the two lowest income bands Rs 6000-10000 and Rs 10000-20000 exhibited higher entrepreneurial intentions than rest of the groups. The opposite trend can be observed in case of parents’ education. The participants with highly qualified parents have relatively strong entrepreneurial intentions compared to the students of low qualified parents. They prefer entrepreneurship even over well paid and secured government jobs. This trend was observed at University of Sindh Hyderabad and University of the Punjab Lahore. Male students when compared with female respondents indicated stronger entrepreneurial intentions at University of Sindh Hyderabad and University of Balochistan Quetta. At Bahauddin Zakariya University Multan and University of Sindh Hyderabad rural students revealed higher entrepreneurial intentions as compared to their urban counterparts. In the case of the University of Karachi the students having fathers doing public sector jobs had higher entrepreneurial intentions as compared to those with fathers with entrepreneurship as a career. Generally the private and public sector employee groups had higher entrepreneurial intentions than the participants belonging to either retired or entrepreneurial families. On the whole a sizable number of the university students in Pakistan have positive attitude towards entrepreneurship. However, at Bahauddin Zakariya University Multan
Ali, Topping and Tariq
27
most of the respondents recorded negative personal factors important in regarding entrepreneurship as a future career option. Among demographic variables income produced significant effects on entrepreneurial personal factors at University of Sindh Hyderabad, University of Karachi, University of Balochistan Quetta and Gomal University D I Khan. Generally high income group exhibited better leadership abilities, had better social networks and preferred personal businesses over working for others. Gender and residence also had some partial impact on entrepreneurial personal factors. Generally students living in rural areas and male respondents had better social networks for any entrepreneurial career choice. On the whole, the majority of the university students in Pakistan indicated future acceptance for entrepreneurship as a profession. Their strong entrepreneurial intentions provide convincing evidence in this regard. Results show personal factors that can support any future entrepreneurial activity. Among demographic factors, parents’ income emerged as the most influential variable. Generally, the majority of the respondents preferred the entrepreneurial option for earning more money. There was partial impact by the rest of the demographic variables (gender, residence, parents’ qualification and occupation). The other public sector universities in the country have a similar type of academic culture. Therefore, we might generalize these results to all general public universities in Pakistan: university students have a positive attitude towards entrepreneurship. To what extent this is translated into later behaviour is of course another question. This is the first study of its nature in the country, so further investigation should bring more clarification in the field. 8. Action Implications Entrepreneurship has a very significant position in the rapidly changing socio-economic scenario of the world. At the moment it is seen as a driving force for many of the world’s leading economies. Pakistan still seems at an initial stage of entrepreneurial thinking. Entrepreneurial thinking among both academia and political leadership is developing in the country. Some practical measures have also been taken in this regard. For example, the Chairman of the Higher Education Commission has recently inaugurated a science and technology park at the National University of Science and Technology Islamabad (Higher Education Commission, Pakistan, 2008e). This piece of research might stimulate further research work in the field. The measuring instrument used here could help for the future investigators. The findings of the study also provide some guidelines for making future decisions. One of the significant findings indicated that respondents in all universities showed high demand for an independent course on entrepreneurship. This situation demands serious consideration, particularly on the part of university authorities and more generally in the case of government. Possibly Pakistan can boost its economy through entrepreneurial promotion. University students if properly trained can play a leading role in this regard. This study identifies suitable students for entrepreneurial activity in future. With the support of government they can promote an entrepreneurial culture in the country.
Entrepreneurial Attitudes among Potential Entrepreneurs
28
References Beugelsdijk, S. and Noorderhaven,N. (2004) Entrepreneurial attitude and economic growth: A cross section of 54 regions. The Annals of Regional Science. 38(2), 199-218. Bhutta, M.K.S., Rana, A.I. and Asad, U. (2008) Owner characteristics and health of SMEs in Pakistan. Journal of Small Business and Enterprise Development. 15(1), 130-149 Boone, W. J. (1997). Science attitude of selected middle school students in China: A preliminary investigation of similarities and differences as a function of gender. School Science and Mathematics, 97, 96-103. Bygrave, W. and Miniti,M.(2000) The social dynamics of entrepreneurship. Entrepreneurship: Theory and practice, 24(1). Cachon,J. and Cotton,B. (2008). The long-term effects of active entrepreneurial training on business school students' and graduates' attitudes towards entrepreneurship. International Journal of Business and Globalisation, 2(1), 72 – 91. Chen, C.C., Greene, P.G. and Crick,A.(1998). Do entrepreneurial self-efficacy distinguish entrepreneurs from managers? Journal of Business Venturing. 13(4), 295-316. Chrisman,J.J., Hynes,T. and Fraser, S.(1995) Faculty entrepreneurship and economic development: the case of University of Calgary. Journal of Business Venturing, 10(4), 267-281. Dionco-Adetayo, E.A.(2006). Factors influencing attitude of youth towards entrepreneurship. International Journal of Adolescence and Youth, 13(1-2), 12-145. Ftzkowitz,H.(2004). The evolution of the entrepreneurial university. International Journal of Technology and Globalization. 1(1), 64-77. Frith, K. and McElwee, G. (2008). The entrepreneurial wide boy: a modern morality tale. International Journal of Entrepreneurship and Small Business 6(1). 80-93 Government of Pakistan (2002). Report of the task force on improvement of higher education in Pakistan: Challenges and opportunities. Islamabad: Ministry of Education. Government of Pakistan (2006). Green papers: National education policy review process. Islamabad: Ministry of Education, National Education Policy Review Team. Gurrero, M., Rialp,J. and Urbano,D.(2008). The impact of desirability and feasibility on entrepreneurial intentions: a structural equation model. International Entrepreneurship Management Journal, 4(1), 35-50 Gurol, Y. & Astan N. (2006). Entrepreneurial characteristics among university students: Some insights for entrepreneurship education and training in Turkey. Education and Training, 48(1), 25-38. Haq, I. (2008). All-failure defines performance Retrieved from http://www.dawn.com/2008/06/11/top1.htm) [June 11, 2008]. Higher Education Commission (2008a). Annual report for 2006-07. Islamabad: Higher Education Commission, Pakistan. Higher Education Commission (2008b) University of the Punjab - course. Retrieved from http://www.pu.edu.pk/description.asp?programid=900036 [June 8, 2008].
Ali, Topping and Tariq
29
Higher Education Commission Pakistan (2008c) Business administration & management (d) – Pakistan Research Repository. Retrieved from http://eprints.hec.gov.pk/view/subjects/d.html [June, 9, 2008]. Higher Education Commission (2008d). Statistics on higher education. Retrieved from http://www.hec.gov.pk/QualityAssurance/Statistics/Number%20of%20UniversitiesDAIs%20in%20Pakistan%20(1947%20to%202004-05).htm [April 1, 2008]. Higher Education Commissin (2008e). Higher education news and views, June, 2008. Islamabad: Higher Education Commission. Khan, Z. M. (2008). Rich-poor gap widened, says survey. Retrieved from http://www.dawn.com/2008/06/11/top8.htm [June, 11, 2008]. Kruegel,N.F. and Brazeal D.V.(1994). Entrepreneurial potential and potential entrepreneurs. Entrepreneurship: Theory and practice, 18(1) (page numbers not available) Krueger,N.F., Reilly,M.D. and Carsrud,A.L.(2000). Competing models of entrepreneurial intentions. Journal of Business Venturing 15(5-6), 411-432. Kuratko,D.F.(2005). The development of entrepreneurship education: development, trends and challenges. Entrepreneurship: Theory and Practice 29(5), 577-598 Lee, S.M. and Peterson, S.J.(2000). Culture, entrepreneurial orientation and global competitiveness. Journal of World Business. 35(4), 401-416. Levenburg,N.M.(2008). Entrepreneurial orientation among the youth of India. Journal of Entrepreneurship. 17(1), 15-35 Linan, F., Rodriguez-Cohard, J. & Rueda-Cantuche, J. M. (2005). Factors affecting entrepreneurial intention levels. Forty-fifth Congress of the European Regional Science Association, Amsterdam, 23-27 August, pp. 1-17. Lope Pihie, Z.A. (2008). An analysis of academic experience to develop entrepreneurial attributes and motivation among at risk students. The International Journal of Learning. 14(6), 207-218 Martinez, D., Mora, J. G. & Vila L. E. (2007). Entrepreneurs, the self employed and employees among young European higher education graduates. European Journal of Education, 42(1), 99-117. Mc Larty, R.(2005). The essentials of value chain implementation in small and medium sized enterprises. Strategic Change, 14, 15-58. Mian, S. A. (2006). Can entrepreneurial university model help Pakistan leapfrog into the knowledge economy? Some reflections. Proceedings of First International Conference on Assessing Quality in Higher Education, Lahore, December, 11-13. Mohar,Y., Singh,M.S. and Kamal,K.K.(2007) Relationship between psychological characteristics and entrepreneurial inclination: a case study of students at University Tun Abdul Razak (UNITAR) Journal of Asia Entrepreneurship and Sustainability July 2007,1-10 Norton Jr., W.I. and Moore, W.T.(2006). The influence of entrepreneurial risk assessment on venture launch or growth decisions. Small Business Economics 26(3), 215-226.
Entrepreneurial Attitudes among Potential Entrepreneurs
30
Othman,F.M., Mutalib,R.A., Ahmed, Z. and Akmal, N.A.(2008) Relationship between personality and entrepreneurial inclination among university students. The International Journal of Interdisciplinary Social Sciences, 2(4), 277-288 Parker, S.C. and Van Praag, C.M.(2006). Schooling, capital constraints and entrepreneurial performance: The endogenous triangle. Journal of Business and Economics Statistics. 24(4), 416-431 Pech, R.J. and Cameron, A. (2006). An entrepreneurial decision process model describing opportunity recognition. European Journal of Innovation Management. 9(1), 61-78 Pillis, E. D. & Reardon, K. K. (2007). The influence of personality traits and persuasive messages on entrepreneurial intention: A cross cultural comparison. Career Development International, 12(4), 382-396. Qamar, N. (2008). Geo business: Rs 2300 billion budget for 2008-09 announced. Retrieved from http://www.geo.tv/6-11-2008/19168.htm [June, 11, 2008]. Ramayah, T. & Haurn, Z. (2005). Entrepreneurial intentions among the students of Universiti Sains Malaysia. International Journal of Management and Entrepreneurship, 1(1), 8-20. Raposo,M.L.B., Matos Ferreira, J.J., Finisterra do Poo, A.M. and Gouveja Rodrigues, R.J.A.(2008). Propensity to firm creation: empirical research using structural equations. International Entrepreneurship and Management Journal. 4(2). 1-20. Rehman, A. (2008). Promotion of excellence in learning and research. In A. Rehman, Higher education in Pakistan: A silent revolution. Retrieved from http://www.iienetwork.org/page/108514/ [May 22, 2008]. Rodermund, E. S. (2004). Pathways to successful entrepreneurship: Parenting, personality, early developmental competence and interests. Journal of Vocational Behaviour, 65(3), 498-581. Schroder E. & Rodermund, E. S. (2006). Crystallizing enterprising interests among adolescents through a career development programme: The role of personality and family background. Journal of Vocational Behaviour, 69(3), 494-509. Segal, G., Borgia, D. and Schoenfeld,J.(2005) The motivation to become an entrepreneur. International Journal of Entrepreneurial Behaviour and Research, 11(1), 42-57. Shook, C.L. and Bratianu, C. (2008). Entrepreneurial intent in a transitional economy: an application of the theory of planned behaviour to Romanian students. The International Entrepreneurship and Management Journal, 4(1). Sobel, R.S. and King, K.A. (2008). Does school choice increase rate of youth entrepreneurship? Economics of Education Review.27 (4), 429-438. Souitaris, V., Zerbinati, S. & Al-Laham, A. (2006). Do entrepreneurial programmes raise the entrepreneurial intention of science and engineering students? The effects of learning inspiration and resources. Journal of Business Venturing, 22(4), 566-591.
Ali, Topping and Tariq
31
Taormina, R.J. and Lao, S.K-M. (2007). Measuring Chinese entrepreneurial motivation: personality and environmental influences. International Journal of Entrepreneurial. Behaviour and Research, 13(4), 200-221. Van Burg, E., Romme, A.G.L., Gilsing, V.A. and Reymen, I.M.M.J. (2008). Creating university spin-offs: A science-based design perspective. Journal of Product Innovation Management 25(2). 114-128. Vivarelli,M.(2004). Are all the potential entrepreneurs so good? Small Business Economics. 23(1), 41-49. Wang, C. K. & Wong, P. K. (2004) Entrepreneurial interests of university students in Singapore. Technovation, 24, 163-172. Wilson, L., Brown, W., Anderson, M. & Galloway, L. (2003). Entrepreneurial ambitions among male and female entrepreneurship students in Scotland. Proceedings of 48th World conference, International Council for Small Business. Pp.1-14. Zamppetakis, L. A. & Moustakis, V. (2006). Linking creativity with entrepreneurial intentions: A structural approach. The International Entrepreneurship and Management Journal, 2(3), 413-428. Zhao, H., Seibert, S. E. & Hills, G. E. (2005). The mediating role of self efficacy in the development of entrepreneurial intentions. Journal of Applied Psychology, 90(6), 1265-1272.
Entrepreneurial Attitudes among Potential Entrepreneurs
32
Appendix A
Table 1: Factor Matrix of Entrepreneurial Attitudes among University Students Factor No.
Attitudes Q.No Items Factor Loadings
R2
21 It is important to teach students about entrepreneurship and starting a business
.717
23 I am likely to make more money running my own business than working for others
.689
24 I am generally happy with the status quo .481 25 I would prefer to have my own successful business
than to be in a secure and well paid job .484
26 I feel that the risks and insecurities associated with being in business are acceptable
.587
1 Entrepreneurial acceptability
27 I closely monitor areas where I know I need more practice
.592
17.41%
19 I believe that people who are important to me think that I should pursue a career as an entrepreneur
.774
20 I would seriously consider starting my own business if I can’t find a job
.566
34 I have seriously considered starting my own business sometimes after graduate
.660
2 Entrepreneurial intentions
35 I would seriously consider starting my own business if I could be taught how to do it
.651
15.54
37 When working in group I prefer being a leader rather than a follower
.636
38 Running my own business would be more prestigious than working for others
.398
39 I have good social networks that can be utilized when I decide to be an entrepreneur
.752
3 Personal Factors
40 I look forward to return to work when I am away from my work
.740
13.07
Total Variance Explained 46.02% Rotation Varimax Cronbach Alpha for total scale .805 Cronbach Alpha Reliability for individual scales .782 Kaiser-Meyer-Olkin Measure of Sampling Adequacy .808 Bartlet Test of Sphericity 1187.545 df 91 Sig. .000 Convergent Validity in the entire individual subscales 100% Overall Convergent validity 89.65% Overall Discriminant Validity 10.35% Anti Image Correlation Less than -.1
Ali, Topping and Tariq
33
Table 2: Entrepreneurial Attitudes among University Students
Students’ Perception Negative Positive
Factors
Frequency Percentage Mean Frequency Percentage Mean
Total Freq
Entrepreneurial Acceptability
979 34.16 163 1877 65.84 313 2866
Entrepreneurial Intentions
796 41.54 199 1120 58.45 280 1916
Personal Factors
819 42.67 205 1020 57.32 255 1919
Overall Entrepreneurial Attitudes
2375 39.45 170 4056 6053 290 6701
Paired Sample ‘t’ test
Negative Mean 184
Negative Standard Deviation 20.838
Positive Mean 284
Positive Standard Deviation 24.03
t = -4.575 Sig .020 df 3
Table 3: Effect of University on Entrepreneurial Acceptability
ANOVA Sum of Squares df Mean Square F Sig.
Between Groups 184.688 5 36.938 9.809 .000 Within Groups 1777.356 472 3.766
S21
Total 1962.044 477 Between Groups 15.024 5 3.005 .802 .548 Within Groups 1767.355 472 3.744
S23
Total 1782.379 477 Between Groups 96.292 5 19.258 5.366 .000 Within Groups 1690.367 471 3.589
S24
Total 1786.658 476 Between Groups 44.298 5 8.860 2.431 .034 Within Groups 1719.937 472 3.644
S25
Total 1764.234 477 Between Groups 124.206 5 24.841 6.868 .000 Within Groups 1707.219 472 3.617
S26
Total 1831.425 477 Between Groups 59.632 5 11.926 3.174 .008 Within Groups 1769.680 471 3.757
S27
Total 1829.312 476
Entrepreneurial Attitudes among Potential Entrepreneurs
34
Table 3a: Multiple Comparisons: Bonferroni
Depend- ent Variable (I) University (J) University
Mean Difference
(I-J) Std.
Error Sig.
Lower Bound
Upper Bound
Lower Bound
S21 University of Sindh, Hyderabad
University of Karachi -1.21076(*) .30219 .001
University of Balochistan, Quetta -1.47231(*) .29768 .000 Bahauddin Zakariya University,
Multan -1.01323(*) .30219 .013
University of Karachi
Gomal University DI Khan 1.08790(*) .31096 .008
University of the Punjab, Lahore 1.25335(*) .31548 .001
University of Balochistan, Quetta
Gomal University DI Khan 1.34946(*) .30658 .000
University of the Punjab, Lahore 1.51490(*) .31116 .000 University of the
Punjab, Lahore Bahauddin Zakariya University, Multan -1.05582(*) .31548 .013
S24 University of Karachi
University of the Punjab, Lahore -1.25300(*) .30799 .001
Bahauddin Zakariya University, Multan -1.40370(*) .29861 .000
S26 University of Sindh, Hyderabad
Gomal University DI Khan .92000(*) .30214 .037
University of Karachi
Gomal University DI Khan 1.10519(*) .30476 .005
University of Balochistan, Quetta
Gomal University DI Khan 1.42388(*) .30047 .000
Gomal University DI Khan
University of the Punjab, Lahore -1.40357(*) .31491 .000
Bahauddin Zakariya University, Multan -1.53728(*) .30476 .000
S27 University of Balochistan, Quetta
Gomal University DI Khan 1.15101(*) .30625 .003
* The mean difference is significant at the .05 level.
Ali, Topping and Tariq
35
Table 4: Effects of University on Entrepreneurial Intentions
ANOVA
Sum of Squares df Mean Square F Sig.
S19 Between Groups 512.868 5 102.574 21.406 .000 Within Groups 2261.768 472 4.792 Total 2774.636 477 S20 Between Groups 247.490 5 49.498 12.102 .000 Within Groups 1930.588 472 4.090 Total 2178.077 477 S34 Between Groups 182.523 5 36.505 9.943 .000 Within Groups 1740.277 474 3.671 Total 1922.800 479 S35 Between Groups 222.556 5 44.511 14.490 .000 Within Groups 1456.036 474 3.072 Total 1678.592 479
The mean difference is significant at the .05 level.
Entrepreneurial Attitudes among Potential Entrepreneurs
36
Table 4a: Multiple Comparisons: Bonferroni
Depend-ent Variable (I) University (J) University
Mean Difference
(I-J) Std. Error Sig.
Lower Bound
Upper Bound
Lower Bound
S19 University of Sindh, Hyderabad
University of the Punjab, Lahore -1.91499(*) .35290 .000
Bahauddin Zakariya University, Multan -2.94577(*) .34089 .000 University of Karachi University of the Punjab, Lahore -1.40132(*) .35588 .001 Bahauddin Zakariya University, Multan -2.43210(*) .34397 .000 University of Balochistan,
Quetta University of the Punjab, Lahore -1.57861(*) .35101 .000
Bahauddin Zakariya University, Multan -2.60939(*) .33894 .000 Gomal University DI Khan University of the Punjab, Lahore -1.21070(*) .36247 .014 Bahauddin Zakariya University, Multan -2.24148(*) .35079 .000 S20 University of Sindh,
Hyderabad University of Balochistan,Quetta -1.55731(*) .31025 .000
Gomal University DI Khan -.99095(*) .32129 .032 University of the Punjab, Lahore -2.16147(*) .32604 .000 Bahauddin Zakariya University, Multan -1.17416(*) .31494 .003 University of Karachi University of Balochistan,Quetta -1.24734(*) .31314 .001 University of the Punjab, Lahore -1.85150(*) .32879 .000 University of Sindh, Hyderabad .99095(*) .32129 .032 Gomal University DI Khan University of the Punjab, Lahore -1.17052(*) .33488 .008 University of the Punjab,
Lahore University of Sindh, Hyderabad 2.16147(*) .32604 .000
University of Karachi 1.85150(*) .32879 .000 Bahauddin Zakariya University, Multan .98731(*) .32879 .042 S34 University of Sindh,
Hyderabad University of the Punjab, Lahore -.98323(*) .30890 .023
Bahauddin Zakariya University, Multan -1.46414(*) .29655 .000 University of Karachi Gomal University DI Khan 1.16296(*) .30705 .003 University of Balochistan,
Quetta Bahauddin Zakariya University, Multan
-1.13911(*) .29483 .002
Gomal University DI Khan University of the Punjab, Lahore -1.37371(*) .31728 .000 Bahauddin Zakariya University, Multan -1.85462(*) .30527 .000 S35 University of Sindh,
Hyderabad University of Balochistan,Quetta -1.45460(*) .26886 .000
University of the Punjab, Lahore -1.35044(*) .28255 .000 Bahauddin Zakariya University, Multan -1.45123(*) .27125 .000 University of Karachi University of Balochistan,Quetta -.98105(*) .27137 .005 University of the Punjab, Lahore -.87689(*) .28494 .033 Bahauddin Zakariya University, Multan -.97769(*) .27374 .006 University of Balochistan,
Quetta Gomal University DI Khan
1.60031(*) .27690 .000
Gomal University DI Khan University of the Punjab, Lahore -1.49615(*) .29021 .000 Bahauddin Zakariya University, Multan -1.59695(*) .27923 .000
* The mean difference is significant at the .05 level.
Ali, Topping and Tariq
37
Table 5: Effects of University on Personal Factors
ANOVA
Sum of Squares df Mean Square F Sig.
S37 Between Groups 147.510 5 29.502 7.583 .000 Within Groups 1844.238 474 3.891 Total 1991.748 479 S38 Between Groups 61.188 5 12.238 2.888 .014 Within Groups 2008.737 474 4.238 Total 2069.925 479 S39 Between Groups 594.914 5 118.983 32.886 .000 Within Groups 1714.953 474 3.618 Total 2309.867 479 S40 Between Groups 268.247 5 53.649 17.069 .000 Within Groups 1486.651 473 3.143 Total 1754.898 478
Entrepreneurial Attitudes among Potential Entrepreneurs
38
Table 5a: Multiple Comparisons: Bonferroni
Depend- ent Variable (I) University (J) University
Mean Difference
(I-J) Std. Error Sig.
Lower Bound Upper Bound
Lower Bound
S37 University of Karachi
Bahauddin Zakariya University, Multan 1.15618(*) .30808 .003
University of Balochistan, Quetta
Gomal University DI Khan 1.05876(*) .31164 .011
Bahauddin Zakariya University, Multan 1.54679(*) .30351 .000
Gomal University DI Khan
University of the Punjab, Lahore -.97540(*) .32661 .045
University of the Punjab, Lahore
Bahauddin Zakariya University, Multan 1.46343(*) .31887 .000
S38 University of Karachi
University of Balochistan, Quetta -1.09776(*) .31874 .009
S39 University of Sindh, Hyderabad
University of Balochistan, Quetta .98948(*) .29179 .011
Bahauddin Zakariya University, Multan 2.84280(*) .29439 .000
University of Karachi
University of the Punjab, Lahore -1.56303(*) .30923 .000
Bahauddin Zakariya University, Multan 1.99271(*) .29708 .000
University of Balochistan, Quetta
University of the Punjab, Lahore -1.70242(*) .30501 .000
Bahauddin Zakariya University, Multan 1.85332(*) .29268 .000
Gomal University DI Khan
Bahauddin Zakariya University, Multan 2.68851(*) .30304 .000
University of the Punjab, Lahore
Bahauddin Zakariya University, Multan 3.55574(*) .30749 .000
S40 University of Sindh, Hyderabad
University of Karachi -.98942(*) .27608 .006
University of Balochistan, Quetta -1.59579(*) .27196 .000 University of the Punjab, Lahore -1.37961(*) .28581 .000 University of
Karachi Bahauddin Zakariya University, Multan 1.45574(*) .27773 .000
University of Balochistan, Quetta
Gomal University DI Khan 1.24341(*) .28010 .000
Bahauddin Zakariya University, Multan 2.06211(*) .27364 .000
Gomal University DI Khan
University of the Punjab, Lahore -1.02723(*) .29356 .008
University of the Punjab, Lahore
Bahauddin Zakariya University, Multan 1.84593(*) .28740 .000
* The mean difference is significant at the .05 level.
Ali, Topping and Tariq
39
Table 6: Effect of Income on Entrepreneurial Intentions
ANOVA Sum of
Squares df Mean Square F Sig. S19 Between Groups 290.844 6 48.474 9.192 .000 Within Groups 2483.792 471 5.273 Total 2774.636 477 S20 Between Groups 102.815 6 17.136 3.889 .001 Within Groups 2075.262 471 4.406 Total 2178.077 477 S34 Between Groups 69.223 6 11.537 2.944 .008 Within Groups 1853.577 473 3.919 Total 1922.800 479 S35 Between Groups 36.294 6 6.049 1.742 .109 Within Groups 1642.297 473 3.472 Total 1678.592 479
Table 6a: Multiple Comparisons: Bonferroni
Dependent Variable (I) Income (J) Income
Mean Difference
(I-J) Std.
Error Sig.
Lower Bound
Upper Bound
Lower Bound
S19 RS6000-10000 RS10000-20000 .86384(*) .28083 .047 RS20000-30000 1.98989(*) .38026 .000 RS30000-40000 1.93296(*) .45968 .001 RS40000-50000 2.38765(*) .40836 .000 RS50000-100000 1.21813(*) .38297 .033 RS10000-20000 RS40000-50000 1.52381(*) .40401 .004 RS30000-40000 RS6000-10000 -2.38765(*) .40836 .000 RS10000-20000 -1.52381(*) .40401 .004 S20 RS6000-10000 RS40000-50000 1.54762(*) .37327 .001 S34 RS6000-10000 RS30000-40000 1.28486(*) .39567 .026
* The mean difference is significant at the .05 level.
Entrepreneurial Attitudes among Potential Entrepreneurs
40
Table 7: Effects of Father’s Occupation on Entrepreneurial Intentions
ANOVA Sum of
Squares df Mean Square F Sig. S19 Between Groups 276.846 5 55.369 10.463 .000 Within Groups 2497.790 472 5.292 Total 2774.636 477 S20 Between Groups 70.785 5 14.157 3.171 .008 Within Groups 2107.293 472 4.465 Total 2178.077 477 S34 Between Groups 88.925 5 17.785 4.597 .000 Within Groups 1833.875 474 3.869 Total 1922.800 479 S35 Between Groups 63.518 5 12.704 3.728 .003 Within Groups 1615.074 474 3.407 Total 1678.592 479
Table 7a : Multiple Comparisons: Bonferroni
Dependent Variable (I) Fathoccu (J) Fathoccu
Mean Difference (I-J) Std. Error Sig.
Lower Bound Upper Bound Lower Bound
S19 Private Sector Employee
Retired 1.48205(*) .38110 .002
Public Sector Employee
Self Employed or Entrepreneur 1.37604(*) .29410 .000
Retired 2.21405(*) .34088 .000 S20 Public Sector
Employee Self Employed or Entrepreneur .85191(*) .27014 .026
S34 Private Sector Employee
Public Sector Employee -.71343(*) .23991 .046
Public Sector Employee
Self Employed or Entrepreneur .86981(*) .25113 .009
S35 Public Sector Employee
Self Employed or Entrepreneur .72843(*) .23567 .032
* The mean difference is significant at the .05 level.
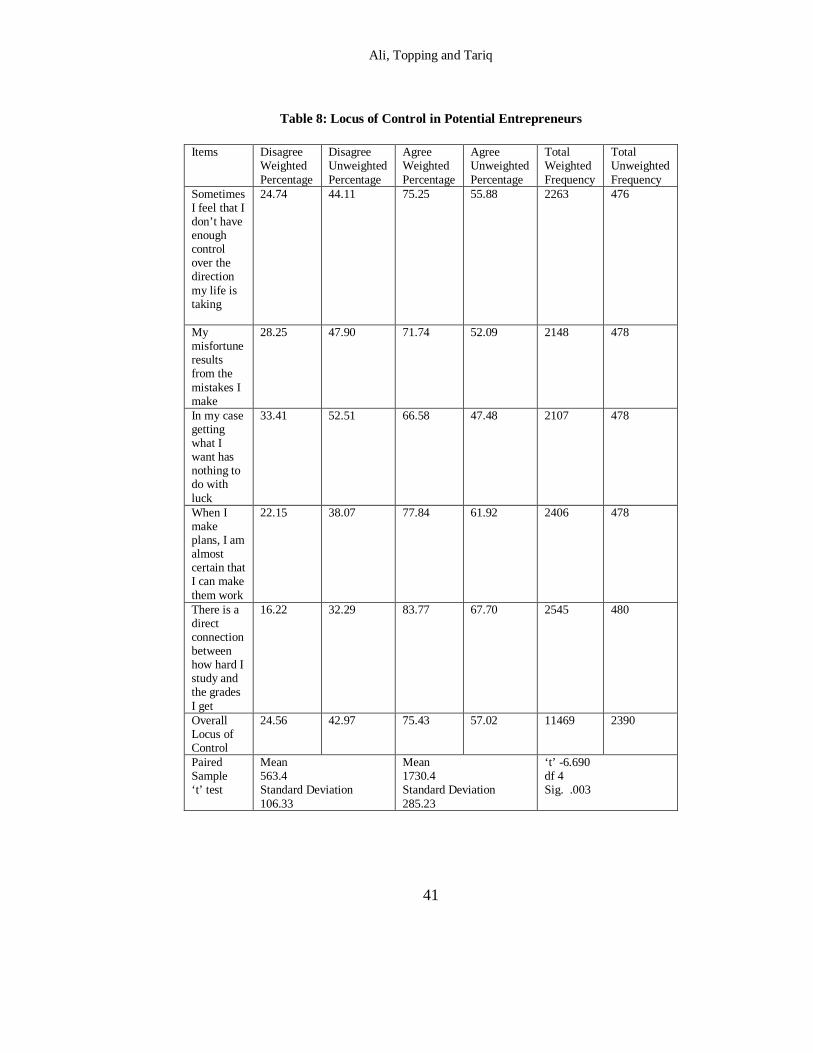
Ali, Topping and Tariq
41
Table 8: Locus of Control in Potential Entrepreneurs
Items Disagree
Weighted Percentage
Disagree Unweighted Percentage
Agree Weighted Percentage
Agree Unweighted Percentage
Total Weighted Frequency
Total Unweighted Frequency
Sometimes I feel that I don’t have enough control over the direction my life is taking
24.74 44.11 75.25 55.88 2263 476
My misfortune results from the mistakes I make
28.25 47.90 71.74 52.09 2148 478
In my case getting what I want has nothing to do with luck
33.41 52.51 66.58 47.48 2107 478
When I make plans, I am almost certain that I can make them work
22.15 38.07 77.84 61.92 2406 478
There is a direct connection between how hard I study and the grades I get
16.22 32.29 83.77 67.70 2545 480
Overall Locus of Control
24.56 42.97 75.43 57.02 11469 2390
Paired Sample ‘t’ test
Mean 563.4 Standard Deviation 106.33
Mean 1730.4 Standard Deviation 285.23
‘t’ -6.690 df 4 Sig. .003
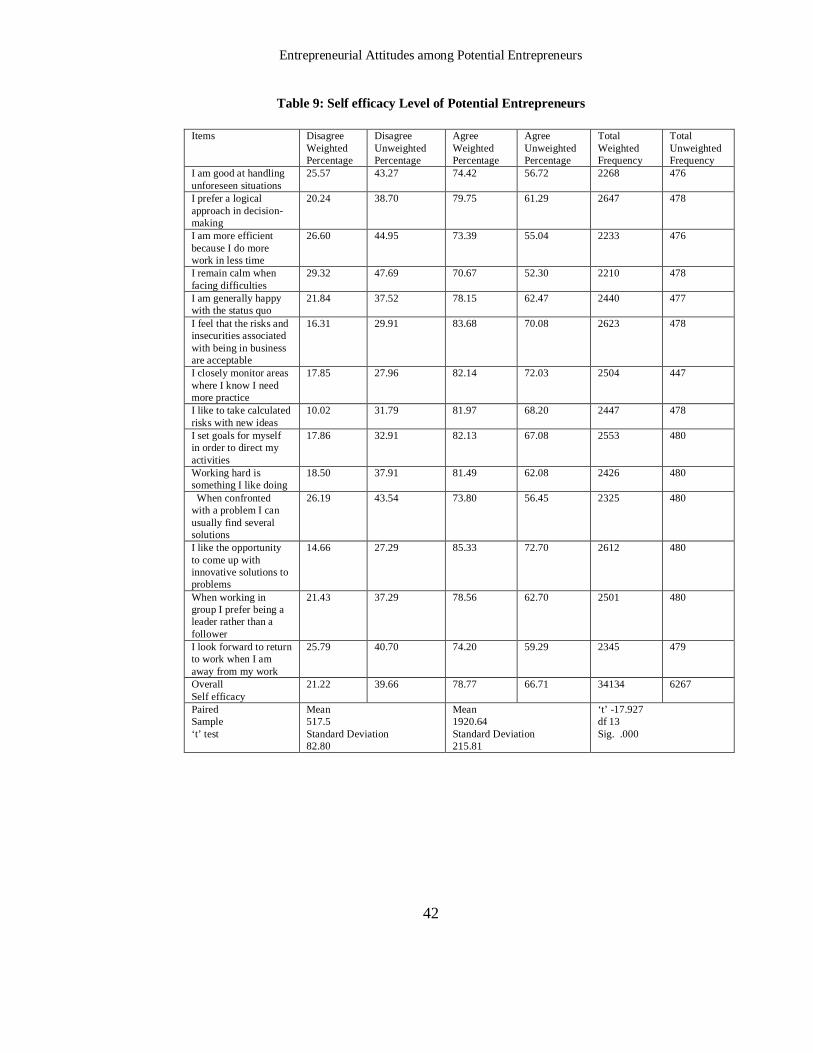
Entrepreneurial Attitudes among Potential Entrepreneurs
42
Table 9: Self efficacy Level of Potential Entrepreneurs Items Disagree
Weighted Percentage
Disagree Unweighted Percentage
Agree Weighted Percentage
Agree Unweighted Percentage
Total Weighted Frequency
Total Unweighted Frequency
I am good at handling unforeseen situations
25.57 43.27 74.42 56.72 2268 476
I prefer a logical approach in decision-making
20.24 38.70 79.75 61.29 2647 478
I am more efficient because I do more work in less time
26.60 44.95 73.39 55.04 2233 476
I remain calm when facing difficulties
29.32 47.69 70.67 52.30 2210 478
I am generally happy with the status quo
21.84 37.52 78.15 62.47 2440 477
I feel that the risks and insecurities associated with being in business are acceptable
16.31 29.91 83.68 70.08 2623 478
I closely monitor areas where I know I need more practice
17.85 27.96 82.14 72.03 2504 447
I like to take calculated risks with new ideas
10.02 31.79 81.97 68.20 2447 478
I set goals for myself in order to direct my activities
17.86 32.91 82.13 67.08 2553 480
Working hard is something I like doing
18.50 37.91 81.49 62.08 2426 480
When confronted with a problem I can usually find several solutions
26.19 43.54 73.80 56.45 2325 480
I like the opportunity to come up with innovative solutions to problems
14.66 27.29 85.33 72.70 2612 480
When working in group I prefer being a leader rather than a follower
21.43 37.29 78.56 62.70 2501 480
I look forward to return to work when I am away from my work
25.79 40.70 74.20 59.29 2345 479
Overall Self efficacy
21.22 39.66 78.77 66.71 34134 6267
Paired Sample ‘t’ test
Mean 517.5 Standard Deviation 82.80
Mean 1920.64 Standard Deviation 215.81
‘t’ -17.927 df 13 Sig. .000
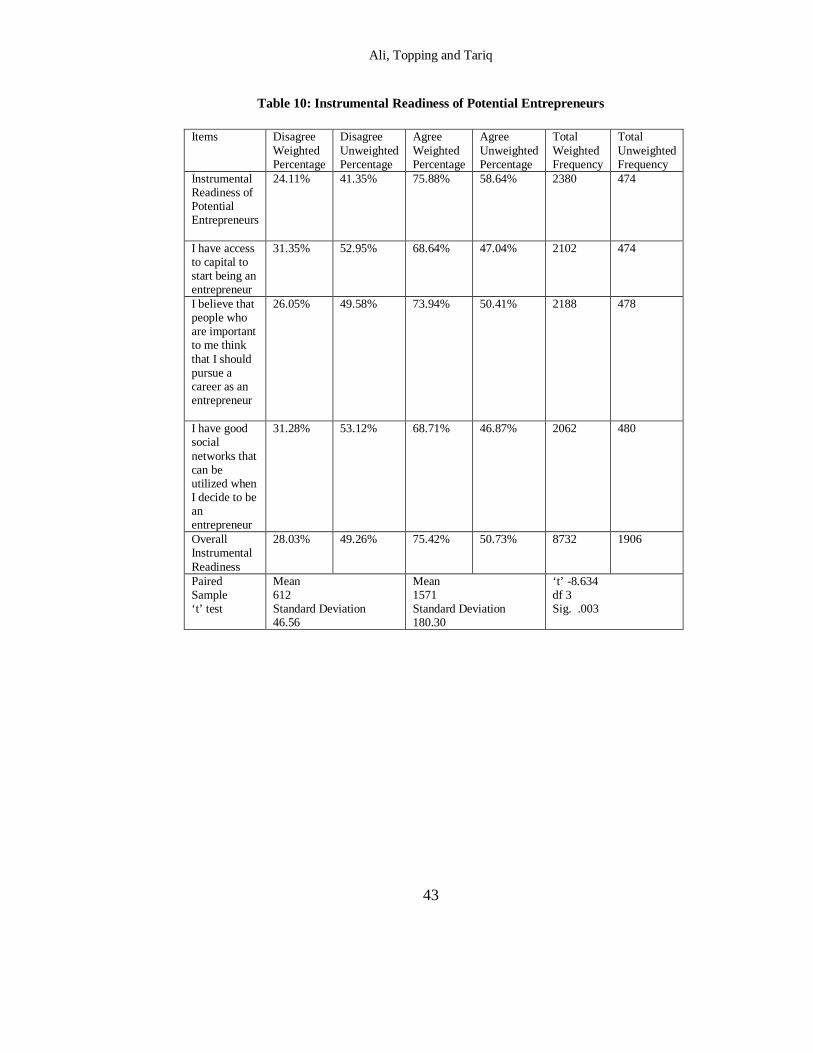
Ali, Topping and Tariq
43
Table 10: Instrumental Readiness of Potential Entrepreneurs Items Disagree
Weighted Percentage
Disagree Unweighted Percentage
Agree Weighted Percentage
Agree Unweighted Percentage
Total Weighted Frequency
Total Unweighted Frequency
Instrumental Readiness of Potential Entrepreneurs
24.11% 41.35% 75.88% 58.64% 2380 474
I have access to capital to start being an entrepreneur
31.35% 52.95% 68.64% 47.04% 2102 474
I believe that people who are important to me think that I should pursue a career as an entrepreneur
26.05% 49.58% 73.94% 50.41% 2188 478
I have good social networks that can be utilized when I decide to be an entrepreneur
31.28% 53.12% 68.71% 46.87% 2062 480
Overall Instrumental Readiness
28.03% 49.26% 75.42% 50.73% 8732 1906
Paired Sample ‘t’ test
Mean 612 Standard Deviation 46.56
Mean 1571 Standard Deviation 180.30
‘t’ -8.634 df 3 Sig. .003
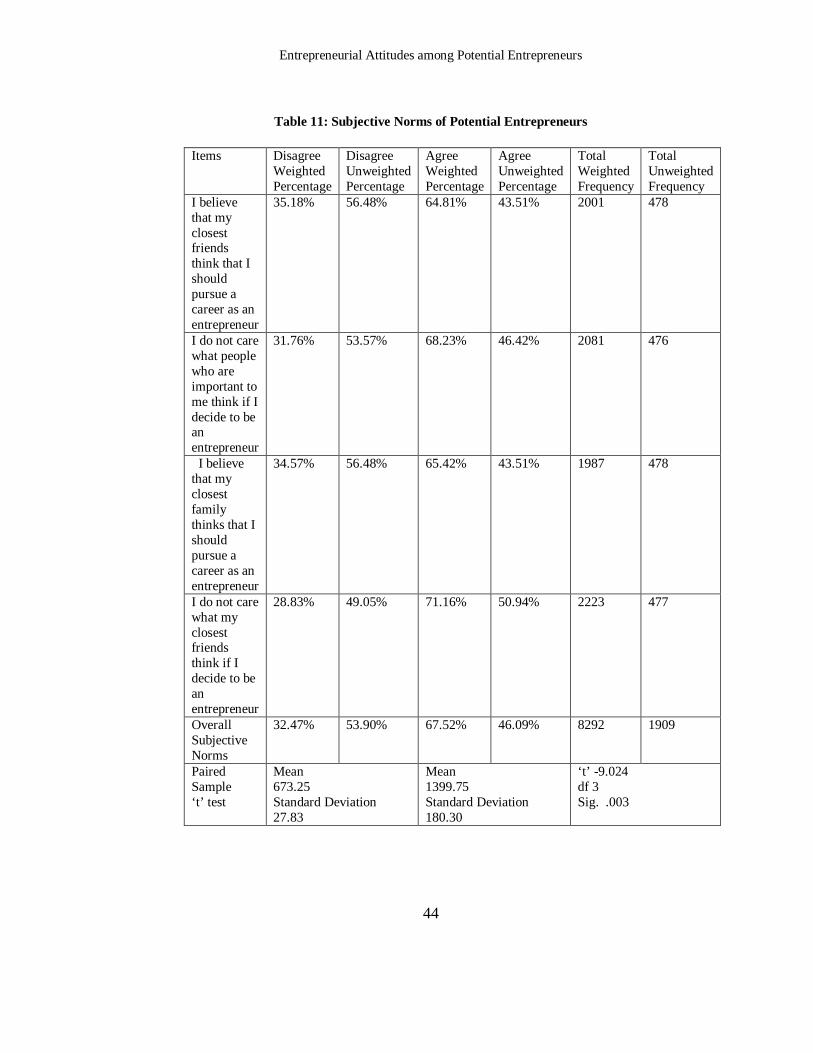
Entrepreneurial Attitudes among Potential Entrepreneurs
44
Table 11: Subjective Norms of Potential Entrepreneurs
Items Disagree
Weighted Percentage
Disagree Unweighted Percentage
Agree Weighted Percentage
Agree Unweighted Percentage
Total Weighted Frequency
Total Unweighted Frequency
I believe that my closest friends think that I should pursue a career as an entrepreneur
35.18% 56.48% 64.81% 43.51% 2001 478
I do not care what people who are important to me think if I decide to be an entrepreneur
31.76% 53.57% 68.23% 46.42% 2081 476
I believe that my closest family thinks that I should pursue a career as an entrepreneur
34.57% 56.48% 65.42% 43.51% 1987 478
I do not care what my closest friends think if I decide to be an entrepreneur
28.83% 49.05% 71.16% 50.94% 2223 477
Overall Subjective Norms
32.47% 53.90% 67.52% 46.09% 8292 1909
Paired Sample ‘t’ test
Mean 673.25 Standard Deviation 27.83
Mean 1399.75 Standard Deviation 180.30
‘t’ -9.024 df 3 Sig. .003
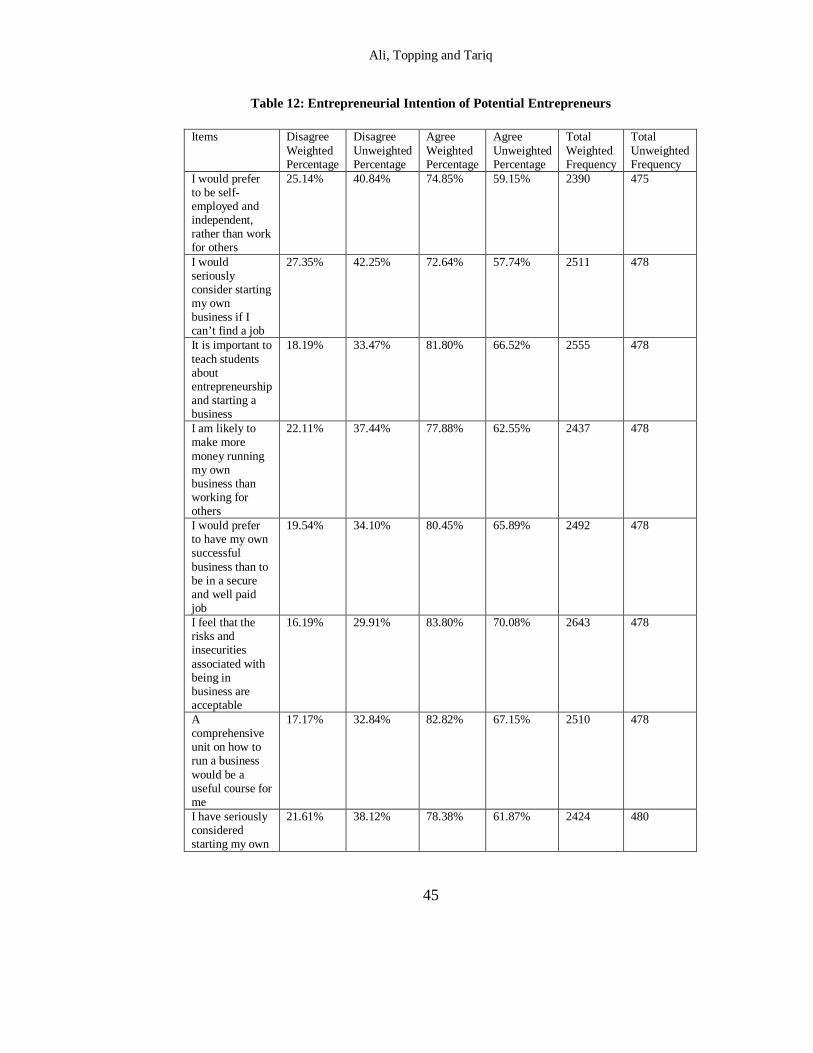
Ali, Topping and Tariq
45
Table 12: Entrepreneurial Intention of Potential Entrepreneurs Items Disagree
Weighted Percentage
Disagree Unweighted Percentage
Agree Weighted Percentage
Agree Unweighted Percentage
Total Weighted Frequency
Total Unweighted Frequency
I would prefer to be self-employed and independent, rather than work for others
25.14% 40.84% 74.85% 59.15% 2390 475
I would seriously consider starting my own business if I can’t find a job
27.35% 42.25% 72.64% 57.74% 2511 478
It is important to teach students about entrepreneurship and starting a business
18.19% 33.47% 81.80% 66.52% 2555 478
I am likely to make more money running my own business than working for others
22.11% 37.44% 77.88% 62.55% 2437 478
I would prefer to have my own successful business than to be in a secure and well paid job
19.54% 34.10% 80.45% 65.89% 2492 478
I feel that the risks and insecurities associated with being in business are acceptable
16.19% 29.91% 83.80% 70.08% 2643 478
A comprehensive unit on how to run a business would be a useful course for me
17.17% 32.84% 82.82% 67.15% 2510 478
I have seriously considered starting my own
21.61% 38.12% 78.38% 61.87% 2424 480
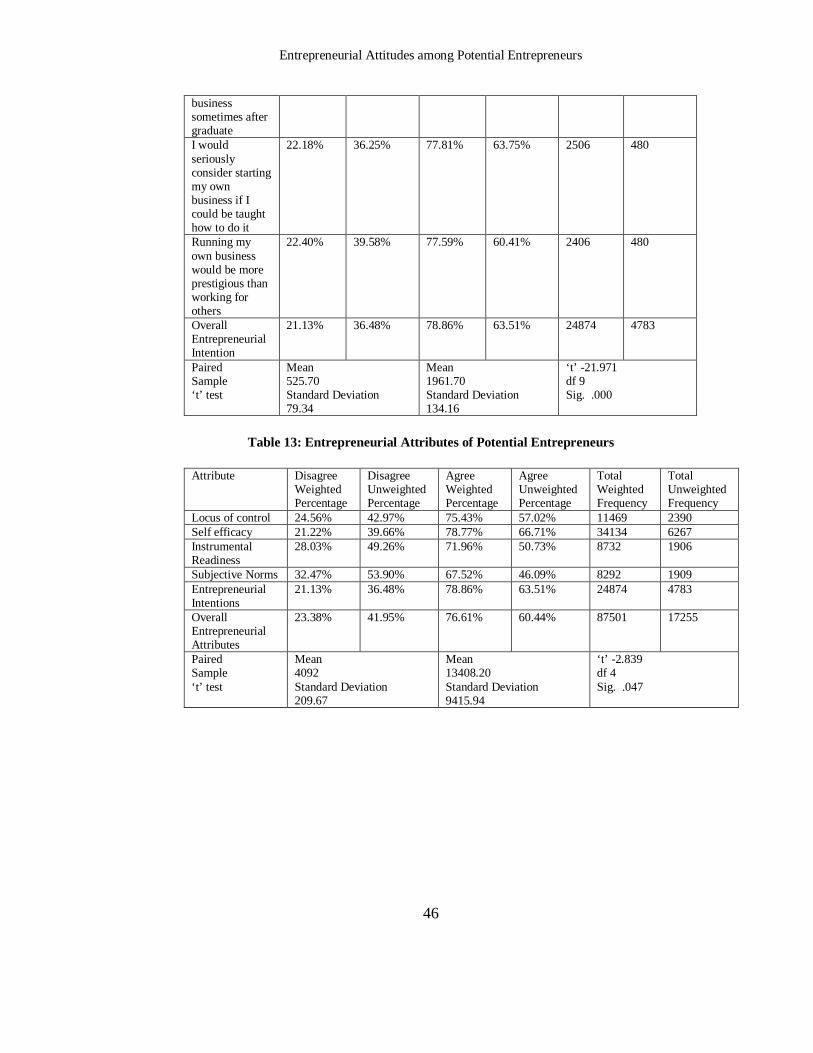
Entrepreneurial Attitudes among Potential Entrepreneurs
46
business sometimes after graduate I would seriously consider starting my own business if I could be taught how to do it
22.18% 36.25% 77.81% 63.75% 2506 480
Running my own business would be more prestigious than working for others
22.40% 39.58% 77.59% 60.41% 2406 480
Overall Entrepreneurial Intention
21.13% 36.48% 78.86% 63.51% 24874 4783
Paired Sample ‘t’ test
Mean 525.70 Standard Deviation 79.34
Mean 1961.70 Standard Deviation 134.16
‘t’ -21.971 df 9 Sig. .000
Table 13: Entrepreneurial Attributes of Potential Entrepreneurs
Attribute Disagree
Weighted Percentage
Disagree Unweighted Percentage
Agree Weighted Percentage
Agree Unweighted Percentage
Total Weighted Frequency
Total Unweighted Frequency
Locus of control 24.56% 42.97% 75.43% 57.02% 11469 2390 Self efficacy 21.22% 39.66% 78.77% 66.71% 34134 6267 Instrumental Readiness
28.03% 49.26% 71.96% 50.73% 8732 1906
Subjective Norms 32.47% 53.90% 67.52% 46.09% 8292 1909 Entrepreneurial Intentions
21.13% 36.48% 78.86% 63.51% 24874 4783
Overall Entrepreneurial Attributes
23.38% 41.95% 76.61% 60.44% 87501 17255
Paired Sample ‘t’ test
Mean 4092 Standard Deviation 209.67
Mean 13408.20 Standard Deviation 9415.94
‘t’ -2.839 df 4 Sig. .047