Embed Size (px)
Citation preview
381
ON DISTRIBUTIONAL CHANGES OF FINANCIAL CHARACTERISTICS IN CYPRUS: WHAT DOESTHE SURVEY OF CONSUMER FINANCES SAY?
Alex KARAGRIGORIOU Review article*
Department of Mathematics and Statistics UDC 657.63and Center of Banking and Finance, JEL C51, D10, D30, D31, G11University of Cyprus, Nicosia
Ilia VONTADepartment of Mathematics and Statistics,University of Cyprus, Nicosia
Abstract
This work is based on the Cyprus Survey of Consumer Finances (CySCF) and focus-es on one hand on the composition of household assets in Cyprus based on the 2002 Cy-prus Survey of Consumer Finances (CySCF2002) and on the other on the distributional changes between the 1999 and the 2002 CySCFs. From 1999 to 2002 there has been a radical increase of household participation in direct stockholding. This is due to the fact that there was a boom of the stock market with a remarkable increase of 688% during 1999, which, however, deflated dramatically during 2000 by 65%. In the same period a 50% increase in the share of households with loans backed by real estate other than their primary residences was observed. Furthermore, real estate prices rose sharply in most areas and affected to a great extent the net wealth so that a more than 7.5% increase was observed in the mean value of the net wealth from 1999 to 2002. Finally, the work deals with the econometric analysis of debts, and results based on probit models are provided. The variables selected are age, family size, employment status and income. The typical 2002 individual was identified as a 45-year old self-employed, married person with 3 chil-dren with a annual income of 18000 Cyprus pounds (1CY £ = 1.7 Euros). For the 2002 typical individual the probability of being in debt is found to be 66.5%.
Keywords: income distribution, family finances, wealth distribution, Cyprus
* Received: August 15, 2006Accepted: November 29, 2006

382
Alex Karagrigoriou and Ilia Vonta: On Distributional Changes of Financial Characteristics in Cyprus:What Does the Survey of Consumer Finances Say?Financial Theory and Practice 30 (4), 380-403 (2006)
1 Introduction
The survey of consumer finances (SCF) collects detailed information on wealth and other financial characteristics of households. The main goal of an SCF, which usually runs on a triennial basis, is to provide accurate and reliable cross-sectional information for the entire spectrum of household financial and non-financial assets and debts. At the same time, information on how portfolio data are related to demographic characteris-tics of households and on their borrowing, lending and risk-taking attitudes is provided. Such surveys are currently run in Finland, Spain, Germany, England, the Netherlands, the United States of America for example. Surveys of this kind can reveal numerous as-pects of financial and non-financial behaviour and can be used for econometric studies. Politicians, policy makers and economists have shown a constant interest in the magni-tude of debt burden of households and in the habit of borrowing money in order to build a business or purchase a house.
The data for Cyprus were collected in 1999 (CySCF1999) and 2002 (CySCF2002) which can be considered as two years that were critical for household finances. Between those years the country observed an increase of stock holding and then a crash in the Cy-prus Stock Market. As a result, the period under investigation was crucial for the finan-cial structure of households and provides an ideal data set for research. Cyprus is a small country with highly developed banking and insurance sectors but with a long tradition of tight regulation of financial markets and a limited selection of financial assets available to households or individuals. A process of relaxing capital controls was underway at the beginning of the CySCF1999 but the banking sector had been operating under a statu-tory ceiling on lending interest rates ever since 1944. The ceiling was abolished on Jan-uary 1st, 2001 and since then Cyprus has been experiencing financial liberalization. The borrowing constraints on households have been limited and since then more people have had the opportunity of borrowing money. A key role has been played by an increasing number of non-bank organizations that entered into the market and created substitutes for bank lending.
The Cyprus Stock Exchange (CSE) started operating on March 29, 1996 in accord-ance with the relevant laws and regulations passed by the House of Representatives the period 1993 - 1995. Due to the predominant euphoria about the newly established stock market and its expectations, the CSE sustained noticeable increase in stock prices. In terms of year-end figures, the general price index of the Cyprus Stock Exchange dropped by 6.23% during 1997, increased by 18% during 1998 and experienced a remarkable in-crease equal to 688% during 1999 and an estimated average daily volume of 17.5 million Cyprus pounds (more than 12 times the average in 1998). This upward movement was followed by a sudden fall of 65% during 2000. From 1999 to 2002 there was a radical increase of household participation in direct stockholding. However even after the crash households continued holding stocks in order to avoid the realisation of losses. Further-more, the crash of the stock market in conjunction with a substantial drop in the volume of daily transactions created a new interest for Cypriots, who started borrowing in order to invest money in land, houses and apartments. In addition, Cyprus has distinctive char-acteristics due to the long tradition of parents providing either a home or a large amount of money to help their children to get settled. Consequently, young people do not have
383
Alex Karagrigoriou and Ilia Vonta: On Distributional Changes of Financial Characteristics in Cyprus:What Does the Survey of Consumer Finances Say?
Financial Theory and Practice 30 (4), 381-403 (2006)
recourse to bank lending. For all the above reasons Cyprus is of financial interest and the task of undertaking an SCF in Cyprus was a significant one.
Research on income distribution was neglected in Cyprus up until the mid 90s. Pol-icy makers and economists had to rely on general feelings and speculations primarily because no reliable statistical data were available. In 1997 the University of Cyprus and the Central Bank of Cyprus, realising this gap in economic research in Cyprus, decided to join forces and start administering the Cyprus Survey of Consumer Finances (CySCF) which even today is the only source of information about household finances in Cyprus. As a result, the present article aims at filling a gap by presenting the basic features of household income distribution in Cyprus. Another main contribution of the present work is that it deals for the first time with distributional changes in the financial characteris-tics of Cypriot households. In addition, the interest in the CySCF is enhanced by Cyprus being the only country outside the financially developed core that runs such a survey and has detailed information on household portfolios. Finally, the reliability of CySCF on the composition of assets and liabilities lies in its efficiency in providing a detailed and comprehensive picture about investment risks and the financial behaviour of house-holds with respect to purchasing, borrowing, lending and investing.
The composition of liabilities as well as the changes of debt distribution of Cy-prus household portfolios were analysed by a recent paper by Antoniou et. al (2004). The composition of household assets in Cyprus based on the first Cyprus Survey of Consumer Finances (CySCF1999) was the subject of a recent work by Kourouyian-nis (2005). This paper deals with the composition of assets based on CySCF2002 and the changes in asset distribution between 1999 and 2002. Furthermore, the changes in net wealth are investigated. Finally, an econometric analysis of debts is provided. The paper is organized as follows. Section 2 describes the Cyprus survey of consumer fi-nances. Section 3 provides a preliminary analysis which focuses on households’ finan-cial and non-financial assets, family income and debts. Section 4 discusses the compo-sition of household assets and investigates the correlation between family income, fi-nancial and non-financial assets, and participation in the stock market. Section 5 ex-plores the demographic shifts in net wealth and section 6 provides the results of a de-tailed econometric analysis of debts. All values reported in this work are in 2002 Cy-prus pounds using the CPI.
2 The Cyprus survey of consumer finances
The first Cyprus Survey of Consumer Finances was administered in 1999 and the second in 2002. The third survey was initiated in January 2005 and the database is ex-pected by the end of 2006. The sampling design is based on standard area-probability multi-stage sampling techniques and provides two samples, the main and the wealthy samples. The main sample is a representative sample from the entire population, which is included in the survey to ensure adequate representation of broadly distributed charac-teristics. Furthermore, it is common practice to use oversampling for the wealthy popu-lation. Usually the population holding a greater amount of assets is proportionally small-er in terms of the total population with a highly skewed wealth distribution so that the overrepresentation in the sample of the wealthy population is an internationally accept-
384
Alex Karagrigoriou and Ilia Vonta: On Distributional Changes of Financial Characteristics in Cyprus:What Does the Survey of Consumer Finances Say?Financial Theory and Practice 30 (4), 380-403 (2006)
able approach for dealing with this issue. The CySCF addresses the issue of statistical efficiency through the use of this dual-frame sample design.
For the CySCF1999, 1097 questionnaires (539 from the main and 558 for the wealthy sample) were collected. Due to the under-representation in some geographic areas and the over-representation of high-income households, the appropriate geographical and in-come weights have been calculated and implemented into the data base. The final sam-ple for CySCF1999 consisted of 1361 households. The corresponding sample sizes for CySCF2002 are 521 for the main population and 376 for the wealthy population. After the implementation of the appropriate weights, the final sample size was raised to 1197. The response rates for both surveys were between 70% and 80% .
The questionnaire follows mainly the format of the United States Survey of Con-sumer Finances and the interviewers used the method of Paper and Pencil (PAPI) for the collection of data. The interview was conducted in person and averaged about 90 min-utes. Since one important advantage of the survey is the collection of detailed informa-tion on assets and debts, every effort was made for the questionnaire to be completed by the economically dominant unit of the household. The questionnaire went through a list of items, so the risk of forgetting to report an item was smaller than with a questionnaire referring to broad categories of assets and debts. Furthermore, this approach reduced the tendency toward underreporting. The survey is organized in 16 sections ranging from demographic information and household attitudes to financial matters and financial in-stitutions to detailed portfolio characteristics1.
The project has been financed by the Central Bank of Cyprus since its initiation in 1997 and is conducted exclusively by a research group at the Research Unit of Banking and Fi-nance at the University of Cyprus. Furthermore CySCF1999 and CySCf2002 have been in-corporated into the international SCF database known as the Luxembourg Wealth Study.
The large amount of information collected in the Survey of Consumer Finances re-sults in great size and demanding administration. One way of dealing with this difficulty is the splitting of the survey into smaller-size specialized surveys according to the purpose of the investigation. Furthermore, a panel survey like the one used currently in the Neth-erlands may be appropriate for the evaluation of social indicators. Such a survey may be useful in identifying not only the factors responsible for economic inequality but also the mechanisms that can work effectively against it. Panel data are also useful in properly ad-dressing issues of portfolio dynamics as well as the dynamics of living standards.
The European Central Bank (ECB) has recently established a team of experts who along with the representatives of the central banks of European Union (EU) countries are discussing the possibility of making the implementation of the Survey of Consumer Finances mandatory in EU. The design of such a survey is expected to be prepared cen-trally and administered in the member countries, which could, however, insert special sections that would be of benefit to the local policy making mechanisms. This attempt of the ECB focuses on the construction of cross-national data useful for wealth compa-rability, which is lagging far behind income comparability. This way a network of pro-
1 The codebook for the CySCF2002 is available on the website of the project at http://www.ucy.ac.cy/~alex /Alex_Karagrigoriou_Files/Codebook_CySCF2002.pdf.
385
Alex Karagrigoriou and Ilia Vonta: On Distributional Changes of Financial Characteristics in Cyprus:What Does the Survey of Consumer Finances Say?
Financial Theory and Practice 30 (4), 381-403 (2006)
ducers of microdata on household wealth will be established and the in-depth analysis of wealth distribution across Europe will be made feasible.
3 Preliminary analysis
This section makes brief references to family income as well as household assets and liabilities. The before-tax family income is categorized into eight income categories ac-cording to the total amount of the yearly income of each household. Assets are catego-rised as financial and non-financial. Financial assets cover liquid accounts like saving, deposit accounts, checking, government and saving bonds, mutual funds, saving certifi-cates, stocks, corporate bonds and warrants, the cash value of life insurance, other insur-ances like medical, educational etc., cash value of pension plans and retirement accounts and liquid accounts in foreign currency. Non-financial assets include consumer durables (like vehicles, motorcycles etc), equity in businesses, gross value of primary residence, gross value of other residential estates and gross value of real estate in the part of the is-land which is not under the control of the Republic of Cyprus.
In the analysis that follows the pension plans will be included since we focus on the augmented wealth in which all sources of future income (e.g. pension plans) are includ-ed. It is worth noting that the properties in the part of the island which is not controlled by the Republic of Cyprus have not been accessible since 1974 so that the gross value reported by households must be viewed with caution since it may not be accurate and up to date. Finally, for the definition of retirement accounts in 1999, social security contri-butions are excluded, whereas in 2002 they are included.
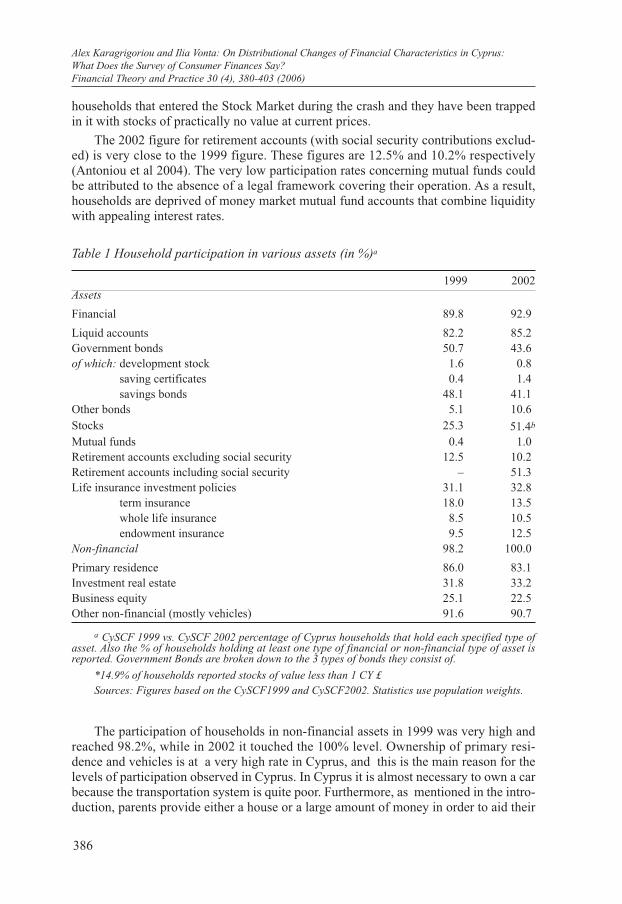
Table 1 provides the participation rates of households holding various financial and non-financial assets for the two survey periods of concern. It is obvious that the partici-pation rate of Cyprus households holding financial assets despite the very high risk (pri-marily due to stock holding) is almost 93% of households for 2002 and being slightly below at 89.8% for 1999. This result is ascribed to households’ holdings of liquid ac-counts that reach a level of 82.2% in 1999 and increased by 3 percentage points, reach-ing 85.2%, in 2002 and simultaneously, to households’ holdings of government bonds, especially saving bonds, which however degraded by 7 percentage points from 50.7% in 1999 to the level of 43.6% in 2002. The popularity of these bonds can be attributed not only to the fact that they are government papers of low denomination and of virtually no default risk but also to their monthly participation in lottery drawings that can result in substantial returns in conjunction with a guaranteed minimum return.
We were able to ascribe the reduction in the holding of government bonds to the re-markable increase of stock holding between the periods of concern. People replaced gov-ernment and other bonds by stocks while the Cyprus stock market was still rising. Later, despite the crash they continued holding stocks, in the hope of an increase in order to avoid the realisation of losses. The salient difference between the two periods is the im-portant increase in stock participation, which went from 25.3% in 1999 to 36.5% in 2002, despite the fact that 2002 followed the stock market crash. An extra 14.9% of house-holds reported possession of stocks at a value less than 1 CY£2. These are assumed to be
2 1 CY£ =1.7 Euros; Cyprus entered the ERM II on May 1st, 2005 with this central rate.
386
Alex Karagrigoriou and Ilia Vonta: On Distributional Changes of Financial Characteristics in Cyprus:What Does the Survey of Consumer Finances Say?Financial Theory and Practice 30 (4), 380-403 (2006)
households that entered the Stock Market during the crash and they have been trapped in it with stocks of practically no value at current prices.
The 2002 figure for retirement accounts (with social security contributions exclud-ed) is very close to the 1999 figure. These figures are 12.5% and 10.2% respectively (Antoniou et al 2004). The very low participation rates concerning mutual funds could be attributed to the absence of a legal framework covering their operation. As a result, households are deprived of money market mutual fund accounts that combine liquidity with appealing interest rates.
Table 1 Household participation in various assets (in %)a
1999 2002 Assets
Financial 89.8 92.9
Liquid accounts 82.2 85.2Government bonds 50.7 43.6of which: development stock 1.6 0.8 saving certificates 0.4 1.4 savings bonds 48.1 41.1Other bonds 5.1 10.6Stocks 25.3 51.4b
Mutual funds 0.4 1.0Retirement accounts excluding social security 12.5 10.2Retirement accounts including social security – 51.3Life insurance investment policies 31.1 32.8 term insurance 18.0 13.5 whole life insurance 8.5 10.5 endowment insurance 9.5 12.5Non-financial 98.2 100.0
Primary residence 86.0 83.1Investment real estate 31.8 33.2Business equity 25.1 22.5Other non-financial (mostly vehicles) 91.6 90.7
a CySCF 1999 vs. CySCF 2002 percentage of Cyprus households that hold each specified type of asset. Also the % of households holding at least one type of financial or non-financial type of asset is reported. Government Bonds are broken down to the 3 types of bonds they consist of.
*14.9% of households reported stocks of value less than 1 CY £Sources: Figures based on the CySCF1999 and CySCF2002. Statistics use population weights.
The participation of households in non-financial assets in 1999 was very high and reached 98.2%, while in 2002 it touched the 100% level. Ownership of primary resi-dence and vehicles is at a very high rate in Cyprus, and this is the main reason for the levels of participation observed in Cyprus. In Cyprus it is almost necessary to own a car because the transportation system is quite poor. Furthermore, as mentioned in the intro-duction, parents provide either a house or a large amount of money in order to aid their
387
Alex Karagrigoriou and Ilia Vonta: On Distributional Changes of Financial Characteristics in Cyprus:What Does the Survey of Consumer Finances Say?
Financial Theory and Practice 30 (4), 381-403 (2006)
children to settle down and this is one of the main reasons for the very high ownership rates in Cyprus. The high participation rate in real (i.e. non-financial) assets is one of the interesting features of Cyprus households, especially if one compares these figures with equivalents in other countries. For example, according to the United States SCF one out of ten US households owns no real assets as opposed to the almost nil in Cyprus.
Table 1 on non-financial assets participation shows that the figures for investment in real estate increased slightly from 1999 to 2002, although prices of houses rose sharply (all houses were overvalued). The figures for 1999 were 31.8% and for 2002 they reached the level of 33.2%, making this a negligible change.
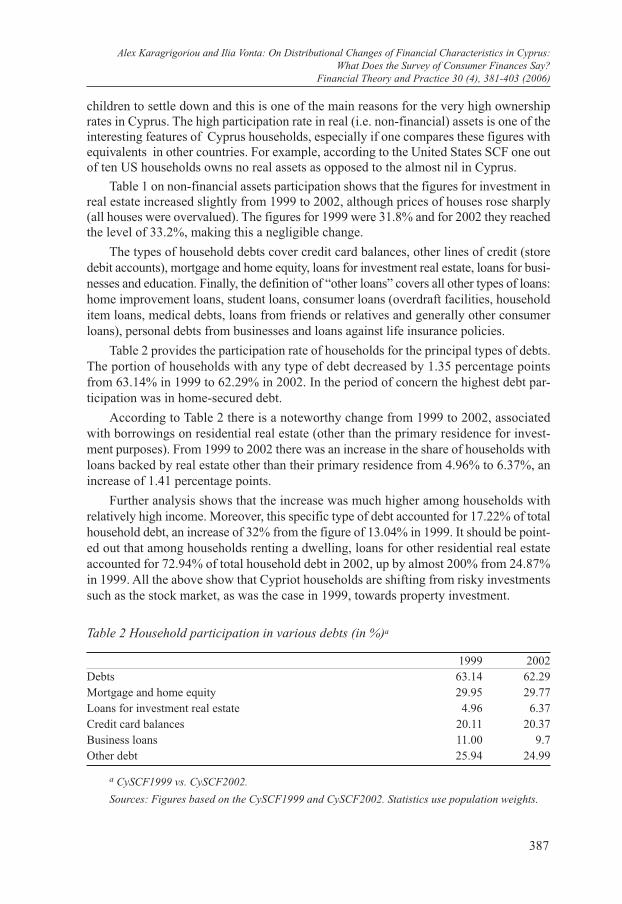
The types of household debts cover credit card balances, other lines of credit (store debit accounts), mortgage and home equity, loans for investment real estate, loans for busi-nesses and education. Finally, the definition of “other loans” covers all other types of loans: home improvement loans, student loans, consumer loans (overdraft facilities, household item loans, medical debts, loans from friends or relatives and generally other consumer loans), personal debts from businesses and loans against life insurance policies.
Table 2 provides the participation rate of households for the principal types of debts. The portion of households with any type of debt decreased by 1.35 percentage points from 63.14% in 1999 to 62.29% in 2002. In the period of concern the highest debt par-ticipation was in home-secured debt.
According to Table 2 there is a noteworthy change from 1999 to 2002, associated with borrowings on residential real estate (other than the primary residence for invest-ment purposes). From 1999 to 2002 there was an increase in the share of households with loans backed by real estate other than their primary residence from 4.96% to 6.37%, an increase of 1.41 percentage points.
Further analysis shows that the increase was much higher among households with relatively high income. Moreover, this specific type of debt accounted for 17.22% of total household debt, an increase of 32% from the figure of 13.04% in 1999. It should be point-ed out that among households renting a dwelling, loans for other residential real estate accounted for 72.94% of total household debt in 2002, up by almost 200% from 24.87% in 1999. All the above show that Cypriot households are shifting from risky investments such as the stock market, as was the case in 1999, towards property investment.
Table 2 Household participation in various debts (in %)a
1999 2002Debts 63.14 62.29Mortgage and home equity 29.95 29.77Loans for investment real estate 4.96 6.37Credit card balances 20.11 20.37Business loans 11.00 9.7Other debt 25.94 24.99
a CySCF1999 vs. CySCF2002.
Sources: Figures based on the CySCF1999 and CySCF2002. Statistics use population weights.
388
Alex Karagrigoriou and Ilia Vonta: On Distributional Changes of Financial Characteristics in Cyprus:What Does the Survey of Consumer Finances Say?Financial Theory and Practice 30 (4), 380-403 (2006)
4 Composition of assets
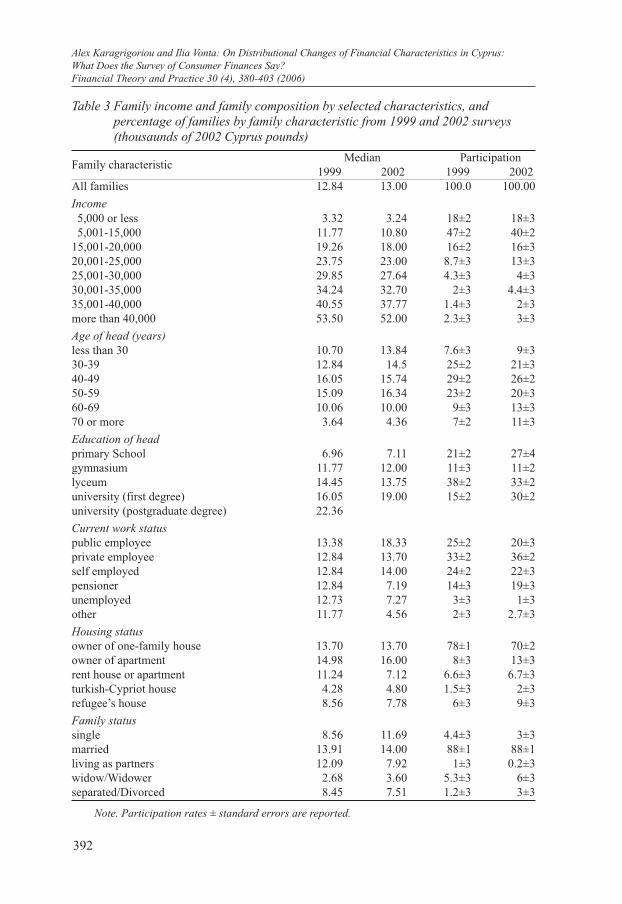
In this section we make a comparison between the range of family income and in-vesting behaviour. Also demographic characteristics were considered. The section is di-vided into three subsections. The first subsection provides the analysis of the composi-tion of before-tax family income among different demographic categories. Two more subsections follow with a detailed analysis of the composition of the financial and non-financial assets (except stocks) and the stock holding behaviour of the households. Table 3 refers to before-tax family income, table 4 to financial and non-financial assets and table 5 to the stockholding attitude of the households. Notice that the tables provide the medians as well as the corresponding participation rates (including the standard errors), namely the percentage of families having a certain family characteristic and at the same time holding the corresponding asset. All values are in 2002 Cyprus pounds (1CY£ = 1,7 Euros). In what follows we give a comparison between the values of 2002 with the cor-responding values of 1999 for the composition of Cyprus households’ assets in 1999.
Households were divided into categories using various family characteristics such as family income, age of the leader of the family, education level, current work status of the head, housing and family status. According to the CySCF, a household consists of an economically dominant single individual or couple, all dependent children (even the adult ones who are living in the household or are studying away from home), and any dependent adult living in the same house (e.g. elderly people, grandparents). The head of the household is defined as the economically dominant individual in the household. The tests used for comparisons are the standard normal and t-tests for the difference be-tween two population means and the difference between two population proportions and the median test for two independent samples (Sheskin, 2000).
4.1 Family Income and Demographic Categories
According to past surveys in 1999 the median value for before-tax family income was 12,840 Cyprus pounds and in 2002 it was slightly increased to the value of 13,000 (considering the inflation between the two periods). In 1999, almost one in two house-holds had income in the range of 5,000 and 15,000 Cyprus pounds (47%) but in 2002 this percentage had been reduced to the level of 40%. Note that this rate decrease is sta-tistically significant (p-value=0.005).
Families in which the head is between 40 and 49 years old have the highest income, the median being 16,050 pounds in 1999 but in 2002 there was a decrease to 15,740 pounds. In 2002, families in which the head is between 50 and 59 years old, had the highest income and the median of this category is 16,340. In the other age-categories the median family income is lower. A statistically significant increase in household in-come between 1999 and 2002 was observed among families in which the head is young-er than 30 (p-value = 0.01) and among families in which the head is between 30 and 39 years old (p-value = 0.07).
Education is positively correlated with family income. Specifically, in 1999 fami-lies in which the head had a postgraduate diploma, had a higher income (median value = 22,363 pounds) than families, in which the education level of the head was primary school (median value = 6,955 pounds). In 2002, similar results were reported. The dif-
389
Alex Karagrigoriou and Ilia Vonta: On Distributional Changes of Financial Characteristics in Cyprus:What Does the Survey of Consumer Finances Say?
Financial Theory and Practice 30 (4), 381-403 (2006)
ference in the household income between these two educational categories is statistical-ly significant for both 1999 and 2002. It should be also noted that the increase reported in the participation rates between 1999 and 2002 for university graduates is statistically significant at the 5% level. The same result holds for the decrease reported in the partic-ipation rates for high school graduates.
Many people in Cyprus believe that being a public employee is one of the best kinds of work due to its steadiness and high pay-scales. Indeed, in 2002, families in which the head was a public employee had an income with a median value of 18,330 pounds which is the highest income among all categories. Note that this was the only work category for which a statistically significant increase in the family income between 1999 and 2002 was observed at the 5% level.
Housing status is another significant family characteristic. The majority of Cyprus households (70%) own the house they live in. A much smaller percentage of households own the apartment in which they live in (13%). Observe that high income is reported among one-family house and apartment owners and that a statistically significant de-crease at the standard 5% level is reported for before-tax income among those renting the place they live in. Furthermore, in 2002 the highest percentage of population, 88%, corresponds to married couples. An observation that characterizes the local culture is the extremely low percentage of couples living together without being married (0.2%) and of separations or divorces (3%). In regard to family status, people who are married had the highest incomes both in 1999 and 2002. The minor increase observed though has been found to be negligible.
4.2 Financial and Non-Financial Assets and Demographic Characteristics
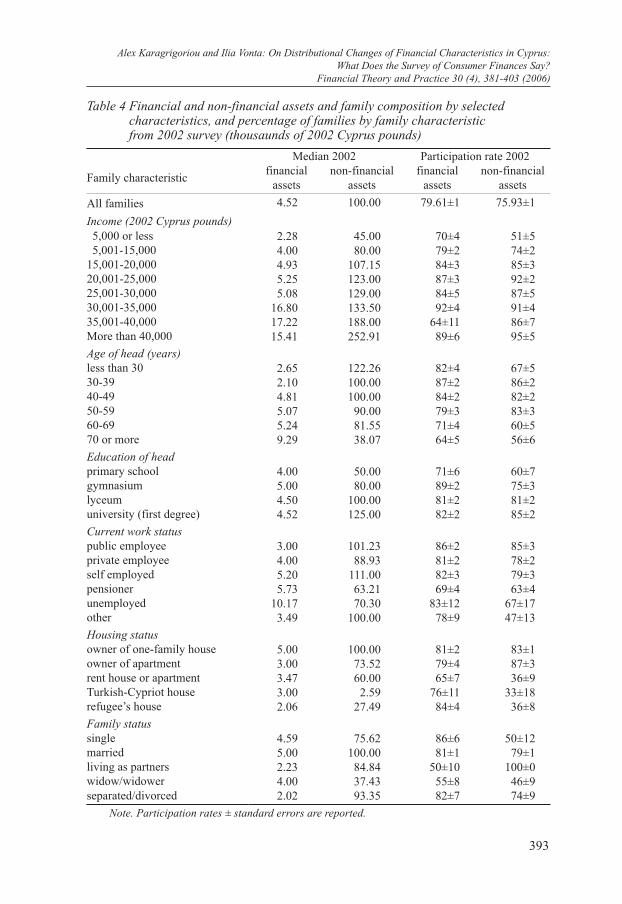
Financial assets, as was mentioned in Section 3, include liquid accounts, different types of bonds, the cash value of life insurance and retirement accounts. Non-financial assets include vehicles, real estate and businesses. It was not feasible to provide com-parisons of financial and non-financial assets between 1999 and 2002 since in 1999 each of the categories was examined separately. All values are reported in Table 4. In Cyprus, where mutual funds are not available, indirect stockholding includes private pension plans and those life insurance policies that invest part of the premium in a risky portfolio and accumulate cash value dependent on risky returns. Finally, risky financial assets include direct and indirect stockholding plus corporate bonds but the stockholding behaviour of the households will be examined separately below.
Eight in ten households have financial assets (80%) with a median value of 4,520 pounds. Households in which the before-tax family income is between 35,001 and 40,000 pounds report the highest financial assets with a median value of 17,220 pounds. In all other categories the financial assets median is lower. Families with an older household head (70 or more years old) report the highest median financial assets at the value of 9,290 pounds. As far as education of head is concerned, there is no considerable difference among categories.
In 2002, families in which the head was unemployed reported financial assets with a median value of 10,170 pounds, which is the highest value of financial assets among all categories of current work status of head. At first sight, this result does not look reason-
390
Alex Karagrigoriou and Ilia Vonta: On Distributional Changes of Financial Characteristics in Cyprus:What Does the Survey of Consumer Finances Say?Financial Theory and Practice 30 (4), 380-403 (2006)
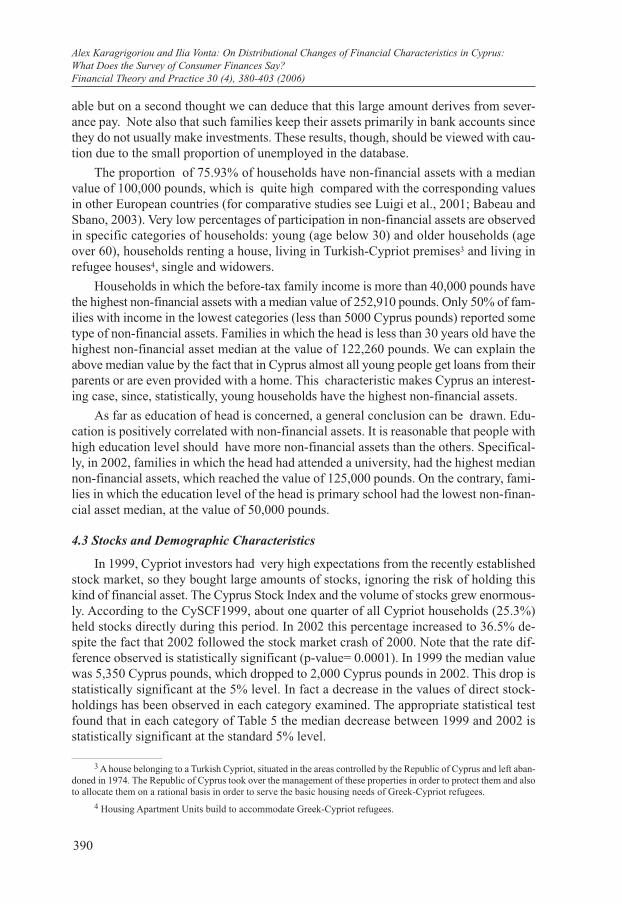
able but on a second thought we can deduce that this large amount derives from sever-ance pay. Note also that such families keep their assets primarily in bank accounts since they do not usually make investments. These results, though, should be viewed with cau-tion due to the small proportion of unemployed in the database.
The proportion of 75.93% of households have non-financial assets with a median value of 100,000 pounds, which is quite high compared with the corresponding values in other European countries (for comparative studies see Luigi et al., 2001; Babeau and Sbano, 2003). Very low percentages of participation in non-financial assets are observed in specific categories of households: young (age below 30) and older households (age over 60), households renting a house, living in Turkish-Cypriot premises3 and living in refugee houses4, single and widowers.
Households in which the before-tax family income is more than 40,000 pounds have the highest non-financial assets with a median value of 252,910 pounds. Only 50% of fam-ilies with income in the lowest categories (less than 5000 Cyprus pounds) reported some type of non-financial assets. Families in which the head is less than 30 years old have the highest non-financial asset median at the value of 122,260 pounds. We can explain the above median value by the fact that in Cyprus almost all young people get loans from their parents or are even provided with a home. This characteristic makes Cyprus an interest-ing case, since, statistically, young households have the highest non-financial assets.
As far as education of head is concerned, a general conclusion can be drawn. Edu-cation is positively correlated with non-financial assets. It is reasonable that people with high education level should have more non-financial assets than the others. Specifical-ly, in 2002, families in which the head had attended a university, had the highest median non-financial assets, which reached the value of 125,000 pounds. On the contrary, fami-lies in which the education level of the head is primary school had the lowest non-finan-cial asset median, at the value of 50,000 pounds.
4.3 Stocks and Demographic Characteristics
In 1999, Cypriot investors had very high expectations from the recently established stock market, so they bought large amounts of stocks, ignoring the risk of holding this kind of financial asset. The Cyprus Stock Index and the volume of stocks grew enormous-ly. According to the CySCF1999, about one quarter of all Cypriot households (25.3%) held stocks directly during this period. In 2002 this percentage increased to 36.5% de-spite the fact that 2002 followed the stock market crash of 2000. Note that the rate dif-ference observed is statistically significant (p-value= 0.0001). In 1999 the median value was 5,350 Cyprus pounds, which dropped to 2,000 Cyprus pounds in 2002. This drop is statistically significant at the 5% level. In fact a decrease in the values of direct stock-holdings has been observed in each category examined. The appropriate statistical test found that in each category of Table 5 the median decrease between 1999 and 2002 is statistically significant at the standard 5% level.
3 A house belonging to a Turkish Cypriot, situated in the areas controlled by the Republic of Cyprus and left aban-doned in 1974. The Republic of Cyprus took over the management of these properties in order to protect them and also to allocate them on a rational basis in order to serve the basic housing needs of Greek-Cypriot refugees.
4 Housing Apartment Units build to accommodate Greek-Cypriot refugees.
391
Alex Karagrigoriou and Ilia Vonta: On Distributional Changes of Financial Characteristics in Cyprus:What Does the Survey of Consumer Finances Say?
Financial Theory and Practice 30 (4), 381-403 (2006)
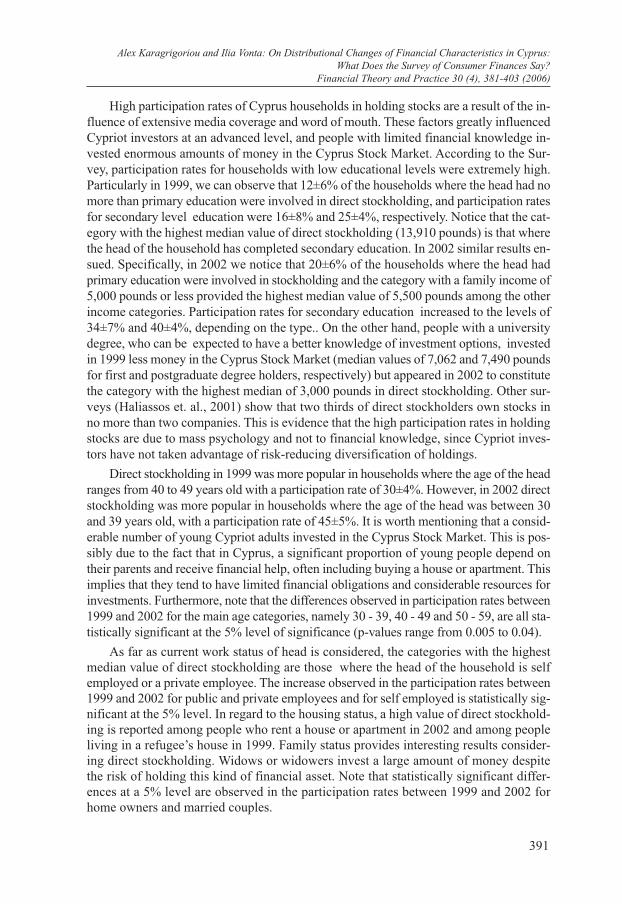
High participation rates of Cyprus households in holding stocks are a result of the in-fluence of extensive media coverage and word of mouth. These factors greatly influenced Cypriot investors at an advanced level, and people with limited financial knowledge in-vested enormous amounts of money in the Cyprus Stock Market. According to the Sur-vey, participation rates for households with low educational levels were extremely high. Particularly in 1999, we can observe that 12±6% of the households where the head had no more than primary education were involved in direct stockholding, and participation rates for secondary level education were 16±8% and 25±4%, respectively. Notice that the cat-egory with the highest median value of direct stockholding (13,910 pounds) is that where the head of the household has completed secondary education. In 2002 similar results en-sued. Specifically, in 2002 we notice that 20±6% of the households where the head had primary education were involved in stockholding and the category with a family income of 5,000 pounds or less provided the highest median value of 5,500 pounds among the other income categories. Participation rates for secondary education increased to the levels of 34±7% and 40±4%, depending on the type.. On the other hand, people with a university degree, who can be expected to have a better knowledge of investment options, invested in 1999 less money in the Cyprus Stock Market (median values of 7,062 and 7,490 pounds for first and postgraduate degree holders, respectively) but appeared in 2002 to constitute the category with the highest median of 3,000 pounds in direct stockholding. Other sur-veys (Haliassos et. al., 2001) show that two thirds of direct stockholders own stocks in no more than two companies. This is evidence that the high participation rates in holding stocks are due to mass psychology and not to financial knowledge, since Cypriot inves-tors have not taken advantage of risk-reducing diversification of holdings.
Direct stockholding in 1999 was more popular in households where the age of the head ranges from 40 to 49 years old with a participation rate of 30±4%. However, in 2002 direct stockholding was more popular in households where the age of the head was between 30 and 39 years old, with a participation rate of 45±5%. It is worth mentioning that a consid-erable number of young Cypriot adults invested in the Cyprus Stock Market. This is pos-sibly due to the fact that in Cyprus, a significant proportion of young people depend on their parents and receive financial help, often including buying a house or apartment. This implies that they tend to have limited financial obligations and considerable resources for investments. Furthermore, note that the differences observed in participation rates between 1999 and 2002 for the main age categories, namely 30 - 39, 40 - 49 and 50 - 59, are all sta-tistically significant at the 5% level of significance (p-values range from 0.005 to 0.04).
As far as current work status of head is considered, the categories with the highest median value of direct stockholding are those where the head of the household is self employed or a private employee. The increase observed in the participation rates between 1999 and 2002 for public and private employees and for self employed is statistically sig-nificant at the 5% level. In regard to the housing status, a high value of direct stockhold-ing is reported among people who rent a house or apartment in 2002 and among people living in a refugee’s house in 1999. Family status provides interesting results consider-ing direct stockholding. Widows or widowers invest a large amount of money despite the risk of holding this kind of financial asset. Note that statistically significant differ-ences at a 5% level are observed in the participation rates between 1999 and 2002 for home owners and married couples.
392
Alex Karagrigoriou and Ilia Vonta: On Distributional Changes of Financial Characteristics in Cyprus:What Does the Survey of Consumer Finances Say?Financial Theory and Practice 30 (4), 380-403 (2006)
Table 3 Family income and family composition by selected characteristics, and percentage of families by family characteristic from 1999 and 2002 surveys(thousaunds of 2002 Cyprus pounds)
Family characteristic Median 1999 2002
Participation 1999 2002
All families 12.84 13.00 100.0 100.00
Income5,000 or less 3.32 3.24 18±2 18±35,001-15,000 11.77 10.80 47±2 40±2
15,001-20,000 19.26 18.00 16±2 16±320,001-25,000 23.75 23.00 8.7±3 13±325,001-30,000 29.85 27.64 4.3±3 4±330,001-35,000 34.24 32.70 2±3 4.4±335,001-40,000 40.55 37.77 1.4±3 2±3more than 40,000 53.50 52.00 2.3±3 3±3
Age of head (years) less than 30 10.70 13.84 7.6±3 9±330-39 12.84 14.5 25±2 21±340-49 16.05 15.74 29±2 26±250-59 15.09 16.34 23±2 20±360-69 10.06 10.00 9±3 13±370 or more 3.64 4.36 7±2 11±3
Education of head primary School 6.96 7.11 21±2 27±4gymnasium 11.77 12.00 11±3 11±2lyceum 14.45 13.75 38±2 33±2university (first degree) 16.05 19.00 15±2 30±2university (postgraduate degree) 22.36
Current work status public employee 13.38 18.33 25±2 20±3private employee 12.84 13.70 33±2 36±2self employed 12.84 14.00 24±2 22±3pensioner 12.84 7.19 14±3 19±3unemployed 12.73 7.27 3±3 1±3other 11.77 4.56 2±3 2.7±3
Housing status owner of one-family house 13.70 13.70 78±1 70±2owner of apartment 14.98 16.00 8±3 13±3rent house or apartment 11.24 7.12 6.6±3 6.7±3turkish-Cypriot house 4.28 4.80 1.5±3 2±3refugee’s house 8.56 7.78 6±3 9±3
Family status single 8.56 11.69 4.4±3 3±3married 13.91 14.00 88±1 88±1living as partners 12.09 7.92 1±3 0.2±3widow/Widower 2.68 3.60 5.3±3 6±3separated/Divorced 8.45 7.51 1.2±3 3±3
Note. Participation rates ± standard errors are reported.
393
Alex Karagrigoriou and Ilia Vonta: On Distributional Changes of Financial Characteristics in Cyprus:What Does the Survey of Consumer Finances Say?
Financial Theory and Practice 30 (4), 381-403 (2006)
Table 4 Financial and non-financial assets and family composition by selected characteristics, and percentage of families by family characteristicfrom 2002 survey (thousaunds of 2002 Cyprus pounds)
Median 2002 Participation rate 2002
Family characteristicfinancial
assetsnon-financial
assetsfinancial
assetsnon-financial
assets
All families 4.52 100.00 79.61±1 75.93±1
Income (2002 Cyprus pounds)5,000 or less 2.28 45.00 70±4 51±55,001-15,000 4.00 80.00 79±2 74±2
15,001-20,000 4.93 107.15 84±3 85±320,001-25,000 5.25 123.00 87±3 92±225,001-30,000 5.08 129.00 84±5 87±530,001-35,000 16.80 133.50 92±4 91±435,001-40,000 17.22 188.00 64±11 86±7More than 40,000 15.41 252.91 89±6 95±5
Age of head (years)less than 30 2.65 122.26 82±4 67±530-39 2.10 100.00 87±2 86±240-49 4.81 100.00 84±2 82±250-59 5.07 90.00 79±3 83±360-69 5.24 81.55 71±4 60±570 or more 9.29 38.07 64±5 56±6
Education of headprimary school 4.00 50.00 71±6 60±7gymnasium 5.00 80.00 89±2 75±3lyceum 4.50 100.00 81±2 81±2university (first degree) 4.52 125.00 82±2 85±2
Current work status public employee 3.00 101.23 86±2 85±3private employee 4.00 88.93 81±2 78±2self employed 5.20 111.00 82±3 79±3pensioner 5.73 63.21 69±4 63±4unemployed 10.17 70.30 83±12 67±17other 3.49 100.00 78±9 47±13
Housing statusowner of one-family house 5.00 100.00 81±2 83±1owner of apartment 3.00 73.52 79±4 87±3rent house or apartment 3.47 60.00 65±7 36±9Turkish-Cypriot house 3.00 2.59 76±11 33±18refugee’s house 2.06 27.49 84±4 36±8
Family statussingle 4.59 75.62 86±6 50±12married 5.00 100.00 81±1 79±1living as partners 2.23 84.84 50±10 100±0widow/widower 4.00 37.43 55±8 46±9separated/divorced 2.02 93.35 82±7 74±9
Note. Participation rates ± standard errors are reported.
394
Alex Karagrigoriou and Ilia Vonta: On Distributional Changes of Financial Characteristics in Cyprus:What Does the Survey of Consumer Finances Say?Financial Theory and Practice 30 (4), 380-403 (2006)
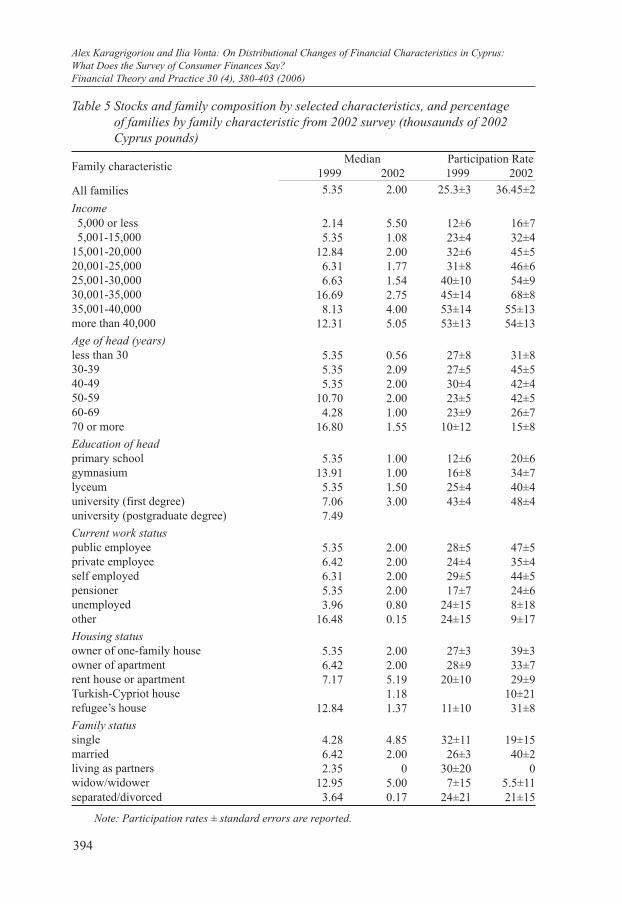
Table 5 Stocks and family composition by selected characteristics, and percentageof families by family characteristic from 2002 survey (thousaunds of 2002 Cyprus pounds)
Family characteristic Median 1999 2002
Participation Rate 1999 2002
All families 5.35 2.00 25.3±3 36.45±2
Income5,000 or less 2.14 5.50 12±6 16±75,001-15,000 5.35 1.08 23±4 32±4
15,001-20,000 12.84 2.00 32±6 45±520,001-25,000 6.31 1.77 31±8 46±625,001-30,000 6.63 1.54 40±10 54±930,001-35,000 16.69 2.75 45±14 68±835,001-40,000 8.13 4.00 53±14 55±13more than 40,000 12.31 5.05 53±13 54±13
Age of head (years)less than 30 5.35 0.56 27±8 31±830-39 5.35 2.09 27±5 45±540-49 5.35 2.00 30±4 42±450-59 10.70 2.00 23±5 42±560-69 4.28 1.00 23±9 26±770 or more 16.80 1.55 10±12 15±8
Education of headprimary school 5.35 1.00 12±6 20±6gymnasium 13.91 1.00 16±8 34±7lyceum 5.35 1.50 25±4 40±4university (first degree) 7.06 3.00 43±4 48±4university (postgraduate degree) 7.49
Current work status public employee 5.35 2.00 28±5 47±5private employee 6.42 2.00 24±4 35±4self employed 6.31 2.00 29±5 44±5pensioner 5.35 2.00 17±7 24±6unemployed 3.96 0.80 24±15 8±18other 16.48 0.15 24±15 9±17
Housing statusowner of one-family house 5.35 2.00 27±3 39±3owner of apartment 6.42 2.00 28±9 33±7rent house or apartment 7.17 5.19 20±10 29±9Turkish-Cypriot house 1.18 10±21refugee’s house 12.84 1.37 11±10 31±8
Family statussingle 4.28 4.85 32±11 19±15married 6.42 2.00 26±3 40±2living as partners 2.35 0 30±20 0widow/widower 12.95 5.00 7±15 5.5±11separated/divorced 3.64 0.17 24±21 21±15
Note: Participation rates ± standard errors are reported.
395
Alex Karagrigoriou and Ilia Vonta: On Distributional Changes of Financial Characteristics in Cyprus:What Does the Survey of Consumer Finances Say?
Financial Theory and Practice 30 (4), 381-403 (2006)
5 Demographic shifts in wealth
The main focus of this section is a graphical decomposition of the net wealth distri-bution and the changes observed from 1999 to 2002. Net wealth is defined as the sum of all household assets minus all of its debts. Empirical distributions of overall changes in wealth are often complicated, and the varieties of distributional moments used to de-scribe univariate distributions can fall far short of being adequately descriptive. Com-parisons between two distributions compound such problems. Sometimes a graphical approach provides more information. The wealth measure used throughout this paper is a broad net wealth concept. Assets include all financial assets, pension accounts from which withdrawals can be made or against which loans may be taken, real estate, busi-nesses, vehicles, and other mixed assorted assets. Debts are taken to include all types of loans from financial institutions, other institutions, and individuals, as well as loans against pension accounts.
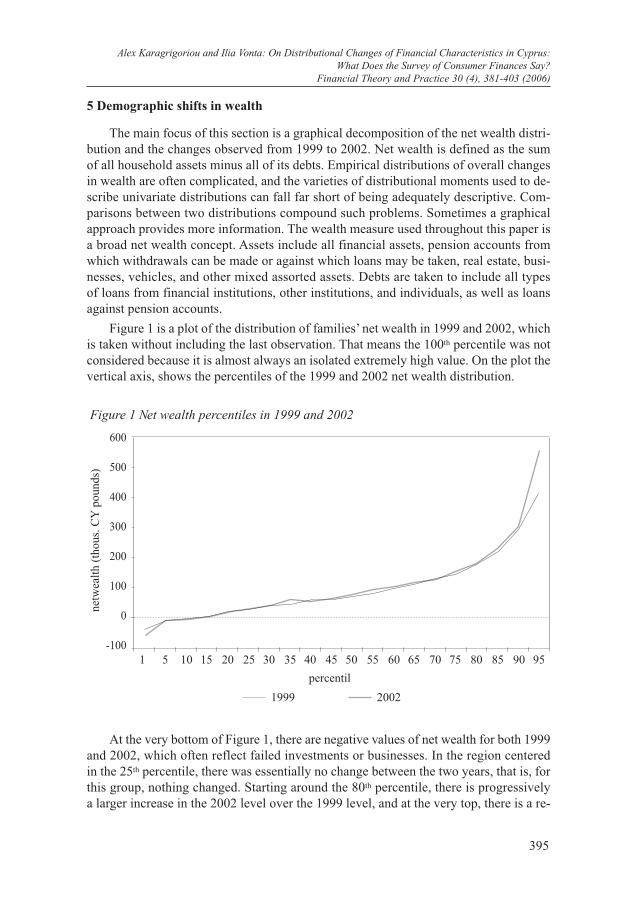
Figure 1 is a plot of the distribution of families’ net wealth in 1999 and 2002, which is taken without including the last observation. That means the 100th percentile was not considered because it is almost always an isolated extremely high value. On the plot the vertical axis, shows the percentiles of the 1999 and 2002 net wealth distribution.
Figure 1 Net wealth percentiles in 1999 and 2002
600
500
400
300
200
100
0
-100 1 5 10 15 20 25 30 35 40 45 50 55 60 65 70 75 80 85 90 95
percentil
20021999
netw
ealt
h (t
hous
. CY
pou
nds)
At the very bottom of Figure 1, there are negative values of net wealth for both 1999 and 2002, which often reflect failed investments or businesses. In the region centered in the 25th percentile, there was essentially no change between the two years, that is, for this group, nothing changed. Starting around the 80th percentile, there is progressively a larger increase in the 2002 level over the 1999 level, and at the very top, there is a re-
396
Alex Karagrigoriou and Ilia Vonta: On Distributional Changes of Financial Characteristics in Cyprus:What Does the Survey of Consumer Finances Say?Financial Theory and Practice 30 (4), 380-403 (2006)
markable leap in absolute value. The growth at the top appears to have been fuelled in part by increases in the values of stocks and closely-held businesses, assets that are high-ly concentrated at the top of the wealth distribution.
These results suggest that there may have been a shift of wealth towards the upper end of the distribution. The proper statistical test shows that there is evidence for such a suggestion since this shift was found to be statistically significant (p-value = 0.06). We should emphasize the fact that the data used here are cross-sectional. Thus, the compari-sons are of distributions, not of individuals. Individuals may have moved from one region of the distribution to another as a result of changes in household composition, returns on assets, or saving. See Kennickell (2002) for a review of SCF (United States Survey of Consumer Finances) evidence for the wealth mobility of individual families.
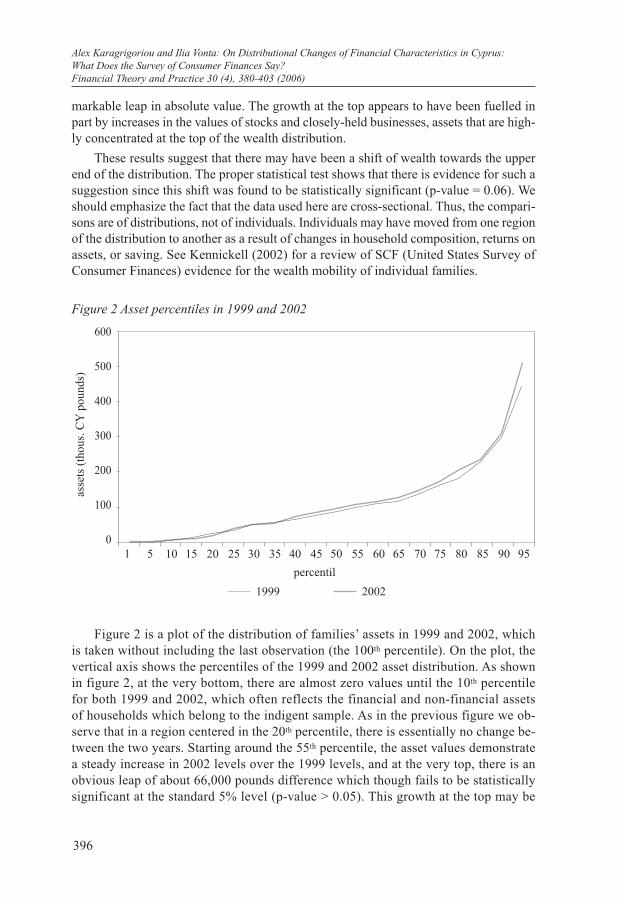
Figure 2 Asset percentiles in 1999 and 2002
600
500
400
300
200
100
0 1 5 10 15 20 25 30 35 40 45 50 55 60 65 70 75 80 85 90 95
percentil
20021999
asse
ts (
thou
s. C
Y p
ound
s)
Figure 2 is a plot of the distribution of families’ assets in 1999 and 2002, which is taken without including the last observation (the 100th percentile). On the plot, the vertical axis shows the percentiles of the 1999 and 2002 asset distribution. As shown in figure 2, at the very bottom, there are almost zero values until the 10th percentile for both 1999 and 2002, which often reflects the financial and non-financial assets of households which belong to the indigent sample. As in the previous figure we ob-serve that in a region centered in the 20th percentile, there is essentially no change be-tween the two years. Starting around the 55th percentile, the asset values demonstrate a steady increase in 2002 levels over the 1999 levels, and at the very top, there is an obvious leap of about 66,000 pounds difference which though fails to be statistically significant at the standard 5% level (p-value > 0.05). This growth at the top may be
397
Alex Karagrigoriou and Ilia Vonta: On Distributional Changes of Financial Characteristics in Cyprus:What Does the Survey of Consumer Finances Say?
Financial Theory and Practice 30 (4), 381-403 (2006)
related to the fact that prices of residences were overvalued during the period of con-cern and moreover, there was an increase in the values of stocks and closely-held busi-nesses. There is also a noticeable decrease in the lower tail of the distribution (below the 15th percentile).
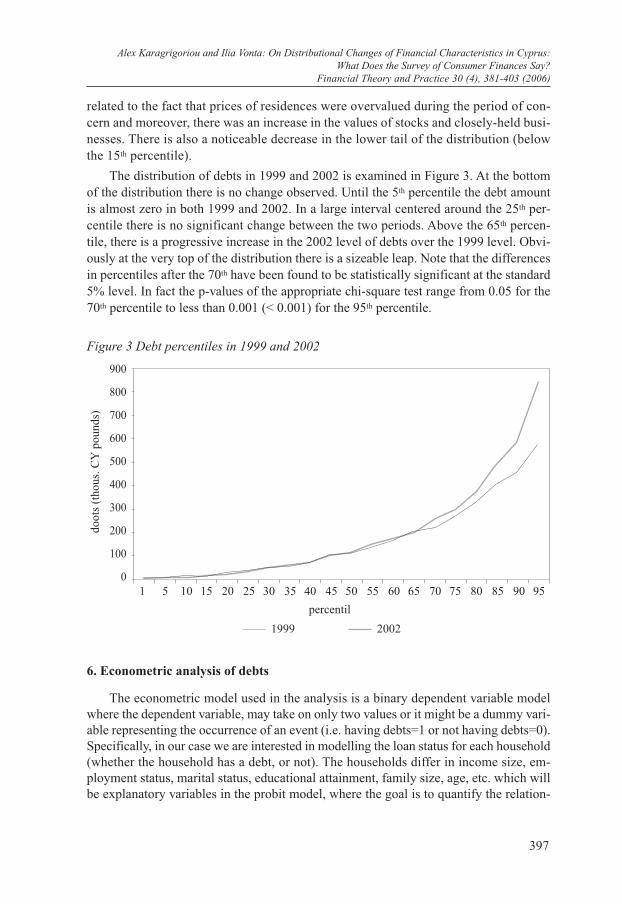
The distribution of debts in 1999 and 2002 is examined in Figure 3. At the bottom of the distribution there is no change observed. Until the 5th percentile the debt amount is almost zero in both 1999 and 2002. In a large interval centered around the 25th per-centile there is no significant change between the two periods. Above the 65th percen-tile, there is a progressive increase in the 2002 level of debts over the 1999 level. Obvi-ously at the very top of the distribution there is a sizeable leap. Note that the differences in percentiles after the 70th have been found to be statistically significant at the standard 5% level. In fact the p-values of the appropriate chi-square test range from 0.05 for the 70th percentile to less than 0.001 (< 0.001) for the 95th percentile.
Figure 3 Debt percentiles in 1999 and 2002
900
800
700
600
500
400
300
200
100
0 1 5 10 15 20 25 30 35 40 45 50 55 60 65 70 75 80 85 90 95
percentil
20021999
doot
s (t
hous
. CY
pou
nds)
6. Econometric analysis of debts
The econometric model used in the analysis is a binary dependent variable model where the dependent variable, may take on only two values or it might be a dummy vari-able representing the occurrence of an event (i.e. having debts=1 or not having debts=0). Specifically, in our case we are interested in modelling the loan status for each household (whether the household has a debt, or not). The households differ in income size, em-ployment status, marital status, educational attainment, family size, age, etc. which will be explanatory variables in the probit model, where the goal is to quantify the relation-
398
Alex Karagrigoriou and Ilia Vonta: On Distributional Changes of Financial Characteristics in Cyprus:What Does the Survey of Consumer Finances Say?Financial Theory and Practice 30 (4), 380-403 (2006)
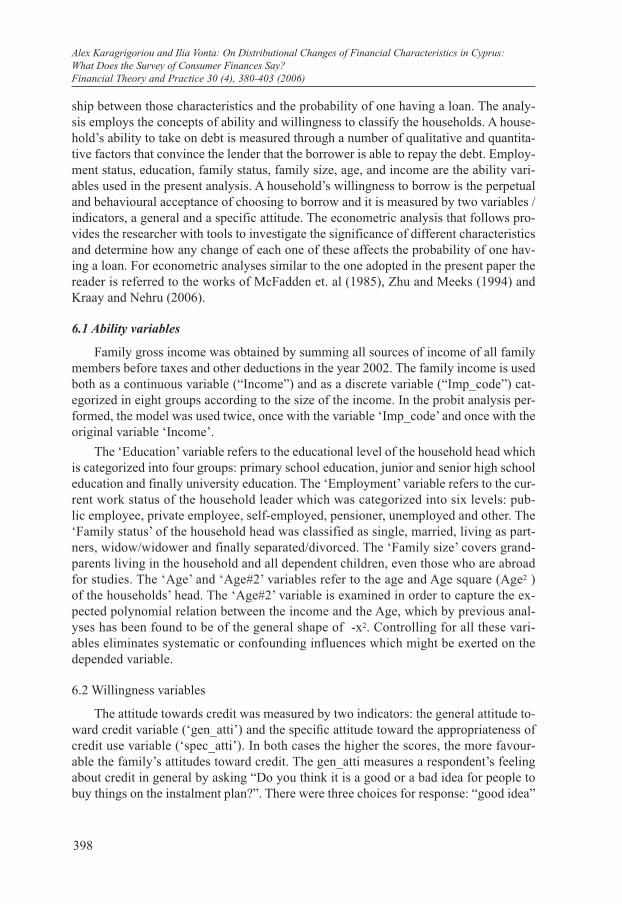
ship between those characteristics and the probability of one having a loan. The analy-sis employs the concepts of ability and willingness to classify the households. A house-hold’s ability to take on debt is measured through a number of qualitative and quantita-tive factors that convince the lender that the borrower is able to repay the debt. Employ-ment status, education, family status, family size, age, and income are the ability vari-ables used in the present analysis. A household’s willingness to borrow is the perpetual and behavioural acceptance of choosing to borrow and it is measured by two variables / indicators, a general and a specific attitude. The econometric analysis that follows pro-vides the researcher with tools to investigate the significance of different characteristics and determine how any change of each one of these affects the probability of one hav-ing a loan. For econometric analyses similar to the one adopted in the present paper the reader is referred to the works of McFadden et. al (1985), Zhu and Meeks (1994) and Kraay and Nehru (2006).
6.1 Ability variables
Family gross income was obtained by summing all sources of income of all family members before taxes and other deductions in the year 2002. The family income is used both as a continuous variable (“Income”) and as a discrete variable (“Imp_code”) cat-egorized in eight groups according to the size of the income. In the probit analysis per-formed, the model was used twice, once with the variable ‘Imp_code’ and once with the original variable ‘Income’.
The ‘Education’ variable refers to the educational level of the household head which is categorized into four groups: primary school education, junior and senior high school education and finally university education. The ‘Employment’ variable refers to the cur-rent work status of the household leader which was categorized into six levels: pub-lic employee, private employee, self-employed, pensioner, unemployed and other. The ‘Family status’ of the household head was classified as single, married, living as part-ners, widow/widower and finally separated/divorced. The ‘Family size’ covers grand-parents living in the household and all dependent children, even those who are abroad for studies. The ‘Age’ and ‘Age#2’ variables refer to the age and Age square (Age2 ) of the households’ head. The ‘Age#2’ variable is examined in order to capture the ex-pected polynomial relation between the income and the Age, which by previous anal-yses has been found to be of the general shape of -x2. Controlling for all these vari-ables eliminates systematic or confounding influences which might be exerted on the depended variable.
6.2 Willingness variables
The attitude towards credit was measured by two indicators: the general attitude to-ward credit variable (‘gen_atti’) and the specific attitude toward the appropriateness of credit use variable (‘spec_atti’). In both cases the higher the scores, the more favour-able the family’s attitudes toward credit. The gen_atti measures a respondent’s feeling about credit in general by asking “Do you think it is a good or a bad idea for people to buy things on the instalment plan?”. There were three choices for response: “good idea”
399
Alex Karagrigoriou and Ilia Vonta: On Distributional Changes of Financial Characteristics in Cyprus:What Does the Survey of Consumer Finances Say?
Financial Theory and Practice 30 (4), 381-403 (2006)
as the most supportive choice, “bad idea” as the least favourable choice, and “good in some ways, bad in others” as an in-between choice.
The spec_atti was constructed from a five-item index of different reasons for borrow-ing money. Respondents were asked: “Tell me if it is all right for someone like yourself to borrow money to: (1) cover the expenses of a vacation trip; (2) cover living expenses when income is cut; (3) finance the purchase of a fur coat or jewellery; (4) finance the purchase of a car; (5) finance educational expenses”. Each of the ‘yes’ responses was given one point and the points were summed up to give a specific attitude index from zero to five. A score of zero indicates that none of the items were viewed as appropriate choices for credit usage.
6.3 Results from the econometric analysis
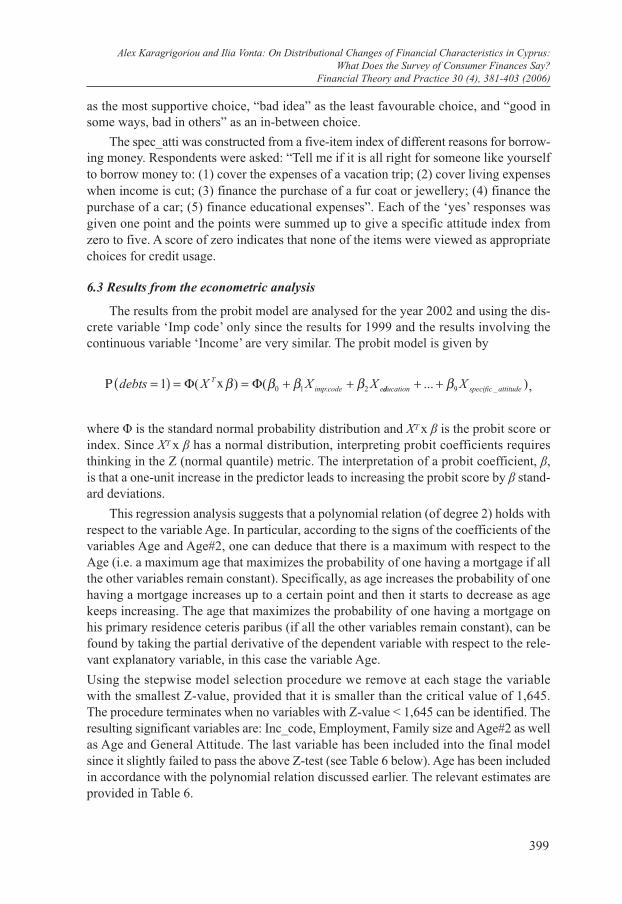
The results from the probit model are analysed for the year 2002 and using the dis-crete variable ‘Imp code’ only since the results for 1999 and the results involving the continuous variable ‘Income’ are very similar. The probit model is given by
,
where Φ is the standard normal probability distribution and XT x β is the probit score or index. Since XT x β has a normal distribution, interpreting probit coefficients requires thinking in the Z (normal quantile) metric. The interpretation of a probit coefficient, β, is that a one-unit increase in the predictor leads to increasing the probit score by β stand-ard deviations.
This regression analysis suggests that a polynomial relation (of degree 2) holds with respect to the variable Age. In particular, according to the signs of the coefficients of the variables Age and Age#2, one can deduce that there is a maximum with respect to the Age (i.e. a maximum age that maximizes the probability of one having a mortgage if all the other variables remain constant). Specifically, as age increases the probability of one having a mortgage increases up to a certain point and then it starts to decrease as age keeps increasing. The age that maximizes the probability of one having a mortgage on his primary residence ceteris paribus (if all the other variables remain constant), can be found by taking the partial derivative of the dependent variable with respect to the rele-vant explanatory variable, in this case the variable Age.
Using the stepwise model selection procedure we remove at each stage the variable with the smallest Z-value, provided that it is smaller than the critical value of 1,645. The procedure terminates when no variables with Z-value < 1,645 can be identified. The resulting significant variables are: Inc_code, Employment, Family size and Age#2 as well as Age and General Attitude. The last variable has been included into the final model since it slightly failed to pass the above Z-test (see Table 6 below). Age has been included in accordance with the polynomial relation discussed earlier. The relevant estimates are provided in Table 6.
400
Alex Karagrigoriou and Ilia Vonta: On Distributional Changes of Financial Characteristics in Cyprus:What Does the Survey of Consumer Finances Say?Financial Theory and Practice 30 (4), 380-403 (2006)
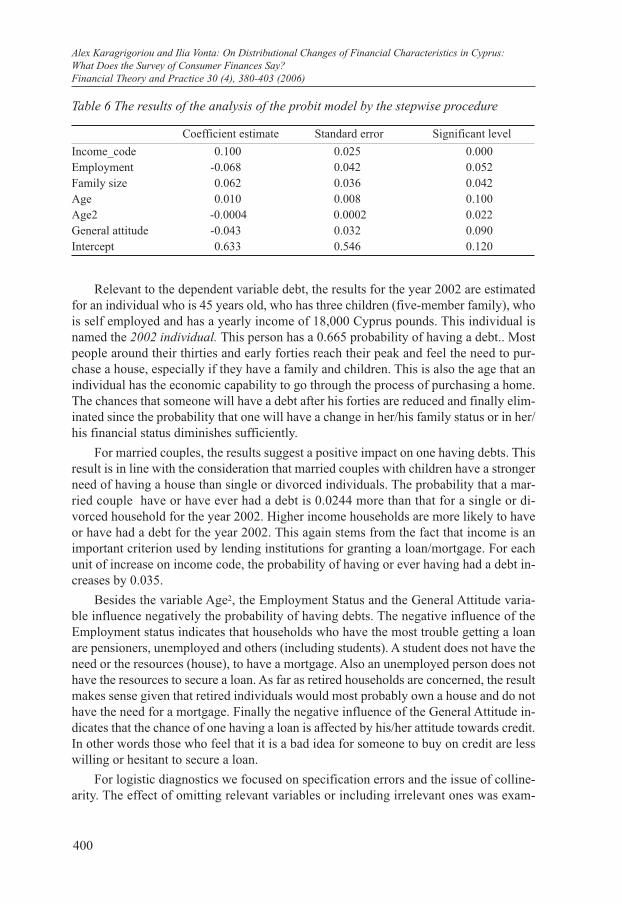
Table 6 The results of the analysis of the probit model by the stepwise procedure
Coefficient estimate Standard error Significant level
Income_code 0.100 0.025 0.000Employment -0.068 0.042 0.052Family size 0.062 0.036 0.042Age 0.010 0.008 0.100Age2 -0.0004 0.0002 0.022General attitude -0.043 0.032 0.090Intercept 0.633 0.546 0.120
Relevant to the dependent variable debt, the results for the year 2002 are estimated for an individual who is 45 years old, who has three children (five-member family), who is self employed and has a yearly income of 18,000 Cyprus pounds. This individual is named the 2002 individual. This person has a 0.665 probability of having a debt.. Most people around their thirties and early forties reach their peak and feel the need to pur-chase a house, especially if they have a family and children. This is also the age that an individual has the economic capability to go through the process of purchasing a home. The chances that someone will have a debt after his forties are reduced and finally elim-inated since the probability that one will have a change in her/his family status or in her/his financial status diminishes sufficiently.
For married couples, the results suggest a positive impact on one having debts. This result is in line with the consideration that married couples with children have a stronger need of having a house than single or divorced individuals. The probability that a mar-ried couple have or have ever had a debt is 0.0244 more than that for a single or di-vorced household for the year 2002. Higher income households are more likely to have or have had a debt for the year 2002. This again stems from the fact that income is an important criterion used by lending institutions for granting a loan/mortgage. For each unit of increase on income code, the probability of having or ever having had a debt in-creases by 0.035.
Besides the variable Age2, the Employment Status and the General Attitude varia-ble influence negatively the probability of having debts. The negative influence of the Employment status indicates that households who have the most trouble getting a loan are pensioners, unemployed and others (including students). A student does not have the need or the resources (house), to have a mortgage. Also an unemployed person does not have the resources to secure a loan. As far as retired households are concerned, the result makes sense given that retired individuals would most probably own a house and do not have the need for a mortgage. Finally the negative influence of the General Attitude in-dicates that the chance of one having a loan is affected by his/her attitude towards credit. In other words those who feel that it is a bad idea for someone to buy on credit are less willing or hesitant to secure a loan.
For logistic diagnostics we focused on specification errors and the issue of colline-arity. The effect of omitting relevant variables or including irrelevant ones was exam-
401
Alex Karagrigoriou and Ilia Vonta: On Distributional Changes of Financial Characteristics in Cyprus:What Does the Survey of Consumer Finances Say?
Financial Theory and Practice 30 (4), 381-403 (2006)
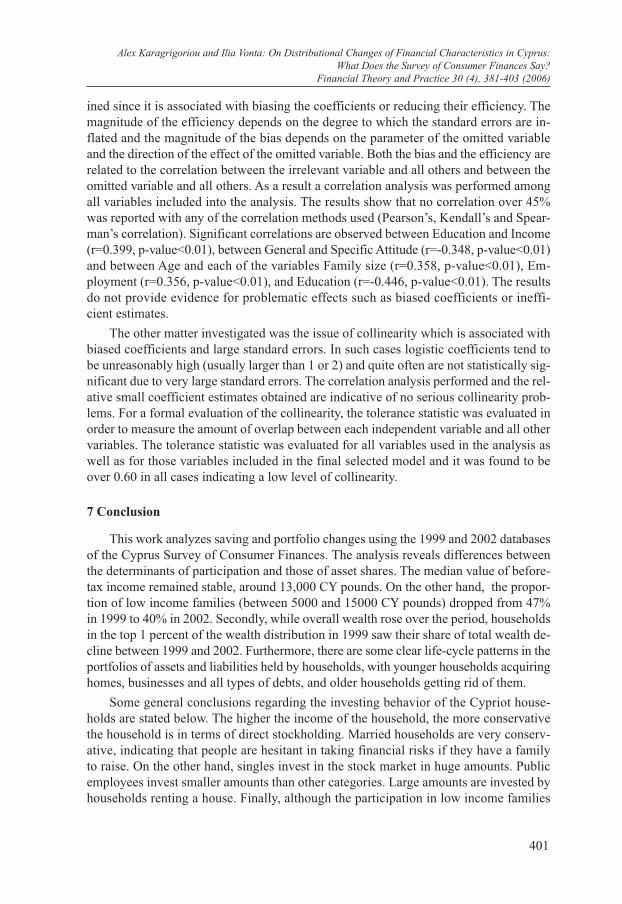
ined since it is associated with biasing the coefficients or reducing their efficiency. The magnitude of the efficiency depends on the degree to which the standard errors are in-flated and the magnitude of the bias depends on the parameter of the omitted variable and the direction of the effect of the omitted variable. Both the bias and the efficiency are related to the correlation between the irrelevant variable and all others and between the omitted variable and all others. As a result a correlation analysis was performed among all variables included into the analysis. The results show that no correlation over 45% was reported with any of the correlation methods used (Pearson’s, Kendall’s and Spear-man’s correlation). Significant correlations are observed between Education and Income (r=0.399, p-value<0.01), between General and Specific Attitude (r=-0.348, p-value<0.01) and between Age and each of the variables Family size (r=0.358, p-value<0.01), Em-ployment (r=0.356, p-value<0.01), and Education (r=-0.446, p-value<0.01). The results do not provide evidence for problematic effects such as biased coefficients or ineffi-cient estimates.
The other matter investigated was the issue of collinearity which is associated with biased coefficients and large standard errors. In such cases logistic coefficients tend to be unreasonably high (usually larger than 1 or 2) and quite often are not statistically sig-nificant due to very large standard errors. The correlation analysis performed and the rel-ative small coefficient estimates obtained are indicative of no serious collinearity prob-lems. For a formal evaluation of the collinearity, the tolerance statistic was evaluated in order to measure the amount of overlap between each independent variable and all other variables. The tolerance statistic was evaluated for all variables used in the analysis as well as for those variables included in the final selected model and it was found to be over 0.60 in all cases indicating a low level of collinearity.
7 Conclusion
This work analyzes saving and portfolio changes using the 1999 and 2002 databases of the Cyprus Survey of Consumer Finances. The analysis reveals differences between the determinants of participation and those of asset shares. The median value of before-tax income remained stable, around 13,000 CY pounds. On the other hand, the propor-tion of low income families (between 5000 and 15000 CY pounds) dropped from 47% in 1999 to 40% in 2002. Secondly, while overall wealth rose over the period, households in the top 1 percent of the wealth distribution in 1999 saw their share of total wealth de-cline between 1999 and 2002. Furthermore, there are some clear life-cycle patterns in the portfolios of assets and liabilities held by households, with younger households acquiring homes, businesses and all types of debts, and older households getting rid of them.
Some general conclusions regarding the investing behavior of the Cypriot house-holds are stated below. The higher the income of the household, the more conservative the household is in terms of direct stockholding. Married households are very conserv-ative, indicating that people are hesitant in taking financial risks if they have a family to raise. On the other hand, singles invest in the stock market in huge amounts. Public employees invest smaller amounts than other categories. Large amounts are invested by households renting a house. Finally, although the participation in low income families
402
Alex Karagrigoriou and Ilia Vonta: On Distributional Changes of Financial Characteristics in Cyprus:What Does the Survey of Consumer Finances Say?Financial Theory and Practice 30 (4), 380-403 (2006)
in 2002 is very limited (16%) the amounts invested are the highest observed. Regarding the modelling of the debt status for each household (whether the household has a debt, or not)., the stepwise procedure used resulted in a probit polynomial model of degree 2 with respect to the age with 3 more variables, namely the income category, the employ-ment status, and the family size.
One of the policy implications of the results presented in this work is that portfolios differ considerably across the income or the wealth distribution. As a result changes or simply variations in the key asset prices like the interest rates or the prices in the stock market may result in different implications on families of different types. Furthermore, although age is often considered the main factor in portfolio choices, other characteris-tics like employment status or family size or even behavioural characteristics may play their own roles in asset markets.
REFERENCES
Antoniou, G. [et al.], 2004. “Assets and debts of Cyprus households: Changes be-tween the 1999 and 2002 Cyprus Surveys of Consumer Finances”. Working Paper Se-ries, No. 04-24. Lefkosa: University of Cyprus, Hermes Center of Excellence on Com-putational Finance and Ceonomics.
Aizcorbe, A. M., Kennickell, A. B. and Moore, K. B., 2003. “Recent changes in U.S. family finances: Evidence from the 1998 and 2001 survey of consumer finances” [online]. Federal Reserve Bulletin, 1-32. Available from: [http://www.federalreserve.gov/pubs/bulletin/2003/0103lead.pdf].
Babeau, A. and Sbano, T., 2003. “Household wealth in the national accounts of Europe, the United States and Japan”. OECD Statistics Working Papers, No. 2. Paris: OECD Publishing.
Guiso, L., Haliassos, M. and Jappelli, T., 2001. Household Portfolios. Cambridge, MA: MIT Press.
Haliassos, M. [et al.], 2001. “Assets of Cyprus households: Lessons from the first Cyprus survey of consumer finances”. Working Paper, No. 01-22. Lefkosa: University of Cyprus, Hermes Center of Excellence on Computational Finance and Economics.
Karagrigoriou, A., 2005. The Survey of Consumer Finances: Sampling and survey-ing in Cyprus, Luxembourg Wealth Study. Rome: Banca d’ Italia.
Kennickell, A., 2002. “Demographic shifts in the distribution of wealth, 1992 to 1998: Evidence from the Survey of Consumer Finances”. Conference of the Internation-al Association for Research in Income and Wealth, Sweden.
Kraay, A. and Nehru, V., 2006. “When is external debt sustainable?”. The World Bank Economic Review, 20 (3), 341-365.
Kourouyiannis, K., 2005. The composition of Cyprus Household assets: Results from the Cyprus Survey of Consumer Finances (CySCF1999). Diploma Thesis. Lefko-sa: University of Cyprus, Dept. of Mathematics and Statistics.

403
Alex Karagrigoriou and Ilia Vonta: On Distributional Changes of Financial Characteristics in Cyprus:What Does the Survey of Consumer Finances Say?
Financial Theory and Practice 30 (4), 381-403 (2006)
McFadden, D. [et al.], 1985. “Is there life after debt? An ecomonetric analysis of the creditworthiness of developing countries” in G. Smith and J. Cuddington, eds. Inter-national Debt and the Developing Countries. Washington DC: The World Bank.
Sheskin, D. J., 2000. Handbook of parametric and nonparametric statistical proce-dures. Boca Raton: Chapman & Hall/CRC.
Zhu, L. Y. and Meeks, C. B., 1994. “Effects of low income families’ ability and willingness to use consumer credit on subsequent outstanding credit balances”. The J. of Consumer Affairs, 28 (2), 403-422.