Embed Size (px)
Citation preview

OMSAN LOJİSTİK

Fundamentals and Terminology of Inventory Planning and
ManagementInventory Planning and
Management
Latin America Logistics Center
Logistics Management Series -

Introduction
• Inventory, Logistics, and Business
• Best Practices in Inventory Planning and Management
• Fundamentals of Inventory Planning and Management

Logistics and Inventory
Customer Service
Inventory
SupplyTransportation
Warehousing

Logistics Master Plan
WAREHOUSING
LOGISTICS
CUSTOMER
RESPONSE
INVE
NTO
RYM
AN
AG
EMEN
T
MANUFACTURING &PROCUREMENT
TRA
NSP
OR
TATI
ON
Customer Service

Inventory Master Plan
Fill RateForecastingEOQReplenishmentPositioning
Inventory

Inventory Management Dilemmas
What should it be the Fill Rate?
What is the optimum Inventory Turnover?

Inventory Management Dilemmas
• The highest Fill Rate that satisfies ROA ?
• The level of Fill Rate that Customer want?
• The optimum between inventory carrying costs and cost of lost sales?
• The right combination between optimums and industry benckmarks?

Inventory Management Performance Gaps
Order Quantities
Location
Information Systems
Organization
Key Performance Indicators
Forecasting
Fill Rate
Control Policy
0
1
2
3
4
5Company A
Best Practice

Inventory Management
Inventory is an Inventory is an ASSETASSET to:to:
* Hide Forecasting errors* Hide Forecasting errors
* Hide Planning errors* Hide Planning errors
* Hide Registry errors* Hide Registry errors
* Hide Quality faults* Hide Quality faults
* Allow optimum production batches* Allow optimum production batches
* Keep high customer service* Keep high customer service

The Value Chain

Key Questions
* WHEN TO ORDER?
* HOW MUCH EACH ORDER?
* HOW OFTEN WE WANT TO EVALUATE??

Inventory Costs
HOLDING COST HOLDING COST
* Opportunity Costs Cash Flow Risk* Handling* Insurance* Obsolescence* Damages, Theft, Merma* Taxes
BACKORDER COSTSBACKORDER COSTS
* Lost Sales* Customer Ill Will* Information Costs* Expediting* Loss of Production
SETUPCOSTSSETUPCOSTS
* Cost to place an order* Machine Setup* Sampling Cost

Basic Trade-Offs
COST
Order or Setup
Holding
Backorders
Inventory Level
High Low

Controls
InventoryInventoryControlControlPolicyPolicy
Fill Rate EOQ
DemandForecasting
Inventory Planning Algorithms

Inventories in the American EconomyLogistics Costs Definition
% of Category % of TotalInventory Carrying Cost
Interest 69$ 22.2% 8.7%Taxes, Obsolescence, Insurance, and Depreciation 175$ 56.3% 22.0%Warehousing 67$ 21.5% 8.4%
Carrying Cost 311$ 100.0% 39.0%
Transportation CostsTruck - Intercity 230$ 51.0% 28.9%Truck - Local 132$ 29.3% 16.6%Railroads 35$ 7.8% 4.4%International Water 15$ 3.3% 1.9%Domestic Water 7$ 1.6% 0.9%Oil Pipelines 8$ 1.8% 1.0%International Air 5$ 1.1% 0.6%Domestic Air 14$ 3.1% 1.8%Forwarders 5$ 1.1% 0.6%
Transportation Costs 451$ 100.0% 56.6%
Shipper Related Cost 4$ 0.5%
Logistics Administration Costs 31$ 3.9%
TOTAL Costs 797$ 100.0%

Inventories in the American EconomyLogistics Costs USA vs. GNP
0.0%
2.0%
4.0%
6.0%
8.0%
10.0%
12.0%
14.0%
16.0%
18.0%
196
0
196
5
197
0
197
5
197
9
198
0
198
1
198
2
198
3
198
4
198
5
198
6
198
7
198
8
198
9
199
0
199
1
199
2
199
3
199
4
199
5
199
6
%Inventory Carrying Cost vs. GNP
%Transportation Cost vs. GNP
%Physical Distribution vs. GNP
199
7
199
8
199
9
200
0
200
1
200
2
200
3

Inventories in the American EconomyTransportation vs. Inventories
20.0%
25.0%
30.0%
35.0%
40.0%
45.0%
50.0%
55.0%
60.0%
65.0%
70.0%
1960
1965
1970
1975
1979
1980
1981
1982
1983
1984
1985
1986
1987
1988
1989
1990
1991
1992
1993
1994
1995
1996
1997
1998
1999
2000
2001
2002
2003
Inventory Carrying Cost vs. Total Physical Distribution Cost
Transportation Cost vs. Total Physical Distribution Cost

Inventories in the American EconomyReplacing Inventory by Transportation
Transportation to Inventory Carrying Cost Ratio
1.00
1.20
1.40
1.60
1.80
2.00
2.20
2.40
1960
1965
1970
1975
1979
1980
1981
1982
1983
1984
1985
1986
1987
1988
1989
1990
1991
1992
1993
1994
1995
1996
1997
1998
1999
2000
2001
2002
2003
Transportation to Inventory Carrying Cost Ratio

Notation
• Push vs. Pull• Types of Orders• Types of Inventories• Levels of Inventories• Backorders • Parameters Planning• Financial Notation• Demand Notation• Decision-making Variables
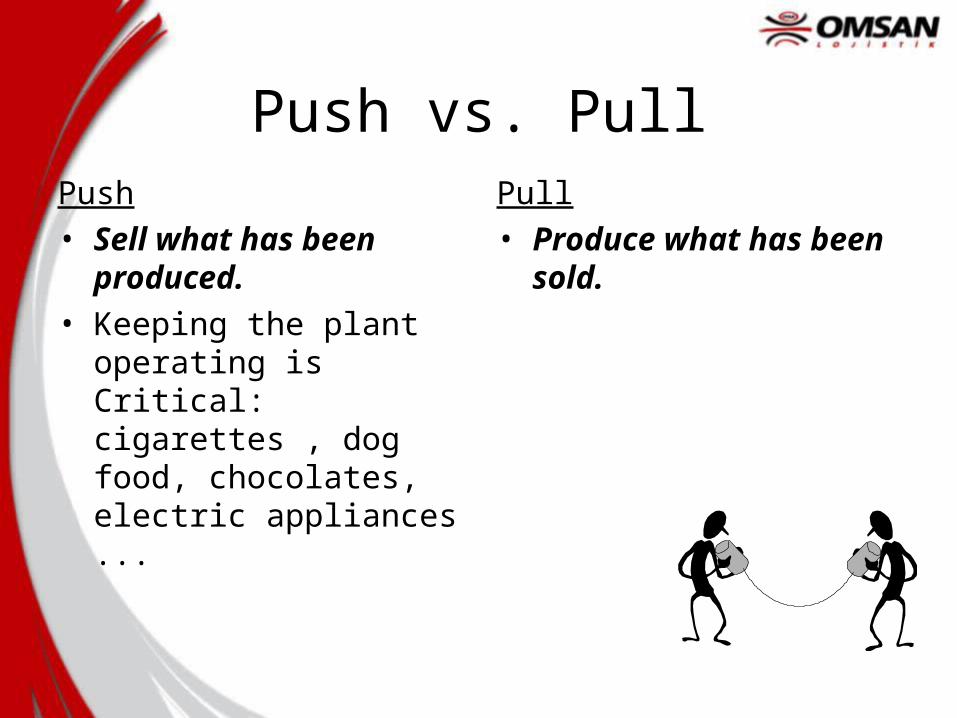
Push vs. PullPush• Sell what has been
produced.• Keeping the plant
operating is Critical: cigarettes , dog food, chocolates, electric appliances ...
Pull• Produce what has been
sold.

Types of Orders• Customer Orders
• Purchase Orders
• Back Orders
• Re-Ordering

Types of Inventory
• Service Inventory
• In-Transit Inventory
• Safety Stock
• Contingency Inventory
• Efficient Process Inventory
• Efficient Purchasing Inventory

Types of Inventories Inventory Role
• Stabilization Inventory
• Anticipation Inventory
• Reserve Inventory
• In-Consignment Inventory

Types of InventoriesInventory Status
• Raw Materials Inventory
• Parts Inventory
• Work in Process (WIP)
• Finished Goods Inventory
• In-Transit Inventory
• Backorders

Types of Inventory - Roles
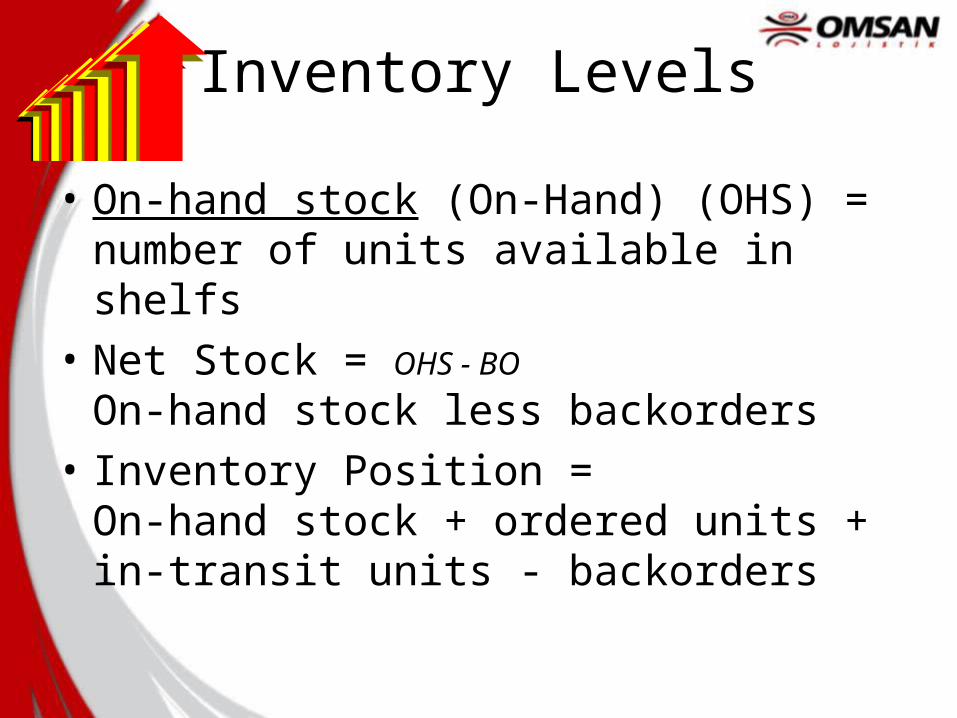
Inventory Levels
• On-hand stock (On-Hand) (OHS) = number of units available in shelfs
• Net Stock = OHS - BO On-hand stock less backorders
• Inventory Position = On-hand stock + ordered units + in-transit units - backorders

Stock-outs
Time
Inve
ntor
y
ReplenishmentOrder
QuantityQ
StockoutCondition

Backorders vs. Lost Sales
• BackorderingAny order not delivered but not lost. Common in low competitive markets
• Lost SalesNon-attended sales for not having stock on-hand
• Substitution
Replacement of a product in stock-out with another

Lost Sales
• Product Type
• Demand Characterisitics
• Substitutes
• Costs of stock-outs
• Competitiveness of the Market
• Subjective but Quantifiable

Inventory Planning Parameters
• SP = Sales Price
• UIV = Unit Inventory Value
• ICR = Inventory Carrying Rate
• POC = Purchasing Order Costs
• SUC = Set-Up Costs
• SF = Scarcity Factor

Inventory Carrying Rate
Handling &Warehousing
22%
Opportunity22%
Taxes,
Obsolescence, InsuranceDamages
56%

Purchase Order Cost (POC)
• Communications• Administration• Financial Costs of the Payment Strategy• Information Systems• Staff• Equipment• Office Supplies• Banking Costs• Documentation, Customs, etc.

Set-Up Cost (SUC)
• Changes of SKU in the Production Program
• Labour
• Waiting Time
• Cleaning - Decontamination
• Waste
• Damages in Test Batches

Financial Notation
• AIV = Average Inventory Value
• ICR = Inventory Carrying Rate
• ICC = Inventory Carrying Cost
• LSC = Lost Sales Cost
• TPC = Total Policy Cost
• TIC = Total Inventory Cost

Nivel de Inventario Promedio (Average Inventory Levels)
Ave
rag
e In
ven
tory
Lev
el (
AIL
)
Number or repositions
The Average Inventory Level exponentially decreases with reference to the number of repositions
AIL(I) = Σ (Inventory Level) Number of Observations
AIV = Σi {AIL(I)*UIV(I)}
ICC = AIV * ICR

Inventory Levels• On-Hand Inventory (OHS)
• Net Stock (NS)NS = OHS - BO
• Net Inventory Position (NIP)NIP = OHS + On-Order - BO - CI
• Safety Stock (SS)
?
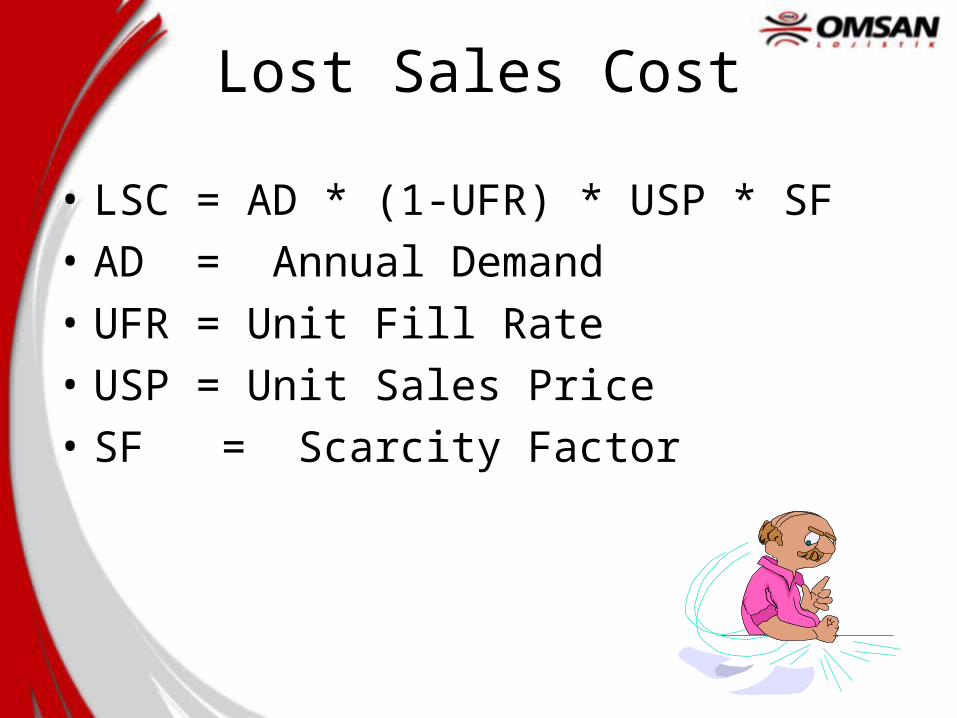
Lost Sales Cost
• LSC = AD * (1-UFR) * USP * SF
• AD = Annual Demand
• UFR = Unit Fill Rate
• USP = Unit Sales Price
• SF = Scarcity Factor

Demand Notation
• L = Lead Time
• AD = Annual Demand
• LD = Lead Time Demand
• FAD = Forecasting Annual Demand
• FLD = Forecasting Lead Time Delivery
• SDFLD = Standard Deviation of Forecasting Lead Time Delivery

Safety Stock (SS)
LeadtimeLeadtimeLeadtime
SAFETY STOCK
Time
Inve
ntor
y
ReplenishmentOrder
QuantityQ
Lower thanExpected Demand
AverageDemand Higher than
Expected Demand
StockoutCondition

Re-Order Point
Time
Inve
ntor
y
ReplenishmentOrder
QuantityQ
ReorderPoint(ROP)

What Fill Rate?
$-
$2,000
$4,000
$6,000
$8,000
$10,000
$12,000
$14,000
$16,000
50.0
0%
60.0
0%
65.0
0%
70.0
0%
75.0
0%
80.0
0%
85.0
0%
90.0
0%
92.5
0%
95.0
0%
97.0
0%
98.0
0%
99.0
0%
99.5
0%
99.7
0%
99.9
5%
Fill Rate
$s
Inventory Carrying Cost
Lost Sales Cost
Total Policy Cost

Demand Probability
LeadtimeLeadtimeLeadtime
Time
Inve
nto
ry
ReplenishmentOrder
QuantityQ
Lower thanExpected Demand
AverageDemand
Higher thanExpected Demand
StockoutCondition

Replenishment Quantity
Time
Inve
ntor
y
ReplenishmentOrder
QuantityQ

Lead Time (LT)
LeadtimeLeadtimeLeadtime
Time
Inve
ntor
y
ReplenishmentOrder
QuantityQ
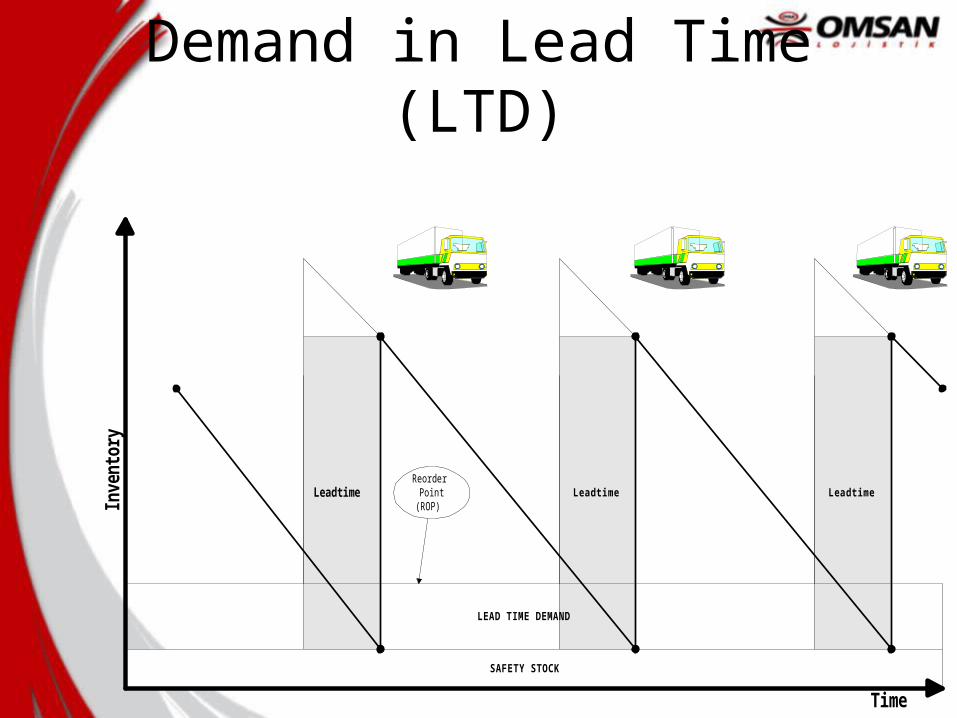
Demand in Lead Time (LTD)
LeadtimeLeadtimeLeadtime
LEAD TIME DEMAND
SAFETY STOCK
Time
Inve
ntor
y
ReorderPoint
(ROP)

Variance in the Lead TimeShort Delivery times is Good.
Consistent Delivery times is Better!
LeadtimeLeadtimeLeadtime
LEAD TIME DEMAND
SAFETY STOCK
Time
Inve
ntor
y
ReorderPoint
(ROP)
Lead TimeVariability
Decisions...
• What is the Optimum Fill Rate?• What will be the Demand?• When do I have to Order?• How much do I have to Order?• How much of Safety Stock?• How much of Service Stock?• How often do I have to check my Inventory
Policy?• Where do I have to locate my inventory within
the network?

Inventory Master Plan