Embed Size (px)
DESCRIPTION
Logistics: Elements of Inventory. June 5, 2006. Required Discussion in Project (1). How are the channels of distribution, from supplier to consumer household, designed to meet the physical characteristics of the product? Weight Bulk Perishability. Required Discussion in Project (2). - PowerPoint PPT Presentation
Citation preview
Logistics: Elements of Inventory
June 5, 2006
Required Discussion in Project (1)
• How are the channels of distribution, from supplier to consumer household, designed to meet the physical characteristics of the product?– Weight– Bulk– Perishability
Required Discussion in Project (2)
• How are the channels of distribution, from supplier to consumer household, designed to meet the consumer’s need for differentiation (or standardization) of product?– Unique product features– Positioning, brand characteristics– Seasonality
Service Output Levels
• Spatial convenience
• Waiting time/postponement speculation
• Lot size/combined shipments
• Assortment depth and inventory
SOS/SOD “Gaps”
• Retail formats are a standardized combination of “service output levels, format design is an optimal combination of SOLs based on assumptions of the household:
• Offering higher spatial convenience sacrifices efficiency in inventory management
Demand Gaps: SOS<SOD or SOS>SOD
• Service level demanded by consumers is less than that supplied.
• Retail supply chain is not delivering the product with respect to convenience, waiting time, etc. demanded– Tupperware, a convenience good is restrictively
distributed
– Adult running shoes stores, minimizing waiting time and additional convenience that’s not demanded.
Supply-Side Gaps
• Total costs of performing a function is too high, a lower cost alternative is available.– Travel agents costing airlines too much for
services provided to the airline and customer.– Multi-level marketing systems, “network
DSOs” place costs too high on convenience goods.
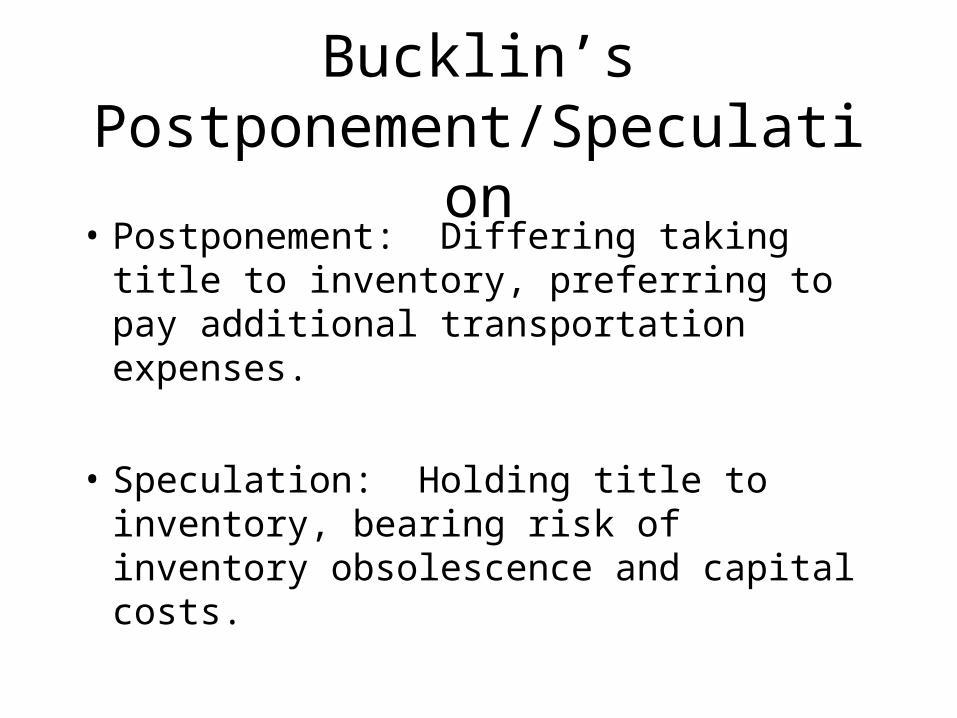
Bucklin’s Postponement/Speculation
• Postponement: Differing taking title to inventory, preferring to pay additional transportation expenses.
• Speculation: Holding title to inventory, bearing risk of inventory obsolescence and capital costs.
Delivery time/waiting time
Buying from supplier A
Uni
t del
iver
y co
sts
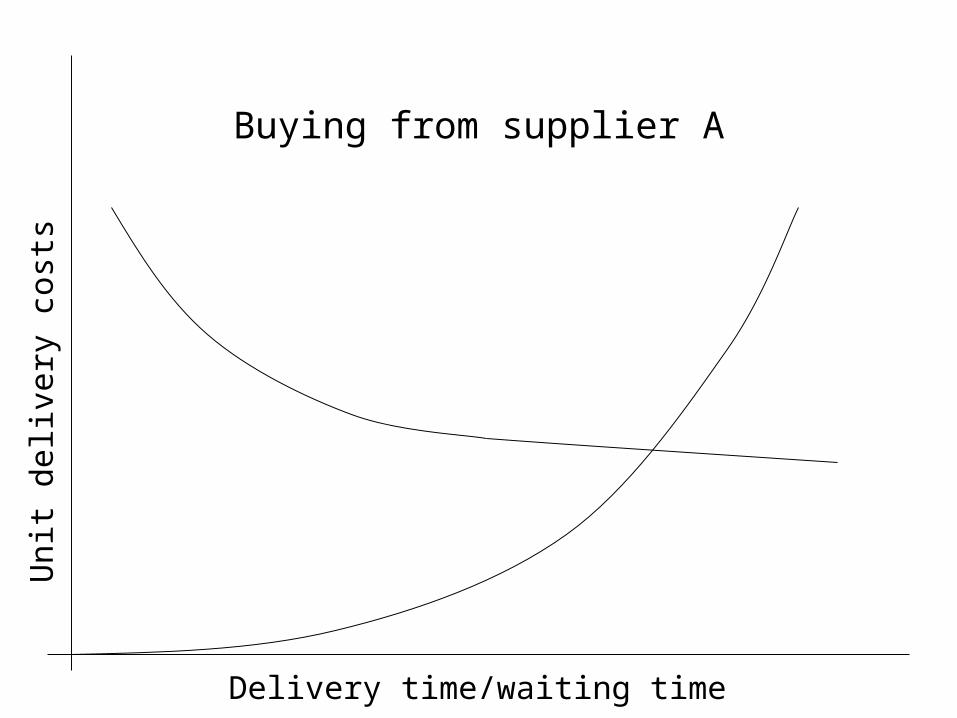
Delivery time/waiting time
Buying from supplier B
Uni
t del
iver
y co
sts
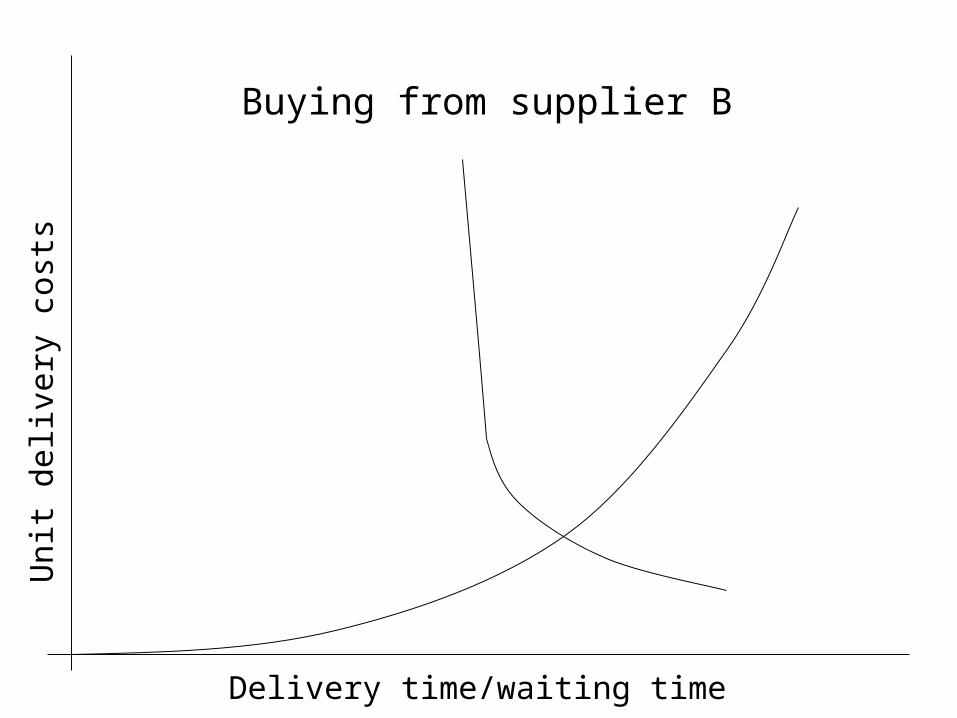
Delivery time/waiting time
Comparing suppliers A and B
Uni
t del
iver
y co
sts
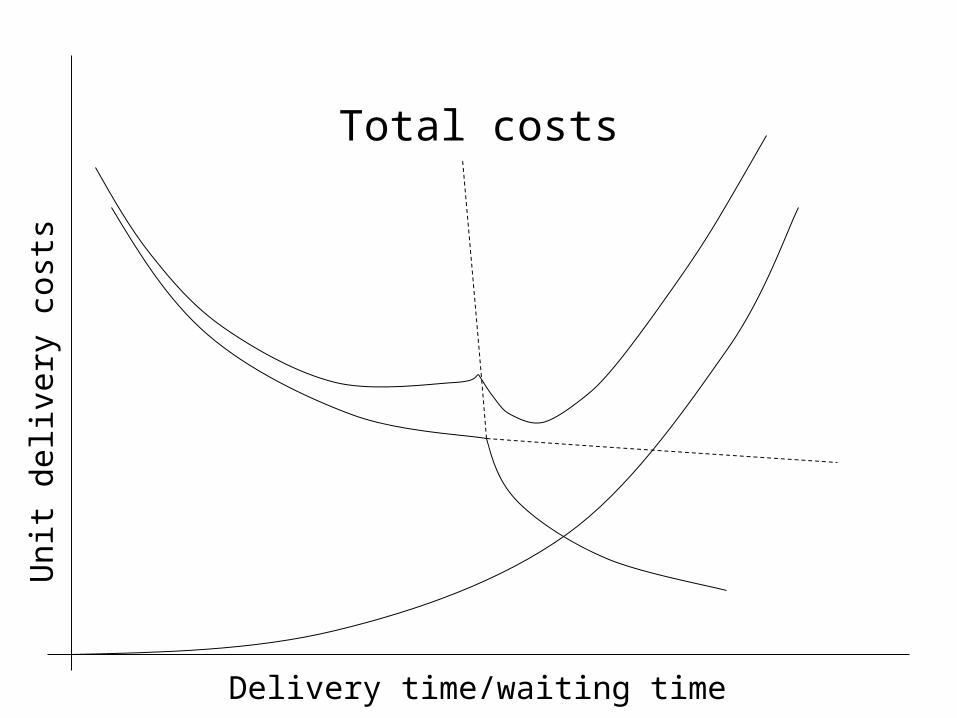
Delivery time/waiting time
Total costs
Uni
t del
iver
y co
sts
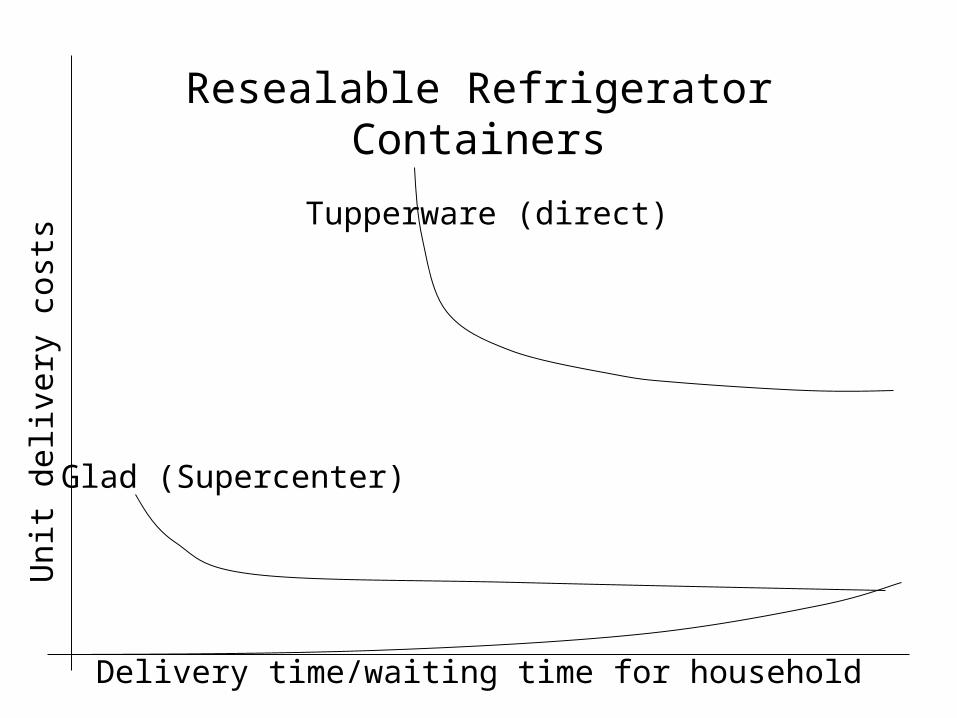
Delivery time/waiting time for household
Resealable Refrigerator Containers
Uni
t del
iver
y co
sts
Glad (Supercenter)
Tupperware (direct)
Number of Intermediate Stocking Points Approach
• Distribution centers are the typical example for a retailer.
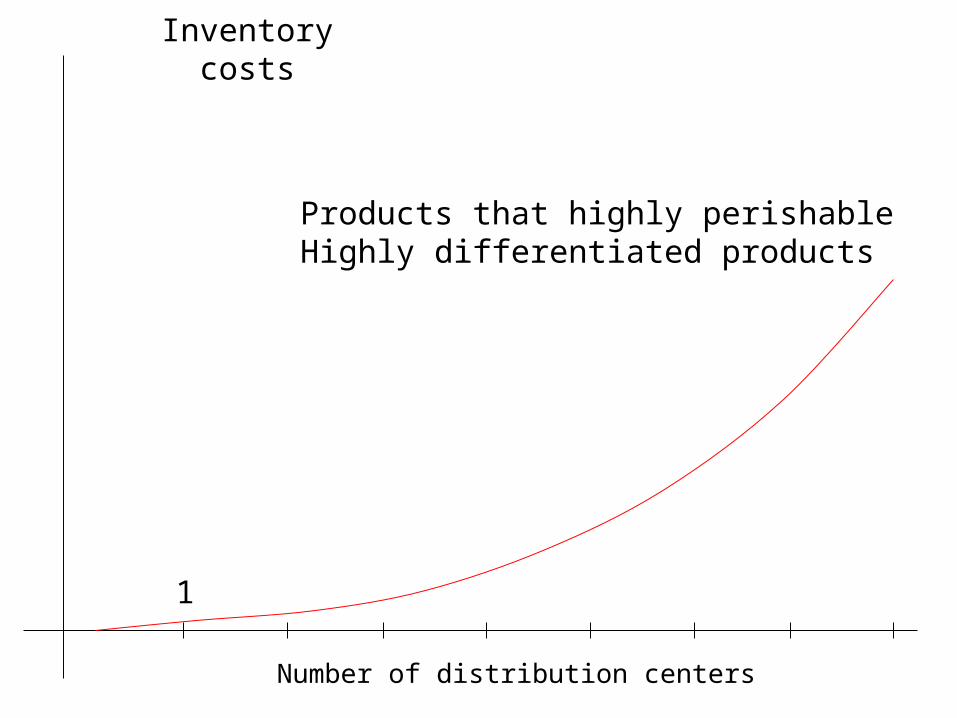
• With each additional distribution center, transportation costs (per unit) decrease.
• Additional inventory appears at each distribution center.
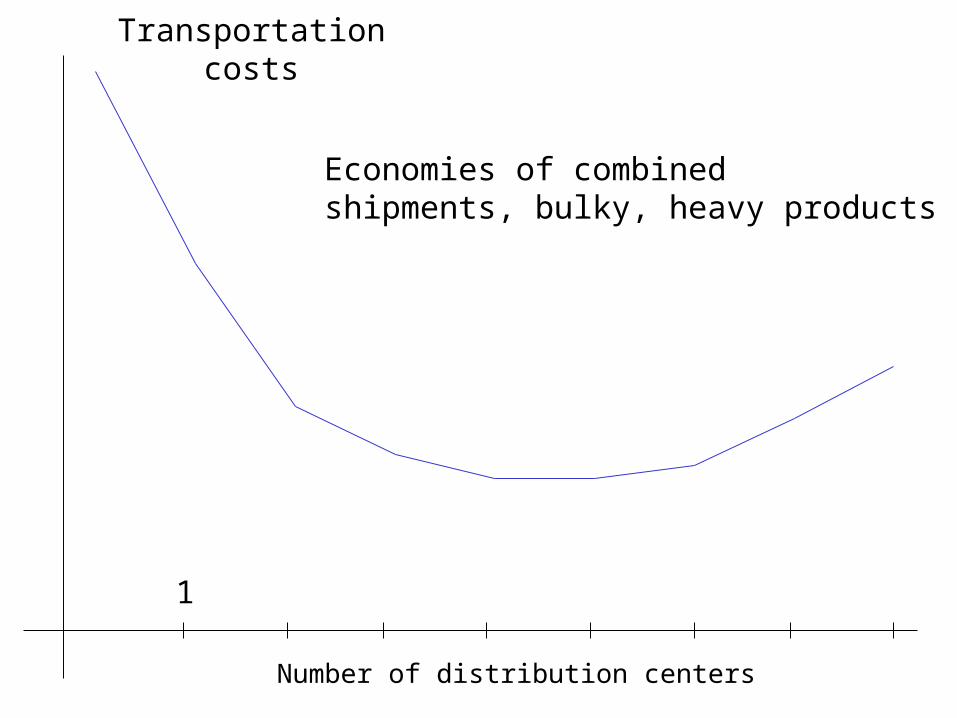
Number of distribution centers
1
Transportation costs
Economies of combined shipments, bulky, heavy products
Number of distribution centers
1
Inventory costs
Products that highly perishableHighly differentiated products
Number of distribution centers
1
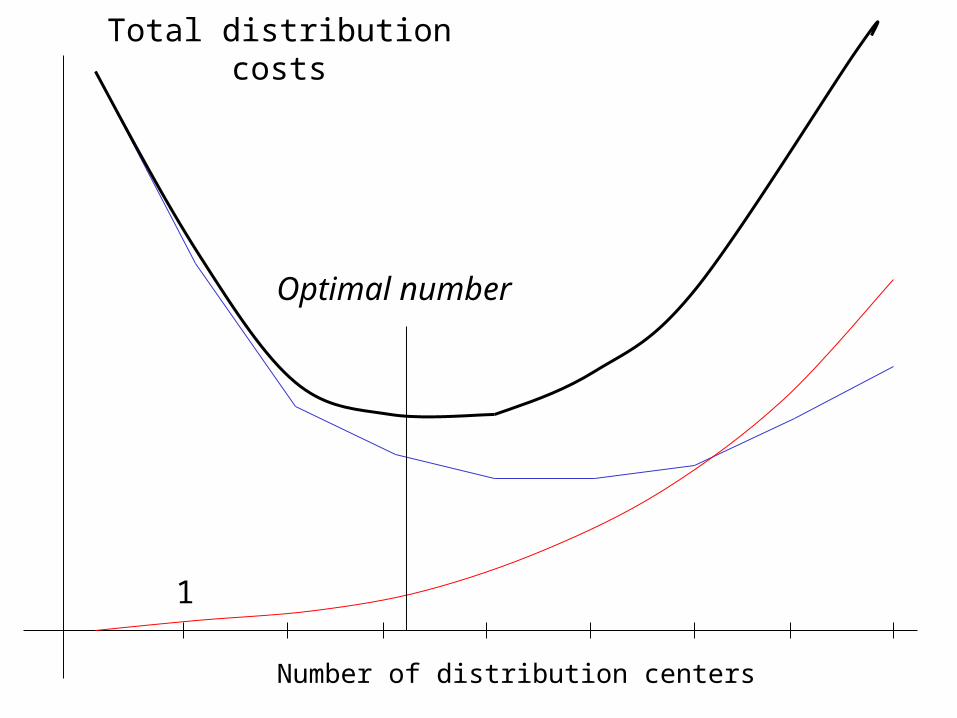
Total distribution costs
Optimal number
Number of distribution centers
1
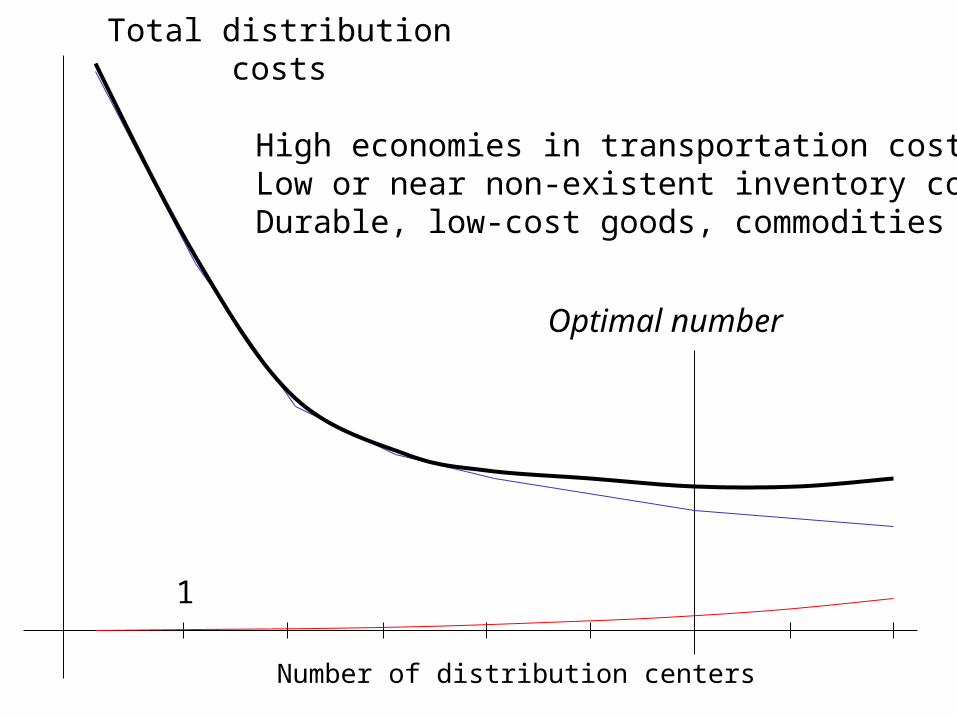
Total distribution costs
Optimal number
High economies in transportation costsLow or near non-existent inventory costsDurable, low-cost goods, commodities
Number of distribution centers
1
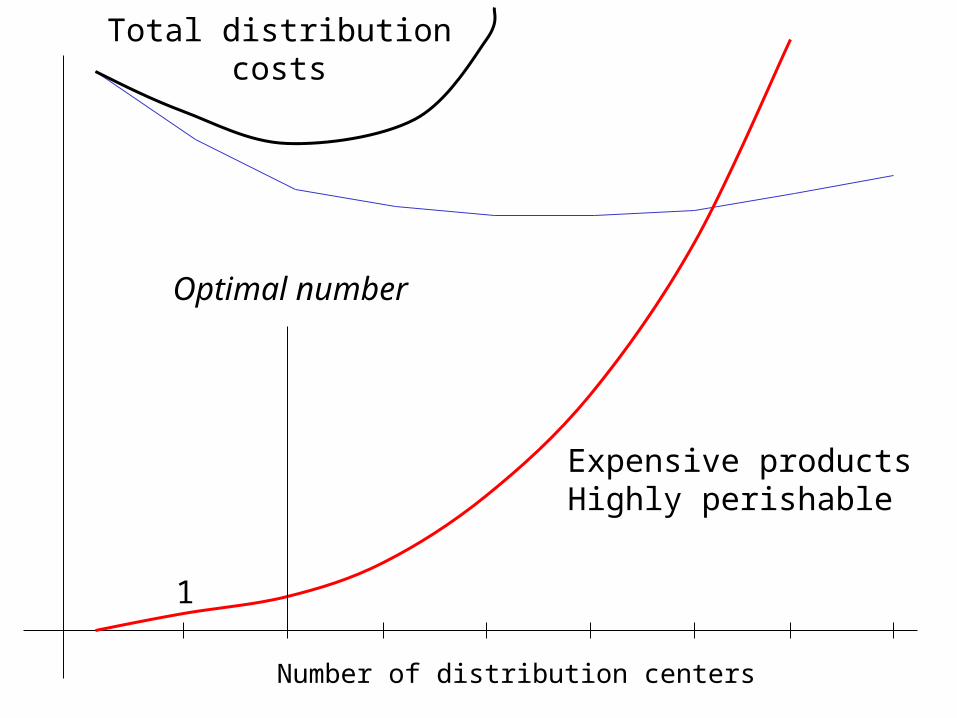
Total distribution costs
Optimal number
Expensive productsHighly perishable
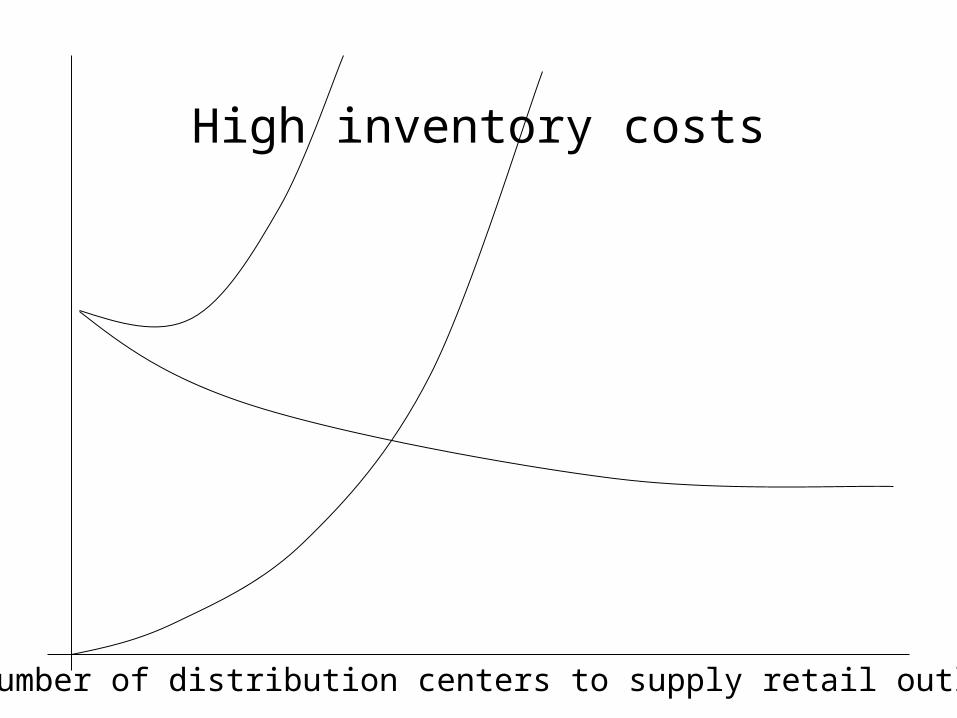
Number of distribution centers to supply retail outlets
High inventory costs
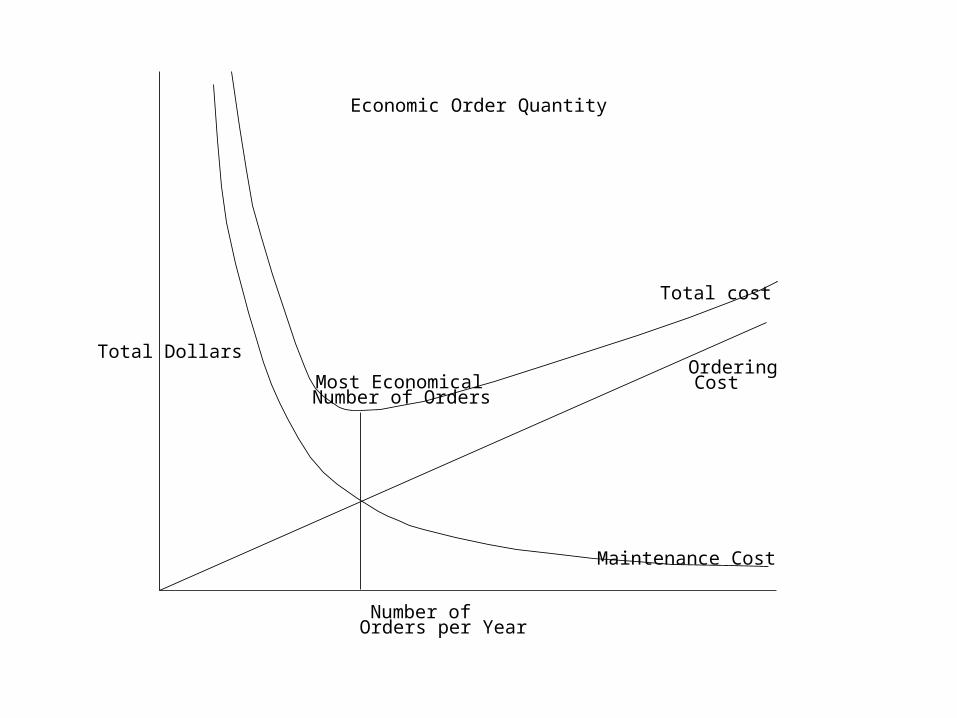
Number of Orders per Year
Most EconomicalNumber of Orders
Maintenance Cost
OrderingCost
Total cost
Total Dollars
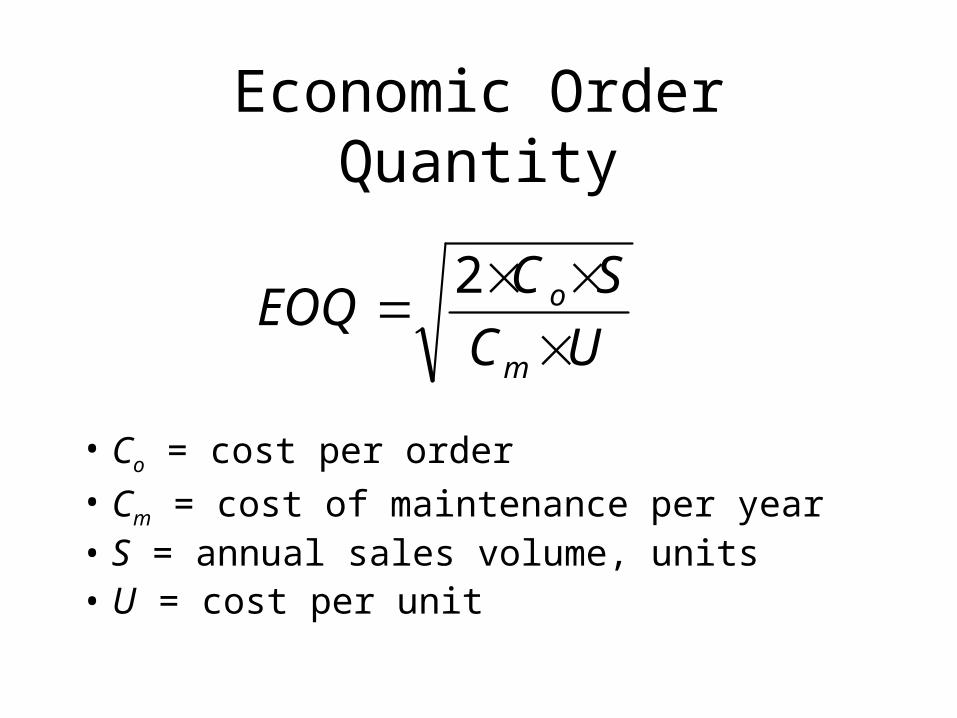
Economic Order Quantity
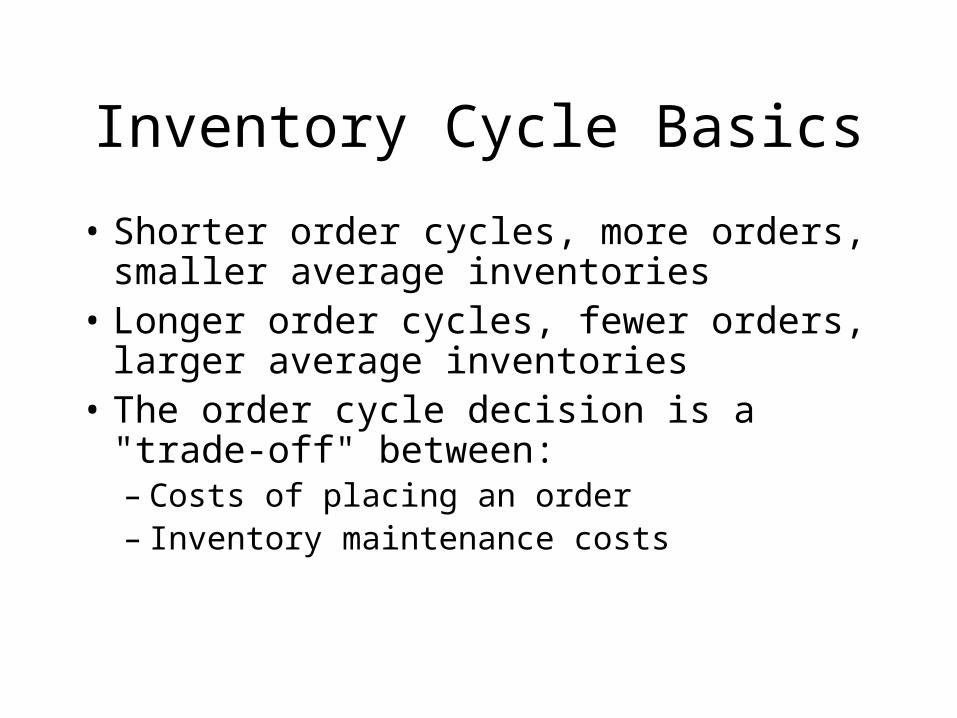
Inventory Cycle Basics
• Shorter order cycles, more orders, smaller average inventories
• Longer order cycles, fewer orders, larger average inventories
• The order cycle decision is a "trade-off" between:– Costs of placing an order– Inventory maintenance costs
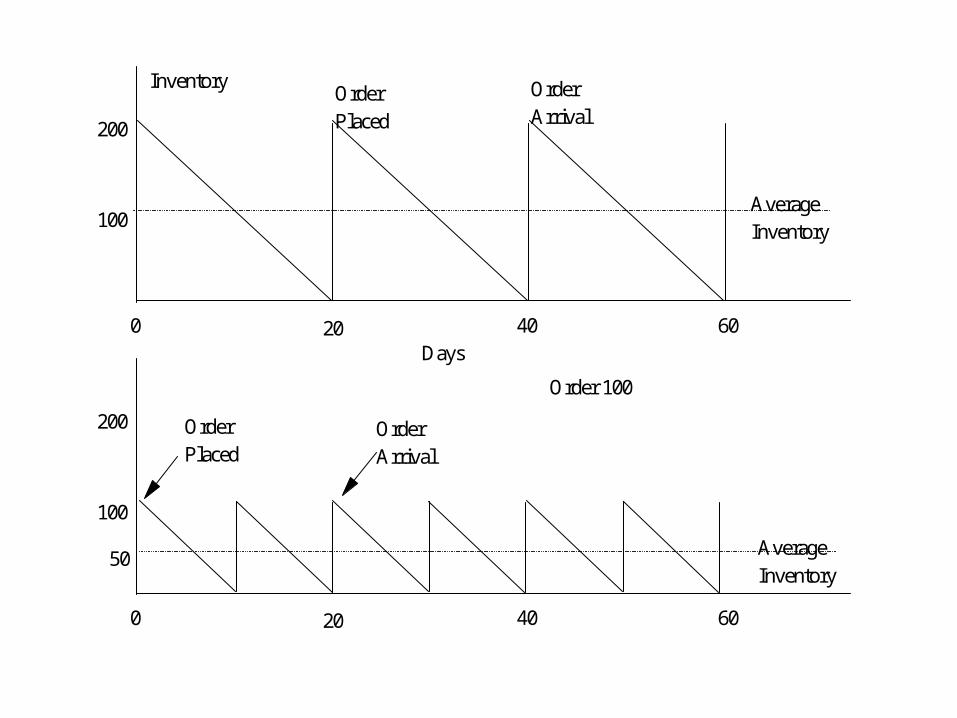
100
200
20 40 60
InventoryOrderPlaced
OrderArrival
AverageInventory
Days0
100
200
20 40 600
50
AverageInventory
Order 100
OrderPlaced
OrderArrival
UC
SCEOQ
m
o
2
Economic Order Quantity
• Co = cost per order• Cm = cost of maintenance per year• S = annual sales volume, units• U = cost per unit
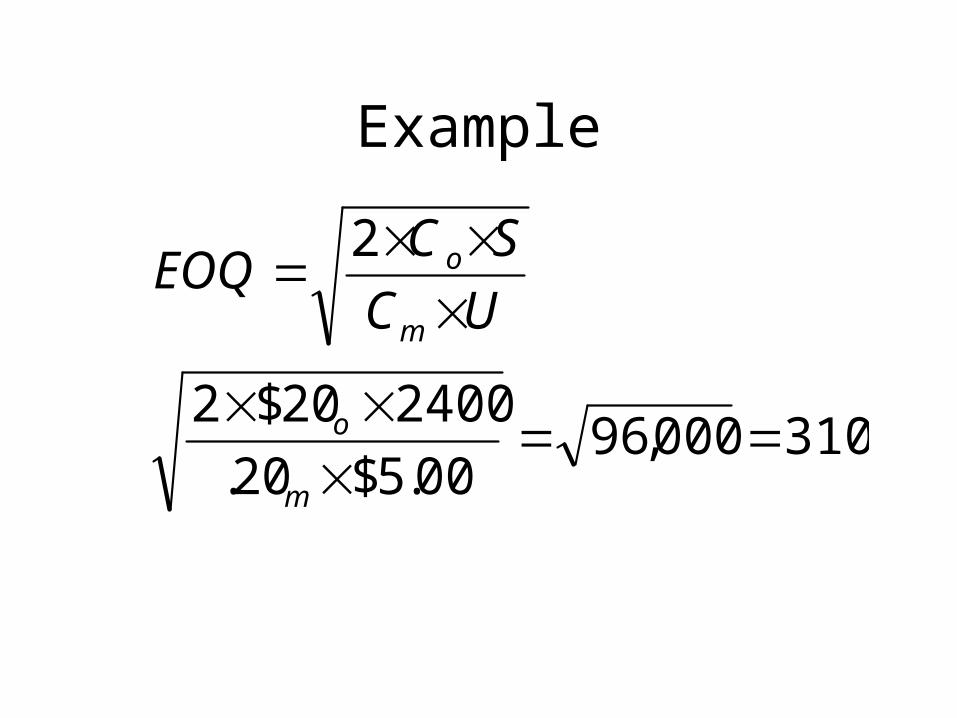
310000,9600.5$20.
240020$2
2
m
o
m
o
UC
SCEOQ
Example
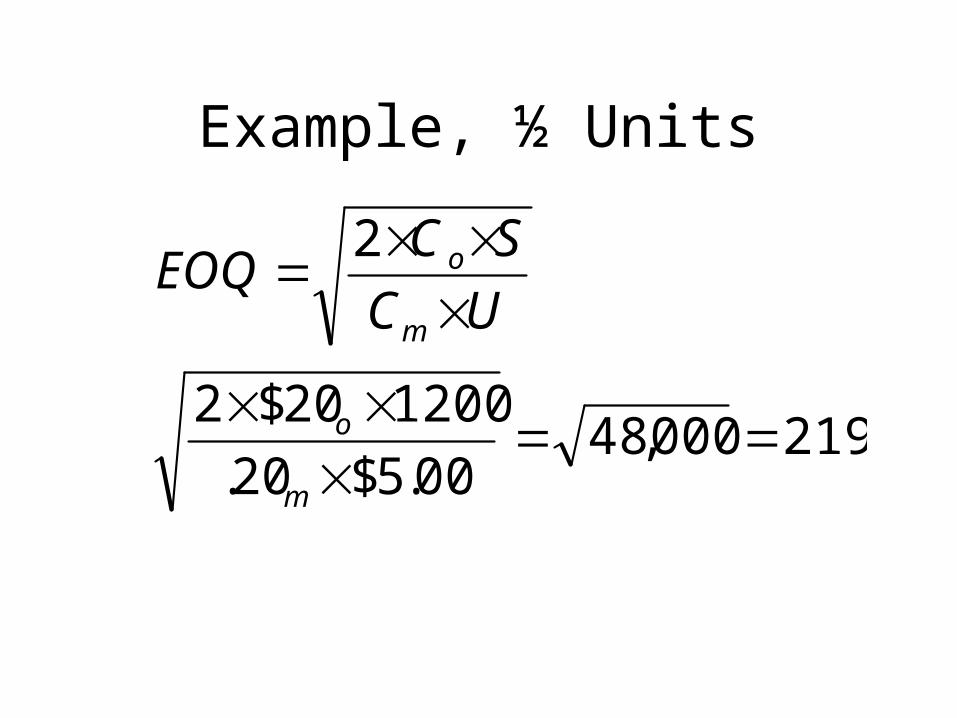
219000,4800.5$20.
120020$2
2
m
o
m
o
UC
SCEOQ
Example, ½ Units
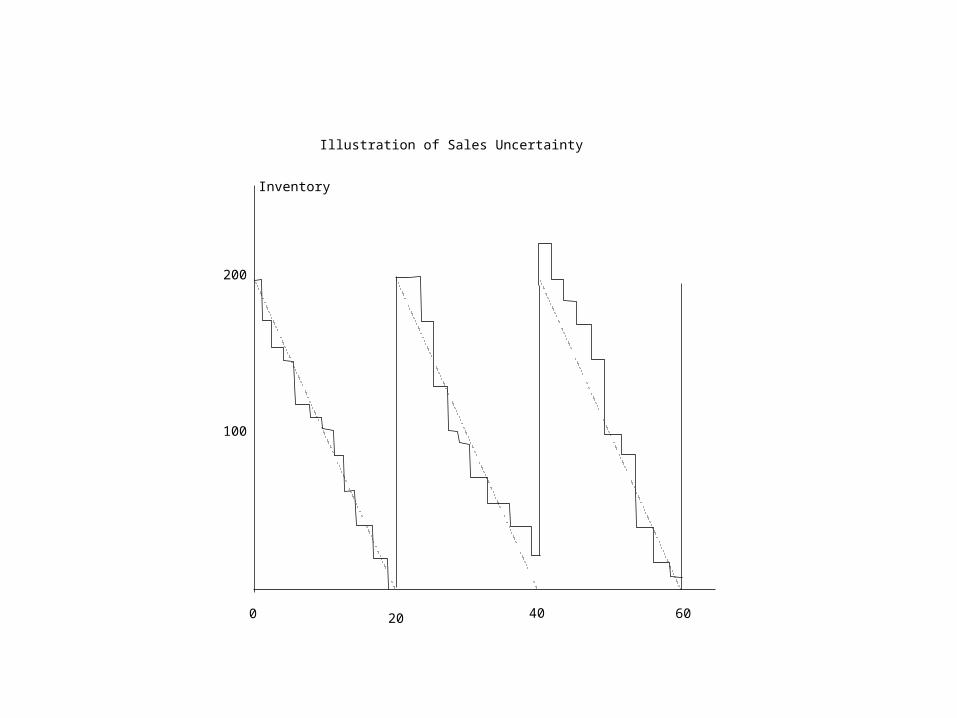
100
200
20 40 60
Inventory
0
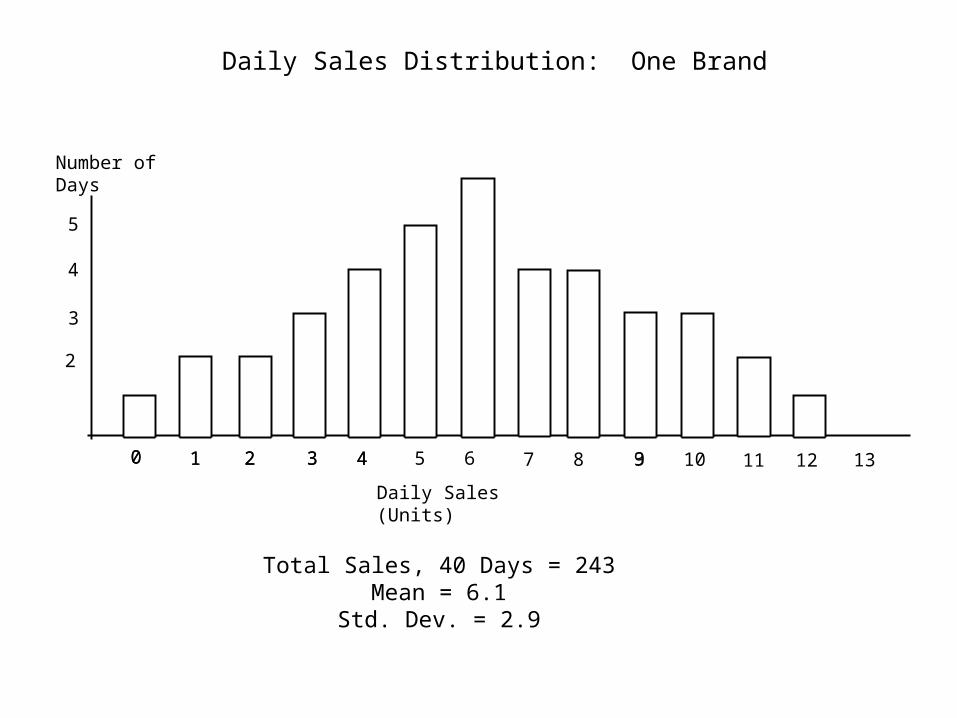
Illustration of Sales Uncertainty
2
0 1 20 1 2 5 63 43 4 7 8 3 109 11 12 13
3
4
5
Daily Sales (Units)
Number ofDays
Total Sales, 40 Days = 243Mean = 6.1
Std. Dev. = 2.9
Daily Sales Distribution: One Brand
2
0 1 20 1 2 5 63 43 4 7 8 3 109 11 12 13
3
4
5
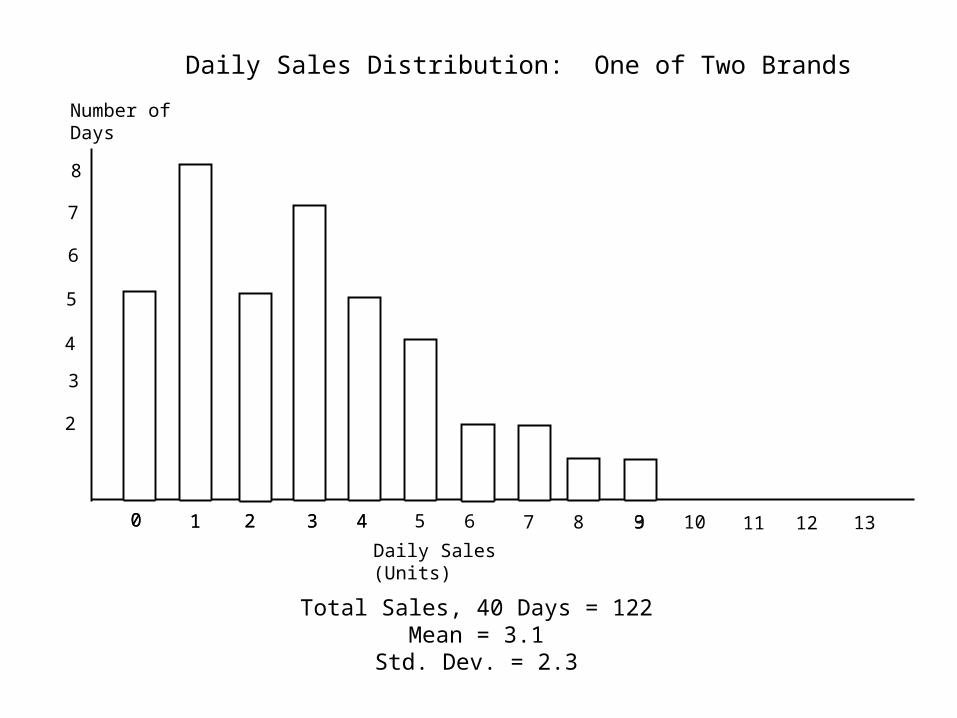
Daily Sales (Units)
Number ofDays
Total Sales, 40 Days = 122Mean = 3.1
Std. Dev. = 2.3
6
7
8
Daily Sales Distribution: One of Two Brands