Embed Size (px)
Citation preview
Omnicom
A N N U A L R E P O R T
99
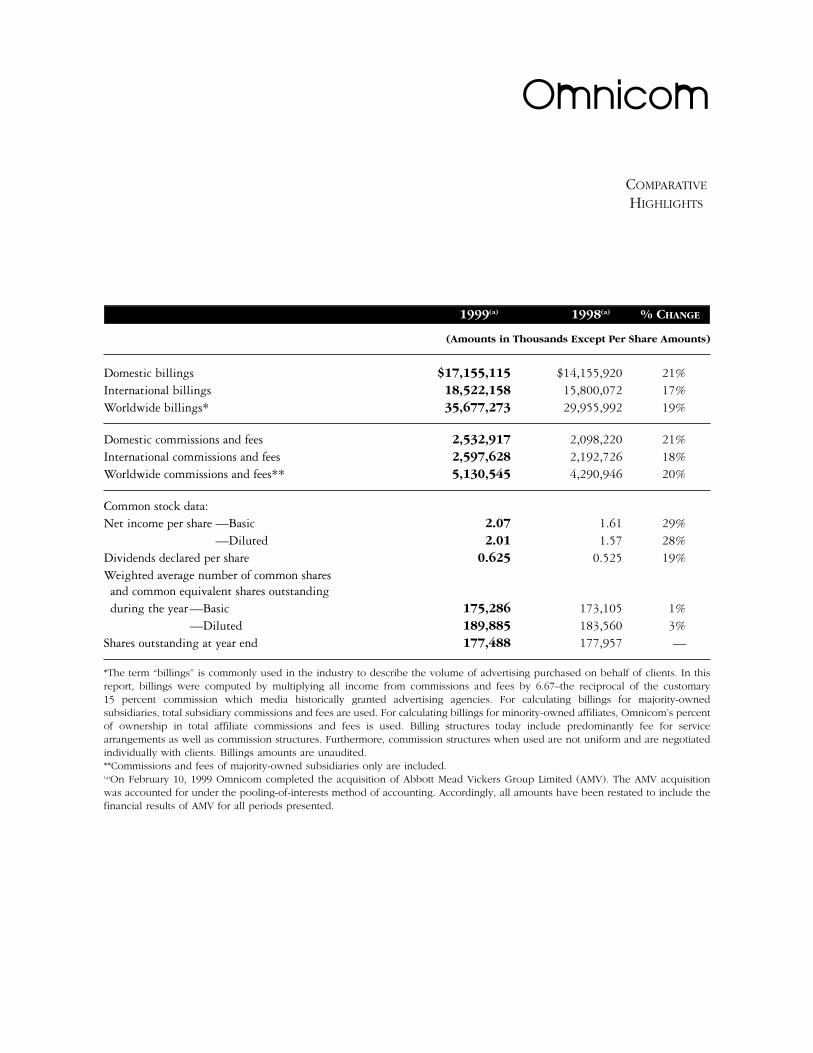
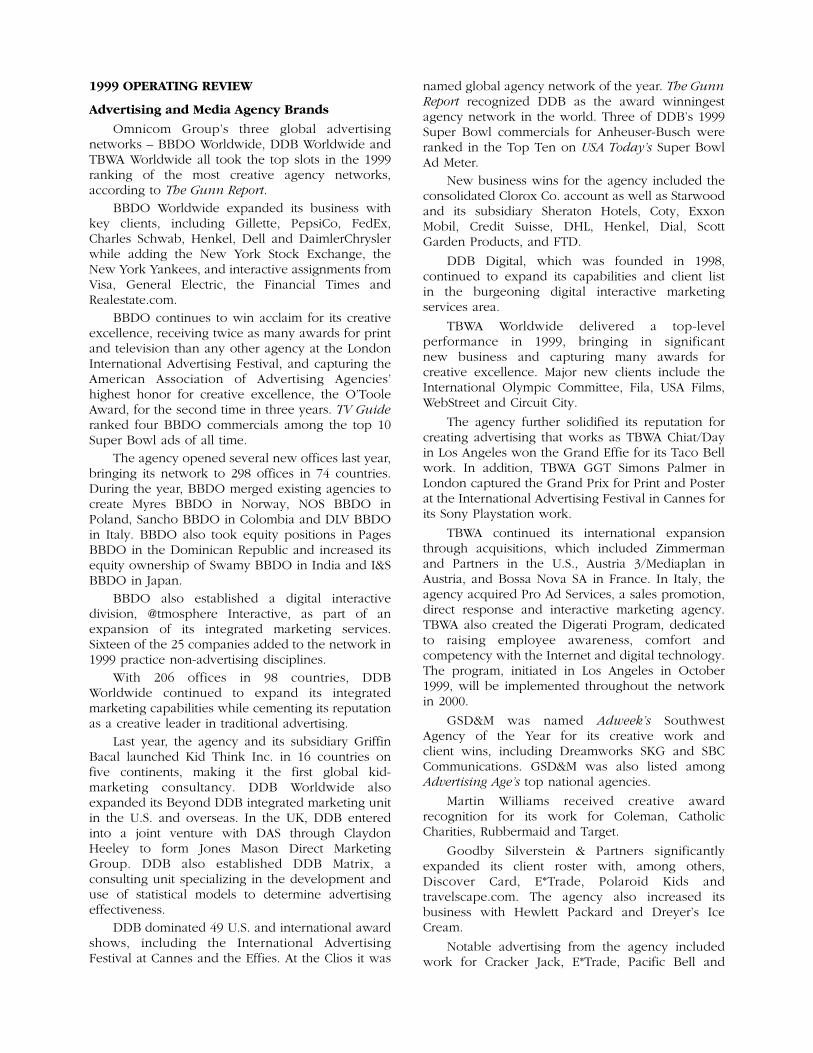
1999(a) 1998(a) % CHANGE
(Amounts in Thousands Except Per Share Amounts)
Domestic billings $17,155,115 $14,155,920 21%International billings 18,522,158 15,800,072 17%Worldwide billings* 35,677,273 29,955,992 19%
Domestic commissions and fees 2,532,917 2,098,220 21%International commissions and fees 2,597,628 2,192,726 18%Worldwide commissions and fees** 5,130,545 4,290,946 20%
Common stock data:Net income per share —Basic 2.07 1.61 29%
—Diluted 2.01 1.57 28%Dividends declared per share 0.625 0.525 19%Weighted average number of common sharesand common equivalent shares outstandingduring the year—Basic 175,286 173,105 1%
—Diluted 189,885 183,560 3%Shares outstanding at year end 177,488 177,957 —
*The term “billings” is commonly used in the industry to describe the volume of advertising purchased on behalf of clients. In thisreport, billings were computed by multiplying all income from commissions and fees by 6.67–the reciprocal of the customary15 percent commission which media historically granted advertising agencies. For calculating billings for majority-ownedsubsidiaries, total subsidiary commissions and fees are used. For calculating billings for minority-owned affiliates, Omnicom’s percentof ownership in total affiliate commissions and fees is used. Billing structures today include predominantly fee for servicearrangements as well as commission structures. Furthermore, commission structures when used are not uniform and are negotiatedindividually with clients. Billings amounts are unaudited.**Commissions and fees of majority-owned subsidiaries only are included.(a)On February 10, 1999 Omnicom completed the acquisition of Abbott Mead Vickers Group Limited (AMV). The AMV acquisitionwas accounted for under the pooling-of-interests method of accounting. Accordingly, all amounts have been restated to include thefinancial results of AMV for all periods presented.
Omnicom
COMPARATIVE
HIGHLIGHTS
A host of forces, including the rapid adoption ofdigital technologies and the Internet, has changed foreverthe way business is conducted. Increased computingpower, high-speed distribution and digital access toeverything makes brand building a crucial businesspriority — without regard to industry, nationality orgeography. Omnicom Group is already capitalizing onthe opportunities created by these changes.
Throughout the past decade, we executed astrategy to benefit from media fragmentation, industryconsolidation and the convergence of marketingdisciplines. We moved early and quickly to buildsignificant positions in over 20 companies involved indigital interactive marketing. These holdings nowrepresent substantial shareholder value.
As a result, our company enjoys a well-earnedreputation for innovation and market leadership. Wehave aligned our assets and focus with today’s economyand our investments and initiatives with tomorrow’s.
Omnicom is a company with a relentless focuson shareholder value. Over the last decade,Omnicom Group delivered a 10-year totalannualized return to its shareholders of 34.7 percent.This exceptional performance made Omnicom the32nd best-performer among all companies in theS&P 500 index.
Last year, as you will see on the following pages,our company posted the best financial performancein its history. It was our 13th consecutive record-breaking year. The fourth quarter was the 34thconsecutive quarter of year-over-year growth inrevenues and earnings.
Non-advertising marketing services nowrepresent 53 percent of our consolidated revenue, upfrom 30 percent at the beginning of the decade.Advertising and media buying services nowrepresent 47 percent of consolidated revenues, downfrom 70 percent in 1990. Geographically, ourconsolidated revenues are about evenly splitbetween the United States and International marketsand no single client is responsible for more than fivepercent of our consolidated revenues.
This balance dramatically reduces our exposureto any single industry, client or geographic economiccycle while at the same time enabling us to profit fromthe powerful forces that are reshaping our industry.
1999 FINANCIAL REVIEW
Total revenues from commissions and feesincreased 20 percent to $5.1 billion in 1999, from$4.3 billion in 1998. Net income increased 30 percentto $362.9 million in 1999, from $278.8 million in
1998, and fully diluted earnings per share rose 28percent to $2.01 per share, from $1.57 per share. Atthe same time, our operating margins widened to14.1 percent from 13.1 percent, amongst the best inour industry.
The reported amounts have been restated toinclude the results of the February 10, 1999 acquisitionof Abbott Mead Vickers Group Limited (AMV), whichwas accounted for as a pooling of interests.
Every major operating unit of our companycontributed to our strong financial performance.Increased spending by both established and newclients fueled across-the-board gains. In 1999, ouroperating companies won net new business of morethan $3 billion for the first time in our history.
As a reflection of this strong performance, onDecember 7, 1999, our Board of Directors increasedthe cash dividend on Omnicom Group commonstock by 16.7 percent from 15 cents to 17.5 cents pershare per quarter.
During 1999, Omnicom’s performance alsoattracted important industry and financial communityrecognition:
• Our general media agencies BBDOWorldwide, DDB Worldwide, TBWAWorldwide and Goodby Silverstein &Partners again dominated the InternationalAdvertising Agency Festival at Cannes. At theindustry’s most prestigious creative awardsshow, Omnicom’s agency networks won78 Lion awards, 64 more than our closestcompetitor.
• Fortune Magazine ranked Omnicom NumberOne in its list of America’s Most AdmiredCompanies in our industry. Fortune cited“Eight Attributes” as the basis of theirrankings; Omnicom ranked Number One in“Quality of Products and Services” andNumber Three in “Quality of Management”considering all companies in all industries.
• Business Week ranked Omnicom 32nd in itsannual review of the best performingcompanies in the S&P 500.
• The Wall Street Journal’s ShareholderScoreboard (a ranking of 1,000 major U.S.public companies) ranked Omnicom NumberOne in its peer group for our ten-yearaverage annual total return to shareholders.
All of these honors are a credit to the enormousdedication, entrepreneurial talent and managementskill that resides within our operating companies.
LETTER FROM THE PRESIDENT
DEAR FELLOW SHAREHOLDERS:
1999 OPERATING REVIEW
Advertising and Media Agency Brands
Omnicom Group’s three global advertisingnetworks – BBDO Worldwide, DDB Worldwide andTBWA Worldwide all took the top slots in the 1999ranking of the most creative agency networks,according to The Gunn Report.
BBDO Worldwide expanded its business withkey clients, including Gillette, PepsiCo, FedEx,Charles Schwab, Henkel, Dell and DaimlerChryslerwhile adding the New York Stock Exchange, theNew York Yankees, and interactive assignments fromVisa, General Electric, the Financial Times andRealestate.com.
BBDO continues to win acclaim for its creativeexcellence, receiving twice as many awards for printand television than any other agency at the LondonInternational Advertising Festival, and capturing theAmerican Association of Advertising Agencies’highest honor for creative excellence, the O’TooleAward, for the second time in three years. TV Guideranked four BBDO commercials among the top 10Super Bowl ads of all time.
The agency opened several new offices last year,bringing its network to 298 offices in 74 countries.During the year, BBDO merged existing agencies tocreate Myres BBDO in Norway, NOS BBDO inPoland, Sancho BBDO in Colombia and DLV BBDOin Italy. BBDO also took equity positions in PagesBBDO in the Dominican Republic and increased itsequity ownership of Swamy BBDO in India and I&SBBDO in Japan.
BBDO also established a digital interactivedivision, @tmosphere Interactive, as part of anexpansion of its integrated marketing services.Sixteen of the 25 companies added to the network in1999 practice non-advertising disciplines.
With 206 offices in 98 countries, DDBWorldwide continued to expand its integratedmarketing capabilities while cementing its reputationas a creative leader in traditional advertising.
Last year, the agency and its subsidiary GriffinBacal launched Kid Think Inc. in 16 countries onfive continents, making it the first global kid-marketing consultancy. DDB Worldwide alsoexpanded its Beyond DDB integrated marketing unitin the U.S. and overseas. In the UK, DDB enteredinto a joint venture with DAS through ClaydonHeeley to form Jones Mason Direct MarketingGroup. DDB also established DDB Matrix, aconsulting unit specializing in the development anduse of statistical models to determine advertisingeffectiveness.
DDB dominated 49 U.S. and international awardshows, including the International AdvertisingFestival at Cannes and the Effies. At the Clios it was
named global agency network of the year. The GunnReport recognized DDB as the award winningestagency network in the world. Three of DDB’s 1999Super Bowl commercials for Anheuser-Busch wereranked in the Top Ten on USA Today’s Super BowlAd Meter.
New business wins for the agency included theconsolidated Clorox Co. account as well as Starwoodand its subsidiary Sheraton Hotels, Coty, ExxonMobil, Credit Suisse, DHL, Henkel, Dial, ScottGarden Products, and FTD.
DDB Digital, which was founded in 1998,continued to expand its capabilities and client listin the burgeoning digital interactive marketingservices area.
TBWA Worldwide delivered a top-levelperformance in 1999, bringing in significantnew business and capturing many awards forcreative excellence. Major new clients include theInternational Olympic Committee, Fila, USA Films,WebStreet and Circuit City.
The agency further solidified its reputation forcreating advertising that works as TBWA Chiat/Dayin Los Angeles won the Grand Effie for its Taco Bellwork. In addition, TBWA GGT Simons Palmer inLondon captured the Grand Prix for Print and Posterat the International Advertising Festival in Cannes forits Sony Playstation work.
TBWA continued its international expansionthrough acquisitions, which included Zimmermanand Partners in the U.S., Austria 3/Mediaplan inAustria, and Bossa Nova SA in France. In Italy, theagency acquired Pro Ad Services, a sales promotion,direct response and interactive marketing agency.TBWA also created the Digerati Program, dedicatedto raising employee awareness, comfort andcompetency with the Internet and digital technology.The program, initiated in Los Angeles in October1999, will be implemented throughout the networkin 2000.
GSD&M was named Adweek’s SouthwestAgency of the Year for its creative work andclient wins, including Dreamworks SKG and SBCCommunications. GSD&M was also listed amongAdvertising Age’s top national agencies.
Martin Williams received creative awardrecognition for its work for Coleman, CatholicCharities, Rubbermaid and Target.
Goodby Silverstein & Partners significantlyexpanded its client roster with, among others,Discover Card, E*Trade, Polaroid Kids andtravelscape.com. The agency also increased itsbusiness with Hewlett Packard and Dreyer’s IceCream.
Notable advertising from the agency includedwork for Cracker Jack, E*Trade, Pacific Bell and
Discover Card. USA Today selected the agency’s“Lizards” campaign for Budweiser as the SuperBowl’s best commercial of all-time.
Early in 2000, we established a new subsidiary,Omnicom Media Group (OMG), to manage ourmany media services assets. OMG has since alignedour media planning and buying companies into twointernational media-service networks, one calledOMD, and the other PhD.
At OMD, which was already a majorinternational force, the change meant expanding intothe U.S. market by combining the domesticprogramming research and broadcast media buyingactivities of our global advertising networks intoOMD USA. OMD is now a truly global media-services company, with about $14 billion in mediabillings.
PhD is an entirely new network that combinesOmnicom’s independent media specialistcompanies, including Advanswers and CreativeMedia in the United States; HYPN in Canada andNew PhD in the UK (which was named UK mediaagency of the year). The new network will enable usto accommodate a very broad array of clients. PhDhandles nearly $3 billion in media billings.
Clients, increasingly, are consolidating theirmedia buying at companies that specialize in mediaservices only. Our new structure is a key strategicinitiative that anticipates further development of thistrend. We offer clients the choice of two high-caliberinternational media networks, each with its owndistinct character of service. OMD was built on theheritage and global scale of our advertising agencies,and the PhD network is a culture of independentand entrepreneurial media specialists.
Marketing Services and SpecialtyCommunications Brands
With over 100 separately branded companiesunder its umbrella, Diversified Agency Services(DAS) is the largest component of Omnicom Group.DAS has experienced significant growth since it wasfounded in 1986, with operations across 28marketing services and specialty communicationscategories and over 13,000 employees.
To support its growth, DAS made severalmanagement changes in 1999. Reporting to DASChairman-CEO Thomas L. Harrison is Michael Birkin,Worldwide President of DAS, who has relocated toNew York from London. Anthony Wreford, who for10 years has been a consultant to Omnicom and DASas well as companies such as McKinsey, LehmanBrothers and Nike, was named President and ChiefExecutive of DAS Europe. In addition, Carmen Baezwas named President of Latin America where DASpublic relations, direct response and brandingcompanies now have 69 offices in 17 countries.
In 1999, Mercedes-Benz of North Americaentered into a strategic marketing alliance with DAScovering the full range of marketing communicationsfor Mercedes-Benz in the U.S. Merkley NewmanHarty was named the lead agency on the account.Other DAS agencies involved include AlconeMarketing Group, the Designory, Footsteps, GMRMarketing, Kaleidoscope Creative and Rapp CollinsWorldwide.
Merkley Newman Harty (MNH) also formed analliance with direct-to-consumer healthcare agencyConsumer Healthworks (CHW) calling for themerger of CHW’s operations with MNH this year.This unit will capitalize on the explosive growth inclient spending for direct-to-consumer marketingservices in the healthcare industry.
Omnicom has established the leading globalhealthcare franchise. In the United States, we own 10healthcare ad agencies, three of which are in the top20 as ranked by Medical Advertising News. As agroup, our agencies work for more than 40 of thetop 50 pharmaceutical manufacturers. In 1999, DASacquired a minority position in SCIREX, a contractresearch organization. This acquisition was the firstof its kind in our industry and will provide earlierentrée by DAS agencies in the brand developmentand commercialization process.
Public relations has become the largest businesscomponent of DAS, with three of the top sevenworldwide public relations networks – Fleishman-Hillard, Ketchum and Porter Novelli International.Fleishman-Hillard, the largest agency in the UnitedStates in terms of revenues, was also named Agencyof the Decade by Inside PR. Fleishman-Hillardacquired UpStart Communications and Lois Paul,both companies primarily focused on high-technology marketing and public relations. Ketchumbegan implementing an internal digital businessinitiative to transform how its professionals workwith one another, deliver client service and engagein the practice of public relations in the digitaleconomy. Through Copithorne & Bellows and PorterNovelli, DAS formed the Porter Novelli ConvergenceGroup, which focuses on technology-based publicrelations business.
The DAS public relations portfolio also includesBrodeur Worldwide, Clark & Weinstock, GavinAnderson and GPC International. In addition, in1999, DAS acquired public affairs specialistsMcDermott O’Neill and Cone Communications.
Rapp Collins Worldwide acquired a 50 percentequity interest in Critical Mass, a Canadian baseddirect response Internet services company withoffices in Chicago and Stockholm. Rapp Collins alsoformed Rapp Digital; an interactive agency thatprovides clients with a range of advanced electronic
customer relationship management (e-CRM)services. Critical Mass is an integral component ofRapp Digital. The combination of the two makesRapp Digital one of the top 20 interactive agencies.
Customer relationship management is a majorcomponent of direct marketing strategies andcustomer research and web-based techniques areconverging. In November, DAS acquired M/A/R/C, adatabase driven relationship management andmarketing company using interactive web-basedapplications. M/A/R/C is one of the largest marketingintelligence firms in North America.
Also in 1999, DAS acquired a third directmarketing company, West Coast based DirectPartners, which is emerging as a major player indirect marketing strategic consulting and electroniccustomer relationship management using digital,web-based technologies.
As this letter was written, DAS announced theacquisition of Washington Speakers Bureau, whichprovides celebrity speaker services for the lecturecircuits and for corporate management andmarketing events.
Promotional marketing is another facet ofcustomer relationship management and AlconeMarketing Group and The Integer Group performedstrongly through their mix of services – strategic andtactical retail executions, database-backed incentivesand loyalty programs. In the area of live eventmarketing, GMR Marketing continued to expand itsbreadth of client services. In the UK, Claydon Heeleyhad an outstanding year.
DAS also recently strengthened its global fieldmarketing capabilities with a 40 percent investmentin MarketStar, one of the leading U.S. firmsspecializing in the computer and communicationsindustries. MarketStar will complement the CPMGroup, which continues to dominate field marketingin Europe.
In brand consulting, Interbrand confirmed itsposition as a global leader in its field, with strongperformances in all regions. A particularly excitingdevelopment for the company was the launch of itsBrandWizard proprietary design system software.
Digital Brands
Omnicom established Communicade three yearsago to serve as a sub-holding company for ourinvestments in interactive, e-Commerce, digitaldesign and technology companies. In 1999, twoof our initial investments, AGENCY.com andRazorfish went public, and in early 2000, Organicand L90 issued their first public shares. SinceJanuary 1, 2000, we have significantly increased our investments in this high-growth area and
we presently own significant positions in public companies AGENCY.com, Organic, L90,AnswerThink and Razorfish. We also own positionsin Red Sky Interactive, DASH.com, Nuforia, PostCommunications, Replay TV, RecruitSoft, WML.com,and Critical Mass.
Several of these companies are featured on theperennial lists of top interactive agency brands. Forexample, Adweek named four Omnicom-affiliatedcompanies (AGENCY.com, Organic, Razorfish andRed Sky Interactive) to its annual Top 10 ranking ofinteractive agencies for 1999.
Among our internal digital initiatives, DDBDigital was launched by DDB in 1998 and BBDOformed @tmosphere Interactive in 1999. BernardHodes, our recruitment agency developed CareerMosaic internally, an online job search system, andCritical Mass aligned with Rapp Collins to form RappDigital, an interactive direct marketing company.
As our reputation for leadership in theinteractive/digital markets has grown, ourCommunicade team has seen a dramatic increase inthe number of business plans and investmentproposals we receive. Omnicom is widely regardedas the strategic and financial partner of choice by thecreative innovators in this fast-growing andimportant sector. Clearly the pace of investment inthis sector will remain robust.
A Balance For Future Growth
In summary, 1999 was a great year. It provedagain that Omnicom Group’s mix of businesses candeliver a consistently strong performance for ourshareholders. We matched our global financial andmarket leadership with global creative leadership.Our established brands are stronger than ever, yetour flexibility and capacity for change allows us tomove quickly to capture emerging opportunities.
Our goal is nothing less than to remain the finestand most admired professional services holdingcompany in the world. For that I will continue to relyon – and be grateful for – the entrepreneurial natureof our management teams and employees aroundthe world and the faith and confidence shown byour shareholders.
Thank you all for being the true foundation ofOmnicom Group.
John Wren
UNITED STATESSECURITIES AND EXCHANGE COMMISSION
Washington, D.C. 20549
FORM 10-K
[X] ANNUAL REPORT PURSUANT TO SECTION 13 OR 15(d) OF THE SECURITIESEXCHANGE ACT OF 1934For the fiscal year ended: December 31, 1999
OR
[ ] TRANSITION REPORT PURSUANT TO SECTION 13 OR 15(d) OF THESECURITIES EXCHANGE ACT OF 1934Commission File Number: 1-10551
OMNICOM GROUP INC.(Exact name of registrant as specified in its charter)
New York 13-1514814(State or other jurisdiction of (I.R.S. Employer Identification No.)incorporation or organization)
437 Madison Avenue, New York, NY 10022(Address of principal executive offices) (Zip Code)
Registrant’s telephone number, including area code: (212) 415-3600
Securities Registered Pursuant to Section 12(b) of the Act:
Name of each exchangeTitle of each class on which registered________________ _________________
Common Stock, $.50 Par Value New York Stock Exchange
Securities Registered Pursuant to Section 12(g) of the Act: NONE
Indicate by check mark whether the registrant (1) has filed all reports required to be filed by Section 13 or15(d) of the Securities Exchange Act of 1934 during the preceding 12 months (or for such shorter period that theregistrant was required to file such reports), and (2) has been subject to such filing requirements for the past90 days. Yes X No
Indicate by check mark if disclosure of delinquent filers pursuant to Item 405 of Regulations S-K is notcontained herein, and will not be contained, to the best of registrant’s knowledge, in the definitive proxy orinformation statements incorporated by reference in Part III of this Form 10-K or any amendment to this Form10-K. [X]
At March 15, 2000, there were 176,930,039 shares of Common Stock, $.50 par value, outstanding; theaggregate market value of the voting stock held by nonaffiliates at March 15, 2000 was approximately$14,351,645,000
DOCUMENTS INCORPORATED BY REFERENCE
Certain portions of the Registrant’s definitive proxy statement relating to its annual meeting of shareholdersscheduled to be held on May 16, 2000 are incorporated by reference into Part III of this Report.
OMNICOM GROUP INC.
Index to Annual Report on Form 10-K
Year Ended December 31, 1999
Page
PART I
Item 1. Business........................................................................................................................ 1Item 2. Properties...................................................................................................................... 3Item 3. Legal Proceedings ........................................................................................................ 3Item 4. Submission of Matters to a Vote of Security Holders ................................................ 3Supplemental Item. Executive Officers of the Registrant .......................................................... 4
PART II
Item 5. Market for Registrant’s Common Equity and Related Stockholder Matters .............. 5Item 6. Selected Financial Data................................................................................................ 5Item 7. Management’s Discussion and Analysis of Financial Condition and
Results of Operations .......................................................................................... 6Item 7A. Quantitative and Qualitative Disclosures About Market Risk .................................... 9Item 8. Financial Statements and Supplementary Data .......................................................... 9Item 9. Changes in and Disagreements with Accountants on Accounting and
Financial Disclosure ............................................................................................ 9
PART III
Item 10. Directors and Executive Officers of the Registrant .................................................... 10Item 11. Executive Compensation.............................................................................................. 10Item 12. Security Ownership of Certain Beneficial Owners and Management ........................ 10Item 13. Certain Relationships and Related Transactions .......................................................... 10
The information called for by Items 10, 11, 12 and 13, to the extent not included in this document, isincorporated herein by reference to such information to be included under the captions “Election ofDirectors,” “Common Stock Ownership of Management,” “Directors’ Compensation” and “ExecutiveCompensation,” in the Company’s definitive proxy statement which is expected to be filed by April 11, 2000.
PART IV
Item 14. Exhibits, Financial Statement Schedules, and Reports on Form 8-K ........................ 11
1
PART I
Item 1. Business
Omnicom Group Inc., through its wholly and partially-owned companies (hereinafter collectivelyreferred to as the “Company” or the “Omnicom Group”), provides corporate communications services toclients worldwide on a global, pan-regional, national and local basis. Operations cover the major regions ofNorth America, the United Kingdom, Germany, France, the remainder of Continental Europe, Latin America,the Far East, Australia, the Middle East and Africa. In both 1999 and 1998, approximately 50% of theOmnicom Group’s commissions and fees came from its non-U.S. operations. The corporate communicationsservices offered by the Company include advertising in various media such as television, radio, newspaper,magazines, outdoor and the internet, as well as public relations, specialty advertising, direct response andpromotional marketing, strategic media planning and buying, and internet and digital media development.
According to the unaudited industry-wide figures published in 1999 by the trade journal AdvertisingAge, the Omnicom Group was ranked as the largest advertising agency group worldwide.
Corporate Communications Services
The Omnicom Group companies provide a variety of advertising and marketing communicationservices to their clients, including: the creation and production of advertising, marketing consultation,strategic media planning and buying, financial and business-to-business advertising, directory advertising,healthcare communications, managed care consultancy, recruitment communications, branding consultancy,digital communications, contract publishing, design and image consultancy, direct/database marketing, fieldmarketing, integrated promotional marketing, public affairs, corporate and financial public relations,reputation management, sports and event marketing, telemarketing, and internet and digital mediadevelopment.
Brands
The above services are provided to clients through numerous worldwide, national and regionalindependent agency brands. These brands include, among others, BBDO Worldwide, DDB Worldwide,TBWA Worldwide, Abbott Mead Vickers, Adelphi Group, Alcone Marketing Group, Bernard HodesAdvertising, Brodeur Worldwide, Case•Dunlap, Clark & Weinstock, Claydon Heeley, CPM International,Diversified Healthcare Communications Group, Doremus & Company, Fleishman-Hillard, Gavin Anderson& Company, GMR Marketing, Goodby, Silverstein & Partners, GPC International, Griffin Bacal, GSD&M,Health & Medical Communications Group, Integer Group, Interbrand, InterOne Marketing Group, Ketchum,Ketchum Directory Advertising, M/A/R/C Inc., Martin-Williams, Merkley Newman Harty, Moss Dragoti,Optimum Media Direction, PhD, Porter Novelli International, Porter Novelli Convergence Group, RappCollins Worldwide, Steve Cram & Associates, TARGIS Healthcare Communications Worldwide, TheDesignory, TicToc, TLP, Inc., and Zimmerman & Partners Advertising. Additionally, through its wholly-owned subsidiary Communicade, the Company has minority equity investments in several interactivemarketing agencies, including: AGENCY.com, Ltd., Organic, Inc., Razorfish, Inc., Red Sky Interactive, Inc.,Critical Mass and AnswerThink Consulting Group, Inc.
Markets
The Omnicom Group agency brands provide services to their clients on a global, pan-regional, nationaland local basis. These agencies operate throughout the major cities of the United States and throughsubsidiaries and affiliates in Argentina, Australia, Austria, Belgium, Brazil, Bulgaria, Canada, Chile, China,Colombia, Costa Rica, Croatia, Cyprus, the Czech Republic, Denmark, Dominican Republic, Egypt, ElSalvador, Estonia, Finland, France, Germany, Greece, Guatemala, Honduras, Hong Kong, Hungary, India,Ireland, Israel, Italy, Japan, Kuwait, Latvia, Lebanon, Lithuania, Malaysia, Mexico, the Netherlands, NewZealand, Nicaragua, Norway, Panama, Peru, the Philippines, Poland, Portugal, Puerto Rico, Romania,Russia, Saudi Arabia, Singapore,the Slovak Republic, Slovenia, South Africa, South Korea, Spain, Sweden,Switzerland, Taiwan, Thailand, Turkey, the United Arab Emirates, the United Kingdom, Uruguay, Venezuelaand other countries around the world.
For financial information concerning domestic and foreign operations and segment reporting see Note 5 to the Consolidated Financial Statements.
2
Clients
The clients of the Omnicom Group include major consumer products, industrial, financial and serviceindustry companies, as well as smaller, pan-regional, national and local companies.
The Omnicom Group’s ten largest clients accounted for approximately 19% of 1999 commissions andfees. Twelve Omnicom Group agency brands provided services to the Company’s largest client, whichaccounted for approximately 5% of the 1999 commissions and fees.
Commissions and Fees
In most cases, fees are generated in lieu of commissions. Several different fee arrangements are useddepending on the client and individual agency. In general, fee charges relate to the cost of providing servicesplus a markup.
Commissions charged on media billings are not uniform and are negotiated with the client. Inaccordance with industry practice, the media source typically bills the agency for the time or space purchasedand the Omnicom Group companies bill their clients for this amount plus the commission.
Revenues are dependent upon the marketing requirements of clients and tend to be highest in the secondand fourth quarters of the calendar year.
Competitive Conditions
The Company’s business is highly competitive and accounts may shift agencies, usually on 90 days’notice. Clients may also reduce advertising and marketing budgets at any time. An agency’s ability tocompete for new clients is affected in some instances by the policy, which many advertisers and marketersfollow, of not permitting their agencies to represent competitive accounts in the same market. As a result,increasing size may limit an agency’s potential for securing certain new clients. In the vast majority of cases,however, the Omnicom Group’s consistent maintenance of separate, independent agency brands haveenabled the Company to represent competing clients.
The Omnicom Group agency brands have sought, and will seek, new business by showing potentialclients examples of advertising and marketing campaigns and by explaining the variety of related servicesoffered. The Omnicom Group competes in the United States and internationally with a multitude of fullservice and special service agencies. In addition to the usual risks of the Company’s business, internationaloperations are subject to the risk of currency exchange fluctuations, exchange control restrictions and toactions of governmental authorities.
Employees
The business success of the Omnicom Group is, and will continue to be, highly dependent upon theskills and creativity of its creative, research, media and account personnel and their relationships with clients.The Company believes its agencies have established reputations for creativity and marketing expertise whichattract, retain and stimulate talented personnel. There is substantial competition among advertising agenciesfor talented personnel and all agencies are vulnerable to adverse consequences from the loss of keyindividuals. Employees are generally not under employment contracts and are free to move to competitors.The Company believes that its compensation arrangements for its key employees, which in addition to basesalaries and performance bonuses may include stock options, restricted stock and retirement plans, are highlycompetitive with those of other advertising agencies. As of December 31, 1999, the Omnicom Group,excluding unconsolidated affiliates, employed approximately 43,000 persons, of which approximately 17,700were employed in the United States and approximately 25,300 were employed in its international offices.
Government Regulation
The Company’s business is subject to government regulation, both within and outside the United States.In the United States, federal, state and local governments and their agencies and various consumer groupshave directly or indirectly affected or attempted to affect the scope, content and manner of presentation ofadvertising. The continued activity by government and by consumer groups regarding advertising may causefurther change in domestic advertising practices in the coming years. While the Company is unable to
3
estimate the effect of these developments on its domestic business, management believes the total volume ofadvertising in general media in the United States will not be materially reduced due to future legislation orregulation, even though the scope, content and manner of presentation of advertising may be modified. Inaddition, the Company will continue to ensure that its management and operating personnel are aware of andare responsive to the possible implications of such developments.
Item 2. Properties
Substantially all of the Company’s offices are located in leased premises. The Company activelymanages its lease obligations and, where appropriate, consolidates its leased premises. Management has obtained subleases for most of the premises vacated. Where appropriate, management has establishedreserves for the difference between the cost of the leased premises that were vacated and anticipated sublease income.
Domestic
The Company’s corporate office occupies approximately 50,000 sq. ft. of space at 437 MadisonAvenue, New York, New York under a lease expiring in the year 2010.
Offices in Atlanta, Boston, Chicago, Coral Gables, Dallas, Detroit, Houston, Irvine, Kansas City, Los Angeles, Minneapolis, New York, Palo Alto, Philadelphia, Pittsburgh, San Francisco, San Jose, Seattle,Stamford, St. Louis and Washington D.C. and at various other locations occupy approximately an aggregateof 5,645,000 sq. ft. of space under leases with varying expiration dates.
International
The Company’s international subsidiaries and affiliates in Australia, Austria, Belgium, Brazil, Bulgaria,Canada, Chile, China, Croatia, the Czech Republic, Denmark, Estonia, Finland, France, Germany, Greece,Hong Kong, Hungary, India, Ireland, Italy, Japan, Latvia, Malaysia, Mexico, the Netherlands, New Zealand,Norway, the Philippines, Poland, Portugal, Puerto Rico, Romania, Singapore, the Slovak Republic, SouthAfrica, South Korea, Spain, Sweden, Switzerland, Taiwan, Thailand and the United Kingdom occupypremises under leases with various expiration dates.
Item 3. Legal Proceedings
The Company has no material pending legal proceedings, other than ordinary routine litigationincidental to its business.
Item 4. Submission of Matters to a Vote of Security Holders
No matters were submitted to a vote of security holders during the last quarter of 1999.
4
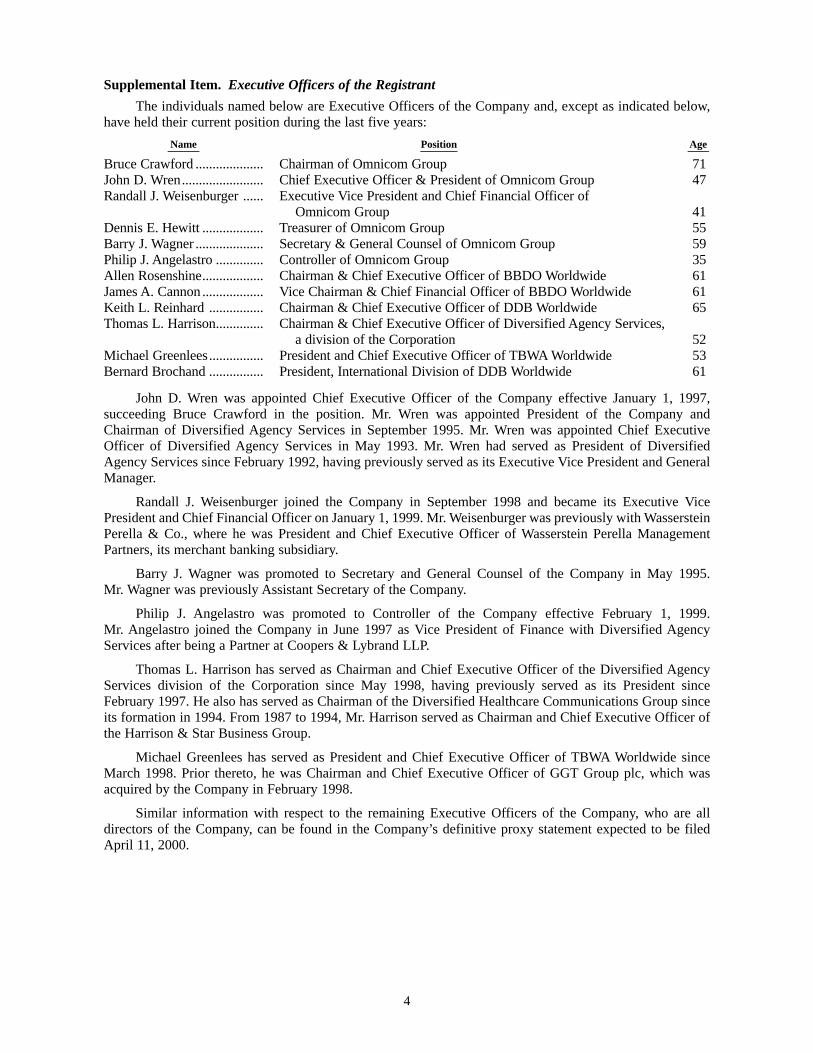
Supplemental Item. Executive Officers of the Registrant
The individuals named below are Executive Officers of the Company and, except as indicated below,have held their current position during the last five years:
Name Position Age______ _______ ____
Bruce Crawford .................... Chairman of Omnicom Group 71John D. Wren........................ Chief Executive Officer & President of Omnicom Group 47Randall J. Weisenburger ...... Executive Vice President and Chief Financial Officer of
Omnicom Group 41Dennis E. Hewitt .................. Treasurer of Omnicom Group 55Barry J. Wagner .................... Secretary & General Counsel of Omnicom Group 59Philip J. Angelastro .............. Controller of Omnicom Group 35Allen Rosenshine.................. Chairman & Chief Executive Officer of BBDO Worldwide 61James A. Cannon .................. Vice Chairman & Chief Financial Officer of BBDO Worldwide 61Keith L. Reinhard ................ Chairman & Chief Executive Officer of DDB Worldwide 65Thomas L. Harrison.............. Chairman & Chief Executive Officer of Diversified Agency Services,
a division of the Corporation 52Michael Greenlees................ President and Chief Executive Officer of TBWA Worldwide 53Bernard Brochand ................ President, International Division of DDB Worldwide 61
John D. Wren was appointed Chief Executive Officer of the Company effective January 1, 1997,succeeding Bruce Crawford in the position. Mr. Wren was appointed President of the Company andChairman of Diversified Agency Services in September 1995. Mr. Wren was appointed Chief ExecutiveOfficer of Diversified Agency Services in May 1993. Mr. Wren had served as President of DiversifiedAgency Services since February 1992, having previously served as its Executive Vice President and GeneralManager.
Randall J. Weisenburger joined the Company in September 1998 and became its Executive VicePresident and Chief Financial Officer on January 1, 1999. Mr. Weisenburger was previously with WassersteinPerella & Co., where he was President and Chief Executive Officer of Wasserstein Perella ManagementPartners, its merchant banking subsidiary.
Barry J. Wagner was promoted to Secretary and General Counsel of the Company in May 1995. Mr. Wagner was previously Assistant Secretary of the Company.
Philip J. Angelastro was promoted to Controller of the Company effective February 1, 1999. Mr. Angelastro joined the Company in June 1997 as Vice President of Finance with Diversified AgencyServices after being a Partner at Coopers & Lybrand LLP.
Thomas L. Harrison has served as Chairman and Chief Executive Officer of the Diversified AgencyServices division of the Corporation since May 1998, having previously served as its President sinceFebruary 1997. He also has served as Chairman of the Diversified Healthcare Communications Group sinceits formation in 1994. From 1987 to 1994, Mr. Harrison served as Chairman and Chief Executive Officer ofthe Harrison & Star Business Group.
Michael Greenlees has served as President and Chief Executive Officer of TBWA Worldwide sinceMarch 1998. Prior thereto, he was Chairman and Chief Executive Officer of GGT Group plc, which wasacquired by the Company in February 1998.
Similar information with respect to the remaining Executive Officers of the Company, who are alldirectors of the Company, can be found in the Company’s definitive proxy statement expected to be filedApril 11, 2000.
PART II
Item 5. Market for Registrant’s Common Equity and Related Stockholder Matters
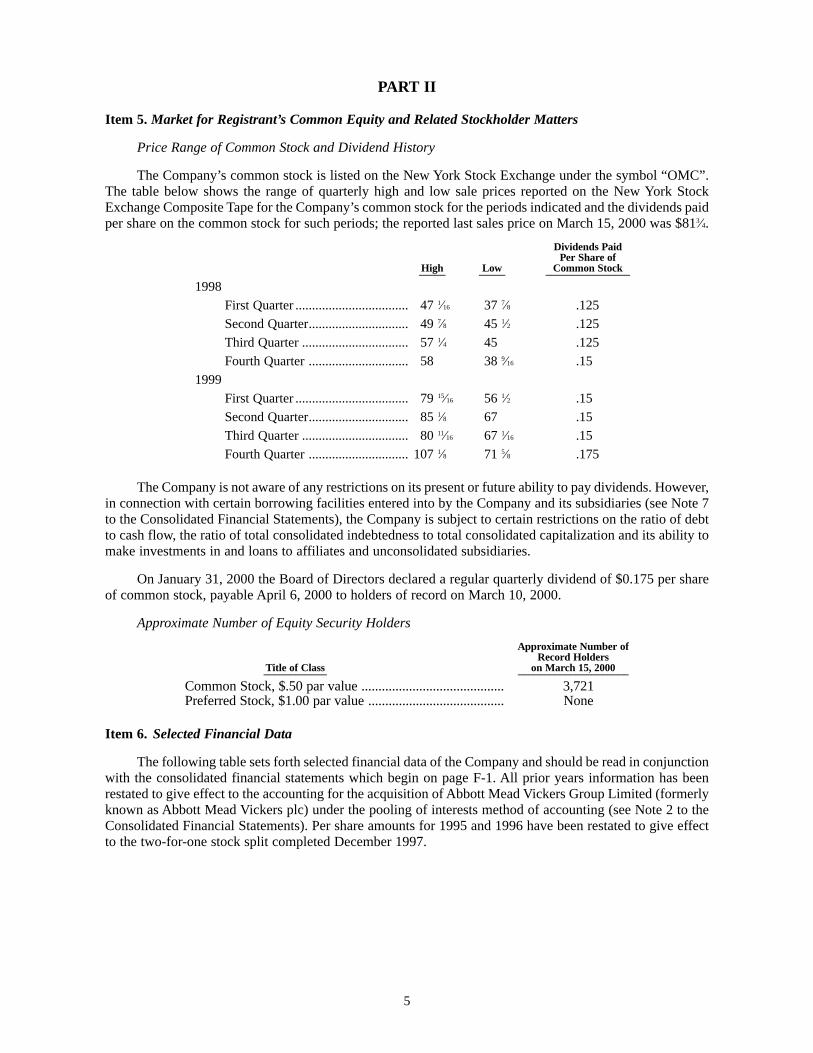
Price Range of Common Stock and Dividend History
The Company’s common stock is listed on the New York Stock Exchange under the symbol “OMC”.The table below shows the range of quarterly high and low sale prices reported on the New York StockExchange Composite Tape for the Company’s common stock for the periods indicated and the dividends paidper share on the common stock for such periods; the reported last sales price on March 15, 2000 was $813⁄4.
Dividends PaidPer Share of
High Low Common Stock_____ _____ ________________
1998
First Quarter .................................. 47 1⁄16 37 7⁄8 .125
Second Quarter.............................. 49 7⁄8 45 1⁄2 .125
Third Quarter ................................ 57 1⁄4 45 .125
Fourth Quarter .............................. 58 38 9⁄16 .15
1999
First Quarter .................................. 79 15⁄16 56 1⁄2 .15
Second Quarter.............................. 85 1⁄8 67 .15
Third Quarter ................................ 80 11⁄16 67 1⁄16 .15
Fourth Quarter .............................. 107 1⁄8 71 5⁄8 .175
The Company is not aware of any restrictions on its present or future ability to pay dividends. However,in connection with certain borrowing facilities entered into by the Company and its subsidiaries (see Note 7to the Consolidated Financial Statements), the Company is subject to certain restrictions on the ratio of debtto cash flow, the ratio of total consolidated indebtedness to total consolidated capitalization and its ability tomake investments in and loans to affiliates and unconsolidated subsidiaries.
On January 31, 2000 the Board of Directors declared a regular quarterly dividend of $0.175 per shareof common stock, payable April 6, 2000 to holders of record on March 10, 2000.
Approximate Number of Equity Security Holders
Approximate Number ofRecord Holders
Title of Class on March 15, 2000____________ _____________________
Common Stock, $.50 par value .......................................... 3,721Preferred Stock, $1.00 par value ........................................ None
Item 6. Selected Financial Data
The following table sets forth selected financial data of the Company and should be read in conjunctionwith the consolidated financial statements which begin on page F-1. All prior years information has beenrestated to give effect to the accounting for the acquisition of Abbott Mead Vickers Group Limited (formerlyknown as Abbott Mead Vickers plc) under the pooling of interests method of accounting (see Note 2 to theConsolidated Financial Statements). Per share amounts for 1995 and 1996 have been restated to give effectto the two-for-one stock split completed December 1997.
5
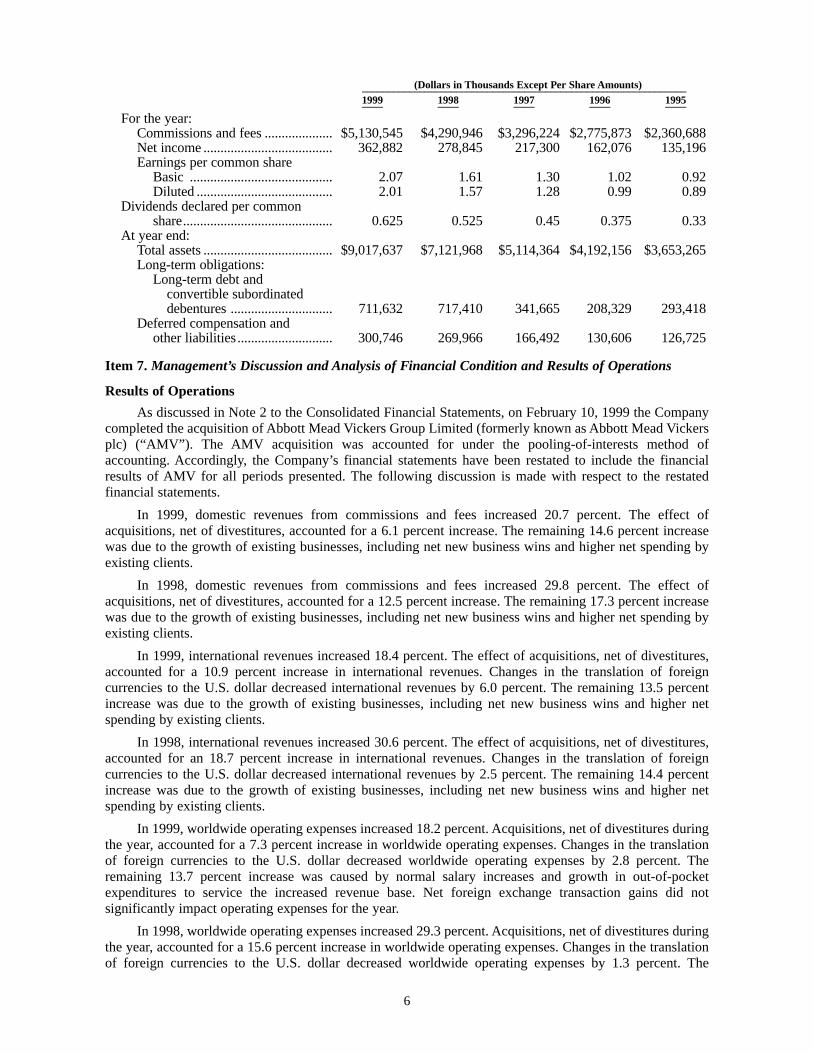
(Dollars in Thousands Except Per Share Amounts)______________________________________________________________1999 1998 1997 1996 1995________ ________ ________ ________ ________
For the year:Commissions and fees .................... $5,130,545 $4,290,946 $3,296,224 $2,775,873 $2,360,688Net income ...................................... 362,882 278,845 217,300 162,076 135,196Earnings per common share
Basic .......................................... 2.07 1.61 1.30 1.02 0.92Diluted ........................................ 2.01 1.57 1.28 0.99 0.89
Dividends declared per common share............................................ 0.625 0.525 0.45 0.375 0.33
At year end:Total assets ...................................... $9,017,637 $7,121,968 $5,114,364 $4,192,156 $3,653,265Long-term obligations:
Long-term debt and convertible subordinated debentures .............................. 711,632 717,410 341,665 208,329 293,418
Deferred compensation and other liabilities ............................ 300,746 269,966 166,492 130,606 126,725
Item 7. Management’s Discussion and Analysis of Financial Condition and Results of Operations
Results of Operations
As discussed in Note 2 to the Consolidated Financial Statements, on February 10, 1999 the Companycompleted the acquisition of Abbott Mead Vickers Group Limited (formerly known as Abbott Mead Vickersplc) (“AMV”). The AMV acquisition was accounted for under the pooling-of-interests method ofaccounting. Accordingly, the Company’s financial statements have been restated to include the financialresults of AMV for all periods presented. The following discussion is made with respect to the restatedfinancial statements.
In 1999, domestic revenues from commissions and fees increased 20.7 percent. The effect ofacquisitions, net of divestitures, accounted for a 6.1 percent increase. The remaining 14.6 percent increasewas due to the growth of existing businesses, including net new business wins and higher net spending byexisting clients.
In 1998, domestic revenues from commissions and fees increased 29.8 percent. The effect ofacquisitions, net of divestitures, accounted for a 12.5 percent increase. The remaining 17.3 percent increasewas due to the growth of existing businesses, including net new business wins and higher net spending byexisting clients.
In 1999, international revenues increased 18.4 percent. The effect of acquisitions, net of divestitures,accounted for a 10.9 percent increase in international revenues. Changes in the translation of foreigncurrencies to the U.S. dollar decreased international revenues by 6.0 percent. The remaining 13.5 percentincrease was due to the growth of existing businesses, including net new business wins and higher netspending by existing clients.
In 1998, international revenues increased 30.6 percent. The effect of acquisitions, net of divestitures,accounted for an 18.7 percent increase in international revenues. Changes in the translation of foreigncurrencies to the U.S. dollar decreased international revenues by 2.5 percent. The remaining 14.4 percentincrease was due to the growth of existing businesses, including net new business wins and higher netspending by existing clients.
In 1999, worldwide operating expenses increased 18.2 percent. Acquisitions, net of divestitures duringthe year, accounted for a 7.3 percent increase in worldwide operating expenses. Changes in the translationof foreign currencies to the U.S. dollar decreased worldwide operating expenses by 2.8 percent. Theremaining 13.7 percent increase was caused by normal salary increases and growth in out-of-pocketexpenditures to service the increased revenue base. Net foreign exchange transaction gains did notsignificantly impact operating expenses for the year.
In 1998, worldwide operating expenses increased 29.3 percent. Acquisitions, net of divestitures duringthe year, accounted for a 15.6 percent increase in worldwide operating expenses. Changes in the translationof foreign currencies to the U.S. dollar decreased worldwide operating expenses by 1.3 percent. The
6
remaining 15.0 percent increase was caused by normal salary increases and growth in out-of-pocketexpenditures to service the increased revenue base. Net foreign exchange transaction gains did notsignificantly impact operating expenses for the year.
Net interest expense in 1999 increased $10 million. This increase primarily reflects higher averageborrowings during the year and higher interest rates.
Net interest expense in 1998 increased $19.3 million. This increase primarily reflects higher averageborrowings during the year, resulting in part from the issuance of the 21⁄4º% Convertible SubordinatedDebentures and the 5.20% French Franc Notes, partially offset by the effect of higher average amounts ofcash and marketable securities invested during the year.
The 1999 effective tax rate decreased to 40.6 percent. The decrease reflects lower domestic andinternational effective tax rates.
The effective tax rate for 1998 decreased to 42.0 percent from 42.6 percent and primarily reflects lowereffective tax rates at the Company’s international subsidiaries.
In 1999, consolidated net income increased 30.1 percent. This increase was primarily the result ofrevenue growth and margin improvement, partially offset by a decrease in equity in affiliates and an increasein minority interest expense. In addition, in connection with the restatement of the prior year amounts,certain costs were recorded by AMV, including transaction costs associated with the merger. Operatingmargin, which excludes net interest expense, increased to 14.1 percent in 1999 from 13.1 percent in 1998,primarily as a result of greater growth in commission and fee revenue compared to the growth in operatingexpenses. Changes in the translation of foreign currencies to the U.S. dollar decreased consolidated netincome by 4.2 percent. The decrease in equity in affiliates in 1999 was primarily the result of the acquisitionof increased ownership interests in certain affiliates that resulted in their consolidation in the December 31,1999 financial statements, as well as lower aggregate profits by companies accounted for under the equitymethod. The increase in minority interest expense in 1999 was caused by higher earnings from companiesin which minority interests exists and an increase, as a result of acquisitions, in the number of consolidatedcompanies with a minority interest, including the conversion of certain affiliates into subsidiaries.
In 1998, consolidated net income increased 28.3 percent. This increase was the result of revenuegrowth and margin improvement, partially offset by a decrease in equity in affiliates and an increase inminority interest expense. Operating margin, which excludes net interest expense, increased to 13.1 percentin 1998 from 12.5 percent in 1997 as a result of greater growth in commission and fee revenue than thegrowth in operating expenses. Changes in the translation of foreign currencies to the U.S. dollar decreasedconsolidated net income by 1.9 percent. The decrease in equity in affiliates was primarily the result of theacquisition of increased ownership interests in certain affiliates that resulted in their consolidation in theDecember 31, 1998 financial statements, as well as lower aggregate profits by companies accounted forunder the equity method. The increase in minority interest expense was caused by higher earnings fromcompanies in which minority interests exist and an increase as a result of acquisitions during the year in thenumber of consolidated companies with a minority interest, including the conversion of certain affiliates intosubsidiaries.
At December 31, 1999, accounts receivable, net of allowance for doubtful accounts, increased by$667.0 million from December 31, 1998. At December 31, 1999, accounts payable increased by $746.9 million from December 31, 1998. These increases were primarily due to an increased volume ofactivity resulting from business growth and acquisitions during the year and, for accounts payable,differences in the timing of payments to media and other suppliers in 1999 as compared to 1998.
The Company is subject to the risk of currency exchange rate fluctuations related to its internationaloperations. This risk is generally limited to the net income of the operations as the revenues and expenses ofthe operations are generally denominated in the same currency. The Company or its international operationsmay in some cases enter into hedging transactions to minimize the risk of adverse currency exchange ratefluctuations. The Company’s major international markets are Brazil, Canada, the Euro currency countries,Japan and the United Kingdom.
As part of managing the Company’s exposures to currency exchange and market interest rates, theCompany periodically enters into derivative financial instruments. Derivative financial instruments aresubject to market and counterparty risk. Market risk is the potential for loss resulting from changes in market
7
conditions. The Company periodically determines the potential loss from market risk by performing a value-at-risk computation. Value-at-risk uses a statistical model that utilizes historic currency exchange and interestrate data to measure the potential impact on future earnings of the Company’s existing portfolio of derivativefinancial instruments. The value-at-risk analysis performed on the Company’s December 31, 1999 portfolioof derivative financial instruments indicated that the risk of loss was immaterial. Counterparty risk arisesfrom the inability of a counterparty to meet its obligations. To minimize counterparty risk, the Company onlyenters into derivative contracts with major well-known financial institutions that have credit ratings equal toor better than the Company’s.
The Company’s derivative activities are limited in volume and confined to risk management activitiesrelated to the Company’s worldwide operations. A reporting system is in place which evaluates the impacton the Company’s earnings resulting from changes in interest rates, currency exchange rates and otherrelevant market risks. This system is structured to enable senior management to initiate prompt remedialaction, if appropriate, and results are periodically reviewed with the Audit Committee.
At December 31, 1999 and 1998, the Company had forward foreign exchange contracts outstandingwith an aggregate notional principal amount of $893 million and $865 million, respectively, most of whichwere denominated in the Company’s major international market currencies. These contracts predominantlyhedge certain intercompany receivables and payables which are not recorded in the respective company’sfunctional currency. The terms of these contracts are generally three months or less.
At December 31, 1999, the Company had Japanese yen 16.3 billion aggregate notional principalamount of cross currency interest rate swaps. The swaps convert a portion of the Company’s U.S. dollarfloating rate debt into fixed rate Japanese yen debt and effectively hedge the Company’s net investment inJapanese yen denominated assets.
At December 31, 1999 and 1998, the Company had no other derivative contracts outstanding.
Year 2000 Issue
The Company did not experience any significant disruption to its operations related to computersystem programming failures or errors associated with the year 2000. The out-of-pocket costs incurred in1999 for its Year 2000 remediation program were not material to the consolidated results of operations forthe year ended December 31, 1999. These costs, substantially all of which were expensed, include third partyconsultants and the replacement and remediation of existing computer software and hardware. Such costs donot include internal management time, the effects of which were not material to the Company’s results ofoperations or financial condition.
Capital Resources and Liquidity
Cash and cash equivalents decreased $72.4 million during 1999 to $576.4 million at December 31,1999. The Company’s positive net cash flow provided by operating activities was maintained. After annualcash outlays for dividends paid to shareholders and minority interests and the repurchase of the Company’scommon stock, primarily for employee programs, the balance of the cash flow, together with the proceedsfrom the issuance of debt obligations, was used to fund acquisitions, make capital expenditures and repaydebt obligations.
The Company maintains two revolving credit facilities with a consortium of banks. One facility, for$500 million, expires June 30, 2003 and the other, for $750 million, expires April 28, 2000 (commitmentshave been delivered to extend this facility until April 28, 2001). Under the terms of these facilities theCompany may either borrow directly or issue commercial paper. During the year approximately $6,663million of commercial paper was issued and $6,584 million was redeemed. The average term of thecommercial paper was 21 days. At December 31, 1999, approximately $79 million of commercial paper wasoutstanding at interest rates ranging from 6.35% to 6.48%.
On June 24, 1998, the Company issued French Franc 1 billion (approximately $164 million at the June24, 1998 exchange rate) of 5.20% Notes with a scheduled maturity in 2005.
On March 4, 1998, the Company issued 4,000,000 shares of common stock for aggregate proceedsbefore expenses of $171 million.
8
On January 6, 1998, the Company issued $230 million of 21⁄4% Convertible Subordinated Debentureswith a scheduled maturity in 2013. The debentures are convertible into common stock of the Company at aconversion price of $49.83 per share subject to adjustment in certain events. Debenture holders have the rightto require the Company to redeem the debentures on January 6, 2004 at a price of 118.968%, or upon theoccurrence of a Fundamental Change, as defined in the indenture agreement, at the prevailing redemptionprice. The Company may redeem the debentures, as a whole or in part, on or after December 31, 2001initially at 112.841% and at increasing prices thereafter to 118.968% until January 6, 2004, and 100%thereafter. Unless the debentures are redeemed, repaid, or converted prior thereto, the debentures will matureon January 6, 2013 at their principal amount.
On January 3, 1997, the Company issued $218.5 million of 41⁄4% Convertible Subordinated Debentureswith a scheduled maturity in 2007. The debentures are convertible into common stock of the Company at aconversion price of $31.50 per share subject to adjustment in certain events. Debenture holders have the rightto require the Company to redeem the debentures on January 3, 2003 at a price of 112.418%, or upon theoccurrence of a Fundamental Change, as defined in the indenture agreement, at the prevailing redemptionprice. The Company may redeem the debentures, as a whole or in part, on or after December 29, 2000initially at 108.324% and at increasing prices thereafter to 112.418% until January 2, 2003, and 100%thereafter. Unless the debentures are redeemed, repaid or converted prior thereto, the debentures will matureon January 3, 2007 at their principal amount.
On March 1, 1996, the Company issued Deutsche Mark 100 million Floating Rate Bonds due March 1, 1999. The bonds matured on March 1, 1999 and were repaid at par. The bonds were unsecured,unsubordinated obligations of the Company and bore interest at a per annum rate equal to Deutsche Markthree month LIBOR plus 0.375%.
The Company maintains relationships with a number of banks worldwide, which have committed tolines of credit in amounts sufficient to meet the Company’s cash needs. At December 31, 1999, the Companyhad $1,420.9 million in such committed lines of credit, comprised of a $750 million unsecured revolvingcredit agreement expiring on April 28, 2000 and a $500 million unsecured revolving credit agreementexpiring June 30, 2003, as discussed above, and $170.9 million in lines of credit, principally outside of theUnited States. Of the $1,420.9 million in committed lines, $127.1 million were drawn at December 31, 1999.Management believes that the Company’s operating cash flow combined with its available lines of credit(including the expected renewal of the $750 million revolving line of credit) are sufficient to support itsforeseeable cash requirements including dividends, capital expenditures, acquisitions and maintenance ofworking capital.
Forward Looking Statements
This report contains disclosures which are forward-looking statements. Forward-looking statementsinclude all statements that do not relate solely to historical or current facts, and can be identified by the useof words such as “may,” “will,” “expect,” “project,” “estimate,” “anticipate,” “envisage,” “plan” or“continue.” These forward-looking statements are based upon the Company’s current plans or expectationsand are subject to a number of uncertainties and risks that could significantly affect current plans andanticipated actions and the Company’s future financial condition and results. The uncertainties and risksinclude, but are not limited to, general economic and business conditions; loss of significant customers;changes in levels of client advertising; the impact of competition; risks relating to acquisition activities; andthe complexity of integrated computer systems. As a consequence, current plans, anticipated actions andfuture financial condition and results may differ from those expressed in any forward-looking statementsmade by or on behalf of the Company.
Item 7A. Quantitative and Qualitative Disclosures About Market Risk
Information with respect to quantitative and qualitative disclosure about market risk is set forth underItem 7 in Part II of this Form 10-K.
Item 8. Financial Statements and Supplementary Data
The financial statements and supplementary data required by this item appear beginning on page F-1.
Item 9. Changes in and Disagreements with Accountants on Accounting and Financial Disclosure
None.
9
PART III
Item 10. Directors and Executive Officers of the Registrant
Information with respect to the directors of the Company and compliance with Section 16 rules isincorporated by reference to the Company’s definitive proxy statement expected to be filed by April 11,2000. Information regarding the Company’s executive officers is set forth under the Supplemental Item inPart I of this Form 10-K.
Item 11. Executive Compensation
Incorporated by reference to the Company’s definitive proxy statement expected to be filed by April 11, 2000.
Item 12. Security Ownership of Certain Beneficial Owners and Management
Incorporated by reference to the Company’s definitive proxy statement expected to be filed by April 11, 2000.
Item 13. Certain Relationships and Related Transactions
Incorporated by reference to the Company’s definitive proxy statement expected to be filed by April 11, 2000.
10
PART IV
Item 14. Exhibits, Financial Statement Schedules, and Reports on Form 8-K
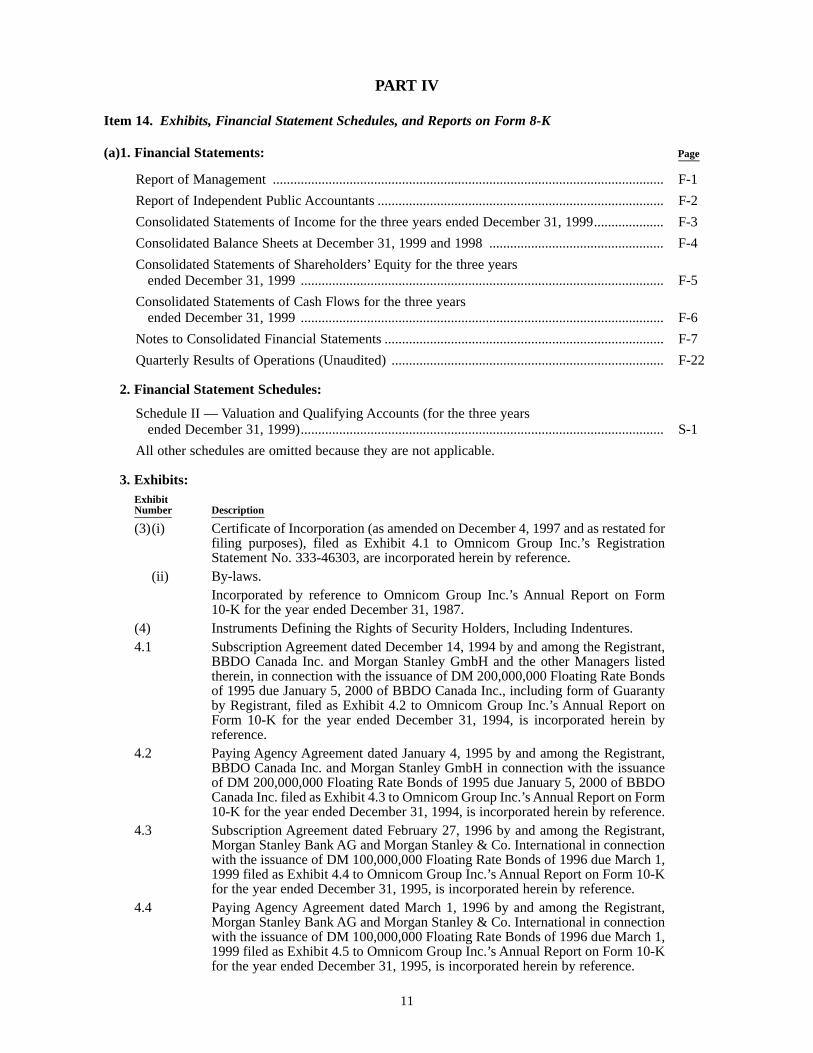
(a)1. Financial Statements: Page____
Report of Management ................................................................................................................ F-1
Report of Independent Public Accountants .................................................................................. F-2
Consolidated Statements of Income for the three years ended December 31, 1999.................... F-3
Consolidated Balance Sheets at December 31, 1999 and 1998 .................................................. F-4
Consolidated Statements of Shareholders’ Equity for the three years ended December 31, 1999 ........................................................................................................ F-5
Consolidated Statements of Cash Flows for the three years ended December 31, 1999 ........................................................................................................ F-6
Notes to Consolidated Financial Statements ................................................................................ F-7
Quarterly Results of Operations (Unaudited) .............................................................................. F-22
2. Financial Statement Schedules:
Schedule II — Valuation and Qualifying Accounts (for the three years ended December 31, 1999)........................................................................................................ S-1
All other schedules are omitted because they are not applicable.
3. Exhibits:ExhibitNumber Description_______ __________
(3)(i) Certificate of Incorporation (as amended on December 4, 1997 and as restated forfiling purposes), filed as Exhibit 4.1 to Omnicom Group Inc.’s RegistrationStatement No. 333-46303, are incorporated herein by reference.
(ii) By-laws.Incorporated by reference to Omnicom Group Inc.’s Annual Report on Form10-K for the year ended December 31, 1987.
(4) Instruments Defining the Rights of Security Holders, Including Indentures.4.1 Subscription Agreement dated December 14, 1994 by and among the Registrant,
BBDO Canada Inc. and Morgan Stanley GmbH and the other Managers listedtherein, in connection with the issuance of DM 200,000,000 Floating Rate Bondsof 1995 due January 5, 2000 of BBDO Canada Inc., including form of Guarantyby Registrant, filed as Exhibit 4.2 to Omnicom Group Inc.’s Annual Report onForm 10-K for the year ended December 31, 1994, is incorporated herein byreference.
4.2 Paying Agency Agreement dated January 4, 1995 by and among the Registrant,BBDO Canada Inc. and Morgan Stanley GmbH in connection with the issuanceof DM 200,000,000 Floating Rate Bonds of 1995 due January 5, 2000 of BBDOCanada Inc. filed as Exhibit 4.3 to Omnicom Group Inc.’s Annual Report on Form10-K for the year ended December 31, 1994, is incorporated herein by reference.
4.3 Subscription Agreement dated February 27, 1996 by and among the Registrant,Morgan Stanley Bank AG and Morgan Stanley & Co. International in connectionwith the issuance of DM 100,000,000 Floating Rate Bonds of 1996 due March 1,1999 filed as Exhibit 4.4 to Omnicom Group Inc.’s Annual Report on Form 10-Kfor the year ended December 31, 1995, is incorporated herein by reference.
4.4 Paying Agency Agreement dated March 1, 1996 by and among the Registrant,Morgan Stanley Bank AG and Morgan Stanley & Co. International in connectionwith the issuance of DM 100,000,000 Floating Rate Bonds of 1996 due March 1,1999 filed as Exhibit 4.5 to Omnicom Group Inc.’s Annual Report on Form 10-Kfor the year ended December 31, 1995, is incorporated herein by reference.
11
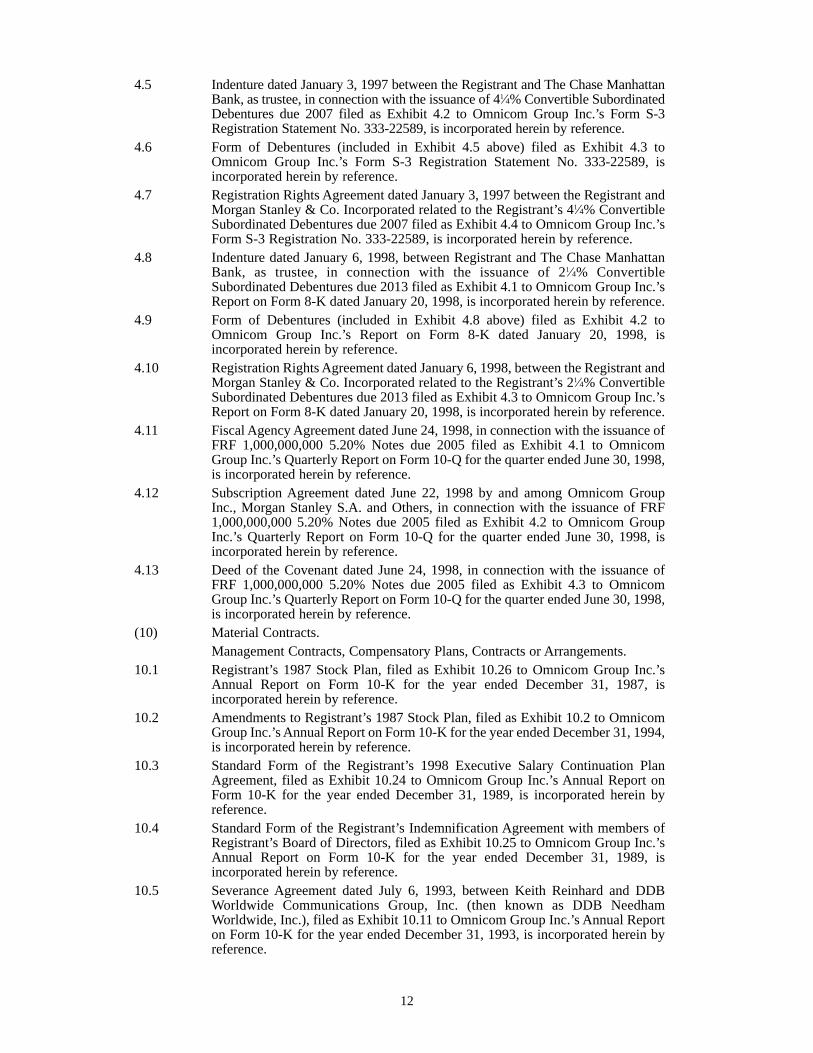
4.5 Indenture dated January 3, 1997 between the Registrant and The Chase ManhattanBank, as trustee, in connection with the issuance of 41⁄4% Convertible SubordinatedDebentures due 2007 filed as Exhibit 4.2 to Omnicom Group Inc.’s Form S-3Registration Statement No. 333-22589, is incorporated herein by reference.
4.6 Form of Debentures (included in Exhibit 4.5 above) filed as Exhibit 4.3 toOmnicom Group Inc.’s Form S-3 Registration Statement No. 333-22589, isincorporated herein by reference.
4.7 Registration Rights Agreement dated January 3, 1997 between the Registrant andMorgan Stanley & Co. Incorporated related to the Registrant’s 41⁄4% ConvertibleSubordinated Debentures due 2007 filed as Exhibit 4.4 to Omnicom Group Inc.’sForm S-3 Registration No. 333-22589, is incorporated herein by reference.
4.8 Indenture dated January 6, 1998, between Registrant and The Chase ManhattanBank, as trustee, in connection with the issuance of 21⁄4% ConvertibleSubordinated Debentures due 2013 filed as Exhibit 4.1 to Omnicom Group Inc.’sReport on Form 8-K dated January 20, 1998, is incorporated herein by reference.
4.9 Form of Debentures (included in Exhibit 4.8 above) filed as Exhibit 4.2 toOmnicom Group Inc.’s Report on Form 8-K dated January 20, 1998, isincorporated herein by reference.
4.10 Registration Rights Agreement dated January 6, 1998, between the Registrant andMorgan Stanley & Co. Incorporated related to the Registrant’s 21⁄4% ConvertibleSubordinated Debentures due 2013 filed as Exhibit 4.3 to Omnicom Group Inc.’sReport on Form 8-K dated January 20, 1998, is incorporated herein by reference.
4.11 Fiscal Agency Agreement dated June 24, 1998, in connection with the issuance ofFRF 1,000,000,000 5.20% Notes due 2005 filed as Exhibit 4.1 to OmnicomGroup Inc.’s Quarterly Report on Form 10-Q for the quarter ended June 30, 1998,is incorporated herein by reference.
4.12 Subscription Agreement dated June 22, 1998 by and among Omnicom GroupInc., Morgan Stanley S.A. and Others, in connection with the issuance of FRF1,000,000,000 5.20% Notes due 2005 filed as Exhibit 4.2 to Omnicom GroupInc.’s Quarterly Report on Form 10-Q for the quarter ended June 30, 1998, isincorporated herein by reference.
4.13 Deed of the Covenant dated June 24, 1998, in connection with the issuance ofFRF 1,000,000,000 5.20% Notes due 2005 filed as Exhibit 4.3 to OmnicomGroup Inc.’s Quarterly Report on Form 10-Q for the quarter ended June 30, 1998,is incorporated herein by reference.
(10) Material Contracts.Management Contracts, Compensatory Plans, Contracts or Arrangements.
10.1 Registrant’s 1987 Stock Plan, filed as Exhibit 10.26 to Omnicom Group Inc.’sAnnual Report on Form 10-K for the year ended December 31, 1987, isincorporated herein by reference.
10.2 Amendments to Registrant’s 1987 Stock Plan, filed as Exhibit 10.2 to OmnicomGroup Inc.’s Annual Report on Form 10-K for the year ended December 31, 1994,is incorporated herein by reference.
10.3 Standard Form of the Registrant’s 1998 Executive Salary Continuation PlanAgreement, filed as Exhibit 10.24 to Omnicom Group Inc.’s Annual Report onForm 10-K for the year ended December 31, 1989, is incorporated herein byreference.
10.4 Standard Form of the Registrant’s Indemnification Agreement with members ofRegistrant’s Board of Directors, filed as Exhibit 10.25 to Omnicom Group Inc.’sAnnual Report on Form 10-K for the year ended December 31, 1989, isincorporated herein by reference.
10.5 Severance Agreement dated July 6, 1993, between Keith Reinhard and DDBWorldwide Communications Group, Inc. (then known as DDB NeedhamWorldwide, Inc.), filed as Exhibit 10.11 to Omnicom Group Inc.’s Annual Reporton Form 10-K for the year ended December 31, 1993, is incorporated herein byreference.
12
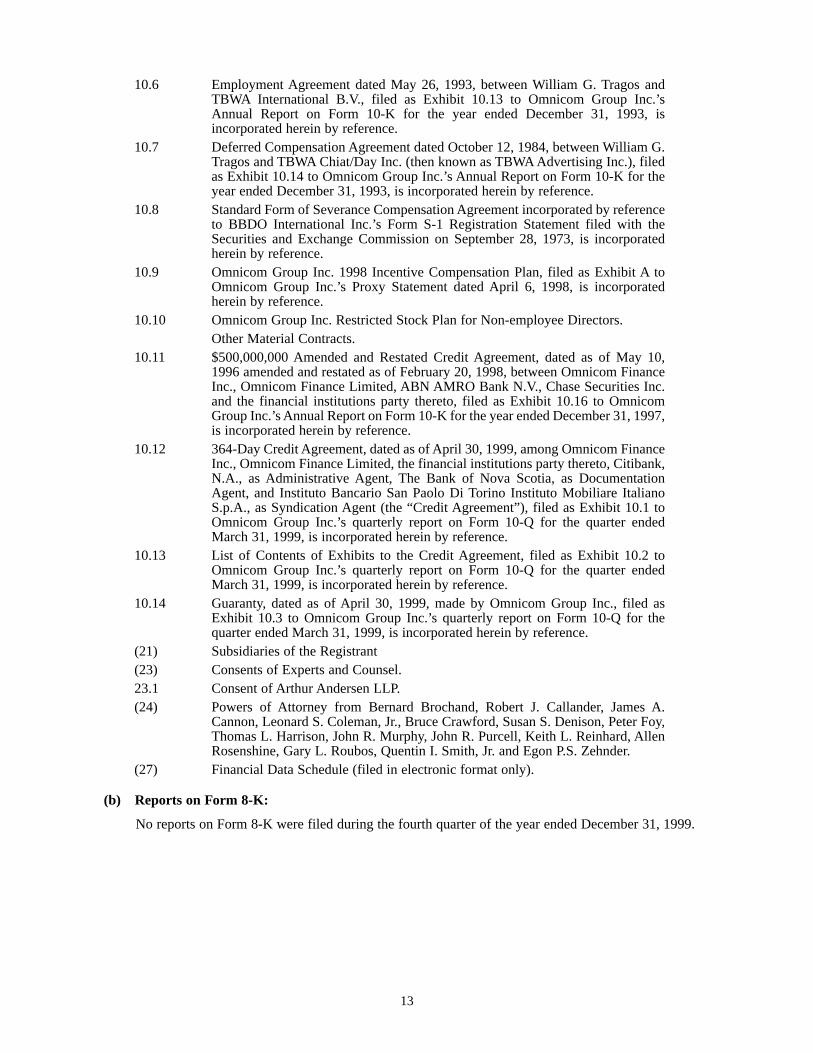
10.6 Employment Agreement dated May 26, 1993, between William G. Tragos andTBWA International B.V., filed as Exhibit 10.13 to Omnicom Group Inc.’sAnnual Report on Form 10-K for the year ended December 31, 1993, isincorporated herein by reference.
10.7 Deferred Compensation Agreement dated October 12, 1984, between William G.Tragos and TBWA Chiat/Day Inc. (then known as TBWA Advertising Inc.), filedas Exhibit 10.14 to Omnicom Group Inc.’s Annual Report on Form 10-K for theyear ended December 31, 1993, is incorporated herein by reference.
10.8 Standard Form of Severance Compensation Agreement incorporated by referenceto BBDO International Inc.’s Form S-1 Registration Statement filed with theSecurities and Exchange Commission on September 28, 1973, is incorporatedherein by reference.
10.9 Omnicom Group Inc. 1998 Incentive Compensation Plan, filed as Exhibit A toOmnicom Group Inc.’s Proxy Statement dated April 6, 1998, is incorporatedherein by reference.
10.10 Omnicom Group Inc. Restricted Stock Plan for Non-employee Directors.Other Material Contracts.
10.11 $500,000,000 Amended and Restated Credit Agreement, dated as of May 10,1996 amended and restated as of February 20, 1998, between Omnicom FinanceInc., Omnicom Finance Limited, ABN AMRO Bank N.V., Chase Securities Inc.and the financial institutions party thereto, filed as Exhibit 10.16 to OmnicomGroup Inc.’s Annual Report on Form 10-K for the year ended December 31, 1997,is incorporated herein by reference.
10.12 364-Day Credit Agreement, dated as of April 30, 1999, among Omnicom FinanceInc., Omnicom Finance Limited, the financial institutions party thereto, Citibank,N.A., as Administrative Agent, The Bank of Nova Scotia, as DocumentationAgent, and Instituto Bancario San Paolo Di Torino Instituto Mobiliare ItalianoS.p.A., as Syndication Agent (the “Credit Agreement”), filed as Exhibit 10.1 toOmnicom Group Inc.’s quarterly report on Form 10-Q for the quarter endedMarch 31, 1999, is incorporated herein by reference.
10.13 List of Contents of Exhibits to the Credit Agreement, filed as Exhibit 10.2 toOmnicom Group Inc.’s quarterly report on Form 10-Q for the quarter endedMarch 31, 1999, is incorporated herein by reference.
10.14 Guaranty, dated as of April 30, 1999, made by Omnicom Group Inc., filed asExhibit 10.3 to Omnicom Group Inc.’s quarterly report on Form 10-Q for thequarter ended March 31, 1999, is incorporated herein by reference.
(21) Subsidiaries of the Registrant(23) Consents of Experts and Counsel.23.1 Consent of Arthur Andersen LLP.(24) Powers of Attorney from Bernard Brochand, Robert J. Callander, James A.
Cannon, Leonard S. Coleman, Jr., Bruce Crawford, Susan S. Denison, Peter Foy,Thomas L. Harrison, John R. Murphy, John R. Purcell, Keith L. Reinhard, AllenRosenshine, Gary L. Roubos, Quentin I. Smith, Jr. and Egon P.S. Zehnder.
(27) Financial Data Schedule (filed in electronic format only).
(b) Reports on Form 8-K:
No reports on Form 8-K were filed during the fourth quarter of the year ended December 31, 1999.
13
14
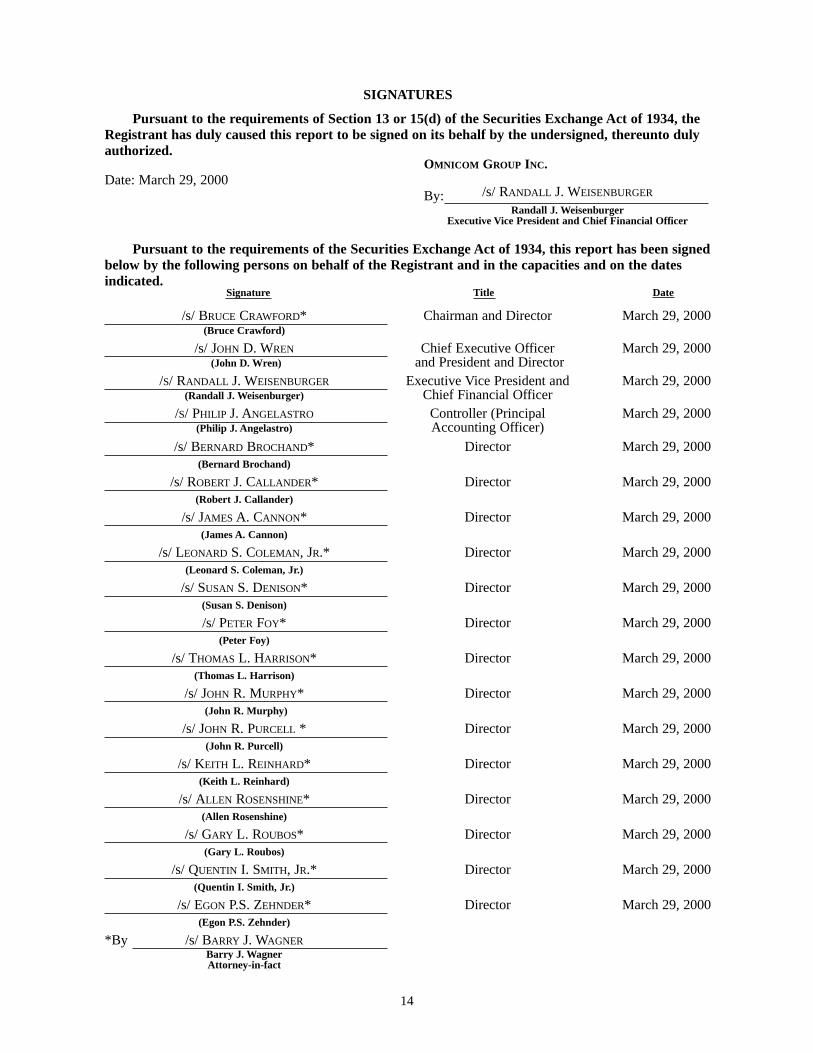
SIGNATURES
Pursuant to the requirements of Section 13 or 15(d) of the Securities Exchange Act of 1934, theRegistrant has duly caused this report to be signed on its behalf by the undersigned, thereunto dulyauthorized.
OMNICOM GROUP INC.Date: March 29, 2000
By: /s/ RANDALL J. WEISENBURGER
Randall J. WeisenburgerExecutive Vice President and Chief Financial Officer
Pursuant to the requirements of the Securities Exchange Act of 1934, this report has been signedbelow by the following persons on behalf of the Registrant and in the capacities and on the datesindicated.
Signature Title Date
/s/ BRUCE CRAWFORD* Chairman and Director March 29, 2000(Bruce Crawford)
/s/ JOHN D. WREN Chief Executive Officer March 29, 2000(John D. Wren) and President and Director
/S/ RANDALL J. WEISENBURGER Executive Vice President and March 29, 2000(Randall J. Weisenburger) Chief Financial Officer
/S/ PHILIP J. ANGELASTRO Controller (Principal March 29, 2000(Philip J. Angelastro) Accounting Officer)
/s/ BERNARD BROCHAND* Director March 29, 2000(Bernard Brochand)
/s/ ROBERT J. CALLANDER* Director March 29, 2000(Robert J. Callander)
/s/ JAMES A. CANNON* Director March 29, 2000(James A. Cannon)
/s/ LEONARD S. COLEMAN, JR.* Director March 29, 2000(Leonard S. Coleman, Jr.)
/s/ SUSAN S. DENISON* Director March 29, 2000(Susan S. Denison)
/s/ PETER FOY* Director March 29, 2000(Peter Foy)
/s/ THOMAS L. HARRISON* Director March 29, 2000(Thomas L. Harrison)
/s/ JOHN R. MURPHY* Director March 29, 2000(John R. Murphy)
/s/ JOHN R. PURCELL * Director March 29, 2000(John R. Purcell)
/s/ KEITH L. REINHARD* Director March 29, 2000(Keith L. Reinhard)
/s/ ALLEN ROSENSHINE* Director March 29, 2000(Allen Rosenshine)
/s/ GARY L. ROUBOS* Director March 29, 2000(Gary L. Roubos)
/s/ QUENTIN I. SMITH, JR.* Director March 29, 2000(Quentin I. Smith, Jr.)
/s/ EGON P.S. ZEHNDER* Director March 29, 2000(Egon P.S. Zehnder)
*By /s/ BARRY J. WAGNERBarry J. WagnerAttorney-in-fact
F-1
REPORT OF MANAGEMENT
The management of Omnicom Group Inc. is responsible for the integrity of the financial data reportedby the Company and its subsidiaries. Management uses its best judgment to ensure that the financial statements present fairly, in all material respects, the consolidated financial position and results of operationsof Omnicom Group Inc. and subsidiaries. These financial statements have been prepared in accordance withgenerally accepted accounting principles.
The system of internal controls of the Company, augmented by a program of internal audits, is designedto provide reasonable assurance that assets are safeguarded and records are maintained to substantiate thepreparation of accurate financial information. Underlying this concept of reasonable assurance is the premisethat the cost of control should not exceed the benefits derived therefrom.
The financial statements have been audited by independent public accountants. Their report expressesan independent informed judgment as to the fairness of management’s reported operating results, cash flowsand financial position. This judgment is based on the procedures described in the second paragraph of theirreport.
The Audit Committee meets periodically with representatives of financial management, internal auditand the independent public accountants to assure that each is properly discharging their responsibilities. Additionally, the Audit Committee met periodically to review progress against the Company’s Year 2000readiness plan. In order to ensure complete independence, the Audit Committee communicates directly andseparately with the independent public accountants, internal audit and financial management to discuss theresults of their audits, the adequacy of internal accounting controls and the quality of financial reporting.
JOHN D. WREN RANDALL J. WEISENBURGER________________________________________ _________________________________________John D. Wren Randall J. Weisenburger
Chief Executive Officer and President Executive Vice President and Chief Financial Officer
F-2
REPORT OF INDEPENDENT PUBLIC ACCOUNTANTS
To the Board of Directors and Shareholders of Omnicom Group Inc.:
We have audited the accompanying consolidated balance sheets of Omnicom Group Inc. (a New Yorkcorporation) and subsidiaries as of December 31, 1999 and 1998, and related consolidated statements ofincome, shareholders’ equity, and cash flows for each of the three years in the period ended December 31,1999. These consolidated financial statements and the schedule referred to below are the responsibility of the Company’s management. Our responsibility is to express an opinion on these consolidated financialstatements and schedule based on our audits.
We conducted our audits in accordance with auditing standards generally accepted in the United States.Those standards require that we plan and perform the audit to obtain reasonable assurance about whether thefinancial statements are free of material misstatement. An audit includes examining, on a test basis, evidencesupporting the amounts and disclosures in the financial statements. An audit also includes assessing theaccounting principles used and significant estimates made by management, as well as evaluating the overallfinancial statement presentation. We believe that our audits provide a reasonable basis for our opinion.
In our opinion, the financial statements referred to above present fairly, in all material respects, thefinancial position of Omnicom Group Inc. and subsidiaries as of December 31, 1999 and 1998, and the resultsof their operations and their cash flows for each of the three years in the period ended December 31, 1999 inconformity with accounting principles generally accepted in the United States.
Our audits were made for the purpose of forming an opinion on the basic financial statements taken asa whole. The schedule on page S-1 is presented for purposes of complying with the Securities and ExchangeCommission’s rules and is not part of the basic financial statements. This schedule has been subjected to theauditing procedures applied in the audits of the basic financial statements and, in our opinion, fairly states in all material respects the financial data required to be set forth therein in relation to the basic financial statements taken as a whole.
ARTHUR ANDERSEN LLP
New York, New YorkFebruary 17, 2000
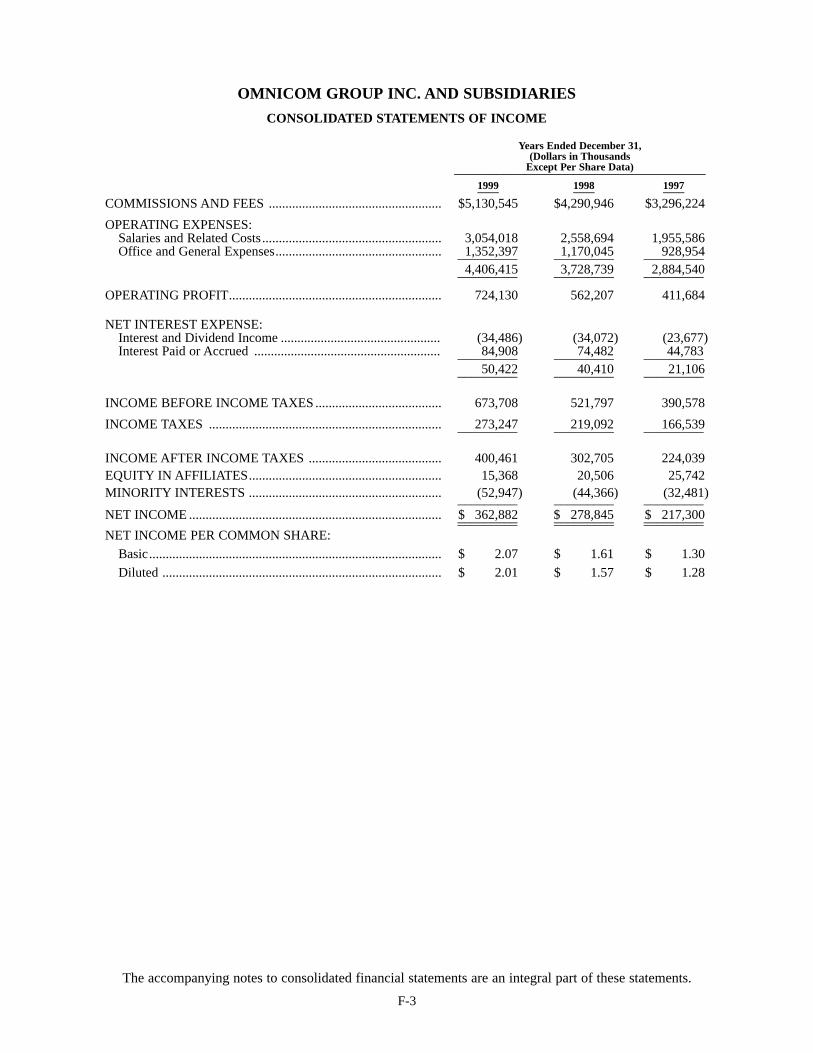
Years Ended December 31,(Dollars in Thousands
Except Per Share Data)____________________________________1999 1998 1997____ ____ ____
COMMISSIONS AND FEES .................................................... $5,130,545 $4,290,946 $3,296,224
OPERATING EXPENSES:Salaries and Related Costs...................................................... 3,054,018 2,558,694 1,955,586Office and General Expenses.................................................. 1,352,397 1,170,045 928,954_________ _________ _________
4,406,415 3,728,739 2,884,540_________ _________ _________
OPERATING PROFIT................................................................ 724,130 562,207 411,684
NET INTEREST EXPENSE:Interest and Dividend Income ................................................ (34,486) (34,072) (23,677)Interest Paid or Accrued ........................................................ 84,908 74,482 44,783_________ _________ _________
50,422 40,410 21,106_________ _________ _________
INCOME BEFORE INCOME TAXES ...................................... 673,708 521,797 390,578
INCOME TAXES ...................................................................... 273,247 219,092 166,539_________ _________ _________
INCOME AFTER INCOME TAXES ........................................ 400,461 302,705 224,039EQUITY IN AFFILIATES.......................................................... 15,368 20,506 25,742MINORITY INTERESTS .......................................................... (52,947) (44,366) (32,481)_________ _________ _________NET INCOME ............................................................................ $ 362,882 $ 278,845 $ 217,300_________ _________ __________________ _________ _________NET INCOME PER COMMON SHARE:
Basic........................................................................................ $ 2.07 $ 1.61 $ 1.30
Diluted .................................................................................... $ 2.01 $ 1.57 $ 1.28
The accompanying notes to consolidated financial statements are an integral part of these statements.
OMNICOM GROUP INC. AND SUBSIDIARIES
CONSOLIDATED STATEMENTS OF INCOME
F-3
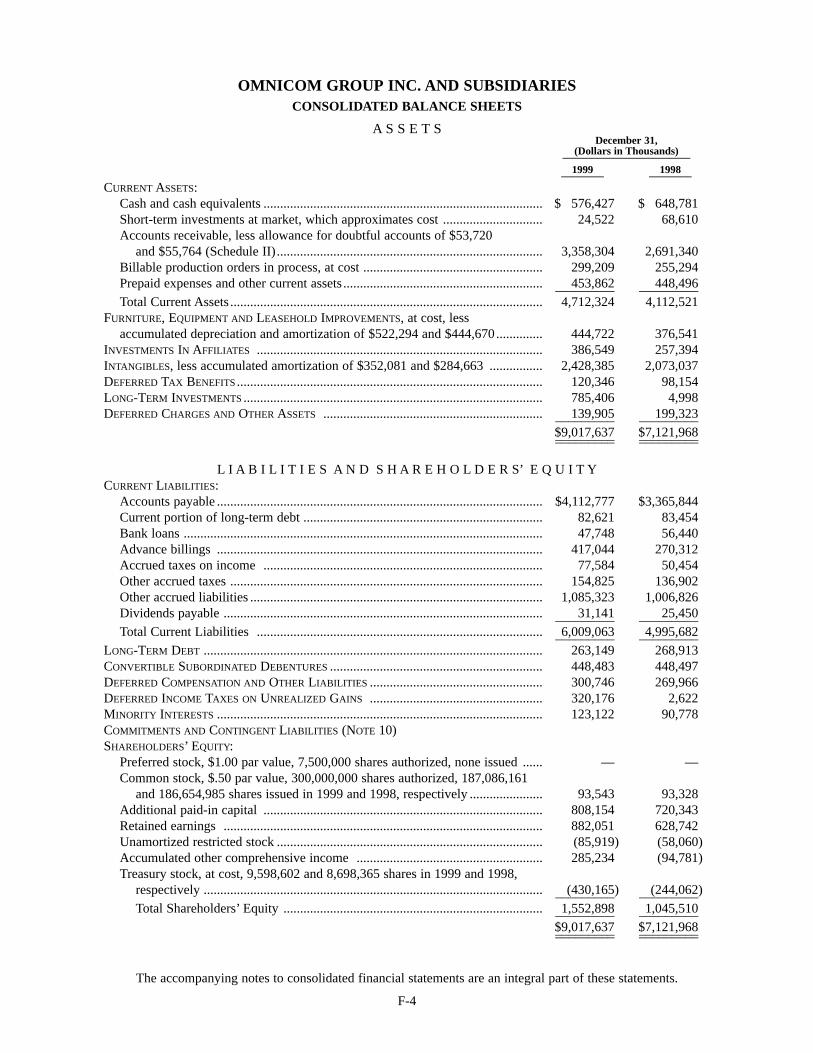
F-4
The accompanying notes to consolidated financial statements are an integral part of these statements.
OMNICOM GROUP INC. AND SUBSIDIARIES CONSOLIDATED BALANCE SHEETS
A S S E T S December 31,
(Dollars in Thousands)________________________
1999 1998________ ________
CURRENT ASSETS:Cash and cash equivalents .................................................................................... $ 576,427 $ 648,781Short-term investments at market, which approximates cost .............................. 24,522 68,610Accounts receivable, less allowance for doubtful accounts of $53,720
and $55,764 (Schedule II)................................................................................ 3,358,304 2,691,340Billable production orders in process, at cost ...................................................... 299,209 255,294Prepaid expenses and other current assets ............................................................ 453,862 448,496_________ _________Total Current Assets .............................................................................................. 4,712,324 4,112,521
FURNITURE, EQUIPMENT AND LEASEHOLD IMPROVEMENTS, at cost, lessaccumulated depreciation and amortization of $522,294 and $444,670.............. 444,722 376,541
INVESTMENTS IN AFFILIATES ...................................................................................... 386,549 257,394INTANGIBLES, less accumulated amortization of $352,081 and $284,663 ................ 2,428,385 2,073,037DEFERRED TAX BENEFITS ............................................................................................ 120,346 98,154LONG-TERM INVESTMENTS .......................................................................................... 785,406 4,998DEFERRED CHARGES AND OTHER ASSETS .................................................................. 139,905 199,323_________ _________
$9,017,637 $7,121,968_________ __________________ _________
L I A B I L I T I E S A N D S H A R E H O L D E R S’ E Q U I T YCURRENT LIABILITIES:
Accounts payable .................................................................................................. $4,112,777 $3,365,844Current portion of long-term debt ........................................................................ 82,621 83,454Bank loans ............................................................................................................ 47,748 56,440Advance billings .................................................................................................. 417,044 270,312Accrued taxes on income .................................................................................... 77,584 50,454Other accrued taxes .............................................................................................. 154,825 136,902Other accrued liabilities ........................................................................................ 1,085,323 1,006,826Dividends payable ................................................................................................ 31,141 25,450_________ _________Total Current Liabilities ...................................................................................... 6,009,063 4,995,682_________ _________
LONG-TERM DEBT ...................................................................................................... 263,149 268,913CONVERTIBLE SUBORDINATED DEBENTURES ................................................................ 448,483 448,497DEFERRED COMPENSATION AND OTHER LIABILITIES .................................................... 300,746 269,966DEFERRED INCOME TAXES ON UNREALIZED GAINS .................................................... 320,176 2,622MINORITY INTERESTS .................................................................................................. 123,122 90,778COMMITMENTS AND CONTINGENT LIABILITIES (NOTE 10)SHAREHOLDERS’ EQUITY:
Preferred stock, $1.00 par value, 7,500,000 shares authorized, none issued ...... — —Common stock, $.50 par value, 300,000,000 shares authorized, 187,086,161
and 186,654,985 shares issued in 1999 and 1998, respectively ...................... 93,543 93,328Additional paid-in capital .................................................................................... 808,154 720,343Retained earnings ................................................................................................ 882,051 628,742Unamortized restricted stock ................................................................................ (85,919) (58,060)Accumulated other comprehensive income ........................................................ 285,234 (94,781)Treasury stock, at cost, 9,598,602 and 8,698,365 shares in 1999 and 1998,
respectively ...................................................................................................... (430,165) (244,062)_________ _________Total Shareholders’ Equity .............................................................................. 1,552,898 1,045,510_________ _________
$9,017,637 $7,121,968_________ __________________ _________
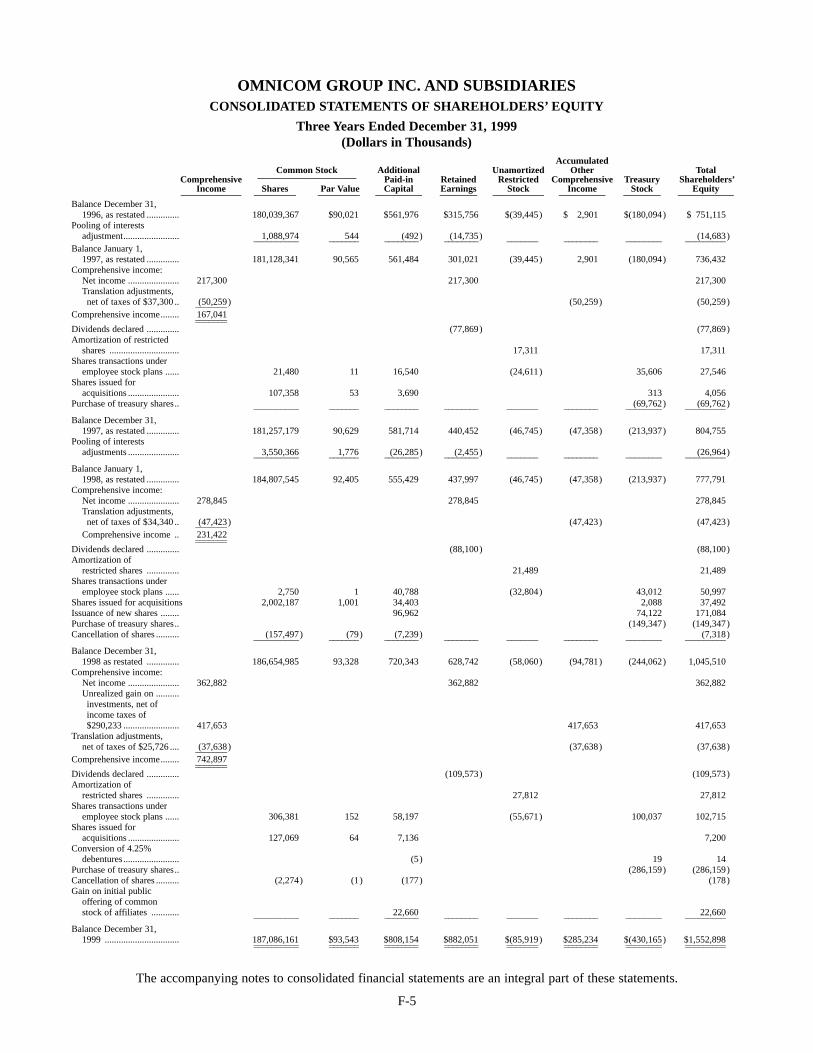
F-5
The accompanying notes to consolidated financial statements are an integral part of these statements.
OMNICOM GROUP INC. AND SUBSIDIARIES CONSOLIDATED STATEMENTS OF SHAREHOLDERS’ EQUITY
Three Years Ended December 31, 1999(Dollars in Thousands)
AccumulatedCommon Stock Additional Unamortized Other Total
Comprehensive ______________________ Paid-in Retained Restricted Comprehensive Treasury Shareholders’Income Shares Par Value Capital Earnings Stock Income Stock Equity_____________ _________ _________ __________ ________ ___________ __________ ________ ____________
Balance December 31, 1996, as restated .............. 180,039,367 $90,021 $561,976 $315,756 $(39,445) $ 2,901 $(180,094) $ 751,115
Pooling of interestsadjustment........................ 1,088,974 544 (492) (14,735) (14,683)__________ _______ ________ ________ _______ ________ ________ _________
Balance January 1, 1997, as restated .............. 181,128,341 90,565 561,484 301,021 (39,445) 2,901 (180,094) 736,432
Comprehensive income:Net income ...................... 217,300 217,300 217,300Translation adjustments, net of taxes of $37,300 .. (50,259) (50,259) (50,259)_______
Comprehensive income........ 167,041______________Dividends declared .............. (77,869) (77,869)Amortization of restricted
shares .............................. 17,311 17,311Shares transactions under
employee stock plans ...... 21,480 11 16,540 (24,611) 35,606 27,546Shares issued for
acquisitions ...................... 107,358 53 3,690 313 4,056Purchase of treasury shares.. (69,762) (69,762)__________ _______ ________ ________ _______ ________ ________ _________
Balance December 31, 1997, as restated .............. 181,257,179 90,629 581,714 440,452 (46,745) (47,358) (213,937) 804,755
Pooling of interests adjustments ...................... 3,550,366 1,776 (26,285) (2,455) (26,964)__________ _______ ________ ________ _______ ________ ________ _________
Balance January 1, 1998, as restated .............. 184,807,545 92,405 555,429 437,997 (46,745) (47,358) (213,937) 777,791
Comprehensive income:Net income ...................... 278,845 278,845 278,845Translation adjustments, net of taxes of $34,340 .. (47,423) (47,423) (47,423)_______
Comprehensive income .. 231,422______________Dividends declared .............. (88,100) (88,100)Amortization of
restricted shares .............. 21,489 21,489Shares transactions under
employee stock plans ...... 2,750 1 40,788 (32,804) 43,012 50,997Shares issued for acquisitions 2,002,187 1,001 34,403 2,088 37,492Issuance of new shares ........ 96,962 74,122 171,084Purchase of treasury shares.. (149,347) (149,347)Cancellation of shares .......... (157,497) (79) (7,239) (7,318)__________ _______ ________ ________ _______ ________ ________ _________
Balance December 31, 1998 as restated .............. 186,654,985 93,328 720,343 628,742 (58,060) (94,781) (244,062) 1,045,510
Comprehensive income:Net income ...................... 362,882 362,882 362,882Unrealized gain on ..........investments, net of income taxes of$290,233 ........................ 417,653 417,653 417,653
Translation adjustments, net of taxes of $25,726 .... (37,638) (37,638) (37,638)_______
Comprehensive income........ 742,897______________Dividends declared .............. (109,573) (109,573)Amortization of
restricted shares .............. 27,812 27,812Shares transactions under
employee stock plans ...... 306,381 152 58,197 (55,671) 100,037 102,715Shares issued for
acquisitions ...................... 127,069 64 7,136 7,200Conversion of 4.25%
debentures........................ (5) 19 14Purchase of treasury shares.. (286,159) (286,159)Cancellation of shares .......... (2,274) (1) (177) (178)Gain on initial public
offering of common stock of affiliates ............ 22,660 22,660__________ _______ ________ ________ _______ ________ ________ _________
Balance December 31, 1999 ................................ 187,086,161 $93,543 $808,154 $882,051 $(85,919) $285,234 $(430,165) $1,552,898__________ _______ ________ ________ _______ ________ ________ ___________________ _______ ________ ________ _______ ________ ________ _________
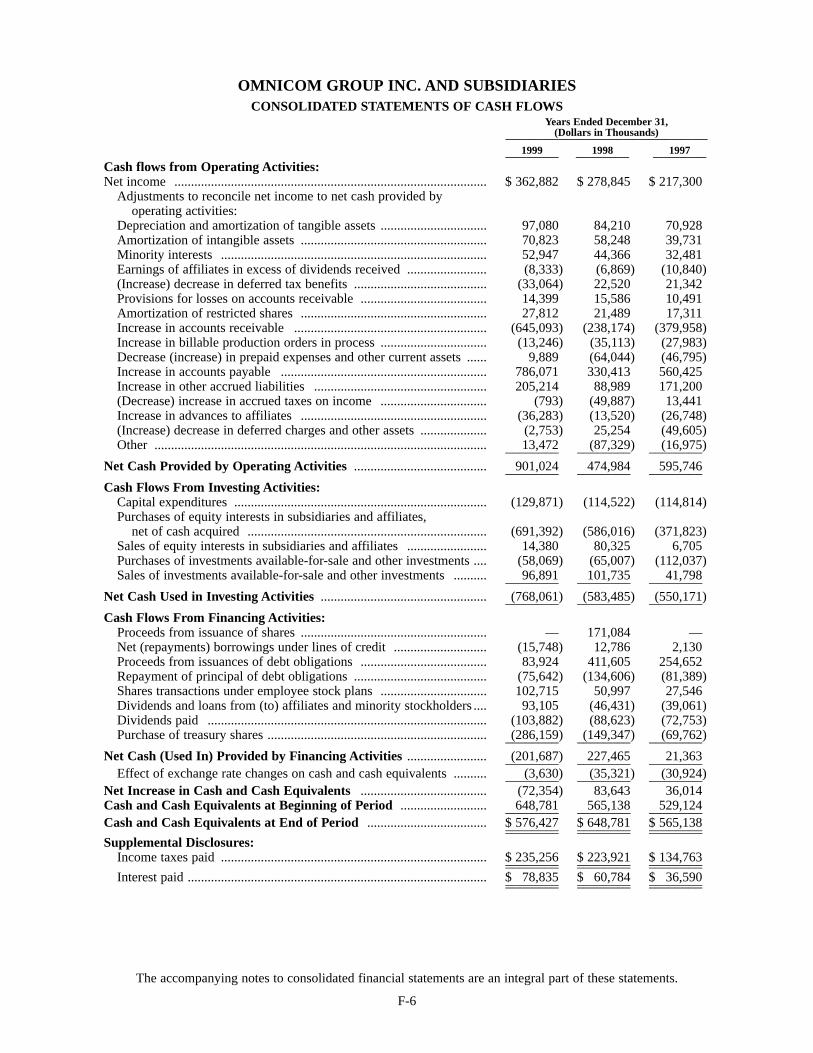
F-6
The accompanying notes to consolidated financial statements are an integral part of these statements.
OMNICOM GROUP INC. AND SUBSIDIARIESCONSOLIDATED STATEMENTS OF CASH FLOWS
Years Ended December 31,(Dollars in Thousands)______________________________________
1999 1998 1997__________ __________ __________Cash flows from Operating Activities:Net income .............................................................................................. $ 362,882 $ 278,845 $ 217,300
Adjustments to reconcile net income to net cash provided byoperating activities:
Depreciation and amortization of tangible assets ................................ 97,080 84,210 70,928Amortization of intangible assets ........................................................ 70,823 58,248 39,731Minority interests ................................................................................ 52,947 44,366 32,481Earnings of affiliates in excess of dividends received ........................ (8,333) (6,869) (10,840)(Increase) decrease in deferred tax benefits ........................................ (33,064) 22,520 21,342Provisions for losses on accounts receivable ...................................... 14,399 15,586 10,491Amortization of restricted shares ........................................................ 27,812 21,489 17,311Increase in accounts receivable .......................................................... (645,093) (238,174) (379,958)Increase in billable production orders in process ................................ (13,246) (35,113) (27,983)Decrease (increase) in prepaid expenses and other current assets ...... 9,889 (64,044) (46,795)Increase in accounts payable .............................................................. 786,071 330,413 560,425Increase in other accrued liabilities .................................................... 205,214 88,989 171,200(Decrease) increase in accrued taxes on income ................................ (793) (49,887) 13,441Increase in advances to affiliates ........................................................ (36,283) (13,520) (26,748)(Increase) decrease in deferred charges and other assets .................... (2,753) 25,254 (49,605)Other .................................................................................................... 13,472 (87,329) (16,975)________ ________ ________
Net Cash Provided by Operating Activities ........................................ 901,024 474,984 595,746________ ________ ________
Cash Flows From Investing Activities:Capital expenditures ............................................................................ (129,871) (114,522) (114,814)Purchases of equity interests in subsidiaries and affiliates,
net of cash acquired ........................................................................ (691,392) (586,016) (371,823)Sales of equity interests in subsidiaries and affiliates ........................ 14,380 80,325 6,705Purchases of investments available-for-sale and other investments .... (58,069) (65,007) (112,037)Sales of investments available-for-sale and other investments .......... 96,891 101,735 41,798________ ________ ________
Net Cash Used in Investing Activities .................................................. (768,061) (583,485) (550,171)________ ________ ________
Cash Flows From Financing Activities:Proceeds from issuance of shares ........................................................ — 171,084 —Net (repayments) borrowings under lines of credit ............................ (15,748) 12,786 2,130Proceeds from issuances of debt obligations ...................................... 83,924 411,605 254,652Repayment of principal of debt obligations ........................................ (75,642) (134,606) (81,389)Shares transactions under employee stock plans ................................ 102,715 50,997 27,546Dividends and loans from (to) affiliates and minority stockholders .... 93,105 (46,431) (39,061)Dividends paid .................................................................................... (103,882) (88,623) (72,753)Purchase of treasury shares .................................................................. (286,159) (149,347) (69,762)________ ________ ________
Net Cash (Used In) Provided by Financing Activities ........................ (201,687) 227,465 21,363________ ________ ________Effect of exchange rate changes on cash and cash equivalents .......... (3,630) (35,321) (30,924)________ ________ ________
Net Increase in Cash and Cash Equivalents ...................................... (72,354) 83,643 36,014Cash and Cash Equivalents at Beginning of Period .......................... 648,781 565,138 529,124________ ________ ________Cash and Cash Equivalents at End of Period .................................... $ 576,427 $ 648,781 $ 565,138________ ________ ________________ ________ ________Supplemental Disclosures:
Income taxes paid ................................................................................ $ 235,256 $ 223,921 $ 134,763________ ________ ________________ ________ ________Interest paid .......................................................................................... $ 78,835 $ 60,784 $ 36,590________ ________ ________________ ________ ________
OMNICOM GROUP INC. AND SUBSIDIARIESNOTES TO CONSOLIDATED FINANCIAL STATEMENTS
F-7
1. Business and Summary of Significant Accounting Policies
Business. Omnicom Group Inc., through its wholly and partially-owned companies (hereinafter collectively referred to as the “Company” or the “Omnicom Group”), provides corporate communications services to clients worldwide on a global, pan-regional, national and local basis. Operations cover the majorregions of North America, the United Kingdom, Germany, France, the remainder of Continental Europe, LatinAmerica, the Far East, Australia, the Middle East and Africa. In both 1999 and 1998, approximately 50% of the Omnicom Group’s commissions and fees came from its non-U.S. operations. The communications services offered by the Company include advertising in various media such as television, radio, newspaper,magazines, outdoor and the internet, as well as public relations, specialty advertising, direct response and promotional marketing, strategic media planning and buying, and internet and digital media development.
Recognition of Commission and Fee Revenue. Substantially all revenues are derived from fees for manpower and for production of advertisements. Additionally, revenues are derived from commissions forplacement of advertisements in various media. Revenue is realized when the service is performed, in accordance with the terms of the contractual arrangement, and collection is reasonably assured. Billings aregenerally rendered upon completion of the earnings process, including: upon presentation date for media, whenmanpower is used, when costs are incurred for radio and television production and when print production iscompleted.
Principles of Consolidation. The accompanying consolidated financial statements include the accountsof Omnicom Group Inc. and its domestic and international subsidiaries (the “Company”). All significantintercompany balances and transactions have been eliminated.
Restatement and Reclassifications. As discussed in Note 2, on February 10, 1999 the Company completed the acquisition of Abbott Mead Vickers Group Limited (formerly known as Abbott Mead Vickersplc) (“AMV”). The AMV acquisition was accounted for as a pooling-of-interests. All prior year amountshave been restated to include the accounts of AMV. In addition, certain prior year amounts have beenreclassified to conform with the 1999 presentation.
Investments Available-For-Sale. Substantially all of the Company’s investments are classified as available-for-sale. Investments available-for-sale, that consist principally of short-term investments and timedeposits with financial institutions with original maturity dates between 3 months and one year, are classifiedas current assets. Strategic investments available-for-sale, which consist principally of publicly traded securities in interactive marketing agencies, are classified as long-term investments.
Billable Production. Billable production orders in process consist principally of costs incurred in providingcorporate communications services to clients. Such amounts are generally billed to clients when manpower isused, when costs are incurred for radio and television production and when print production is completed.
Common Stock. Wholly-owned subsidiaries of the Company have issued securities which areexchangeable into common stock of the Company at the holders’ option. Shares of common stock issuableon the exchange of these securities are included in common stock issued at December 31, 1999.
Treasury Stock. The Company accounts for treasury share purchases at cost. The reissuance of treasuryshares is accounted for at the average cost. Gains or losses on the reissuance of treasury shares are accounted for as additional paid-in capital.
Foreign Currency Translation. The Company’s financial statements were prepared in accordance withthe requirements of Statement of Financial Accounting Standards (“SFAS”) No. 52, “Foreign CurrencyTranslation.” Under this method, net transaction gains of $9.9 million, $15.2 million and $3.6 million areincluded in 1999, 1998 and 1997 net income, respectively.
OMNICOM GROUP INC. AND SUBSIDIARIESNOTES TO CONSOLIDATED FINANCIAL STATEMENTS (Continued)
Earnings Per Common Share. Basic earnings per share is based upon the weighted average number ofcommon shares outstanding during each year. Diluted earnings per share is based on the above, plus, if dilutive, common share equivalents which include outstanding options and restricted shares, and if dilutive,adjusted for the assumed conversion of the Company’s 21⁄4% and 41⁄4% Convertible Subordinated Debentures(assumed to be converted for the full year) and the assumed increase in net income for the after tax interestcost of these debentures. For purposes of computing diluted earnings per share for the years ended December31, 1999, 1998 and 1997, respectively, 3,046,904, 3,518,600 and 3,174,000 shares were assumed to havebeen outstanding related to common share equivalents and 11,551,936, and 6,936,500 shares in 1999 and1998, respectively were assumed to have been converted related to the Company’s convertible subordinateddebentures. Additionally, the assumed increase in net income used in the computations was $17,968,000,$9,627,900 and $318,300 for the years ended December 31, 1999, 1998 and 1997, respectively. The numberof shares used in the computations were as follows:
1999 1998 1997____ ____ ____
Basic EPS computation............................ 175,285,932 173,104,700 166,857,300Diluted EPS computation ........................ 189,884,772 183,559,800 170,031,300
For purposes of computing diluted earnings per share for the year ended December 31, 1998, theCompany’s 21⁄4% Convertible Subordinated Debentures and for the year ended December 31, 1997 the 41⁄4%Convertible Subordinated Debentures, were not reflected in the computation as inclusion would have beenanti-dilutive.
Gains and Losses on Issuance of Stock in Affiliates and Subsidiaries. Gains and losses on the issuanceof stock in equity method affiliates and consolidated subsidiaries are recognized directly in the Company’sshareholder’s equity through an increase or decrease to additional paid-in capital, in the period in which thesale occurs.
Severance Agreements. Arrangements with certain present and former employees provide for continuingpayments for periods up to 10 years after cessation of their full-time employment in consideration for agreements by the employees not to compete and to render consulting services in the post employment period.Such payments, which are determined, subject to certain conditions and limitations, by earnings in subsequentperiods, are expensed in such periods.
Depreciation of Furniture and Equipment and Amortization of Leasehold Improvements. Depreciationcharges are computed on a straight-line basis or declining balance method over the estimated useful lives offurniture and equipment, up to 10 years. Leasehold improvements are amortized on a straight-line basis overthe lesser of the terms of the related lease or the useful life of these assets.
Intangibles. Intangibles represent acquisition costs in excess of the fair value of tangible net assets ofpurchased subsidiaries. The intangible values associated with the Company’s business consist predominantlyof two types: the value of the worldwide agency networks and agency brands and the value of ongoing clientrelationships. The Company’s worldwide agency networks have been operating for an average of over 60years and intangibles associated with enhancing network value are intended to enhance the long-term valueof the networks. Client relationships in the corporate communications services industry are typicallylong-term in nature and the Company’s largest clients have on average been clients for more than 25 years.As such, intangibles are amortized on a straight-line basis principally over a period of 40 years. Each year,the intangibles are written down if, and to the extent, they are determined to be impaired. Intangibles are considered to be impaired if the future anticipated undiscounted cash flows arising from the use of the intangibles is less than the net unamortized cost of the intangibles.
Deferred Taxes. Deferred tax liabilities and tax benefits relate to the recognition of certain revenues andexpenses in different years for financial statement and tax purposes and to differences between the tax andbook basis of assets and liabilities recorded in connection with acquisitions, unrealized gains and losses oninvestments available for sale and the issuance of stock of affiliates.
F-8
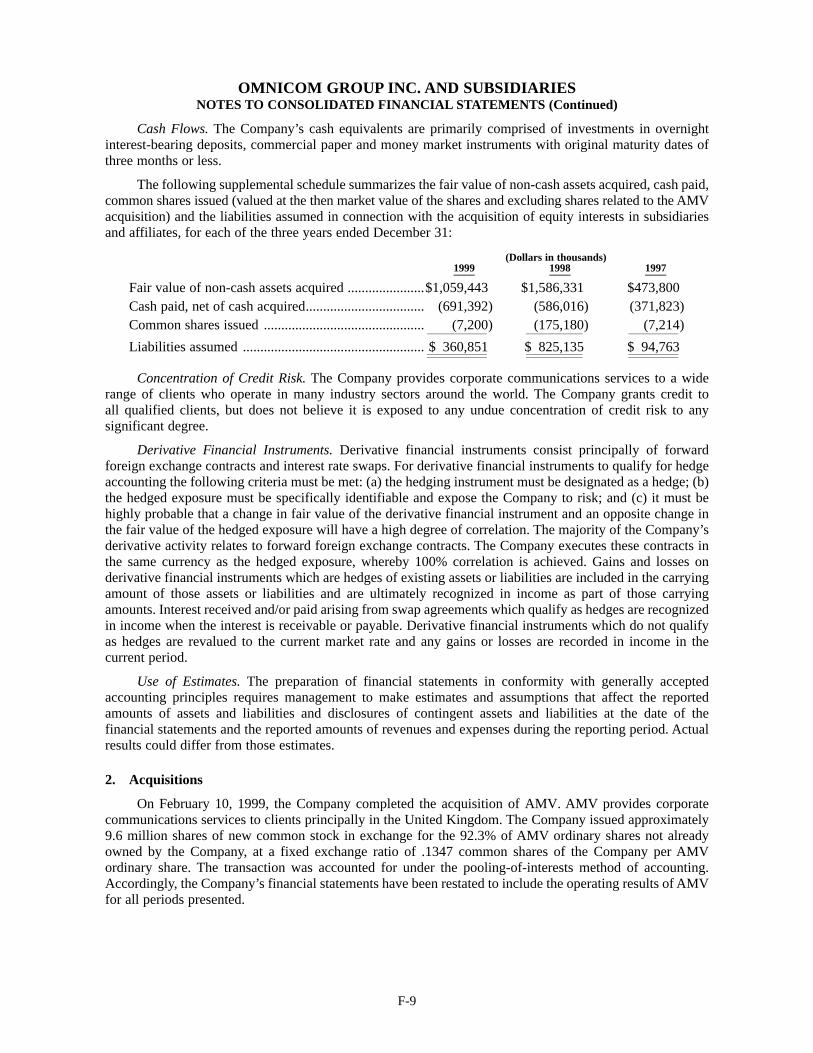
OMNICOM GROUP INC. AND SUBSIDIARIESNOTES TO CONSOLIDATED FINANCIAL STATEMENTS (Continued)
Cash Flows. The Company’s cash equivalents are primarily comprised of investments in overnightinterest-bearing deposits, commercial paper and money market instruments with original maturity dates ofthree months or less.
The following supplemental schedule summarizes the fair value of non-cash assets acquired, cash paid,common shares issued (valued at the then market value of the shares and excluding shares related to the AMVacquisition) and the liabilities assumed in connection with the acquisition of equity interests in subsidiariesand affiliates, for each of the three years ended December 31:
(Dollars in thousands)1999 1998 1997____ ____ ____
Fair value of non-cash assets acquired ......................$1,059,443 $1,586,331 $473,800Cash paid, net of cash acquired.................................. (691,392) (586,016) (371,823)Common shares issued .............................................. (7,200) (175,180) (7,214)
__________________ _________________ _______________
Liabilities assumed .................................................... $ 360,851 $ 825,135 $ 94,763__________________ _________________ _________________________________ _________________ _______________
Concentration of Credit Risk. The Company provides corporate communications services to a widerange of clients who operate in many industry sectors around the world. The Company grants credit to all qualified clients, but does not believe it is exposed to any undue concentration of credit risk to any significant degree.
Derivative Financial Instruments. Derivative financial instruments consist principally of forward foreign exchange contracts and interest rate swaps. For derivative financial instruments to qualify for hedgeaccounting the following criteria must be met: (a) the hedging instrument must be designated as a hedge; (b)the hedged exposure must be specifically identifiable and expose the Company to risk; and (c) it must behighly probable that a change in fair value of the derivative financial instrument and an opposite change inthe fair value of the hedged exposure will have a high degree of correlation. The majority of the Company’sderivative activity relates to forward foreign exchange contracts. The Company executes these contracts inthe same currency as the hedged exposure, whereby 100% correlation is achieved. Gains and losses on derivative financial instruments which are hedges of existing assets or liabilities are included in the carryingamount of those assets or liabilities and are ultimately recognized in income as part of those carryingamounts. Interest received and/or paid arising from swap agreements which qualify as hedges are recognizedin income when the interest is receivable or payable. Derivative financial instruments which do not qualifyas hedges are revalued to the current market rate and any gains or losses are recorded in income in the current period.
Use of Estimates. The preparation of financial statements in conformity with generally acceptedaccounting principles requires management to make estimates and assumptions that affect the reportedamounts of assets and liabilities and disclosures of contingent assets and liabilities at the date of the financial statements and the reported amounts of revenues and expenses during the reporting period. Actualresults could differ from those estimates.
2. Acquisitions
On February 10, 1999, the Company completed the acquisition of AMV. AMV provides corporatecommunications services to clients principally in the United Kingdom. The Company issued approximately9.6 million shares of new common stock in exchange for the 92.3% of AMV ordinary shares not alreadyowned by the Company, at a fixed exchange ratio of .1347 common shares of the Company per AMVordinary share. The transaction was accounted for under the pooling-of-interests method of accounting.Accordingly, the Company’s financial statements have been restated to include the operating results of AMVfor all periods presented.
F-9
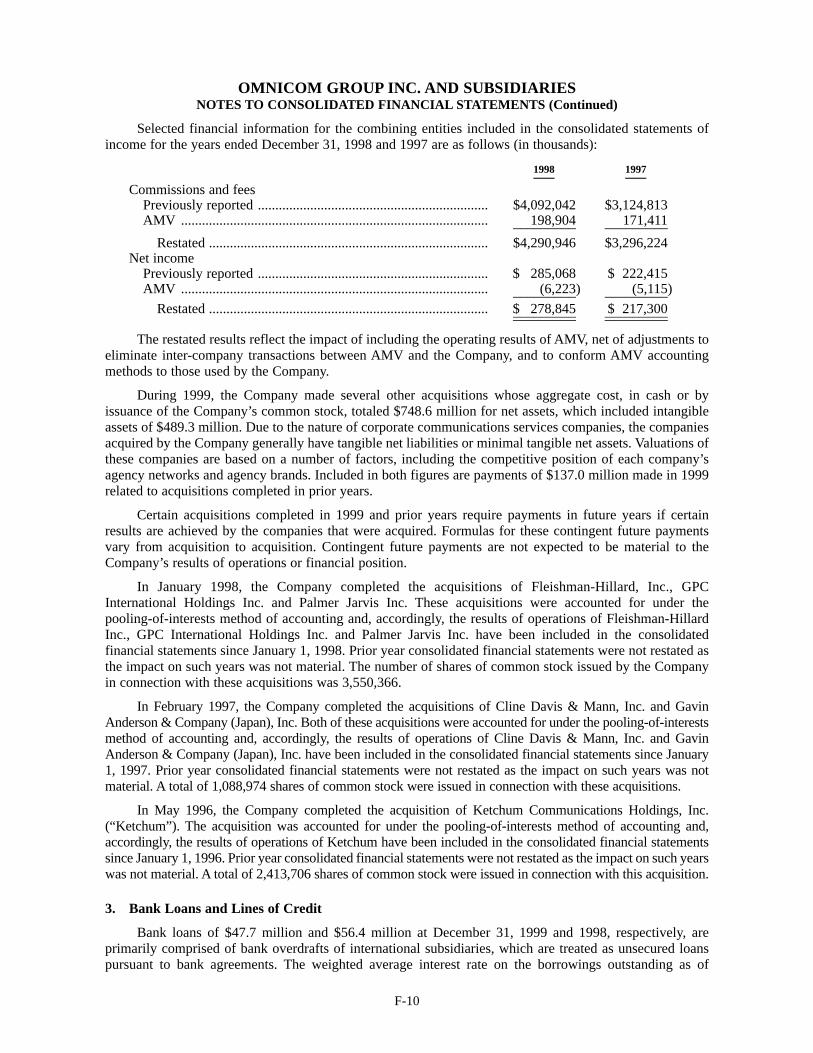
OMNICOM GROUP INC. AND SUBSIDIARIESNOTES TO CONSOLIDATED FINANCIAL STATEMENTS (Continued)
Selected financial information for the combining entities included in the consolidated statements ofincome for the years ended December 31, 1998 and 1997 are as follows (in thousands):
1998 1997___ ___ Commissions and fees
Previously reported .................................................................. $4,092,042 $3,124,813AMV ........................................................................................ 198,904 171,411_________ _________
Restated ................................................................................ $4,290,946 $3,296,224Net income
Previously reported .................................................................. $ 285,068 $ 222,415AMV ........................................................................................ (6,223) (5,115)_________ _________
Restated ................................................................................ $ 278,845 $ 217,300_________ __________________ _________
The restated results reflect the impact of including the operating results of AMV, net of adjustments toeliminate inter-company transactions between AMV and the Company, and to conform AMV accountingmethods to those used by the Company.
During 1999, the Company made several other acquisitions whose aggregate cost, in cash or byissuance of the Company’s common stock, totaled $748.6 million for net assets, which included intangibleassets of $489.3 million. Due to the nature of corporate communications services companies, the companiesacquired by the Company generally have tangible net liabilities or minimal tangible net assets. Valuations ofthese companies are based on a number of factors, including the competitive position of each company’sagency networks and agency brands. Included in both figures are payments of $137.0 million made in 1999related to acquisitions completed in prior years.
Certain acquisitions completed in 1999 and prior years require payments in future years if certainresults are achieved by the companies that were acquired. Formulas for these contingent future payments vary from acquisition to acquisition. Contingent future payments are not expected to be material to theCompany’s results of operations or financial position.
In January 1998, the Company completed the acquisitions of Fleishman-Hillard, Inc., GPCInternational Holdings Inc. and Palmer Jarvis Inc. These acquisitions were accounted for under the pooling-of-interests method of accounting and, accordingly, the results of operations of Fleishman-HillardInc., GPC International Holdings Inc. and Palmer Jarvis Inc. have been included in the consolidated financial statements since January 1, 1998. Prior year consolidated financial statements were not restated asthe impact on such years was not material. The number of shares of common stock issued by the Companyin connection with these acquisitions was 3,550,366.
In February 1997, the Company completed the acquisitions of Cline Davis & Mann, Inc. and GavinAnderson & Company (Japan), Inc. Both of these acquisitions were accounted for under the pooling-of-interestsmethod of accounting and, accordingly, the results of operations of Cline Davis & Mann, Inc. and GavinAnderson & Company (Japan), Inc. have been included in the consolidated financial statements since January1, 1997. Prior year consolidated financial statements were not restated as the impact on such years was not material. A total of 1,088,974 shares of common stock were issued in connection with these acquisitions.
In May 1996, the Company completed the acquisition of Ketchum Communications Holdings, Inc.(“Ketchum”). The acquisition was accounted for under the pooling-of-interests method of accounting and,accordingly, the results of operations of Ketchum have been included in the consolidated financial statementssince January 1, 1996. Prior year consolidated financial statements were not restated as the impact on such yearswas not material. A total of 2,413,706 shares of common stock were issued in connection with this acquisition.
3. Bank Loans and Lines of Credit
Bank loans of $47.7 million and $56.4 million at December 31, 1999 and 1998, respectively, are primarily comprised of bank overdrafts of international subsidiaries, which are treated as unsecured loanspursuant to bank agreements. The weighted average interest rate on the borrowings outstanding as of
F-10
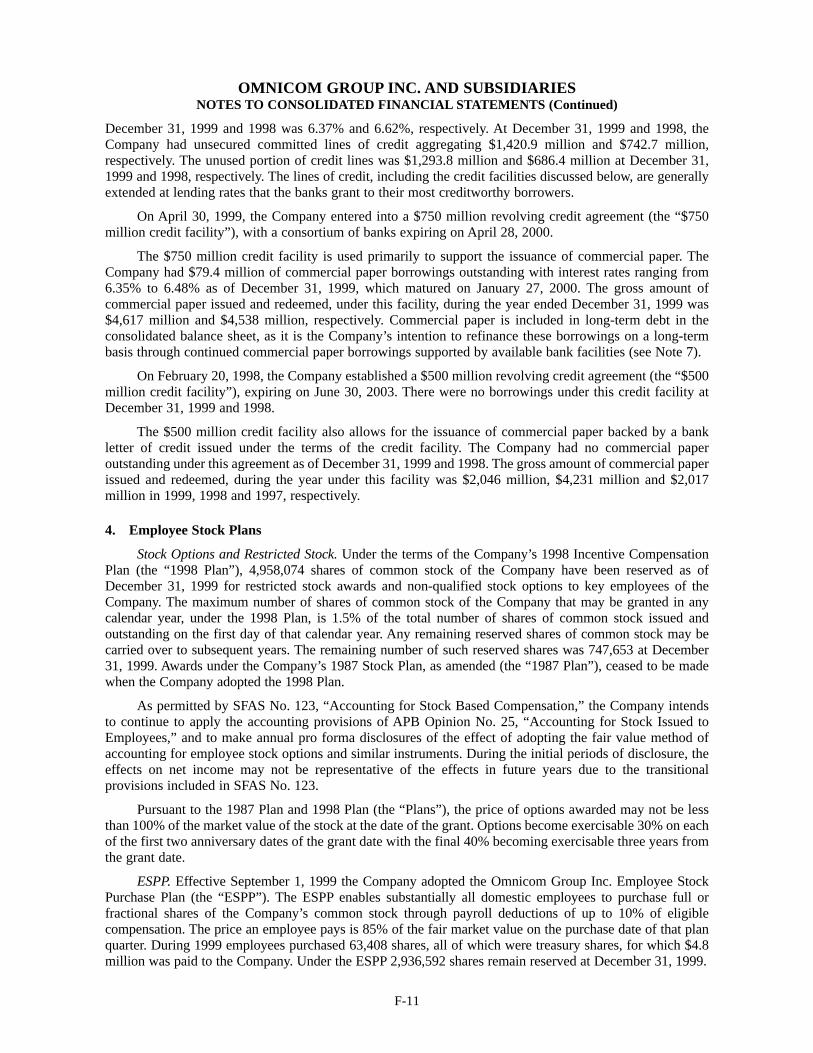
OMNICOM GROUP INC. AND SUBSIDIARIESNOTES TO CONSOLIDATED FINANCIAL STATEMENTS (Continued)
December 31, 1999 and 1998 was 6.37% and 6.62%, respectively. At December 31, 1999 and 1998, theCompany had unsecured committed lines of credit aggregating $1,420.9 million and $742.7 million, respectively. The unused portion of credit lines was $1,293.8 million and $686.4 million at December 31,1999 and 1998, respectively. The lines of credit, including the credit facilities discussed below, are generallyextended at lending rates that the banks grant to their most creditworthy borrowers.
On April 30, 1999, the Company entered into a $750 million revolving credit agreement (the “$750 million credit facility”), with a consortium of banks expiring on April 28, 2000.
The $750 million credit facility is used primarily to support the issuance of commercial paper. TheCompany had $79.4 million of commercial paper borrowings outstanding with interest rates ranging from6.35% to 6.48% as of December 31, 1999, which matured on January 27, 2000. The gross amount ofcommercial paper issued and redeemed, under this facility, during the year ended December 31, 1999 was$4,617 million and $4,538 million, respectively. Commercial paper is included in long-term debt in theconsolidated balance sheet, as it is the Company’s intention to refinance these borrowings on a long-termbasis through continued commercial paper borrowings supported by available bank facilities (see Note 7).
On February 20, 1998, the Company established a $500 million revolving credit agreement (the “$500million credit facility”), expiring on June 30, 2003. There were no borrowings under this credit facility atDecember 31, 1999 and 1998.
The $500 million credit facility also allows for the issuance of commercial paper backed by a bankletter of credit issued under the terms of the credit facility. The Company had no commercial paperoutstanding under this agreement as of December 31, 1999 and 1998. The gross amount of commercial paperissued and redeemed, during the year under this facility was $2,046 million, $4,231 million and $2,017million in 1999, 1998 and 1997, respectively.
4. Employee Stock Plans
Stock Options and Restricted Stock. Under the terms of the Company’s 1998 Incentive CompensationPlan (the “1998 Plan”), 4,958,074 shares of common stock of the Company have been reserved as ofDecember 31, 1999 for restricted stock awards and non-qualified stock options to key employees of theCompany. The maximum number of shares of common stock of the Company that may be granted in anycalendar year, under the 1998 Plan, is 1.5% of the total number of shares of common stock issued andoutstanding on the first day of that calendar year. Any remaining reserved shares of common stock may becarried over to subsequent years. The remaining number of such reserved shares was 747,653 at December31, 1999. Awards under the Company’s 1987 Stock Plan, as amended (the “1987 Plan”), ceased to be madewhen the Company adopted the 1998 Plan.
As permitted by SFAS No. 123, “Accounting for Stock Based Compensation,” the Company intendsto continue to apply the accounting provisions of APB Opinion No. 25, “Accounting for Stock Issued toEmployees,” and to make annual pro forma disclosures of the effect of adopting the fair value method ofaccounting for employee stock options and similar instruments. During the initial periods of disclosure, theeffects on net income may not be representative of the effects in future years due to the transitional provisions included in SFAS No. 123.
Pursuant to the 1987 Plan and 1998 Plan (the “Plans”), the price of options awarded may not be lessthan 100% of the market value of the stock at the date of the grant. Options become exercisable 30% on eachof the first two anniversary dates of the grant date with the final 40% becoming exercisable three years fromthe grant date.
ESPP. Effective September 1, 1999 the Company adopted the Omnicom Group Inc. Employee StockPurchase Plan (the “ESPP”). The ESPP enables substantially all domestic employees to purchase full or fractional shares of the Company’s common stock through payroll deductions of up to 10% of eligible compensation. The price an employee pays is 85% of the fair market value on the purchase date of that planquarter. During 1999 employees purchased 63,408 shares, all of which were treasury shares, for which $4.8million was paid to the Company. Under the ESPP 2,936,592 shares remain reserved at December 31, 1999.
F-11
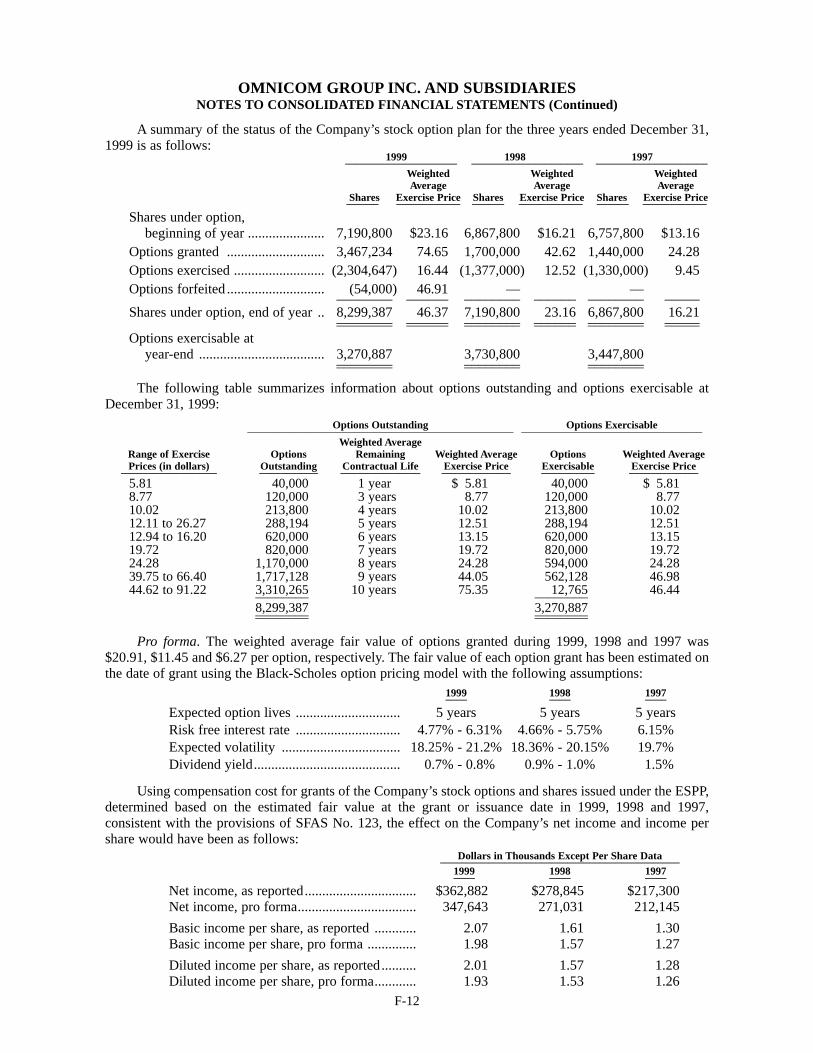
OMNICOM GROUP INC. AND SUBSIDIARIESNOTES TO CONSOLIDATED FINANCIAL STATEMENTS (Continued)
A summary of the status of the Company’s stock option plan for the three years ended December 31,1999 is as follows:
1999 1998 1997_____________________ _____________________ _____________________Weighted Weighted WeightedAverage Average Average
Shares Exercise Price Shares Exercise Price Shares Exercise Price______ ____________ ______ ____________ ______ ____________
Shares under option, beginning of year ...................... 7,190,800 $23.16 6,867,800 $16.21 6,757,800 $13.16
Options granted ............................ 3,467,234 74.65 1,700,000 42.62 1,440,000 24.28Options exercised .......................... (2,304,647) 16.44 (1,377,000) 12.52 (1,330,000) 9.45Options forfeited ............................ (54,000) 46.91 — —________ ______ ________ ______ ________ _____Shares under option, end of year .. 8,299,387 46.37 7,190,800 23.16 6,867,800 16.21________ ______ ________ ______ ________ _____________ ______ ________ ______ ________ _____Options exercisable at
year-end .................................... 3,270,887 3,730,800 3,447,800________ ________ ________________ ________ ________
The following table summarizes information about options outstanding and options exercisable atDecember 31, 1999:
Options Outstanding Options Exercisable__________________________________________________ __________________________________Weighted Average
Range of Exercise Options Remaining Weighted Average Options Weighted AveragePrices (in dollars) Outstanding Contractual Life Exercise Price Exercisable Exercise Price__________________ ___________ _______________ _____________ __________ _____________5.81 40,000 1 years $ 5.81 40,000 $ 5.818.77 120,000 3 years 8.77 120,000 8.7710.02 213,800 4 years 10.02 213,800 10.0212.11 to 26.27 288,194 5 years 12.51 288,194 12.5112.94 to 16.20 620,000 6 years 13.15 620,000 13.1519.72 820,000 7 years 19.72 820,000 19.7224.28 1,170,000 8 years 24.28 594,000 24.2839.75 to 66.40 1,717,128 9 years 44.05 562,128 46.9844.62 to 91.22 3,310,265 10 years 75.35 12,765 46.44________ ________
8,299,387 3,270,887________ ________________ ________
Pro forma. The weighted average fair value of options granted during 1999, 1998 and 1997 was$20.91, $11.45 and $6.27 per option, respectively. The fair value of each option grant has been estimated onthe date of grant using the Black-Scholes option pricing model with the following assumptions:
1999 1998 1997____ ____ ____
Expected option lives .............................. 5 years 5 years 5 yearsRisk free interest rate .............................. 4.77% - 6.31% 4.66% - 5.75% 6.15%Expected volatility .................................. 18.25% - 21.2% 18.36% - 20.15% 19.7%Dividend yield.......................................... 0.7% - 0.8% 0.9% - 1.0% 1.5%
Using compensation cost for grants of the Company’s stock options and shares issued under the ESPP,determined based on the estimated fair value at the grant or issuance date in 1999, 1998 and 1997, consistent with the provisions of SFAS No. 123, the effect on the Company’s net income and income pershare would have been as follows:
Dollars in Thousands Except Per Share Data_____________________________________________1999 1998 1997____ ____ ____
Net income, as reported................................ $362,882 $278,845 $217,300Net income, pro forma.................................. 347,643 271,031 212,145
Basic income per share, as reported ............ 2.07 1.61 1.30Basic income per share, pro forma .............. 1.98 1.57 1.27
Diluted income per share, as reported.......... 2.01 1.57 1.28Diluted income per share, pro forma............ 1.93 1.53 1.26
F-12
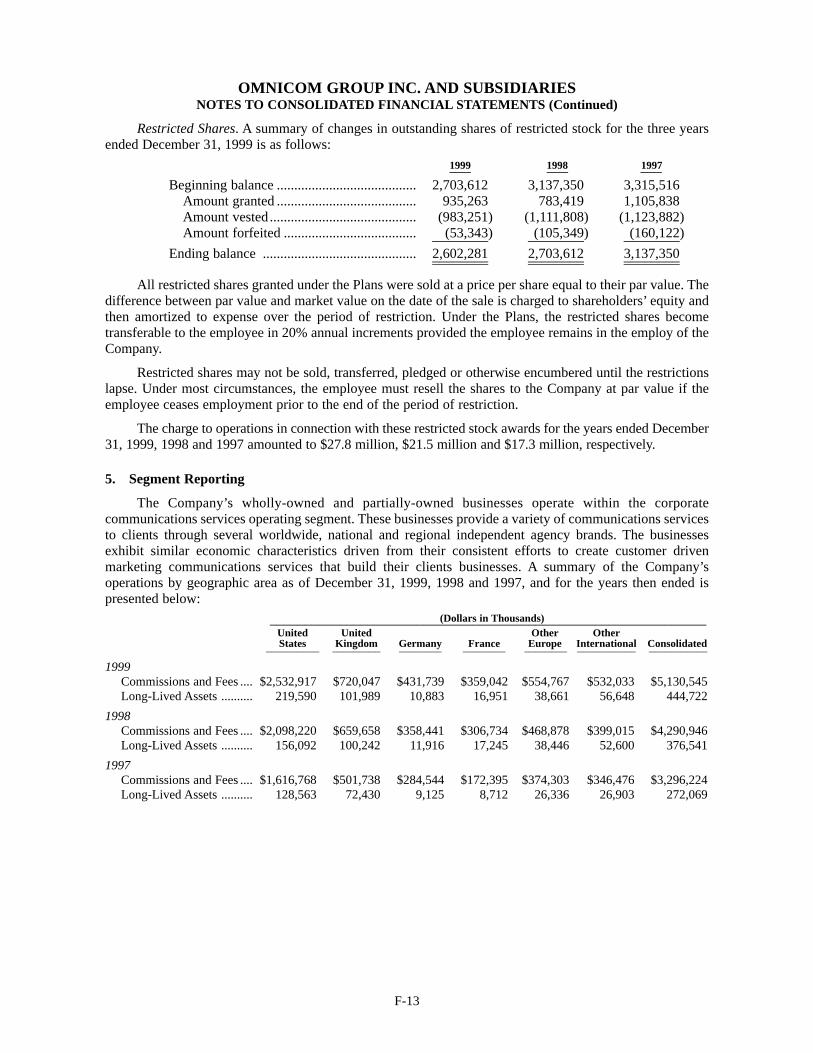
OMNICOM GROUP INC. AND SUBSIDIARIESNOTES TO CONSOLIDATED FINANCIAL STATEMENTS (Continued)
Restricted Shares. A summary of changes in outstanding shares of restricted stock for the three yearsended December 31, 1999 is as follows:
1999 1998 1997____ ____ ____
Beginning balance ........................................ 2,703,612 3,137,350 3,315,516Amount granted ........................................ 935,263 783,419 1,105,838Amount vested .......................................... (983,251) (1,111,808) (1,123,882)Amount forfeited ...................................... (53,343) (105,349) (160,122)________ ________ ________
Ending balance ............................................ 2,602,281 2,703,612 3,137,350________ ________ ________________ ________ ________
All restricted shares granted under the Plans were sold at a price per share equal to their par value. Thedifference between par value and market value on the date of the sale is charged to shareholders’ equity andthen amortized to expense over the period of restriction. Under the Plans, the restricted shares become transferable to the employee in 20% annual increments provided the employee remains in the employ of theCompany.
Restricted shares may not be sold, transferred, pledged or otherwise encumbered until the restrictionslapse. Under most circumstances, the employee must resell the shares to the Company at par value if theemployee ceases employment prior to the end of the period of restriction.
The charge to operations in connection with these restricted stock awards for the years ended December31, 1999, 1998 and 1997 amounted to $27.8 million, $21.5 million and $17.3 million, respectively.
5. Segment Reporting
The Company’s wholly-owned and partially-owned businesses operate within the corporate communications services operating segment. These businesses provide a variety of communications servicesto clients through several worldwide, national and regional independent agency brands. The businessesexhibit similar economic characteristics driven from their consistent efforts to create customer driven marketing communications services that build their clients businesses. A summary of the Company’soperations by geographic area as of December 31, 1999, 1998 and 1997, and for the years then ended is presented below:
(Dollars in Thousands)_______________________________________________________________United United Other OtherStates Kingdom Germany France Europe International Consolidated__________ _________ ________ ________ ________ ___________ ___________
1999Commissions and Fees .... $2,532,917 $720,047 $431,739 $359,042 $554,767 $532,033 $5,130,545Long-Lived Assets .......... 219,590 101,989 10,883 16,951 38,661 56,648 444,722
1998Commissions and Fees .... $2,098,220 $659,658 $358,441 $306,734 $468,878 $399,015 $4,290,946Long-Lived Assets .......... 156,092 100,242 11,916 17,245 38,446 52,600 376,541
1997Commissions and Fees .... $1,616,768 $501,738 $284,544 $172,395 $374,303 $346,476 $3,296,224Long-Lived Assets .......... 128,563 72,430 9,125 8,712 26,336 26,903 272,069
F-13
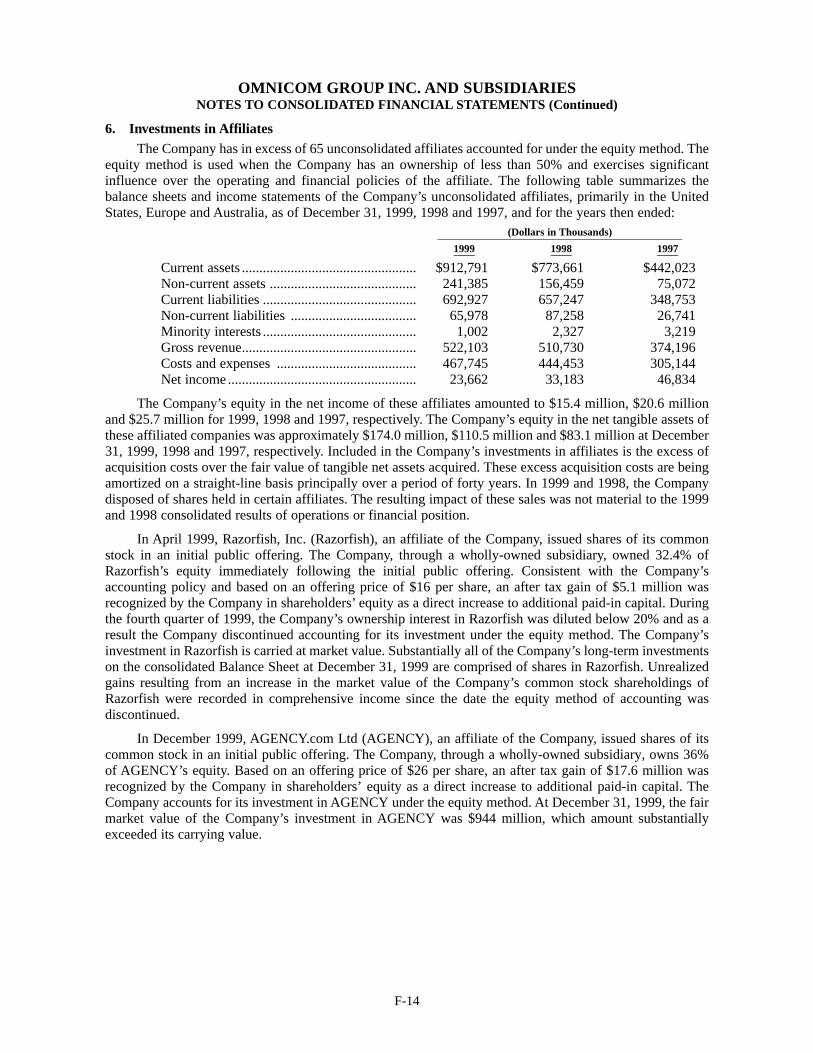
OMNICOM GROUP INC. AND SUBSIDIARIESNOTES TO CONSOLIDATED FINANCIAL STATEMENTS (Continued)
6. Investments in AffiliatesThe Company has in excess of 65 unconsolidated affiliates accounted for under the equity method. The
equity method is used when the Company has an ownership of less than 50% and exercises significant influence over the operating and financial policies of the affiliate. The following table summarizes the balance sheets and income statements of the Company’s unconsolidated affiliates, primarily in the UnitedStates, Europe and Australia, as of December 31, 1999, 1998 and 1997, and for the years then ended:
(Dollars in Thousands)______________________________________________1999 1998 1997___ ___ ___
Current assets .................................................. $912,791 $773,661 $442,023Non-current assets .......................................... 241,385 156,459 75,072Current liabilities ............................................ 692,927 657,247 348,753Non-current liabilities .................................... 65,978 87,258 26,741Minority interests ............................................ 1,002 2,327 3,219Gross revenue.................................................. 522,103 510,730 374,196Costs and expenses ........................................ 467,745 444,453 305,144Net income ...................................................... 23,662 33,183 46,834
The Company’s equity in the net income of these affiliates amounted to $15.4 million, $20.6 millionand $25.7 million for 1999, 1998 and 1997, respectively. The Company’s equity in the net tangible assets ofthese affiliated companies was approximately $174.0 million, $110.5 million and $83.1 million at December31, 1999, 1998 and 1997, respectively. Included in the Company’s investments in affiliates is the excess ofacquisition costs over the fair value of tangible net assets acquired. These excess acquisition costs are beingamortized on a straight-line basis principally over a period of forty years. In 1999 and 1998, the Companydisposed of shares held in certain affiliates. The resulting impact of these sales was not material to the 1999and 1998 consolidated results of operations or financial position.
In April 1999, Razorfish, Inc. (Razorfish), an affiliate of the Company, issued shares of its commonstock in an initial public offering. The Company, through a wholly-owned subsidiary, owned 32.4% ofRazorfish’s equity immediately following the initial public offering. Consistent with the Company’saccounting policy and based on an offering price of $16 per share, an after tax gain of $5.1 million wasrecognized by the Company in shareholders’ equity as a direct increase to additional paid-in capital. Duringthe fourth quarter of 1999, the Company’s ownership interest in Razorfish was diluted below 20% and as aresult the Company discontinued accounting for its investment under the equity method. The Company’sinvestment in Razorfish is carried at market value. Substantially all of the Company’s long-term investmentson the consolidated Balance Sheet at December 31, 1999 are comprised of shares in Razorfish. Unrealizedgains resulting from an increase in the market value of the Company’s common stock shareholdings ofRazorfish were recorded in comprehensive income since the date the equity method of accounting wasdiscontinued.
In December 1999, AGENCY.com Ltd (AGENCY), an affiliate of the Company, issued shares of itscommon stock in an initial public offering. The Company, through a wholly-owned subsidiary, owns 36%of AGENCY’s equity. Based on an offering price of $26 per share, an after tax gain of $17.6 million wasrecognized by the Company in shareholders’ equity as a direct increase to additional paid-in capital. TheCompany accounts for its investment in AGENCY under the equity method. At December 31, 1999, the fair market value of the Company’s investment in AGENCY was $944 million, which amount substantiallyexceeded its carrying value.
F-14
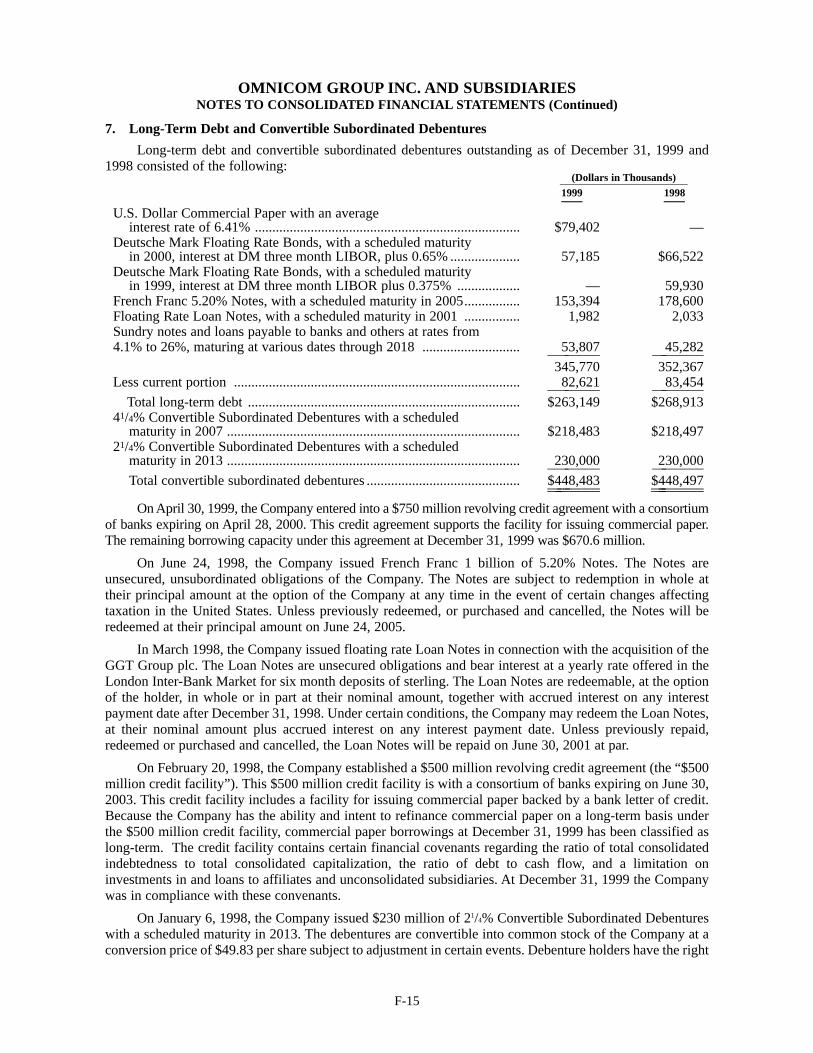
OMNICOM GROUP INC. AND SUBSIDIARIESNOTES TO CONSOLIDATED FINANCIAL STATEMENTS (Continued)
7. Long-Term Debt and Convertible Subordinated Debentures
Long-term debt and convertible subordinated debentures outstanding as of December 31, 1999 and1998 consisted of the following:
(Dollars in Thousands)________________________1999 1998___ ___
U.S. Dollar Commercial Paper with an average interest rate of 6.41% ............................................................................ $79,402 —
Deutsche Mark Floating Rate Bonds, with a scheduled maturityin 2000, interest at DM three month LIBOR, plus 0.65% .................... 57,185 $66,522
Deutsche Mark Floating Rate Bonds, with a scheduled maturityin 1999, interest at DM three month LIBOR plus 0.375% .................. — 59,930
French Franc 5.20% Notes, with a scheduled maturity in 2005................ 153,394 178,600Floating Rate Loan Notes, with a scheduled maturity in 2001 ................ 1,982 2,033Sundry notes and loans payable to banks and others at rates from4.1% to 26%, maturing at various dates through 2018 ............................ 53,807 45,282________ ________
345,770 352,367Less current portion .................................................................................. 82,621 83,454________ ________
Total long-term debt .............................................................................. $263,149 $268,91341/4% Convertible Subordinated Debentures with a scheduled
maturity in 2007 .................................................................................... $218,483 $218,49721/4% Convertible Subordinated Debentures with a scheduled
maturity in 2013 .................................................................................... 230,000 230,000________ ________Total convertible subordinated debentures ............................................ $448,483 $448,497_________ __________________ _________
On April 30, 1999, the Company entered into a $750 million revolving credit agreement with a consortiumof banks expiring on April 28, 2000. This credit agreement supports the facility for issuing commercial paper.The remaining borrowing capacity under this agreement at December 31, 1999 was $670.6 million.
On June 24, 1998, the Company issued French Franc 1 billion of 5.20% Notes. The Notes are unsecured, unsubordinated obligations of the Company. The Notes are subject to redemption in whole attheir principal amount at the option of the Company at any time in the event of certain changes affecting taxation in the United States. Unless previously redeemed, or purchased and cancelled, the Notes will beredeemed at their principal amount on June 24, 2005.
In March 1998, the Company issued floating rate Loan Notes in connection with the acquisition of theGGT Group plc. The Loan Notes are unsecured obligations and bear interest at a yearly rate offered in theLondon Inter-Bank Market for six month deposits of sterling. The Loan Notes are redeemable, at the optionof the holder, in whole or in part at their nominal amount, together with accrued interest on any interest payment date after December 31, 1998. Under certain conditions, the Company may redeem the Loan Notes,at their nominal amount plus accrued interest on any interest payment date. Unless previously repaid,redeemed or purchased and cancelled, the Loan Notes will be repaid on June 30, 2001 at par.
On February 20, 1998, the Company established a $500 million revolving credit agreement (the “$500million credit facility”). This $500 million credit facility is with a consortium of banks expiring on June 30,2003. This credit facility includes a facility for issuing commercial paper backed by a bank letter of credit.Because the Company has the ability and intent to refinance commercial paper on a long-term basis underthe $500 million credit facility, commercial paper borrowings at December 31, 1999 has been classified aslong-term. The credit facility contains certain financial covenants regarding the ratio of total consolidatedindebtedness to total consolidated capitalization, the ratio of debt to cash flow, and a limitation on investments in and loans to affiliates and unconsolidated subsidiaries. At December 31, 1999 the Companywas in compliance with these convenants.
On January 6, 1998, the Company issued $230 million of 21/4% Convertible Subordinated Debentureswith a scheduled maturity in 2013. The debentures are convertible into common stock of the Company at aconversion price of $49.83 per share subject to adjustment in certain events. Debenture holders have the right
F-15
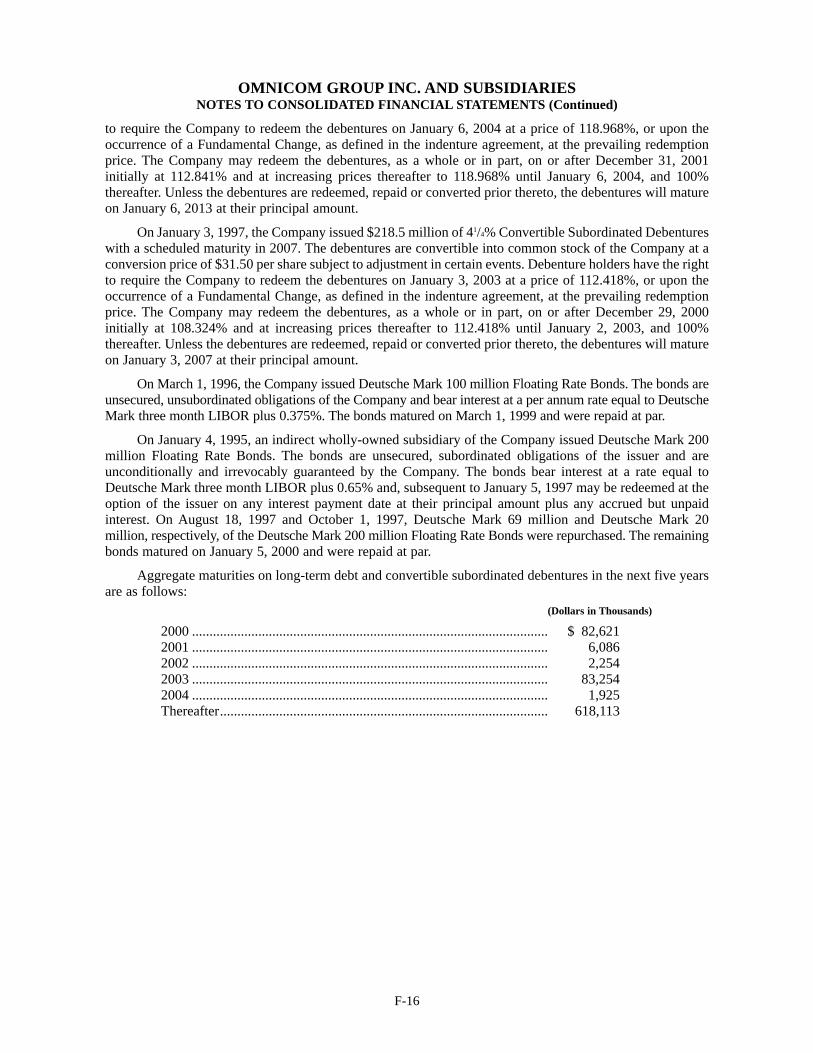
OMNICOM GROUP INC. AND SUBSIDIARIESNOTES TO CONSOLIDATED FINANCIAL STATEMENTS (Continued)
to require the Company to redeem the debentures on January 6, 2004 at a price of 118.968%, or upon theoccurrence of a Fundamental Change, as defined in the indenture agreement, at the prevailing redemptionprice. The Company may redeem the debentures, as a whole or in part, on or after December 31, 2001 initially at 112.841% and at increasing prices thereafter to 118.968% until January 6, 2004, and 100% thereafter. Unless the debentures are redeemed, repaid or converted prior thereto, the debentures will matureon January 6, 2013 at their principal amount.
On January 3, 1997, the Company issued $218.5 million of 41/4% Convertible Subordinated Debentureswith a scheduled maturity in 2007. The debentures are convertible into common stock of the Company at aconversion price of $31.50 per share subject to adjustment in certain events. Debenture holders have the rightto require the Company to redeem the debentures on January 3, 2003 at a price of 112.418%, or upon theoccurrence of a Fundamental Change, as defined in the indenture agreement, at the prevailing redemptionprice. The Company may redeem the debentures, as a whole or in part, on or after December 29, 2000 initially at 108.324% and at increasing prices thereafter to 112.418% until January 2, 2003, and 100% thereafter. Unless the debentures are redeemed, repaid or converted prior thereto, the debentures will matureon January 3, 2007 at their principal amount.
On March 1, 1996, the Company issued Deutsche Mark 100 million Floating Rate Bonds. The bonds areunsecured, unsubordinated obligations of the Company and bear interest at a per annum rate equal to DeutscheMark three month LIBOR plus 0.375%. The bonds matured on March 1, 1999 and were repaid at par.
On January 4, 1995, an indirect wholly-owned subsidiary of the Company issued Deutsche Mark 200million Floating Rate Bonds. The bonds are unsecured, subordinated obligations of the issuer and areunconditionally and irrevocably guaranteed by the Company. The bonds bear interest at a rate equal toDeutsche Mark three month LIBOR plus 0.65% and, subsequent to January 5, 1997 may be redeemed at theoption of the issuer on any interest payment date at their principal amount plus any accrued but unpaid interest. On August 18, 1997 and October 1, 1997, Deutsche Mark 69 million and Deutsche Mark 20 million, respectively, of the Deutsche Mark 200 million Floating Rate Bonds were repurchased. The remainingbonds matured on January 5, 2000 and were repaid at par.
Aggregate maturities on long-term debt and convertible subordinated debentures in the next five yearsare as follows:
(Dollars in Thousands)
2000 ...................................................................................................... $ 82,6212001 ...................................................................................................... 6,0862002 ...................................................................................................... 2,2542003 ...................................................................................................... 83,2542004 ...................................................................................................... 1,925Thereafter.............................................................................................. 618,113
F-16
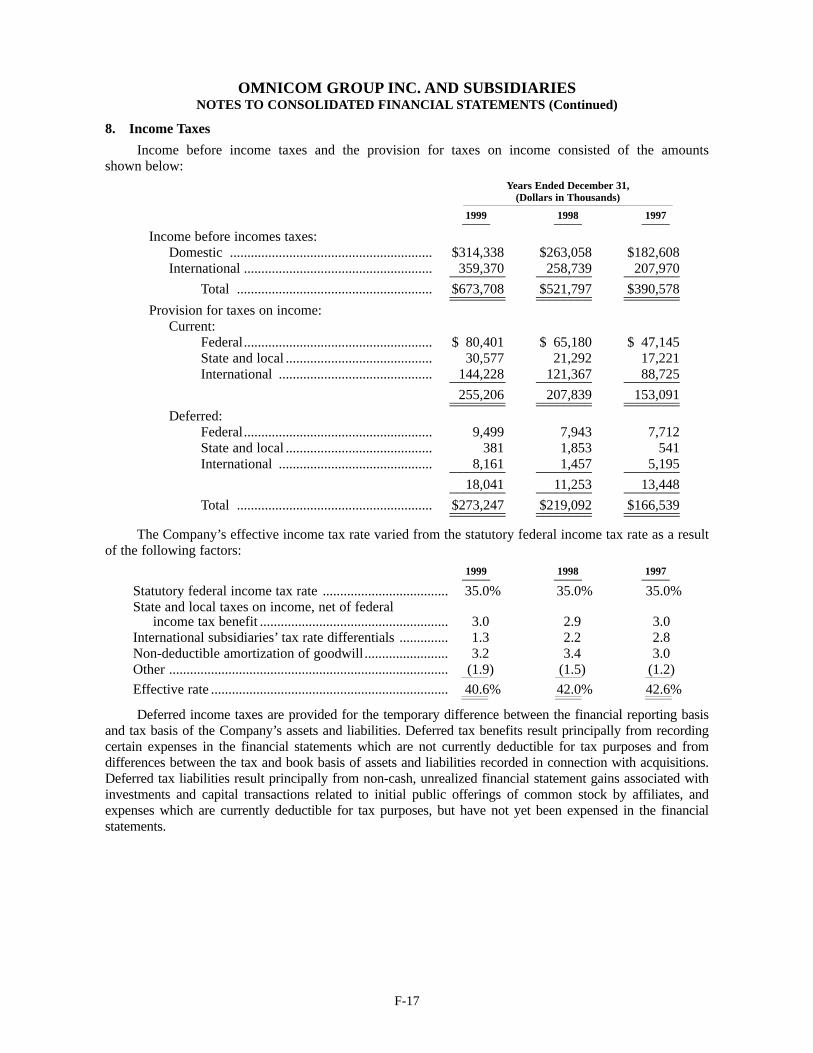
OMNICOM GROUP INC. AND SUBSIDIARIESNOTES TO CONSOLIDATED FINANCIAL STATEMENTS (Continued)
8. Income Taxes
Income before income taxes and the provision for taxes on income consisted of the amounts shown below:
Years Ended December 31,(Dollars in Thousands)
_______________________________________________________________
1999 1998 1997____ ____ ____Income before incomes taxes:
Domestic .......................................................... $314,338 $263,058 $182,608International ...................................................... 359,370 258,739 207,970________ ________ ________
Total ........................................................ $673,708 $521,797 $390,578________ ________ ________________ ________ ________Provision for taxes on income:
Current:Federal...................................................... $ 80,401 $ 65,180 $ 47,145State and local .......................................... 30,577 21,292 17,221International ............................................ 144,228 121,367 88,725________ ________ ________
255,206 207,839 153,091________ ________ ________________ ________ ________Deferred:
Federal...................................................... 9,499 7,943 7,712State and local .......................................... 381 1,853 541International ............................................ 8,161 1,457 5,195________ ________ ________________
18,041 11,253 13,448________ ________ ________________Total ........................................................ $273,247 $219,092 $166,539________ ________ ________________ ________ ________
The Company’s effective income tax rate varied from the statutory federal income tax rate as a resultof the following factors:
1999 1998 1997____ ____ ____Statutory federal income tax rate .................................... 35.0% 35.0% 35.0%State and local taxes on income, net of federal
income tax benefit ...................................................... 3.0 2.9 3.0International subsidiaries’ tax rate differentials .............. 1.3 2.2 2.8Non-deductible amortization of goodwill........................ 3.2 3.4 3.0Other ................................................................................ (1.9) (1.5) (1.2)________ ________ ________
Effective rate .................................................................... 40.6% 42.0% 42.6%________ ________ ________________ ________ ________
Deferred income taxes are provided for the temporary difference between the financial reporting basisand tax basis of the Company’s assets and liabilities. Deferred tax benefits result principally from recording certain expenses in the financial statements which are not currently deductible for tax purposes and from differences between the tax and book basis of assets and liabilities recorded in connection with acquisitions.Deferred tax liabilities result principally from non-cash, unrealized financial statement gains associated withinvestments and capital transactions related to initial public offerings of common stock by affiliates, andexpenses which are currently deductible for tax purposes, but have not yet been expensed in the financial statements.
F-17
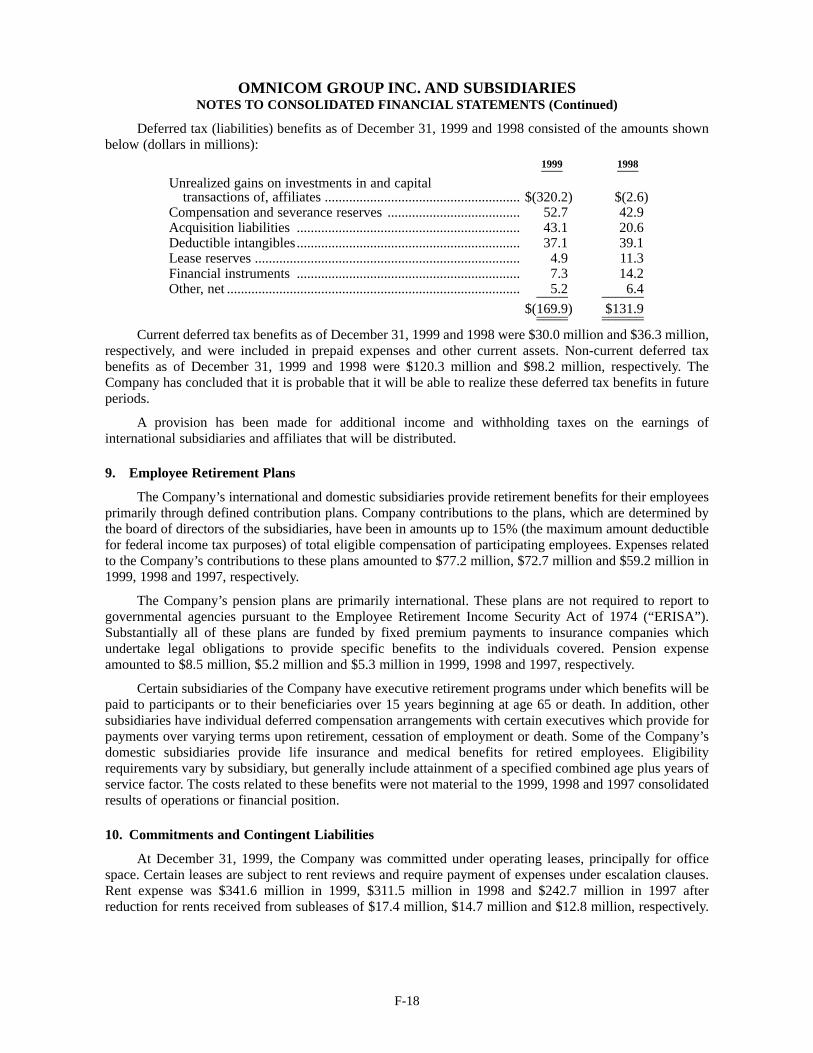
OMNICOM GROUP INC. AND SUBSIDIARIESNOTES TO CONSOLIDATED FINANCIAL STATEMENTS (Continued)
Deferred tax (liabilities) benefits as of December 31, 1999 and 1998 consisted of the amounts shownbelow (dollars in millions):
1999 1998____ ____
Unrealized gains on investments in and capital transactions of, affiliates ........................................................ $(320.2) $(2.6)
Compensation and severance reserves ...................................... 52.7 42.9Acquisition liabilities ................................................................ 43.1 20.6Deductible intangibles................................................................ 37.1 39.1Lease reserves ............................................................................ 4.9 11.3Financial instruments ................................................................ 7.3 14.2Other, net .................................................................................... 5.2 6.4_____ ______
$(169.9) $131.9_____ ___________ ______
Current deferred tax benefits as of December 31, 1999 and 1998 were $30.0 million and $36.3 million,respectively, and were included in prepaid expenses and other current assets. Non-current deferred tax benefits as of December 31, 1999 and 1998 were $120.3 million and $98.2 million, respectively. TheCompany has concluded that it is probable that it will be able to realize these deferred tax benefits in futureperiods.
A provision has been made for additional income and withholding taxes on the earnings of international subsidiaries and affiliates that will be distributed.
9. Employee Retirement Plans
The Company’s international and domestic subsidiaries provide retirement benefits for their employeesprimarily through defined contribution plans. Company contributions to the plans, which are determined bythe board of directors of the subsidiaries, have been in amounts up to 15% (the maximum amount deductiblefor federal income tax purposes) of total eligible compensation of participating employees. Expenses relatedto the Company’s contributions to these plans amounted to $77.2 million, $72.7 million and $59.2 million in1999, 1998 and 1997, respectively.
The Company’s pension plans are primarily international. These plans are not required to report to governmental agencies pursuant to the Employee Retirement Income Security Act of 1974 (“ERISA”).Substantially all of these plans are funded by fixed premium payments to insurance companies which undertake legal obligations to provide specific benefits to the individuals covered. Pension expense amounted to $8.5 million, $5.2 million and $5.3 million in 1999, 1998 and 1997, respectively.
Certain subsidiaries of the Company have executive retirement programs under which benefits will bepaid to participants or to their beneficiaries over 15 years beginning at age 65 or death. In addition, othersubsidiaries have individual deferred compensation arrangements with certain executives which provide forpayments over varying terms upon retirement, cessation of employment or death. Some of the Company’sdomestic subsidiaries provide life insurance and medical benefits for retired employees. Eligibility requirements vary by subsidiary, but generally include attainment of a specified combined age plus years ofservice factor. The costs related to these benefits were not material to the 1999, 1998 and 1997 consolidatedresults of operations or financial position.
10. Commitments and Contingent Liabilities
At December 31, 1999, the Company was committed under operating leases, principally for officespace. Certain leases are subject to rent reviews and require payment of expenses under escalation clauses.Rent expense was $341.6 million in 1999, $311.5 million in 1998 and $242.7 million in 1997 after reduction for rents received from subleases of $17.4 million, $14.7 million and $12.8 million, respectively.
F-18
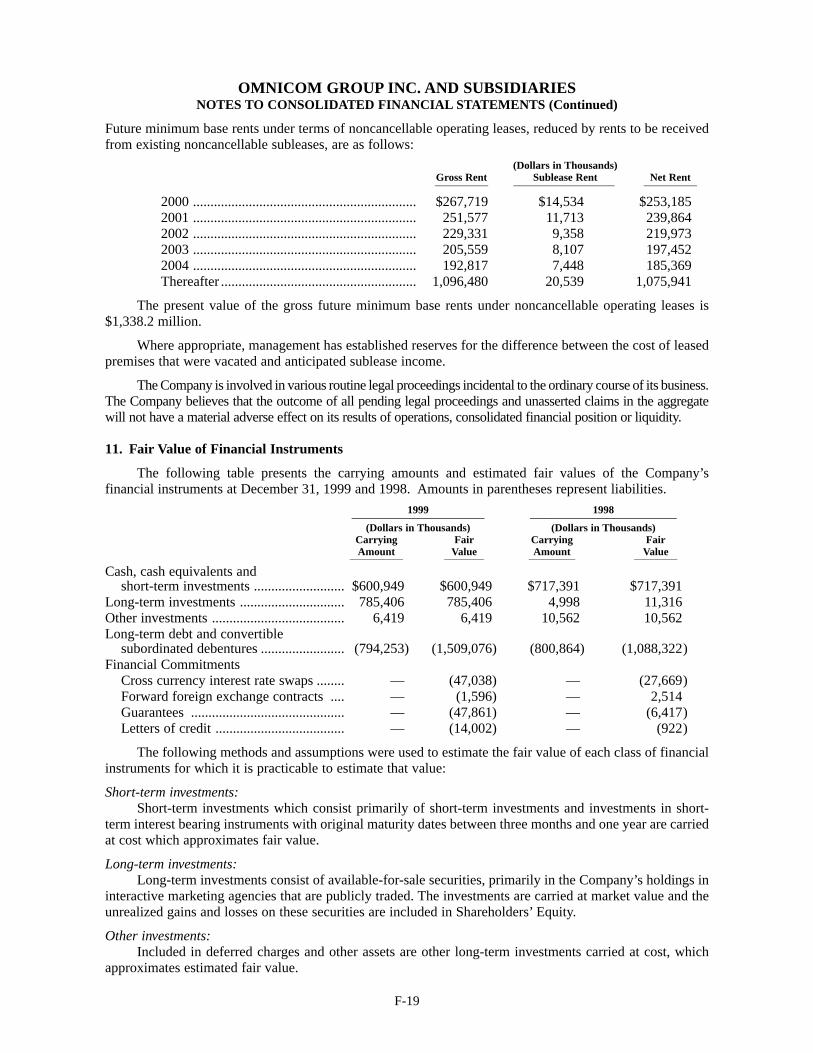
OMNICOM GROUP INC. AND SUBSIDIARIESNOTES TO CONSOLIDATED FINANCIAL STATEMENTS (Continued)
Future minimum base rents under terms of noncancellable operating leases, reduced by rents to be receivedfrom existing noncancellable subleases, are as follows:
(Dollars in Thousands)Gross Rent Sublease Rent Net Rent__________ ___________________ __________
2000 ................................................................ $267,719 $14,534 $253,1852001 ................................................................ 251,577 11,713 239,8642002 ................................................................ 229,331 9,358 219,9732003 ................................................................ 205,559 8,107 197,4522004 ................................................................ 192,817 7,448 185,369Thereafter ........................................................ 1,096,480 20,539 1,075,941
The present value of the gross future minimum base rents under noncancellable operating leases is$1,338.2 million.
Where appropriate, management has established reserves for the difference between the cost of leasedpremises that were vacated and anticipated sublease income.
The Company is involved in various routine legal proceedings incidental to the ordinary course of its business.The Company believes that the outcome of all pending legal proceedings and unasserted claims in the aggregatewill not have a material adverse effect on its results of operations, consolidated financial position or liquidity.
11. Fair Value of Financial Instruments
The following table presents the carrying amounts and estimated fair values of the Company’s financial instruments at December 31, 1999 and 1998. Amounts in parentheses represent liabilities.
1999 1998___________________ _____________________(Dollars in Thousands) (Dollars in Thousands)
Carrying Fair Carrying FairAmount Value Amount Value
________________ ____________ ______________ _____________
Cash, cash equivalents andshort-term investments .......................... $600,949 $600,949 $717,391 $717,391
Long-term investments .............................. 785,406 785,406 4,998 11,316Other investments ...................................... 6,419 6,419 10,562 10,562Long-term debt and convertible
subordinated debentures ........................ (794,253) (1,509,076) (800,864) (1,088,322)Financial Commitments
Cross currency interest rate swaps ........ — (47,038) — (27,669)Forward foreign exchange contracts .... — (1,596) — 2,514Guarantees ............................................ — (47,861) — (6,417)Letters of credit ..................................... — (14,002) — (922)
The following methods and assumptions were used to estimate the fair value of each class of financialinstruments for which it is practicable to estimate that value:
Short-term investments:Short-term investments which consist primarily of short-term investments and investments in short-
term interest bearing instruments with original maturity dates between three months and one year are carriedat cost which approximates fair value.
Long-term investments:Long-term investments consist of available-for-sale securities, primarily in the Company’s holdings in
interactive marketing agencies that are publicly traded. The investments are carried at market value and theunrealized gains and losses on these securities are included in Shareholders’ Equity.
Other investments:Included in deferred charges and other assets are other long-term investments carried at cost, which
approximates estimated fair value.
F-19
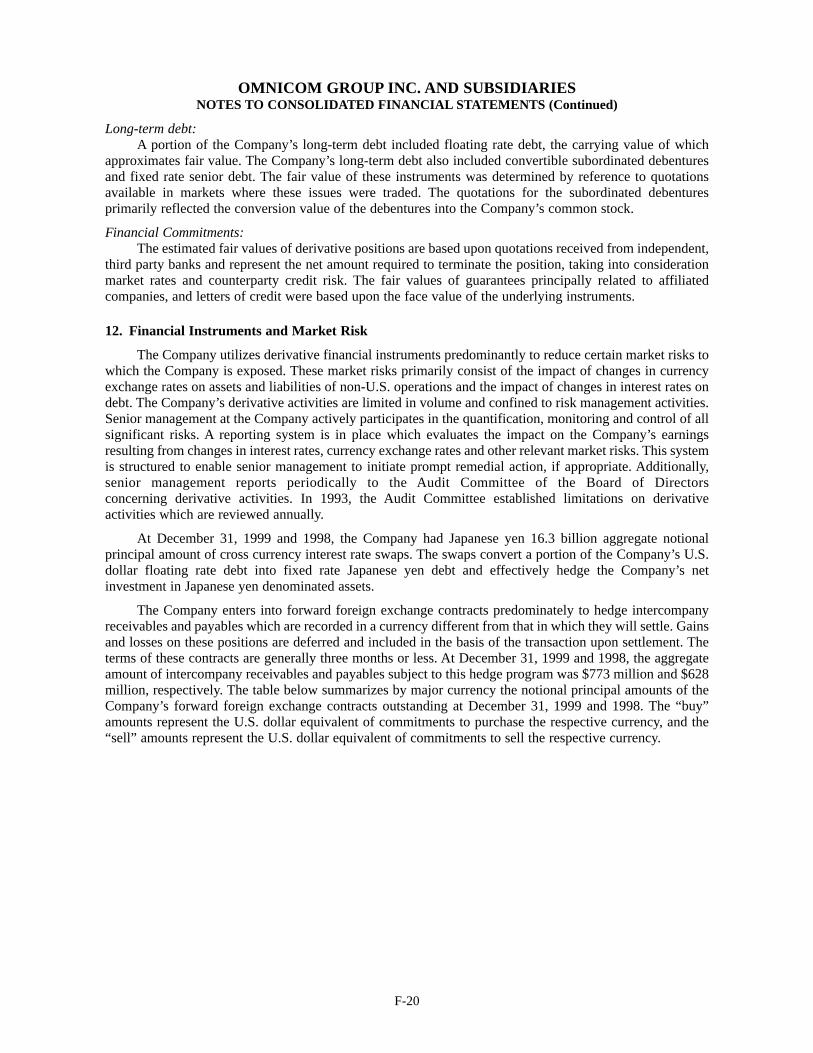
OMNICOM GROUP INC. AND SUBSIDIARIESNOTES TO CONSOLIDATED FINANCIAL STATEMENTS (Continued)
Long-term debt:A portion of the Company’s long-term debt included floating rate debt, the carrying value of which
approximates fair value. The Company’s long-term debt also included convertible subordinated debenturesand fixed rate senior debt. The fair value of these instruments was determined by reference to quotationsavailable in markets where these issues were traded. The quotations for the subordinated debentures primarily reflected the conversion value of the debentures into the Company’s common stock.
Financial Commitments:The estimated fair values of derivative positions are based upon quotations received from independent,
third party banks and represent the net amount required to terminate the position, taking into considerationmarket rates and counterparty credit risk. The fair values of guarantees principally related to affiliated companies, and letters of credit were based upon the face value of the underlying instruments.
12. Financial Instruments and Market Risk
The Company utilizes derivative financial instruments predominantly to reduce certain market risks towhich the Company is exposed. These market risks primarily consist of the impact of changes in currencyexchange rates on assets and liabilities of non-U.S. operations and the impact of changes in interest rates ondebt. The Company’s derivative activities are limited in volume and confined to risk management activities.Senior management at the Company actively participates in the quantification, monitoring and control of allsignificant risks. A reporting system is in place which evaluates the impact on the Company’s earnings resulting from changes in interest rates, currency exchange rates and other relevant market risks. This systemis structured to enable senior management to initiate prompt remedial action, if appropriate. Additionally,senior management reports periodically to the Audit Committee of the Board of Directors concerning derivative activities. In 1993, the Audit Committee established limitations on derivative activities which are reviewed annually.
At December 31, 1999 and 1998, the Company had Japanese yen 16.3 billion aggregate notional principal amount of cross currency interest rate swaps. The swaps convert a portion of the Company’s U.S.dollar floating rate debt into fixed rate Japanese yen debt and effectively hedge the Company’s net investment in Japanese yen denominated assets.
The Company enters into forward foreign exchange contracts predominately to hedge intercompanyreceivables and payables which are recorded in a currency different from that in which they will settle. Gainsand losses on these positions are deferred and included in the basis of the transaction upon settlement. Theterms of these contracts are generally three months or less. At December 31, 1999 and 1998, the aggregateamount of intercompany receivables and payables subject to this hedge program was $773 million and $628million, respectively. The table below summarizes by major currency the notional principal amounts of theCompany’s forward foreign exchange contracts outstanding at December 31, 1999 and 1998. The “buy”amounts represent the U.S. dollar equivalent of commitments to purchase the respective currency, and the“sell” amounts represent the U.S. dollar equivalent of commitments to sell the respective currency.
F-20
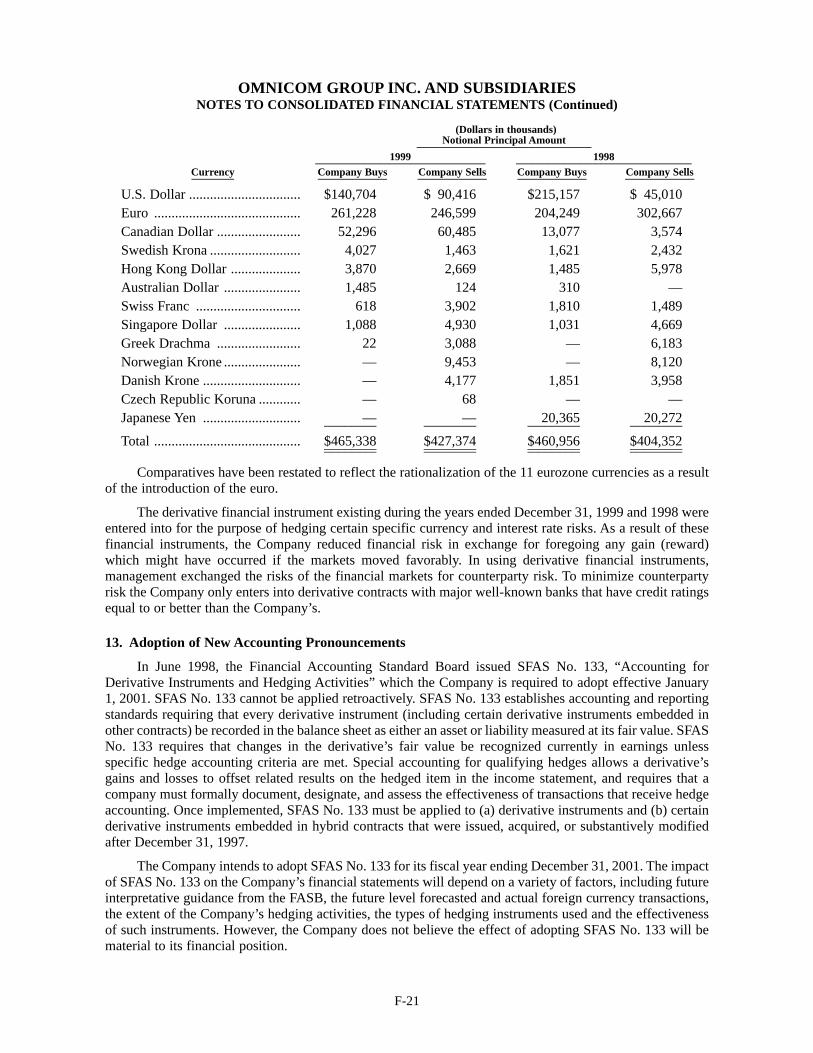
OMNICOM GROUP INC. AND SUBSIDIARIESNOTES TO CONSOLIDATED FINANCIAL STATEMENTS (Continued)
(Dollars in thousands)Notional Principal Amount_________________________
1999 1998________________________________ _________________________________Currency Company Buys Company Sells Company Buys Company Sells________ _____________ _____________ _____________ _____________
U.S. Dollar ................................ $140,704 $ 90,416 $215,157 $ 45,010Euro .......................................... 261,228 246,599 204,249 302,667Canadian Dollar ........................ 52,296 60,485 13,077 3,574Swedish Krona .......................... 4,027 1,463 1,621 2,432Hong Kong Dollar .................... 3,870 2,669 1,485 5,978Australian Dollar ...................... 1,485 124 310 —Swiss Franc .............................. 618 3,902 1,810 1,489Singapore Dollar ...................... 1,088 4,930 1,031 4,669Greek Drachma ........................ 22 3,088 — 6,183Norwegian Krone ...................... — 9,453 — 8,120Danish Krone ............................ — 4,177 1,851 3,958Czech Republic Koruna ............ — 68 — —Japanese Yen ............................ — — 20,365 20,272_______________ _______________ _______________ _______________
Total .......................................... $465,338 $427,374 $460,956 $404,352_______________ _______________ _______________ ______________________________ _______________ _______________ _______________
Comparatives have been restated to reflect the rationalization of the 11 eurozone currencies as a resultof the introduction of the euro.
The derivative financial instrument existing during the years ended December 31, 1999 and 1998 wereentered into for the purpose of hedging certain specific currency and interest rate risks. As a result of thesefinancial instruments, the Company reduced financial risk in exchange for foregoing any gain (reward)which might have occurred if the markets moved favorably. In using derivative financial instruments, management exchanged the risks of the financial markets for counterparty risk. To minimize counterpartyrisk the Company only enters into derivative contracts with major well-known banks that have credit ratingsequal to or better than the Company’s.
13. Adoption of New Accounting Pronouncements
In June 1998, the Financial Accounting Standard Board issued SFAS No. 133, “Accounting forDerivative Instruments and Hedging Activities” which the Company is required to adopt effective January1, 2001. SFAS No. 133 cannot be applied retroactively. SFAS No. 133 establishes accounting and reportingstandards requiring that every derivative instrument (including certain derivative instruments embedded inother contracts) be recorded in the balance sheet as either an asset or liability measured at its fair value. SFASNo. 133 requires that changes in the derivative’s fair value be recognized currently in earnings unless specific hedge accounting criteria are met. Special accounting for qualifying hedges allows a derivative’sgains and losses to offset related results on the hedged item in the income statement, and requires that a company must formally document, designate, and assess the effectiveness of transactions that receive hedgeaccounting. Once implemented, SFAS No. 133 must be applied to (a) derivative instruments and (b) certainderivative instruments embedded in hybrid contracts that were issued, acquired, or substantively modifiedafter December 31, 1997.
The Company intends to adopt SFAS No. 133 for its fiscal year ending December 31, 2001. The impactof SFAS No. 133 on the Company’s financial statements will depend on a variety of factors, including futureinterpretative guidance from the FASB, the future level forecasted and actual foreign currency transactions,the extent of the Company’s hedging activities, the types of hedging instruments used and the effectivenessof such instruments. However, the Company does not believe the effect of adopting SFAS No. 133 will bematerial to its financial position.
F-21
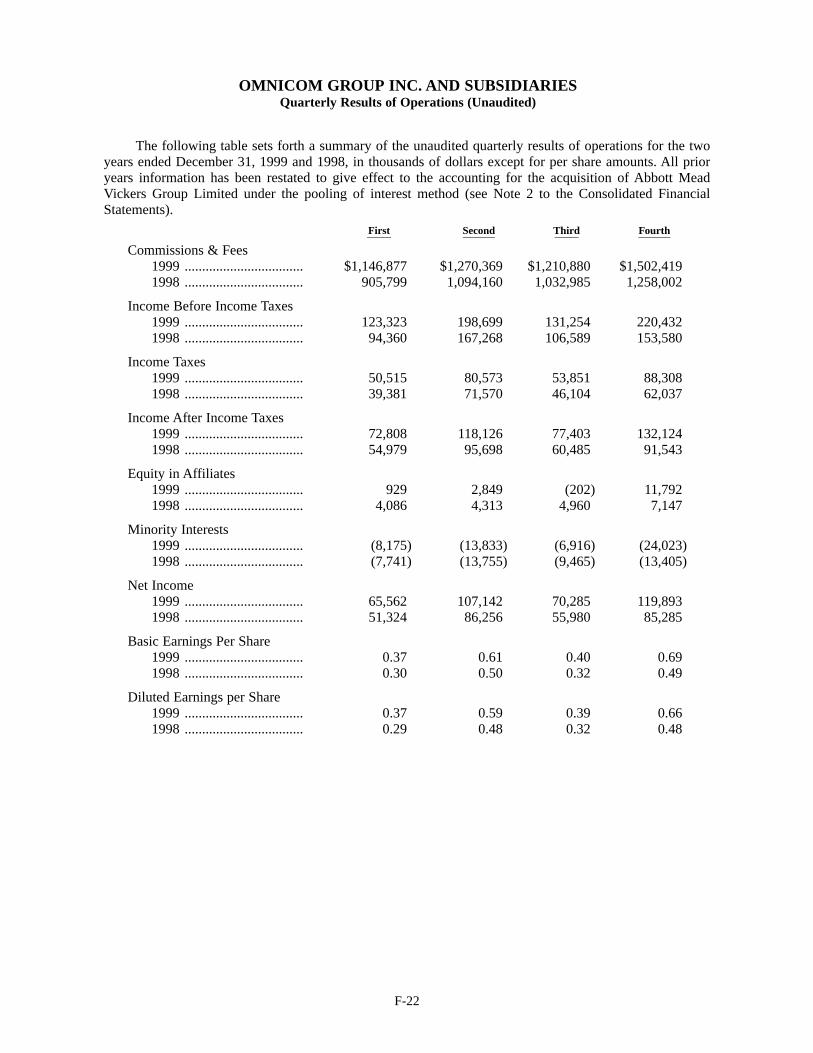
F-22
OMNICOM GROUP INC. AND SUBSIDIARIESQuarterly Results of Operations (Unaudited)
The following table sets forth a summary of the unaudited quarterly results of operations for the twoyears ended December 31, 1999 and 1998, in thousands of dollars except for per share amounts. All prioryears information has been restated to give effect to the accounting for the acquisition of Abbott MeadVickers Group Limited under the pooling of interest method (see Note 2 to the Consolidated FinancialStatements).
First Second Third Fourth_________ ____________ _________ ____________
Commissions & Fees1999 .................................. $1,146,877 $1,270,369 $1,210,880 $1,502,4191998 .................................. 905,799 1,094,160 1,032,985 1,258,002
Income Before Income Taxes1999 .................................. 123,323 198,699 131,254 220,4321998 .................................. 94,360 167,268 106,589 153,580
Income Taxes1999 .................................. 50,515 80,573 53,851 88,3081998 .................................. 39,381 71,570 46,104 62,037
Income After Income Taxes1999 .................................. 72,808 118,126 77,403 132,1241998 .................................. 54,979 95,698 60,485 91,543
Equity in Affiliates1999 .................................. 929 2,849 (202) 11,7921998 .................................. 4,086 4,313 4,960 7,147
Minority Interests1999 .................................. (8,175) (13,833) (6,916) (24,023)1998 .................................. (7,741) (13,755) (9,465) (13,405)
Net Income1999 .................................. 65,562 107,142 70,285 119,8931998 .................................. 51,324 86,256 55,980 85,285
Basic Earnings Per Share1999 .................................. 0.37 0.61 0.40 0.691998 .................................. 0.30 0.50 0.32 0.49
Diluted Earnings per Share1999 .................................. 0.37 0.59 0.39 0.661998 .................................. 0.29 0.48 0.32 0.48
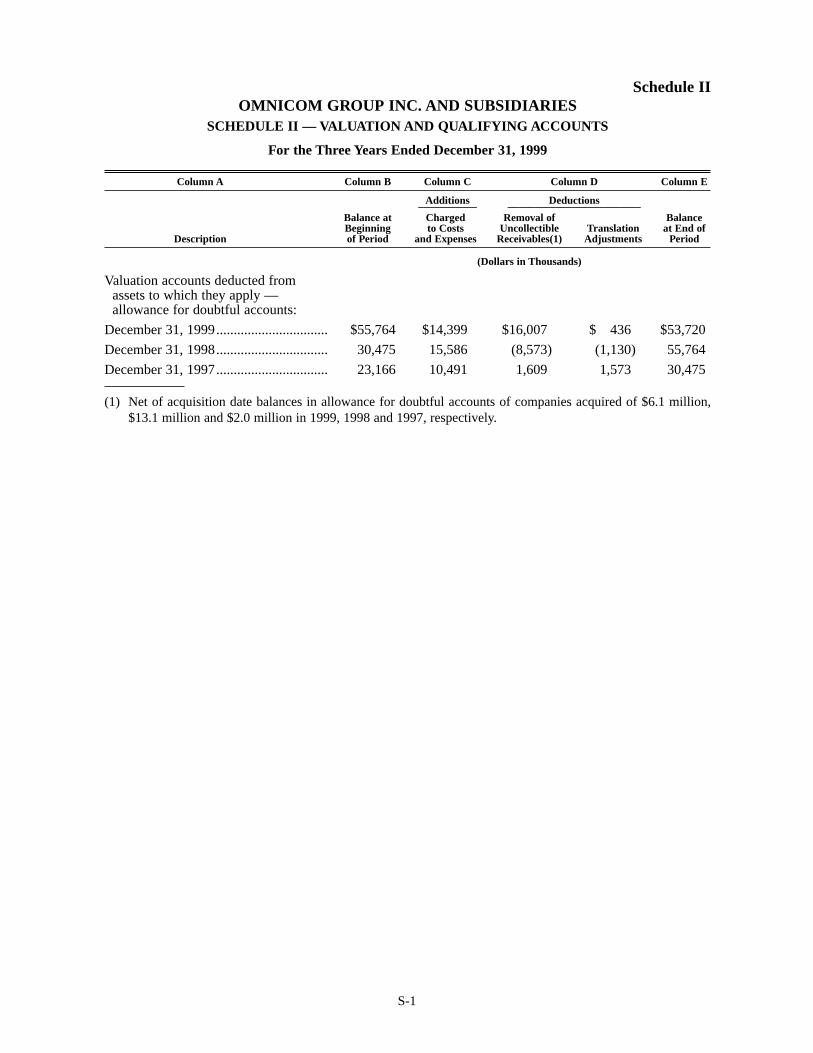
S-1
Schedule IIOMNICOM GROUP INC. AND SUBSIDIARIES
SCHEDULE II — VALUATION AND QUALIFYING ACCOUNTS
For the Three Years Ended December 31, 1999
Column A Column B Column C Column D Column E
Additions Deductions___________ _________________________Balance at Charged Removal of BalanceBeginning to Costs Uncollectible Translation at End of
Description of Period and Expenses Receivables(1) Adjustments Period
(Dollars in Thousands)
Valuation accounts deducted from assets to which they apply — allowance for doubtful accounts:
December 31, 1999................................ $55,764 $14,399 $16,007 $ 436 $53,720
December 31, 1998................................ 30,475 15,586 (8,573) (1,130) 55,764
December 31, 1997................................ 23,166 10,491 1,609 1,573 30,475
(1) Net of acquisition date balances in allowance for doubtful accounts of companies acquired of $6.1 million,$13.1 million and $2.0 million in 1999, 1998 and 1997, respectively.
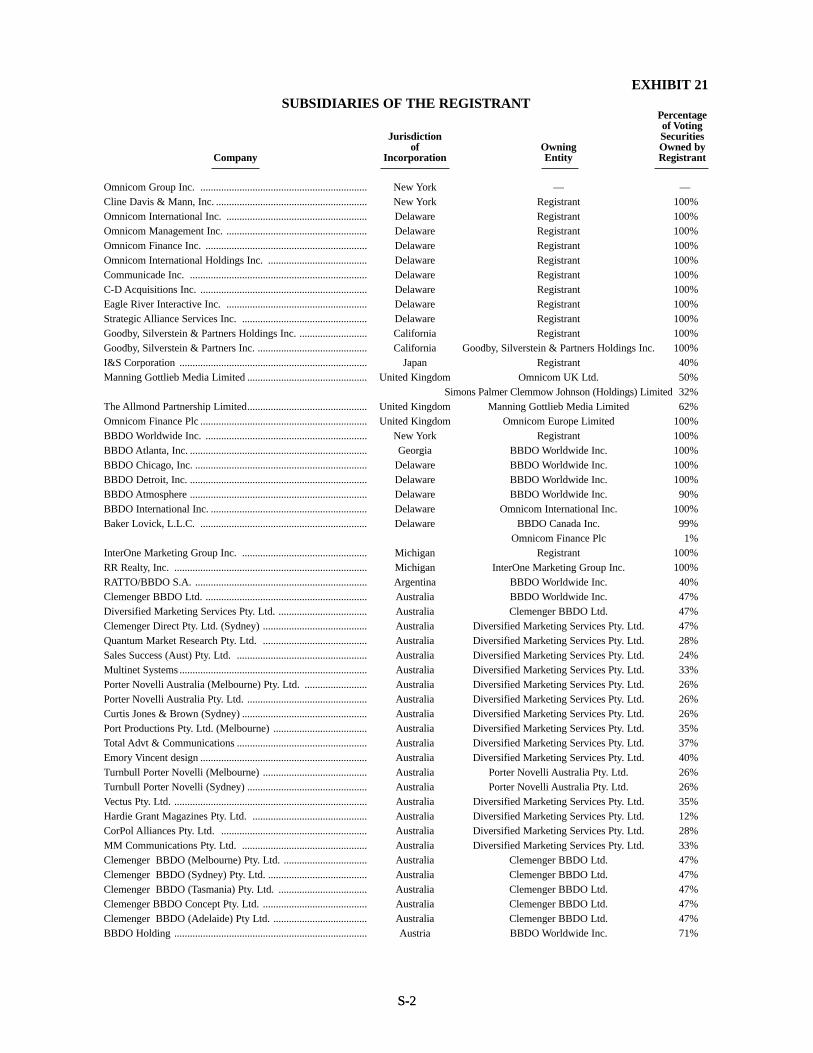
S-2
EXHIBIT 21SUBSIDIARIES OF THE REGISTRANT
Percentageof Voting
Jurisdiction Securitiesof Owning Owned by
Company Incorporation Entity Registrant
Omnicom Group Inc. ................................................................ New York — —Cline Davis & Mann, Inc. .......................................................... New York Registrant 100%Omnicom International Inc. ...................................................... Delaware Registrant 100%Omnicom Management Inc. ...................................................... Delaware Registrant 100%Omnicom Finance Inc. .............................................................. Delaware Registrant 100%Omnicom International Holdings Inc. ...................................... Delaware Registrant 100%Communicade Inc. .................................................................... Delaware Registrant 100%C-D Acquisitions Inc. ................................................................ Delaware Registrant 100%Eagle River Interactive Inc. ...................................................... Delaware Registrant 100%Strategic Alliance Services Inc. ................................................ Delaware Registrant 100%Goodby, Silverstein & Partners Holdings Inc. .......................... California Registrant 100%Goodby, Silverstein & Partners Inc. .......................................... California Goodby, Silverstein & Partners Holdings Inc. 100%I&S Corporation ........................................................................ Japan Registrant 40%Manning Gottlieb Media Limited .............................................. United Kingdom Omnicom UK Ltd. 50%
Simons Palmer Clemmow Johnson (Holdings) Limited 32%The Allmond Partnership Limited.............................................. United Kingdom Manning Gottlieb Media Limited 62%Omnicom Finance Plc ................................................................ United Kingdom Omnicom Europe Limited 100%BBDO Worldwide Inc. .............................................................. New York Registrant 100%BBDO Atlanta, Inc. .................................................................... Georgia BBDO Worldwide Inc. 100%BBDO Chicago, Inc. .................................................................. Delaware BBDO Worldwide Inc. 100%BBDO Detroit, Inc. .................................................................... Delaware BBDO Worldwide Inc. 100%BBDO Atmosphere .................................................................... Delaware BBDO Worldwide Inc. 90%BBDO International Inc. ............................................................ Delaware Omnicom International Inc. 100%Baker Lovick, L.L.C. ................................................................ Delaware BBDO Canada Inc. 99%
Omnicom Finance Plc 1%InterOne Marketing Group Inc. ................................................ Michigan Registrant 100%RR Realty, Inc. .......................................................................... Michigan InterOne Marketing Group Inc. 100%RATTO/BBDO S.A. .................................................................. Argentina BBDO Worldwide Inc. 40%Clemenger BBDO Ltd. .............................................................. Australia BBDO Worldwide Inc. 47%Diversified Marketing Services Pty. Ltd. .................................. Australia Clemenger BBDO Ltd. 47%Clemenger Direct Pty. Ltd. (Sydney) ........................................ Australia Diversified Marketing Services Pty. Ltd. 47%Quantum Market Research Pty. Ltd. ........................................ Australia Diversified Marketing Services Pty. Ltd. 28%Sales Success (Aust) Pty. Ltd. .................................................. Australia Diversified Marketing Services Pty. Ltd. 24%Multinet Systems ........................................................................ Australia Diversified Marketing Services Pty. Ltd. 33%Porter Novelli Australia (Melbourne) Pty. Ltd. ........................ Australia Diversified Marketing Services Pty. Ltd. 26%Porter Novelli Australia Pty. Ltd. .............................................. Australia Diversified Marketing Services Pty. Ltd. 26%Curtis Jones & Brown (Sydney) ................................................ Australia Diversified Marketing Services Pty. Ltd. 26%Port Productions Pty. Ltd. (Melbourne) .................................... Australia Diversified Marketing Services Pty. Ltd. 35%Total Advt & Communications .................................................. Australia Diversified Marketing Services Pty. Ltd. 37%Emory Vincent design ................................................................ Australia Diversified Marketing Services Pty. Ltd. 40%Turnbull Porter Novelli (Melbourne) ........................................ Australia Porter Novelli Australia Pty. Ltd. 26%Turnbull Porter Novelli (Sydney) .............................................. Australia Porter Novelli Australia Pty. Ltd. 26%Vectus Pty. Ltd. .......................................................................... Australia Diversified Marketing Services Pty. Ltd. 35%Hardie Grant Magazines Pty. Ltd. ............................................ Australia Diversified Marketing Services Pty. Ltd. 12%CorPol Alliances Pty. Ltd. ........................................................ Australia Diversified Marketing Services Pty. Ltd. 28%MM Communications Pty. Ltd. ................................................ Australia Diversified Marketing Services Pty. Ltd. 33%Clemenger BBDO (Melbourne) Pty. Ltd. ................................ Australia Clemenger BBDO Ltd. 47%Clemenger BBDO (Sydney) Pty. Ltd. ...................................... Australia Clemenger BBDO Ltd. 47%Clemenger BBDO (Tasmania) Pty. Ltd. .................................. Australia Clemenger BBDO Ltd. 47%Clemenger BBDO Concept Pty. Ltd. ........................................ Australia Clemenger BBDO Ltd. 47%Clemenger BBDO (Adelaide) Pty Ltd. .................................... Australia Clemenger BBDO Ltd. 47%BBDO Holding .......................................................................... Austria BBDO Worldwide Inc. 71%
S-2
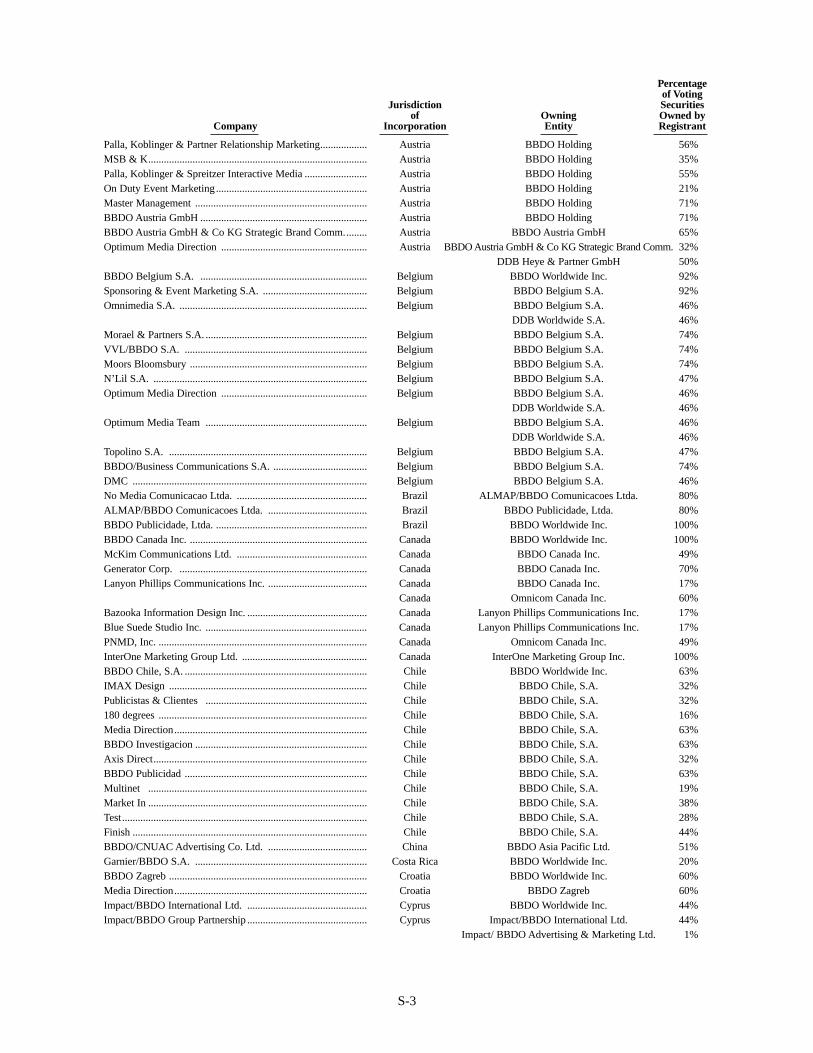
Percentageof Voting
Jurisdiction Securitiesof Owning Owned by
Company Incorporation Entity Registrant
S-3
Palla, Koblinger & Partner Relationship Marketing.................. Austria BBDO Holding 56%MSB & K.................................................................................... Austria BBDO Holding 35%Palla, Koblinger & Spreitzer Interactive Media ........................ Austria BBDO Holding 55%On Duty Event Marketing.......................................................... Austria BBDO Holding 21%Master Management .................................................................. Austria BBDO Holding 71%BBDO Austria GmbH ................................................................ Austria BBDO Holding 71%BBDO Austria GmbH & Co KG Strategic Brand Comm......... Austria BBDO Austria GmbH 65%Optimum Media Direction ........................................................ Austria BBDO Austria GmbH & Co KG Strategic Brand Comm. 32%
DDB Heye & Partner GmbH 50%BBDO Belgium S.A. ................................................................ Belgium BBDO Worldwide Inc. 92%Sponsoring & Event Marketing S.A. ........................................ Belgium BBDO Belgium S.A. 92%Omnimedia S.A. ........................................................................ Belgium BBDO Belgium S.A. 46%
DDB Worldwide S.A. 46%Morael & Partners S.A. .............................................................. Belgium BBDO Belgium S.A. 74%VVL/BBDO S.A. ...................................................................... Belgium BBDO Belgium S.A. 74%Moors Bloomsbury .................................................................... Belgium BBDO Belgium S.A. 74%N’Lil S.A. .................................................................................. Belgium BBDO Belgium S.A. 47%Optimum Media Direction ........................................................ Belgium BBDO Belgium S.A. 46%
DDB Worldwide S.A. 46%Optimum Media Team .............................................................. Belgium BBDO Belgium S.A. 46%
DDB Worldwide S.A. 46%Topolino S.A. ............................................................................ Belgium BBDO Belgium S.A. 47%BBDO/Business Communications S.A. .................................... Belgium BBDO Belgium S.A. 74%DMC .......................................................................................... Belgium BBDO Belgium S.A. 46%No Media Comunicacao Ltda. .................................................. Brazil ALMAP/BBDO Comunicacoes Ltda. 80%ALMAP/BBDO Comunicacoes Ltda. ...................................... Brazil BBDO Publicidade, Ltda. 80%BBDO Publicidade, Ltda. .......................................................... Brazil BBDO Worldwide Inc. 100%BBDO Canada Inc. .................................................................... Canada BBDO Worldwide Inc. 100%McKim Communications Ltd. .................................................. Canada BBDO Canada Inc. 49%Generator Corp. ........................................................................ Canada BBDO Canada Inc. 70%Lanyon Phillips Communications Inc. ...................................... Canada BBDO Canada Inc. 17%
Canada Omnicom Canada Inc. 60%Bazooka Information Design Inc. .............................................. Canada Lanyon Phillips Communications Inc. 17%Blue Suede Studio Inc. .............................................................. Canada Lanyon Phillips Communications Inc. 17%PNMD, Inc. ................................................................................ Canada Omnicom Canada Inc. 49%InterOne Marketing Group Ltd. ................................................ Canada InterOne Marketing Group Inc. 100%BBDO Chile, S.A. ...................................................................... Chile BBDO Worldwide Inc. 63%IMAX Design ............................................................................ Chile BBDO Chile, S.A. 32%Publicistas & Clientes .............................................................. Chile BBDO Chile, S.A. 32%180 degrees ................................................................................ Chile BBDO Chile, S.A. 16%Media Direction.......................................................................... Chile BBDO Chile, S.A. 63%BBDO Investigacion .................................................................. Chile BBDO Chile, S.A. 63%Axis Direct.................................................................................. Chile BBDO Chile, S.A. 32%BBDO Publicidad ...................................................................... Chile BBDO Chile, S.A. 63%Multinet .................................................................................... Chile BBDO Chile, S.A. 19%Market In .................................................................................... Chile BBDO Chile, S.A. 38%Test.............................................................................................. Chile BBDO Chile, S.A. 28%Finish .......................................................................................... Chile BBDO Chile, S.A. 44%BBDO/CNUAC Advertising Co. Ltd. ...................................... China BBDO Asia Pacific Ltd. 51%Garnier/BBDO S.A. .................................................................. Costa Rica BBDO Worldwide Inc. 20%BBDO Zagreb ............................................................................ Croatia BBDO Worldwide Inc. 60%Media Direction.......................................................................... Croatia BBDO Zagreb 60%Impact/BBDO International Ltd. .............................................. Cyprus BBDO Worldwide Inc. 44%Impact/BBDO Group Partnership .............................................. Cyprus Impact/BBDO International Ltd. 44%
Impact/ BBDO Advertising & Marketing Ltd. 1%
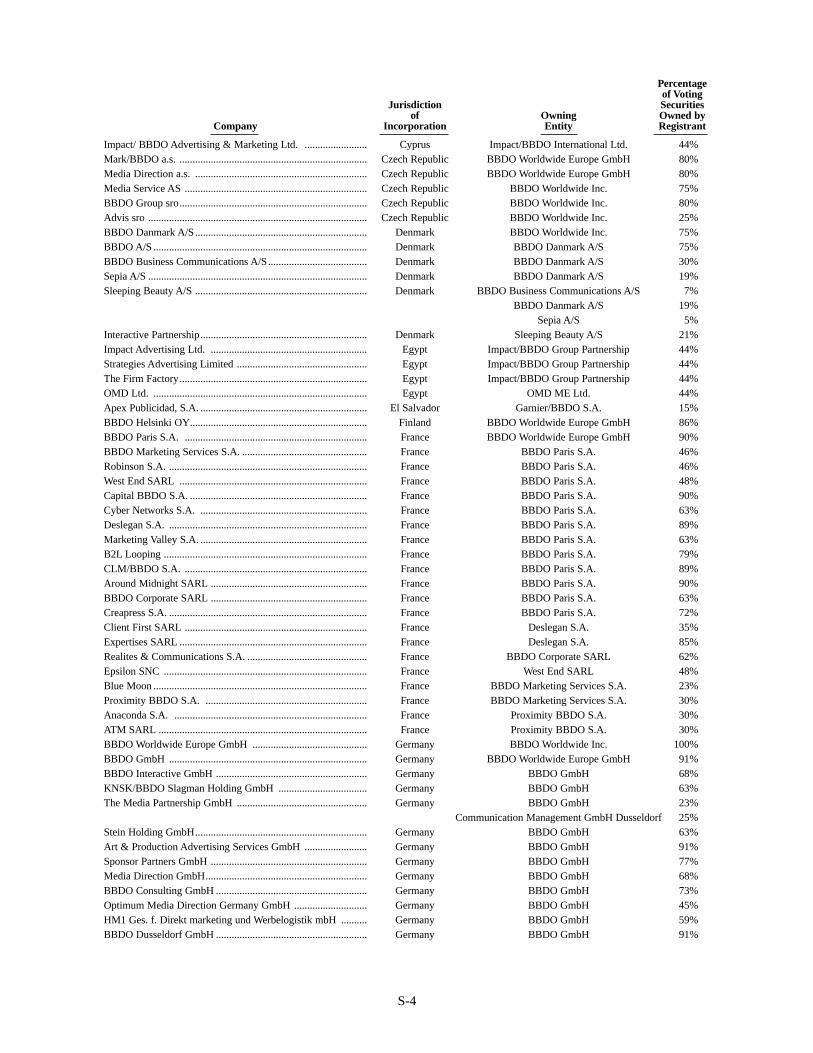
Percentageof Voting
Jurisdiction Securitiesof Owning Owned by
Company Incorporation Entity Registrant
S-4
Impact/ BBDO Advertising & Marketing Ltd. ........................ Cyprus Impact/BBDO International Ltd. 44%Mark/BBDO a.s. ........................................................................ Czech Republic BBDO Worldwide Europe GmbH 80%Media Direction a.s. .................................................................. Czech Republic BBDO Worldwide Europe GmbH 80%Media Service AS ...................................................................... Czech Republic BBDO Worldwide Inc. 75%BBDO Group sro........................................................................ Czech Republic BBDO Worldwide Inc. 80%Advis sro .................................................................................... Czech Republic BBDO Worldwide Inc. 25%BBDO Danmark A/S.................................................................. Denmark BBDO Worldwide Inc. 75%BBDO A/S .................................................................................. Denmark BBDO Danmark A/S 75%BBDO Business Communications A/S...................................... Denmark BBDO Danmark A/S 30%Sepia A/S .................................................................................... Denmark BBDO Danmark A/S 19%Sleeping Beauty A/S .................................................................. Denmark BBDO Business Communications A/S 7%
BBDO Danmark A/S 19%Sepia A/S 5%
Interactive Partnership................................................................ Denmark Sleeping Beauty A/S 21%Impact Advertising Ltd. ............................................................ Egypt Impact/BBDO Group Partnership 44%Strategies Advertising Limited .................................................. Egypt Impact/BBDO Group Partnership 44%The Firm Factory........................................................................ Egypt Impact/BBDO Group Partnership 44%OMD Ltd. .................................................................................. Egypt OMD ME Ltd. 44%Apex Publicidad, S.A. ................................................................ El Salvador Garnier/BBDO S.A. 15%BBDO Helsinki OY.................................................................... Finland BBDO Worldwide Europe GmbH 86%BBDO Paris S.A. ...................................................................... France BBDO Worldwide Europe GmbH 90%BBDO Marketing Services S.A. ................................................ France BBDO Paris S.A. 46%Robinson S.A. ............................................................................ France BBDO Paris S.A. 46%West End SARL ........................................................................ France BBDO Paris S.A. 48%Capital BBDO S.A. .................................................................... France BBDO Paris S.A. 90%Cyber Networks S.A. ................................................................ France BBDO Paris S.A. 63%Deslegan S.A. ............................................................................ France BBDO Paris S.A. 89%Marketing Valley S.A. ................................................................ France BBDO Paris S.A. 63%B2L Looping .............................................................................. France BBDO Paris S.A. 79%CLM/BBDO S.A. ...................................................................... France BBDO Paris S.A. 89%Around Midnight SARL ............................................................ France BBDO Paris S.A. 90%BBDO Corporate SARL ............................................................ France BBDO Paris S.A. 63%Creapress S.A. ............................................................................ France BBDO Paris S.A. 72%Client First SARL ...................................................................... France Deslegan S.A. 35%Expertises SARL ........................................................................ France Deslegan S.A. 85%Realites & Communications S.A. .............................................. France BBDO Corporate SARL 62%Epsilon SNC .............................................................................. France West End SARL 48%Blue Moon .................................................................................. France BBDO Marketing Services S.A. 23%Proximity BBDO S.A. .............................................................. France BBDO Marketing Services S.A. 30%Anaconda S.A. .......................................................................... France Proximity BBDO S.A. 30%ATM SARL ................................................................................ France Proximity BBDO S.A. 30%BBDO Worldwide Europe GmbH ............................................ Germany BBDO Worldwide Inc. 100%BBDO GmbH ............................................................................ Germany BBDO Worldwide Europe GmbH 91%BBDO Interactive GmbH .......................................................... Germany BBDO GmbH 68%KNSK/BBDO Slagman Holding GmbH .................................. Germany BBDO GmbH 63%The Media Partnership GmbH .................................................. Germany BBDO GmbH 23%
Communication Management GmbH Dusseldorf 25%Stein Holding GmbH.................................................................. Germany BBDO GmbH 63%Art & Production Advertising Services GmbH ........................ Germany BBDO GmbH 91%Sponsor Partners GmbH ............................................................ Germany BBDO GmbH 77%Media Direction GmbH.............................................................. Germany BBDO GmbH 68%BBDO Consulting GmbH .......................................................... Germany BBDO GmbH 73%Optimum Media Direction Germany GmbH ............................ Germany BBDO GmbH 45%HM1 Ges. f. Direkt marketing und Werbelogistik mbH .......... Germany BBDO GmbH 59%BBDO Dusseldorf GmbH .......................................................... Germany BBDO GmbH 91%
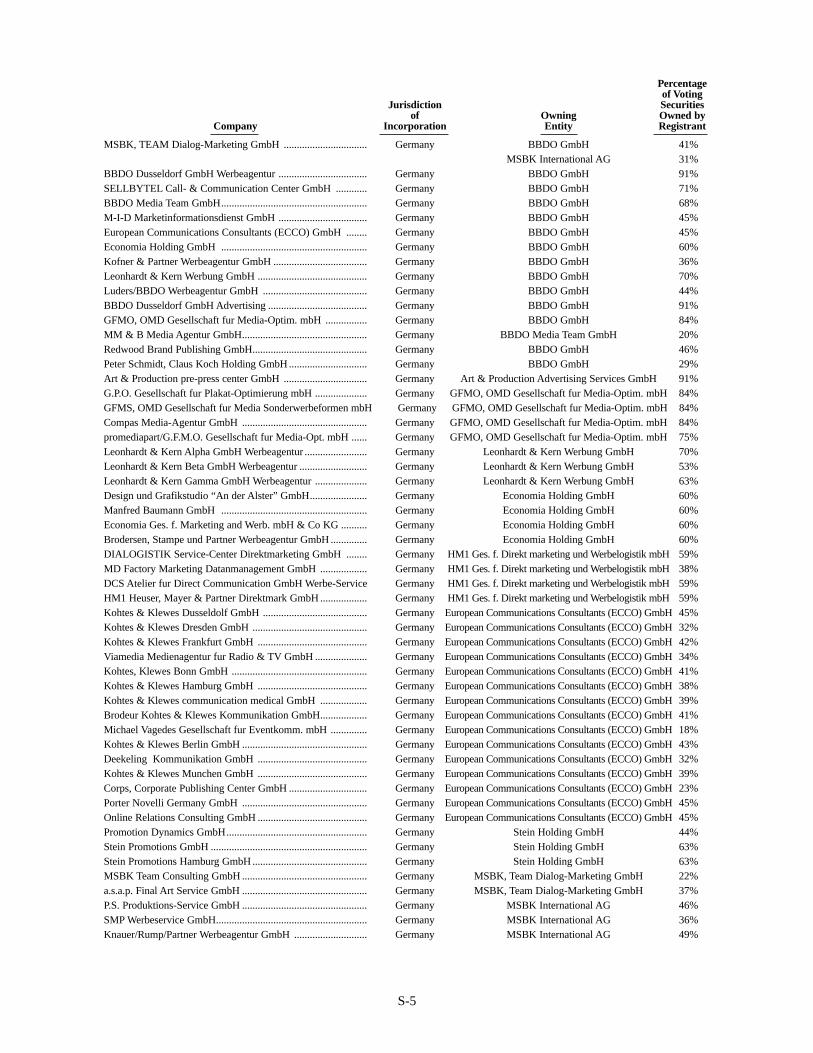
Percentageof Voting
Jurisdiction Securitiesof Owning Owned by
Company Incorporation Entity Registrant
S-5
MSBK, TEAM Dialog-Marketing GmbH ................................ Germany BBDO GmbH 41%MSBK International AG 31%
BBDO Dusseldorf GmbH Werbeagentur .................................. Germany BBDO GmbH 91%SELLBYTEL Call- & Communication Center GmbH ............ Germany BBDO GmbH 71%BBDO Media Team GmbH........................................................ Germany BBDO GmbH 68%M-I-D Marketinformationsdienst GmbH .................................. Germany BBDO GmbH 45%European Communications Consultants (ECCO) GmbH ........ Germany BBDO GmbH 45%Economia Holding GmbH ........................................................ Germany BBDO GmbH 60%Kofner & Partner Werbeagentur GmbH .................................... Germany BBDO GmbH 36%Leonhardt & Kern Werbung GmbH .......................................... Germany BBDO GmbH 70%Luders/BBDO Werbeagentur GmbH ........................................ Germany BBDO GmbH 44%BBDO Dusseldorf GmbH Advertising ...................................... Germany BBDO GmbH 91%GFMO, OMD Gesellschaft fur Media-Optim. mbH ................ Germany BBDO GmbH 84%MM & B Media Agentur GmbH................................................ Germany BBDO Media Team GmbH 20%Redwood Brand Publishing GmbH............................................ Germany BBDO GmbH 46%Peter Schmidt, Claus Koch Holding GmbH .............................. Germany BBDO GmbH 29%Art & Production pre-press center GmbH ................................ Germany Art & Production Advertising Services GmbH 91%G.P.O. Gesellschaft fur Plakat-Optimierung mbH .................... Germany GFMO, OMD Gesellschaft fur Media-Optim. mbH 84%GFMS, OMD Gesellschaft fur Media Sonderwerbeformen mbH Germany GFMO, OMD Gesellschaft fur Media-Optim. mbH 84%Compas Media-Agentur GmbH ................................................ Germany GFMO, OMD Gesellschaft fur Media-Optim. mbH 84%promediapart/G.F.M.O. Gesellschaft fur Media-Opt. mbH ...... Germany GFMO, OMD Gesellschaft fur Media-Optim. mbH 75%Leonhardt & Kern Alpha GmbH Werbeagentur ........................ Germany Leonhardt & Kern Werbung GmbH 70%Leonhardt & Kern Beta GmbH Werbeagentur .......................... Germany Leonhardt & Kern Werbung GmbH 53%Leonhardt & Kern Gamma GmbH Werbeagentur .................... Germany Leonhardt & Kern Werbung GmbH 63%Design und Grafikstudio “An der Alster” GmbH...................... Germany Economia Holding GmbH 60%Manfred Baumann GmbH ........................................................ Germany Economia Holding GmbH 60%Economia Ges. f. Marketing and Werb. mbH & Co KG .......... Germany Economia Holding GmbH 60%Brodersen, Stampe und Partner Werbeagentur GmbH .............. Germany Economia Holding GmbH 60%DIALOGISTIK Service-Center Direktmarketing GmbH ........ Germany HM1 Ges. f. Direkt marketing und Werbelogistik mbH 59%MD Factory Marketing Datanmanagement GmbH .................. Germany HM1 Ges. f. Direkt marketing und Werbelogistik mbH 38%DCS Atelier fur Direct Communication GmbH Werbe-Service Germany HM1 Ges. f. Direkt marketing und Werbelogistik mbH 59%HM1 Heuser, Mayer & Partner Direktmark GmbH .................. Germany HM1 Ges. f. Direkt marketing und Werbelogistik mbH 59%Kohtes & Klewes Dusseldolf GmbH ........................................ Germany European Communications Consultants (ECCO) GmbH 45%Kohtes & Klewes Dresden GmbH ............................................ Germany European Communications Consultants (ECCO) GmbH 32%Kohtes & Klewes Frankfurt GmbH .......................................... Germany European Communications Consultants (ECCO) GmbH 42%Viamedia Medienagentur fur Radio & TV GmbH .................... Germany European Communications Consultants (ECCO) GmbH 34%Kohtes, Klewes Bonn GmbH .................................................... Germany European Communications Consultants (ECCO) GmbH 41%Kohtes & Klewes Hamburg GmbH .......................................... Germany European Communications Consultants (ECCO) GmbH 38%Kohtes & Klewes communication medical GmbH .................. Germany European Communications Consultants (ECCO) GmbH 39%Brodeur Kohtes & Klewes Kommunikation GmbH.................. Germany European Communications Consultants (ECCO) GmbH 41%Michael Vagedes Gesellschaft fur Eventkomm. mbH .............. Germany European Communications Consultants (ECCO) GmbH 18%Kohtes & Klewes Berlin GmbH ................................................ Germany European Communications Consultants (ECCO) GmbH 43%Deekeling Kommunikation GmbH .......................................... Germany European Communications Consultants (ECCO) GmbH 32%Kohtes & Klewes Munchen GmbH .......................................... Germany European Communications Consultants (ECCO) GmbH 39%Corps, Corporate Publishing Center GmbH .............................. Germany European Communications Consultants (ECCO) GmbH 23%Porter Novelli Germany GmbH ................................................ Germany European Communications Consultants (ECCO) GmbH 45%Online Relations Consulting GmbH .......................................... Germany European Communications Consultants (ECCO) GmbH 45%Promotion Dynamics GmbH...................................................... Germany Stein Holding GmbH 44%Stein Promotions GmbH ............................................................ Germany Stein Holding GmbH 63%Stein Promotions Hamburg GmbH ............................................ Germany Stein Holding GmbH 63%MSBK Team Consulting GmbH ................................................ Germany MSBK, Team Dialog-Marketing GmbH 22%a.s.a.p. Final Art Service GmbH ................................................ Germany MSBK, Team Dialog-Marketing GmbH 37%P.S. Produktions-Service GmbH ................................................ Germany MSBK International AG 46%SMP Werbeservice GmbH.......................................................... Germany MSBK International AG 36%Knauer/Rump/Partner Werbeagentur GmbH ............................ Germany MSBK International AG 49%
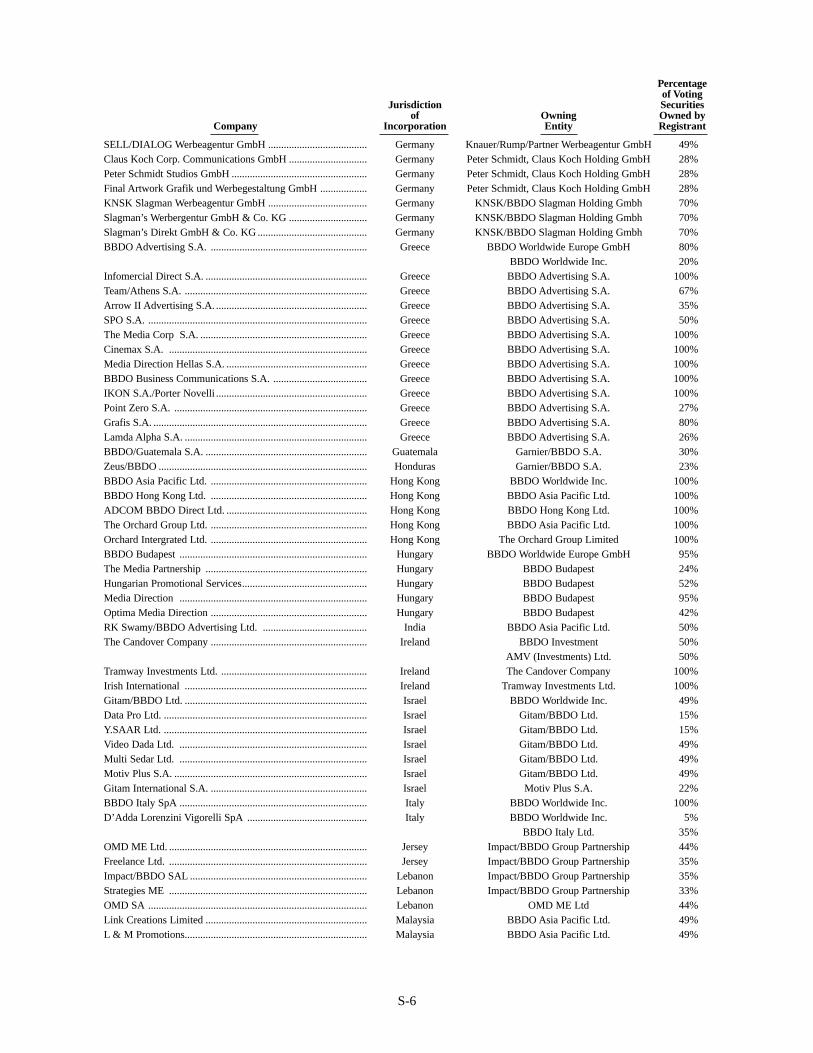
Percentageof Voting
Jurisdiction Securitiesof Owning Owned by
Company Incorporation Entity Registrant
S-6
SELL/DIALOG Werbeagentur GmbH ...................................... Germany Knauer/Rump/Partner Werbeagentur GmbH 49%Claus Koch Corp. Communications GmbH .............................. Germany Peter Schmidt, Claus Koch Holding GmbH 28%Peter Schmidt Studios GmbH .................................................... Germany Peter Schmidt, Claus Koch Holding GmbH 28%Final Artwork Grafik und Werbegestaltung GmbH .................. Germany Peter Schmidt, Claus Koch Holding GmbH 28%KNSK Slagman Werbeagentur GmbH ...................................... Germany KNSK/BBDO Slagman Holding Gmbh 70%Slagman’s Werbergentur GmbH & Co. KG .............................. Germany KNSK/BBDO Slagman Holding Gmbh 70%Slagman’s Direkt GmbH & Co. KG .......................................... Germany KNSK/BBDO Slagman Holding Gmbh 70%BBDO Advertising S.A. ............................................................ Greece BBDO Worldwide Europe GmbH 80%
BBDO Worldwide Inc. 20%Infomercial Direct S.A. .............................................................. Greece BBDO Advertising S.A. 100%Team/Athens S.A. ...................................................................... Greece BBDO Advertising S.A. 67%Arrow II Advertising S.A. .......................................................... Greece BBDO Advertising S.A. 35%SPO S.A. .................................................................................... Greece BBDO Advertising S.A. 50%The Media Corp S.A. ................................................................ Greece BBDO Advertising S.A. 100%Cinemax S.A. ............................................................................ Greece BBDO Advertising S.A. 100%Media Direction Hellas S.A. ...................................................... Greece BBDO Advertising S.A. 100%BBDO Business Communications S.A. .................................... Greece BBDO Advertising S.A. 100%IKON S.A./Porter Novelli .......................................................... Greece BBDO Advertising S.A. 100%Point Zero S.A. .......................................................................... Greece BBDO Advertising S.A. 27%Grafis S.A. .................................................................................. Greece BBDO Advertising S.A. 80%Lamda Alpha S.A. ...................................................................... Greece BBDO Advertising S.A. 26%BBDO/Guatemala S.A. .............................................................. Guatemala Garnier/BBDO S.A. 30%Zeus/BBDO ................................................................................ Honduras Garnier/BBDO S.A. 23%BBDO Asia Pacific Ltd. ............................................................ Hong Kong BBDO Worldwide Inc. 100%BBDO Hong Kong Ltd. ............................................................ Hong Kong BBDO Asia Pacific Ltd. 100%ADCOM BBDO Direct Ltd. ...................................................... Hong Kong BBDO Hong Kong Ltd. 100%The Orchard Group Ltd. ............................................................ Hong Kong BBDO Asia Pacific Ltd. 100%Orchard Intergrated Ltd. ............................................................ Hong Kong The Orchard Group Limited 100%BBDO Budapest ........................................................................ Hungary BBDO Worldwide Europe GmbH 95%The Media Partnership .............................................................. Hungary BBDO Budapest 24%Hungarian Promotional Services................................................ Hungary BBDO Budapest 52%Media Direction ........................................................................ Hungary BBDO Budapest 95%Optima Media Direction ............................................................ Hungary BBDO Budapest 42%RK Swamy/BBDO Advertising Ltd. ........................................ India BBDO Asia Pacific Ltd. 50%The Candover Company ............................................................ Ireland BBDO Investment 50%
AMV (Investments) Ltd. 50%Tramway Investments Ltd. ........................................................ Ireland The Candover Company 100%Irish International ...................................................................... Ireland Tramway Investments Ltd. 100%Gitam/BBDO Ltd. ...................................................................... Israel BBDO Worldwide Inc. 49%Data Pro Ltd. .............................................................................. Israel Gitam/BBDO Ltd. 15%Y.SAAR Ltd. .............................................................................. Israel Gitam/BBDO Ltd. 15%Video Dada Ltd. ........................................................................ Israel Gitam/BBDO Ltd. 49%Multi Sedar Ltd. ........................................................................ Israel Gitam/BBDO Ltd. 49%Motiv Plus S.A. .......................................................................... Israel Gitam/BBDO Ltd. 49%Gitam International S.A. ............................................................ Israel Motiv Plus S.A. 22%BBDO Italy SpA ........................................................................ Italy BBDO Worldwide Inc. 100%D’Adda Lorenzini Vigorelli SpA .............................................. Italy BBDO Worldwide Inc. 5%
BBDO Italy Ltd. 35%OMD ME Ltd. ............................................................................ Jersey Impact/BBDO Group Partnership 44%Freelance Ltd. ............................................................................ Jersey Impact/BBDO Group Partnership 35%Impact/BBDO SAL .................................................................... Lebanon Impact/BBDO Group Partnership 35%Strategies ME ............................................................................ Lebanon Impact/BBDO Group Partnership 33%OMD SA .................................................................................... Lebanon OMD ME Ltd 44%Link Creations Limited .............................................................. Malaysia BBDO Asia Pacific Ltd. 49%L & M Promotions...................................................................... Malaysia BBDO Asia Pacific Ltd. 49%
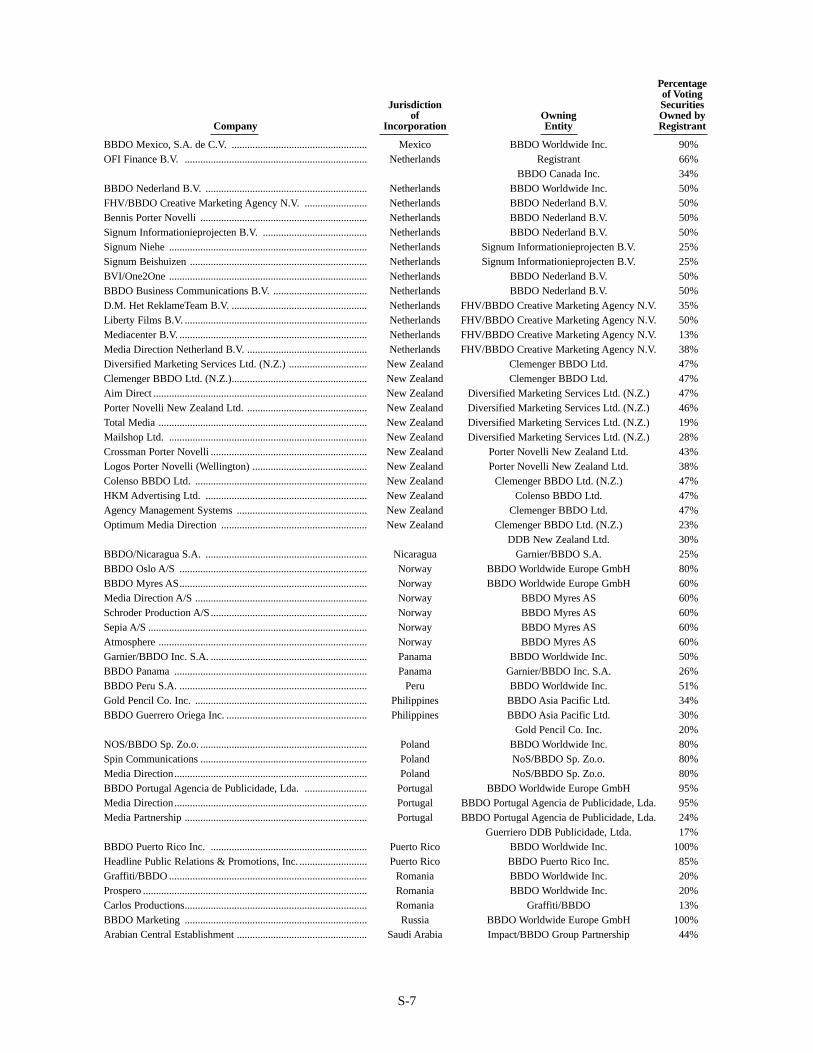
Percentageof Voting
Jurisdiction Securitiesof Owning Owned by
Company Incorporation Entity Registrant
S-7
BBDO Mexico, S.A. de C.V. .................................................... Mexico BBDO Worldwide Inc. 90%OFI Finance B.V. ...................................................................... Netherlands Registrant 66%
BBDO Canada Inc. 34%BBDO Nederland B.V. .............................................................. Netherlands BBDO Worldwide Inc. 50%FHV/BBDO Creative Marketing Agency N.V. ........................ Netherlands BBDO Nederland B.V. 50%Bennis Porter Novelli ................................................................ Netherlands BBDO Nederland B.V. 50%Signum Informationieprojecten B.V. ........................................ Netherlands BBDO Nederland B.V. 50%Signum Niehe ............................................................................ Netherlands Signum Informationieprojecten B.V. 25%Signum Beishuizen .................................................................... Netherlands Signum Informationieprojecten B.V. 25%BVI/One2One ............................................................................ Netherlands BBDO Nederland B.V. 50%BBDO Business Communications B.V. .................................... Netherlands BBDO Nederland B.V. 50%D.M. Het ReklameTeam B.V. .................................................... Netherlands FHV/BBDO Creative Marketing Agency N.V. 35%Liberty Films B.V. ...................................................................... Netherlands FHV/BBDO Creative Marketing Agency N.V. 50%Mediacenter B.V. ........................................................................ Netherlands FHV/BBDO Creative Marketing Agency N.V. 13%Media Direction Netherland B.V. .............................................. Netherlands FHV/BBDO Creative Marketing Agency N.V. 38%Diversified Marketing Services Ltd. (N.Z.) .............................. New Zealand Clemenger BBDO Ltd. 47%Clemenger BBDO Ltd. (N.Z.).................................................... New Zealand Clemenger BBDO Ltd. 47%Aim Direct .................................................................................. New Zealand Diversified Marketing Services Ltd. (N.Z.) 47%Porter Novelli New Zealand Ltd. .............................................. New Zealand Diversified Marketing Services Ltd. (N.Z.) 46%Total Media ................................................................................ New Zealand Diversified Marketing Services Ltd. (N.Z.) 19%Mailshop Ltd. ............................................................................ New Zealand Diversified Marketing Services Ltd. (N.Z.) 28%Crossman Porter Novelli ............................................................ New Zealand Porter Novelli New Zealand Ltd. 43%Logos Porter Novelli (Wellington) ............................................ New Zealand Porter Novelli New Zealand Ltd. 38%Colenso BBDO Ltd. .................................................................. New Zealand Clemenger BBDO Ltd. (N.Z.) 47%HKM Advertising Ltd. .............................................................. New Zealand Colenso BBDO Ltd. 47%Agency Management Systems .................................................. New Zealand Clemenger BBDO Ltd. 47%Optimum Media Direction ........................................................ New Zealand Clemenger BBDO Ltd. (N.Z.) 23%
DDB New Zealand Ltd. 30%BBDO/Nicaragua S.A. .............................................................. Nicaragua Garnier/BBDO S.A. 25%BBDO Oslo A/S ........................................................................ Norway BBDO Worldwide Europe GmbH 80%BBDO Myres AS........................................................................ Norway BBDO Worldwide Europe GmbH 60%Media Direction A/S .................................................................. Norway BBDO Myres AS 60%Schroder Production A/S ............................................................ Norway BBDO Myres AS 60%Sepia A/S .................................................................................... Norway BBDO Myres AS 60%Atmosphere ................................................................................ Norway BBDO Myres AS 60%Garnier/BBDO Inc. S.A. ............................................................ Panama BBDO Worldwide Inc. 50%BBDO Panama .......................................................................... Panama Garnier/BBDO Inc. S.A. 26%BBDO Peru S.A. ........................................................................ Peru BBDO Worldwide Inc. 51%Gold Pencil Co. Inc. .................................................................. Philippines BBDO Asia Pacific Ltd. 34%BBDO Guerrero Oriega Inc. ...................................................... Philippines BBDO Asia Pacific Ltd. 30%
Gold Pencil Co. Inc. 20%NOS/BBDO Sp. Zo.o. ................................................................ Poland BBDO Worldwide Inc. 80%Spin Communications ................................................................ Poland NoS/BBDO Sp. Zo.o. 80%Media Direction.......................................................................... Poland NoS/BBDO Sp. Zo.o. 80%BBDO Portugal Agencia de Publicidade, Lda. ........................ Portugal BBDO Worldwide Europe GmbH 95%Media Direction.......................................................................... Portugal BBDO Portugal Agencia de Publicidade, Lda. 95%Media Partnership ...................................................................... Portugal BBDO Portugal Agencia de Publicidade, Lda. 24%
Guerriero DDB Publicidade, Ltda. 17%BBDO Puerto Rico Inc. ............................................................ Puerto Rico BBDO Worldwide Inc. 100%Headline Public Relations & Promotions, Inc. .......................... Puerto Rico BBDO Puerto Rico Inc. 85%Graffiti/BBDO ............................................................................ Romania BBDO Worldwide Inc. 20%Prospero ...................................................................................... Romania BBDO Worldwide Inc. 20%Carlos Productions...................................................................... Romania Graffiti/BBDO 13%BBDO Marketing ...................................................................... Russia BBDO Worldwide Europe GmbH 100%Arabian Central Establishment .................................................. Saudi Arabia Impact/BBDO Group Partnership 44%
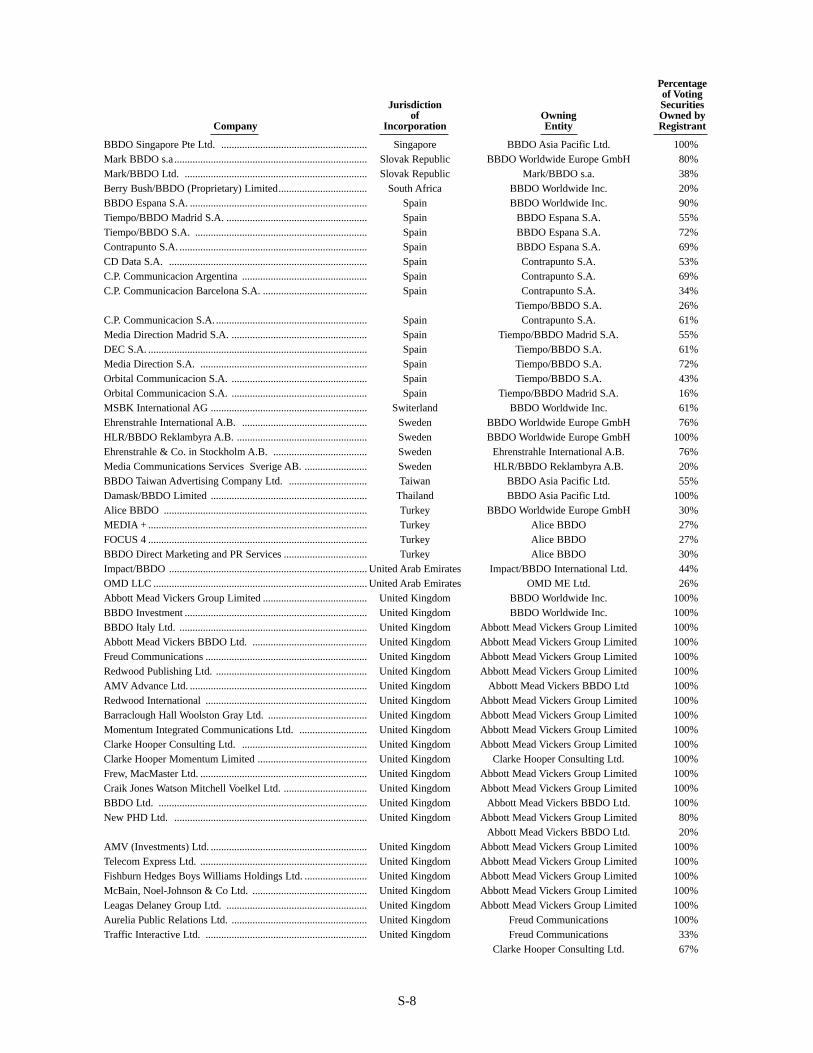
Percentageof Voting
Jurisdiction Securitiesof Owning Owned by
Company Incorporation Entity Registrant
S-8
BBDO Singapore Pte Ltd. ........................................................ Singapore BBDO Asia Pacific Ltd. 100%Mark BBDO s.a .......................................................................... Slovak Republic BBDO Worldwide Europe GmbH 80%Mark/BBDO Ltd. ...................................................................... Slovak Republic Mark/BBDO s.a. 38%Berry Bush/BBDO (Proprietary) Limited.................................. South Africa BBDO Worldwide Inc. 20%BBDO Espana S.A. .................................................................... Spain BBDO Worldwide Inc. 90%Tiempo/BBDO Madrid S.A. ...................................................... Spain BBDO Espana S.A. 55%Tiempo/BBDO S.A. .................................................................. Spain BBDO Espana S.A. 72%Contrapunto S.A. ........................................................................ Spain BBDO Espana S.A. 69%CD Data S.A. ............................................................................ Spain Contrapunto S.A. 53%C.P. Communicacion Argentina ................................................ Spain Contrapunto S.A. 69%C.P. Communicacion Barcelona S.A. ........................................ Spain Contrapunto S.A. 34%
Tiempo/BBDO S.A. 26%C.P. Communicacion S.A. .......................................................... Spain Contrapunto S.A. 61%Media Direction Madrid S.A. .................................................... Spain Tiempo/BBDO Madrid S.A. 55%DEC S.A. .................................................................................... Spain Tiempo/BBDO S.A. 61%Media Direction S.A. ................................................................ Spain Tiempo/BBDO S.A. 72%Orbital Communicacion S.A. .................................................... Spain Tiempo/BBDO S.A. 43%Orbital Communicacion S.A. .................................................... Spain Tiempo/BBDO Madrid S.A. 16%MSBK International AG ............................................................ Switerland BBDO Worldwide Inc. 61%Ehrenstrahle International A.B. ................................................ Sweden BBDO Worldwide Europe GmbH 76%HLR/BBDO Reklambyra A.B. .................................................. Sweden BBDO Worldwide Europe GmbH 100%Ehrenstrahle & Co. in Stockholm A.B. .................................... Sweden Ehrenstrahle International A.B. 76%Media Communications Services Sverige AB. ........................ Sweden HLR/BBDO Reklambyra A.B. 20%BBDO Taiwan Advertising Company Ltd. .............................. Taiwan BBDO Asia Pacific Ltd. 55%Damask/BBDO Limited ............................................................ Thailand BBDO Asia Pacific Ltd. 100%Alice BBDO .............................................................................. Turkey BBDO Worldwide Europe GmbH 30%MEDIA + .................................................................................... Turkey Alice BBDO 27%FOCUS 4 .................................................................................... Turkey Alice BBDO 27%BBDO Direct Marketing and PR Services ................................ Turkey Alice BBDO 30%Impact/BBDO ............................................................................ United Arab Emirates Impact/BBDO International Ltd. 44%OMD LLC .................................................................................. United Arab Emirates OMD ME Ltd. 26%Abbott Mead Vickers Group Limited ........................................ United Kingdom BBDO Worldwide Inc. 100%BBDO Investment ...................................................................... United Kingdom BBDO Worldwide Inc. 100%BBDO Italy Ltd. ........................................................................ United Kingdom Abbott Mead Vickers Group Limited 100%Abbott Mead Vickers BBDO Ltd. ............................................ United Kingdom Abbott Mead Vickers Group Limited 100%Freud Communications .............................................................. United Kingdom Abbott Mead Vickers Group Limited 100%Redwood Publishing Ltd. .......................................................... United Kingdom Abbott Mead Vickers Group Limited 100%AMV Advance Ltd. .................................................................... United Kingdom Abbott Mead Vickers BBDO Ltd 100%Redwood International .............................................................. United Kingdom Abbott Mead Vickers Group Limited 100%Barraclough Hall Woolston Gray Ltd. ...................................... United Kingdom Abbott Mead Vickers Group Limited 100%Momentum Integrated Communications Ltd. .......................... United Kingdom Abbott Mead Vickers Group Limited 100%Clarke Hooper Consulting Ltd. ................................................ United Kingdom Abbott Mead Vickers Group Limited 100%Clarke Hooper Momentum Limited .......................................... United Kingdom Clarke Hooper Consulting Ltd. 100%Frew, MacMaster Ltd. ................................................................ United Kingdom Abbott Mead Vickers Group Limited 100%Craik Jones Watson Mitchell Voelkel Ltd. ................................ United Kingdom Abbott Mead Vickers Group Limited 100%BBDO Ltd. ................................................................................ United Kingdom Abbott Mead Vickers BBDO Ltd. 100%New PHD Ltd. .......................................................................... United Kingdom Abbott Mead Vickers Group Limited 80%
Abbott Mead Vickers BBDO Ltd. 20%AMV (Investments) Ltd. ............................................................ United Kingdom Abbott Mead Vickers Group Limited 100%Telecom Express Ltd. ................................................................ United Kingdom Abbott Mead Vickers Group Limited 100%Fishburn Hedges Boys Williams Holdings Ltd. ........................ United Kingdom Abbott Mead Vickers Group Limited 100%McBain, Noel-Johnson & Co Ltd. ............................................ United Kingdom Abbott Mead Vickers Group Limited 100%Leagas Delaney Group Ltd. ...................................................... United Kingdom Abbott Mead Vickers Group Limited 100%Aurelia Public Relations Ltd. .................................................... United Kingdom Freud Communications 100%Traffic Interactive Ltd. .............................................................. United Kingdom Freud Communications 33%
Clarke Hooper Consulting Ltd. 67%
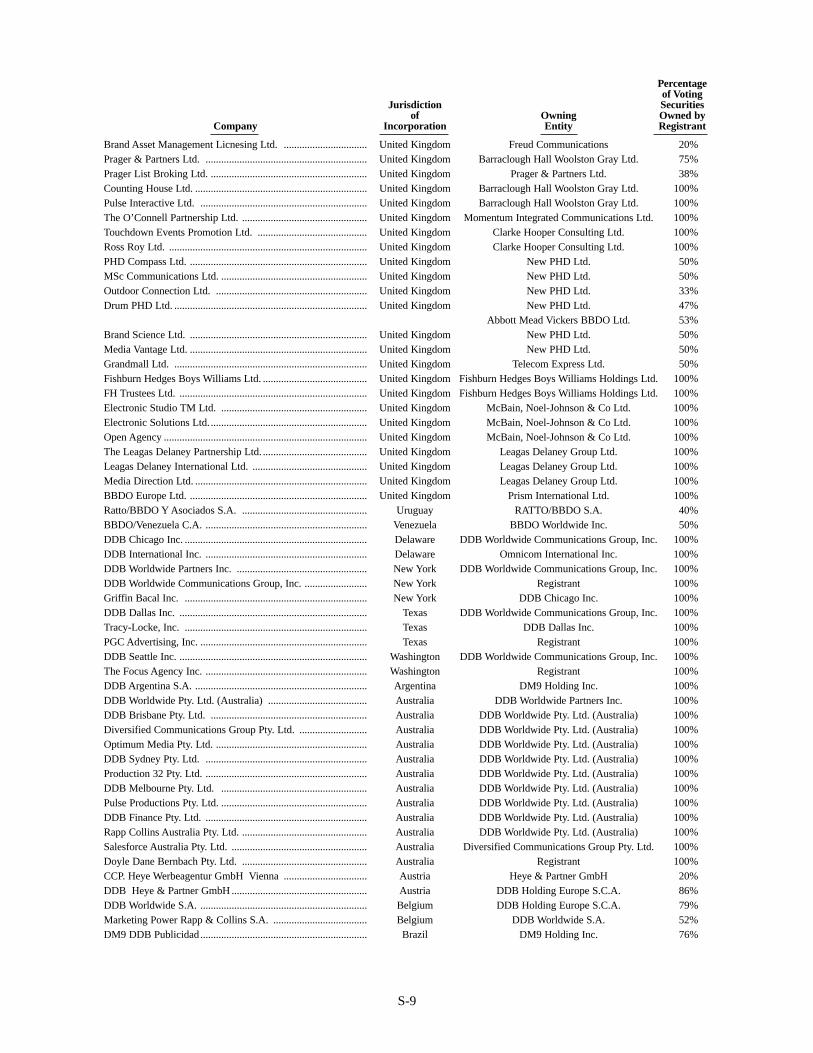
Percentageof Voting
Jurisdiction Securitiesof Owning Owned by
Company Incorporation Entity Registrant
S-9
Brand Asset Management Licnesing Ltd. ................................ United Kingdom Freud Communications 20%Prager & Partners Ltd. .............................................................. United Kingdom Barraclough Hall Woolston Gray Ltd. 75%Prager List Broking Ltd. ............................................................ United Kingdom Prager & Partners Ltd. 38%Counting House Ltd. .................................................................. United Kingdom Barraclough Hall Woolston Gray Ltd. 100%Pulse Interactive Ltd. ................................................................ United Kingdom Barraclough Hall Woolston Gray Ltd. 100%The O’Connell Partnership Ltd. ................................................ United Kingdom Momentum Integrated Communications Ltd. 100%Touchdown Events Promotion Ltd. .......................................... United Kingdom Clarke Hooper Consulting Ltd. 100%Ross Roy Ltd. ............................................................................ United Kingdom Clarke Hooper Consulting Ltd. 100%PHD Compass Ltd. .................................................................... United Kingdom New PHD Ltd. 50%MSc Communications Ltd. ........................................................ United Kingdom New PHD Ltd. 50%Outdoor Connection Ltd. .......................................................... United Kingdom New PHD Ltd. 33%Drum PHD Ltd. .......................................................................... United Kingdom New PHD Ltd. 47%
Abbott Mead Vickers BBDO Ltd. 53%Brand Science Ltd. .................................................................... United Kingdom New PHD Ltd. 50%Media Vantage Ltd. .................................................................... United Kingdom New PHD Ltd. 50%Grandmall Ltd. .......................................................................... United Kingdom Telecom Express Ltd. 50%Fishburn Hedges Boys Williams Ltd. ........................................ United Kingdom Fishburn Hedges Boys Williams Holdings Ltd. 100%FH Trustees Ltd. ........................................................................ United Kingdom Fishburn Hedges Boys Williams Holdings Ltd. 100%Electronic Studio TM Ltd. ........................................................ United Kingdom McBain, Noel-Johnson & Co Ltd. 100%Electronic Solutions Ltd. ............................................................ United Kingdom McBain, Noel-Johnson & Co Ltd. 100%Open Agency .............................................................................. United Kingdom McBain, Noel-Johnson & Co Ltd. 100%The Leagas Delaney Partnership Ltd. ........................................ United Kingdom Leagas Delaney Group Ltd. 100%Leagas Delaney International Ltd. ............................................ United Kingdom Leagas Delaney Group Ltd. 100%Media Direction Ltd. .................................................................. United Kingdom Leagas Delaney Group Ltd. 100%BBDO Europe Ltd. .................................................................... United Kingdom Prism International Ltd. 100%Ratto/BBDO Y Asociados S.A. ................................................ Uruguay RATTO/BBDO S.A. 40%BBDO/Venezuela C.A. .............................................................. Venezuela BBDO Worldwide Inc. 50%DDB Chicago Inc. ...................................................................... Delaware DDB Worldwide Communications Group, Inc. 100%DDB International Inc. .............................................................. Delaware Omnicom International Inc. 100%DDB Worldwide Partners Inc. .................................................. New York DDB Worldwide Communications Group, Inc. 100%DDB Worldwide Communications Group, Inc. ........................ New York Registrant 100%Griffin Bacal Inc. ...................................................................... New York DDB Chicago Inc. 100%DDB Dallas Inc. ........................................................................ Texas DDB Worldwide Communications Group, Inc. 100%Tracy-Locke, Inc. ...................................................................... Texas DDB Dallas Inc. 100%PGC Advertising, Inc. ................................................................ Texas Registrant 100%DDB Seattle Inc. ........................................................................ Washington DDB Worldwide Communications Group, Inc. 100%The Focus Agency Inc. .............................................................. Washington Registrant 100%DDB Argentina S.A. .................................................................. Argentina DM9 Holding Inc. 100%DDB Worldwide Pty. Ltd. (Australia) ...................................... Australia DDB Worldwide Partners Inc. 100%DDB Brisbane Pty. Ltd. ............................................................ Australia DDB Worldwide Pty. Ltd. (Australia) 100%Diversified Communications Group Pty. Ltd. .......................... Australia DDB Worldwide Pty. Ltd. (Australia) 100%Optimum Media Pty. Ltd. .......................................................... Australia DDB Worldwide Pty. Ltd. (Australia) 100%DDB Sydney Pty. Ltd. .............................................................. Australia DDB Worldwide Pty. Ltd. (Australia) 100%Production 32 Pty. Ltd. .............................................................. Australia DDB Worldwide Pty. Ltd. (Australia) 100%DDB Melbourne Pty. Ltd. ........................................................ Australia DDB Worldwide Pty. Ltd. (Australia) 100%Pulse Productions Pty. Ltd. ........................................................ Australia DDB Worldwide Pty. Ltd. (Australia) 100%DDB Finance Pty. Ltd. .............................................................. Australia DDB Worldwide Pty. Ltd. (Australia) 100%Rapp Collins Australia Pty. Ltd. ................................................ Australia DDB Worldwide Pty. Ltd. (Australia) 100%Salesforce Australia Pty. Ltd. .................................................... Australia Diversified Communications Group Pty. Ltd. 100%Doyle Dane Bernbach Pty. Ltd. ................................................ Australia Registrant 100%CCP. Heye Werbeagentur GmbH Vienna ................................ Austria Heye & Partner GmbH 20%DDB Heye & Partner GmbH .................................................... Austria DDB Holding Europe S.C.A. 86%DDB Worldwide S.A. ................................................................ Belgium DDB Holding Europe S.C.A. 79%Marketing Power Rapp & Collins S.A. .................................... Belgium DDB Worldwide S.A. 52%DM9 DDB Publicidad................................................................ Brazil DM9 Holding Inc. 76%
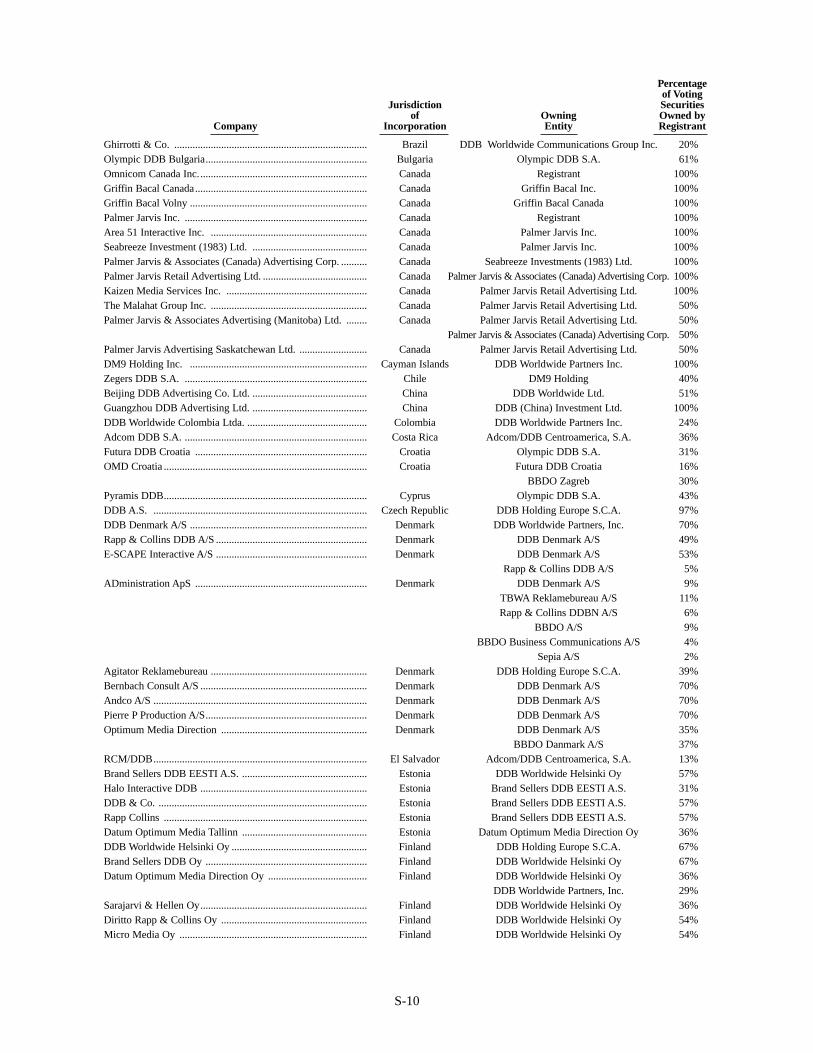
Percentageof Voting
Jurisdiction Securitiesof Owning Owned by
Company Incorporation Entity Registrant
S-10
Ghirrotti & Co. .......................................................................... Brazil DDB Worldwide Communications Group Inc. 20%Olympic DDB Bulgaria.............................................................. Bulgaria Olympic DDB S.A. 61%Omnicom Canada Inc................................................................. Canada Registrant 100%Griffin Bacal Canada.................................................................. Canada Griffin Bacal Inc. 100%Griffin Bacal Volny .................................................................... Canada Griffin Bacal Canada 100%Palmer Jarvis Inc. ...................................................................... Canada Registrant 100%Area 51 Interactive Inc. ............................................................ Canada Palmer Jarvis Inc. 100%Seabreeze Investment (1983) Ltd. ............................................ Canada Palmer Jarvis Inc. 100%Palmer Jarvis & Associates (Canada) Advertising Corp. .......... Canada Seabreeze Investments (1983) Ltd. 100%Palmer Jarvis Retail Advertising Ltd. ........................................ Canada Palmer Jarvis & Associates (Canada) Advertising Corp. 100%Kaizen Media Services Inc. ...................................................... Canada Palmer Jarvis Retail Advertising Ltd. 100%The Malahat Group Inc. ............................................................ Canada Palmer Jarvis Retail Advertising Ltd. 50%Palmer Jarvis & Associates Advertising (Manitoba) Ltd. ........ Canada Palmer Jarvis Retail Advertising Ltd. 50%
Palmer Jarvis & Associates (Canada) Advertising Corp. 50%Palmer Jarvis Advertising Saskatchewan Ltd. .......................... Canada Palmer Jarvis Retail Advertising Ltd. 50%DM9 Holding Inc. .................................................................... Cayman Islands DDB Worldwide Partners Inc. 100%Zegers DDB S.A. ...................................................................... Chile DM9 Holding 40%Beijing DDB Advertising Co. Ltd. ............................................ China DDB Worldwide Ltd. 51%Guangzhou DDB Advertising Ltd. ............................................ China DDB (China) Investment Ltd. 100%DDB Worldwide Colombia Ltda. .............................................. Colombia DDB Worldwide Partners Inc. 24%Adcom DDB S.A. ...................................................................... Costa Rica Adcom/DDB Centroamerica, S.A. 36%Futura DDB Croatia .................................................................. Croatia Olympic DDB S.A. 31%OMD Croatia .............................................................................. Croatia Futura DDB Croatia 16%
BBDO Zagreb 30%Pyramis DDB.............................................................................. Cyprus Olympic DDB S.A. 43%DDB A.S. .................................................................................. Czech Republic DDB Holding Europe S.C.A. 97%DDB Denmark A/S .................................................................... Denmark DDB Worldwide Partners, Inc. 70%Rapp & Collins DDB A/S .......................................................... Denmark DDB Denmark A/S 49%E-SCAPE Interactive A/S .......................................................... Denmark DDB Denmark A/S 53%
Rapp & Collins DDB A/S 5%ADministration ApS .................................................................. Denmark DDB Denmark A/S 9%
TBWA Reklamebureau A/S 11%Rapp & Collins DDBN A/S 6%
BBDO A/S 9%BBDO Business Communications A/S 4%
Sepia A/S 2%Agitator Reklamebureau ............................................................ Denmark DDB Holding Europe S.C.A. 39%Bernbach Consult A/S ................................................................ Denmark DDB Denmark A/S 70%Andco A/S .................................................................................. Denmark DDB Denmark A/S 70%Pierre P Production A/S.............................................................. Denmark DDB Denmark A/S 70%Optimum Media Direction ........................................................ Denmark DDB Denmark A/S 35%
BBDO Danmark A/S 37%RCM/DDB.................................................................................. El Salvador Adcom/DDB Centroamerica, S.A. 13%Brand Sellers DDB EESTI A.S. ................................................ Estonia DDB Worldwide Helsinki Oy 57%Halo Interactive DDB ................................................................ Estonia Brand Sellers DDB EESTI A.S. 31%DDB & Co. ................................................................................ Estonia Brand Sellers DDB EESTI A.S. 57%Rapp Collins .............................................................................. Estonia Brand Sellers DDB EESTI A.S. 57%Datum Optimum Media Tallinn ................................................ Estonia Datum Optimum Media Direction Oy 36%DDB Worldwide Helsinki Oy .................................................... Finland DDB Holding Europe S.C.A. 67%Brand Sellers DDB Oy .............................................................. Finland DDB Worldwide Helsinki Oy 67%Datum Optimum Media Direction Oy ...................................... Finland DDB Worldwide Helsinki Oy 36%
DDB Worldwide Partners, Inc. 29%Sarajarvi & Hellen Oy................................................................ Finland DDB Worldwide Helsinki Oy 36%Diritto Rapp & Collins Oy ........................................................ Finland DDB Worldwide Helsinki Oy 54%Micro Media Oy ........................................................................ Finland DDB Worldwide Helsinki Oy 54%
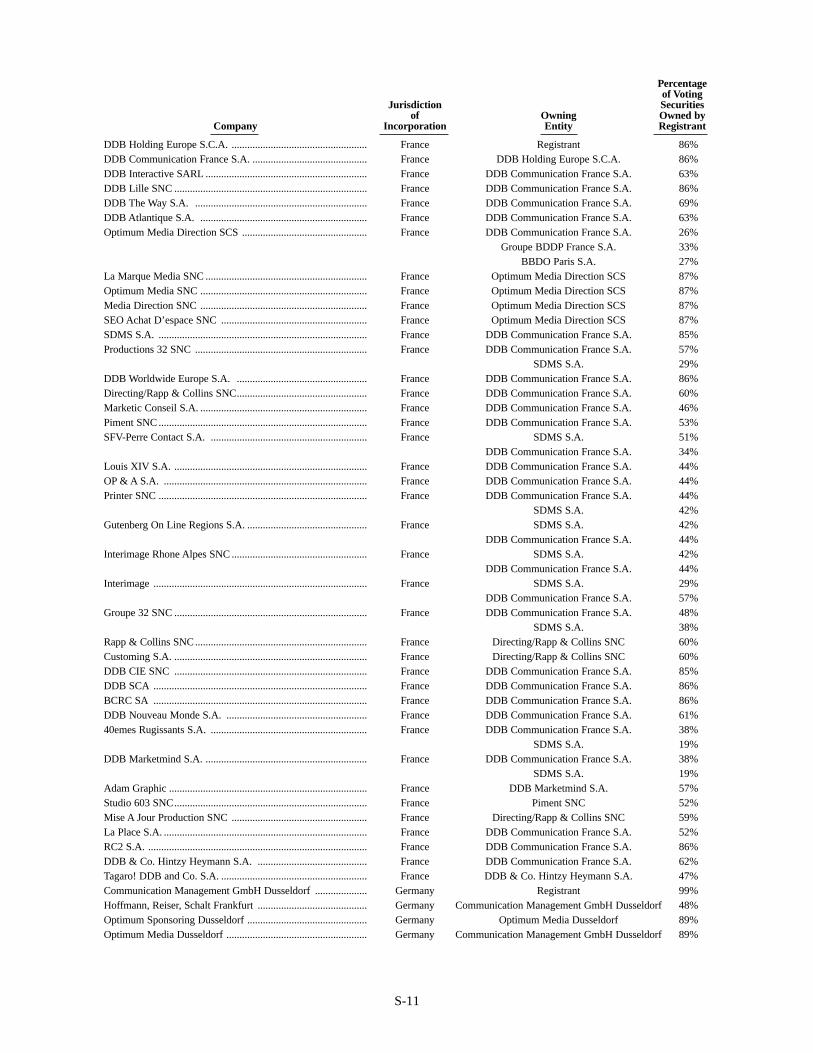
Percentageof Voting
Jurisdiction Securitiesof Owning Owned by
Company Incorporation Entity Registrant
S-11
DDB Holding Europe S.C.A. .................................................... France Registrant 86%DDB Communication France S.A. ............................................ France DDB Holding Europe S.C.A. 86%DDB Interactive SARL .............................................................. France DDB Communication France S.A. 63%DDB Lille SNC .......................................................................... France DDB Communication France S.A. 86%DDB The Way S.A. .................................................................. France DDB Communication France S.A. 69%DDB Atlantique S.A. ................................................................ France DDB Communication France S.A. 63%Optimum Media Direction SCS ................................................ France DDB Communication France S.A. 26%
Groupe BDDP France S.A. 33%BBDO Paris S.A. 27%
La Marque Media SNC .............................................................. France Optimum Media Direction SCS 87%Optimum Media SNC ................................................................ France Optimum Media Direction SCS 87%Media Direction SNC ................................................................ France Optimum Media Direction SCS 87%SEO Achat D’espace SNC ........................................................ France Optimum Media Direction SCS 87%SDMS S.A. ................................................................................ France DDB Communication France S.A. 85%Productions 32 SNC .................................................................. France DDB Communication France S.A. 57%
SDMS S.A. 29%DDB Worldwide Europe S.A. .................................................. France DDB Communication France S.A. 86%Directing/Rapp & Collins SNC.................................................. France DDB Communication France S.A. 60%Marketic Conseil S.A. ................................................................ France DDB Communication France S.A. 46%Piment SNC ................................................................................ France DDB Communication France S.A. 53%SFV-Perre Contact S.A. ............................................................ France SDMS S.A. 51%
DDB Communication France S.A. 34%Louis XIV S.A. .......................................................................... France DDB Communication France S.A. 44%OP & A S.A. .............................................................................. France DDB Communication France S.A. 44%Printer SNC ................................................................................ France DDB Communication France S.A. 44%
SDMS S.A. 42%Gutenberg On Line Regions S.A. .............................................. France SDMS S.A. 42%
DDB Communication France S.A. 44%Interimage Rhone Alpes SNC .................................................... France SDMS S.A. 42%
DDB Communication France S.A. 44%Interimage .................................................................................. France SDMS S.A. 29%
DDB Communication France S.A. 57%Groupe 32 SNC .......................................................................... France DDB Communication France S.A. 48%
SDMS S.A. 38%Rapp & Collins SNC.................................................................. France Directing/Rapp & Collins SNC 60%Customing S.A. .......................................................................... France Directing/Rapp & Collins SNC 60%DDB CIE SNC .......................................................................... France DDB Communication France S.A. 85%DDB SCA .................................................................................. France DDB Communication France S.A. 86%BCRC SA .................................................................................. France DDB Communication France S.A. 86%DDB Nouveau Monde S.A. ...................................................... France DDB Communication France S.A. 61%40emes Rugissants S.A. ............................................................ France DDB Communication France S.A. 38%
SDMS S.A. 19%DDB Marketmind S.A. .............................................................. France DDB Communication France S.A. 38%
SDMS S.A. 19%Adam Graphic ............................................................................ France DDB Marketmind S.A. 57%Studio 603 SNC.......................................................................... France Piment SNC 52%Mise A Jour Production SNC .................................................... France Directing/Rapp & Collins SNC 59%La Place S.A. .............................................................................. France DDB Communication France S.A. 52%RC2 S.A. .................................................................................... France DDB Communication France S.A. 86%DDB & Co. Hintzy Heymann S.A. .......................................... France DDB Communication France S.A. 62%Tagaro! DDB and Co. S.A. ........................................................ France DDB & Co. Hintzy Heymann S.A. 47%Communication Management GmbH Dusseldorf .................... Germany Registrant 99%Hoffmann, Reiser, Schalt Frankfurt .......................................... Germany Communication Management GmbH Dusseldorf 48%Optimum Sponsoring Dusseldorf .............................................. Germany Optimum Media Dusseldorf 89%Optimum Media Dusseldorf ...................................................... Germany Communication Management GmbH Dusseldorf 89%
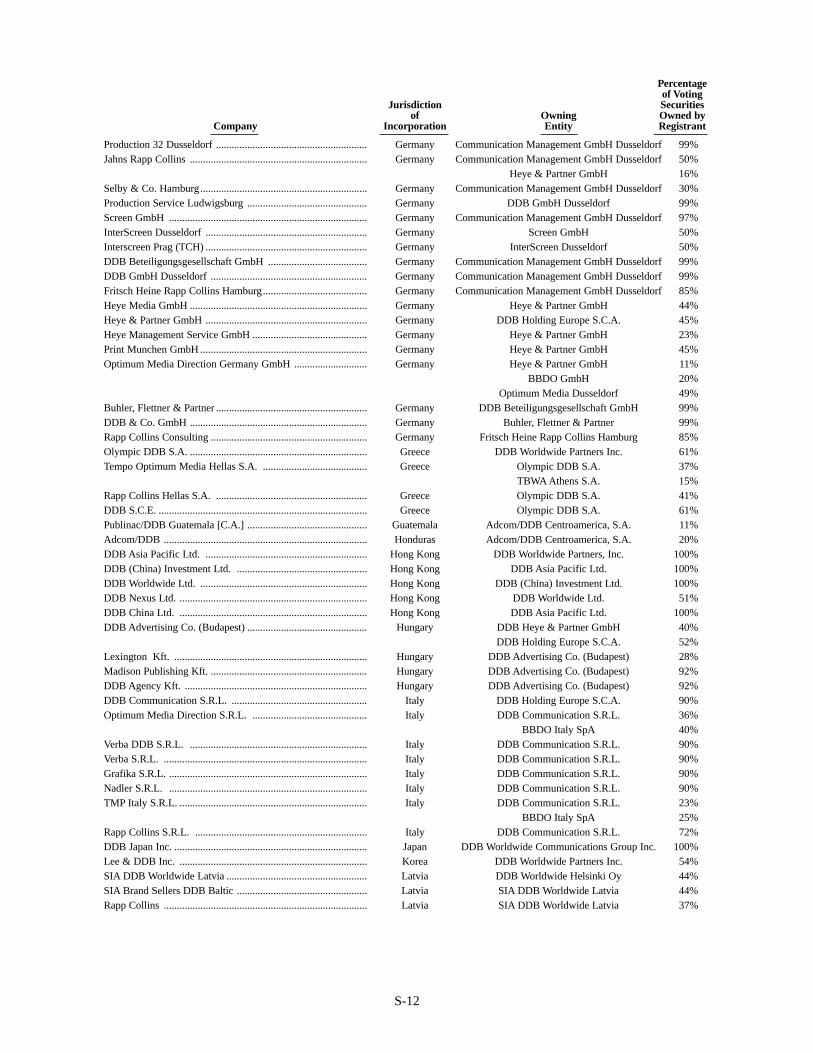
Percentageof Voting
Jurisdiction Securitiesof Owning Owned by
Company Incorporation Entity Registrant
S-12
Production 32 Dusseldorf .......................................................... Germany Communication Management GmbH Dusseldorf 99%Jahns Rapp Collins .................................................................... Germany Communication Management GmbH Dusseldorf 50%
Heye & Partner GmbH 16%Selby & Co. Hamburg................................................................ Germany Communication Management GmbH Dusseldorf 30%Production Service Ludwigsburg .............................................. Germany DDB GmbH Dusseldorf 99%Screen GmbH ............................................................................ Germany Communication Management GmbH Dusseldorf 97%InterScreen Dusseldorf .............................................................. Germany Screen GmbH 50%Interscreen Prag (TCH) .............................................................. Germany InterScreen Dusseldorf 50%DDB Beteiligungsgesellschaft GmbH ...................................... Germany Communication Management GmbH Dusseldorf 99%DDB GmbH Dusseldorf ............................................................ Germany Communication Management GmbH Dusseldorf 99%Fritsch Heine Rapp Collins Hamburg........................................ Germany Communication Management GmbH Dusseldorf 85%Heye Media GmbH .................................................................... Germany Heye & Partner GmbH 44%Heye & Partner GmbH .............................................................. Germany DDB Holding Europe S.C.A. 45%Heye Management Service GmbH ............................................ Germany Heye & Partner GmbH 23%Print Munchen GmbH ................................................................ Germany Heye & Partner GmbH 45%Optimum Media Direction Germany GmbH ............................ Germany Heye & Partner GmbH 11%
BBDO GmbH 20%Optimum Media Dusseldorf 49%
Buhler, Flettner & Partner .......................................................... Germany DDB Beteiligungsgesellschaft GmbH 99%DDB & Co. GmbH .................................................................... Germany Buhler, Flettner & Partner 99%Rapp Collins Consulting ............................................................ Germany Fritsch Heine Rapp Collins Hamburg 85%Olympic DDB S.A. .................................................................... Greece DDB Worldwide Partners Inc. 61%Tempo Optimum Media Hellas S.A. ........................................ Greece Olympic DDB S.A. 37%
TBWA Athens S.A. 15%Rapp Collins Hellas S.A. .......................................................... Greece Olympic DDB S.A. 41%DDB S.C.E. ................................................................................ Greece Olympic DDB S.A. 61%Publinac/DDB Guatemala [C.A.] .............................................. Guatemala Adcom/DDB Centroamerica, S.A. 11%Adcom/DDB .............................................................................. Honduras Adcom/DDB Centroamerica, S.A. 20%DDB Asia Pacific Ltd. .............................................................. Hong Kong DDB Worldwide Partners, Inc. 100%DDB (China) Investment Ltd. .................................................. Hong Kong DDB Asia Pacific Ltd. 100%DDB Worldwide Ltd. ................................................................ Hong Kong DDB (China) Investment Ltd. 100%DDB Nexus Ltd. ........................................................................ Hong Kong DDB Worldwide Ltd. 51%DDB China Ltd. ........................................................................ Hong Kong DDB Asia Pacific Ltd. 100%DDB Advertising Co. (Budapest) .............................................. Hungary DDB Heye & Partner GmbH 40%
DDB Holding Europe S.C.A. 52%Lexington Kft. .......................................................................... Hungary DDB Advertising Co. (Budapest) 28%Madison Publishing Kft. ............................................................ Hungary DDB Advertising Co. (Budapest) 92%DDB Agency Kft. ...................................................................... Hungary DDB Advertising Co. (Budapest) 92%DDB Communication S.R.L. .................................................... Italy DDB Holding Europe S.C.A. 90%Optimum Media Direction S.R.L. ............................................ Italy DDB Communication S.R.L. 36%
BBDO Italy SpA 40%Verba DDB S.R.L. .................................................................... Italy DDB Communication S.R.L. 90%Verba S.R.L. .............................................................................. Italy DDB Communication S.R.L. 90%Grafika S.R.L. ............................................................................ Italy DDB Communication S.R.L. 90%Nadler S.R.L. ............................................................................ Italy DDB Communication S.R.L. 90%TMP Italy S.R.L. ........................................................................ Italy DDB Communication S.R.L. 23%
BBDO Italy SpA 25%Rapp Collins S.R.L. .................................................................. Italy DDB Communication S.R.L. 72%DDB Japan Inc. .......................................................................... Japan DDB Worldwide Communications Group Inc. 100%Lee & DDB Inc. ........................................................................ Korea DDB Worldwide Partners Inc. 54%SIA DDB Worldwide Latvia ...................................................... Latvia DDB Worldwide Helsinki Oy 44%SIA Brand Sellers DDB Baltic .................................................. Latvia SIA DDB Worldwide Latvia 44%Rapp Collins .............................................................................. Latvia SIA DDB Worldwide Latvia 37%
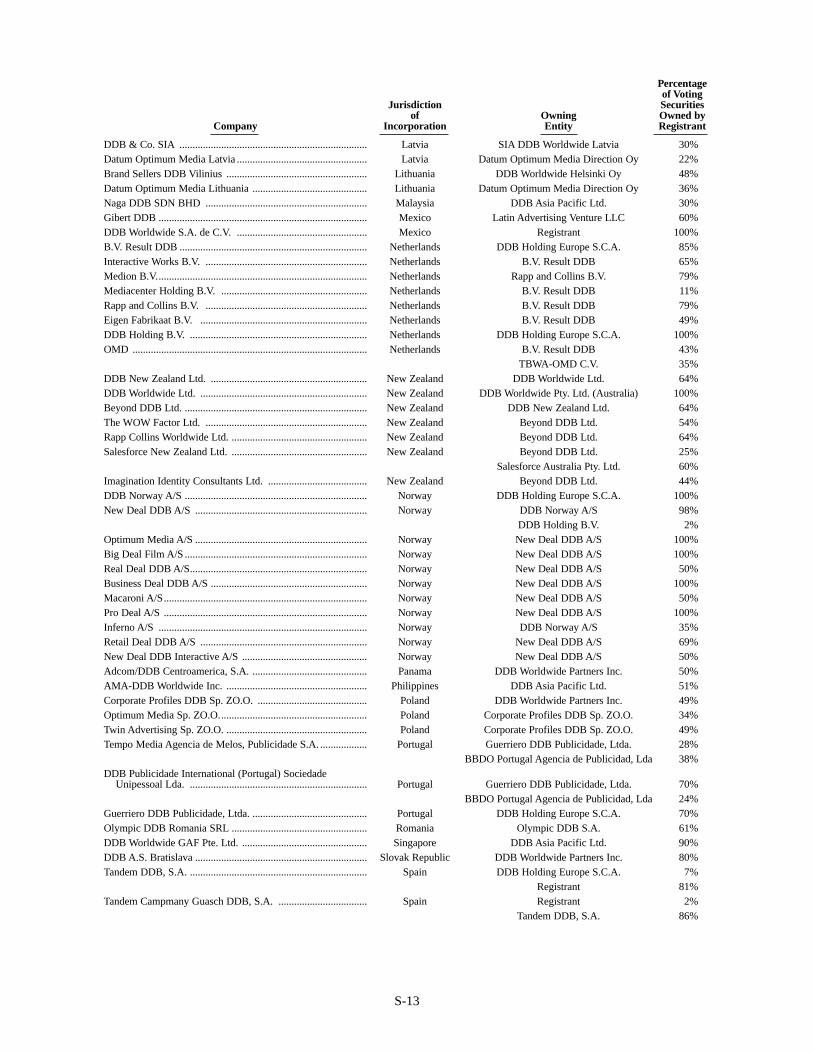
Percentageof Voting
Jurisdiction Securitiesof Owning Owned by
Company Incorporation Entity Registrant
S-13
DDB & Co. SIA ........................................................................ Latvia SIA DDB Worldwide Latvia 30%Datum Optimum Media Latvia .................................................. Latvia Datum Optimum Media Direction Oy 22%Brand Sellers DDB Vilinius ...................................................... Lithuania DDB Worldwide Helsinki Oy 48%Datum Optimum Media Lithuania ............................................ Lithuania Datum Optimum Media Direction Oy 36%Naga DDB SDN BHD .............................................................. Malaysia DDB Asia Pacific Ltd. 30%Gibert DDB ................................................................................ Mexico Latin Advertising Venture LLC 60%DDB Worldwide S.A. de C.V. .................................................. Mexico Registrant 100%B.V. Result DDB ........................................................................ Netherlands DDB Holding Europe S.C.A. 85%Interactive Works B.V. .............................................................. Netherlands B.V. Result DDB 65%Medion B.V................................................................................. Netherlands Rapp and Collins B.V. 79%Mediacenter Holding B.V. ........................................................ Netherlands B.V. Result DDB 11%Rapp and Collins B.V. .............................................................. Netherlands B.V. Result DDB 79%Eigen Fabrikaat B.V. ................................................................ Netherlands B.V. Result DDB 49%DDB Holding B.V. .................................................................... Netherlands DDB Holding Europe S.C.A. 100%OMD .......................................................................................... Netherlands B.V. Result DDB 43%
TBWA-OMD C.V. 35%DDB New Zealand Ltd. ............................................................ New Zealand DDB Worldwide Ltd. 64%DDB Worldwide Ltd. ................................................................ New Zealand DDB Worldwide Pty. Ltd. (Australia) 100%Beyond DDB Ltd. ...................................................................... New Zealand DDB New Zealand Ltd. 64%The WOW Factor Ltd. .............................................................. New Zealand Beyond DDB Ltd. 54%Rapp Collins Worldwide Ltd. .................................................... New Zealand Beyond DDB Ltd. 64%Salesforce New Zealand Ltd. .................................................... New Zealand Beyond DDB Ltd. 25%
Salesforce Australia Pty. Ltd. 60%Imagination Identity Consultants Ltd. ...................................... New Zealand Beyond DDB Ltd. 44%DDB Norway A/S ...................................................................... Norway DDB Holding Europe S.C.A. 100%New Deal DDB A/S .................................................................. Norway DDB Norway A/S 98%
DDB Holding B.V. 2%Optimum Media A/S .................................................................. Norway New Deal DDB A/S 100%Big Deal Film A/S ...................................................................... Norway New Deal DDB A/S 100%Real Deal DDB A/S.................................................................... Norway New Deal DDB A/S 50%Business Deal DDB A/S ............................................................ Norway New Deal DDB A/S 100%Macaroni A/S.............................................................................. Norway New Deal DDB A/S 50%Pro Deal A/S .............................................................................. Norway New Deal DDB A/S 100%Inferno A/S ................................................................................ Norway DDB Norway A/S 35%Retail Deal DDB A/S ................................................................ Norway New Deal DDB A/S 69%New Deal DDB Interactive A/S ................................................ Norway New Deal DDB A/S 50%Adcom/DDB Centroamerica, S.A. ............................................ Panama DDB Worldwide Partners Inc. 50%AMA-DDB Worldwide Inc. ...................................................... Philippines DDB Asia Pacific Ltd. 51%Corporate Profiles DDB Sp. ZO.O. .......................................... Poland DDB Worldwide Partners Inc. 49%Optimum Media Sp. ZO.O......................................................... Poland Corporate Profiles DDB Sp. ZO.O. 34%Twin Advertising Sp. ZO.O. ...................................................... Poland Corporate Profiles DDB Sp. ZO.O. 49%Tempo Media Agencia de Melos, Publicidade S.A. .................. Portugal Guerriero DDB Publicidade, Ltda. 28%
BBDO Portugal Agencia de Publicidad, Lda 38%DDB Publicidade International (Portugal) Sociedade
Unipessoal Lda. .................................................................... Portugal Guerriero DDB Publicidade, Ltda. 70%BBDO Portugal Agencia de Publicidad, Lda 24%
Guerriero DDB Publicidade, Ltda. ............................................ Portugal DDB Holding Europe S.C.A. 70%Olympic DDB Romania SRL .................................................... Romania Olympic DDB S.A. 61%DDB Worldwide GAF Pte. Ltd. ................................................ Singapore DDB Asia Pacific Ltd. 90%DDB A.S. Bratislava .................................................................. Slovak Republic DDB Worldwide Partners Inc. 80%Tandem DDB, S.A. .................................................................... Spain DDB Holding Europe S.C.A. 7%
Registrant 81%Tandem Campmany Guasch DDB, S.A. .................................. Spain Registrant 2%
Tandem DDB, S.A. 86%
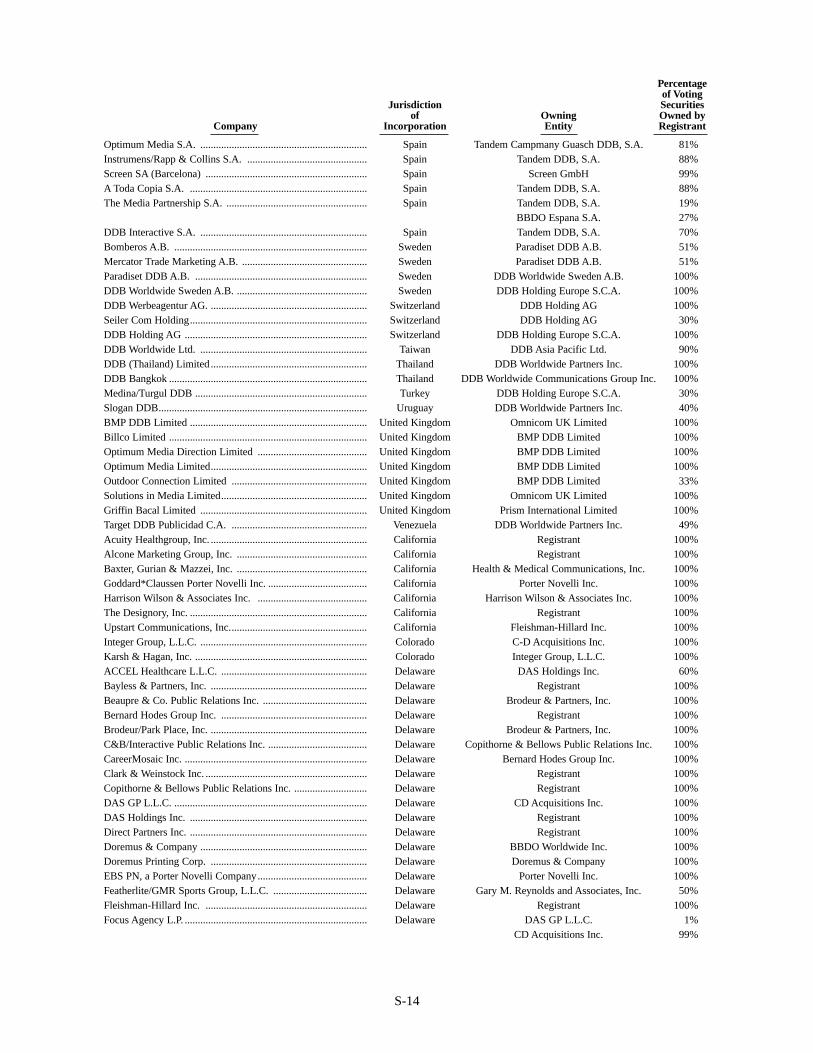
Percentageof Voting
Jurisdiction Securitiesof Owning Owned by
Company Incorporation Entity Registrant
S-14
Optimum Media S.A. ................................................................ Spain Tandem Campmany Guasch DDB, S.A. 81%Instrumens/Rapp & Collins S.A. .............................................. Spain Tandem DDB, S.A. 88%Screen SA (Barcelona) .............................................................. Spain Screen GmbH 99%A Toda Copia S.A. .................................................................... Spain Tandem DDB, S.A. 88%The Media Partnership S.A. ...................................................... Spain Tandem DDB, S.A. 19%
BBDO Espana S.A. 27%DDB Interactive S.A. ................................................................ Spain Tandem DDB, S.A. 70%Bomberos A.B. .......................................................................... Sweden Paradiset DDB A.B. 51%Mercator Trade Marketing A.B. ................................................ Sweden Paradiset DDB A.B. 51%Paradiset DDB A.B. .................................................................. Sweden DDB Worldwide Sweden A.B. 100%DDB Worldwide Sweden A.B. .................................................. Sweden DDB Holding Europe S.C.A. 100%DDB Werbeagentur AG. ............................................................ Switzerland DDB Holding AG 100%Seiler Com Holding.................................................................... Switzerland DDB Holding AG 30%DDB Holding AG ...................................................................... Switzerland DDB Holding Europe S.C.A. 100%DDB Worldwide Ltd. ................................................................ Taiwan DDB Asia Pacific Ltd. 90%DDB (Thailand) Limited ............................................................ Thailand DDB Worldwide Partners Inc. 100%DDB Bangkok ............................................................................ Thailand DDB Worldwide Communications Group Inc. 100%Medina/Turgul DDB .................................................................. Turkey DDB Holding Europe S.C.A. 30%Slogan DDB................................................................................ Uruguay DDB Worldwide Partners Inc. 40%BMP DDB Limited .................................................................... United Kingdom Omnicom UK Limited 100%Billco Limited ............................................................................ United Kingdom BMP DDB Limited 100%Optimum Media Direction Limited .......................................... United Kingdom BMP DDB Limited 100%Optimum Media Limited............................................................ United Kingdom BMP DDB Limited 100%Outdoor Connection Limited .................................................... United Kingdom BMP DDB Limited 33%Solutions in Media Limited........................................................ United Kingdom Omnicom UK Limited 100%Griffin Bacal Limited ................................................................ United Kingdom Prism International Limited 100%Target DDB Publicidad C.A. .................................................... Venezuela DDB Worldwide Partners Inc. 49%Acuity Healthgroup, Inc. ............................................................ California Registrant 100%Alcone Marketing Group, Inc. .................................................. California Registrant 100%Baxter, Gurian & Mazzei, Inc. .................................................. California Health & Medical Communications, Inc. 100%Goddard*Claussen Porter Novelli Inc. ...................................... California Porter Novelli Inc. 100%Harrison Wilson & Associates Inc. .......................................... California Harrison Wilson & Associates Inc. 100%The Designory, Inc. .................................................................... California Registrant 100%Upstart Communications, Inc..................................................... California Fleishman-Hillard Inc. 100%Integer Group, L.L.C. ................................................................ Colorado C-D Acquisitions Inc. 100%Karsh & Hagan, Inc. .................................................................. Colorado Integer Group, L.L.C. 100%ACCEL Healthcare L.L.C. ........................................................ Delaware DAS Holdings Inc. 60%Bayless & Partners, Inc. ............................................................ Delaware Registrant 100%Beaupre & Co. Public Relations Inc. ........................................ Delaware Brodeur & Partners, Inc. 100%Bernard Hodes Group Inc. ........................................................ Delaware Registrant 100%Brodeur/Park Place, Inc. ............................................................ Delaware Brodeur & Partners, Inc. 100%C&B/Interactive Public Relations Inc. ...................................... Delaware Copithorne & Bellows Public Relations Inc. 100%CareerMosaic Inc. ...................................................................... Delaware Bernard Hodes Group Inc. 100%Clark & Weinstock Inc. .............................................................. Delaware Registrant 100%Copithorne & Bellows Public Relations Inc. ............................ Delaware Registrant 100%DAS GP L.L.C. .......................................................................... Delaware CD Acquisitions Inc. 100%DAS Holdings Inc. .................................................................... Delaware Registrant 100%Direct Partners Inc. .................................................................... Delaware Registrant 100%Doremus & Company ................................................................ Delaware BBDO Worldwide Inc. 100%Doremus Printing Corp. ............................................................ Delaware Doremus & Company 100%EBS PN, a Porter Novelli Company.......................................... Delaware Porter Novelli Inc. 100%Featherlite/GMR Sports Group, L.L.C. .................................... Delaware Gary M. Reynolds and Associates, Inc. 50%Fleishman-Hillard Inc. .............................................................. Delaware Registrant 100%Focus Agency L.P. ...................................................................... Delaware DAS GP L.L.C. 1%
CD Acquisitions Inc. 99%
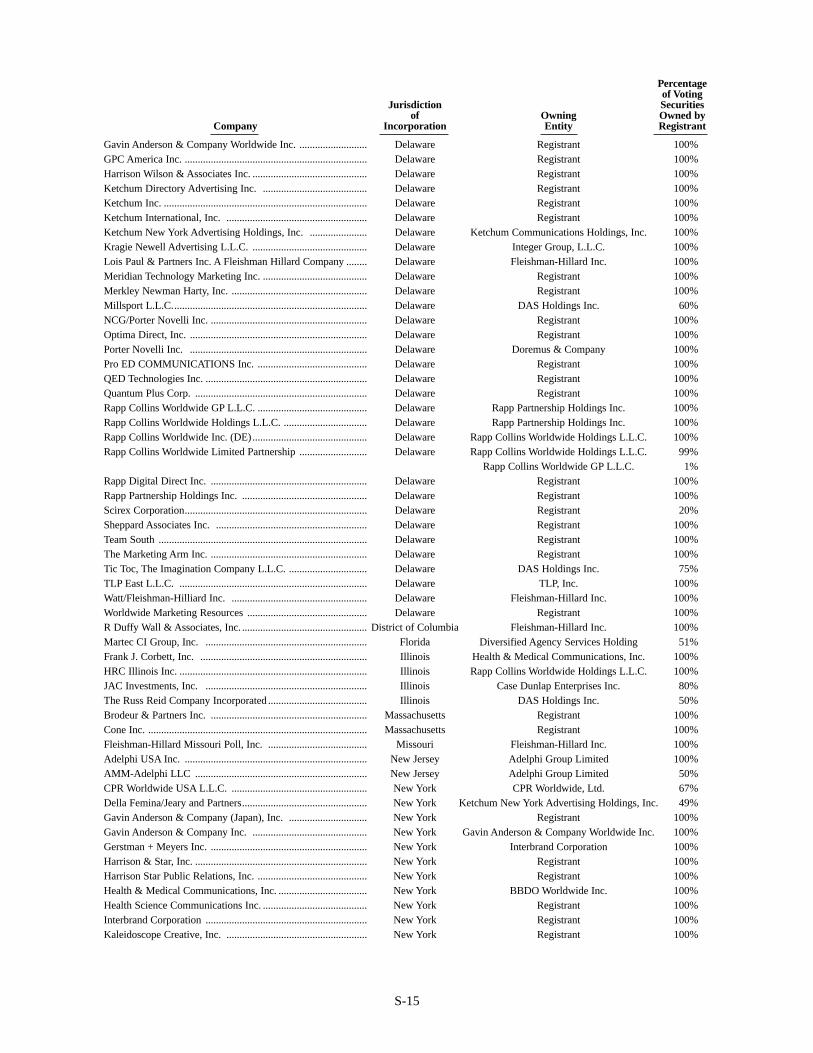
Percentageof Voting
Jurisdiction Securitiesof Owning Owned by
Company Incorporation Entity Registrant
S-15
Gavin Anderson & Company Worldwide Inc. .......................... Delaware Registrant 100%GPC America Inc. ...................................................................... Delaware Registrant 100%Harrison Wilson & Associates Inc. ............................................ Delaware Registrant 100%Ketchum Directory Advertising Inc. ........................................ Delaware Registrant 100%Ketchum Inc. .............................................................................. Delaware Registrant 100%Ketchum International, Inc. ...................................................... Delaware Registrant 100%Ketchum New York Advertising Holdings, Inc. ...................... Delaware Ketchum Communications Holdings, Inc. 100%Kragie Newell Advertising L.L.C. ............................................ Delaware Integer Group, L.L.C. 100%Lois Paul & Partners Inc. A Fleishman Hillard Company ........ Delaware Fleishman-Hillard Inc. 100%Meridian Technology Marketing Inc. ........................................ Delaware Registrant 100%Merkley Newman Harty, Inc. .................................................... Delaware Registrant 100%Millsport L.L.C........................................................................... Delaware DAS Holdings Inc. 60%NCG/Porter Novelli Inc. ............................................................ Delaware Registrant 100%Optima Direct, Inc. .................................................................... Delaware Registrant 100%Porter Novelli Inc. .................................................................... Delaware Doremus & Company 100%Pro ED COMMUNICATIONS Inc. .......................................... Delaware Registrant 100%QED Technologies Inc. .............................................................. Delaware Registrant 100%Quantum Plus Corp. .................................................................. Delaware Registrant 100%Rapp Collins Worldwide GP L.L.C. .......................................... Delaware Rapp Partnership Holdings Inc. 100%Rapp Collins Worldwide Holdings L.L.C. ................................ Delaware Rapp Partnership Holdings Inc. 100%Rapp Collins Worldwide Inc. (DE)............................................ Delaware Rapp Collins Worldwide Holdings L.L.C. 100%Rapp Collins Worldwide Limited Partnership .......................... Delaware Rapp Collins Worldwide Holdings L.L.C. 99%
Rapp Collins Worldwide GP L.L.C. 1%Rapp Digital Direct Inc. ............................................................ Delaware Registrant 100%Rapp Partnership Holdings Inc. ................................................ Delaware Registrant 100%Scirex Corporation...................................................................... Delaware Registrant 20%Sheppard Associates Inc. .......................................................... Delaware Registrant 100%Team South ................................................................................ Delaware Registrant 100%The Marketing Arm Inc. ............................................................ Delaware Registrant 100%Tic Toc, The Imagination Company L.L.C. .............................. Delaware DAS Holdings Inc. 75%TLP East L.L.C. ........................................................................ Delaware TLP, Inc. 100%Watt/Fleishman-Hilliard Inc. .................................................... Delaware Fleishman-Hillard Inc. 100%Worldwide Marketing Resources .............................................. Delaware Registrant 100%R Duffy Wall & Associates, Inc. ................................................ District of Columbia Fleishman-Hillard Inc. 100%Martec CI Group, Inc. .............................................................. Florida Diversified Agency Services Holding 51%Frank J. Corbett, Inc. ................................................................ Illinois Health & Medical Communications, Inc. 100%HRC Illinois Inc. ........................................................................ Illinois Rapp Collins Worldwide Holdings L.L.C. 100%JAC Investments, Inc. .............................................................. Illinois Case Dunlap Enterprises Inc. 80%The Russ Reid Company Incorporated ...................................... Illinois DAS Holdings Inc. 50%Brodeur & Partners Inc. ............................................................ Massachusetts Registrant 100%Cone Inc. .................................................................................... Massachusetts Registrant 100%Fleishman-Hillard Missouri Poll, Inc. ...................................... Missouri Fleishman-Hillard Inc. 100%Adelphi USA Inc. ...................................................................... New Jersey Adelphi Group Limited 100%AMM-Adelphi LLC .................................................................. New Jersey Adelphi Group Limited 50%CPR Worldwide USA L.L.C. .................................................... New York CPR Worldwide, Ltd. 67%Della Femina/Jeary and Partners................................................ New York Ketchum New York Advertising Holdings, Inc. 49%Gavin Anderson & Company (Japan), Inc. .............................. New York Registrant 100%Gavin Anderson & Company Inc. ............................................ New York Gavin Anderson & Company Worldwide Inc. 100%Gerstman + Meyers Inc. ............................................................ New York Interbrand Corporation 100%Harrison & Star, Inc. .................................................................. New York Registrant 100%Harrison Star Public Relations, Inc. .......................................... New York Registrant 100%Health & Medical Communications, Inc. .................................. New York BBDO Worldwide Inc. 100%Health Science Communications Inc. ........................................ New York Registrant 100%Interbrand Corporation .............................................................. New York Registrant 100%Kaleidoscope Creative, Inc. ...................................................... New York Registrant 100%
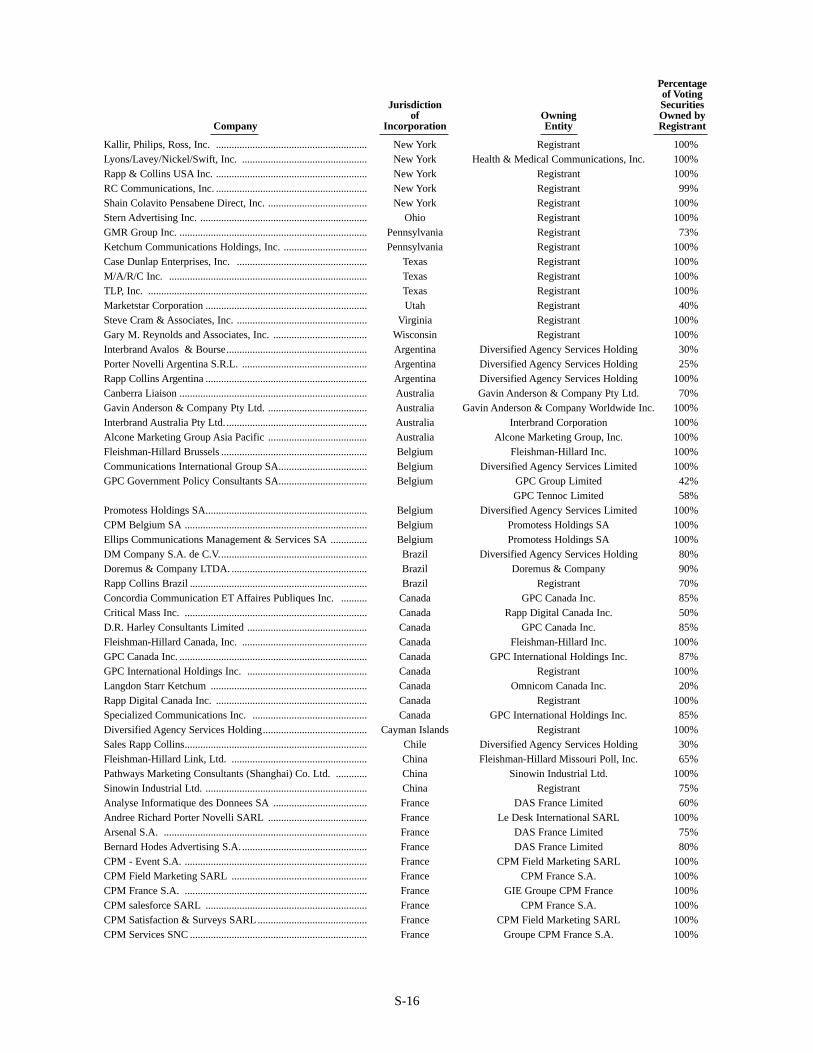
Percentageof Voting
Jurisdiction Securitiesof Owning Owned by
Company Incorporation Entity Registrant
S-16
Kallir, Philips, Ross, Inc. .......................................................... New York Registrant 100%Lyons/Lavey/Nickel/Swift, Inc. ................................................ New York Health & Medical Communications, Inc. 100%Rapp & Collins USA Inc. .......................................................... New York Registrant 100%RC Communications, Inc. .......................................................... New York Registrant 99%Shain Colavito Pensabene Direct, Inc. ...................................... New York Registrant 100%Stern Advertising Inc. ................................................................ Ohio Registrant 100%GMR Group Inc. ........................................................................ Pennsylvania Registrant 73%Ketchum Communications Holdings, Inc. ................................ Pennsylvania Registrant 100%Case Dunlap Enterprises, Inc. .................................................. Texas Registrant 100%M/A/R/C Inc. ............................................................................ Texas Registrant 100%TLP, Inc. .................................................................................... Texas Registrant 100%Marketstar Corporation .............................................................. Utah Registrant 40%Steve Cram & Associates, Inc. .................................................. Virginia Registrant 100%Gary M. Reynolds and Associates, Inc. .................................... Wisconsin Registrant 100%Interbrand Avalos & Bourse...................................................... Argentina Diversified Agency Services Holding 30%Porter Novelli Argentina S.R.L. ................................................ Argentina Diversified Agency Services Holding 25%Rapp Collins Argentina .............................................................. Argentina Diversified Agency Services Holding 100%Canberra Liaison ........................................................................ Australia Gavin Anderson & Company Pty Ltd. 70%Gavin Anderson & Company Pty Ltd. ...................................... Australia Gavin Anderson & Company Worldwide Inc. 100%Interbrand Australia Pty Ltd....................................................... Australia Interbrand Corporation 100%Alcone Marketing Group Asia Pacific ...................................... Australia Alcone Marketing Group, Inc. 100%Fleishman-Hillard Brussels ........................................................ Belgium Fleishman-Hillard Inc. 100%Communications International Group SA.................................. Belgium Diversified Agency Services Limited 100%GPC Government Policy Consultants SA.................................. Belgium GPC Group Limited 42%
GPC Tennoc Limited 58%Promotess Holdings SA.............................................................. Belgium Diversified Agency Services Limited 100%CPM Belgium SA ...................................................................... Belgium Promotess Holdings SA 100%Ellips Communications Management & Services SA .............. Belgium Promotess Holdings SA 100%DM Company S.A. de C.V......................................................... Brazil Diversified Agency Services Holding 80%Doremus & Company LTDA. .................................................... Brazil Doremus & Company 90%Rapp Collins Brazil .................................................................... Brazil Registrant 70%Concordia Communication ET Affaires Publiques Inc. .......... Canada GPC Canada Inc. 85%Critical Mass Inc. ...................................................................... Canada Rapp Digital Canada Inc. 50%D.R. Harley Consultants Limited .............................................. Canada GPC Canada Inc. 85%Fleishman-Hillard Canada, Inc. ................................................ Canada Fleishman-Hillard Inc. 100%GPC Canada Inc. ........................................................................ Canada GPC International Holdings Inc. 87%GPC International Holdings Inc. .............................................. Canada Registrant 100%Langdon Starr Ketchum ............................................................ Canada Omnicom Canada Inc. 20%Rapp Digital Canada Inc. .......................................................... Canada Registrant 100%Specialized Communications Inc. ............................................ Canada GPC International Holdings Inc. 85%Diversified Agency Services Holding........................................ Cayman Islands Registrant 100%Sales Rapp Collins...................................................................... Chile Diversified Agency Services Holding 30%Fleishman-Hillard Link, Ltd. .................................................... China Fleishman-Hillard Missouri Poll, Inc. 65%Pathways Marketing Consultants (Shanghai) Co. Ltd. ............ China Sinowin Industrial Ltd. 100%Sinowin Industrial Ltd. .............................................................. China Registrant 75%Analyse Informatique des Donnees SA .................................... France DAS France Limited 60%Andree Richard Porter Novelli SARL ...................................... France Le Desk International SARL 100%Arsenal S.A. .............................................................................. France DAS France Limited 75%Bernard Hodes Advertising S.A................................................. France DAS France Limited 80%CPM - Event S.A. ...................................................................... France CPM Field Marketing SARL 100%CPM Field Marketing SARL .................................................... France CPM France S.A. 100%CPM France S.A. ...................................................................... France GIE Groupe CPM France 100%CPM salesforce SARL .............................................................. France CPM France S.A. 100%CPM Satisfaction & Surveys SARL.......................................... France CPM Field Marketing SARL 100%CPM Services SNC .................................................................... France Groupe CPM France S.A. 100%
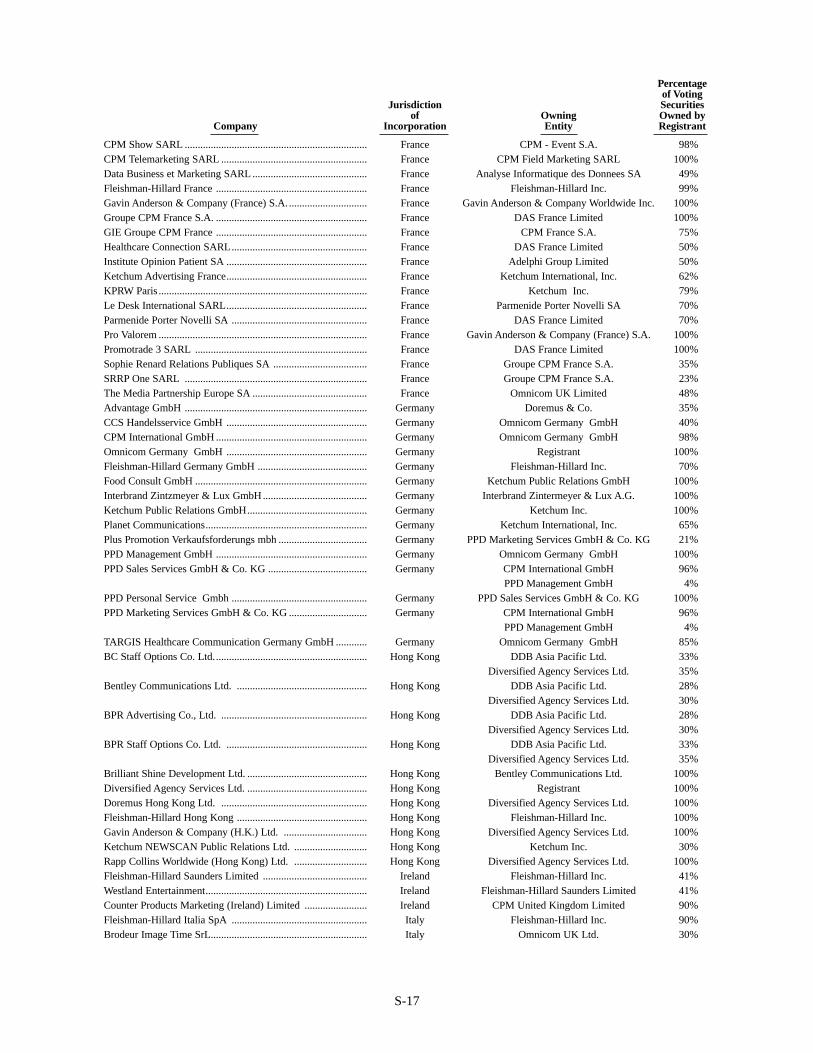
Percentageof Voting
Jurisdiction Securitiesof Owning Owned by
Company Incorporation Entity Registrant
S-17
CPM Show SARL ...................................................................... France CPM - Event S.A. 98%CPM Telemarketing SARL ........................................................ France CPM Field Marketing SARL 100%Data Business et Marketing SARL ............................................ France Analyse Informatique des Donnees SA 49%Fleishman-Hillard France .......................................................... France Fleishman-Hillard Inc. 99%Gavin Anderson & Company (France) S.A. .............................. France Gavin Anderson & Company Worldwide Inc. 100%Groupe CPM France S.A. .......................................................... France DAS France Limited 100%GIE Groupe CPM France .......................................................... France CPM France S.A. 75%Healthcare Connection SARL.................................................... France DAS France Limited 50%Institute Opinion Patient SA ...................................................... France Adelphi Group Limited 50%Ketchum Advertising France...................................................... France Ketchum International, Inc. 62%KPRW Paris ................................................................................ France Ketchum Inc. 79%Le Desk International SARL...................................................... France Parmenide Porter Novelli SA 70%Parmenide Porter Novelli SA .................................................... France DAS France Limited 70%Pro Valorem ................................................................................ France Gavin Anderson & Company (France) S.A. 100%Promotrade 3 SARL .................................................................. France DAS France Limited 100%Sophie Renard Relations Publiques SA .................................... France Groupe CPM France S.A. 35%SRRP One SARL ...................................................................... France Groupe CPM France S.A. 23%The Media Partnership Europe SA ............................................ France Omnicom UK Limited 48%Advantage GmbH ...................................................................... Germany Doremus & Co. 35%CCS Handelsservice GmbH ...................................................... Germany Omnicom Germany GmbH 40%CPM International GmbH .......................................................... Germany Omnicom Germany GmbH 98%Omnicom Germany GmbH ...................................................... Germany Registrant 100%Fleishman-Hillard Germany GmbH .......................................... Germany Fleishman-Hillard Inc. 70%Food Consult GmbH .................................................................. Germany Ketchum Public Relations GmbH 100%Interbrand Zintzmeyer & Lux GmbH........................................ Germany Interbrand Zintermeyer & Lux A.G. 100%Ketchum Public Relations GmbH.............................................. Germany Ketchum Inc. 100%Planet Communications.............................................................. Germany Ketchum International, Inc. 65%Plus Promotion Verkaufsforderungs mbh .................................. Germany PPD Marketing Services GmbH & Co. KG 21%PPD Management GmbH .......................................................... Germany Omnicom Germany GmbH 100%PPD Sales Services GmbH & Co. KG ...................................... Germany CPM International GmbH 96%
PPD Management GmbH 4%PPD Personal Service Gmbh .................................................... Germany PPD Sales Services GmbH & Co. KG 100%PPD Marketing Services GmbH & Co. KG .............................. Germany CPM International GmbH 96%
PPD Management GmbH 4%TARGIS Healthcare Communication Germany GmbH ............ Germany Omnicom Germany GmbH 85%BC Staff Options Co. Ltd........................................................... Hong Kong DDB Asia Pacific Ltd. 33%
Diversified Agency Services Ltd. 35%Bentley Communications Ltd. .................................................. Hong Kong DDB Asia Pacific Ltd. 28%
Diversified Agency Services Ltd. 30%BPR Advertising Co., Ltd. ........................................................ Hong Kong DDB Asia Pacific Ltd. 28%
Diversified Agency Services Ltd. 30%BPR Staff Options Co. Ltd. ...................................................... Hong Kong DDB Asia Pacific Ltd. 33%
Diversified Agency Services Ltd. 35%Brilliant Shine Development Ltd. .............................................. Hong Kong Bentley Communications Ltd. 100%Diversified Agency Services Ltd. .............................................. Hong Kong Registrant 100%Doremus Hong Kong Ltd. ........................................................ Hong Kong Diversified Agency Services Ltd. 100%Fleishman-Hillard Hong Kong .................................................. Hong Kong Fleishman-Hillard Inc. 100%Gavin Anderson & Company (H.K.) Ltd. ................................ Hong Kong Diversified Agency Services Ltd. 100%Ketchum NEWSCAN Public Relations Ltd. ............................ Hong Kong Ketchum Inc. 30%Rapp Collins Worldwide (Hong Kong) Ltd. ............................ Hong Kong Diversified Agency Services Ltd. 100%Fleishman-Hillard Saunders Limited ........................................ Ireland Fleishman-Hillard Inc. 41%Westland Entertainment.............................................................. Ireland Fleishman-Hillard Saunders Limited 41%Counter Products Marketing (Ireland) Limited ........................ Ireland CPM United Kingdom Limited 90%Fleishman-Hillard Italia SpA .................................................... Italy Fleishman-Hillard Inc. 90%Brodeur Image Time SrL............................................................ Italy Omnicom UK Ltd. 30%
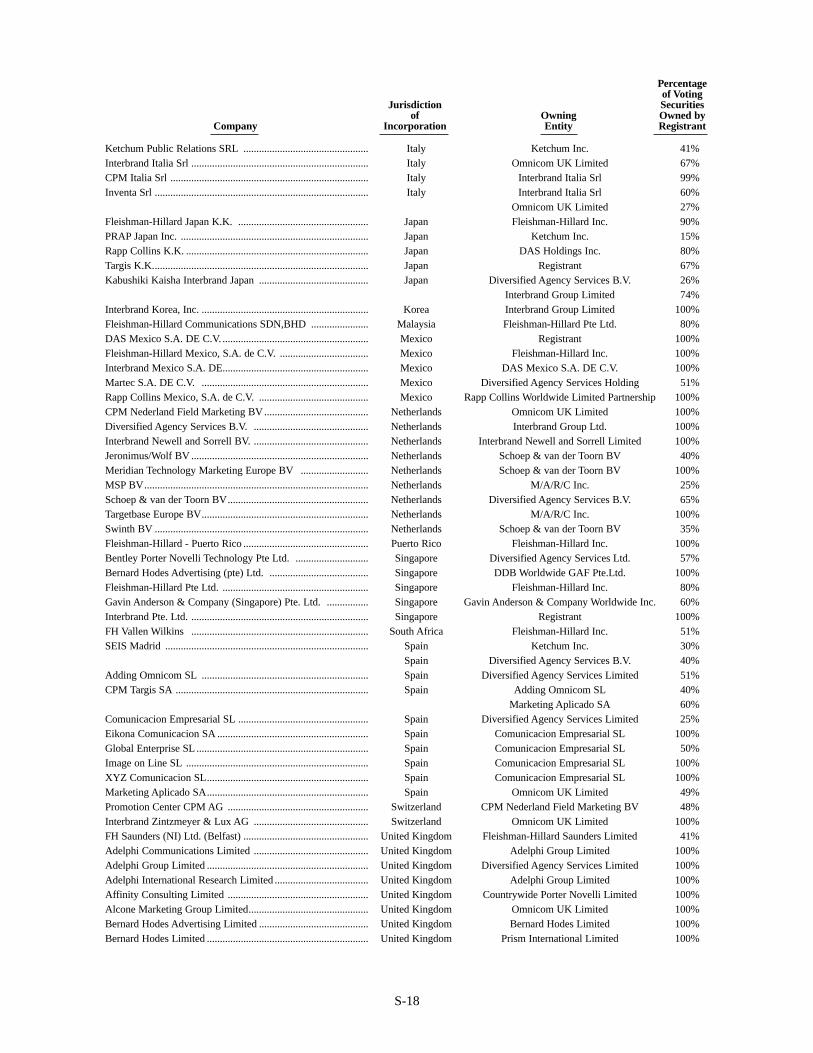
Percentageof Voting
Jurisdiction Securitiesof Owning Owned by
Company Incorporation Entity Registrant
Ketchum Public Relations SRL ................................................ Italy Ketchum Inc. 41%Interbrand Italia Srl .................................................................... Italy Omnicom UK Limited 67%CPM Italia Srl ............................................................................ Italy Interbrand Italia Srl 99%Inventa Srl .................................................................................. Italy Interbrand Italia Srl 60%
Omnicom UK Limited 27%Fleishman-Hillard Japan K.K. .................................................. Japan Fleishman-Hillard Inc. 90%PRAP Japan Inc. ........................................................................ Japan Ketchum Inc. 15%Rapp Collins K.K. ...................................................................... Japan DAS Holdings Inc. 80%Targis K.K................................................................................... Japan Registrant 67%Kabushiki Kaisha Interbrand Japan .......................................... Japan Diversified Agency Services B.V. 26%
Interbrand Group Limited 74%Interbrand Korea, Inc. ................................................................ Korea Interbrand Group Limited 100%Fleishman-Hillard Communications SDN,BHD ...................... Malaysia Fleishman-Hillard Pte Ltd. 80%DAS Mexico S.A. DE C.V. ........................................................ Mexico Registrant 100%Fleishman-Hillard Mexico, S.A. de C.V. .................................. Mexico Fleishman-Hillard Inc. 100%Interbrand Mexico S.A. DE........................................................ Mexico DAS Mexico S.A. DE C.V. 100%Martec S.A. DE C.V. ................................................................ Mexico Diversified Agency Services Holding 51%Rapp Collins Mexico, S.A. de C.V. .......................................... Mexico Rapp Collins Worldwide Limited Partnership 100%CPM Nederland Field Marketing BV........................................ Netherlands Omnicom UK Limited 100%Diversified Agency Services B.V. ............................................ Netherlands Interbrand Group Ltd. 100%Interbrand Newell and Sorrell BV. ............................................ Netherlands Interbrand Newell and Sorrell Limited 100%Jeronimus/Wolf BV .................................................................... Netherlands Schoep & van der Toorn BV 40%Meridian Technology Marketing Europe BV .......................... Netherlands Schoep & van der Toorn BV 100%MSP BV...................................................................................... Netherlands M/A/R/C Inc. 25%Schoep & van der Toorn BV...................................................... Netherlands Diversified Agency Services B.V. 65%Targetbase Europe BV................................................................ Netherlands M/A/R/C Inc. 100%Swinth BV .................................................................................. Netherlands Schoep & van der Toorn BV 35%Fleishman-Hillard - Puerto Rico ................................................ Puerto Rico Fleishman-Hillard Inc. 100%Bentley Porter Novelli Technology Pte Ltd. ............................ Singapore Diversified Agency Services Ltd. 57%Bernard Hodes Advertising (pte) Ltd. ...................................... Singapore DDB Worldwide GAF Pte.Ltd. 100%Fleishman-Hillard Pte Ltd. ........................................................ Singapore Fleishman-Hillard Inc. 80%Gavin Anderson & Company (Singapore) Pte. Ltd. ................ Singapore Gavin Anderson & Company Worldwide Inc. 60%Interbrand Pte. Ltd. .................................................................... Singapore Registrant 100%FH Vallen Wilkins .................................................................... South Africa Fleishman-Hillard Inc. 51%SEIS Madrid .............................................................................. Spain Ketchum Inc. 30%
Spain Diversified Agency Services B.V. 40%Adding Omnicom SL ................................................................ Spain Diversified Agency Services Limited 51%CPM Targis SA .......................................................................... Spain Adding Omnicom SL 40%
Marketing Aplicado SA 60%Comunicacion Empresarial SL .................................................. Spain Diversified Agency Services Limited 25%Eikona Comunicacion SA .......................................................... Spain Comunicacion Empresarial SL 100%Global Enterprise SL .................................................................. Spain Comunicacion Empresarial SL 50%Image on Line SL ...................................................................... Spain Comunicacion Empresarial SL 100%XYZ Comunicacion SL.............................................................. Spain Comunicacion Empresarial SL 100%Marketing Aplicado SA.............................................................. Spain Omnicom UK Limited 49%Promotion Center CPM AG ...................................................... Switzerland CPM Nederland Field Marketing BV 48%Interbrand Zintzmeyer & Lux AG ............................................ Switzerland Omnicom UK Limited 100%FH Saunders (NI) Ltd. (Belfast) ................................................ United Kingdom Fleishman-Hillard Saunders Limited 41%Adelphi Communications Limited ............................................ United Kingdom Adelphi Group Limited 100%Adelphi Group Limited .............................................................. United Kingdom Diversified Agency Services Limited 100%Adelphi International Research Limited .................................... United Kingdom Adelphi Group Limited 100%Affinity Consulting Limited ...................................................... United Kingdom Countrywide Porter Novelli Limited 100%Alcone Marketing Group Limited.............................................. United Kingdom Omnicom UK Limited 100%Bernard Hodes Advertising Limited .......................................... United Kingdom Bernard Hodes Limited 100%Bernard Hodes Limited .............................................................. United Kingdom Prism International Limited 100%
S-18
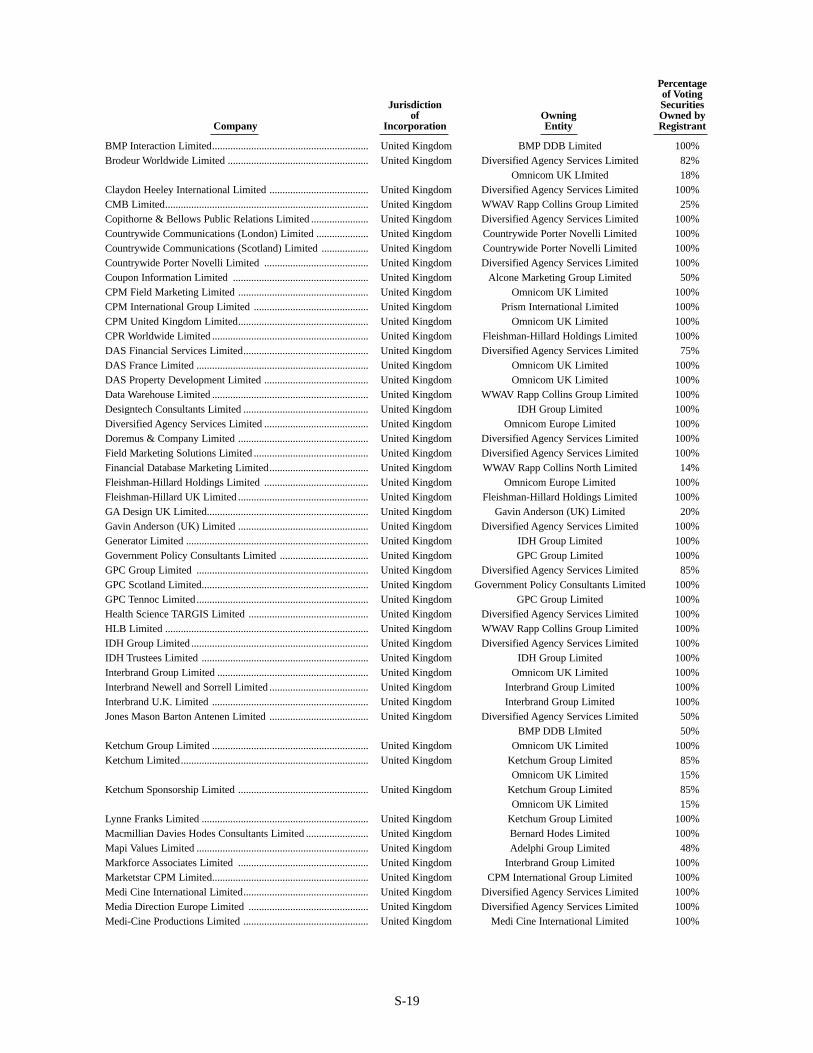
Percentageof Voting
Jurisdiction Securitiesof Owning Owned by
Company Incorporation Entity Registrant
BMP Interaction Limited............................................................ United Kingdom BMP DDB Limited 100%Brodeur Worldwide Limited ...................................................... United Kingdom Diversified Agency Services Limited 82%
Omnicom UK LImited 18%Claydon Heeley International Limited ...................................... United Kingdom Diversified Agency Services Limited 100%CMB Limited.............................................................................. United Kingdom WWAV Rapp Collins Group Limited 25%Copithorne & Bellows Public Relations Limited ...................... United Kingdom Diversified Agency Services Limited 100%Countrywide Communications (London) Limited .................... United Kingdom Countrywide Porter Novelli Limited 100%Countrywide Communications (Scotland) Limited .................. United Kingdom Countrywide Porter Novelli Limited 100%Countrywide Porter Novelli Limited ........................................ United Kingdom Diversified Agency Services Limited 100%Coupon Information Limited .................................................... United Kingdom Alcone Marketing Group Limited 50%CPM Field Marketing Limited .................................................. United Kingdom Omnicom UK Limited 100%CPM International Group Limited ............................................ United Kingdom Prism International Limited 100%CPM United Kingdom Limited.................................................. United Kingdom Omnicom UK Limited 100%CPR Worldwide Limited ............................................................ United Kingdom Fleishman-Hillard Holdings Limited 100%DAS Financial Services Limited................................................ United Kingdom Diversified Agency Services Limited 75%DAS France Limited .................................................................. United Kingdom Omnicom UK Limited 100%DAS Property Development Limited ........................................ United Kingdom Omnicom UK Limited 100%Data Warehouse Limited ............................................................ United Kingdom WWAV Rapp Collins Group Limited 100%Designtech Consultants Limited ................................................ United Kingdom IDH Group Limited 100%Diversified Agency Services Limited ........................................ United Kingdom Omnicom Europe Limited 100%Doremus & Company Limited .................................................. United Kingdom Diversified Agency Services Limited 100%Field Marketing Solutions Limited ............................................ United Kingdom Diversified Agency Services Limited 100%Financial Database Marketing Limited...................................... United Kingdom WWAV Rapp Collins North Limited 14%Fleishman-Hillard Holdings Limited ........................................ United Kingdom Omnicom Europe Limited 100%Fleishman-Hillard UK Limited .................................................. United Kingdom Fleishman-Hillard Holdings Limited 100%GA Design UK Limited.............................................................. United Kingdom Gavin Anderson (UK) Limited 20%Gavin Anderson (UK) Limited .................................................. United Kingdom Diversified Agency Services Limited 100%Generator Limited ...................................................................... United Kingdom IDH Group Limited 100%Government Policy Consultants Limited .................................. United Kingdom GPC Group Limited 100%GPC Group Limited .................................................................. United Kingdom Diversified Agency Services Limited 85%GPC Scotland Limited................................................................ United Kingdom Government Policy Consultants Limited 100%GPC Tennoc Limited.................................................................. United Kingdom GPC Group Limited 100%Health Science TARGIS Limited .............................................. United Kingdom Diversified Agency Services Limited 100%HLB Limited .............................................................................. United Kingdom WWAV Rapp Collins Group Limited 100%IDH Group Limited .................................................................... United Kingdom Diversified Agency Services Limited 100%IDH Trustees Limited ................................................................ United Kingdom IDH Group Limited 100%Interbrand Group Limited .......................................................... United Kingdom Omnicom UK Limited 100%Interbrand Newell and Sorrell Limited ...................................... United Kingdom Interbrand Group Limited 100%Interbrand U.K. Limited ............................................................ United Kingdom Interbrand Group Limited 100%Jones Mason Barton Antenen Limited ...................................... United Kingdom Diversified Agency Services Limited 50%
BMP DDB LImited 50%Ketchum Group Limited ............................................................ United Kingdom Omnicom UK Limited 100%Ketchum Limited........................................................................ United Kingdom Ketchum Group Limited 85%
Omnicom UK Limited 15%Ketchum Sponsorship Limited .................................................. United Kingdom Ketchum Group Limited 85%
Omnicom UK Limited 15%Lynne Franks Limited ................................................................ United Kingdom Ketchum Group Limited 100%Macmillian Davies Hodes Consultants Limited ........................ United Kingdom Bernard Hodes Limited 100%Mapi Values Limited .................................................................. United Kingdom Adelphi Group Limited 48%Markforce Associates Limited .................................................. United Kingdom Interbrand Group Limited 100%Marketstar CPM Limited............................................................ United Kingdom CPM International Group Limited 100%Medi Cine International Limited................................................ United Kingdom Diversified Agency Services Limited 100%Media Direction Europe Limited .............................................. United Kingdom Diversified Agency Services Limited 100%Medi-Cine Productions Limited ................................................ United Kingdom Medi Cine International Limited 100%
S-19
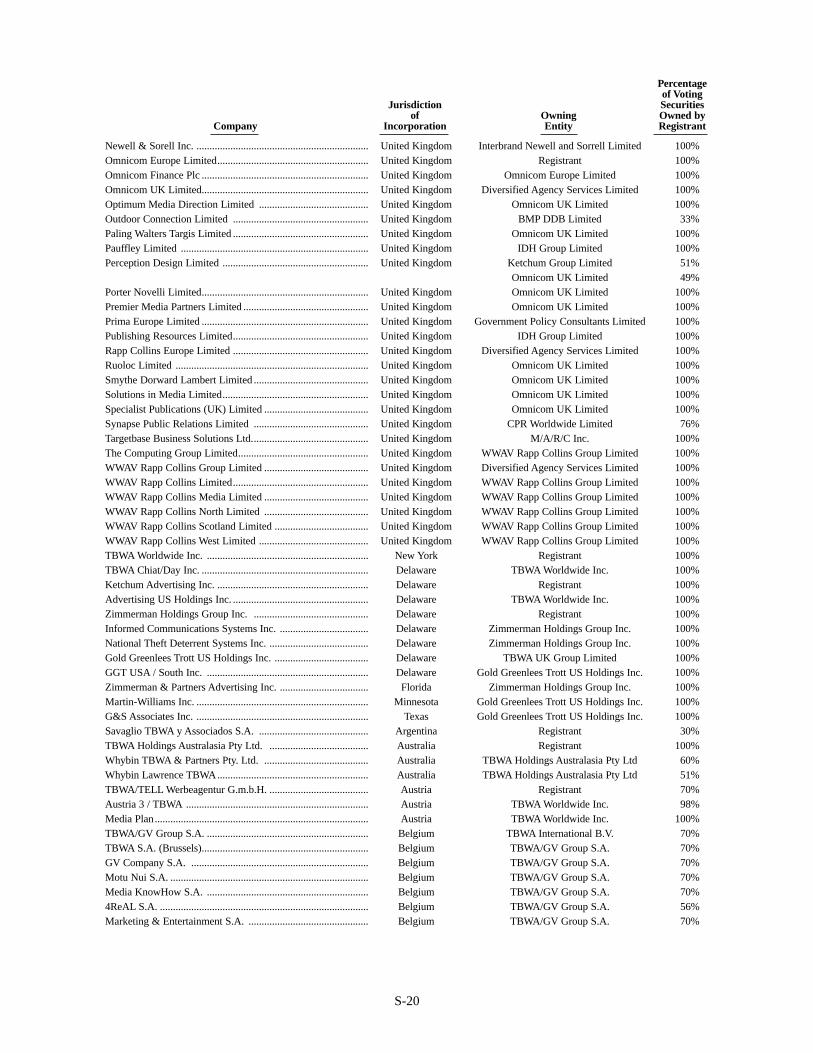
Percentageof Voting
Jurisdiction Securitiesof Owning Owned by
Company Incorporation Entity Registrant
Newell & Sorell Inc. .................................................................. United Kingdom Interbrand Newell and Sorrell Limited 100%Omnicom Europe Limited.......................................................... United Kingdom Registrant 100%Omnicom Finance Plc ................................................................ United Kingdom Omnicom Europe Limited 100%Omnicom UK Limited................................................................ United Kingdom Diversified Agency Services Limited 100%Optimum Media Direction Limited .......................................... United Kingdom Omnicom UK Limited 100%Outdoor Connection Limited .................................................... United Kingdom BMP DDB Limited 33%Paling Walters Targis Limited .................................................... United Kingdom Omnicom UK Limited 100%Pauffley Limited ........................................................................ United Kingdom IDH Group Limited 100%Perception Design Limited ........................................................ United Kingdom Ketchum Group Limited 51%
Omnicom UK Limited 49%Porter Novelli Limited................................................................ United Kingdom Omnicom UK Limited 100%Premier Media Partners Limited ................................................ United Kingdom Omnicom UK Limited 100%Prima Europe Limited ................................................................ United Kingdom Government Policy Consultants Limited 100%Publishing Resources Limited.................................................... United Kingdom IDH Group Limited 100%Rapp Collins Europe Limited .................................................... United Kingdom Diversified Agency Services Limited 100%Ruoloc Limited .......................................................................... United Kingdom Omnicom UK Limited 100%Smythe Dorward Lambert Limited ............................................ United Kingdom Omnicom UK Limited 100%Solutions in Media Limited........................................................ United Kingdom Omnicom UK Limited 100%Specialist Publications (UK) Limited ........................................ United Kingdom Omnicom UK Limited 100%Synapse Public Relations Limited ............................................ United Kingdom CPR Worldwide Limited 76%Targetbase Business Solutions Ltd............................................. United Kingdom M/A/R/C Inc. 100%The Computing Group Limited.................................................. United Kingdom WWAV Rapp Collins Group Limited 100%WWAV Rapp Collins Group Limited ........................................ United Kingdom Diversified Agency Services Limited 100%WWAV Rapp Collins Limited.................................................... United Kingdom WWAV Rapp Collins Group Limited 100%WWAV Rapp Collins Media Limited ........................................ United Kingdom WWAV Rapp Collins Group Limited 100%WWAV Rapp Collins North Limited ........................................ United Kingdom WWAV Rapp Collins Group Limited 100%WWAV Rapp Collins Scotland Limited .................................... United Kingdom WWAV Rapp Collins Group Limited 100%WWAV Rapp Collins West Limited .......................................... United Kingdom WWAV Rapp Collins Group Limited 100%TBWA Worldwide Inc. .............................................................. New York Registrant 100%TBWA Chiat/Day Inc. ................................................................ Delaware TBWA Worldwide Inc. 100%Ketchum Advertising Inc. .......................................................... Delaware Registrant 100%Advertising US Holdings Inc. .................................................... Delaware TBWA Worldwide Inc. 100%Zimmerman Holdings Group Inc. ............................................ Delaware Registrant 100%Informed Communications Systems Inc. .................................. Delaware Zimmerman Holdings Group Inc. 100%National Theft Deterrent Systems Inc. ...................................... Delaware Zimmerman Holdings Group Inc. 100%Gold Greenlees Trott US Holdings Inc. .................................... Delaware TBWA UK Group Limited 100%GGT USA / South Inc. .............................................................. Delaware Gold Greenlees Trott US Holdings Inc. 100%Zimmerman & Partners Advertising Inc. .................................. Florida Zimmerman Holdings Group Inc. 100%Martin-Williams Inc. .................................................................. Minnesota Gold Greenlees Trott US Holdings Inc. 100%G&S Associates Inc. .................................................................. Texas Gold Greenlees Trott US Holdings Inc. 100%Savaglio TBWA y Associados S.A. .......................................... Argentina Registrant 30%TBWA Holdings Australasia Pty Ltd. ...................................... Australia Registrant 100%Whybin TBWA & Partners Pty. Ltd. ........................................ Australia TBWA Holdings Australasia Pty Ltd 60%Whybin Lawrence TBWA.......................................................... Australia TBWA Holdings Australasia Pty Ltd 51%TBWA/TELL Werbeagentur G.m.b.H. ...................................... Austria Registrant 70%Austria 3 / TBWA ...................................................................... Austria TBWA Worldwide Inc. 98%Media Plan.................................................................................. Austria TBWA Worldwide Inc. 100%TBWA/GV Group S.A. .............................................................. Belgium TBWA International B.V. 70%TBWA S.A. (Brussels)................................................................ Belgium TBWA/GV Group S.A. 70%GV Company S.A. .................................................................... Belgium TBWA/GV Group S.A. 70%Motu Nui S.A. ............................................................................ Belgium TBWA/GV Group S.A. 70%Media KnowHow S.A. .............................................................. Belgium TBWA/GV Group S.A. 70%4ReAL S.A. ................................................................................ Belgium TBWA/GV Group S.A. 56%Marketing & Entertainment S.A. .............................................. Belgium TBWA/GV Group S.A. 70%
S-20
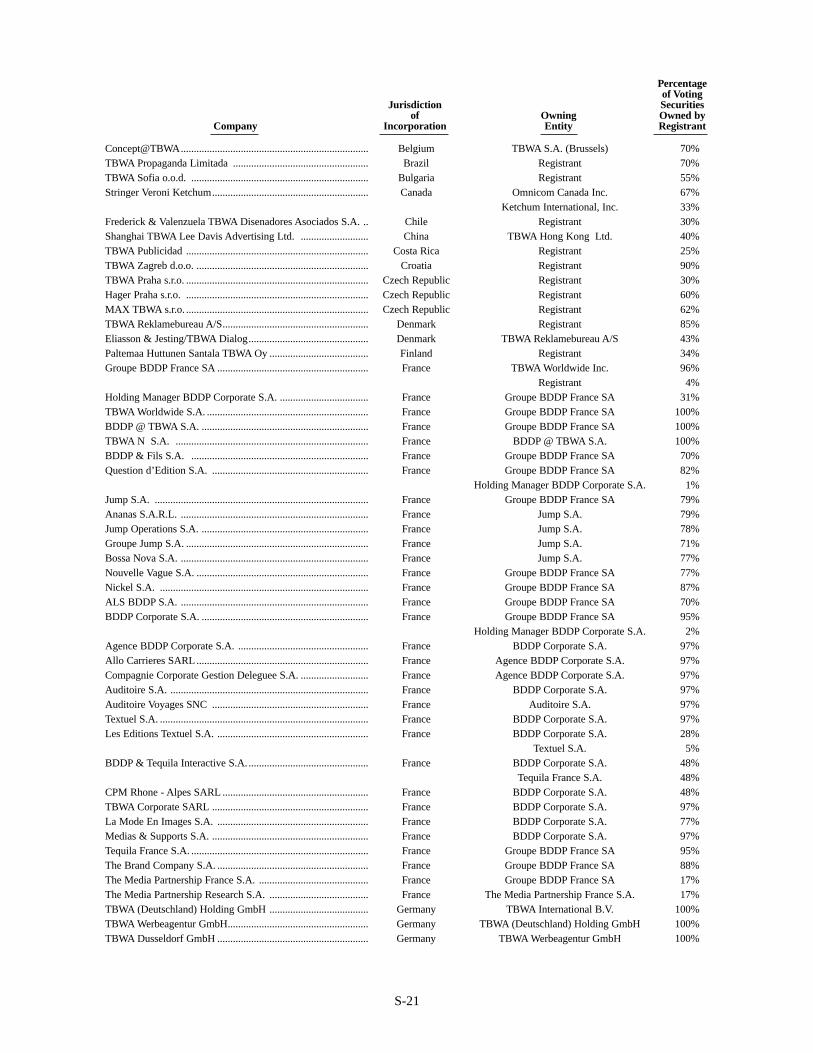
Percentageof Voting
Jurisdiction Securitiesof Owning Owned by
Company Incorporation Entity Registrant
Concept@TBWA........................................................................ Belgium TBWA S.A. (Brussels) 70%TBWA Propaganda Limitada .................................................... Brazil Registrant 70%TBWA Sofia o.o.d. .................................................................... Bulgaria Registrant 55%Stringer Veroni Ketchum............................................................ Canada Omnicom Canada Inc. 67%
Ketchum International, Inc. 33%Frederick & Valenzuela TBWA Disenadores Asociados S.A. .. Chile Registrant 30%Shanghai TBWA Lee Davis Advertising Ltd. .......................... China TBWA Hong Kong Ltd. 40%TBWA Publicidad ...................................................................... Costa Rica Registrant 25%TBWA Zagreb d.o.o. .................................................................. Croatia Registrant 90%TBWA Praha s.r.o. ...................................................................... Czech Republic Registrant 30%Hager Praha s.r.o. ...................................................................... Czech Republic Registrant 60%MAX TBWA s.r.o. ...................................................................... Czech Republic Registrant 62%TBWA Reklamebureau A/S........................................................ Denmark Registrant 85%Eliasson & Jesting/TBWA Dialog.............................................. Denmark TBWA Reklamebureau A/S 43%Paltemaa Huttunen Santala TBWA Oy ...................................... Finland Registrant 34%Groupe BDDP France SA .......................................................... France TBWA Worldwide Inc. 96%
Registrant 4%Holding Manager BDDP Corporate S.A. .................................. France Groupe BDDP France SA 31%TBWA Worldwide S.A. .............................................................. France Groupe BDDP France SA 100%BDDP @ TBWA S.A. ................................................................ France Groupe BDDP France SA 100%TBWA N S.A. .......................................................................... France BDDP @ TBWA S.A. 100%BDDP & Fils S.A. .................................................................... France Groupe BDDP France SA 70%Question d’Edition S.A. ............................................................ France Groupe BDDP France SA 82%
Holding Manager BDDP Corporate S.A. 1%Jump S.A. .................................................................................. France Groupe BDDP France SA 79%Ananas S.A.R.L. ........................................................................ France Jump S.A. 79%Jump Operations S.A. ................................................................ France Jump S.A. 78%Groupe Jump S.A. ...................................................................... France Jump S.A. 71%Bossa Nova S.A. ........................................................................ France Jump S.A. 77%Nouvelle Vague S.A. .................................................................. France Groupe BDDP France SA 77%Nickel S.A. ................................................................................ France Groupe BDDP France SA 87%ALS BDDP S.A. ........................................................................ France Groupe BDDP France SA 70%BDDP Corporate S.A. ................................................................ France Groupe BDDP France SA 95%
Holding Manager BDDP Corporate S.A. 2%Agence BDDP Corporate S.A. .................................................. France BDDP Corporate S.A. 97%Allo Carrieres SARL.................................................................. France Agence BDDP Corporate S.A. 97%Compagnie Corporate Gestion Deleguee S.A. .......................... France Agence BDDP Corporate S.A. 97%Auditoire S.A. ............................................................................ France BDDP Corporate S.A. 97%Auditoire Voyages SNC ............................................................ France Auditoire S.A. 97%Textuel S.A. ................................................................................ France BDDP Corporate S.A. 97%Les Editions Textuel S.A. .......................................................... France BDDP Corporate S.A. 28%
Textuel S.A. 5%BDDP & Tequila Interactive S.A. .............................................. France BDDP Corporate S.A. 48%
Tequila France S.A. 48%CPM Rhone - Alpes SARL ........................................................ France BDDP Corporate S.A. 48%TBWA Corporate SARL ............................................................ France BDDP Corporate S.A. 97%La Mode En Images S.A. .......................................................... France BDDP Corporate S.A. 77%Medias & Supports S.A. ............................................................ France BDDP Corporate S.A. 97%Tequila France S.A. .................................................................... France Groupe BDDP France SA 95%The Brand Company S.A. .......................................................... France Groupe BDDP France SA 88%The Media Partnership France S.A. .......................................... France Groupe BDDP France SA 17%The Media Partnership Research S.A. ...................................... France The Media Partnership France S.A. 17%TBWA (Deutschland) Holding GmbH ...................................... Germany TBWA International B.V. 100%TBWA Werbeagentur GmbH...................................................... Germany TBWA (Deutschland) Holding GmbH 100%TBWA Dusseldorf GmbH .......................................................... Germany TBWA Werbeagentur GmbH 100%
S-21
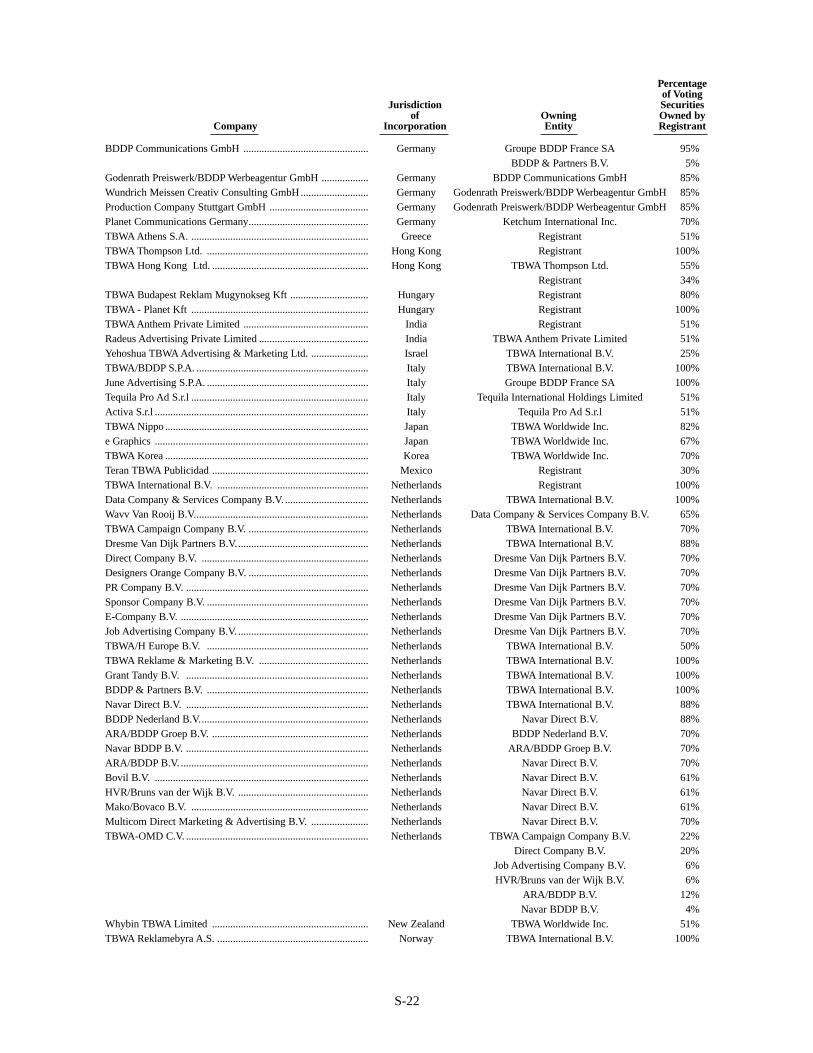
Percentageof Voting
Jurisdiction Securitiesof Owning Owned by
Company Incorporation Entity Registrant
BDDP Communications GmbH ................................................ Germany Groupe BDDP France SA 95%BDDP & Partners B.V. 5%
Godenrath Preiswerk/BDDP Werbeagentur GmbH .................. Germany BDDP Communications GmbH 85%Wundrich Meissen Creativ Consulting GmbH .......................... Germany Godenrath Preiswerk/BDDP Werbeagentur GmbH 85%Production Company Stuttgart GmbH ...................................... Germany Godenrath Preiswerk/BDDP Werbeagentur GmbH 85%Planet Communications Germany.............................................. Germany Ketchum International Inc. 70%TBWA Athens S.A. .................................................................... Greece Registrant 51%TBWA Thompson Ltd. .............................................................. Hong Kong Registrant 100%TBWA Hong Kong Ltd. ............................................................ Hong Kong TBWA Thompson Ltd. 55%
Registrant 34%TBWA Budapest Reklam Mugynokseg Kft .............................. Hungary Registrant 80%TBWA - Planet Kft .................................................................... Hungary Registrant 100%TBWA Anthem Private Limited ................................................ India Registrant 51%Radeus Advertising Private Limited .......................................... India TBWA Anthem Private Limited 51%Yehoshua TBWA Advertising & Marketing Ltd. ...................... Israel TBWA International B.V. 25%TBWA/BDDP S.P.A. .................................................................. Italy TBWA International B.V. 100%June Advertising S.P.A. .............................................................. Italy Groupe BDDP France SA 100%Tequila Pro Ad S.r.l .................................................................... Italy Tequila International Holdings Limited 51%Activa S.r.l .................................................................................. Italy Tequila Pro Ad S.r.l 51%TBWA Nippo .............................................................................. Japan TBWA Worldwide Inc. 82%e Graphics .................................................................................. Japan TBWA Worldwide Inc. 67%TBWA Korea .............................................................................. Korea TBWA Worldwide Inc. 70%Teran TBWA Publicidad ............................................................ Mexico Registrant 30%TBWA International B.V. .......................................................... Netherlands Registrant 100%Data Company & Services Company B.V. ................................ Netherlands TBWA International B.V. 100%Wavv Van Rooij B.V................................................................... Netherlands Data Company & Services Company B.V. 65%TBWA Campaign Company B.V. .............................................. Netherlands TBWA International B.V. 70%Dresme Van Dijk Partners B.V................................................... Netherlands TBWA International B.V. 88%Direct Company B.V. ................................................................ Netherlands Dresme Van Dijk Partners B.V. 70%Designers Orange Company B.V. .............................................. Netherlands Dresme Van Dijk Partners B.V. 70%PR Company B.V. ...................................................................... Netherlands Dresme Van Dijk Partners B.V. 70%Sponsor Company B.V. .............................................................. Netherlands Dresme Van Dijk Partners B.V. 70%E-Company B.V. ........................................................................ Netherlands Dresme Van Dijk Partners B.V. 70%Job Advertising Company B.V. .................................................. Netherlands Dresme Van Dijk Partners B.V. 70%TBWA/H Europe B.V. .............................................................. Netherlands TBWA International B.V. 50%TBWA Reklame & Marketing B.V. .......................................... Netherlands TBWA International B.V. 100%Grant Tandy B.V. ...................................................................... Netherlands TBWA International B.V. 100%BDDP & Partners B.V. .............................................................. Netherlands TBWA International B.V. 100%Navar Direct B.V. ...................................................................... Netherlands TBWA International B.V. 88%BDDP Nederland B.V................................................................. Netherlands Navar Direct B.V. 88%ARA/BDDP Groep B.V. ............................................................ Netherlands BDDP Nederland B.V. 70%Navar BDDP B.V. ...................................................................... Netherlands ARA/BDDP Groep B.V. 70%ARA/BDDP B.V. ........................................................................ Netherlands Navar Direct B.V. 70%Bovil B.V. .................................................................................. Netherlands Navar Direct B.V. 61%HVR/Bruns van der Wijk B.V. .................................................. Netherlands Navar Direct B.V. 61%Mako/Bovaco B.V. .................................................................... Netherlands Navar Direct B.V. 61%Multicom Direct Marketing & Advertising B.V. ...................... Netherlands Navar Direct B.V. 70%TBWA-OMD C.V. ...................................................................... Netherlands TBWA Campaign Company B.V. 22%
Direct Company B.V. 20%Job Advertising Company B.V. 6%HVR/Bruns van der Wijk B.V. 6%
ARA/BDDP B.V. 12%Navar BDDP B.V. 4%
Whybin TBWA Limited ............................................................ New Zealand TBWA Worldwide Inc. 51%TBWA Reklamebyra A.S. .......................................................... Norway TBWA International B.V. 100%
S-22
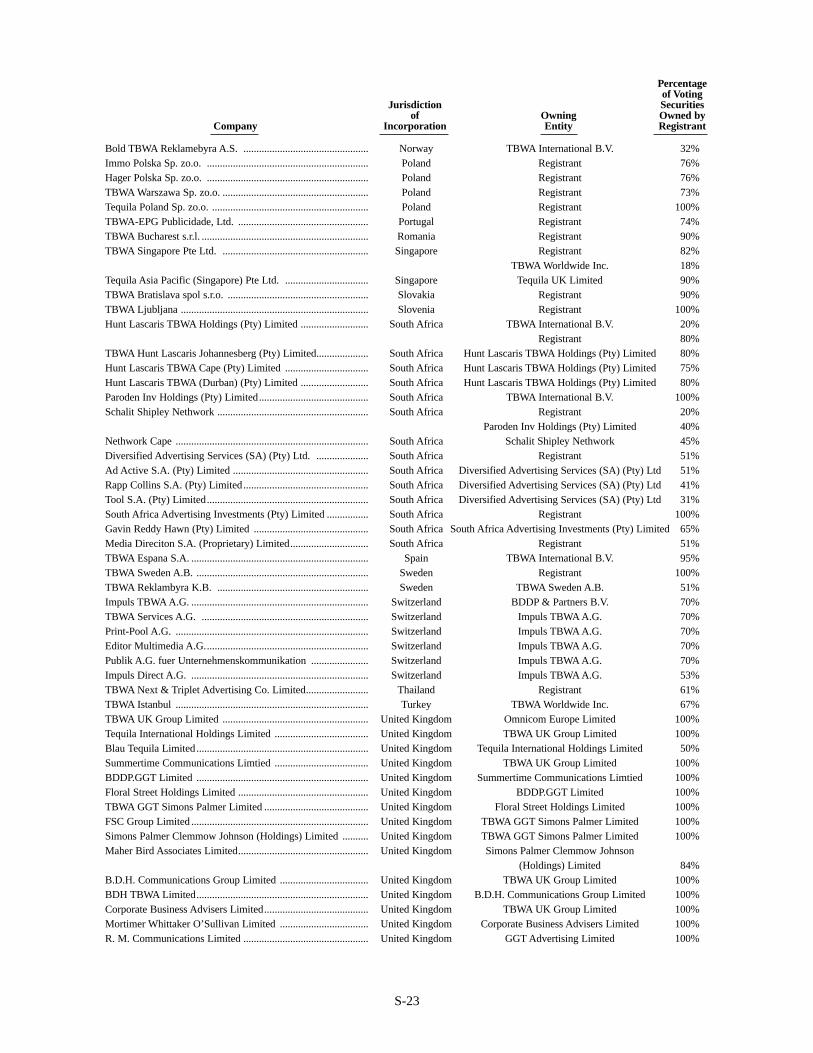
Percentageof Voting
Jurisdiction Securitiesof Owning Owned by
Company Incorporation Entity Registrant
Bold TBWA Reklamebyra A.S. ................................................ Norway TBWA International B.V. 32%Immo Polska Sp. zo.o. .............................................................. Poland Registrant 76%Hager Polska Sp. zo.o. .............................................................. Poland Registrant 76%TBWA Warszawa Sp. zo.o. ........................................................ Poland Registrant 73%Tequila Poland Sp. zo.o. ............................................................ Poland Registrant 100%TBWA-EPG Publicidade, Ltd. .................................................. Portugal Registrant 74%TBWA Bucharest s.r.l. ................................................................ Romania Registrant 90%TBWA Singapore Pte Ltd. ........................................................ Singapore Registrant 82%
TBWA Worldwide Inc. 18%Tequila Asia Pacific (Singapore) Pte Ltd. ................................ Singapore Tequila UK Limited 90%TBWA Bratislava spol s.r.o. ...................................................... Slovakia Registrant 90%TBWA Ljubljana ........................................................................ Slovenia Registrant 100%Hunt Lascaris TBWA Holdings (Pty) Limited .......................... South Africa TBWA International B.V. 20%
Registrant 80%TBWA Hunt Lascaris Johannesberg (Pty) Limited.................... South Africa Hunt Lascaris TBWA Holdings (Pty) Limited 80%Hunt Lascaris TBWA Cape (Pty) Limited ................................ South Africa Hunt Lascaris TBWA Holdings (Pty) Limited 75%Hunt Lascaris TBWA (Durban) (Pty) Limited .......................... South Africa Hunt Lascaris TBWA Holdings (Pty) Limited 80%Paroden Inv Holdings (Pty) Limited.......................................... South Africa TBWA International B.V. 100%Schalit Shipley Nethwork .......................................................... South Africa Registrant 20%
Paroden Inv Holdings (Pty) Limited 40%Nethwork Cape .......................................................................... South Africa Schalit Shipley Nethwork 45%Diversified Advertising Services (SA) (Pty) Ltd. .................... South Africa Registrant 51%Ad Active S.A. (Pty) Limited .................................................... South Africa Diversified Advertising Services (SA) (Pty) Ltd 51%Rapp Collins S.A. (Pty) Limited................................................ South Africa Diversified Advertising Services (SA) (Pty) Ltd 41%Tool S.A. (Pty) Limited.............................................................. South Africa Diversified Advertising Services (SA) (Pty) Ltd 31%South Africa Advertising Investments (Pty) Limited ................ South Africa Registrant 100%Gavin Reddy Hawn (Pty) Limited ............................................ South Africa South Africa Advertising Investments (Pty) Limited 65%Media Direciton S.A. (Proprietary) Limited.............................. South Africa Registrant 51%TBWA Espana S.A. .................................................................... Spain TBWA International B.V. 95%TBWA Sweden A.B. .................................................................. Sweden Registrant 100%TBWA Reklambyra K.B. .......................................................... Sweden TBWA Sweden A.B. 51%Impuls TBWA A.G. .................................................................... Switzerland BDDP & Partners B.V. 70%TBWA Services A.G. ................................................................ Switzerland Impuls TBWA A.G. 70%Print-Pool A.G. .......................................................................... Switzerland Impuls TBWA A.G. 70%Editor Multimedia A.G............................................................... Switzerland Impuls TBWA A.G. 70%Publik A.G. fuer Unternehmenskommunikation ...................... Switzerland Impuls TBWA A.G. 70%Impuls Direct A.G. .................................................................... Switzerland Impuls TBWA A.G. 53%TBWA Next & Triplet Advertising Co. Limited........................ Thailand Registrant 61%TBWA Istanbul .......................................................................... Turkey TBWA Worldwide Inc. 67%TBWA UK Group Limited ........................................................ United Kingdom Omnicom Europe Limited 100%Tequila International Holdings Limited .................................... United Kingdom TBWA UK Group Limited 100%Blau Tequila Limited.................................................................. United Kingdom Tequila International Holdings Limited 50%Summertime Communications Limtied .................................... United Kingdom TBWA UK Group Limited 100%BDDP.GGT Limited .................................................................. United Kingdom Summertime Communications Limtied 100%Floral Street Holdings Limited .................................................. United Kingdom BDDP.GGT Limited 100%TBWA GGT Simons Palmer Limited ........................................ United Kingdom Floral Street Holdings Limited 100%FSC Group Limited .................................................................... United Kingdom TBWA GGT Simons Palmer Limited 100%Simons Palmer Clemmow Johnson (Holdings) Limited .......... United Kingdom TBWA GGT Simons Palmer Limited 100%Maher Bird Associates Limited.................................................. United Kingdom Simons Palmer Clemmow Johnson
(Holdings) Limited 84%B.D.H. Communications Group Limited .................................. United Kingdom TBWA UK Group Limited 100%BDH TBWA Limited.................................................................. United Kingdom B.D.H. Communications Group Limited 100%Corporate Business Advisers Limited........................................ United Kingdom TBWA UK Group Limited 100%Mortimer Whittaker O’Sullivan Limited .................................. United Kingdom Corporate Business Advisers Limited 100%R. M. Communications Limited ................................................ United Kingdom GGT Advertising Limited 100%
S-23

Percentageof Voting
Jurisdiction Securitiesof Owning Owned by
Company Incorporation Entity Registrant
GGT Direct Advertising Limited .............................................. United Kingdom TBWA UK Group Limited 100%Happy Dog Limited.................................................................... United Kingdom TBWA UK Group Limited 100%Option One Group Limited ........................................................ United Kingdom TBWA UK Group Limited 100%Option One Limited.................................................................... United Kingdom Option One Group Limited 100%Prism International Limited........................................................ United Kingdom Option One Limited 100%Tequila Payne Stracey Limited .................................................. United Kingdom Prism International Limited 96%Tequila UK Limited.................................................................... United Kingdom Tequila Payne Stracey Limited 100%
S-24
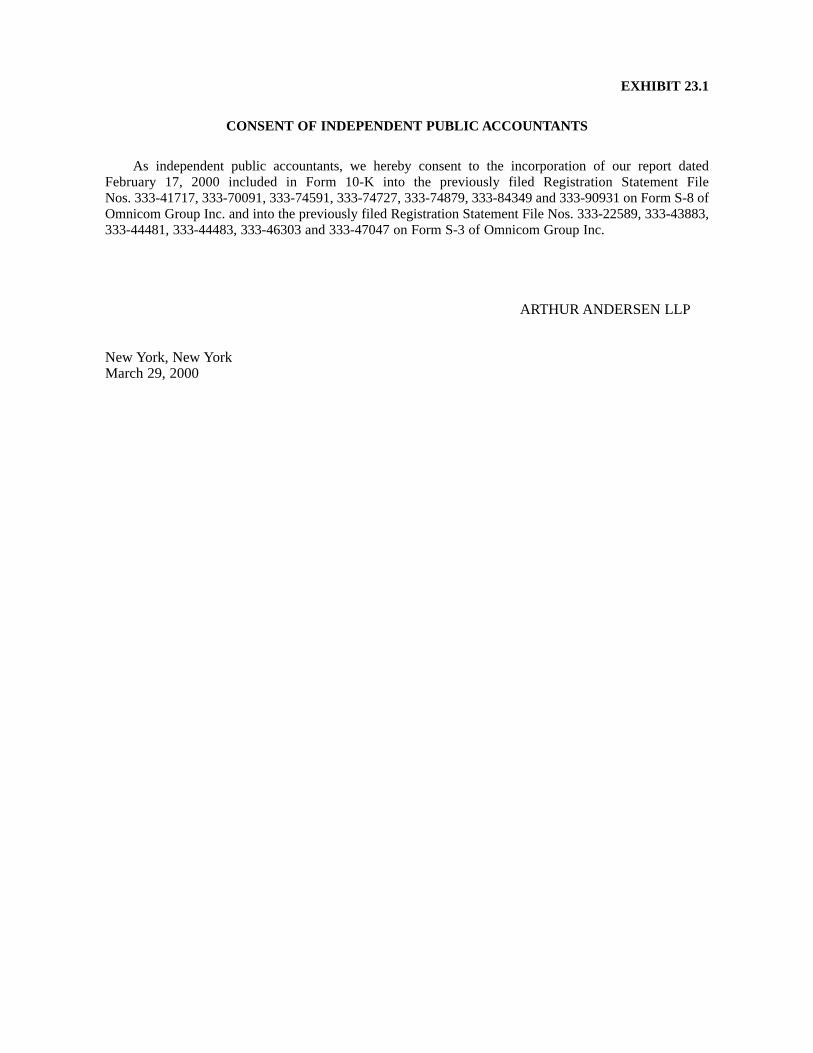
EXHIBIT 23.1
CONSENT OF INDEPENDENT PUBLIC ACCOUNTANTS
As independent public accountants, we hereby consent to the incorporation of our report datedFebruary 17, 2000 included in Form 10-K into the previously filed Registration Statement File Nos. 333-41717, 333-70091, 333-74591, 333-74727, 333-74879, 333-84349 and 333-90931 on Form S-8 ofOmnicom Group Inc. and into the previously filed Registration Statement File Nos. 333-22589, 333-43883,333-44481, 333-44483, 333-46303 and 333-47047 on Form S-3 of Omnicom Group Inc.
ARTHUR ANDERSEN LLP
New York, New YorkMarch 29, 2000
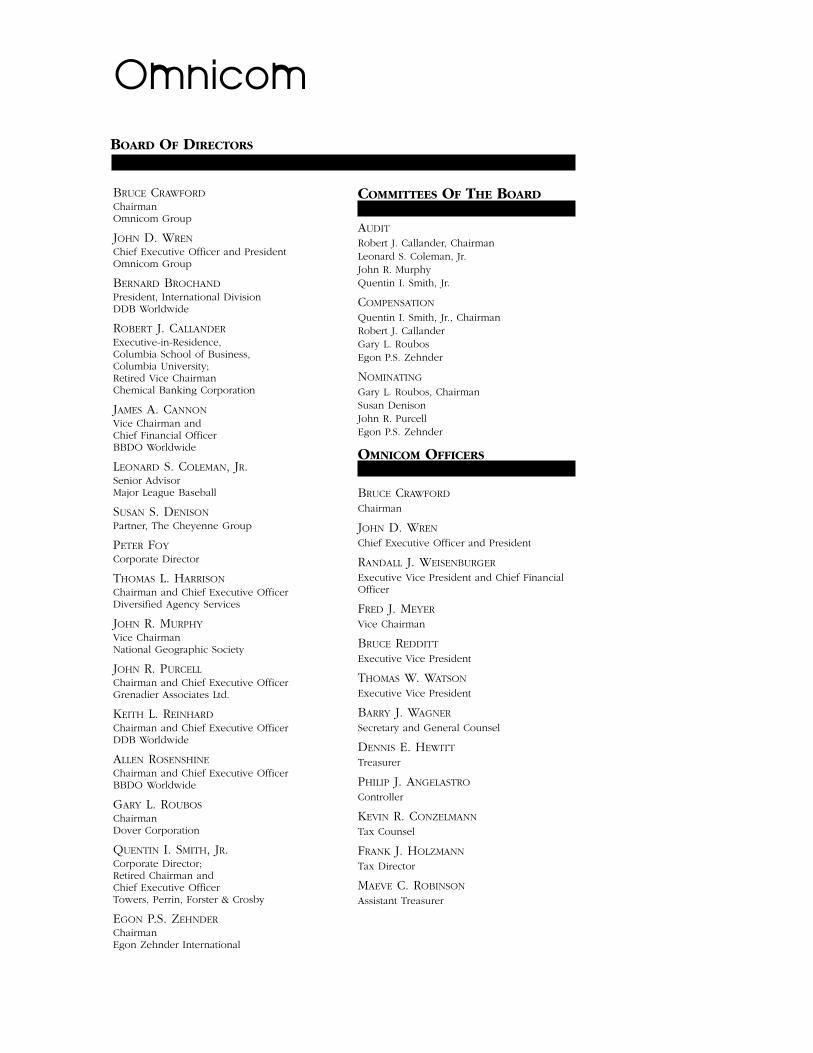
Omnicom
BOARD OF DIRECTORS
BRUCE CRAWFORDChairmanOmnicom Group
JOHN D. WRENChief Executive Officer and PresidentOmnicom Group
BERNARD BROCHANDPresident, International DivisionDDB Worldwide
ROBERT J. CALLANDERExecutive-in-Residence,Columbia School of Business,Columbia University;Retired Vice ChairmanChemical Banking Corporation
JAMES A. CANNONVice Chairman andChief Financial OfficerBBDO Worldwide
LEONARD S. COLEMAN, JR.Senior AdvisorMajor League Baseball
SUSAN S. DENISONPartner, The Cheyenne Group
PETER FOYCorporate Director
THOMAS L. HARRISONChairman and Chief Executive OfficerDiversified Agency Services
JOHN R. MURPHYVice ChairmanNational Geographic Society
JOHN R. PURCELLChairman and Chief Executive OfficerGrenadier Associates Ltd.
KEITH L. REINHARDChairman and Chief Executive OfficerDDB Worldwide
ALLEN ROSENSHINEChairman and Chief Executive OfficerBBDO Worldwide
GARY L. ROUBOSChairman Dover Corporation
QUENTIN I. SMITH, JR.Corporate Director;Retired Chairman and Chief Executive OfficerTowers, Perrin, Forster & Crosby
EGON P.S. ZEHNDERChairmanEgon Zehnder International
COMMITTEES OF THE BOARD
AUDIT
Robert J. Callander, ChairmanLeonard S. Coleman, Jr.John R. MurphyQuentin I. Smith, Jr.
COMPENSATION
Quentin I. Smith, Jr., ChairmanRobert J. CallanderGary L. RoubosEgon P.S. Zehnder
NOMINATING
Gary L. Roubos, ChairmanSusan DenisonJohn R. PurcellEgon P.S. Zehnder
OMNICOM OFFICERS
BRUCE CRAWFORD
Chairman
JOHN D. WREN
Chief Executive Officer and President
RANDALL J. WEISENBURGER
Executive Vice President and Chief FinancialOfficer
FRED J. MEYER
Vice Chairman
BRUCE REDDITT
Executive Vice President
THOMAS W. WATSON
Executive Vice President
BARRY J. WAGNER
Secretary and General Counsel
DENNIS E. HEWITT
Treasurer
PHILIP J. ANGELASTRO
Controller
KEVIN R. CONZELMANN
Tax Counsel
FRANK J. HOLZMANN
Tax Director
MAEVE C. ROBINSON
Assistant Treasurer
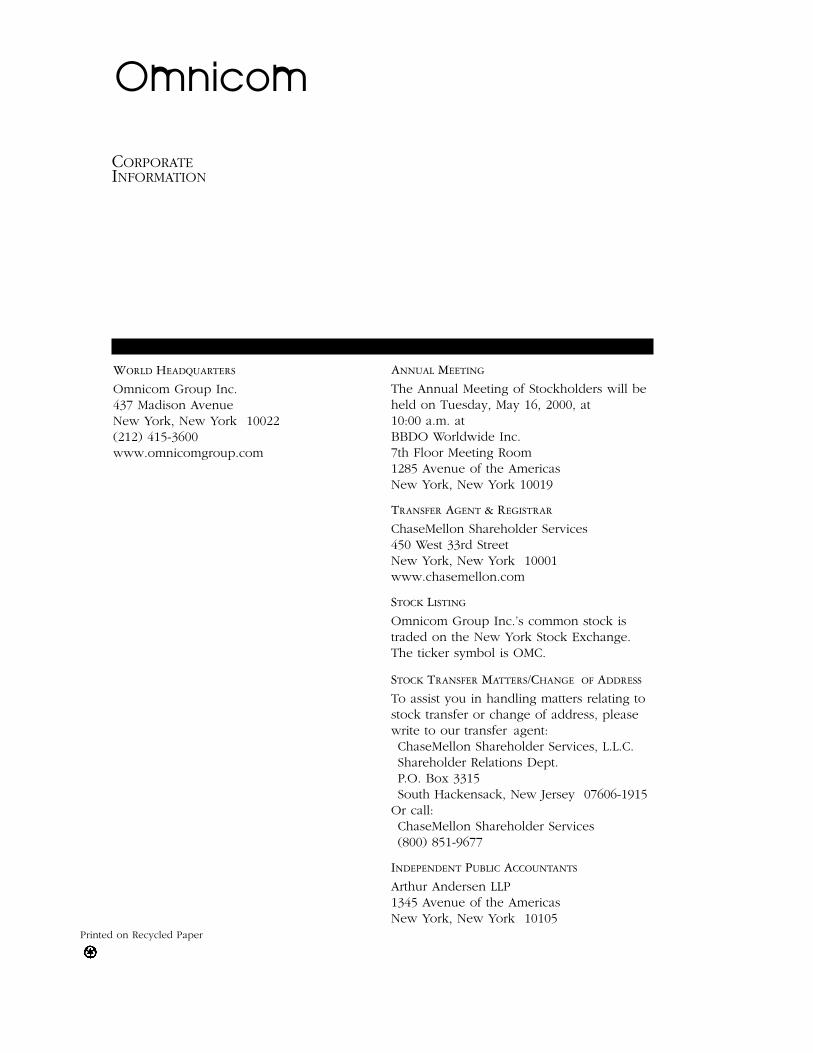
Omnicom
CORPORATEINFORMATION
WORLD HEADQUARTERS
Omnicom Group Inc.437 Madison AvenueNew York, New York 10022(212) 415-3600www.omnicomgroup.com
ANNUAL MEETING
The Annual Meeting of Stockholders will beheld on Tuesday, May 16, 2000, at10:00 a.m. atBBDO Worldwide Inc.7th Floor Meeting Room1285 Avenue of the AmericasNew York, New York 10019
TRANSFER AGENT & REGISTRAR
ChaseMellon Shareholder Services450 West 33rd StreetNew York, New York 10001www.chasemellon.com
STOCK LISTING
Omnicom Group Inc.’s common stock istraded on the New York Stock Exchange.The ticker symbol is OMC.
STOCK TRANSFER MATTERS/CHANGE OF ADDRESS
To assist you in handling matters relating tostock transfer or change of address, pleasewrite to our transfer agent:ChaseMellon Shareholder Services, L.L.C.Shareholder Relations Dept.P.O. Box 3315South Hackensack, New Jersey 07606-1915
Or call:ChaseMellon Shareholder Services(800) 851-9677
INDEPENDENT PUBLIC ACCOUNTANTS
Arthur Andersen LLP1345 Avenue of the AmericasNew York, New York 10105
Printed on Recycled Paper