Embed Size (px)
Citation preview
DRAFT
Omnibus Amendment to Simplify Vessel Baselines
Including an
Environmental Assessment Regulatory Impact Review
July 2014
Amendment 6 to the Atlantic Herring FMP;
Amendment 16 to the Atlantic Sea Scallop FMP;
Amendment 4 to the Deep-Sea Red Crab FMP;
Amendment # to the Mackerel, Squid, and Butterfish FMP;
Amendment 7 to the Monkfish FMP;
Amendment 20 to the Northeast Multispecies FMP;
Amendment # to the Summer Flounder, Scup, and Black Sea Bass FMP;
Amendment # to the Surfclam and Ocean Quahog FMP; and
Amendment # to the Tilefish FMP
Prepared by the
National Marine Fisheries Service Greater Atlantic Regional Fisheries Office
55 Great Republic Drive Gloucester, MA 01930
In consultation with the
New England Fishery Management Council
50 Water Street, Mill 2 Newburyport, MA 01950
Mid-Atlantic Fishery Management Council
800 N. State Street, Suite 201 Dover, DE 19901
Woods Hole, MA 02543
Date adopted by NEFMC: Date adopted by MAFMC: Date Draft Submitted: Date Final Submitted:
Table of Contents List of Tables ................................................................................................................................................ iii
List of Figures ............................................................................................................................................... iv
ACRONYMS ................................................................................................................................................... v
1.0 INTRODUCTION ....................................................................................................................................... 1
1.2 History of Vessel Upgrade Restrictions ............................................................................................... 1
1.3 The 1999 Omnibus Consistency Amendment ..................................................................................... 2
1.4 Baseline Regulations in 2014 .............................................................................................................. 2
Vessel Baseline Administration ............................................................................................................. 4
Baseline Working Group ....................................................................................................................... 5
2.0 PURPOSE AND NEED FOR THE ACTION ................................................................................................... 6
3.0 PROPOSED ACTION AND ALTERNATIVES ................................................................................................ 6
3.1 Alternative 1 – No Action Alternative ................................................................................................. 6
3.2 Alternative 2 – Eliminate One-Time Limit on Vessel Upgrades .......................................................... 7
3.3 Alternative 3 – Eliminate Tonnages from Vessel Baselines ................................................................ 8
3.4 Alternative 4 – Eliminate Both Tonnages and Upgrade Limit ............................................................. 8
4.0 AFFECTED ENVIRONMENT ..................................................................................................................... 9
4.1 Potentially Impacted Valued Ecosystem Components (VECs) ........................................................... 9
4.2 Physical Environment/Habitat/EFH ................................................................................................. 10
4.2.1 Gulf of Maine ............................................................................................................................ 11
4.2.2 Georges Bank ............................................................................................................................ 14
4.2.3 Southern New England/Mid-Atlantic Bight ............................................................................... 15
4.2.4 Essential Fish Habitat (EFH) Designations ................................................................................. 17
4.2.5 Gear Types and Interactions with Habitat ................................................................................ 17
4.3 Target Species .................................................................................................................................. 18
4.3.1 Species and Stock Status Descriptions ...................................................................................... 18
4.4 Non-Target Species and Bycatch ...................................................................................................... 21
4.5 Protected Resources ........................................................................................................................ 22
4.5.1 Species Potentially Affected ...................................................................................................... 25
4.5.1.1 Sea Turtles .............................................................................................................................. 25
i
4.5.1.2 Large Cetaceans ..................................................................................................................... 27
4.5.1.3 Small Cetaceans ..................................................................................................................... 30
4.5.1.4 Pinnipeds ................................................................................................................................ 30
4.5.1.5 Atlantic Sturgeon ................................................................................................................... 31
4.5.1.6 Atlantic Salmon (Gulf of Maine DPS) ..................................................................................... 32
4.5.2 Species and Habitats Not Likely to be Affected ........................................................................ 33
4.6 Human Communities/Social-Economic Environment ...................................................................... 34
4.6.1 Description of the Fisheries ...................................................................................................... 34
5.0 IMPACTS OF THE ALTERNATIVES .......................................................................................................... 35
5.1 Impact Assessment .......................................................................................................................... 35
5.1.1 Evaluation Criteria ..................................................................................................................... 35
5.1.3 Data Analysis ............................................................................................................................. 36
5.1.4 Impacts of the Alternative 1 – No Action Alternative ............................................................... 44
5.1.5 Impacts of Alternative 2 – Eliminate One-Time Limit on Vessel Upgrades .............................. 45
5.1.6 Impacts of Alternative 3 – Eliminate Tonnages from Vessel Baselines .................................... 46
5.1.7 Impacts to Alternative 4 – Eliminated Both Tonnages and Upgrade Limit ................................ 48
5.2 Cumulative Effects Analysis ............................................................................................................. 50
6.0 LIST OF PREPARERS AND CONTACTS .................................................................................................... 59
7.0 PERSONS AND AGENCIES CONSULTED................................................................................................. 60
8.0 COMPLIANCE WITH APPLICABLE LAWS AND EXECUTIVE ORDERS ...................................................... 60
9.0 REFERENCES ......................................................................................................................................... 61
ii

List of Tables Table 1. Baseline Year for Limited Access Fisheries .................................................................................. 2 Table 2. Management Measures in NE Limited Access Fisheries ............................................................... 5 Table 3. Status of Target Species ............................................................................................................... 20 Table 4. Status of Non-Target and Bycatch Species .................................................................................. 22 Table 5. Species Protected Under the Endangered Species Act and/or Marine Mammal Protection Act that May Occur in the Operations Areaa ..................................................................................................... 24 Table 6. Fishing Year 2012 Commercial Landings and Value of Affected FMPs1 ................................... 35 Table 7. Impact Definitions and Qualifiers ................................................................................................ 36 Table 8. Number of Permits Used in Analysis ........................................................................................... 38 Table 9. Average Limited Access Vessel Size and Horsepower by Fishery ............................................. 40 Table 10. Average Limited Access Vessel Size and Horsepower by Region and State ............................ 41 Table 11. Percent of Limited Access Permits Upgraded1 .......................................................................... 42
iii

List of Figures
Figure 1. Northeast U.S. Shelf Ecosystem ................................................................................................. 11 Figure 2. Gulf of Maine ............................................................................................................................. 12 Figure 3. Vessel Size and Horsepower Frequency By Limited Access Permit Suite ................................ 70 Figure 4. Limited Access Black Sea Bass Vessel Size and Horsepower Frequency ................................. 72 Figure 5. Limited Access Summer Flounder Vessel Size and Horsepower Frequency ............................. 74 Figure 6. Limited Access Scup Vessel Size and Horsepower Frequency .................................................. 76 Figure 7. Limited Access Atlantic Herring Vessel Size and Horsepower Frequency ............................... 78 Figure 8. Limited Access Illex Squid Vessel Size and Horsepower Frequency ........................................ 80 Figure 9. Limited Access Longfin Squid Vessel Size and Horsepower Frequency .................................. 82 Figure 10. Limited Access Atlantic Mackerel Vessel Size and Horsepower Frequency ........................... 84 Figure 11. Limited Access Mahogany Quahog Vessel Size and Horsepower Frequency ......................... 86 Figure 12. Limited Access Monkfish Vessel Size and Horsepower Frequency ........................................ 88 Figure 13. Limited Access NE Multispecies Vessel Size and Horsepower Frequency ............................. 90 Figure 14. Limited Access Atlantic Sea Scallop Vessel Size and Horsepower Frequency ....................... 92 Figure 15. Limited Access Red Crab Vessel Size and Horsepower Frequency ........................................ 94 Figure 16. New England Limited Access Vessel Size and Horsepower Frequency .................................. 96 Figure 17. Mid-Atlantic Limited Access Vessel Size and Horsepower Frequency ................................... 98 Figure 18. Maine Limited Access Vessel Size and Horsepower Frequency ........................................... 100 Figure 19. New Hampshire Limited Access Vessel Size and Horsepower Frequency ............................ 102 Figure 20. Massachusetts Limited Access Vessel Size and Horsepower Frequency ............................... 104 Figure 21. Rhode Island Limited Access Vessel Size and Horsepower Frequency................................. 106 Figure 22. Connecticut Limited Access Vessel Size and Horsepower Frequency .................................. 108 Figure 23. New York Limited Access Vessel Size and Horsepower Frequency ..................................... 110 Figure 24. New Jersey Limited Access Vessel Size and Horsepower Frequency ................................... 112 Figure 25. Pennsylvania Limited Access Vessel Size and Horsepower Frequency ................................ 114 Figure 26. Delaware Limited Access Vessel Size and Horsepower Frequency ...................................... 116 Figure 27. Maryland Limited Access Vessel Size and Horsepower Frequency ...................................... 118 Figure 28. Virginia Limited Access Vessel Size and Horsepower Frequency ........................................ 120 Figure 29. North Carolina Limited Access Vessel Size and Horsepower Frequency .............................. 122
iv
ACRONYMS ABC Acceptable Biological Catch
ACE Annual Catch Entitlement
ACL Annual Catch Limit
ALWTRP Atlantic Large Whale Take Reduction Plan
AM Accountability Measure
ANPR Advanced Notice of Proposed Rulemaking
ASMFC Atlantic States Marine Fisheries Commission
BMSY Biomass necessary to produce maximum sustainable yield
CEA Cumulative Effects Assessment
CEQ Council on Environmental Quality
cm Centimeter
Council New England Fishery Management Council
CPH Confirmation of permit history
CPUE Catch per unit of effort
CY Calendar year
DAS Days-at-sea
DPS Distinct population segment
EA Environmental Assessment
EEZ Exclusive economic zone
EFH Essential Fish Habitat
EIS Environmental Impact Statement
ESA Endangered Species Act
F Fishing mortality rate
FMP Fishery management plan
FMSY Fishing mortality rate that produces the maximum sustainable yield
v
FW Framework
FY Fishing year
GARM Groundfish Assessment Review Meeting
GB Georges Bank
GOM Gulf of Maine
HPTRP Harbor Porpoise Take Reduction Plan
kg Kilogram
km Kilometer
lbs Pounds
m Meter
MAFMC Mid-Atlantic Fishery Management Council
mm Millimeter
MMPA Marine Mammal Protection Act
MSY Maximum Sustainable Yield
mt Metric ton
NEFMC New England Fishery Management Council
NEFSC Northeast Fisheries Science Center
NEPA National Environmental Policy Act
NMFS National Marine Fisheries Service
NOAA National Oceanic and Atmospheric Administration
NRCC Northeast Region Coordinating Council
PBR Potential Biological Removal
PSC Potential Sector Contribution
RMA Regulated Mesh Area
SAP Special Access Program
SEFSC NMFS Southeast Fisheries Science Center
vi

SNE Southern New England
SNE/MA Southern New England/Mid-Atlantic
TAC Total allowable catch
TED Turtle exclusion device
U.S. United States
USFWS United States Fish and Wildlife Service
VEC(s) Valued Ecosystem Component(s)
VMS Vessel Monitoring System
VTR Vessel trip report
WNA Western North Atlantic
vii
1.0 INTRODUCTION Fishing vessel baseline specifications and upgrade restrictions have been used as a tool in many limited access fisheries to promote conservation of fish species by limiting potential increases in the harvest capacity of the fleet. To reduce fishing mortality and fishing effort, the New England and Mid-Atlantic Fishery Management Councils use various effort controls, such as limits on the amount of time (numbers of days-at-sea (DAS)) that can be fished, trip limits, state quota allocations, and moratoria on issuance of new permits. Vessel upgrade restrictions were intended to control the potential increase in effort and catch that could occur if an individual vessel increased in size or horsepower and, therefore, was able to catch more fish for a given amount of effort. For example, if a vessel were able to land more fish per DAS fished because of an increased size or horsepower, it could undermine the purpose of matching the total DAS allocation to a target Total Allowable Catch (TAC). In the case of hard quotas, a vessel’s catch rate per trip could increase because of an upgrade, accelerating the rate the quota is taken and increasing the race to fish. A permit’s “baseline vessel” was generally the vessel that was first issued the limited access permit for the fishery. The specifications of this first permitted vessel (length, horsepower, gross tonnage, and net tonnage) became the permit’s “baseline specifications” and restrictions were placed on how much a future vessel holding the permit could deviate from these specifications. In this way, baseline specifications and upgrade restrictions were used to limit potential future increases in harvest capacity and prevent them from undermining other management measures targeted at controlling fishing mortality. However, since the time baseline specifications were adopted, many fisheries have implemented other effort controls and annual catch limits (ACLs), which restrict effort and put a cap on total harvest. In addition, replacement and upgrade restrictions can be a costly and time-consuming administrative burden for both the industry and the NOAA National Marine Fisheries Service (NMFS). This action considers eliminating certain baseline restrictions to reduce the administrative and cost burden to industry and NMFS without adversely affecting conservation.
1.2 History of Vessel Upgrade Restrictions The Mid-Atlantic Council developed the first limited entry program in 1977 for the surfclam/quahog fishery, which included restrictions on replacement vessels. This program required that a replacement vessel be of “substantially similar capacity” in an effort to maintain and not increase the harvest capacity of the fleet at that time. Over the following two decades, additional limited entry programs were implemented by the Mid-Atlantic and the New England Councils. In some cases, restrictions on vessel replacements, upgrades, vessel sales, ownership, permit splitting, and transfers were made consistent across the Fishery Management Plans (FMPs), but in other cases, restrictions were very different. Some FMP provisions were more strict that others. The summer flounder limited access program prohibited any upgrade from being made to an existing vessel and only allowed a vessel to be replaced if it was documented as unseaworthy. The Northeast Multispecies and Atlantic Sea Scallop FMPs allowed vessel upgrades and replacements, but restricted the size and horsepower of any replacement vessel or modifications to the current vessel, based on the specifications of a baseline vessel. The definition of a baseline vessel varied in each limited access fishery, but was typically the first vessel issued the limited access permit in that fishery at the time the limited access program was established. Additional limited access programs were implemented for American lobster (1994),
1
Northeast multispecies (1994), scup (1996), black sea bass (1996), longfin squid and butterfish (1996), Illex squid (1997), and mahogany quahogs (1998). By 1998, there were four different sets of vessel upgrade and replacement restrictions among the various FMPs. The upgrade restrictions became confusing for fishing industry members with more than one limited access permit, because each permit had the potential to have different vessel upgrade regulations apply. This complex system led to a complex administrative burden for NMFS, a financial burden and confusion for fishermen, and even safety concerns. Thus, in 1999, the Councils, in consultation with NMFS, developed a joint omnibus amendment to streamline and make consistent baseline provisions and upgrade restrictions across FMPs.
1.3 The 1999 Omnibus Consistency Amendment The Consistency Amendment standardized definitions and restrictions for vessel baselines, upgrades, and replacements across all limited access fisheries. The affected FMPs included Summer Flounder, Scup, and Black Sea Bass; NE Multispecies; Atlantic Mackerel, Squid, and Butterfish; Atlantic Surf Clam and Ocean Quahog; Atlantic Sea Scallops, and American Lobster. Baseline requirements already existed for most limited access fisheries, but were implemented for the first time for the Longfin squid/butterfish, Illex squid, and scup fisheries and eliminated for the American lobster fishery. The Consistency Amendment aimed to reduce complications for sales, transfers, and upgrades of commercial vessels holding multiple limited access permits, while maintaining controls on fishing effort. It simplified regulations for vessel replacements, permit transfers, and vessel upgrades, making them consistent and less restrictive in order to facilitate business transactions. These are the baseline restrictions that still govern limited access permits in 2014, having been adopted by later limited access programs including the monkfish (2000), Atlantic herring (2007), tilefish (date permit first issued), and Atlantic mackerel (2011) fisheries.
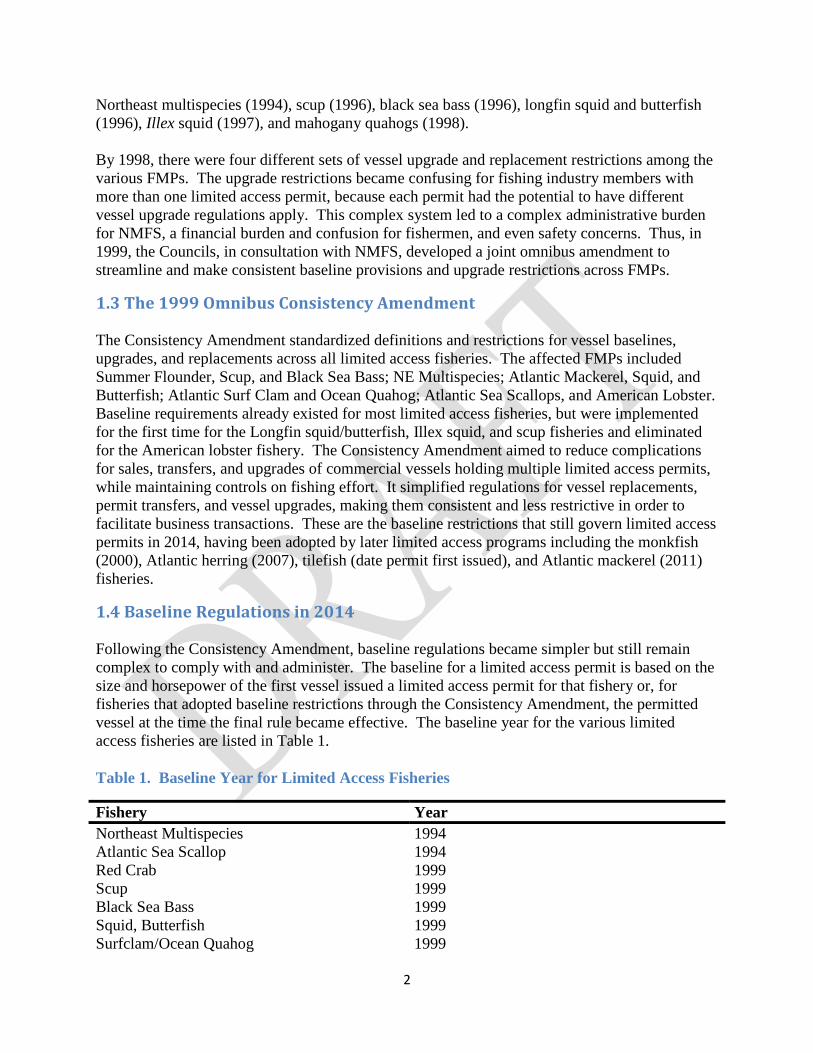
1.4 Baseline Regulations in 2014 Following the Consistency Amendment, baseline regulations became simpler but still remain complex to comply with and administer. The baseline for a limited access permit is based on the size and horsepower of the first vessel issued a limited access permit for that fishery or, for fisheries that adopted baseline restrictions through the Consistency Amendment, the permitted vessel at the time the final rule became effective. The baseline year for the various limited access fisheries are listed in Table 1. Table 1. Baseline Year for Limited Access Fisheries
Fishery Year Northeast Multispecies 1994 Atlantic Sea Scallop 1994 Red Crab 1999 Scup 1999 Black Sea Bass 1999 Squid, Butterfish 1999 Surfclam/Ocean Quahog 1999
2
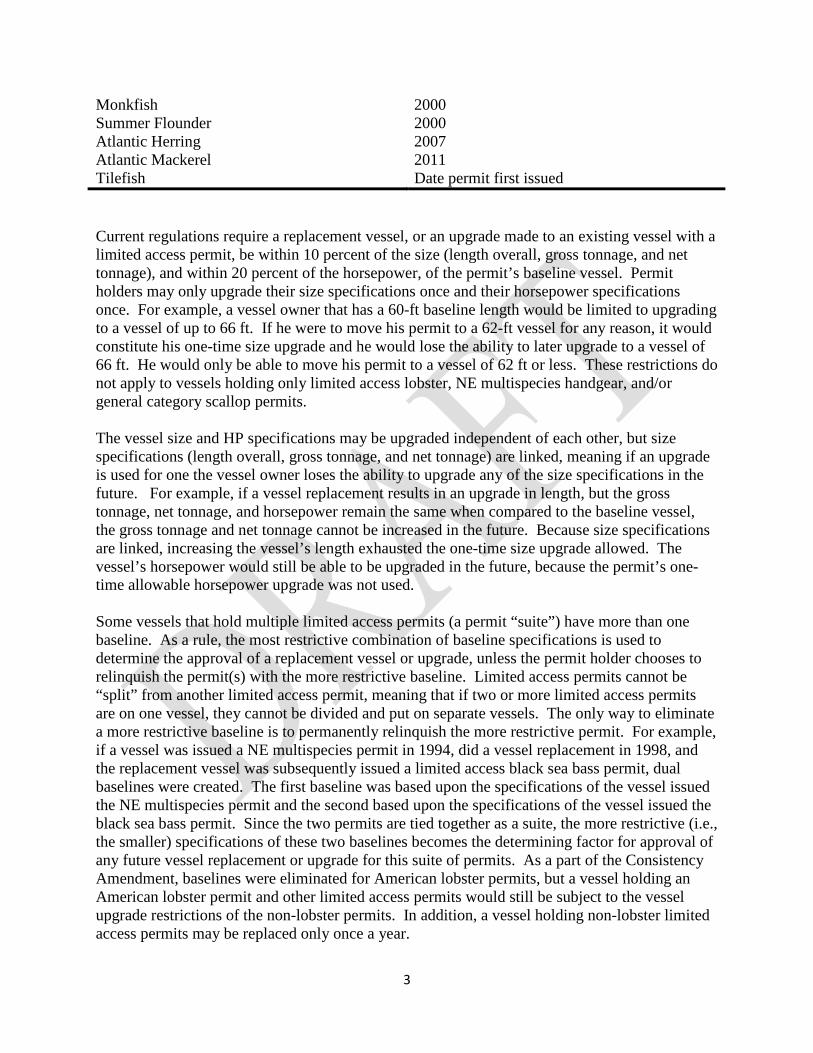
Monkfish 2000 Summer Flounder 2000 Atlantic Herring 2007 Atlantic Mackerel 2011 Tilefish Date permit first issued Current regulations require a replacement vessel, or an upgrade made to an existing vessel with a limited access permit, be within 10 percent of the size (length overall, gross tonnage, and net tonnage), and within 20 percent of the horsepower, of the permit’s baseline vessel. Permit holders may only upgrade their size specifications once and their horsepower specifications once. For example, a vessel owner that has a 60-ft baseline length would be limited to upgrading to a vessel of up to 66 ft. If he were to move his permit to a 62-ft vessel for any reason, it would constitute his one-time size upgrade and he would lose the ability to later upgrade to a vessel of 66 ft. He would only be able to move his permit to a vessel of 62 ft or less. These restrictions do not apply to vessels holding only limited access lobster, NE multispecies handgear, and/or general category scallop permits. The vessel size and HP specifications may be upgraded independent of each other, but size specifications (length overall, gross tonnage, and net tonnage) are linked, meaning if an upgrade is used for one the vessel owner loses the ability to upgrade any of the size specifications in the future. For example, if a vessel replacement results in an upgrade in length, but the gross tonnage, net tonnage, and horsepower remain the same when compared to the baseline vessel, the gross tonnage and net tonnage cannot be increased in the future. Because size specifications are linked, increasing the vessel’s length exhausted the one-time size upgrade allowed. The vessel’s horsepower would still be able to be upgraded in the future, because the permit’s one-time allowable horsepower upgrade was not used. Some vessels that hold multiple limited access permits (a permit “suite”) have more than one baseline. As a rule, the most restrictive combination of baseline specifications is used to determine the approval of a replacement vessel or upgrade, unless the permit holder chooses to relinquish the permit(s) with the more restrictive baseline. Limited access permits cannot be “split” from another limited access permit, meaning that if two or more limited access permits are on one vessel, they cannot be divided and put on separate vessels. The only way to eliminate a more restrictive baseline is to permanently relinquish the more restrictive permit. For example, if a vessel was issued a NE multispecies permit in 1994, did a vessel replacement in 1998, and the replacement vessel was subsequently issued a limited access black sea bass permit, dual baselines were created. The first baseline was based upon the specifications of the vessel issued the NE multispecies permit and the second based upon the specifications of the vessel issued the black sea bass permit. Since the two permits are tied together as a suite, the more restrictive (i.e., the smaller) specifications of these two baselines becomes the determining factor for approval of any future vessel replacement or upgrade for this suite of permits. As a part of the Consistency Amendment, baselines were eliminated for American lobster permits, but a vessel holding an American lobster permit and other limited access permits would still be subject to the vessel upgrade restrictions of the non-lobster permits. In addition, a vessel holding non-lobster limited access permits may be replaced only once a year.
3

Vessel Baseline Administration In order to ensure that permit holders are complying with baseline and vessel upgrade requirements, they are required to submit any proposed vessel upgrade or replacement to NMFS for approval. The Consistency Amendment standardized the baseline requirements, but the regulations are still complex and can make administrating these requirements complicated and costly for both the permit holders and NMFS. It can be difficult and take time for a permit holder to find a replacement vessel that falls within all four of his permit’s allowable upgrades (with 10 percent of size, 20 percent of horsepower of the baseline). Vessel manufacturers may make vessels of only certain types and sizes. Vessel engines may be tuned to meet horsepower restrictions, but modern engines may not be as flexible as their previous counterparts because they must meet more stringent emissions standards. However, a replacement would still be denied if the replacement vessel falls outside the maximum allowed upgrade for the permit suite, even if the difference is a matter of inches. It can also be difficult for a permit holder to determine their own permit’s baseline specifications. A permit suite may have changed hands several times and been owned by different owners when different limited access permits were first issued, making it difficult to track down a permit’s upgrade history. However, it is important for a vessel owner to determine a permit’s upgrade history before purchasing a new permit or a replacement vessel, lest an upgrade already have been used and their subsequent application for replacement denied. NMFS prepares letters for permit holders to document baseline specifications and upgrade history for a permit suite, and also processes occasional corrections and exemptions to vessel baselines. Although NMFS grants these requests rarely, and only in instances where it can be shown NMFS made an error, processing these requests can take extensive research of the vessel and permit history, which may delay business decisions for the buyer or seller of a permit, or a permit holder trying to complete a vessel replacement. To apply for a replacement or upgrade, a permit holder must be able to demonstrate with documentation that the size and horsepower specifications of the vessel as upgraded or the replacement vessel fall within his permit’s allowable upgrades. NMFS requires documentation from a marine surveyor, mechanic, the engine manufacturer, the U.S. Coast Guard, or the U.S. Bureau of Shipping to verify vessel specifications. Vessel owners often also hire marine documentation services or attorneys, at additional cost, to assist them in finding a suitable replacement vessel, obtaining documentation from the seller or NMFS, completing and submitting an application, and navigating the application process. Some permit holders may use replacements to transfer permits to a buyer, since permits cannot be bought or sold separately from a vessel. In order to retain a vessel, a permit holder may transfer the permit to a skiff and then sell the skiff and permit together to a third party. Some permit holders transfer their permits to a skiff in order to lease out the DAS or other allocations without the expense of maintaining a vessel. Since 2007 NMFS no longer requires additional documentation of vessel size or horsepower for replacements to vessels under 17 feet (called “non-fishing skiffs”) in order to reduce the administrative burden to NMFS and vessel owners from processing these frequent requests.
4
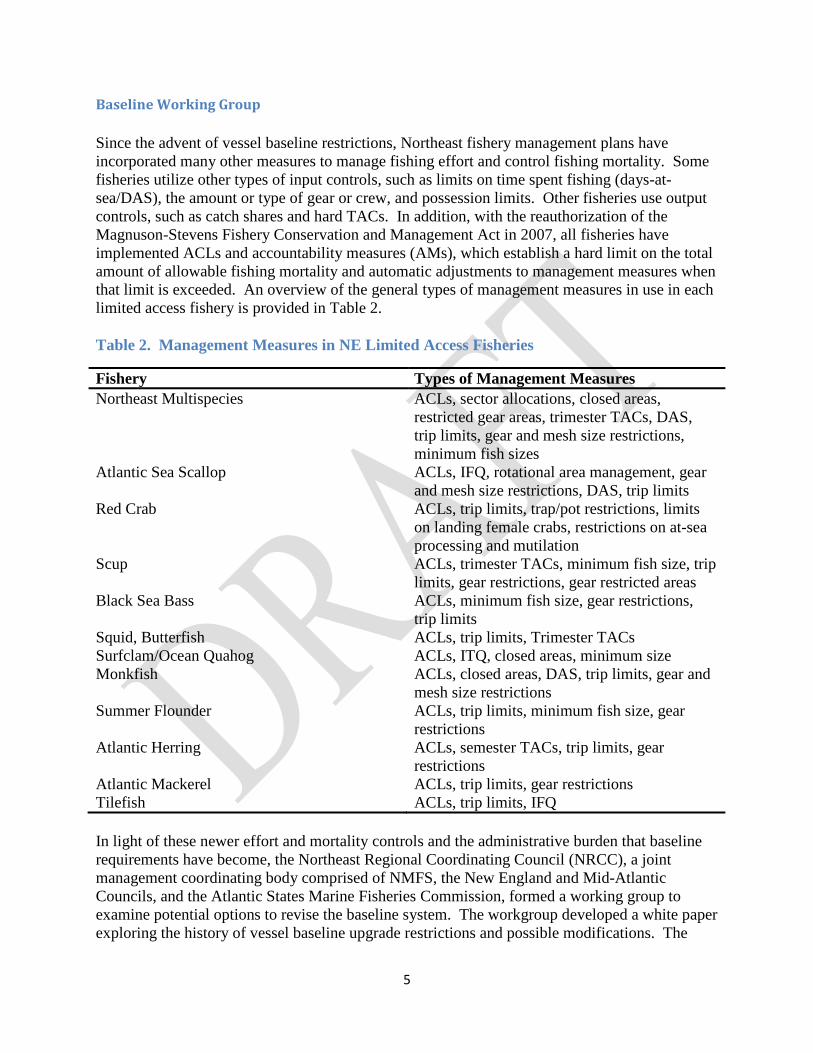
Baseline Working Group Since the advent of vessel baseline restrictions, Northeast fishery management plans have incorporated many other measures to manage fishing effort and control fishing mortality. Some fisheries utilize other types of input controls, such as limits on time spent fishing (days-at-sea/DAS), the amount or type of gear or crew, and possession limits. Other fisheries use output controls, such as catch shares and hard TACs. In addition, with the reauthorization of the Magnuson-Stevens Fishery Conservation and Management Act in 2007, all fisheries have implemented ACLs and accountability measures (AMs), which establish a hard limit on the total amount of allowable fishing mortality and automatic adjustments to management measures when that limit is exceeded. An overview of the general types of management measures in use in each limited access fishery is provided in Table 2. Table 2. Management Measures in NE Limited Access Fisheries
Fishery Types of Management Measures Northeast Multispecies ACLs, sector allocations, closed areas,
restricted gear areas, trimester TACs, DAS, trip limits, gear and mesh size restrictions, minimum fish sizes
Atlantic Sea Scallop ACLs, IFQ, rotational area management, gear and mesh size restrictions, DAS, trip limits
Red Crab ACLs, trip limits, trap/pot restrictions, limits on landing female crabs, restrictions on at-sea processing and mutilation
Scup ACLs, trimester TACs, minimum fish size, trip limits, gear restrictions, gear restricted areas
Black Sea Bass ACLs, minimum fish size, gear restrictions, trip limits
Squid, Butterfish ACLs, trip limits, Trimester TACs Surfclam/Ocean Quahog ACLs, ITQ, closed areas, minimum size Monkfish ACLs, closed areas, DAS, trip limits, gear and
mesh size restrictions Summer Flounder ACLs, trip limits, minimum fish size, gear
restrictions Atlantic Herring ACLs, semester TACs, trip limits, gear
restrictions Atlantic Mackerel ACLs, trip limits, gear restrictions Tilefish ACLs, trip limits, IFQ In light of these newer effort and mortality controls and the administrative burden that baseline requirements have become, the Northeast Regional Coordinating Council (NRCC), a joint management coordinating body comprised of NMFS, the New England and Mid-Atlantic Councils, and the Atlantic States Marine Fisheries Commission, formed a working group to examine potential options to revise the baseline system. The workgroup developed a white paper exploring the history of vessel baseline upgrade restrictions and possible modifications. The
5

workgroup found that changes to the vessel baseline system may be warranted and recommended that NMFS publish an Advanced Notice of Proposed Rulemaking (ANPR) to solicit public comments on a range of potential changes to vessel baseline measures. NMFS published an ANPR on October 5, 2011, and collected public comments through December 5, 2011. The ANPR requested public comment on five potential changes: 1) Eliminate tonnages from vessel baseline specifications; 2) eliminate the one-time upgrade limit; 3) change from a system of fixed upgrades to a system of size classes; 4) remove upgrade restrictions for vessels under 30 feet; and 5) complete remove of upgrade restrictions. The public comments ran the full spectrum, from support for maintaining the current system to support for removing it entirely. Many commenters thought that the baseline restrictions have helped to preserve a diverse fleet, in the absence of a more formal fleet vision and measures, and expressed general concerns that modifications to or removing the baseline requirements would unintentionally increase consolidation. The baseline workgroup also raised concerns that, although baseline restrictions may no longer be as necessary as they once were to control fishing effort in Federal fisheries, other management bodies, such as the ASMFC, may have come to rely on Federal baseline restrictions to limit capacity in their managed fisheries (Baseline Working Group 2011). Based on comments received on the ANPR and the baseline working group’s report, NMFS and the NRCC proposed to the Councils initiating an omnibus amendment to consider making limited changes to streamline and simplify the vessel baseline requirements. The Councils initiated the joint Omnibus Amendment to Simplify Vessel Baselines at their August, and September meetings. NMFS staff developed this amendment and environmental assessment in consultation with the Councils to support the Councils’ joint action.
2.0 PURPOSE AND NEED FOR THE ACTION The purpose of this action is to simplify and streamline the administration of vessel baselines, upgrades, and replacements for vessel owners and NMFS, while maintaining the function they provide for maintaining fleet diversity and limiting capacity. The purpose of this action is also to eliminate redundant regulations that may no longer be necessary as a result of the implementation of ACLs and other controls on mortality and effort in the applicable FMPs. This action is needed to reduce the administrative burden that vessel baseline and upgrade restrictions have become for NMFS and vessel owners. This action is also needed to increase flexibility and reduce costs for vessel owners in order to facilitate more efficient operations and profitable fishing businesses. This action seeks to fulfill the purpose and need while continuing to meet the goals and objectives set forth by the Councils in the applicable FMPs.
3.0 PROPOSED ACTION AND ALTERNATIVES
3.1 Alternative 1 – No Action Alternative Under the No Action Alternative, all vessel baseline specifications and upgrade restrictions would remain in place. Baseline would continue to be defined by vessel length overall, gross tonnage, net tonnage, and horsepower. The baseline for a limited access permit is based on the size and horsepower of the first vessel issued a limited access permit for that fishery or, for
6
fisheries that adopted baseline restrictions through the Consistency Amendment, the permitted vessel at the time the final rule became effective. Current regulations require a replacement vessel or an upgrade made to an existing vessel with a limited access permit be within 10 percent of the size (length overall, net tonnage, and gross tonnage) and 20 percent of the horsepower, of the permit’s baseline vessel. Some vessels that hold multiple limited access permits have more than one baseline. As a rule, the most restrictive of the baselines is used to judge the approval of a replacement vessel or upgrade, unless the permit holder chooses to relinquish the more restrictive permit. Permit holders would continue to be limited to a one-time upgrade of the vessel size and horsepower specifications. For example, a vessel owner that has a 60-ft baseline length would be limited to upgrading to a vessel of up to 66ft. If he were to move his permit to a 62-ft vessel for any reason, it would constitute his one-time size upgrade and he would lose the ability to later upgrade to a vessel of 66ft. He would only be able to move his permit to a vessel of 62ft or less. Because his one-time size upgrade was used, he would not be able to later upgrade the vessel’s tonnages. He would still be able to later use his horsepower upgrade to upgrade his horsepower by 20 percent, but only once.
3.2 Alternative 2 – Eliminate One-Time Limit on Vessel Upgrades Under Alternative 2, the one-time limit on vessel size and horsepower upgrades would be eliminated. All vessel baseline specifications would remain in place (length overall, gross tonnage, net tonnage, and horsepower). A vessel would still be restricted by the 10 percent cap on size upgrades and 20 percent cap on horsepower upgrades, but would be able to make incremental increases without losing the ability to make later upgrades, up to the caps. For example, a vessel owner that has a 60-ft baseline length would be limited to upgrading to a vessel of up to 66ft. Under Alternative 2, if he were to move his permit to a 62-ft vessel, he would still retain the ability to later upgrade to a vessel of up to 66ft and upgrade his tonnages. He would also be able to later use his horsepower upgrade to upgrade his horsepower by 20 percent. Note that permit holders would still have to comply with non-baseline related permit restrictions on vessel size or horsepower. Rationale: Eliminating the one-time upgrade limit would provide more flexibility for vessel owners in the selection of replacement vessels and upgrades to existing vessels. Some vessel owners have been constrained by the one-time limit because they or a previous owner did not maximize the one-time upgrade with a previous vessel replacement, due to cost or availability or for other reasons, and have since been unable to further upgrade the vessel. Eliminating the one-time limit would also simplify the baseline verification and vessel replacement process for vessel owners and NMFS by eliminating the need to research and document whether a one-time upgrade was used during the vessel’s entire limited access history.
7
3.3 Alternative 3 – Eliminate Tonnages from Vessel Baselines Under Alternative 3, gross and net tonnage would be eliminated from vessel baseline specifications. A permit’s baseline would consist of only the length and horsepower of its baseline vessel. A vessel would still be restricted by the 20-percent cap on horsepower upgrades and the 10-percent cap on size upgrades, but only for length overall. Note that some monkfish permits were initially based on vessel tonnage, but eliminating the tonnage restrictions would not change these already established permits. Similarly, volume restrictions that were implemented Atlantic mackerel fishery in Amendment 11 to the SMB FMP would not be affected by this action. Permit holders would still have to comply with non-baseline related permit restrictions on vessel size or horsepower. Rationale: Tonnages are considered the most variable of vessel baseline specifications and, therefore, are believed to have little effect on limiting vessel capacity when compared to length and horsepower restrictions. There is more than one acceptable method of determining tonnages, and the tonnages of a vessel can vary significantly depending on whether an exact measurement or simplified calculation is used. Net tonnage limits can also be circumvented by modifying internal bulkheads. Tonnage specification limits have also been a concern for owners of vessels built outside of the United States that are determined to be under 5 net tons for import purposes. Eliminating tonnages would simplify and reduce the cost burden of the vessel baseline verification and replacement process, by simplifying or, if only horsepower verification is needed, eliminating the need for a marine survey.
3.4 Alternative 4 – Eliminate Both Tonnages and Upgrade Limit Under Alternative 4, gross and net tonnage would be eliminated from baseline specifications and the one-time limit on vessel upgrades would also be eliminated. A permit’s baseline would consist of only the length and horsepower of its baseline vessel. A vessel would still be restricted by the 20-percent cap on horsepower upgrades and the 10-percent cap on size upgrades, but only for length overall. A vessel would not be limited by the number of times it was upgraded within the 10/20 caps. A vessel owner could make incremental increases in his vessel’s length and horsepower without losing the ability to make later upgrades, up to the 10/20 caps. For example, a vessel owner that has a 60-ft baseline length would be limited to upgrading to a vessel of up to 66ft. Under Alternative 4, if he were to move his permit to a 62-ft vessel, he would still retain the ability to later upgrade to a vessel of up to 66ft and would not be restricted by any baseline tonnage specifications. He would also be able to later use his horsepower upgrade to upgrade his horsepower by 20 percent. Note that some monkfish permits were initially based on vessel tonnage, but eliminating the tonnage restrictions would not change these already established permits. Similarly, volume restrictions that were implemented Atlantic mackerel fishery in Amendment 11 to the SMB FMP would not be affected by this action. Permit holders would still have to comply with non-baseline related permit restrictions on vessel size or horsepower.
8
Rationale: Alternative 4 would provide the more flexibility for vessel owners in the selection of replacement vessels and upgrades to existing vessels. Some vessel owners have been constrained by the one-time limit because they or a previous owner did not maximize the one-time upgrade with a previous vessel replacement, due to cost or availability or for other reasons, and have since been unable to further upgrade the vessel. Tonnages are considered the most variable of vessel baseline specifications and, therefore, are believed to have little effect on limiting vessel capacity when compared to length and horsepower restrictions. There is more than one acceptable method of determining tonnages, and the tonnages of a vessel can vary significantly depending on whether an exact measurement or simplified calculation is used. Net tonnage limits can also be circumvented by modifying internal bulkheads. Tonnage specification limits have also been a concern for owners of vessels built outside of the United States that are determined to be under 5 net tons for import purposes. Alternative 4 would also simplify and reduce the cost burden of the baseline verification and vessel replacement process for both vessel owners and NMFS. It would eliminate the need to research, verify, and document baseline and replacement vessel tonnages. It would also reduce administrative burden by eliminating the need to determine whether a one-time upgrade was used during the vessel’s entire limited access history.
4.0 AFFECTED ENVIRONMENT
4.1 Potentially Impacted Valued Ecosystem Components (VECs)
This analysis considers impacts to 5 VECs:
Physical Environment/Habitat/EFH: For the purpose of this analysis the physical environment VEC consists of EFH in the Gulf of Maine, Georges Bank, the southern New England/Mid-Atlantic areas, and the continental shelf/slope sub-regions. The Sustainable Fisheries Act defines EFH as “[t]hose waters and substrate necessary to fish for spawning, breeding, feeding, or growth to maturity.” Section 4.2 describes the conditions of the physical environment.
Target species: For the purpose of this analysis, the target species VEC includes those species targeted by vessels participating in the FMPs modified by this action. Target stocks include: GOM cod, GB cod, GOM haddock, GB haddock, GOM winter flounder, GB winter flounder, SNE/MA winter flounder, Cape Cod (CC)/GOM yellowtail flounder, GB yellowtail flounder, SNE/MA yellowtail flounder, Pollock, redfish, white hake, Atlantic halibut, American plaice, witch flounder, Atlantic sea scallops, red crab, Atlantic herring, monkfish, summer flounder, black sea bass, scup, Longfin squid, Illex squid, Atlantic mackerel, surfclams, ocean quahogs, and tilefish. Section 4.3 describes the current condition of each stock.
Non-target species and bycatch: For the purposes of this analysis, the non-target species and bycatch VEC includes non-target stocks, which are defined as managed stocks caught by vessels participating in the FMPs modified by this action, but managed by other FMPs. The term "bycatch," as defined by the MSA, means fish that are harvested in a fishery but that are not sold or kept for personal use. Bycatch includes the discard of whole fish at sea or elsewhere, including economic and regulatory discards, and F due to an encounter with fishing gear that
9
does not result in capture of fish (i.e., unobserved fishing mortality). Bycatch does not include fish released alive under a recreational catch-and-release fishery management program. Section 4.4 describes the current condition of these stocks.
Protected resources: This VEC includes species under NMFS’ jurisdiction which are afforded protection under the Endangered Species Act (ESA) (i.e., for those designated as threatened or endangered) and/or the Marine Mammal Protection Act (MMPA). Table 5 lists the 18 marine mammal, sea turtle, and fish species that are classified as endangered or threatened under the ESA. The remaining species in Table 5 are protected by the MMPA and are known to interact with the Northeast Multispecies fishery. Section 4.5 describes the current condition of these protected resources.
Human communities: This VEC includes impacts to people’s way of life, traditions, and communities. These social and economic impacts may be driven by changes in fishery flexibility, opportunity, stability, certainty, safety, and other factors. Impacts would most likely be experienced across communities, gear cohorts, and vessel size classes. Section 4.6 describes the current conditions in the potentially impacted communities.
4.2 Physical Environment/Habitat/EFH The Northeast U.S. Shelf Ecosystem (Figure 1) includes the area from the Gulf of Maine south to Cape Hatteras, North Carolina. It extends from the coast seaward to the edge of the continental shelf and offshore to the Gulf Stream (Sherman et al. 1996). The continental slope includes the area seaward of the shelf, out to a depth of 6,562 feet (ft) [2,000 meters (m)]. Four distinct sub-regions comprise the NMFS Northeast Region: the Gulf of Maine, Georges Bank, the southern New England/Mid-Atlantic region, and the continental slope. Sectors primarily fish in the inshore and offshore waters of the Gulf of Maine, Georges Bank, and the southern New England/Mid-Atlantic areas. Therefore, the description of the physical and biological environment focuses on these sub-regions. Information in this section was extracted from Stevenson et al. (2004).
10
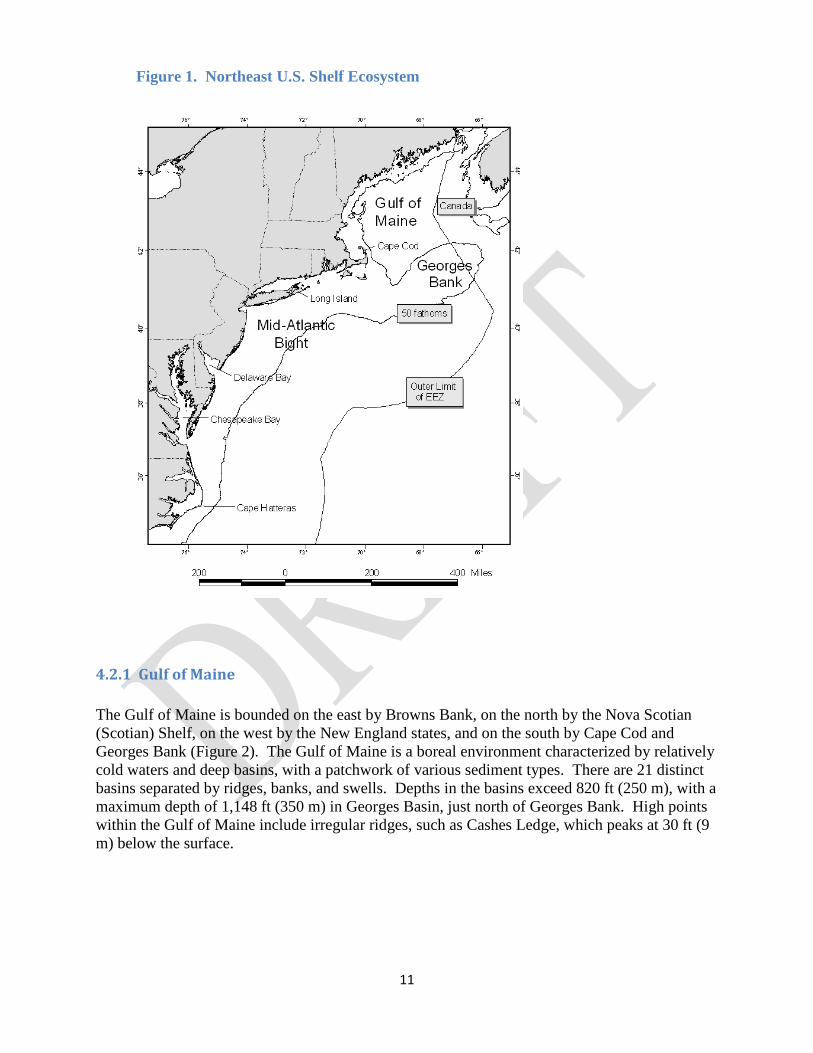
4.2.1 Gulf of Maine The Gulf of Maine is bounded on the east by Browns Bank, on the north by the Nova Scotian (Scotian) Shelf, on the west by the New England states, and on the south by Cape Cod and Georges Bank (Figure 2). The Gulf of Maine is a boreal environment characterized by relatively cold waters and deep basins, with a patchwork of various sediment types. There are 21 distinct basins separated by ridges, banks, and swells. Depths in the basins exceed 820 ft (250 m), with a maximum depth of 1,148 ft (350 m) in Georges Basin, just north of Georges Bank. High points within the Gulf of Maine include irregular ridges, such as Cashes Ledge, which peaks at 30 ft (9 m) below the surface.
Figure 1. Northeast U.S. Shelf Ecosystem
11
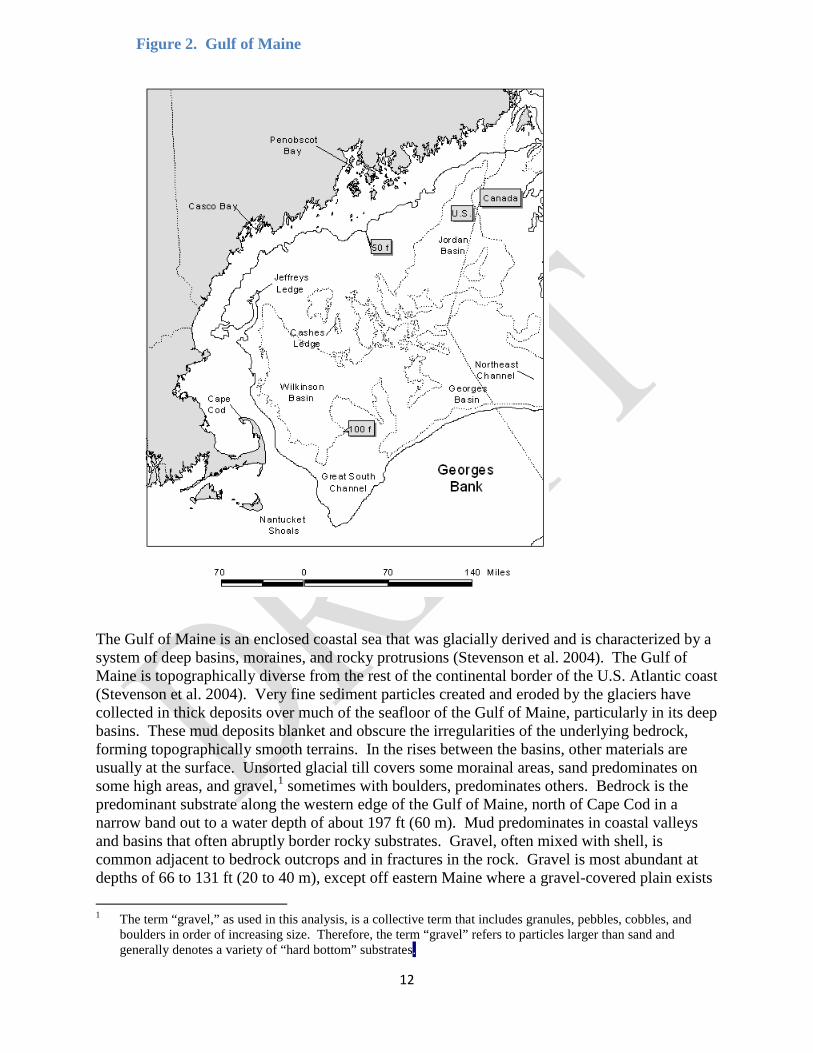
The Gulf of Maine is an enclosed coastal sea that was glacially derived and is characterized by a system of deep basins, moraines, and rocky protrusions (Stevenson et al. 2004). The Gulf of Maine is topographically diverse from the rest of the continental border of the U.S. Atlantic coast (Stevenson et al. 2004). Very fine sediment particles created and eroded by the glaciers have collected in thick deposits over much of the seafloor of the Gulf of Maine, particularly in its deep basins. These mud deposits blanket and obscure the irregularities of the underlying bedrock, forming topographically smooth terrains. In the rises between the basins, other materials are usually at the surface. Unsorted glacial till covers some morainal areas, sand predominates on some high areas, and gravel,1 sometimes with boulders, predominates others. Bedrock is the predominant substrate along the western edge of the Gulf of Maine, north of Cape Cod in a narrow band out to a water depth of about 197 ft (60 m). Mud predominates in coastal valleys and basins that often abruptly border rocky substrates. Gravel, often mixed with shell, is common adjacent to bedrock outcrops and in fractures in the rock. Gravel is most abundant at depths of 66 to 131 ft (20 to 40 m), except off eastern Maine where a gravel-covered plain exists
1 The term “gravel,” as used in this analysis, is a collective term that includes granules, pebbles, cobbles, and boulders in order of increasing size. Therefore, the term “gravel” refers to particles larger than sand and generally denotes a variety of “hard bottom” substrates.
Figure 2. Gulf of Maine
12
to depths of at least 328 ft (100 m). Sandy areas are relatively rare along the inner shelf of the western Gulf of Maine, but are more common south of Casco Bay, especially offshore of sandy beaches.
The geologic features of the Gulf of Maine coupled with the vertical variation in water properties (e.g., salinity, depth, temperature) combine to provide a great diversity of habitat types that support a rich biological community. To illustrate this, a brief description of benthic invertebrates and demersal (i.e., bottom-dwelling) fish that occupy the Gulf of Maine is provided below. Additional information is provided in Stevenson et al. (2004), which is incorporated by reference.
The most common groups of benthic invertebrates in the Gulf of Maine reported by Theroux and Wigley (1998) in terms of numbers collected were annelid worms, bivalve mollusks, and amphipod crustaceans. Bivalves, sea cucumbers, sand dollars, annelids, and sea anemones dominated biomass. Watling (1998) identified seven different bottom assemblages that occur on the following habitat types:
1) Sandy offshore banks: fauna are characteristically sand dwellers with an abundant interstitial component;
2) Rocky offshore ledges: fauna are predominantly sponges, tunicates, bryozoans, hydroids, and other hard bottom dwellers;
3) Shallow [< 197 ft (60 m)] temperate bottoms with mixed substrate: fauna population is rich and diverse, primarily comprised of polychaetes and crustaceans;
4) Primarily fine muds at depths of 197 to 459 ft (60 to 140 m) within cold Gulf of Maine Intermediate Water:2 fauna are dominated by polychaetes, shrimp, and cerianthid anemones;
5) Cold deep water, muddy bottom: fauna include species with wide temperature tolerances which are sparsely distributed, diversity low, dominated by a few polychaetes, with brittle stars, sea pens, shrimp, and cerianthids also present;
6) Deep basin, muddy bottom, overlaying water usually 45 to 46 °F (7 to 8°C): fauna densities are not high, dominated by brittle stars and sea pens, and sporadically by tube-making amphipods; and
7) Upper slope, mixed sediment of either fine muds or mixture of mud and gravel, water temperatures always greater than 46 °F (8°C): upper slope fauna extending into the Northeast Channel.
Two studies (Gabriel 1992, Overholtz and Tyler 1985) reported common3 demersal fish species by assemblages in the Gulf of Maine and Georges Bank:
• Deepwater/Slope and Canyon: offshore hake, blackbelly rosefish, Gulf stream flounder;
2 Maine Intermediate Water is described as a mid-depth layer of water that preserves winter salinity and temperatures, and is located between more saline Maine bottom water and the warmer, stratified Maine surface water. The stratified surface layer is most pronounced in the deep portions of the western Gulf of Maine.
3 Other species were listed as found in these assemblages, but only the species common to both studies are listed.
13
• Intermediate/Combination of Deepwater Gulf of Maine-Georges Bank and Gulf of Maine-Georges Bank Transition: silver hake, red hake, goosefish (monkfish);
• Shallow/Gulf of Maine-Georges Bank Transition Zone: Atlantic cod, haddock, pollock;
• Shallow water Georges Bank-southern New England: yellowtail flounder, windowpane flounder, winter flounder, winter skate, little skate, longhorn sculpin;
• Deepwater Gulf of Maine-Georges Bank: white hake, American plaice, witch flounder, thorny skate; and
• Northeast Peak/Gulf of Maine-Georges Bank Transition: Atlantic cod, haddock, pollock.
4.2.2 Georges Bank Georges Bank is a shallow (10 to 492 ft [3 to 150 m depth]), elongated ((100 miles [mi] (161 kilometer [km]) wide by 20 mi (322 km long)) extension of the continental shelf that was formed during the Wisconsinian glacial episode (Figure 1). It has a steep slope on its northern edge, a broad, flat, gently sloping southern flank, and steep submarine canyons on its eastern and southeastern edges. It has highly productive, well-mixed waters and strong currents. The Great South Channel lies to the west. Natural processes continue to erode and rework the sediments on Georges Bank. Erosion and reworking of sediments by the action of rising sea level as well as tidal and storm currents may reduce the amount of sand and cause an overall coarsening of the bottom sediments (Valentine and Lough 1991).
Bottom topography on eastern Georges Bank consists of linear ridges in the western shoal areas; a relatively smooth, gently dipping seafloor on the deeper, easternmost part; a highly energetic peak in the north with sand ridges up to 30 m high and extensive gravel pavement; and steeper and smoother topography incised by submarine canyons on the southeastern margin. The central region of Georges Bank is shallow, and the bottom has shoals and troughs, with sand dunes superimposed within. The area west of the Great South Channel, known as Nantucket Shoals, is similar in nature to the central region of Georges Bank. Currents in these areas are strongest where water depth is shallower than 164 ft (50 m). Sediments in this region include gravel pavement and mounds, some scattered boulders, sand with storm-generated ripples, and scattered shell and mussel beds. Tidal and storm currents range from moderate to strong, depending upon location and storm activity.
Oceanographic frontal systems separate the water masses of the Gulf of Maine and Georges Bank from oceanic waters south of Georges Bank. These water masses differ in temperature, salinity, nutrient concentration, and planktonic communities. These differences influence productivity and may influence fish abundance and distribution.
Georges Bank has historically had high levels of both primary productivity and fish production. The most common groups of benthic invertebrates on Georges Bank in terms of numbers collected were amphipod crustaceans and annelid worms, while sand dollars and bivalves dominated the overall biomass (Theroux and Wigley 1998). Using the same database, Theroux and Grosslein (1987) identified four macrobenthic invertebrate assemblages that occur on similar habitat type:
14

1) The Western Basin assemblage is found in comparatively deep water (492 to 656 ft [150 to 200 m]) with relatively slow currents and fine bottom sediments of silt, clay, and muddy sand. Fauna are comprised mainly of small burrowing detritivores and deposit feeders, and carnivorous scavengers.
2) The Northeast Peak assemblage is found in variable depths and current strength and includes coarse sediments, consisting mainly of gravel and coarse sand with interspersed boulders, cobbles, and pebbles. Fauna tend to be sessile (coelenterates, brachiopods, barnacles, and tubiferous annelids) or free-living (brittle stars, crustaceans, and polychaetes), with a characteristic absence of burrowing forms.
3) The Central Georges Bank assemblage occupies the greatest area, including the central and northern portions of Georges Bank in depths less than 328 ft (100 m). Medium-grained shifting sands predominate this dynamic area of strong currents. Organisms tend to be small to moderately large with burrowing or motile habits. Sand dollars are most characteristic of this assemblage.
4) The Southern Georges Bank assemblage is found on the southern and southwestern flanks at depths from 262 to 656 ft (80 to 200 m), where fine-grained sands and moderate currents predominate. Many southern species exist here at the northern limits of their range. Dominant fauna include amphipods, copepods, euphausiids, and starfish.
Common demersal fish species in Georges Bank are offshore hake, blackbelly rosefish, Gulf stream flounder, silver hake, red hake, goosefish (monkfish), Atlantic cod, haddock, pollock, yellowtail flounder, windowpane flounder, winter flounder, winter skate, little skate, longhorn sculpin, white hake, American plaice, witch flounder, and thorny skate.
4.2.3 Southern New England/Mid-Atlantic Bight The Mid-Atlantic Bight includes the shelf and slope waters from Georges Bank south to Cape Hatteras, and east to the Gulf Stream (Figure 1). The northern portion of the Mid-Atlantic Bight is sometimes referred to as southern New England. It generally includes the area of the continental shelf south of Cape Cod from the Great South Channel to Hudson Canyon. The Mid-Atlantic Bight consists of the sandy, relatively flat, gently sloping continental shelf from southern New England to Cape Hatteras, North Carolina. The shelf slopes gently from shore out to between 62 to 124 ft (100 and 200 km) offshore where it transforms to the slope (328 to 656 ft [100 to 200 m water depth]) at the shelf break. In both the Mid-Atlantic Bight and on Georges Bank, numerous canyons incise the slope, and some cut up onto the shelf itself (Stevenson et al. 2004). Like the rest of the continental shelf, sea level fluctuations during past ice ages largely shaped the topography of the Mid-Atlantic Bight. Since that time, currents and waves have modified this basic structure.
The sediment type covering most of the shelf in the Mid-Atlantic Bight is sand, with some relatively small, localized areas of sand-shell and sand-gravel. Silty sand, silt, and clay predominate on the slope. Permanent sand ridges occur in groups with heights of about 33 ft (10 m), lengths of 6 to 31 mi (10 to 50 km), and spacing of 1 mi (2 km). The sand ridges are usually oriented at a slight angle towards shore, running in length from northeast to southwest. Sand ridges are often covered with smaller similar forms such as sand waves, megaripples, and
15
ripples. Sand waves are usually found in patches of 5 to 10 with heights of about 7 ft (2 m), lengths of 164 to 328 ft (50 to 100 m), and 0.6 to 1 mi (1 to 2 km) between patches. Sand waves are temporary features that form and re-form in different locations. They usually occur on the inner shelf, especially in areas like Nantucket Shoals where there are strong bottom currents. Because tidal currents southwest of Nantucket Shoals and southeast of Long Island and Rhode Island slow significantly, there is a large mud patch on the seafloor where silts and clays settle out.
Artificial reefs are another important Mid-Atlantic Bight habitat. Artificial reefs formed much more recently on the geologic time scale than other regional habitat types. These localized areas of hard structure have been formed by shipwrecks, lost cargoes, disposed solid materials, shoreline jetties and groins, submerged pipelines, cables, and other materials (Steimle and Zetlin 2000). In general, reefs are important for attachment sites, shelter, and food for many species. In addition, fish predators, such as tunas, may be drawn by prey aggregations or may be behaviorally attracted to the reef structure. Estuarine reefs, such as blue mussel beds or oyster reefs, are dominated by epibenthic organisms, as well as crabs, lobsters, and sea stars. These reefs are hosts to a multitude of fish, including gobies, spot, bass (black sea and striped), perch, toadfish, and croaker. Coastal reefs consist of either exposed rock, wrecks, kelp, or other hard material. Boring mollusks, algae, sponges, anemones, hydroids, and coral generally dominate these coastal reefs. These reef types also host lobsters, crabs, sea stars, and urchins, as well as a multitude of fish, including; black sea bass, pinfish, scup, cunner, red hake, gray triggerfish, black grouper, smooth dogfish, and summer flounder. These epibenthic organisms and fish assemblages are similar to the reefs farther offshore, which generally consist of rocks and boulders, wrecks, and other types of artificial reefs. There is less information available for reefs on the outer shelf, but the fish species associated with these reefs include tilefish, white hake, and conger eel.
In terms of numbers, amphipod crustaceans and bivalve mollusks dominate the benthic inhabitants of this primarily sandy environment. Mollusks (70%) dominate the biomass (Theroux and Wigley 1998). Pratt (1973) identified three broad faunal zones related to water depth and sediment type:
1) The “sand fauna” zone is dominated by polycheates and was defined for sandy sediments (1 percent or less silt) that are at least occasionally disturbed by waves, from shore out to a depth of about 164 ft (50 m).
2) The “silty sand fauna” zone is dominated by amphipods and polychaetes and occurs immediately offshore from the sand fauna zone, in stable sands containing a small amount of silt and organic material.
3) Silts and clays become predominant at the shelf break and line the Hudson Shelf Valley supporting the “silt-clay fauna.”
While substrate is the primary factor influencing demersal species distribution in the Gulf of Maine and Georges Bank, latitude and water depth are the primary influence in the Mid-Atlantic
16
Bight area. Colvocoresses and Musick (1984) identified the following assemblages in the Mid-Atlantic subregion during spring and fall.4
• Northern (boreal) portions: hake (white, silver, red), goosefish (monkfish), longhorn sculpin, winter flounder, little skate, and spiny dogfish;
• Warm temperate portions: black sea bass, summer flounder, butterfish, scup, spotted hake, and northern searobin;
• Water of the inner shelf: windowpane flounder;
• Water of the outer shelf: fourspot flounder; and
• Water of the continental slope: shortnose greeneye, offshore hake, blackbelly rosefish, and white hake.
4.2.4 Essential Fish Habitat (EFH) Designations The Sustainable Fisheries Act defines EFH as “[t]hose waters and substrate necessary to fish for spawning, breeding, feeding, or growth to maturity.” The proposed action could potentially affect EFH for benthic life stages of species that are managed under the Northeast multispecies; Atlantic sea scallop; deep-sea red crab; northeast skate complex; Atlantic herring; monkfish; dogfish; bluefish; summer flounder, scup, and black sea bass; tilefish; squid, Atlantic mackerel, and butterfish; Atlantic surfclam and ocean quahog FMPs. EFH for the species managed under these FMPs includes a wide variety of benthic habitats in state and Federal waters throughout the Northeast U.S. Shelf Ecosystem. Full descriptions and maps of EFH for each species and life stage are available on the NMFS Greater Atlantic Region website at https://www.nero.noaa.gov/habitat/index.html. In general, EFH for species and life stages that rely on the seafloor for shelter (e.g., from predators), reproduction, or food is vulnerable to disturbance by bottom tending gear. The most vulnerable habitat is more likely to be hard or rough bottom with attached epifauna.
4.2.5 Gear Types and Interactions with Habitat Vessels participating in Northeast limited access fisheries would fish for target species with a number of gear types: purse seine, trawl (including midwater and bottom), dredges (including scallop and hydraulic clam), gillnet, fish pot/trap, and hook and line gear (including jigs, handline, and non-automated demersal longlines). An in-depth analysis of gear types and their interactions with habitats is available in the respective FMPs. In general, the seafloor is the location of habitat types most susceptible to gear disturbances, so adverse effects to the physical habitat from different gear types are assessed by whether and how much the gear or harvesting technique contacts the bottom (Stevenson et al. 2004). Mobile gear types, such as dredges and trawls, generally have greater impacts on habitat than fixed gear types, like gillnets and fish pots, due to the amount of the gear that contacts the bottom and how it interacts with the bottom. Hydraulic clam dredges use pressurized water jets to wash clams out of the seafloor and,
4 Other species were listed as found in these assemblages, but only the species common to both spring and fall seasons are listed.
17
therefore, have a high degree of impact on high and low energy sand environments (Stevenson et al. 2004; NEFMC 2013). Bottom otter trawls and scallop dredges are considered to have high degree impacts to habitat. Bottom otter trawls have doors, ground cables, bridles, and sweeps that are dragged across the bottom during fishing. Some possible effects of bottom otter trawls on benthic habitats include reduction of habitat complexity, changes in benthic communities, reduction of productivity of benthic habitat (NRC 2002). Impacts from trawling are greater in gravel/rock habitats with attached epifauna, due to its greater vulnerability and lower frequency of disturbance. Scallop dredges have a cutting bar at the forward edge that that creates disturbs the substrate and directs objects and scallops into the bag. The bag, which is made of metal rings with chafing gear also drags along the substrate (Stevenson et al. 2004). Impacts to habitat from fish pots, sink gillnets, and bottom longlines are considered low because less of the gear comes into contact with the bottom (anchors, lead lines) and the gear remains fixed during fishing. Midwater trawls and purse seines also have low or no impacts, because they are fished in the water column to catch pelagic species and have minimal contact with the bottom.
There are a number of closed areas throughout the GOM, GB, and SNE/MAB regions designed to minimize such adverse effects from fishing on habitat. Existing and potential new habitat management areas are being evaluated in an ongoing Omnibus Essential Fish Habitat Amendment 2. More detailed analysis of the vulnerability of different habitats to different gear types is available in the draft amendment, which can be viewed on the NEFMC’s website: http://www.nefmc.org/habitat/index.html.
4.3 Target Species
4.3.1 Species and Stock Status Descriptions
Target species are defined as those species targeted by vessels participating in the FMPs modified by this action. Target stocks include: GOM cod, GB cod, GOM haddock, GB haddock, GOM winter flounder, GB winter flounder, SNE/MA winter flounder, Cape Cod (CC)/GOM yellowtail flounder, GB yellowtail flounder, SNE/MA yellowtail flounder, Pollock, redfish, white hake, Atlantic halibut, American plaice, witch flounder, Atlantic sea scallops, red crab, Atlantic herring, monkfish, summer flounder, black sea bass, scup, Longfin squid, Illex squid, Atlantic mackerel, surfclams, ocean quahogs, and tilefish.
18
Table 3 summarizes information from the 2014 first quarter NMFS status of the stocks report to Congress. Based on the first quarter update, six of the managed resources have overfishing occurring: GB cod, GOM cod, GOM haddock, witch flounder, Cape Cod (CC)/GOM yellowtail flounder, and GB yellowtail flounder. Tilefish, American plaice, GB cod, GOM cod, Atlantic halibut, ocean pout, white hake, GB winter flounder, GOM winter flounder, SNE/MA winter flounder, witch flounder, CC/GOM yellowtail flounder, and GB yellowtail flounder are under rebuilding plans. 14 stocks have stock biomass (either total or spawning stock biomass) above biomass at maximum sustainable yield (BMSY). Reports on “Stock Status,” including annual assessment and reference point update reports, Stock Assessment Workshop (SAW) reports, Stock Assessment Review Committee (SARC) panelist reports, and peer-review panelist reports are available online at the NEFSC website: http://www.nefsc.noaa.gov. EFH Source Documents, which include details on stock characteristics and ecological relationships, are available at the following website: http://www.nefsc.noaa.gov/nefsc/habitat/efh/.
19
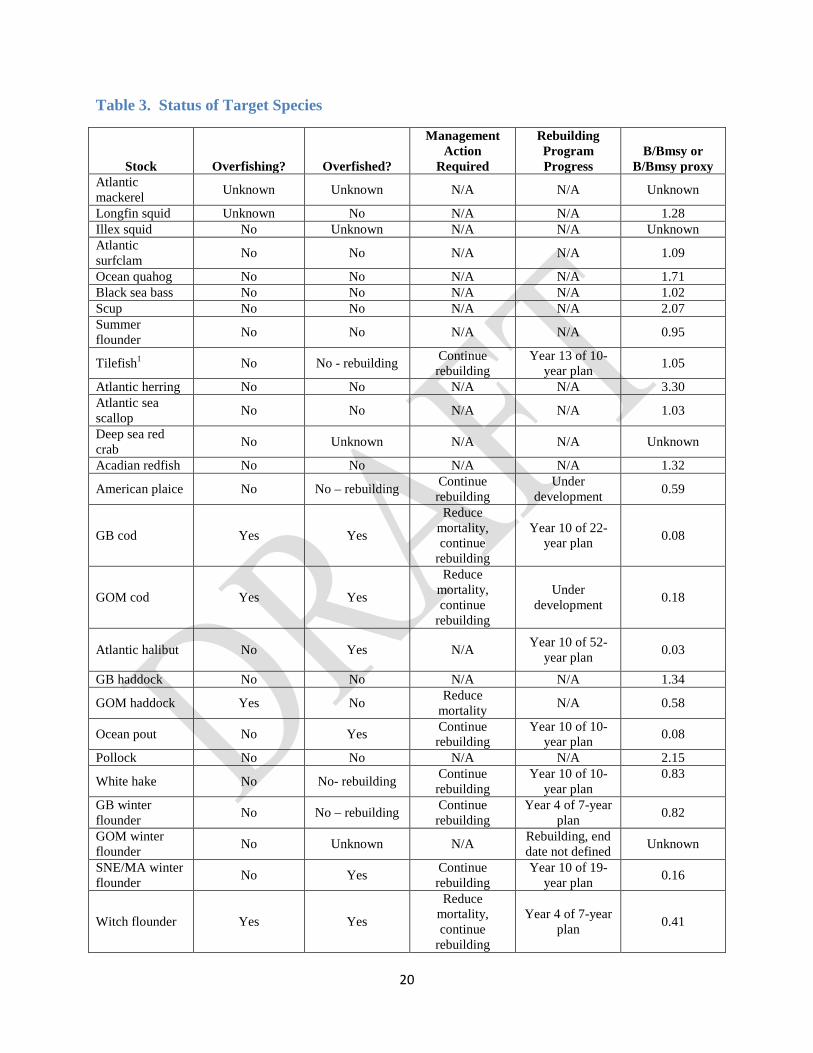
Table 3. Status of Target Species
Stock Overfishing? Overfished?
Management Action
Required
Rebuilding Program Progress
B/Bmsy or B/Bmsy proxy
Atlantic mackerel Unknown Unknown N/A N/A Unknown
Longfin squid Unknown No N/A N/A 1.28 Illex squid No Unknown N/A N/A Unknown Atlantic surfclam No No N/A N/A 1.09
Ocean quahog No No N/A N/A 1.71 Black sea bass No No N/A N/A 1.02 Scup No No N/A N/A 2.07 Summer flounder No No N/A N/A 0.95
Tilefish1 No No - rebuilding Continue rebuilding
Year 13 of 10-year plan 1.05
Atlantic herring No No N/A N/A 3.30 Atlantic sea scallop No No N/A N/A 1.03
Deep sea red crab No Unknown N/A N/A Unknown
Acadian redfish No No N/A N/A 1.32
American plaice No No – rebuilding Continue rebuilding
Under development 0.59
GB cod Yes Yes
Reduce mortality, continue
rebuilding
Year 10 of 22-year plan 0.08
GOM cod Yes Yes
Reduce mortality, continue
rebuilding
Under development 0.18
Atlantic halibut No Yes N/A Year 10 of 52-year plan 0.03
GB haddock No No N/A N/A 1.34
GOM haddock Yes No Reduce mortality N/A 0.58
Ocean pout No Yes Continue rebuilding
Year 10 of 10-year plan 0.08
Pollock No No N/A N/A 2.15
White hake No No- rebuilding Continue rebuilding
Year 10 of 10-year plan
0.83
GB winter flounder No No – rebuilding Continue
rebuilding Year 4 of 7-year
plan 0.82
GOM winter flounder No Unknown N/A Rebuilding, end
date not defined Unknown
SNE/MA winter flounder No Yes Continue
rebuilding Year 10 of 19-
year plan 0.16
Witch flounder Yes Yes
Reduce mortality, continue
rebuilding
Year 4 of 7-year plan 0.41
20
CC/GOM yellowtail flounder
Yes Yes
Reduce mortality, continue
rebuilding
Year 10 of 19-year plan 0.24
GB yellowtail flounder Yes Yes N/A Year 8 of 26-
year plan 0.11
SNE/MA yellowtail flounder
No No N/A N/A 1.29
GOM/NGB monkfish No No N/A N/A 1.31
SGB/SNE monkfish No No N/A N/A 1.55 1 A benchmark assessment completed in January 2014 determined that tilefish is not experiencing overfishing, is not overfished, and is rebuilt.
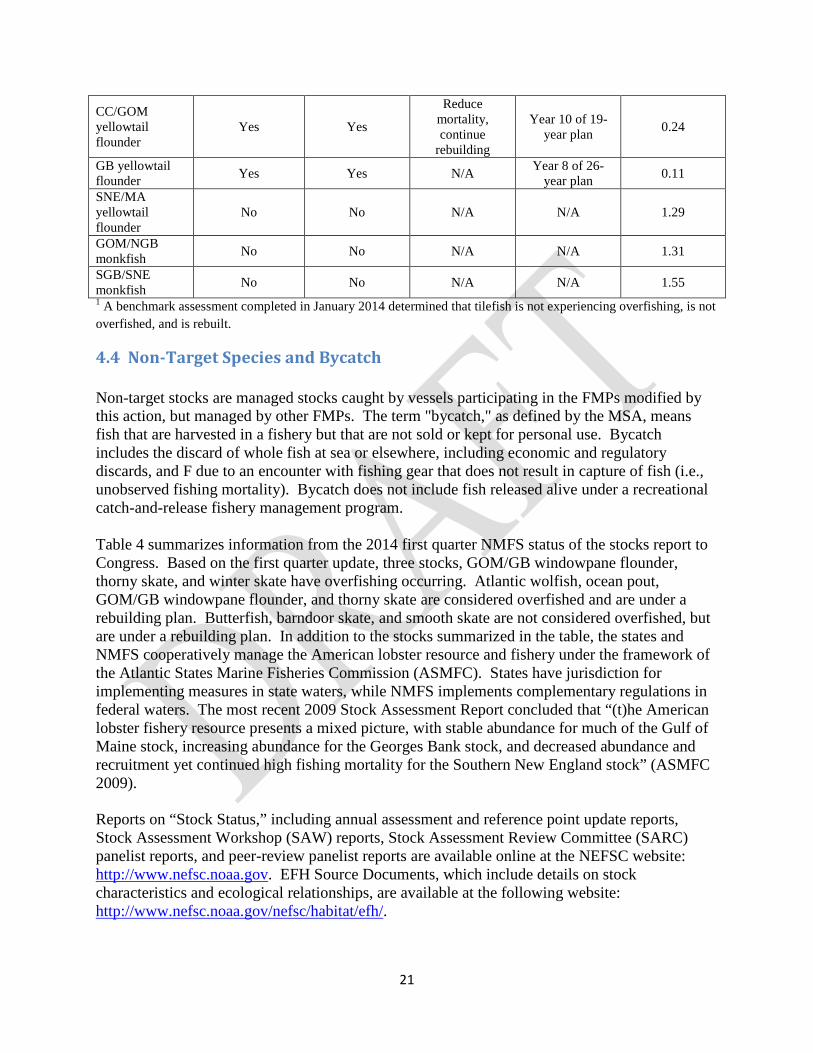
4.4 Non-Target Species and Bycatch Non-target stocks are managed stocks caught by vessels participating in the FMPs modified by this action, but managed by other FMPs. The term "bycatch," as defined by the MSA, means fish that are harvested in a fishery but that are not sold or kept for personal use. Bycatch includes the discard of whole fish at sea or elsewhere, including economic and regulatory discards, and F due to an encounter with fishing gear that does not result in capture of fish (i.e., unobserved fishing mortality). Bycatch does not include fish released alive under a recreational catch-and-release fishery management program. Table 4 summarizes information from the 2014 first quarter NMFS status of the stocks report to Congress. Based on the first quarter update, three stocks, GOM/GB windowpane flounder, thorny skate, and winter skate have overfishing occurring. Atlantic wolfish, ocean pout, GOM/GB windowpane flounder, and thorny skate are considered overfished and are under a rebuilding plan. Butterfish, barndoor skate, and smooth skate are not considered overfished, but are under a rebuilding plan. In addition to the stocks summarized in the table, the states and NMFS cooperatively manage the American lobster resource and fishery under the framework of the Atlantic States Marine Fisheries Commission (ASMFC). States have jurisdiction for implementing measures in state waters, while NMFS implements complementary regulations in federal waters. The most recent 2009 Stock Assessment Report concluded that “(t)he American lobster fishery resource presents a mixed picture, with stable abundance for much of the Gulf of Maine stock, increasing abundance for the Georges Bank stock, and decreased abundance and recruitment yet continued high fishing mortality for the Southern New England stock” (ASMFC 2009). Reports on “Stock Status,” including annual assessment and reference point update reports, Stock Assessment Workshop (SAW) reports, Stock Assessment Review Committee (SARC) panelist reports, and peer-review panelist reports are available online at the NEFSC website: http://www.nefsc.noaa.gov. EFH Source Documents, which include details on stock characteristics and ecological relationships, are available at the following website: http://www.nefsc.noaa.gov/nefsc/habitat/efh/.
21

Table 4. Status of Non-Target and Bycatch Species
Stock Overfishing? Overfished?
Management Action
Required
Rebuilding Program Progress
B/Bmsy or B/Bmsy proxy
Butterfish1 No Unknown Continue rebuilding
Year 4 of 4-year plan Unknown
Atlantic wolfish No Yes Continue rebuilding
Rebuilding, end date not defined4 0.29
Ocean pout No Yes Continue rebuilding
Year 10 of 10-year plan 0.08
GOM/GB windowpane Yes Yes
Reduce mortality, continue
rebuilding
Year 4 of 7-year plan 0.29
Bluefish No No N/A N/A 0.86 Spiny Dogfish No No N/A N/A 1.35 GOM/NGB Red Hake No No N/A N/A 0.95
SGB/MA Red Hake No No N/A N/A 0.93
Offshore Hake Unknown Unknown N/A N/A Unknown GOM/NGB Silver Hake No No N/A N/A 0.97
SGB/MA Silver Hake No No N/A N/A 0.67
Barndoor Skate No No - Rebuilding Continue rebuilding Year 11 of plan 0.78
Clearnose Skate No No N/A N/A 1.47 Little Skate No No N/A N/A 1.16 Rosette Skate No No N/A N/A 0.69
Smooth Skate No No - Rebuilding Continue rebuilding
Year 4 of 10-year plan 0.85
Thorny Skate Yes Yes
Reduce mortality, Continue rebuilding
Year 11 of 25-year plan 0.04
Winter Skate Yes No Reduce mortality N/A 1.19
1A benchmark assessment completed in March 2014 determined that butterfish is not subject to overfishing, is not overfished, and is rebuilt.
4.5 Protected Resources
Numerous protected species inhabit the environment within the Northeast Multispecies FMP management unit. Therefore, many protected species potentially occur in the operations area of the fishery. These species are under NMFS jurisdiction and are afforded protection under the Endangered Species Act of 1973 (ESA) and/or the Marine Mammal Protection Act of 1972 (MMPA). As listed in Table 5, 15 marine mammal, sea turtle, and fish species are classified as endangered or threatened under the ESA, and two others are candidate species under the ESA. The remaining species in Table 5 are protected by the MMPA and are known to interact with the fisheries modified by this action. Non ESA-listed species protected by the MMPA that utilize
22
this environment and have no documented interaction with the fisheries modified by this action will not be discussed in this document.
Table 5 lists the species, protected either by the ESA, the MMPA, or both, that may be found in the environment utilized by the fisheries modified by this action. Table 5 also includes two candidate fish species, as identified under the ESA. Candidate species are those petitioned species that NMFS is actively considering for listing as endangered or threatened under the ESA. Candidate species also include those species for which NMFS has initiated an ESA status review through an announcement in the Federal Register. Candidate species receive no substantive or procedural protection under the ESA; however, NMFS recommends that project proponents consider implementing conservation actions to limit the potential for adverse effects on candidate species from any proposed project. NMFS has initiated review of recent stock assessments, bycatch information, and other information for these candidate and proposed species. The results of those efforts are needed to accurately characterize recent interactions between fisheries and the candidate/proposed species in the context of stock sizes. Any conservation measures deemed appropriate for these species will follow the information reviews. Please note that once a species is proposed for listing the conference provisions of the ESA apply (see 50 CFR 402.10).
23
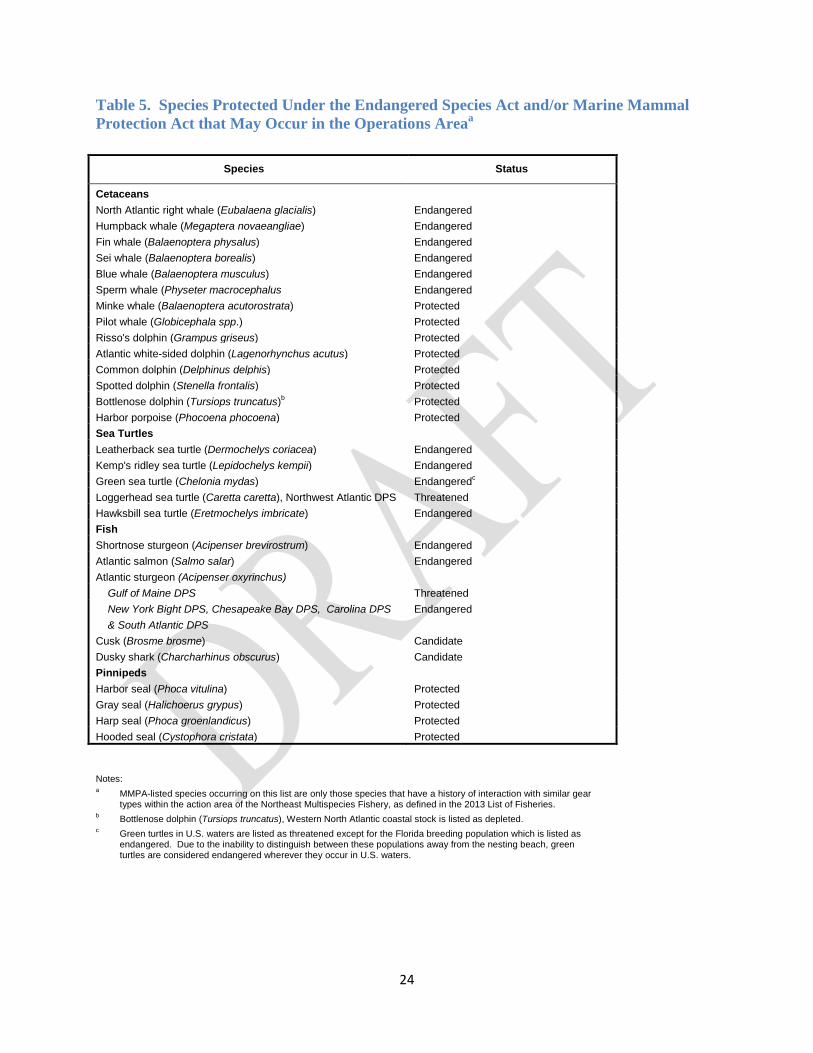
Table 5. Species Protected Under the Endangered Species Act and/or Marine Mammal Protection Act that May Occur in the Operations Areaa
Species Status
Cetaceans North Atlantic right whale (Eubalaena glacialis) Endangered Humpback whale (Megaptera novaeangliae) Endangered Fin whale (Balaenoptera physalus) Endangered Sei whale (Balaenoptera borealis) Endangered Blue whale (Balaenoptera musculus) Endangered Sperm whale (Physeter macrocephalus Endangered Minke whale (Balaenoptera acutorostrata) Protected Pilot whale (Globicephala spp.) Protected Risso's dolphin (Grampus griseus) Protected Atlantic white-sided dolphin (Lagenorhynchus acutus) Protected Common dolphin (Delphinus delphis) Protected Spotted dolphin (Stenella frontalis) Protected Bottlenose dolphin (Tursiops truncatus)b Protected Harbor porpoise (Phocoena phocoena) Protected Sea Turtles Leatherback sea turtle (Dermochelys coriacea) Endangered Kemp's ridley sea turtle (Lepidochelys kempii) Endangered Green sea turtle (Chelonia mydas) Endangeredc Loggerhead sea turtle (Caretta caretta), Northwest Atlantic DPS Threatened Hawksbill sea turtle (Eretmochelys imbricate) Endangered Fish Shortnose sturgeon (Acipenser brevirostrum) Endangered Atlantic salmon (Salmo salar) Endangered Atlantic sturgeon (Acipenser oxyrinchus) Gulf of Maine DPS Threatened New York Bight DPS, Chesapeake Bay DPS, Carolina DPS
& South Atlantic DPS Endangered
Cusk (Brosme brosme) Dusky shark (Charcharhinus obscurus)
Candidate Candidate
Pinnipeds Harbor seal (Phoca vitulina) Protected Gray seal (Halichoerus grypus) Protected Harp seal (Phoca groenlandicus) Protected Hooded seal (Cystophora cristata) Protected
Notes: a MMPA-listed species occurring on this list are only those species that have a history of interaction with similar gear
types within the action area of the Northeast Multispecies Fishery, as defined in the 2013 List of Fisheries. b Bottlenose dolphin (Tursiops truncatus), Western North Atlantic coastal stock is listed as depleted. c Green turtles in U.S. waters are listed as threatened except for the Florida breeding population which is listed as
endangered. Due to the inability to distinguish between these populations away from the nesting beach, green turtles are considered endangered wherever they occur in U.S. waters.
24
4.5.1 Species Potentially Affected
Northeast limited access fisheries have the potential to affect the fish, sea turtle, cetacean, and pinniped species discussed below. A number of documents contain background information on the range-wide status of the protected species that occur in the area and are known or suspected of interacting with fishing gear. These documents include sea turtle status reviews and biological reports (NMFS and USFWS 1995; Turtle Expert Working Group 1998, 2000, 2007, 2009; NMFS and USFWS 2007a, 2007b, recovery plans for ESA-listed cetaceans and sea turtles (NMFS 1991a, 2005; NMFS and USFWS 1991a, 1991b; NMFS and USFWS 1992), the marine mammal stock assessment reports (e.g., Waring et al. 1995; 2011), and other publications (e.g., Clapham et al. 1999, Perry et al. 1999, Best et al. 2001, Perrin et al. 2002, ASSRT 2007). Additional ESA background information on the range-wide status of these species and a description of critical habitat can be found in a number of published documents including recent sea turtle (NMFS and USFWS 1995, TEWG 2000, NMFS SEFSC 2001, NMFS and USFWS 2007), loggerhead recovery team report (NMFS and USFWS 2008), status reviews and stock assessments, Recovery Plans for the humpback whale (NMFS 1991a), right whale (NMFS 1991b), NMFS 2005), right whale EIS (August 2007), and the marine mammal stock assessment report (Waring et al. 2013) and other publications (e.g., Perry et al. 1999; Clapham et al. 1999; IWC 2001 a). A recovery plan for fin and sei whales is also available and may be found at the following web site http://www.NOAAFisheries.noaa.gov/prot_res/PR3/recovery.html (NOAA Fisheries unpublished). An updated batched BO was issued for seven Northeast fisheries, including the monkfish, groundfish, dogfish, mackerel/squid/butterfish, and summer flounder/scup/black sea bass fisheries, on December 16, 2013 (NMFS 2013). The BO reviewed the current status of large marine mammals, sea turtles, and Atlantic sturgeon, the environmental baseline, and cumulative effects in the action area, including the effects of the continued operation of the these FMPs over the next 10 years. The BO concluded that the continuation of these fisheries “may adversely affect, but is not likely to jeopardize, the continued existence of” North Atlantic right whales, humpback whales, fin whales, sei whales, the Northwest Atlantic DPS of loggerhead sea turtles, leatherback turtles, Kemp’s ridley turtles, green sea turtles, any of the five DPSs of Atlantic sturgeon, or the GOM DPS for Atlantic salmon. This BO also concluded that these fisheries will not adversely affect hawksbill sea turtles, shortnose sturgeon, smalltooth sawfish DPS, Acroporid corals, Johnson’s seagrass, sperm whales, blue whales, designated critical habitat for right whales in the Northwest Atlantic, or designated critical habitat for GOM DPS Atlantic salmon (NMFS 2013). An incidental take statement was developed for the seven combined fisheries. The 2012 BO issued for the Atlantic Sea Scallop FMP reach the same conclusion. Both BOs are available online on the NMFS Greater Atlantic Regional Fisheries Office’s website: http://www.nero.noaa.gov/protected/section7/bo/actbo.html.
4.5.1.1 Sea Turtles
Loggerhead, leatherback, Kemp’s ridley, and green sea turtles occur seasonally in southern New England and Mid-Atlantic continental shelf waters north of Cape Hatteras, North Carolina. Turtles generally move up the coast from southern wintering areas as water temperatures warm
25
in the spring (James et al. 2005, Morreale and Standora 2005, Braun-McNeill and Epperly 2004, Morreale and Standora 1998, Musick and Limpus 1997, Shoop and Kenney 1992, Keinath et al. 1987). A reversal of this trend occurs in the fall when water temperatures cool. Turtles pass Cape Hatteras by December and return to more southern waters for the winter (James et al. 2005, Morreale and Standora 2005, Braun-McNeill and Epperly 2004, Morreale and Standora 1998, Musick and Limpus 1997, Shoop and Kenney 1992, Keinath et al. 1987). Hard-shelled species typically occur as far north as Cape Cod whereas the more cold-tolerant leatherbacks occur in more northern Gulf of Maine waters in the summer and fall (Shoop and Kenney 1992, STSSN database http://www.sefsc.noaa.gov/seaturtleSTSSN.jsp). On March 16, 2010, NMFS and USFWS published a proposed rule (75 FR 12598) to divide the worldwide population of loggerhead sea turtles into nine DPSs, as described in the 2009 Status Review. Two of the DPSs were proposed to be listed as threatened and seven of the DPSs, including the Northwest Atlantic Ocean DPS, were proposed to be listed as endangered. NMFS and the USFWS accepted comments on the proposed rule through September 13, 2010 (75 FR 30769, June 2, 2010). On March 22, 2011 (76 FR 15932), NMFS and USFWS extended the date by which a final determination on the listing action will be made to no later than September 16, 2011. This action was taken to address the interpretation of the existing data on status and trends and its relevance to the assessment of risk of extinction for the Northwest Atlantic Ocean DPS, as well as the magnitude and immediacy of the fisheries bycatch threat and measures to reduce this threat. New information or analyses to help clarify these issues were requested by April 11, 2011. On September 22, 2011, NMFS and USFWS issued a final rule (76 FR 58868), determining that the loggerhead sea turtle is composed of nine DPSs (as defined in Conant et al., 2009) that constitute species that may be listed as threatened or endangered under the ESA. Five DPSs were listed as endangered (North Pacific Ocean, South Pacific Ocean, North Indian Ocean, Northeast Atlantic Ocean, and Mediterranean Sea), and four DPSs were listed as threatened (Northwest Atlantic Ocean, South Atlantic Ocean, Southeast Indo-Pacific Ocean, and Southwest Indian Ocean). Note that the Northwest Atlantic Ocean (NWA) DPS and the Southeast Indo-Pacific Ocean DPS were original proposed as endangered. The NWA DPS was determined to be threatened based on review of nesting data available after the proposed rule was published, information provided in public comments on the proposed rule, and further discussions within the agencies. The two primary factors considered were population abundance and population trend. NMFS and USFWS found that an endangered status for the NWA DPS was not warranted given the large size of the nesting population, the overall nesting population remains widespread, the trend for the nesting population appears to be stabilizing, and substantial conservation efforts are underway to address threats. The September 2011 final rule also noted that critical habitat for the two DPSs occurring within the U.S. (NWA DPS and North Pacific DPS) will be designated in a future rulemaking. Information from the public related to the identification of critical habitat, essential physical or biological features for this species, and other relevant impacts of a critical habitat designation was solicited.
26
This proposed action only occurs in the Atlantic Ocean. As noted in Conant et al. (2009), the range of the four DPSs occurring in the Atlantic Ocean are as follows: NWA DPS – north of the equator, south of 60° N latitude, and west of 40° W longitude; Northeast Atlantic Ocean (NEA) DPS – north of the equator, south of 60° N latitude, east of 40° W longitude, and west of 5° 36’ W longitude; South Atlantic DPS – south of the equator, north of 60° S latitude, west of 20° E longitude, and east of 60° W longitude; Mediterranean DPS – the Mediterranean Sea east of 5° 36’ W longitude. These boundaries were determined based on oceanographic features, loggerhead sightings, thermal tolerance, fishery bycatch data, and information on loggerhead distribution from satellite telemetry and flipper tagging studies. Sea turtles from the NEA DPS are not expected to be present over the North American continental shelf in U.S. coastal waters, where the proposed action occurs (P. Dutton, NMFS, personal communication, 2011). Previous literature (Bowen et al. 2004) has suggested that there is the potential, albeit small, for some juveniles from the Mediterranean DPS to be present in U.S. Atlantic coastal foraging grounds. These data should be interpreted with caution however, as they may be representing a shared common haplotype and lack of representative sampling at Eastern Atlantic rookeries. Given that updated, more refined analyses are ongoing and the occurrence of Mediterranean DPS juveniles in U.S. coastal waters is rare and uncertain, if even occurring at all, for the purposes of this assessment we are making the determination that the Mediterranean DPS is not likely to be present in the action area. Sea turtles of the South Atlantic DPS do not inhabit the action area of this subject fishery (Conant et al. 2009). As such, the remainder of this assessment will only focus on the NWA DPS of loggerhead sea turtles, listed as threatened. In general, sea turtles are a long-lived species and reach sexual maturity relatively late (NMFS SEFSC 2001; NMFS and USFWS 2007a, 2007b, 2007c, 2007d). Sea turtles are injured and killed by numerous human activities (NRC 1990; NMFS and USFWS 2007a, 2007b, 2007c, 2007d). Nest count data are a valuable source of information for each turtle species since the number of nests laid reflects the reproductive output of the nesting group each year. A decline in the annual nest counts has been measured or suggested for four of five western Atlantic loggerhead nesting groups through 2004 (NMFS and USFWS 2007a), however, data collected since 2004 suggests nest counts have stabilized or increased (TEWG 2009). Nest counts for Kemp’s ridley sea turtles as well as leatherback and green sea turtles in the Atlantic demonstrate increased nesting by these species (NMFS and USFWS 2007b, 2007c, 2007d).
4.5.1.2 Large Cetaceans The most recent Marine Mammal Stock Assessment Report (SAR) (Waring et al. 2012), covering the time period between 2005 and 2009, reviewed the current population trend for each of these cetacean species within U.S. Economic Exclusion Zone (EEZ) waters. The SAR also estimated annual human-caused mortality and serious injury. Finally, it described the commercial fisheries that interact with each stock in the U.S. Atlantic. The following paragraphs summarize information from the SAR. The western North Atlantic baleen whale species (North Atlantic right, humpback, fin, sei, and minke whales) follow a general annual pattern of migration. They migrate from high latitude summer foraging grounds, including the Gulf of Maine and Georges Bank, to low latitude winter calving grounds (Perry et al. 1999, Kenney 2002). However, this is a simplification of species
27
movements as the complete winter distribution of most species is unclear (Perry et al. 1999, Waring et al. 2012). Studies of some of the large baleen whales (right, humpback, and fin) have demonstrated the presence of each species in higher latitude waters even in the winter (Swingle et al. 1993, Wiley et al. 1995, Perry et al. 1999, Brown et al. 2002). Blue whales are most often sighted along the east coast of Canada, particularly in the Gulf of St. Lawrence. They occur only infrequently within the U.S. EEZ (Waring et al. 2002). North Atlantic right whales are federally listed as endangered under the ESA and a revised recovery plan was published in June 2005. Available information suggests that the North Atlantic right whale population increased at a rate of 2.4 percent per year between 1990 and 2007. The total number of North Atlantic right whales is estimated to be at least 396 animals in 2006 (Waring et al. 2012). The minimum rate of annual human-caused mortality and serious injury to right whales averaged 2.4 mortality or serious injury incidents per year during 2005 to 2009 (Waring et al. 2012). Of these, fishery interactions resulted in an average of 0.8 mortality or serious injury incidents per year, all in U.S. waters. The potential biological removal (PBR) level for this stock is 0.8 animals per year (Waring et al. 2012). Humpback whales are also listed as endangered under the ESA, and a recovery plan was published for this species in 1991. The North Atlantic population of humpback whales is conservatively estimated to be 7,698 (Waring et al. 2012). The best estimate for the GOM stock of humpback whale population is 847 whales and current data suggest that the Gulf of Maine humpback whale stock is steadily increasing in size (Waring et al. 2012). The minimum rate of annual human-caused mortality and serious injury to humpback whales averaged 5.2 mortality or serious injury incidents per year during 2005 to 2009 (Waring et al. 2012). Of these, fishery interactions resulted in an average of 3.8 mortality or serious injury incidents per year (3.4 from U.S. waters and 0.4 from Canadian waters). The PBR for this stock is 1.1 animals per year (Waring et al. 2012). Fin, sei, and sperm whales are all federally listed as endangered under the ESA, with recovery plans currently in place. Based on data available for selected areas and time periods, the minimum population estimates for these western North Atlantic whale stocks are 3,269 fin whales, 208 sei whales (Nova Scotia stock) (Waring et al. 2012), and 3,539 sperm whales (Waring et al. 2007). Insufficient information exists to determine population trends for these large whale species. The minimum rate of annual human-caused mortality and serious injury to fin whales averaged 2.6 mortality or serious injury incidents per year during 2005 to 2009 (Waring et al. 2012). Of these, fishery interactions resulted in an average of 0.8 mortality or serious injury incidents per year (0.6 from U.S. waters and 0.2 from Canadian waters). The PBR for this stock is 6.5 animals per year (Waring et al. 2012). For sei whales, the minimum rate of annual human-cause mortality and serious injury averaged 1.2 per year, of which 0.6 were a result of fishery interactions. PBR for the Nova Scotia sei whale stock is 0.4 (Waring et al. 2012). For both fin and sei whales, these estimates are likely biased low due to the low detection rate for these species. The most recent SAR for the North Atlantic sperm whale stock is from 2007 (covering the years 2001-2005) and during that time period, there were no recorded mortality or serious
28
injury incidents due to entanglements (Waring et al. 2007). PBR for this stock is 7.1 animals per year. Minke whales are not ESA-listed but are protected under the MMPA, with a minimum population estimate of 6,909 animals for the Canadian east coast stock; however, a population trend analysis has not been conducted for this stock (Waring et al. 2012). The minimum rate of annual human-caused mortality and serious injury averaged 5.9 per year during 2005 to 2009, and of these, 3.5 animals per year were recorded through observed fisheries and 0.8 per year were attributed to U.S. fisheries using stranding and entanglement data (Waring et al. 2012). PBR for this stock is 69 animals per year. More details on fisheries interactions with these species, as well as management actions in place to reduce entanglement risk, can be found in Section 5.1.
29
4.5.1.3 Small Cetaceans
There is fishing related mortality of numerous small cetacean species (dolphins, pilot whales, and harbor porpoises) associated with Northeast limited access fisheries. Seasonal abundance and distribution of each species off the coast of the Northeast U.S. varies with respect to life history characteristics. Some species such as white-sided dolphins and harbor porpoises primarily occupy continental shelf waters. Other species such as the Risso’s dolphin occur primarily in continental shelf edge and slope waters. Still other species like the common dolphin and the spotted dolphin occupy all three habitats. Waring et al. (2012) summarizes information on the distribution and geographic range of western North Atlantic stocks of each species. The most commonly observed small cetaceans recorded as bycatch in multispecies fishing gear (e.g., gillnets and trawls) are harbor porpoises, white-sided dolphins, common dolphins, and pilot whales. These species are described in a bit more detail here. Harbor porpoises are found seasonally within New England and Mid-Atlantic waters. In the Mid-Atlantic, porpoises are present in the winter/spring (typically January through April) and in southern New England waters from December through May. In the Gulf of Maine, porpoises occur largely from the fall through the spring (September through May) and in the summer are found in northern Maine and through the Bay of Fundy and Nova Scotia area. White-sided dolphin distribution shifts seasonally, with a large presence from Georges Bank through the Gulf of Maine from June through September, with intermediate presence from Georges Bank through the lower Gulf of Maine from October through December. Low numbers are present from Georges Bank to Jeffrey’s Ledge from January through May (Waring et al. 2012). Common dolphins are widely distributed over the continental shelf from Maine through Cape Hatteras, North Carolina. From mid-January to May they are dispersed from North Carolina through Georges Bank, and then move onto Georges Bank and the Scotia shelf from the summer to fall. They are occasionally found in the Gulf of Maine (Waring et al. 2012). Pilot whales are generally distributed along the continental shelf edge off the northeastern U.S. coast in the winter and early spring. In late spring, the move onto Georges Bank and into the Gulf of Maine and remain until late fall. They do occur along the Mid-Atlantic shelf break between Cape Hatteras, North Carolina and New Jersey (Waring et al. 2012). Since pilot whales are difficult to differentiate at sea, they are generally considered Globicephala sp. when they are recorded at sea (Waring et al. 2012).
4.5.1.4 Pinnipeds Harbor seals have the most extensive distribution of the four species of seal expected to occur in the area. Harbor seals sighting have occurred far south as 30° N (Katona et al. 1993, Waring et al. 2012). Their approximate year-round range extends from Nova Scotia, through the Bay of Fundy, and south through Maine to northern Massachusetts (Waring et al. 2012). Their more seasonal range (September through May) extends from northern Massachusetts south through southern New Jersey, and stranding records indicate occasional presence of harbor seals from southern New Jersey through northern North Carolina (Waring et al. 2012). Gray seals are the second most common seal species in U.S. EEZ waters. They occur from Nova Scotia through the Bay of Fundy and into waters off of New England (Katona et al. 1993; Waring et al. 2011) year-round from Maine through southern Massachusetts (Waring et al. 2012). A more seasonal distribution of gray seals occurs from southern Massachusetts through southern New Jersey from September through May. Similar to harbor seals, occasional presence from southern New Jersey
30

through northern North Carolina indicate occasional presence of gray seals in this region (Waring et al. 2012). Pupping for both species occurs in both U.S. and Canadian waters of the western North Atlantic. The majority of harbor seal pupping is thought to occur in U.S. waters. While there are at least three gray seal pupping colonies in U.S., the majority of gray seal pupping likely occurs in Canadian waters. Observations of harp and hooded seals are less common in U.S. EEZ waters. Both species form aggregations for pupping and breeding off eastern Canada in the late winter/early spring. They then travel to more northern latitudes for molting and summer feeding (Waring et al. 2006). Both species have a seasonal presence in U.S. waters from Maine to New Jersey, based on sightings, stranding, and fishery bycatch information (Waring et al. 2012).
4.5.1.5 Atlantic Sturgeon A status review for Atlantic sturgeon was completed in 2007 which indicated that five distinct population segments (DPS) of Atlantic sturgeon exist in the United States (ASSRT 2007). On October 6, 2010, NMFS proposed listing these five DPSs of Atlantic sturgeon along the U.S. East Coast as either threatened or endangered species (75 FR 61872 and 75 FR 61904). A final listing was published on February 6th, 2012 (77 FR 5880 and 75 FR 5914). The GOM DPS of Atlantic sturgeon has been listed as threatened, and the New York Bight, Chesapeake Bay, Carolina, and South Atlantic DPSs of Atlantic sturgeon have been listed as endangered. Atlantic sturgeon from any of the five DPSs could occur in areas where the multispecies fishery operates Atlantic sturgeon are known to be captured in sink gillnet, drift gillnet, and otter trawl gear (Stein et al. 2004a, ASMFC TC 2007). Of these gear types, sink gillnet gear poses the greatest known risk of mortality for bycaught sturgeon (ASMFC TC 2007). Sturgeon deaths were rarely reported in the otter trawl observer dataset, as well as sink gillnet and drift gillnet gear (ASMFC TC 2007). Atlantic sturgeon is an anadromous species that spawns in relatively low salinity, river environments, but spends most of its life in the marine and estuarine environments from Labrador, Canada to the Saint Johns River, Florida (Holland and Yelverton 1973, Dovel and Berggen 1983, Waldman et al. 1996, Kynard and Horgan 2002, Dadswell 2006, ASSRT 2007). Tracking and tagging studies have shown that subadult and adult Atlantic sturgeon that originate from different rivers mix within the marine environment, utilizing ocean and estuarine waters for life functions such as foraging and overwintering (Stein et al. 2004a, Dadswell 2006, ASSRT 2007, Laney et al. 2007, Dunton et al. 2010). Fishery-dependent data as well as fishery-independent data demonstrate that Atlantic sturgeon use relatively shallow inshore areas of the continental shelf; primarily waters less than 50 m (Stein et al. 2004b, ASMFC 2007, Dunton et al. 2010). The data also suggest regional differences in Atlantic sturgeon depth distribution with sturgeon observed in waters primarily less than 20 m in the Mid-Atlantic Bight and in deeper waters in the Gulf of Maine (Stein et al. 2004b, ASMFC 2007, Dunton et al. 2010). Information on population sizes for each Atlantic sturgeon DPS is very limited. Based on the best available information, NMFS has concluded that bycatch, vessel strikes, water quality and water availability, dams, lack of regulatory mechanisms for protecting the fish, and dredging are the most significant threats to Atlantic sturgeon. Since the ESA listing of Atlantic sturgeon, the NEFSC has completed new population estimates using data from the Northeast Area Monitoring and Assessment (NEAMAP) survey (Kocik et al.
31
2013). Atlantic sturgeon are frequently sampled during the NEAMAP survey. NEAMAP has been conducting trawl surveys from Cape Cod, Massachusetts to Cape Hatteras, North Carolina in nearshore waters at depths to 18.3 meters (60 feet) during the fall since 2007 and depths up to 36.6 meters (120 feet) during the spring since 2008 using a spatially stratified random design with a total of 35 strata and 150 stations per survey. The information from this survey can be directly used to calculate minimum swept area population estimates during the fall, which range from 6,980 to 42,160 with coefficients of variation between 0.02 and 0.57 and during the spring, which range from 25,540 to 52,990 with coefficients of variation between 0.27 and 0.65. These are considered minimum estimates because the calculation makes the unlikely assumption that the gear will capture 100 percent of the sturgeon in the water column along the tow path. Efficiencies less than 100 percent will result in estimates greater than the minimum. The true efficiency depends on many things including the availability of the species to the survey and the behavior of the species with respect to the gear. True efficiencies much less than 100 percent are common for most species. The NEFSC’s analysis also calculated estimates based on an assumption of 50 percent efficiency, which reasonably accounts for the robust, yet not complete sampling of the Atlantic sturgeon, oceanic temporal and spatial ranges, and the documented high rates of encounter with NEAMAP survey gear and Atlantic sturgeon. For this analysis, NMFS has determined that the best available scientific information for the status of Atlantic sturgeon at this time are the population estimates derived from NEAMAP swept area biomass (Kocik et al. 2013) because the estimates are derived directly from empirical data with few assumptions. NMFS has determined that using the median value of the 50 percent efficiency as the best estimate of the Atlantic sturgeon ocean population is most appropriate at this time. This results in a total population size estimate of 67,776 fish, which is considerably higher than the estimates that were available at the time of listing. This estimate is the best available estimate of Atlantic sturgeon abundance at the time of this analysis. The ASMFC has begun work on a benchmark assessment for Atlantic sturgeon to be completed in 2014, which would be expected to provide an updated population estimate and stock status. The ASMFC is currently collecting public submissions of data for use in the assessment: http://www.asmfc.org/uploads/file/pr20AtlSturgeonStockAssmtPrep.pdf.
4.5.1.6 Atlantic Salmon (Gulf of Maine DPS) The wild populations of Atlantic salmon are listed as endangered under the ESA. Their freshwater range occurs in the watersheds from the Androscoggin River northward along the Maine coast to the Dennys River. Juvenile salmon in New England rivers typically migrate to sea in spring after a one- to three-year period of development in freshwater streams. They remain at sea for two winters before returning to their U.S. natal rivers to spawn (Kocik and Sheehan 2006). The marine range of the GOM DPS extends from the Gulf of Maine, throughout the Northwest Atlantic Ocean, to the coast of Greenland. Results from a 2001-2003 post-smolt trawl survey in the nearshore waters of the Gulf of Maine indicate that Atlantic salmon post-smolts are prevalent in the upper water column throughout this area in mid to late May (Lacroix, Knox, and Stokesbury 2005). The trend in abundance of Atlantic salmon in the GOM DPS has been low and either stable or declining over the past several decades. The number of returning naturally-reared adults continues at low levels due to poor marine survival. Adult Atlantic salmon may be present in the action area year-round, however they are rarely captured in the marine environment. NEFOP data from 1989 through August 2013 show records
32
of incidental Atlantic salmon bycatch in 7 of 24 years, with a total of 15 individuals caught. Of the observed incidentally caught Atlantic salmon, 10 were listed as “discarded,” which is assumed to be a live discard (Kocik, pers comm, Feb 11, 2013). Five of the 15 were listed as mortalities. The incidental takes of Atlantic salmon occurred using sink gillnets (11) and bottom otter trawls (4). Observed captures occurred in November (6), June (3), March (2), April (2), August (1) and May (1). The most recent data, from 2004 through August 2013, show incidental captures in the multispecies and monkfish fisheries during the spring months in areas offshore (statistical areas 522 and 525) and in the spring and summer months in the Gulf of Maine (statistical areas 513, 514, and 515).
4.5.2 Species and Habitats Not Likely to be Affected
NMFS has determined that the action being considered in this EA is not likely to adversely affect shortnose sturgeon, hawksbill sea turtles, blue whales, or sperm whales, all of which are listed as endangered species under the ESA. Further, the action considered in this EA is not likely to adversely affect North Atlantic right whale (discussed in Section 4.5.1.2) critical habitat. The following discussion provides the rationale for these determinations. Shortnose sturgeon are benthic fish that mainly occupy the deep channel sections of large rivers. They occupy rivers along the western Atlantic coast from St. Johns River in Florida, to the Saint John River in New Brunswick, Canada. Although, the species is possibly extirpated from the Saint Johns River system. The species is anadromous in the southern portion of its range (i.e., south of Chesapeake Bay), while some northern populations are amphidromous (NMFS 1998). Since sectors would not operate in or near the rivers where concentrations of shortnose sturgeon are most likely found, it is highly unlikely that sectors would affect shortnose sturgeon. The hawksbill turtle is uncommon in the waters of the continental U.S. Hawksbills prefer coral reefs, such as those found in the Caribbean and Central America. Hawksbills feed primarily on a wide variety of sponges, but also consume bryozoans, coelenterates, and mollusks. The Culebra Archipelago of Puerto Rico contains especially important foraging habitat for hawksbills. Nesting areas in the western North Atlantic include Puerto Rico and the Virgin Islands. There are accounts of hawksbills in south Florida and individuals have been sighted along the east coast as far north as Massachusetts; however, east coast sightings north of Florida are rare (NMFS 2009a). Therefore, it is highly unlikely that Northeast fishery operations would affect this turtle species. Blue whales do not regularly occur in waters of the U.S. EEZ (Waring et al. 2002). In the North Atlantic region, blue whales are most frequently sighted from April to January (Sears 2002). No blue whales were observed during the Cetacean and Turtle Assessment Program surveys of the mid- and North Atlantic areas of the outer continental shelf (Cetacean and Turtle Assessment Program 1982). Calving for the species occurs in low latitude waters outside of the area where the sectors would operate. Blue whales feed on euphausiids (krill) that are too small to be captured in fishing gear. There were no observed fishery-related mortalities or serious injuries to blue whales between 1996 and 2000 (Waring et al. 2002). The species is unlikely to occur in areas where Northeast fisheries would operate, and Northeast fishery operations would not affect
33
the availability of blue whale prey or areas where calving and nursing of young occurs. Therefore, the Proposed Action would not be likely to adversely affect blue whales. Unlike blue whales, sperm whales do regularly occur in waters of the U.S. EEZ. However, the distribution of the sperm whales in the U.S. EEZ occurs on the continental shelf edge, over the continental slope, and into mid-ocean regions (Waring et al. 2007). Sperm whale distribution is typically concentrated east-northeast of Cape Hatteras in winter and shifts northward in spring when whales are found throughout the Mid-Atlantic Bight (Waring et al. 2006). Distribution extends further northward to areas north of Georges Bank and the Northeast Channel region in summer and then south of New England in fall, back to the Mid-Atlantic Bight (Waring et al. 1999). In contrast, the sectors would operate in continental shelf waters. The average depth over which sperm whale sightings occurred during the Cetacean and Turtle Assessment Program surveys was 5,879 ft (1,792 m) (Cetacean and Turtle Assessment Program 1982). Female sperm whales and young males almost always inhabit open ocean, deep water habitat with bottom depths greater than 3,280 ft (1,000 m) and at latitudes less than 40° N (Whitehead 2002). Sperm whales feed on large squid and fish that inhabit the deeper ocean regions (Perrin et al. 2002). There were no observed fishery-related mortalities or serious injuries to sperm whales between 2001 and 2005 (Waring et al. 2007). Sperm whales are unlikely to occur in water depths where the Northeast fisheries would operate, Northeast fishery operations would not affect the availability of sperm whale prey or areas where calving and nursing of young occurs. Therefore, the Proposed Action would not be likely to adversely affect sperm whales. North Atlantic right whales occur in coastal and shelf waters in the western North Atlantic (NMFS 2005). The western North Atlantic population in the U.S. primarily ranges from winter calving and nursery areas in coastal waters off the southeastern U.S. to summer feeding grounds in New England waters (NMFS 2005). North Atlantic right whales use five well-known habitats annually, including multiple in northern waters. These northern areas include the Great South Channel (east of Cape Cod); Cape Cod and Massachusetts Bays; the Bay of Fundy; and Browns and Baccaro Banks, south of Nova Scotia. NMFS designated the Great South Channel and Cape Cod and Massachusetts Bays as North Atlantic right whale critical habitat in June 1994 (59 FR 28793). NMFS has designated additional critical habitat in the southeastern U.S. It is not known whether the bottom-trawl, or any other type of fishing gear, has an impact on the habitat of the North Atlantic right whale (59 FR 28793). As discussed in Section 5.1 Impact Assessment5.1, the proposed alternatives would result in a negligible effect on physical habitat. Therefore, changes considered under this action would not result in a significant impact on North Atlantic right whale critical habitat. Further, mesh sizes used in Northeast limited access fisheries do not significantly impact the North Atlantic right whale’s planktonic food supply (59 FR 28793). Therefore, North Atlantic right whale food sources in areas designated as critical habitat would not be adversely affected by Northeast limited access fisheries. For these reasons, North Atlantic right whale critical habitat will not be considered further in this EA.
4.6 Human Communities/Social-Economic Environment
4.6.1 Description of the Fisheries Detailed descriptions of the economic aspects of the commercial fisheries for the managed resources, as well as the management regimes are available in the respective FMPs. The 2012
34
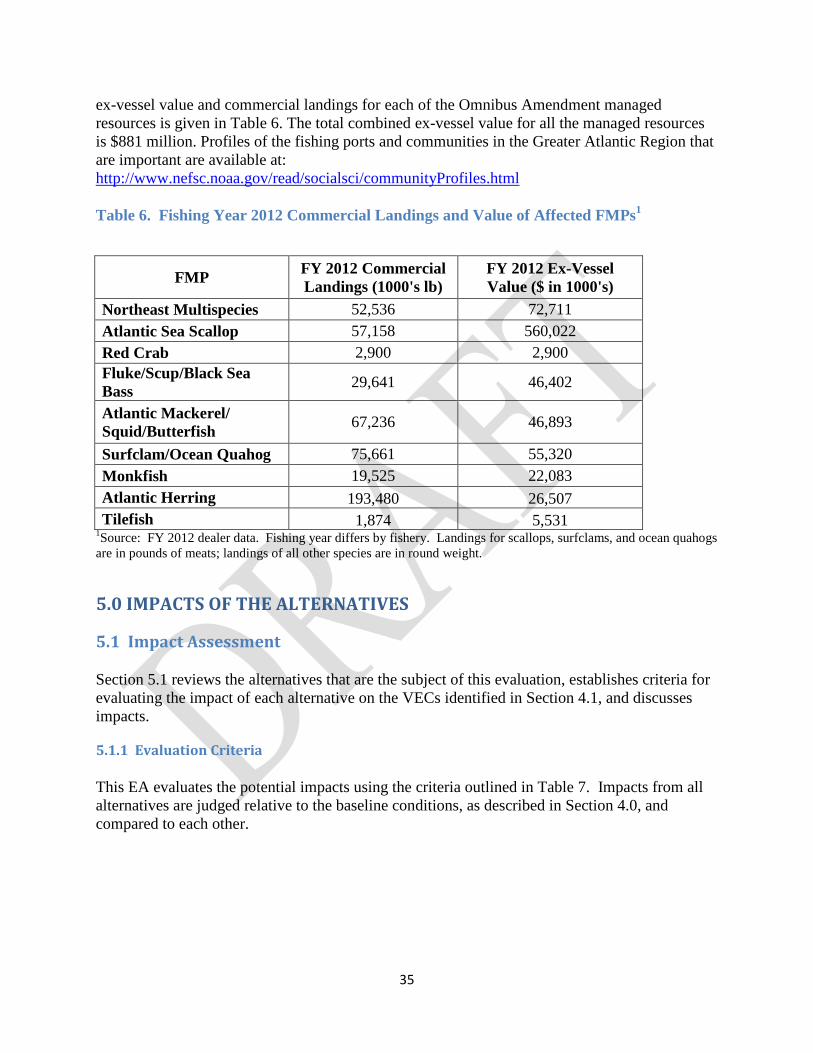
ex-vessel value and commercial landings for each of the Omnibus Amendment managed resources is given in Table 6. The total combined ex-vessel value for all the managed resources is $881 million. Profiles of the fishing ports and communities in the Greater Atlantic Region that are important are available at: http://www.nefsc.noaa.gov/read/socialsci/communityProfiles.html Table 6. Fishing Year 2012 Commercial Landings and Value of Affected FMPs1
FMP FY 2012 Commercial Landings (1000's lb)
FY 2012 Ex-Vessel Value ($ in 1000's)
Northeast Multispecies 52,536 72,711 Atlantic Sea Scallop 57,158 560,022 Red Crab 2,900 2,900 Fluke/Scup/Black Sea Bass 29,641 46,402
Atlantic Mackerel/ Squid/Butterfish 67,236 46,893
Surfclam/Ocean Quahog 75,661 55,320 Monkfish 19,525 22,083 Atlantic Herring 193,480 26,507 Tilefish 1,874 5,531
1Source: FY 2012 dealer data. Fishing year differs by fishery. Landings for scallops, surfclams, and ocean quahogs are in pounds of meats; landings of all other species are in round weight.
5.0 IMPACTS OF THE ALTERNATIVES
5.1 Impact Assessment
Section 5.1 reviews the alternatives that are the subject of this evaluation, establishes criteria for evaluating the impact of each alternative on the VECs identified in Section 4.1, and discusses impacts.
5.1.1 Evaluation Criteria This EA evaluates the potential impacts using the criteria outlined in Table 7. Impacts from all alternatives are judged relative to the baseline conditions, as described in Section 4.0, and compared to each other.
35
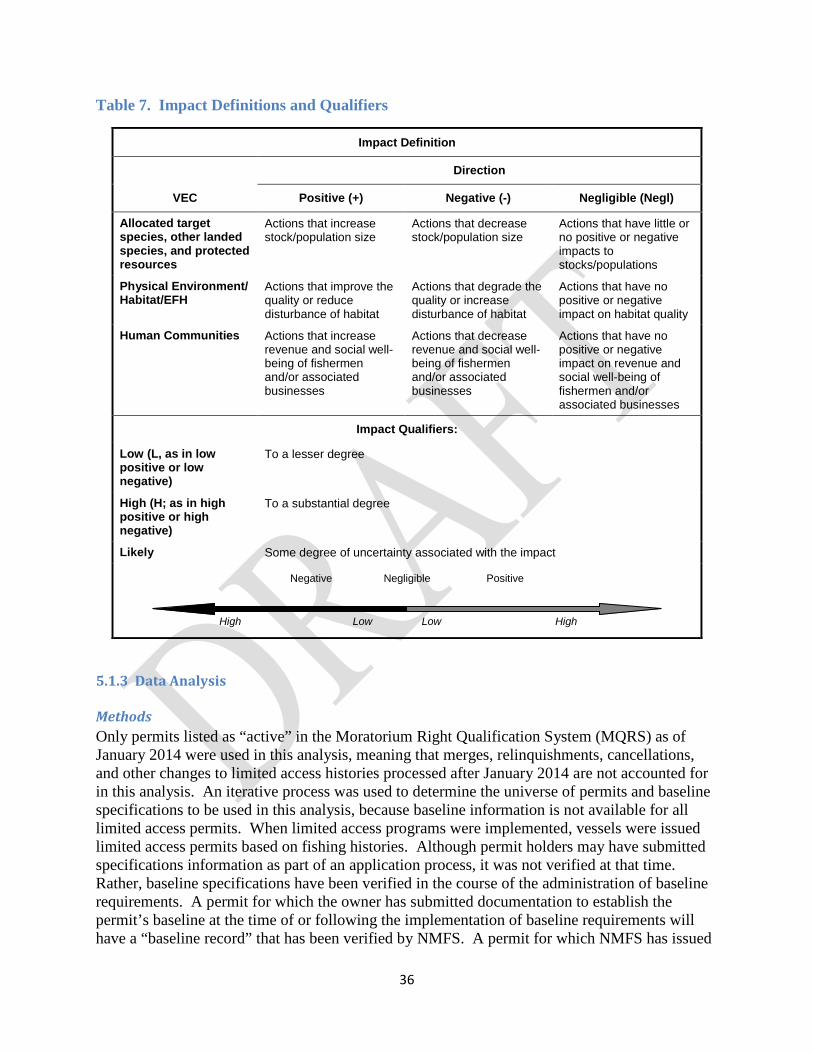
Table 7. Impact Definitions and Qualifiers
Impact Definition
VEC
Direction
Positive (+) Negative (-) Negligible (Negl)
Allocated target species, other landed species, and protected resources
Actions that increase stock/population size
Actions that decrease stock/population size
Actions that have little or no positive or negative impacts to stocks/populations
Physical Environment/ Habitat/EFH
Actions that improve the quality or reduce disturbance of habitat
Actions that degrade the quality or increase disturbance of habitat
Actions that have no positive or negative impact on habitat quality
Human Communities Actions that increase revenue and social well-being of fishermen and/or associated businesses
Actions that decrease revenue and social well-being of fishermen and/or associated businesses
Actions that have no positive or negative impact on revenue and social well-being of fishermen and/or associated businesses
Impact Qualifiers:
Low (L, as in low positive or low negative)
To a lesser degree
High (H; as in high positive or high negative)
To a substantial degree
Likely Some degree of uncertainty associated with the impact
5.1.3 Data Analysis
Methods Only permits listed as “active” in the Moratorium Right Qualification System (MQRS) as of January 2014 were used in this analysis, meaning that merges, relinquishments, cancellations, and other changes to limited access histories processed after January 2014 are not accounted for in this analysis. An iterative process was used to determine the universe of permits and baseline specifications to be used in this analysis, because baseline information is not available for all limited access permits. When limited access programs were implemented, vessels were issued limited access permits based on fishing histories. Although permit holders may have submitted specifications information as part of an application process, it was not verified at that time. Rather, baseline specifications have been verified in the course of the administration of baseline requirements. A permit for which the owner has submitted documentation to establish the permit’s baseline at the time of or following the implementation of baseline requirements will have a “baseline record” that has been verified by NMFS. A permit for which NMFS has issued
Negligible
Positive
Negative
Low High Low High
36
a baseline letter or processed a vessel replacement at some point in time will also have verified baseline specifications. If NMFS has not processed any of these requests for a permit before, verified baseline specifications for that permit may not be on file. NMFS has periodically attempted to update its databases by researching and creating verified baseline records for those permits missing them, but some missing records still remain. Therefore, it was necessary for this analysis to first determine how many limited access permits had verified baseline records and then to infer baseline specifications for those permits that did not.
An initial query revealed that 4,245 (74 percent) of the 5,713 active permits had a verified baseline record. The proportion of permits with verified baseline records varied by fishery, as shown in Table 8. Some reasons for this are that NMFS’s efforts to update its databases focused on the low-hanging fruit first, namely FMPs with few permits like the red crab fishery, or FMPs undergoing major changes to fishing histories, like the NE multispecies fishery with the creation of Potential Sector Contributions (PSCs) in 2010. 1,468 (26 percent) of active permits did not have a verified baseline record, which means it either did not have a baseline record or had an incomplete record. Rather than excluding all of these permits from the analysis, a step-wise method was used to infer baseline specifications for a permit from other limited access permits in its suite. Because no other information was readily available to infer baseline specifications for single permits that are not part of a limited access permit suite, those permits were excluded from the analysis.
1. If all limited access permits in a suite qualified on the same vessel and a verified baseline record existed for one of the permits in the suite, then those baseline specifications were used to substitute missing records for the other permits in the suite.
2. If all limited access permits in a suite qualified on the same vessel, but two or more verified baseline records in the suite differed, then the most restrictive baseline specifications were used to substitute the missing records in the suite.
3. If the permits in a suite qualified on different vessels (a true multiple-baseline suite), then the most restrictive baseline specifications were used to substitute the missing records in the suite.
After this step-wise process was completed, the remaining permits with missing specifications were excluded from the analysis. This approach added an additional 459 baseline records to the analysis for a total of 4,704 permits, or 82 percent of active permits, for analysis.
37

Table 8. Number of Permits Used in Analysis
Fishery # of Permits # of Permits Used
in Analysis % of Permits Used
in Analysis Black sea bass 842 605 72% Summer flounder 954 814 85% Scup 803 625 78% Atlantic herring 99 82 83% Illex squid 79 70 89% Longfin squid 394 361 92% Atlantic mackerel 167 144 86% Mahogany quahog 42 25 60% Monkfish 739 636 86% NE multispecies 1242 1038 84% Atlantic sea scallop 347 298 86% Red crab 5 5 100%
The impacts of the alternatives are dependent on whether they will increase vessel size or horsepower from current specifications. To determine these changes, the baseline specifications for each permit were compared to the current and potential future specifications of each permit under the no action alternative and each alternative. Vessels holding those permits were then binned into ranges of length, tonnage, and horsepower and the frequency was plotted on charts to show the fleet characteristics under each scenario:
• Baseline – The baseline specification of each limited access permit. • Current – The specifications of the vessel currently holding the limited access permit as
of January 2014.5 • Current Maximum – The maximum upgrade allowed under the status quo baseline
regulations. This would be 10 percent of baseline size and 20 percent of baseline horsepower, or the specification as upgraded if the one-time upgrade was used.
• Future Maximum – The maximum upgrade allowed based on the permit’s baseline specifications. This is simply calculated as 10 percent of baseline size and 20 percent of baseline horsepower, unlimited by upgrade history.
A permit suite with multiple baselines would be limited by the most restrictive of its different baselines. However, a permit holder could relinquish the most restrictive permit in order to increase his/her flexibility to upgrade. In order to show the potential impact of the alternatives under either scenario, specifications were plotted for both individual fishery permits and for permit suites (Table 9; Appendix Figures 3-15). Specifications for permit suites were also plotted by region and state according to homeport to show the impact of the alternatives on different geographic areas (Table 10; Appendix Figures 16-29). Gross and net tonnage are
5 Current vessel specifications were obtained from the most recent vessel replacement record in MQRS or, if not available in MQRS, from the Vessel Permit System (VPS).
38

proportional (net tonnage equals ~80-percent of gross tonnage), because net tonnage is typically calculated from gross tonnage using a formula. Therefore, only gross tonnage of permits is shown for comparison. The impacts of the action alternatives on net tonnage would be expected to be proportional. Permits on non-fishing skiffs (< 17 feet) or in confirmation of permit history (CPH) were differentiated from other permits in the plots, because their current specifications were not informative for the comparison. These permits were given a value of “1” for the current length and horsepower specifications, and “0” for the current gross tonnage (some permits that have an actual gross tonnage of “1”). Note that these permits still have baselines and upgrade history associated with them and, when moved to a fishing vessel, would be impacted by the current regulations and alternatives under consideration. For the purpose of this analysis, the relevant comparison for the purpose of determining impacts to the environment is the difference between the current, current maximum, and future maximum specifications.
The number of permits for which the maximum upgrade was used was determined and summarized in Table 11 for each fishery and for all permit suites.
39
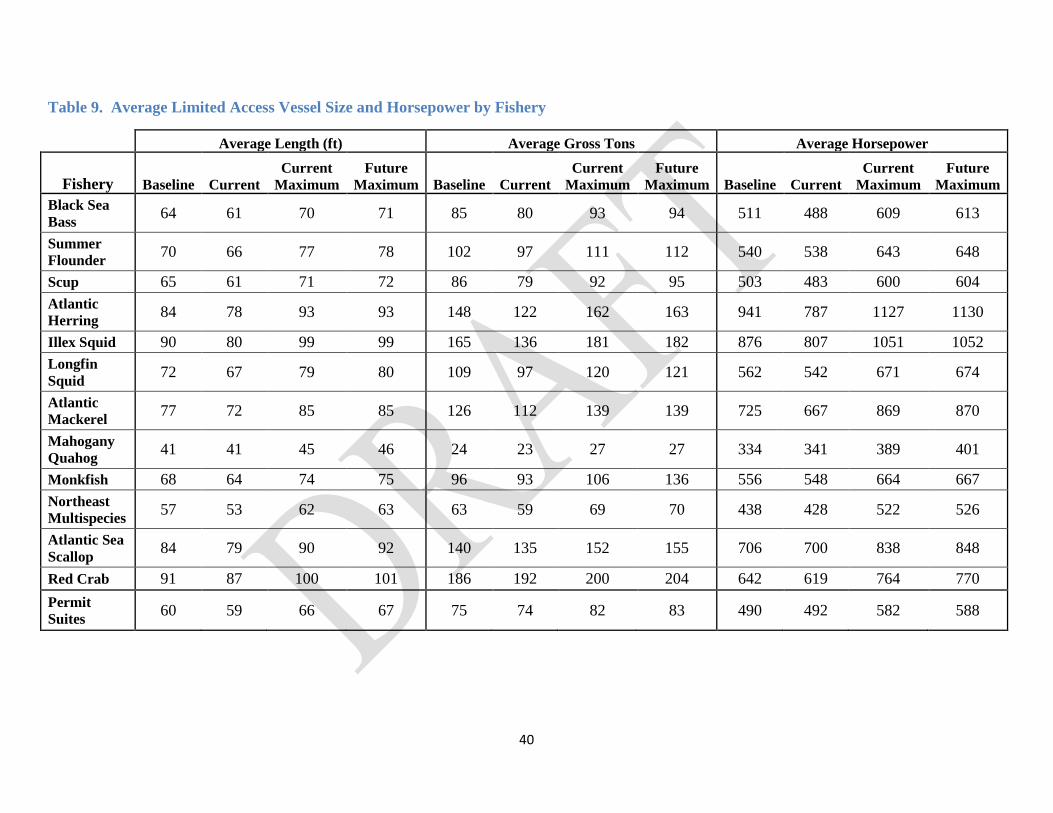
Table 9. Average Limited Access Vessel Size and Horsepower by Fishery
Average Length (ft) Average Gross Tons Average Horsepower
Fishery Baseline Current Current
Maximum Future
Maximum Baseline Current Current
Maximum Future
Maximum Baseline Current Current
Maximum Future
Maximum Black Sea Bass 64 61 70 71 85 80 93 94 511 488 609 613
Summer Flounder 70 66 77 78 102 97 111 112 540 538 643 648
Scup 65 61 71 72 86 79 92 95 503 483 600 604 Atlantic Herring 84 78 93 93 148 122 162 163 941 787 1127 1130
Illex Squid 90 80 99 99 165 136 181 182 876 807 1051 1052 Longfin Squid 72 67 79 80 109 97 120 121 562 542 671 674
Atlantic Mackerel 77 72 85 85 126 112 139 139 725 667 869 870
Mahogany Quahog 41 41 45 46 24 23 27 27 334 341 389 401
Monkfish 68 64 74 75 96 93 106 136 556 548 664 667 Northeast Multispecies 57 53 62 63 63 59 69 70 438 428 522 526
Atlantic Sea Scallop 84 79 90 92 140 135 152 155 706 700 838 848
Red Crab 91 87 100 101 186 192 200 204 642 619 764 770 Permit Suites 60 59 66 67 75 74 82 83 490 492 582 588
40
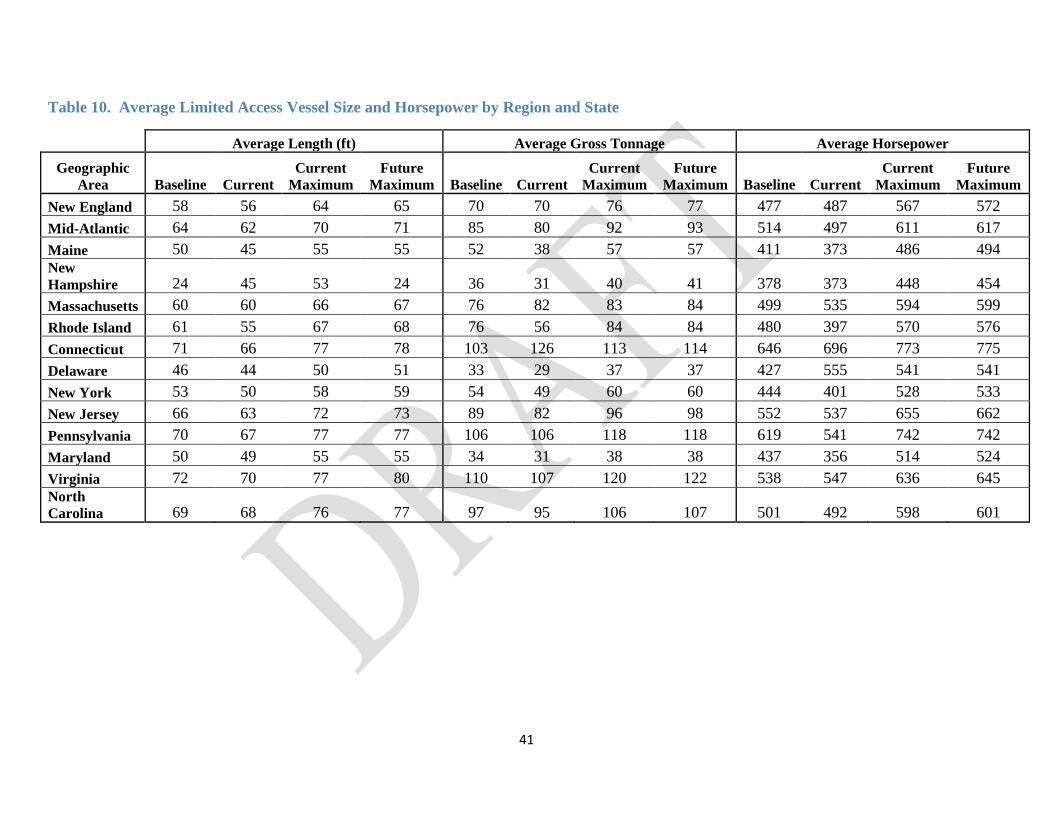
Table 10. Average Limited Access Vessel Size and Horsepower by Region and State
Average Length (ft) Average Gross Tonnage Average Horsepower
Geographic Area Baseline Current
Current Maximum
Future Maximum Baseline Current
Current Maximum
Future Maximum Baseline Current
Current Maximum
Future Maximum
New England 58 56 64 65 70 70 76 77 477 487 567 572 Mid-Atlantic 64 62 70 71 85 80 92 93 514 497 611 617 Maine 50 45 55 55 52 38 57 57 411 373 486 494 New Hampshire 24 45 53 24 36 31 40 41 378 373 448 454 Massachusetts 60 60 66 67 76 82 83 84 499 535 594 599 Rhode Island 61 55 67 68 76 56 84 84 480 397 570 576 Connecticut 71 66 77 78 103 126 113 114 646 696 773 775 Delaware 46 44 50 51 33 29 37 37 427 555 541 541 New York 53 50 58 59 54 49 60 60 444 401 528 533 New Jersey 66 63 72 73 89 82 96 98 552 537 655 662 Pennsylvania 70 67 77 77 106 106 118 118 619 541 742 742 Maryland 50 49 55 55 34 31 38 38 437 356 514 524 Virginia 72 70 77 80 110 107 120 122 538 547 636 645 North Carolina 69 68 76 77 97 95 106 107 501 492 598 601
41
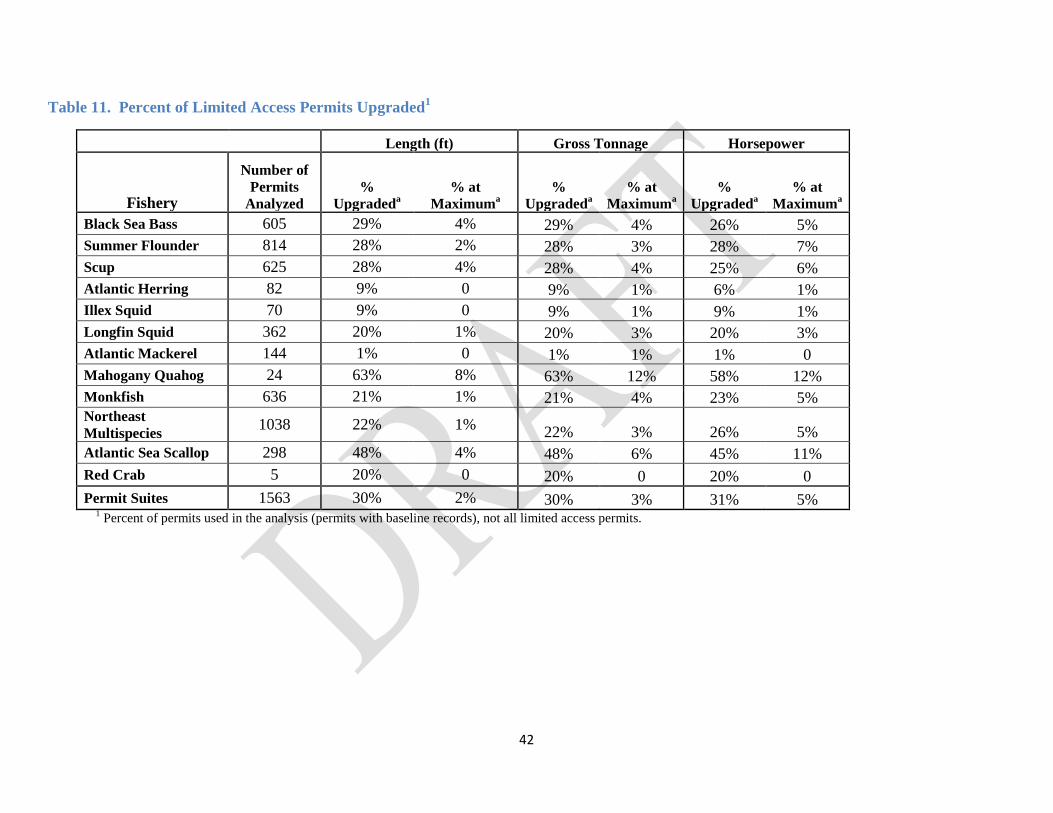
Table 11. Percent of Limited Access Permits Upgraded1
Length (ft) Gross Tonnage Horsepower
Fishery
Number of Permits
Analyzed %
Upgradeda % at
Maximuma %
Upgradeda % at
Maximuma %
Upgradeda % at
Maximuma Black Sea Bass 605 29% 4% 29% 4% 26% 5% Summer Flounder 814 28% 2% 28% 3% 28% 7% Scup 625 28% 4% 28% 4% 25% 6% Atlantic Herring 82 9% 0 9% 1% 6% 1% Illex Squid 70 9% 0 9% 1% 9% 1% Longfin Squid 362 20% 1% 20% 3% 20% 3% Atlantic Mackerel 144 1% 0 1% 1% 1% 0 Mahogany Quahog 24 63% 8% 63% 12% 58% 12% Monkfish 636 21% 1% 21% 4% 23% 5% Northeast Multispecies 1038 22% 1% 22% 3% 26% 5% Atlantic Sea Scallop 298 48% 4% 48% 6% 45% 11% Red Crab 5 20% 0 20% 0 20% 0 Permit Suites 1563 30% 2% 30% 3% 31% 5%
1 Percent of permits used in the analysis (permits with baseline records), not all limited access permits.
42
Results Analysis of permit suites, which accounts for multiple baselines, shows little difference between current maximum and future maximum specifications (Appendix Figure 3). Of the 1,563 permit suites analyzed, 30 percent have upgraded size and 31 percent have upgraded horsepower, but only 2-5 percent of permits have upgraded to their 10/20 maximum size or horsepower (Table 11). 27-28 percent of vessels, if allowed to upgrade again, could further upgrade size to the maximum 20-10-percent. Similarly, 26 percent of vessels could further increase horsepower to the maximum 20-percent. However, as shown in Table 9, average additional increases to already upgraded vessels would be small, as the average current maximum size and horsepower is within a few units of the future maximum. This could mean that on average permit suites that have been upgraded are close to the maximum 10-percent/20-percent allowed. The small differences between average current maximum and average future maximum could also be because 10 percent and 20 percent are not large increases. Most vessels would only be able to graduate to the next size class or stay within the same size class based on that limit. For example, a 40ft vessel would only be able to increase to a 44ft vessel under the future maximum scenario, which would still place it in the 41-50ft size category.
Analysis of individual fishing permits shows similar results. According to Table 9 and Figures 3-15 (Appendix), there is little difference between average and overall fleet composition in vessel size and horsepower under the current maximum and future maximum scenarios. Vessel upgrade history in Table 9 shows that as few as 1 percent (Atlantic mackerel) to as much as 63 percent (ocean quahog) of permits in an individual fishery have upgraded. And between 0 and 8 percent upgraded to their maximum length, and 0-12 percent upgraded to their maximum horsepower. Between 37-99 percent of permits for an individual fishery have yet to be upgraded, and could upgrade to the maximum 10/20 under current regulations. However, incorporating permit suites, this number is closer 70 percent for size and 69 percent for horsepower (Table 9). Plots of vessel size frequency by individual fishery shows that vessel size frequency under the current maximum scenario (status quo regulations) is little different than under the future maximum scenario (removing one-time upgrade limit) (Appendix Figure 3-15). This may be because most permits that have been upgraded have been upgraded close to the maximum allowed, or because a 10 or 20-percent increase was not a sufficient change to shift a vessel from one size category to another. One exception is the shift from the 31-40ft to 41-50ft category for mahogany quahog. This could be because some vessels in the 31-40ft category are close to the 41ft category already and would only require a small change to graduate to the next size category (Appendix Figure 11). This change would not appear as drastic if the size category were defined as 36-45ft, in which a change from 40ft to 41ft would not be visible in the plot. Additionally there are only 24 permits analyzed, so a size change of just a few permits would represent a large percentage of the fishery. This could also explain differences in the red crab fishery size frequency (Appendix Figure 15). There appears to be some room for growth in vessel length in the 61-70ft, 71-80ft, and 81-90ft categories in the scallop fishery. This could be because these vessel sizes are large, so a 10 percent change to a 65ft vessel would easily move it into the next size category at 71.5ft. Average vessel size and vessel size frequency by region and state also demonstrated little difference for most fleets between the current maximum and future maximum scenarios (Table
43
10; Appendix Figures 16-29). There are substantial changes in Delaware vessel size and horsepower frequency and in length frequency for Virginia permits between the larger size categories (Appendix Figures 26-28). But given that there is little average room for increase between current and future maximum in Table 10, this may be due to a small sample size (only 5 permits were analyzed for Delaware), or because a permit’s current maximum is already at the upper end of a size category.
5.1.4 Impacts of the Alternative 1 – No Action Alternative
Under the No Action Alternative, all vessel baseline specifications and upgrade restrictions would remain in place. Baselines would continue to be defined by vessel length overall, gross tonnage, net tonnage, and horsepower. Permit holders would continue to be limited to a one-time upgrade of the vessel size and horsepower specifications. Whether this action would impact target or non-target species depends upon whether the alternative would be expected to undermine measures in place to control fishing mortality by increasing harvest capacity or fishing effort. Based on the results summarized in Section 5.1.3, the majority of permit suites have not yet used the one-time size upgrade or one-time horsepower upgrade. These permits could be upgraded under the No Action Alternative to the maximum increase of 10 percent of size and 20 percent of horsepower. Increased size may allow a vessel to retain more fish per trip, take longer trips, or travel farther from shore. Increased horsepower may allow a vessel to tow a larger dredge or net, thereby increasing catch per DAS or per trip. However, the allowable changes to vessel size and horsepower are small and would not be expected to change a vessel’s fishing behavior. In addition, a permit holder’s ability to upgrade his/her vessel is dependent upon finding a suitable vessel that falls within the upgrade limits. The fact that these permits have not yet been upgraded may suggest that suitable vessels are limited, or current economic conditions are not favorable for a vessel replacement. Furthermore, there are ACLs and AMs in all New England and Mid-Atlantic FMPs to limit overall fishing mortality, as well as inseason management measures to manage fishing effort or catch to within those limits. Bycatch caps or sub-ACLs also exist for fisheries that have substantial bycatch of certain non-target species (e.g., haddock catch caps for the herring fishery, river herring and shad caps for the herring and mackerel fisheries). Total mortality of a fish stock would still be limited by these caps and when the ACL is caught, vessels would have to stop fishing. If the ACL is exceeded, an AM would be triggered that would further limit catch or effort in the following year. Therefore, the No Action Alternative would be expected to have negligible impacts to target and non-target and bycatch species. As described above, a slightly larger size or more powerful engine is not likely to substantially change the area or amount of time fished, or gear type fished, by an individual vessel. In addition, there are closed areas and gear restrictions in place to minimize the adverse effects of fishing on habitat. Vessels would still have to comply with regulations implemented by Take Reduction Plans and Incidental Take Statements to reduce or otherwise mitigate the impact of fishing on protected resources. Thus, the No Action Alternative would be expected to have negligible impacts to the physical environment/habitat/EFH and protected resources. Increased size or horsepower may enable an individual vessel to increase its catch per DAS or per trip and, therefore, its proportion of the catch when compared to other vessels. However, as
44
all permits are allowed an upgrade to size and horsepower, it is unlikely that one vessel would substantially increase its share of the catch compared to other vessels. Permits that have not already upgraded would be able to do so under the No Action Alternative, which could improve safety. However, the fact that these permits have not upgraded may suggest that suitable vessels are not available. There would be no change under this alternative to the administrative costs or burden to permit holders or NMFS from the existing baseline regulations. The 26-28 percent of permit holders that have already used a one-time upgrade, but have not upgraded to the maximum allowed, would continue to be constrained by the one-time limit and would not be able to further upgrade. This could limit operational flexibility for some permit holders. Therefore, the No Action Alternative would be expected to have a low negative impact to human communities.
5.1.5 Impacts of Alternative 2 – Eliminate One-Time Limit on Vessel Upgrades Under Alternative 2, the one-time limit on size and horsepower upgrade would be eliminated. A vessel would still be restricted by the 10 percent cap on size upgrades and 20 percent cape on horsepower upgrades, but would be able to make incremental increasing without losing the ability to make later upgrades, up to the caps. Under Alternative 2, permits that have been previously upgraded, but did not upgrade to the maximum size or horsepower allowed, would be able to upgrade to within 10 percent of size and 20 percent of horsepower. From Table 11 as many as 26-28 percent of permit suites would be able to be further upgraded, in addition to the 70 percent that have not used a one-time upgrade at all. Whether Alternative 2 would impact target or non-target species depends upon whether these changes would be expected to undermine measures in place to control fishing mortality by increasing harvest capacity or fishing effort. As summarized in Section 5.1.3, because the 10/20 limits would remain in place, average increases from current maximum to future maximum specifications are very small and would not be likely to substantially change fishing behavior. Even if a vessel were able to increase its catch or effort under these small changes, other management measures, such as DAS, trip limits and individual quotas, would continue to limit the fishing mortality and effort of individual vessels. In addition, bycatch caps, ACLs and AMs would continue to be a back-stop to any unexpected increases in fishing mortality. A permit holder that has not yet upgraded his/her permit may elect not to upgrade it to the maximum, because the opportunity to do so in the future would be preserved under Alternative 2. Therefore, it is unlikely any increase of vessel size or horsepower as a result of removing the one-time upgrade limit would undermine existing management measures. When compared to the No Action Alternative, impacts to target and non-target species and bycatch from Alternative 2 would be expected to be negligible.
Although Alternative 2 would allow vessels that have already upgraded to further increase size or horsepower, such changes would not be expected to change fishing behavior. Size or horsepower upgrades under Alternative 2 would not be expected to change the area or amount of time fished, or the gear type fished. Existing measures to minimize and reduce impacts of fishing to habitat and protected resources such as closed areas and gear restrictions would remain in place. Therefore, Alternative 2 would be expected to have negligible impacts to the physical environment/habitat/EFH and protected resources relative to the No Action Alternative.
45
Alternative 2 would increase flexibility when compared to the No Action Alternative for the 26-28 percent of permit holders that used the one-time upgrade but did not upgrade to the maximum allowed (Table 11). Although average changes in vessel size or horsepower as a result of this alternative would be small, this could provide limited operational flexibility and increased safety for some permit holders that are able to upgrade to a suitable vessel. Alternative 2 would preserve a permit holder’s ability to upgrade to the maximum 10/20 allowed after making a smaller upgrade. This could allow some permit holders that may not have otherwise upgraded their vessels to do so.
Removing the one-time upgrade limit would simplify administration of vessel baselines by eliminating the need for permit holders and NMFS to determine whether a permit already used its one-time upgrade at some point in its history. This research can be a substantial time and cost burden for a permit holder and NMFS, especially if the permit has changed hands several times. However, is important to determine whether the one-time upgrade was used to ensure that a new permit owner can transfer the permit to their desired vessel. For example, Owner A has a 44ft vessel he wishes to purchase a permit for. He finds Owner B, who has a permit for sale on a 40ft vessel. Owner A’s vessel falls within the 10-percent size upgrade limit on Owner B’s permit, so he decides to purchase the permit from Owner B. However, upon requesting a baseline letter from NMFS, Owner A learns that 15 years ago the permit was temporarily transferred to a 42ft vessel, using up the permit’s one-time size upgrade. Because the one-time upgrade was used, Owner A cannot transfer the permit he wished to purchase to his own vessel, even if the vessel’s other specifications fit the permit, and he decides not to buy the permit. Under Alternative 2, Owner A would not be limited by the previous upgrade on the permit and would be able to purchase the permit. Under this alternative, NMFS and the permit holder would simply have to determine the permit’s baseline and whether the replacement vessel falls within the allowable 10 percent of size and 20 percent of horsepower. This may negate the need for a permit holder to hire a third party to research his/her vessel and permit history, which would costs for permit holders for complying with this requirement. Similarly, eliminating the one-time upgrade limit would also reduce the amount of time and resources NMFS must expend researching permit and vessel histories, reducing costs to the government. Permit holders may no longer need to request baseline letters to confirm a permit’s upgrade history, which could reduce the number of requests NMFS must process. NMFS estimated that it processes an average of 331 applications for vessel replacements and baseline letters that involve baseline verifications each year, requiring approximately 4,000hrs to process at an average cost of $150,000. A streamlined, less time-intensive process could be a substantial cost savings and allow for staff time to be reallocated to other services. Therefore, Alternative 2 would be expected to have low positive impacts to human communities relative to the No Action Alternative.
5.1.6 Impacts of Alternative 3 – Eliminate Tonnages from Vessel Baselines Under Alternative 3, gross and net tonnage would be eliminated from vessel baselines. A permit’s baseline would consist of only length overall and horsepower. Upgrades would
46

continue to be limited to a one-time increase within 10 percent of length overall and 20 percent of horsepower. Alternative 3 would allow a permit holder to choose a replacement vessel based on its length and horsepower. It appears from Table 11) that some permits reached the maximum tonnage upgrade allowed but not the maximum length. This suggests that, although vessel tonnage and length are correlated, tonnage can be limiting in some cases. Under Alternative 3, a permit holder may be able to achieve the maximum vessel length upgrade compared to the No Action Alternative, being unlimited by tonnage. This may result in increases to tonnage greater than the 10 percent allowed under the No Action Alternative. However, such increases would likely be small as upgrades to length overall would still be limited by the 10 percent cap. Even if a vessel were able to increase its catch or effort under Alternative 3, other management measures, such as DAS, trip limits, and individual quotas would continue to limit fishing mortality and effort from individual vessels. In addition, ACLs and AMs would continue to be a back-stop to any unexpected increases in fishing mortality. Therefore, it is unlikely any increase of vessel size or horsepower as a result of removing tonnages from vessel baselines would undermine existing management measures. When compared to the No Action Alternative, impacts to target and non-target species and bycatch from Alternative 3 would be expected to be negligible. In addition, although Alternative 3 may allow some increases in vessel size that would not otherwise be possible under the No Action Alternative, it would not be expected to substantially change the area or amount of time fished or gear type fished by individual vessels. In addition, existing measures to minimize impacts of fishing on habitat and protected resources, including closed areas and gear restrictions would remain in place. Therefore, Alternative 3 would be expected to have negligible impacts to the physical environment/habitat/EFH and protected resources relative to the No Action Alternative and Alternative 2. Alternative 3 may increase operational flexibility for some permit holders compared to the No Action Alternative if eliminating limits on tonnage for replacement vessels provides a broader range of replacement vessels to choose from. Alternative 3 would simplify the replacement process for permit holders and NMFS when compared to the No Action Alternative. Removing tonnages from vessel baselines would eliminate the need for a permit holder to research his/her permit history to determine its baseline tonnage. It could also simplify or, if only length verification would be otherwise needed, eliminate the need to have the vessel surveyed to determine and document tonnage. Tonnage documentation can be an additional expense because it must be completed by a naval architect, as opposed to a simple marine survey to verify only length. NMFS estimates an average cost savings of as much as $375 per survey. It would also eliminate the need for NMFS and the permit holder to determine whether tonnage had been upgraded previously in the permit’s history. This may negate the need for a permit holder to a third party to research a permit’s history and prepare the vessel replacement application. Estimates of the costs for these third party services were not available, but NMFS estimates that permit holders spend an average of 3 hours, or $270 in labor cost, annually preparing vessel replacement applications. Alternative 3 would reduce the amount of time and resources NMFS must expend researching permit and vessel histories, reducing costs to the government. Therefore, Alternative 3 would be
47
expected to have low positive impacts to human communities relative to the No Action Alternative. Alternative 3 would be expected to provide less positive impacts to human communities than Alternative 2, because fewer permit holders appear to have been limited by tonnages during vessel upgrades, than by the one-time upgrade limit overall (Table 11).
5.1.7 Impacts to Alternative 4 – Eliminated Both Tonnages and Upgrade Limit Under Alternative 4, gross and net tonnage would be eliminated from baseline specifications and the one-time limit on size and horsepower upgrades would also be eliminated. A permit’s baseline would consist of only the length overall and horsepower of its baseline vessel. And a vessel would still be restricted by the 10-percent cap on size upgrades, but only for length overall, and 20-percent cap on horsepower upgrades. Under Alternative 4, permits that have been previously upgraded, but did not upgrade to the maximum size or horsepower allowed, would be able to upgrade to within 10 percent of size and 20 percent of horsepower. From Table 11 as many as 26-28 percent of permit suites would be able to be further upgraded, in addition to the 70 percent that have not used a one-time upgrade at all. Alternative 4 would also allow a permit holder to choose a replacement vessel based on its length and horsepower only. It appears from Table 11 that some permits reached the maximum tonnage upgrade allowed but not the maximum length. This suggests that, although vessel tonnage and length are correlated, tonnage can be limiting in some cases. Under Alternative 4, a permit holder may be able to achieve the maximum vessel length upgrade, when compared to the No Action Alternative, being unlimited by tonnage. This may result in increases to tonnage greater than the 10 percent allowed under the No Action Alternative. However, such increases would likely be small as upgrades to length overall would still be limited by the 10 percent cap.
As summarized in Section 5.1.3, average available increases from current maximum to future maximum specifications are very small. Even if a vessel were able to increase its catch or effort under Alternative 4, other management measures such as DAS, trip limits, and individual quotas would continue to limit fishing mortality and effort from individual vessels. In addition, ACLs and AMs would continue to be a back-stop to any unexpected increases in fishing mortality. A permit holder that has not yet upgraded his/her permit may elect not to upgrade it to the maximum, because the opportunity to do so in the future would be preserved under Alternative 4. Therefore, it is unlikely any increase of vessel size or horsepower as a result of removing the one-time upgrade limit would undermine existing management measures. When compared to the No Action Alternative, impacts to target and non-target species and bycatch from Alternative 4 would be expected to be negligible. Alternative 4 would allow vessels that have already upgraded to further increase size or horsepower. However, such small increases would not be expected to change the overall fishing behavior of individual vessels. Size or horsepower upgrades under Alternative 4 would not be expected to change the area or amount of time fished, or the gear type fished. Furthermore, existing measures to minimize and reduce impacts of fishing to habitat and protected resources such as closed areas and gear restrictions would remain in place. Therefore, Alternative 4 would be expected to have negligible impacts to the physical environment/habitat/EFH and protected resources relative to the No Action Alternative and Alternatives 2 and 3.
48

Alternative 4 would provide greater operational flexibility for permit holders than the No Action Alternative and Alternatives 2 and 3. The 26-28 percent of permit holders that used a one-time upgrade but did not upgrade to the maximum allowed would be allowed to do so under Alternative 4 (Table 11). Although average changes in vessel size or horsepower as a result of this alternative would be small, it could provide limited operational flexibility and increased safety for some permit holders that are able to upgrade to a suitable vessel. Alternative 2 would preserve a permit holder’s ability to upgrade to the maximum 10/20 allowed after making a smaller upgrade. This could allow some permit holders to make an upgrade that might otherwise not have done so. This provides greater flexibility than Alternatives 1 and 3. By eliminating limits on tonnage for replacement vessels, Alternative 4 may provide a broader choice of replacement vessels for permit holders, when compared to Alternatives 1 and 2. Although average changes in vessel size or horsepower as a result of this alternative would be small, it could provide some operational flexibility for some permit holders and may increase safety if they can upgrade to a slightly larger or more powerful vessel. Removing the one-time upgrade limit would also simplify administration of vessel baselines by eliminating the need for permit holders and NMFS to determine whether a permit already used its one-time upgrade or an upgrade to tonnage at some point in its history. This research can be a substantial time and cost burden for a permit holder and NMFS, especially if the permit has changed hands several times. However, as illustrated by the example given under Alternative 2 (Section 5.1.5) is important to determine whether the one-time upgrade was used to ensure that a permit would “fit” the desired vessel. Similar to Alternative 2, under Alternative 4 a permit holder would not be limited by previous upgrades made to a permit. Under this alternative, NMFS and the permit holder would simply have to determine the permit’s baseline length and horsepower and whether the replacement vessel falls within the 10 and 20 percent caps. Removing tonnages from vessel baselines may also simplify or eliminate the need for a permit holder to hire a naval architect to determine and document tonnage if it was not previously established. NMFS estimates an average cost savings of as much as $375 per survey. A simpler process may negate the need for a permit holder to hire a third party to research the permit’s history and prepare the replacement application. Estimates of the costs for these third party services were not available, but NMFS estimates that permit holders spend an average of 3 hours, or $270 in labor cost, annually preparing vessel replacement applications. Similarly, eliminating tonnages and the one-time limit on upgrades may reduce the amount of time and resources NMFS must expend to research vessel and permit histories and process vessel replacements, reducing costs to the government. Permit holders may no longer need to request baseline letters to confirm a permit’s upgrade history, which could reduce the number of requests NMFS must process. NMFS estimated that it processes an average of 331 applications for vessel replacements and baseline letters involving baseline verifications each year, requiring approximately 4,000hrs to process at an average cost of $150,000. A streamlined, less time-intensive process could be a substantial cost savings and allow staff time to be reallocated to other services. Therefore, relative to Alternative 1, Alternative 4 would be expected to have low positive impacts to human communities. Because Alternative 4 removes both the one-time upgrade limit and baseline tonnages, it would be expect to have more positive impacts to the
49
human environment than Alternatives 2 and 3, while continuing to meet the goals and objectives set forth by the Councils in the applicable FMPs.
5.2 Cumulative Effects Analysis The Center for Environmental Quality (CEQ) regulations implementing NEPA (40 CFR Part 1508.25) reference the need for a cumulative effects analysis (CEA). CEQ regulations define cumulative impacts as “the impact on the environment which results from the incremental impact of the action when added to other past, present, and reasonably foreseeable future actions regardless of what agency (federal or non-federal) or person undertakes such other action.” The purpose of a CEA is to consider the effects of the Proposed Action combined with the effects of many other actions on the human environment. The CEA assesses impacts that would be missed if each action were evaluated separately. CEQ guidelines recognize that it is not practical to analyze the cumulative effects of an action from every conceivable perspective, but, rather, the intent is to focus on those effects that are truly meaningful. The CEA baseline condition consists of the present condition of the VECs plus the combined effects of past, present and reasonably foreseeable future actions which are described below. The present condition of the VECs is described in the affected environment (Section 4.0). This CEA assesses the combined impact of the direct and indirect effects of the preferred alternative (Proposed Action) with the impact from the past, present, and reasonably foreseeable future fishing actions. Additionally, it assesses factors external to the fisheries that affect the physical, biological, and socioeconomic resource components of the fisheries environment. The Councils have not yet selected a preferred alternative for this action on which to base this CEA. However, the impacts to the environment from the different alternatives are relatively similar, so this CEA provides a general analysis for the purposes of public comment on the draft EA. This CEA will be updated once the Councils have selected their preferred alternative. This analysis focuses on the VECs (see below) and compares the impacts of the changes to baseline regulations (Proposed Action) with the impacts of existing baseline regulations (No Action Alternative) as currently regulated by the FMPs and subsequent actions. The impacts of the No Action Alternative were previously assessed in the EIS and EAs associated with these actions (summarized in Section 1.0). Valued Ecosystem Components (VECs): The CEA focuses on VECs specifically including:
• Physical environment/habitat/EFH;
• Target species;
• Non-target species and bycatch;
• Protected resources; and
• Human communities/social-economic environment. Temporal and Geographic Scope of the Analysis: The temporal range considered for the habitat, target species, non-target species and bycatch, and human communities VECs, is primarily focused on the original FMPs and amendments that implemented limited access programs and associated baseline restrictions, beginning in 1977 with the surfclam/quahog
50
fishery. This range encompasses the major management actions that governed fisheries regulations in the Mid-Atlantic and New England in recent history, including recent FMP amendments that implemented the ACLs and AMs that make up the current fisheries management regime. This time period also covers the previous actions that established or revised baseline regulations in Mid-Atlantic and New England fisheries, as summarized in Section 1.0. The temporal range considered for the protected resources VEC begins in the 1990’s when NMFS started generating stock assessments for marine mammals and developed recovery plans for sea turtles that inhabit waters of the U.S. EEZ. The temporal scope of future actions for all VECs extends five years into the future (2019). This period was chosen because the dynamic nature of resource management and the lack of specific information on future projects make it difficult to predict impacts beyond this timeframe. The geographic scope considered for cumulative effects to physical environment/habitat/EFH, target species, and non- target species and bycatch consists of the range of species and geographic areas discussed in Sections 4.2-4.4 (Affected Environment). The range of each endangered and protected species as presented in Section 4.5 is the geographic scope for that VEC. The geographic scope for the human communities consists of those primary port communities from which vessels originate and/or land their catch, as discussed in Section 4.6.
5.2.1 Summary of Direct and Indirect Impacts of Proposed Action As discussed previously, the Councils have not yet selected a preferred alternative (Proposed Action) for this amendment. The Action discussed in this analysis refers to any of the alternatives under consideration in the amendment. Table 12 summarizes the direct and indirect effects on the VECs from eliminating the one-time limit on vessel upgrades (Alternative 2), eliminating tonnages from vessel baselines (Alternative 3), and eliminating the one-time upgrade limit and baseline tonnages (Alternative 3) compared to what the impacts would be if the baseline regulations remained unchanged (Alternative 1: No Action) The impacts to target and non-target species and bycatch from removing the one-time limit on vessel upgrades (Alternative 2) would be negligible. The effects from Alternative 2 to the physical environment/habitat/EFH and protected resources would also be expected to be negligible. Removing the one-time limit on vessel upgrades would have low positive impacts to human communities relative to the No Action Alternative (for full discussion, see Section 5.1.5). The effects of removing tonnages from vessel baselines (Alternative 3) would be expected be negligible on the physical environment/habitat/EFH, target species, non-target species and bycatch, and protected resources. Removing tonnage baselines would be expected to have a low positive impact to human communities relative to the No Action Alternative, but less than Alternative 2 (for full discussion, see Section 5.1.6). Eliminating both the one-time upgrade limit and baseline tonnages (Alternative 4) would have negligible impacts to the physical environment/habitat/EFH, target species, non-target species and bycatch, and protected resources. Alternative 4 would be expected to have low positive
51
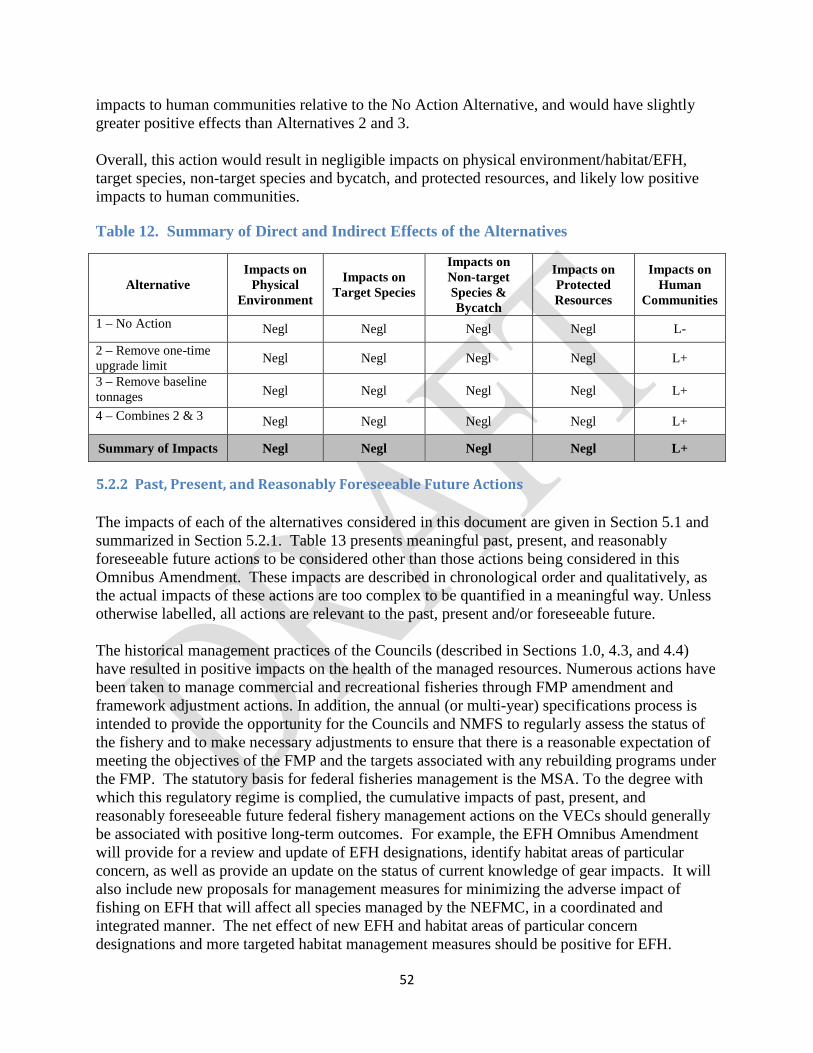
impacts to human communities relative to the No Action Alternative, and would have slightly greater positive effects than Alternatives 2 and 3. Overall, this action would result in negligible impacts on physical environment/habitat/EFH, target species, non-target species and bycatch, and protected resources, and likely low positive impacts to human communities.
Table 12. Summary of Direct and Indirect Effects of the Alternatives
Alternative Impacts on
Physical Environment
Impacts on Target Species
Impacts on Non-target Species & Bycatch
Impacts on Protected Resources
Impacts on Human
Communities
1 – No Action Negl Negl Negl Negl L- 2 – Remove one-time upgrade limit Negl Negl Negl Negl L+
3 – Remove baseline tonnages Negl Negl Negl Negl L+
4 – Combines 2 & 3 Negl Negl Negl Negl L+
Summary of Impacts Negl Negl Negl Negl L+
5.2.2 Past, Present, and Reasonably Foreseeable Future Actions The impacts of each of the alternatives considered in this document are given in Section 5.1 and summarized in Section 5.2.1. Table 13 presents meaningful past, present, and reasonably foreseeable future actions to be considered other than those actions being considered in this Omnibus Amendment. These impacts are described in chronological order and qualitatively, as the actual impacts of these actions are too complex to be quantified in a meaningful way. Unless otherwise labelled, all actions are relevant to the past, present and/or foreseeable future. The historical management practices of the Councils (described in Sections 1.0, 4.3, and 4.4) have resulted in positive impacts on the health of the managed resources. Numerous actions have been taken to manage commercial and recreational fisheries through FMP amendment and framework adjustment actions. In addition, the annual (or multi-year) specifications process is intended to provide the opportunity for the Councils and NMFS to regularly assess the status of the fishery and to make necessary adjustments to ensure that there is a reasonable expectation of meeting the objectives of the FMP and the targets associated with any rebuilding programs under the FMP. The statutory basis for federal fisheries management is the MSA. To the degree with which this regulatory regime is complied, the cumulative impacts of past, present, and reasonably foreseeable future federal fishery management actions on the VECs should generally be associated with positive long-term outcomes. For example, the EFH Omnibus Amendment will provide for a review and update of EFH designations, identify habitat areas of particular concern, as well as provide an update on the status of current knowledge of gear impacts. It will also include new proposals for management measures for minimizing the adverse impact of fishing on EFH that will affect all species managed by the NEFMC, in a coordinated and integrated manner. The net effect of new EFH and habitat areas of particular concern designations and more targeted habitat management measures should be positive for EFH.
52
Constraining fishing effort through regulatory actions can often have negative short-term socio-economic impacts. These impacts are usually necessary to bring about long-term sustainability of a given resource, and as such, should, in the long-term, promote positive effects on human communities, especially those that are economically dependent upon the managed resources.
Non-fishing activities that introduce chemical pollutants, sewage, changes in water temperature, salinity, dissolved oxygen, and suspended sediment into the marine environment pose a risk to all of the identified VECs. Human-induced non-fishing activities tend to be localized in near shore areas and marine project areas where they occur. Some examples of these activities and their impacts on the VECs are described below. Construction/Development Activities and Projects: Construction and development activities include, but are not limited to, point source pollution, agricultural and urban runoff, land (roads, shoreline development, wetland loss) and water-based (beach nourishment, piers, jetties) coastal development, marine transportation (port maintenance, shipping, marinas), marine mining, dredging and disposal of dredged material and energy-related facilities. All these activities are discussed in detail in Johnson et al. (2008). These activities can introduce pollutants (through point and non-point sources), cause changes in water quality (temperature, salinity, dissolved oxygen, suspended solids), modify the physical characteristics of a habitat or remove/replace the habitat altogether. Many of these impacts have occurred in the past and present and their effects would likely continue in the reasonably foreseeable future. It is likely that these projects would have negative impacts caused from disturbance, construction, and operational activities in the area immediately around the affected project area. However, given the wide distribution of the affected species, minor overall negative effects to offshore habitat, protected resources, allocated target stocks, and non-allocated target species and bycatch are anticipated since the affected areas are localized to the project sites, which involve a small percentage of the fish populations and their habitat. Thus, these activities for most biological VECs would likely have an overall low negative effect due to limited exposure to the population or habitat as a whole. Any impacts to inshore water quality from these permitted projects, including impacts to planktonic, juvenile, and adult life stages, are uncertain but likely minor due to the transient and limited exposure. It should be noted that wherever these activities co-occur, they are likely to work additively or synergistically to decrease habitat quality. As such, they may indirectly constrain the sustainability of the allocated target stocks, non-allocated target species and bycatch, and protected resources.
Restoration Projects: Regional projects that are restorative or beneficial in nature include estuarine wetland restoration, offshore artificial reef creation, and eelgrass (Zostera marina) restoration. These types of projects improve habitats, including nursery habitats for several commercial species. Due to past and present adverse impacts from human activities on these types of habitat, restorative projects likely have slightly positive effects at the local level.
Energy Projects: Cape Wind Associates proposes to construct a wind farm on Horseshoe Shoal, located between Cape Cod and Nantucket Island in Nantucket Sound, Massachusetts. The Cape Wind Associates project would have 130 wind turbines located as close as 4.1 miles off the shore of Cape Cod in an area of approximately 24 square miles with the turbines being placed at a minimum of 1/3 of a mile apart. The turbines would be interconnected by cables, which would relay the energy to the shore-based power grid. If constructed, the turbines would preempt other
53

bottom uses in an area similar to oil and natural gas leases. The potential impacts associated with the Cape Wind Associates offshore wind energy project include the construction, operation, and removal of turbine platforms and transmission cables; thermal and vibration impacts; and changes to species assemblages within the area from the introduction of vertical structures.
The Bureau of Ocean Energy Management (BOEM) published Notice of Intent to Prepare an Environmental Impact Statement for Potential Commercial Wind Lease Issuance and Approval of Construction and Operations Plan Offshore Maine” was published in the Federal Register on August 10, 2012. Statoil NA’s proposed project, Hywind Maine, would consist of four 3- megawatt (MW) floating wind turbine generators (WTGs) configured for a total of 12 MW. The project would be located in water depths greater than 100 meters approximately 12 nautical miles off the coast of Maine. Statoil NA’s short-term objective is to construct the Hywind Maine project to demonstrate the commercial potential of the existing floating offshore Hywind technology. The company’s long-term objective is to construct a full-scale, deepwater floating wind turbine facility that leverages economies of scale as well as technical and operational enhancements developed in the Hywind Maine project. The full-scale project would be subject to a subsequent and separate leasing and environmental review process.
BOEM also prepared an EA in July of 2013 considering the reasonably foreseeable environmental impacts and socioeconomic effects of issuing renewable energy leases and subsequent site characterization activities (geophysical, geotechnical, archaeological, and biological surveys needed to develop specific project proposals on those leases) in an identified Wind Energy Area on the OCS offshore Rhode Island and Massachusetts. This EA also considers the reasonably foreseeable environmental impacts associated with the approval of site assessment activities (including the installation and operation of meteorological towers and buoys) on the leases that may be issued in the Wind Energy Area.
Other offshore projects that can affect VECs include the construction of offshore liquefied natural gas facilities such as the Neptune liquefied natural gas facility approximately 10 miles off the coast of Gloucester, Massachusetts. The liquefied natural gas facility consists of an unloading buoy system where specially designed vessels moor and offload their natural gas into a pipeline, which delivers the product to customers in Massachusetts and throughout New England. As it related to the impacts of this Action, the Neptune liquefied natural gas facility is expected to have small, localized impacts where the pipelines and buoy anchors contact the bottom.
On December 1, 2010, the Obama administration announced there would be at least a seven year moratorium on oil and natural gas exploration on the Atlantic coast.
In addition to guidelines mandated by the MSA, NMFS reviews these types of effects through the review processes required by Section 404 of the Clean Water Act and Section 10 of the Rivers and Harbors Act for certain activities that are regulated by federal, state, and local authorities. The jurisdiction of these activities is in "waters of the U.S." and includes both riverine and marine habitats. Most of the impacts from these aforementioned activities are uncertain but would likely range from negative to low negative in the immediate areas of the project site. However, on a larger-scale population level, these activities are likely to have a low negative to negligible impact considering that the large portion of the populations have a limited
54
or negligible exposure to these local non-fishing perturbations and that existing regulatory requirements would likely mitigate the severity of many impacts (see Table 13). Other non-fishing activities that may impact the VECs include Federal actions to mitigate or reduce impacts to protected resources. Under the ESA and MMPA, NMFS and the USFWS share responsibility for implementing programs to conserve and recover threatened and endangered species and marine mammals. Several species in the North Atlantic are under recovery plans or take reduction plans, which specify measures to monitor and reduce mortality (see Section 4.5). Modifications to these plans or addition of other species to the threatened or endangered listings may occur in the reasonably foreseeable future. An example of this type of action is the NMFS final Rule on Ship Strike Reduction Measures (73 FR 60173, October 10, 2008). This rule is a non-fishing action in the U.S.-controlled North Atlantic that is likely to affect endangered species and protected resources. The goal of this rule is to significantly reduce the threat of ship strikes on North Atlantic right whales and other whale species in the region. Ship strikes are considered the main threat to North Atlantic right whales; therefore, NMFS anticipates this regulation will result in population improvements to this critically endangered species. In general, these types of actions are intended to reduce mortality or other impacts to protected resources and so should have long-term positive impacts to this VEC. To the extent that these actions otherwise reduce the impact of non-fishing activities to the environment, they may have long-term positive impacts to other VECs, including to fishing communities. Protected resources rules that are targeted at reducing fishing-related interactions with protected species could have negative impacts to fishing communities by restricting fishing effort and associated revenue.
55

Table 13. Impacts of Past, Present, and Reasonably Foreseeable Future Actions on the five VECs (not including those actions considered in this document).
Action Impacts on Physical Environment
Impacts on Target Species
Impacts on Non-target Species & Bycatch
Impacts on Protected Resources
Impacts on Human Communities
Original FMPs and subsequent Amendments and Frameworks (section 1.2)
+ + + + +
Target species specifications (establishes commercial and/0r recreation limits on landings)
+ + + + +
Standardized Bycatch Reporting Methodology (establishes acceptable level of precision and accuracy for monitoring of bycatch in fisheries)
Negl Negl Negl Negl L-
Omnibus EFH Amendment
(measures to minimize, mitigate or avoid impacts of fishing gear on EFH that are more than minimal and temporary in nature)
Likely + Likely + Likely + ND ND
Protected resources plans and associated rules to reduce mortality and injury to protected resources
Likely L+ Likely + Likely + Likely + Likely -
Future FMP Amendments and Frameworks + + + + +
Note: ND= Not determined
56

Table 13. Continued. Impacts of Past, Present, and Reasonably Foreseeable Future Actions on the five VECs (not including those actions considered in this document).
Action Impacts on Physical Environment
Impacts on Target Species
Impacts on Non-target Species and Bycatch
Impacts on Protected Resources
Impacts on Human
Communities
General construction and development activities (point and non-point source pollution, land and water-based coastal development, marine transportation, marine mining, dredging and disposal, energy-related facilities)
- in nearshore Likely L- in offshore Likely L- Likely L- Likely L- Negl
Point and non-point source (agricultural/urban runoff) pollution - in nearshore
Likely L- in offshore Likely L- Likely L- Likely L- Negl
Offshore disposal of dredged materials L- Likely L- Likely L- Likely L- Negl
Beach nourishment L- Likely L- Likely L- Negl Negl
Installation of offshore wind farm and infrastructure Likely L- Likely L- Likely L- Likely L- Likely L-
Installation of infrastructure associated with liquefied natural gas terminal
Likely L- Likely L- Likely L- Likely L- Likely L-
Restoration activities (wetland restoration, artificial reefs, eelgrass, etc…) + + + + +
Summary of Impacts L+ L+ L+ L+ L- (short term) L+ (long term)
Note: Unless noted otherwise, the impacts of most of these actions are localized and although considered negative at the site, they have an overall low negative or negligible effect on each VEC due to limited exposure of action to the population or habitat as a whole.
57
5.2.3 Magnitude and Significance of Cumulative Effects In determining the magnitude and significance of the cumulative effects, the additive and synergistic effects of this action, as well as past, present, and future actions, must be taken into account. The following section discusses the effects of these actions on each of the VECs. The effects of this action on all five VECs are discussed in detail in Section 5.1 and summarized in Section 5.2.1 and Table 12. In general, this omnibus amendment would have negligible impacts to the physical environment/habitat/EFH, target species, non-target species and bycatch, and protected resources because it makes simple, mostly administrative changes that would not be expected to undermine measures to control fishing mortality, rebuild fish stocks, or minimize or reduce impacts from fishing on habitat or protected resources. This action would be expected to have low positive impacts to human communities, by simplifying and streamlining the baseline regulations and administrative process, which could in turn reduce the cost and time burden of these measures. The effects of past, present, and reasonably foreseeable future actions are discussed in Section 5.2.2 and summarized in Table 13. The combination of past, present, and reasonably foreseeable future fishing and non-fishing actions are expected to have low positive impacts on the physical environment, target species, non-target species and bycatch, and protected resources. This is due to direct and indirect effects on resource populations and their habitat. To the extent that these activities restrict fishing effort or impact the health and availability of fishery resources to fishermen, they may have short-term low negative to long-term low positive impacts on human communities. This omnibus amendment would not be expected to significantly alter the impacts of the past, present, and reasonably foreseeable future actions on the environment, because it makes simple changes to administrative measures in the FMPs. This is particularly true when considered in combination with past FMPs and subsequent actions, which have incorporated many measures in addition to baseline restrictions to control fishing effort and mortality. Removing the one-time upgrade limit or tonnages from vessel baselines may allow some permits to upgrade to larger vessels. However, the continued presence of other restrictions on vessel size and fishing power, as well as direct and indirect controls on fishing mortality and effort, habitat and protected resources interactions, ensure that any increases in fishing capacity will be minimal. This action may positively reinforce the past and future positive effects on human communities by alleviating some of the administrative burden of baseline measures and potentially slightly increasing efficiency of the fishing fleet.
Conclusion In conclusion, the cumulative impacts from this action and the CEA Baseline would not be significant due to the reasons stated in this assessment. The cumulative impacts from this action and past, present, and reasonably foreseeable future actions would be low positive on the physical environment/habitat/EFH target species, non-target species and bycatch, and protected resources; and short-term low negative to long-term low positive on human communities (Table 14).
58
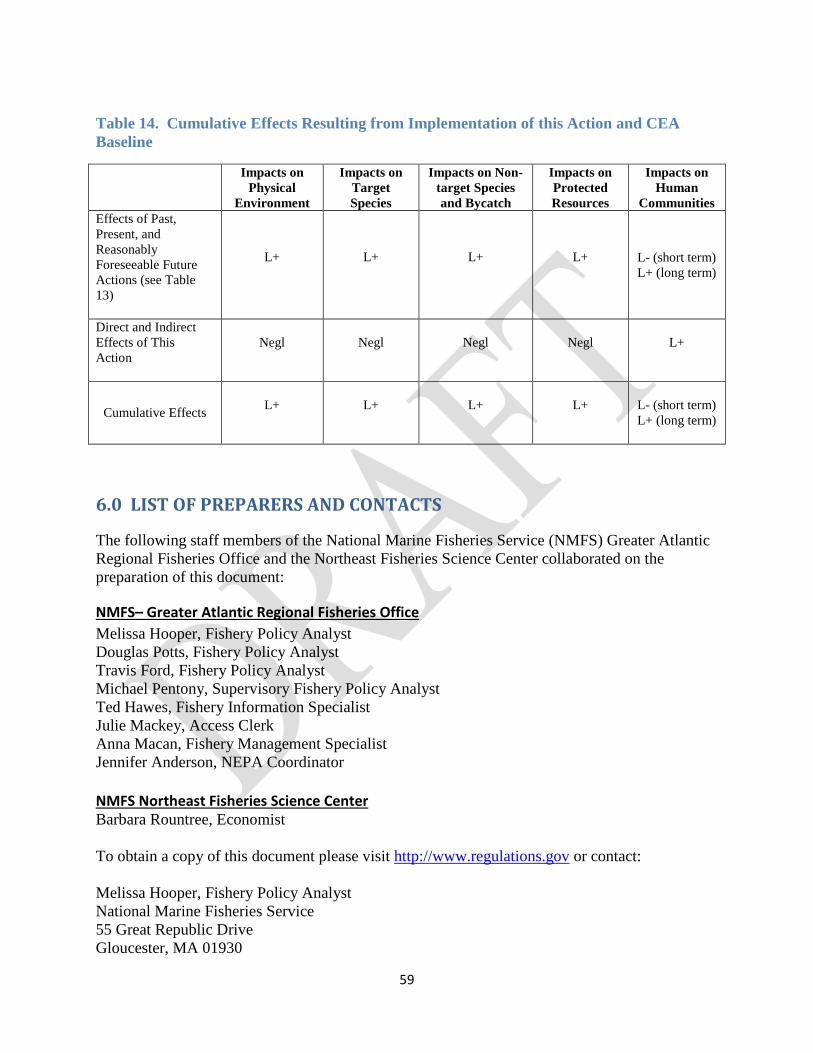
Table 14. Cumulative Effects Resulting from Implementation of this Action and CEA Baseline
Impacts on Physical
Environment
Impacts on Target Species
Impacts on Non-target Species and Bycatch
Impacts on Protected Resources
Impacts on Human
Communities Effects of Past, Present, and Reasonably Foreseeable Future Actions (see Table 13)
L+ L+ L+ L+ L- (short term) L+ (long term)
Direct and Indirect Effects of This Action
Negl Negl Negl Negl L+
Cumulative Effects L+ L+ L+ L+
L- (short term) L+ (long term)
6.0 LIST OF PREPARERS AND CONTACTS
The following staff members of the National Marine Fisheries Service (NMFS) Greater Atlantic Regional Fisheries Office and the Northeast Fisheries Science Center collaborated on the preparation of this document:
NMFS– Greater Atlantic Regional Fisheries Office Melissa Hooper, Fishery Policy Analyst Douglas Potts, Fishery Policy Analyst Travis Ford, Fishery Policy Analyst Michael Pentony, Supervisory Fishery Policy Analyst Ted Hawes, Fishery Information Specialist Julie Mackey, Access Clerk Anna Macan, Fishery Management Specialist Jennifer Anderson, NEPA Coordinator NMFS Northeast Fisheries Science Center Barbara Rountree, Economist To obtain a copy of this document please visit http://www.regulations.gov or contact: Melissa Hooper, Fishery Policy Analyst National Marine Fisheries Service 55 Great Republic Drive Gloucester, MA 01930
59
(978) 281-9166 [email protected]
7.0 PERSONS AND AGENCIES CONSULTED
NMFS prepared this Omnibus Amendment and EA for and in consultation with the New England and Mid Atlantic Fishery Management Councils. NMFS and the Councils consulted with the states of Maine through North Carolina through their membership on the Mid-Atlantic and New England Fishery Management Councils. NMFS also consulted with the Atlantic States Marine Fisheries Commission through the Northeast Region Coordinating Council. In addition, states that are members within the management unit were consulted by NMFS through the Coastal Zone Management Program consistency process. NMFS staff members of the Greater Atlantic Regional Fisheries Office and Northeast Fisheries Science Center were also consulted in preparing this EA.
8.0 COMPLIANCE WITH APPLICABLE LAWS AND EXECUTIVE ORDERS TO BE COMPLETED IN FINAL EA
60

9.0 REFERENCES
ASMFC TC (Atlantic States Marine Fisheries Commission Technical Committee). 2007. Special Report to the Atlantic Sturgeon Management Board: Estimation of Atlantic sturgeon bycatch in coastal Atlantic commercial fisheries of New England and the Mid-Atlantic. August 2007. 95 pp.
Atlantic States Marine Fisheries Commission (ASMFC). 2009. Stock Assessment Report No. 09-01 (Supplement) of the Atlantic States Marine Fisheries Commission, “American Lobster Stock Assessment Report for Peer Review,” www.asmfc.org
ASSRT (Atlantic Sturgeon Status Review Team). 2007. Status review of Atlantic sturgeon (Acipenser oxyrinchus oxyrinchus). National Marine Fisheries Service. February 23, 2007. 188 pp.
Baseline Working Group. 2011. White Paper: Evaluating Options to Simplify Vessel Baseline, Upgrade, and Replacement Restrictions. Prepared by the National Marine Fisheries Service. October 18, 2011. 18pp.
Best, P.B., J.L. Bannister, R.L. Brownell, Jr., and G.P. Donovan, (eds). 2001. Right whales: worldwide status. J. Cetacean Res. Manage. (Special Issue) 2. 309pp.
Bowen, B.W., A.L. Bass, S.M. Chow, M. Bostrom, K.A. Bjorndal, A.B. Bolten, T. Okuyuma, B.M. Bolker, S. Epperly, E. Lacasella, D. Shaver, M. Dodd, S.R. Hopkins-Murphy, J.A. Musick, M. Swingle, K. Rankin-Baransky, W. Teas, W.N. Witzell & P.H. Dutton. 2004. Natal homing in juvenile loggerhead turtles (Caretta caretta). Molecular Ecology 13:3797-3808.
Braun-McNeill, J., and S.P. Epperly. 2004. Spatial and temporal distribution of sea turtles in the western North Atlantic and the U.S. Gulf of Mexico from Marine Recreational Fishery Statistics Survey (MRFSS). Mar. Fish. Rev. 64(4):50-56.
Brown, M.W., O.C. Nichols, M.K. Marx, and J.N. Ciano. 2002. Surveillance of North Atlantic right whales in Cape Cod Bay and adjacent waters-2002. Final Report to the Division of Marine Fisheries, Commonwealth of Massachusetts. 29pp.
Cetacean and Turtle Assessment Program. 1982. A characterization of marine mammals and turtles in the mid- and north Atlantic areas of the U.S. outer continental shelf. Cetacean and Turtle Assessment Program, University of Rhode Island. Final Report #AA551-CT8-48 to the Bureau of Land Management, Washington, DC, 538 pp.
Clapham, P.J., S.B. Young, and R.L. Brownell. 1999. Baleen whales: Conservation issues and the status of the most endangered populations. Mammal Rev. 29(1):35-60.
Colvocoresses, J.A. and J.A. Musick. 1984. Species associations and community composition of Middle Atlantic Bight continental shelf demersal fishes. Fish. Bull. (U.S.) 82: 295-313.
61
Conant, T.A., P.H. Dutton, T. Eguchi, S.P. Epperly, C.C. Fahy, M.H. Godfrey, S.L. MacPherson, E.E. Possardt, B.A. Schroeder, J.A. Seminoff, M.L. Snover, C.M. Upite, and B.E. Witherington. 2009. Loggerhead sea turtle (Caretta caretta) 2009 status review under the U.S. Endangered Species Act. Report of the Loggerhead Biological Review Team to the National Marine Fisheries Service, August 2009. 222 pages.
Dadswell, M. 2006. A review of the status of Atlantic sturgeon in Canada, with comparisons to populations in the United States and Europe. Fisheries 31: 218-229.
Dovel, W. L. and T. J. Berggren. 1983. Atlantic sturgeon of the Hudson River estuary, New York. New York Fish and Game Journal 30: 140-172.
Dunton, K.J., A. Jordaan, K.A. McKown, D.O. Conover, and M.G. Frisk. 2010. Abundance and distribution of Atlantic sturgeon (Acipenser oxyrinchus) within the Northwest Atlantic Ocean determined from five fishery-independent surveys. Fish. Bull. 108:450-465.
Gabriel, W. 1992. Persistence of demersal fish assemblages between Cape Hatteras and Nova Scotia, northwest Atlantic. J. Northwest Atl. Fish. Sci. 14: 29-46.
Holland, B.F., Jr., and G.F. Yelverton. 1973. Distribution and biological studies of anadromous fishes offshore North Carolina. Division of Commercial and Sports Fisheries, North Carolina Dept. of Natural and Economic Resources, Special Scientific Report No. 24. 130pp.
(IWC) International Whaling Commission. 2001a. Report of the workshop on the comprehensive assessment of right whales: A worldwide comparison. J. Cet. Res. Manage (Special issue) 2: 1-60.
James, M.C., R.A. Myers, and C.A. Ottenmeyer. 2005. Behaviour of leatherback sea turtles, Dermochelys coriacea, during the migratory cycle. Proc. R. Soc. B, 272: 1547-1555.
Johnson M.R., C. Boelke, L.A. Chiarella, P.D. Colosi, K. Greene, K. Lellis, and H. Ludemann, M. Ludwig, S. McDermott, J. Ortiz, D. Rusanowsky, M. Scott, J. Smith. 2008. Impacts to marine fisheries habitat from nonfishing activities in the Northeastern United States. Available at: http://www.nefsc.noaa.gov/publications/tm/tm209/index.html.
Katona, S.K., V. Rough, and D.T. Richardson. 1993. A field guide to whales, porpoises, and seals from Cape Cod to Newfoundland. Smithsonian Institution Press, Washington, D.C. 316 pp.
Kenney, R.D. 2002. North Atlantic, North Pacific, and Southern hemisphere right whales in W.F. Perrin, B. Wursig, and J.G.M. Thewissen, eds., Encyclopedia of Marine Mammals. Academic Press, CA. pp. 806-813.
Keinath, J.A., J.A. Musick, and R.A. Byles. 1987. Aspects of the biology of Virginia’s sea turtles: 1979-1986. Virginia J. Sci. 38(4): 329-336.
62
Kocik, J.F., and T.F. Sheehan. 2006. Atlantic Salmon. Available at: http://www.nefsc.noaa.gov/sos/spsyn/af/salmon/.
Kocik J, Lipsky C, Miller T, Rago P, Shepherd G. 2013. An Atlantic Sturgeon Population Index for ESA Management Analysis. US Dept Commer, Northeast Fish Sci Cent Ref Doc. 13-06; 36 p. Available from: National Marine Fisheries Service, 166 Water Street, Woods Hole, MA 02543-1026, or online at http://www.nefsc.noaa.gov/nefsc/publications/
Kynard, B. and M. Horgan. 2002. Ontogenetic behavior and migration of Atlantic sturgeon, Acipenser oxyrinchus oxyrinchus, and shortnose sturgeon, A. brevirostrum, with notes on social behavior. Environmental Behavior of Fishes 63: 137-150.
Lacroix G. L., D. Knox, and M. J. W. Stokesbury. 2005. Survival and behaviour of postsmolt Atlantic salmon in coastal habitat with extreme tides. Journal of Fish Biology 66(2): 485-498.
Laney, R.W., J.E. Hightower, B.R. Versak, M.F. Mangold, W.W. Cole Jr., and S.E. Winslow. 2007. Distribution, habitat use, and size of Atlantic sturgeon captured during cooperative winter tagging cruises, 1988-2006. In Anadromous sturgeons: habitats, threats, and management (J. Munro, D. Hatin, J.E. Hightower, K. McKown, K.J. Sulak, A.W. Kahnle, and F. Caron (eds.)), p. 167-182. Am. Fish. Soc. Symp. 56, Bethesda, MD.
Milliken, H. O., L. Belskis, W. DuPaul, J. Gearhart, H. Haas, J. Mitchell, R. Smolowitz, and W. Teas. April 2007. Evaluation of a Modified Scallop Dredge’s Ability to Reduce the Likelihood of Damage to Loggerhead Sea Turtle Carcasses. Northeast Fisheries Science Center Reference Document 07-07, Woods Hole, MA.
Morreale, S.J. and E.A. Standora. 1998. Early life stage ecology of sea turtles in northeastern U.S. waters. U.S. Dep. Commer. NOAA Tech. Mem. NMFS-SEFSC-413, 49 pp.
Morreale, S.J. and E.A. Standora. 2005. Western North Atlantic waters: Crucial developmental habitat for Kemp’s ridley and loggerhead sea turtles. Chel. Conserv. Biol. 4(4):872-882.
Murray, K.T., 2011. Sea turtle bycatch in the U.S. sea scallop (Placopecten magellanicus) dredge fishery, 2001–2008. Fish. Res. 107:137-146.
Musick, J.A. and C.J. Limpus. 1997. Habitat utilization and migration in juvenile sea turtles. Pp. 137-164 in Lutz, P.L., and J.A. Musick, eds. The Biology of Sea Turtles. CRC Press, New York. 432 pp.
National Marine Fisheries Service (NMFS) and U.S. Fish and Wildlife Service (USFWS). 1991a. Recovery plan for U.S. population of loggerhead turtle. National Marine Fisheries Service, Washington, D.C. 64 pp.
National Marine Fisheries Service (NMFS) and U.S. Fish and Wildlife Service (USFWS). 1991b. Recovery plan for U.S. population of Atlantic green turtle. National Marine Fisheries Service, Washington, D.C. 58 pp.
63

National Marine Fisheries Service (NMFS) and U.S. Fish and Wildlife Service (USFWS). 1992. Recovery plan for leatherback turtles in the U.S. Caribbean, Atlantic, and Gulf of Mexico. National Marine Fisheries Service, Washington, D.C. 65 pp.
National Marine Fisheries Service (NMFS) and U.S. Fish and Wildlife Service (USFWS). 1995. Status reviews for sea turtles listed under the Endangered Species Act of 1973. National Marine Fisheries Service, Silver Spring, MD. 139 pp.
National Marine Fisheries Service (NMFS) and U.S. Fish and Wildlife Service (USFWS). 2007a. Loggerhead sea turtle (/Caretta caretta/) 5 year review: summary and evaluation. National Marine Fisheries Service, Silver Spring, Maryland. 65 pp. Available at: http://www.nmfs.noaa.gov/pr/listing/reviews.htm.
National Marine Fisheries Service (NMFS) and U.S. Fish and Wildlife Service (USFWS). 2007b. Leatherback sea turtle (/Dermochelys coriacea/) 5 year review: summary and evaluation. National Marine Fisheries Service, Silver Spring, Maryland. 79 pp. Available at: http://www.nmfs.noaa.gov/pr/listing/reviews.htm.
National Marine Fisheries Service (NMFS) and U.S. Fish and Wildlife Service (USFWS). 2007c. Kemp’s ridley sea turtle/ (Lepidochelys/ /kempii/) 5 year review: summary and evaluation. National Marine Fisheries Service, Silver Spring, Maryland. 50 pp. Available at: http://www.nmfs.noaa.gov/pr/listing/reviews.htm.
National Marine Fisheries Service (NMFS) and U.S. Fish and Wildlife Service (USFWS). 2007d. Green sea turtle (/Chelonia mydas/) 5 year review: summary and evaluation. National Marine Fisheries Service, Silver Spring, Maryland. 102 pp. Available at: http://www.nmfs.noaa.gov/pr/listing/reviews.htm.
National Marine Fisheries Service (NMFS) and U.S. Fish and Wildlife Service (USFWS). 2008. Recovery Plan for the Northwest Atlantic Population of the Loggerhead Sea Turtle (Caretta caretta). Second Revision. National Marine Fisheries Service, Silver Spring, MD. 325pp.
National Marine Fisheries Service (NMFS) Southeast Fisheries Science Center (SEFSC). 2001. Stock assessments of loggerheads and leatherback sea turtles and an assessment of the impact of the pelagic longline fishery on the loggerhead and leatherback sea turtles of the Western North Atlantic. U.S.
National Marine Fisheries Service (NMFS). 1991a. Final recovery plan for the humpback whale (Megaptera novaeangliae). Prepared by the Humpback Whale Recovery Team for the National Marine Fisheries Service, Silver Spring, Maryland. 105 pp.
National Marine Fisheries Service. 1991b. Final Recovery Plan for the Northern Right Whale (Eubalaena glacialis). U.S. Department of Commerce, National Oceanic and Atmospheric Administration, National Marine Fisheries Service, Office of Protected Resources. 86 pp
64
National Marine Fisheries Service (NMFS). 1998. Recovery Plan for the Shortnose Sturgeon (Acipenser brevirostrum). Prepared by the Shortnose Sturgeon Recovery Team for the National Marine Fisheries Service, Silver Spring, Maryland. 104 pages.
National Marine Fisheries Service (NMFS). 2005. Recovery Plan for the North Atlantic right whale (Eubalaena glacialis). National Marine Fisheries Service, Silver Spring, MD. 137pp.
National Marine Fisheries Service (NMFS). 2007. Final Environmental Impact Statement for Amending the Atlantic Large Whale Take Reduction Plan. Available at: http://www.nero.noaa.gov/nero/hotnews/whalesfr/
National Marine Fisheries Service (NMFS). 2009a. Hawksbill Turtle (Eretmochelys imbricata). Available at: http://www.nmfs.noaa.gov/pr/species/turtles/hawksbill.htm.
National Marine Fisheries Service (NMFS). 2013. Endangered Species Action Section 7 Consultation Biological Opinion. 434pp. Available at: http://www.nero.noaa.gov/protected/section7/bo/actbo.html
National Marine Fisheries Service (NMFS). 2013. Fisheries of the United States 2012. 124pp. Available at: http://www.st.nmfs.noaa.gov/commercial-fisheries/fus/fus12/
National Research Council. 1990. Decline of the Sea Turtles: Causes and Prevention. Committee on Sea Turtle Conservation. Natl. Academy Press, Washington, D.C. 259 pp.
National Research Council. 2002. Effects of trawling and dredging on seafloor habitat. Ocean Studies Board, Division on Earth and Life Studies, National Research Council. National Academy Press, Washington, D.C. 126 p.
New England Fishery Management Council. 2013. Draft Atlantic Deep Sea Red Crab Fishery Years 2014-2016 Specifications. 28pp. Available at: http://www.nefmc.org/crab/index.html
New England Fishery Management Council. 2014. Draft Omnibus Essential Fish Habitat Amendment 2, Volume 1. 411pp. Available at: http://www.nefmc.org/habitat/index.html
Overholtz, W.J. and A.V. Tyler. 1985. Long-term responses of the demersal fish assemblages of Georges Bank. Fish. Bull. (U.S.) 83: 507-520.
Perrin, W.F., B. Wursig, and J.G.M. Thewissen, (eds). 2002. Encyclopedia of Marine Mammals. Academic Press, CA. 1414 pp.
Perry, S.L., D.P. DeMaster, and G.K. Silber. 1999. The great whales: History and status of six species listed as endangered under the U.S. Endangered Species Act of 1973. Mar. Fish. Rev. Special Edition. 61(1): 59-74.
65
Pratt, S. 1973. Benthic fauna in Coastal and offshore environmental inventory, Cape Hatteras to Nantucket Shoals. p. 5-1 to 5-70. Univ. Rhode Island, Mar. Pub. Ser. No. 2. Kingston, RI.
Sears, R. 2002. Blue whale, Balaenoptera musculus. Pages 112-116 in W.F. Perrin, B. Würsig, and J.G.M. Thewissen, eds. Encyclopedia of Marine Mammals. San Diego: Academic Press.
Sherman, K., N.A. Jaworski, T.J. Smayda, eds. 1996. The northeast shelf ecosystem – assessment, sustainability, and management. Blackwell Science, Cambridge, MA. 564 p.
Shoop, C.R. and R.D. Kenney. 1992. Seasonal distributions and abundance of loggerhead and leatherback sea turtles in waters of the northeastern United States. Herpetol. Monogr. 6: 43-67.
Smolowitz, R., H. Haas, H.O. Milliken, M. Weeks and E. Matzen. 2010. Using Sea Turtle Carcasses to Assess the Conservation Potential of a Turtle Excluder Dredge. North American Journal of Fisheries Management 30:993–1000.
Steimle, F.W. and C. Zetlin. 2000. Reef habitats in the middle Atlantic bight: abundance, distribution, associated biological communities, and fishery resource use. Mar. Fish. Rev. 62: 24-42.
Stein, A. B., K. D. Friedland, and M. Sutherland. 2004a. Atlantic sturgeon marine bycatch and mortality on the continental shelf of the Northeast United States. North American Journal of Fisheries Management 24: 171-183.
Stein, A.B., K. D. Friedland, and M. Sutherland. 2004b. Atlantic sturgeon marine distribution and habitat use along the northeastern coast of the United States. Transaction of the American Fisheries Society 133:527-537.
Stevenson, D., L. Chiarella, D. Stephan, R. Reid, K. Wilhelm, J. McCarthy, and M. Pentony. 2004. Characterization of the fishing practices and marine benthic ecosystems of the northeast U.S. shelf, and an evaluation of the potential effects of fishing on essential fish habitat. NOAA Tech. Memo. NMFS-NE-181. 179 p.
Swingle, W.M., S.G. Barco, T.D. Pitchford, W.A. McLellan, and D.A. Pabst. 1993. Appearance of juvenile humpback whales feeding in the nearshore waters of Virginia. Mar. Mamm. Sci. 9: 309-315.
Theroux, R.B. and M.D. Grosslein. 1987. Benthic fauna in R.H. Backus and D.W. Bourne, eds. Georges Bank. p. 283-295. MIT Press, Cambridge, MA.
Theroux, R.B. and R.L. Wigley. 1998. Quantitative composition and distribution of the macrobenthic invertebrate fauna of the continental shelf ecosystems of the northeastern United States. NOAA Tech. Rep. NMFS 140. 240 p.
66
Turtle Expert Working Group. 1998. An assessment of the Kemp’s ridley (Lepidochelys kempii) and loggerhead (Caretta caretta) sea turtle populations in the Western North Atlantic. NOAA Technical Memorandum NMFS-SEFSC-409. 96 pp.
Turtle Expert Working Group. 2000. Assessment update for the Kemp’s ridley and loggerhead sea turtle populations in the Western North Atlantic. U.S. Dep. Commer. NOAA Tech. Mem. NMFS-SEFSC-444. 115 pp.
Turtle Expert Working Group. 2007. An assessment of the leatherback turtle population in the Atlantic Ocean. NOAA Technical Memorandum NMFS-SEFSC-555. 116 pp.
Turtle Expert Working Group. 2009. An Assessment of the Loggerhead Turtle Population in the Western North Atlantic Ocean. NOAA Tech. Memo. NMFS-SEFSC.575. 131 pp.
Upite C. 2011. Evaluating Sea Turtle Injuries in Northeast Fishing Gear. US Dept Commer, Northeast Fish Sci Cent Ref Doc. 11-10; 26 p. Available from: National Marine Fisheries Service, 166 Water Street, Woods Hole, MA 02543-1026, or online at http://www.nefsc.noaa.gov/nefsc/publications/
Valentine, P.C. and R.G. Lough. 1991. The seafloor environment and the fishery of eastern
Georges Bank. U.S. Dep. Interior, U.S. Geol. Sur. Open File Rep. 91-439. 25 p.
Waldman, J. R., J. T. Hart, and I. I. Wirgin. 1996. Stock composition of the New York Bight Atlantic sturgeon fishery based on analysis of mitochondrial DNA. Transactions of the American Fisheries Society 125: 364-371.
Warden, M.L. in press. Modeling loggerhead sea turtle (Caretta caretta) interactions with U.S. Mid-Atlantic bottom trawl gear for fish and scallops, 2005-2008. Bio. Cons.
Waring GT, Palka DL, Clapham PJ, Swartz S, Rossman MC, Cole TVN, Bisack KD, Hansen LJ. 1999. U.S. Atlantic Marine Mammal Stock Assessments -- 1998. US Dep Commer, NOAA Tech Memo NMFS NE 116; 184 p. Available at: http://www.nefsc.noaa.gov/publications/tm/tm116/
Waring GT, Palka DL, Clapham PJ, Swart S, Rossman MC, Cole TVN, Hansen LJ, Bisack KD, Mullin DK, Wells RS, Odell DK, Barros NB. 2000. U.S. Atlantic and Gulf of Mexico Marine Mammal Assessments -- 1999. US Dep Commer, NOAA Tech Memo NMFS NE 153; 187 p. Available at: http://www.nefsc.noaa.gov/publications/tm/tm153/
Waring GT, Quintal JM, Fairfield CP, editors. 2002. US Atlantic and Gulf of Mexico marine mammal stock assessments -- 2002. NOAA Tech Memo NMFS NE 169; 318 p. Available at: http://www.nefsc.noaa.gov/publications/tm/tm169/
Waring, G.T., E. Josephson, C.P. Fairfield-Walsh, and K. Maze-Foley, (eds). 2007. U.S. Atlantic and Gulf of Mexico Marine Mammal Stock Assessments - 2006 (2nd edition). NOAA Technical Memorandum NMFS-NE-201. Available at : http://www.nmfs.noaa.gov/pr/sars/region.htm.
67
Waring GT, Josephson E, Maze-Foley K, Rosel, PE, editors. 2011. U.S. Atlantic and Gulf of Mexico Marine Mammal Stock Assessments -- 2010. NOAA Tech Memo NMFS NE 219; 598 p. Available at: http://www.nmfs.noaa.gov/pr/sars/region.htm.
Waring GT, Josephson E, Maze-Foley K, Rosel, PE, editors. 2012. U.S. Atlantic and Gulf of Mexico Marine Mammal Stock Assessments -- 2011. NOAA Tech Memo NMFS NE 221; 319 p.
Waring GT, Josephson E, Maze-Foley K, Rosel, PE, editors. 2013. U.S. Atlantic and Gulf of Mexico Marine Mammal Stock Assessments -- 2012. NOAA Tech Memo NMFS NE 223; 419 p. Available at http: //www.nefsc.noaa.gov/nefsc/publications/
Waring, G.T , R. A. Blaylock, J. W. Hain, L. J. Hansen, D. L. Palka. 1995. U.S. Atlantic and Gulf of Mexico marine mammal stock assessments. NOAA Tech. Memo. NMFS-SEFSC-363, 211 pp.
Watling, L. 1998. Benthic fauna of soft substrates in the Gulf of Maine in E.M. Dorsey and J. Pederson, eds. Effects of fishing gear on the seafloor of New England. p. 20-29. MIT Sea Grant Pub. 98-4.
Whitehead, H. 2002. Estimates of the Current Global Population Size and Historical Trajectory for Sperm Whales. Mar. Ecol. Prog. Ser. 242: 295-304.
Wiley, D.N., R.A. Asmutis, T.D. Pitchford, and D.P. Gannon. 1995. Stranding and mortality of humpback whales, Megaptera novaengliae, in the mid-Atlantic and southeast United States, 1985-1992. Fish. Bull. (U.S.) 93:196-205.
68

Appendix
69
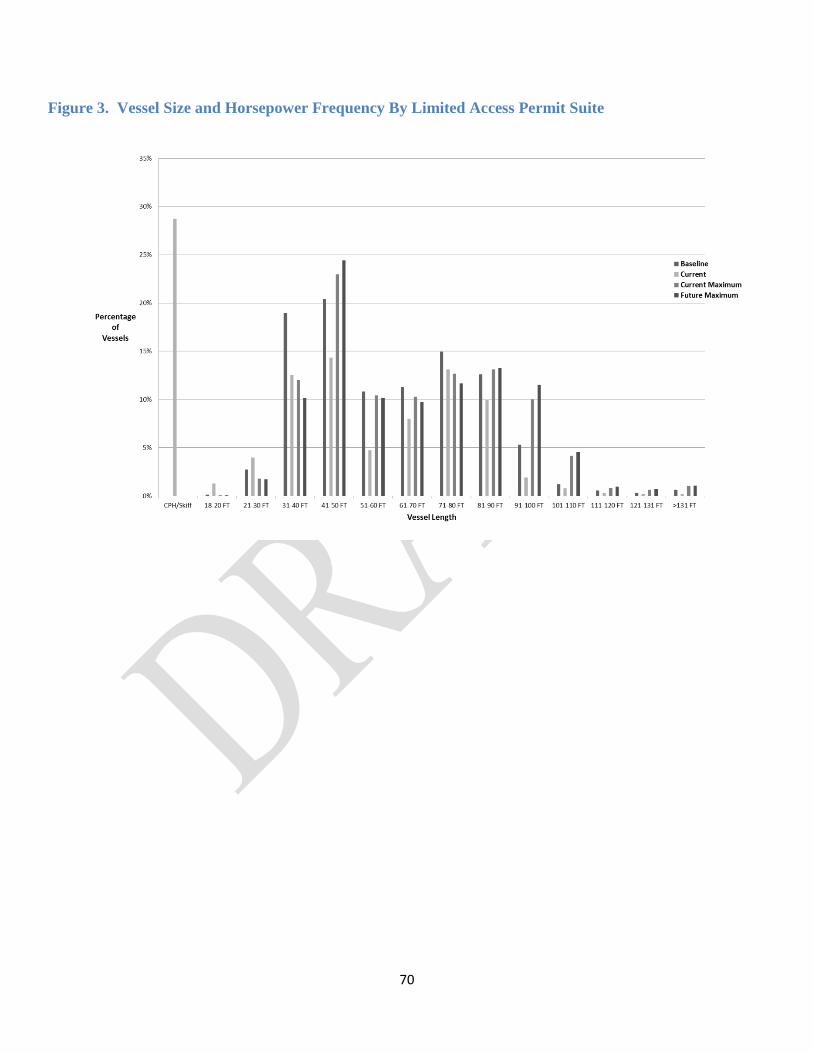
Figure 3. Vessel Size and Horsepower Frequency By Limited Access Permit Suite
70
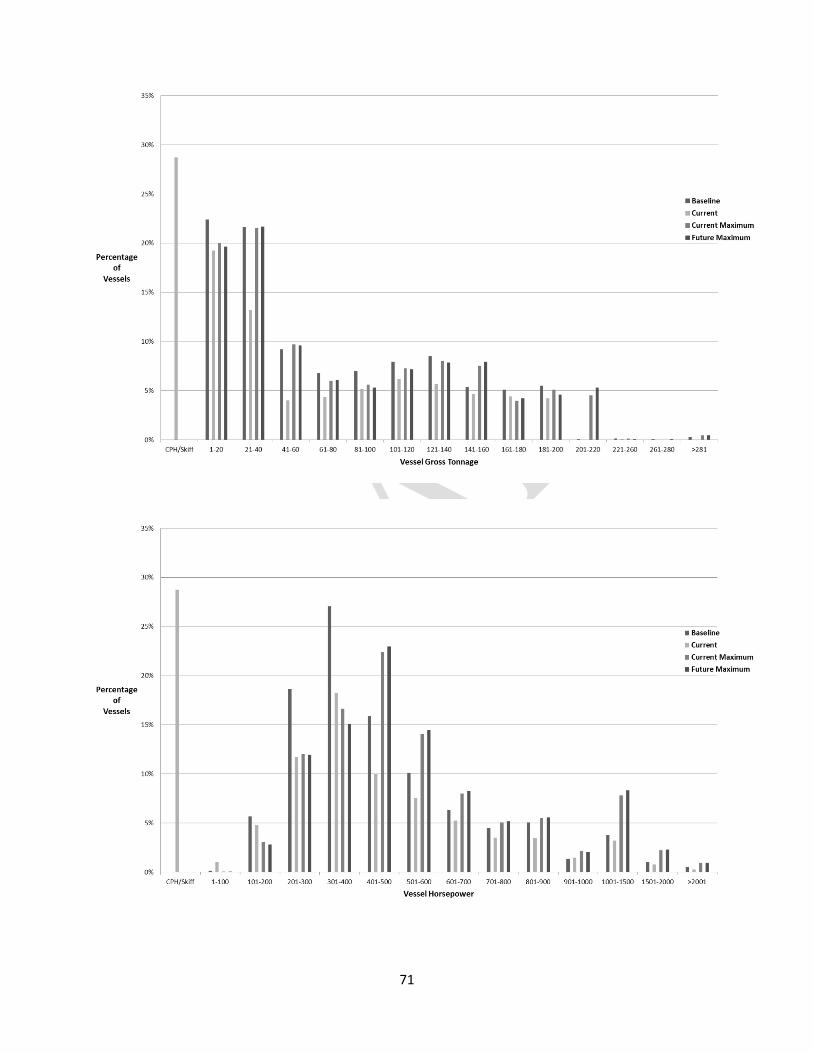
71

Figure 4. Limited Access Black Sea Bass Vessel Size and Horsepower Frequency
72
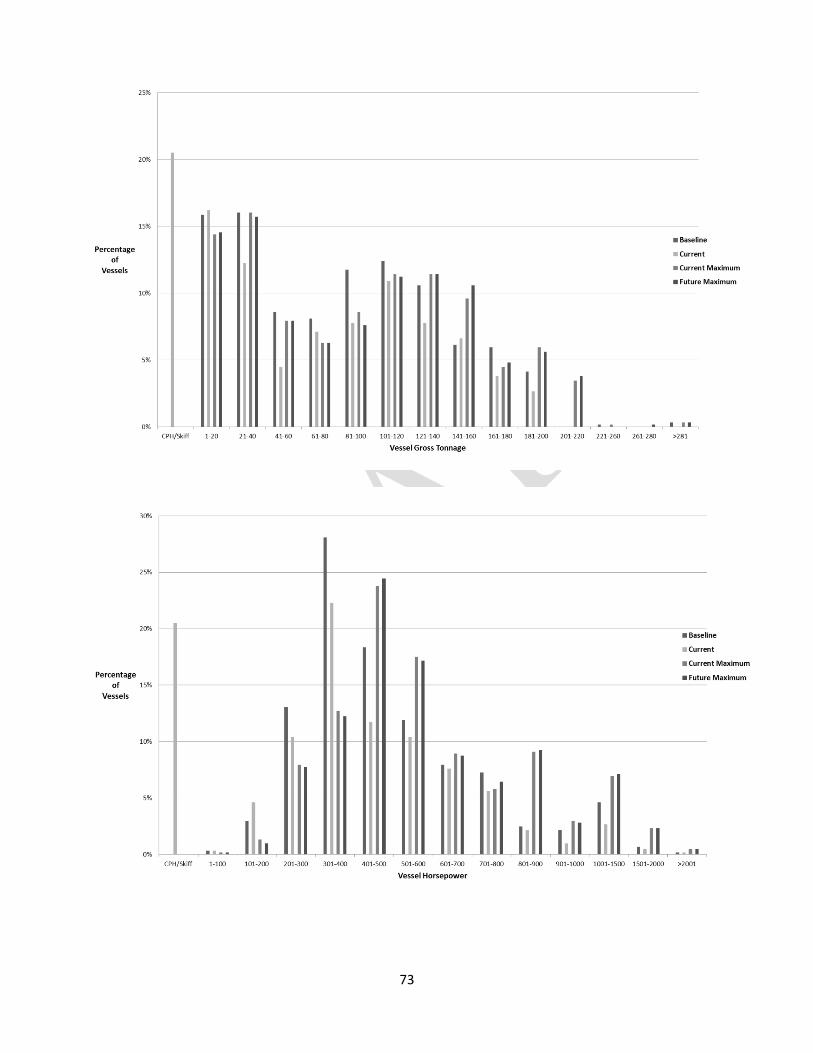
73
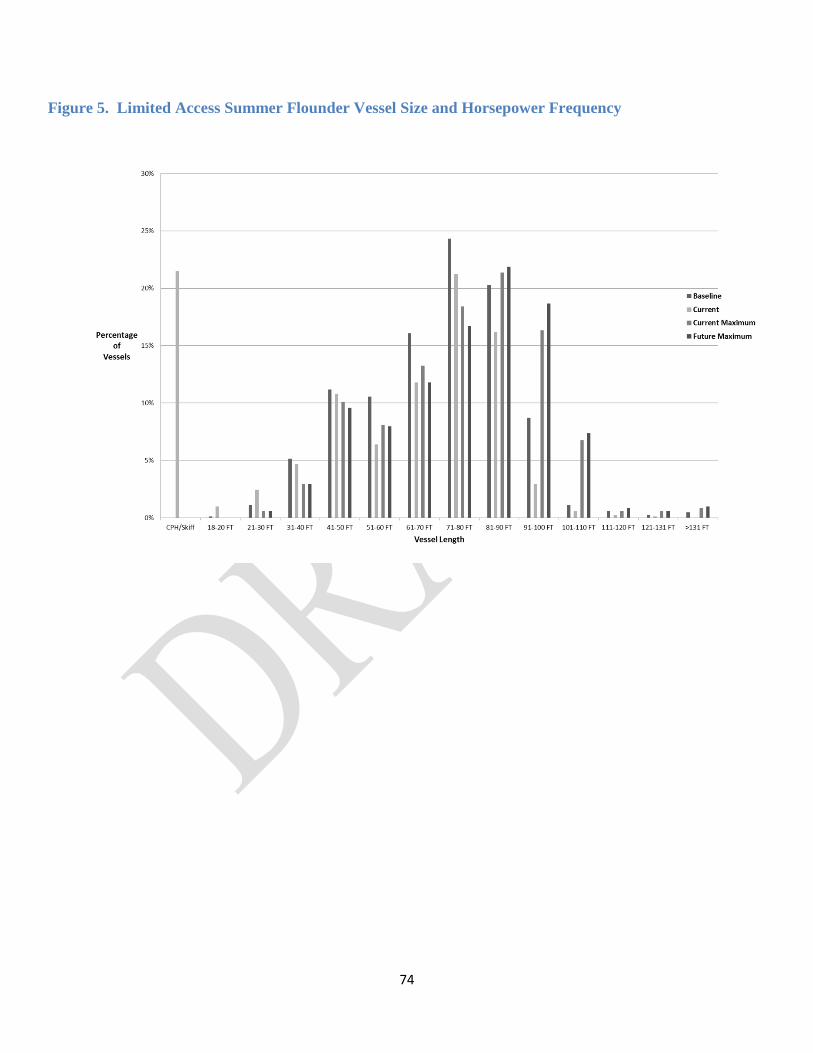
Figure 5. Limited Access Summer Flounder Vessel Size and Horsepower Frequency
74
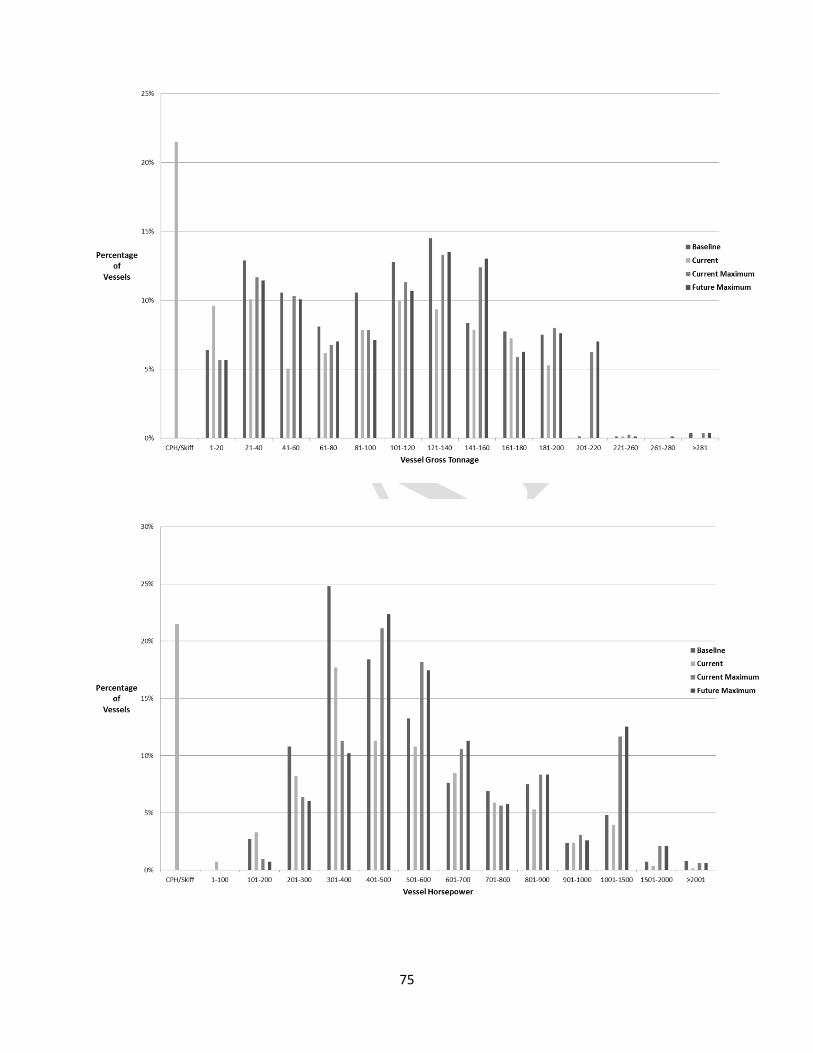
75
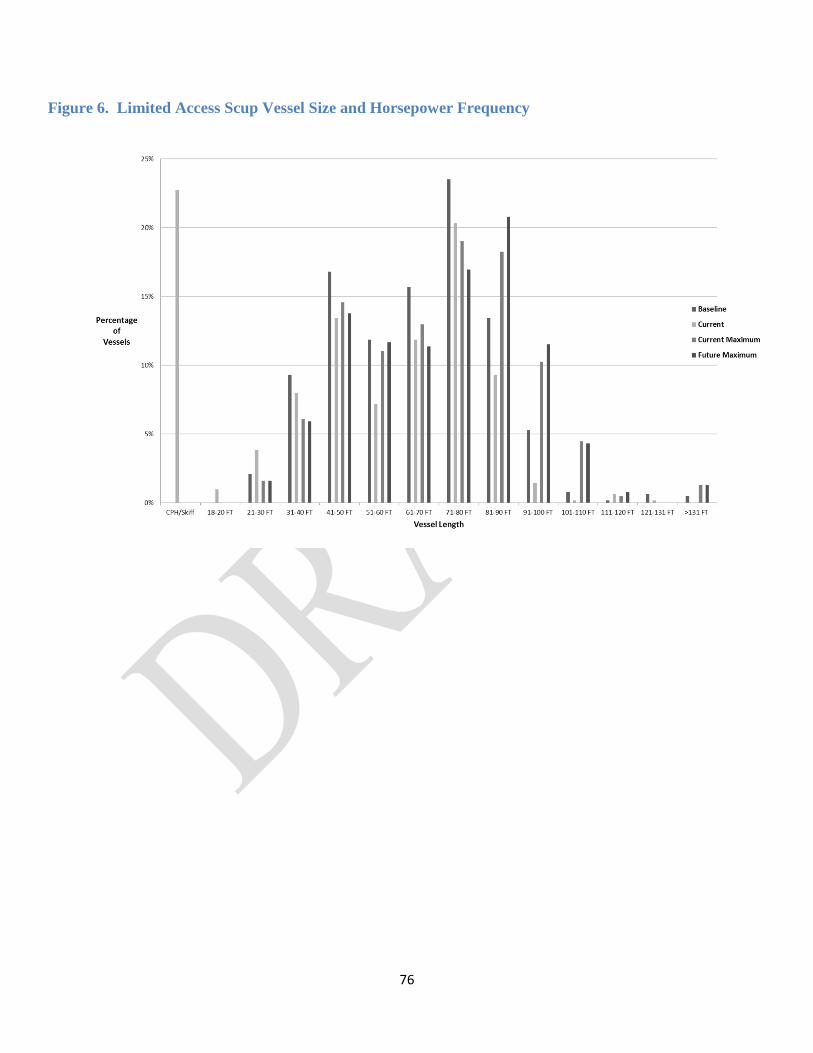
Figure 6. Limited Access Scup Vessel Size and Horsepower Frequency
76

77
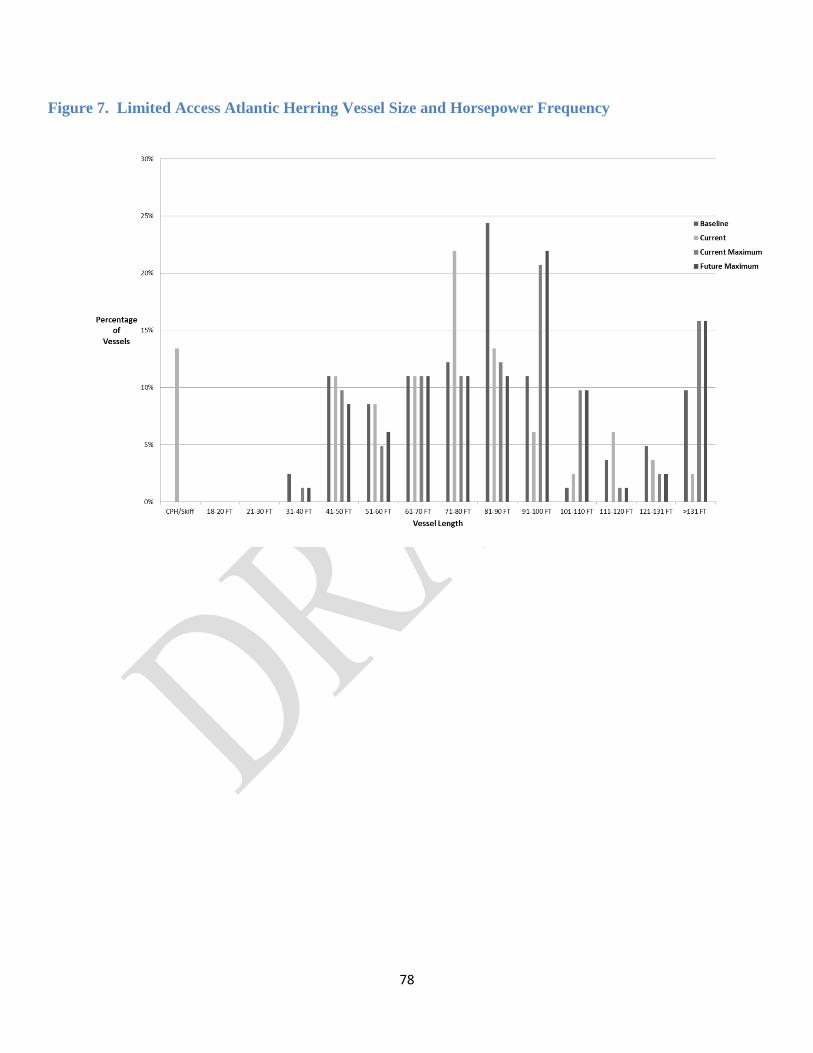
Figure 7. Limited Access Atlantic Herring Vessel Size and Horsepower Frequency
78
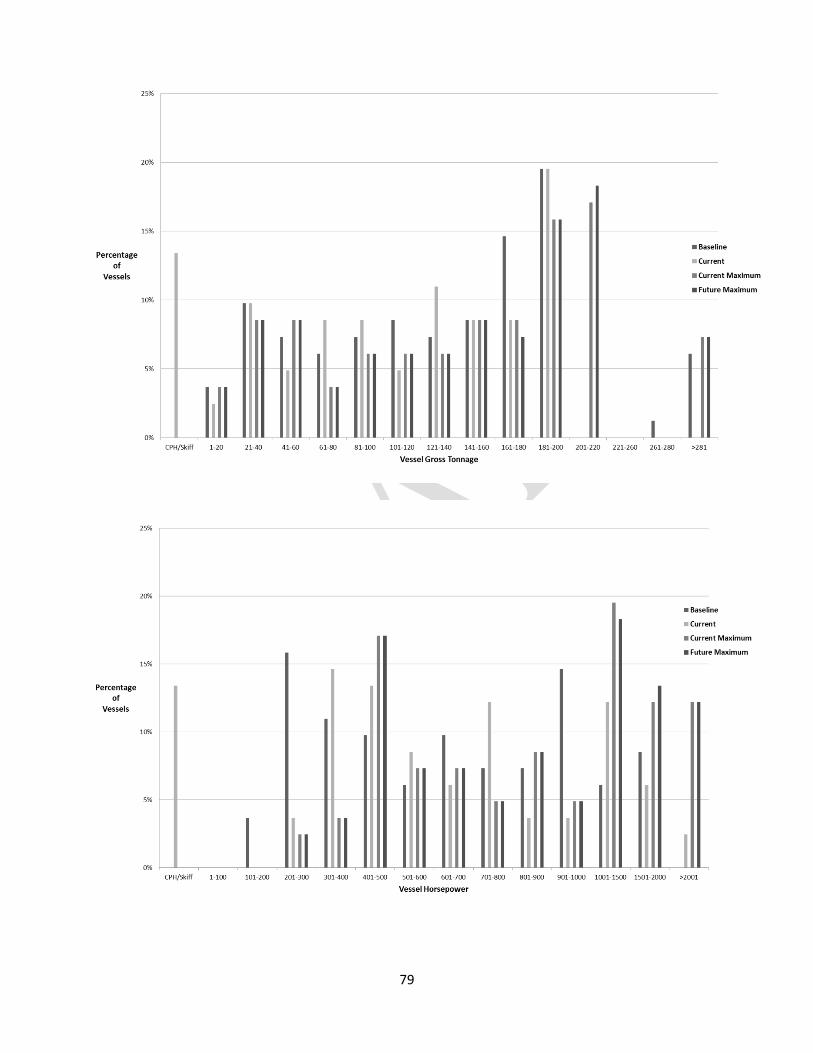
79
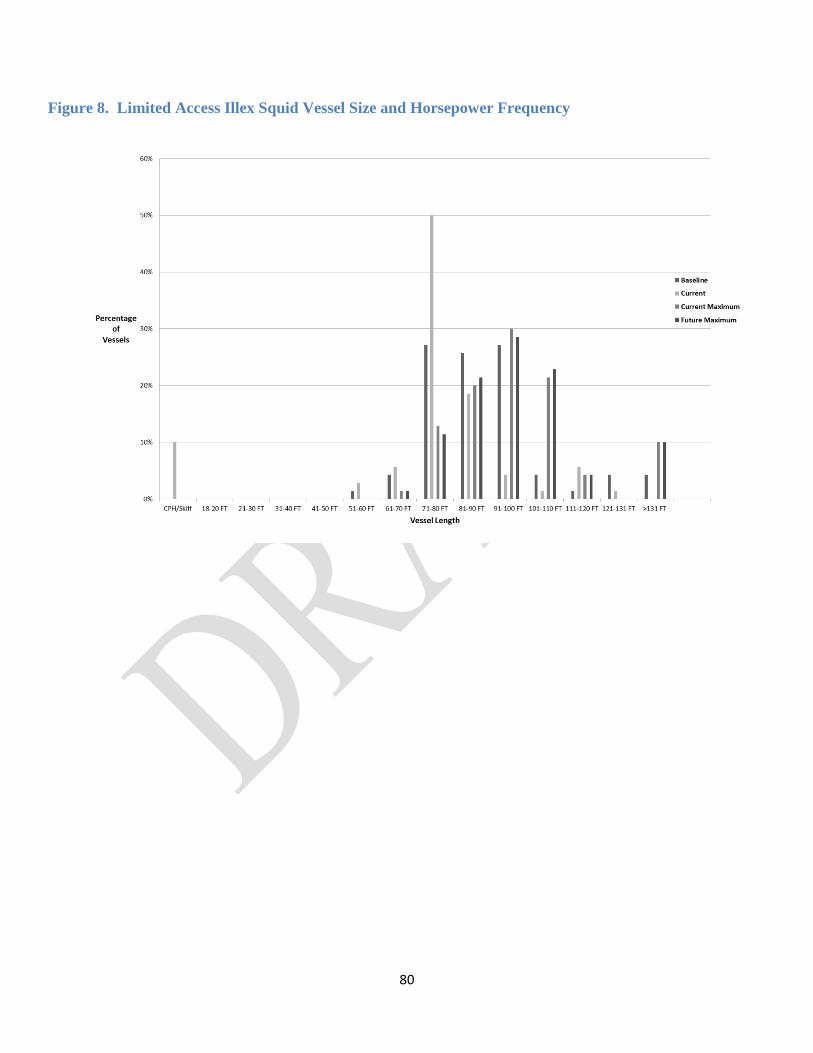
Figure 8. Limited Access Illex Squid Vessel Size and Horsepower Frequency
80
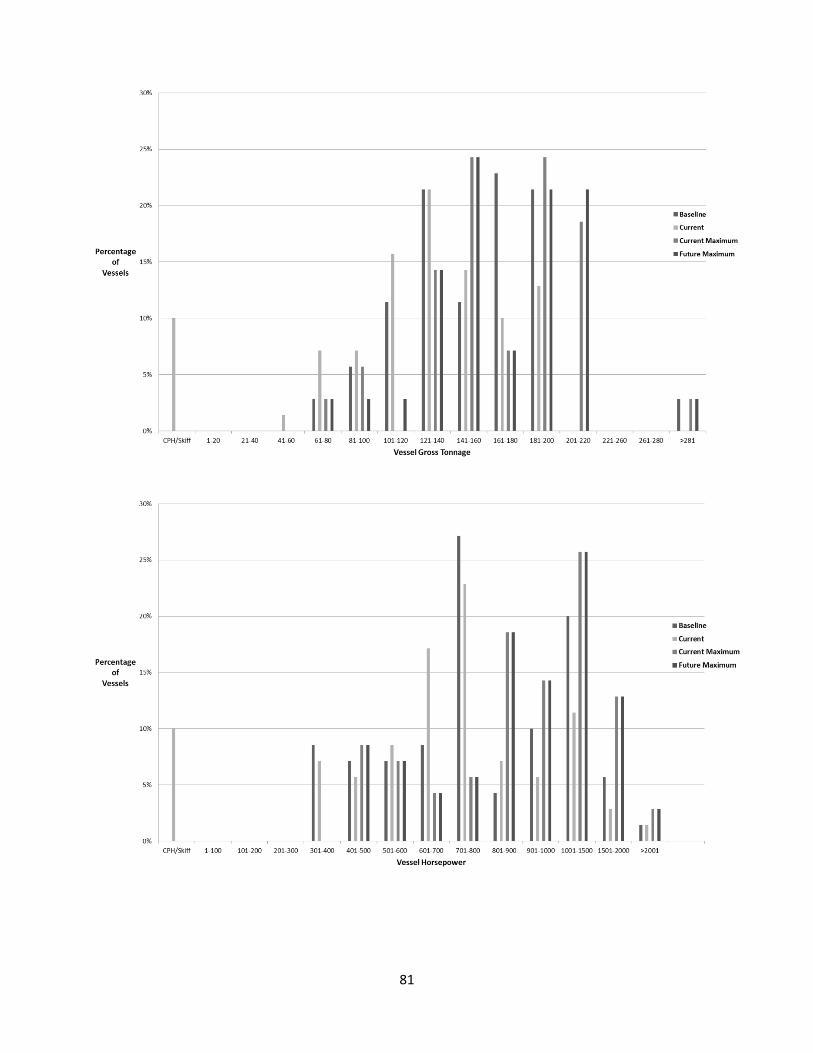
81
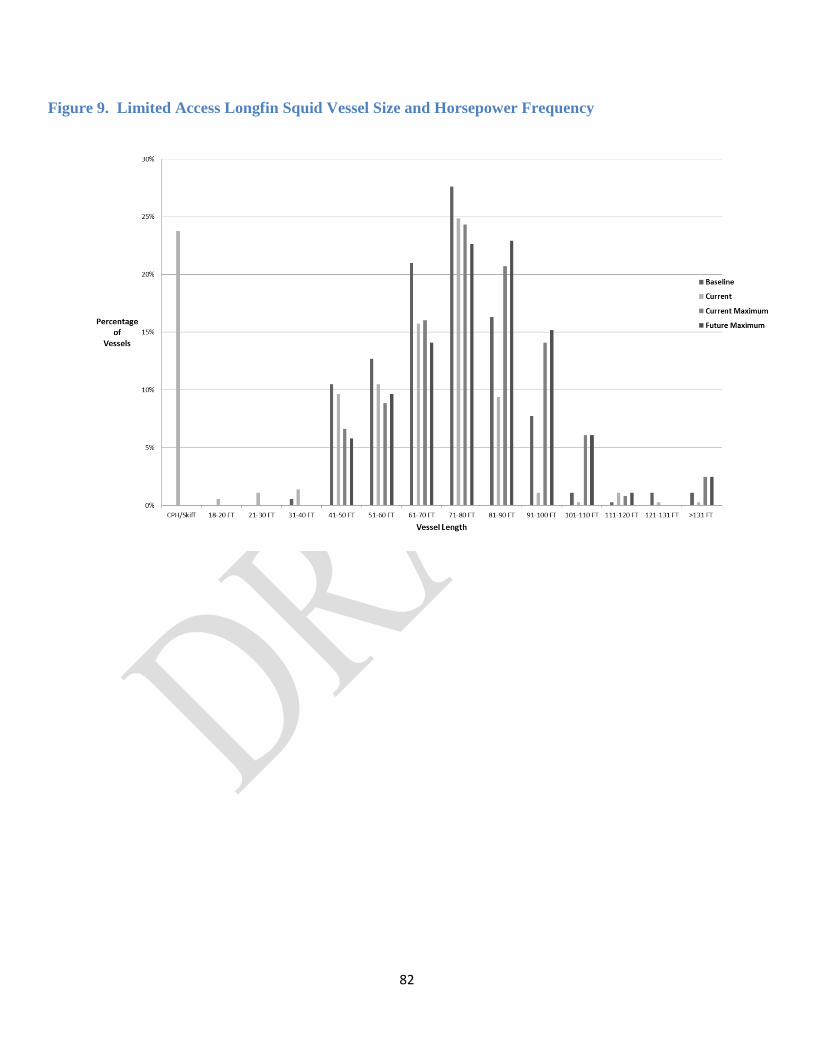
Figure 9. Limited Access Longfin Squid Vessel Size and Horsepower Frequency
82
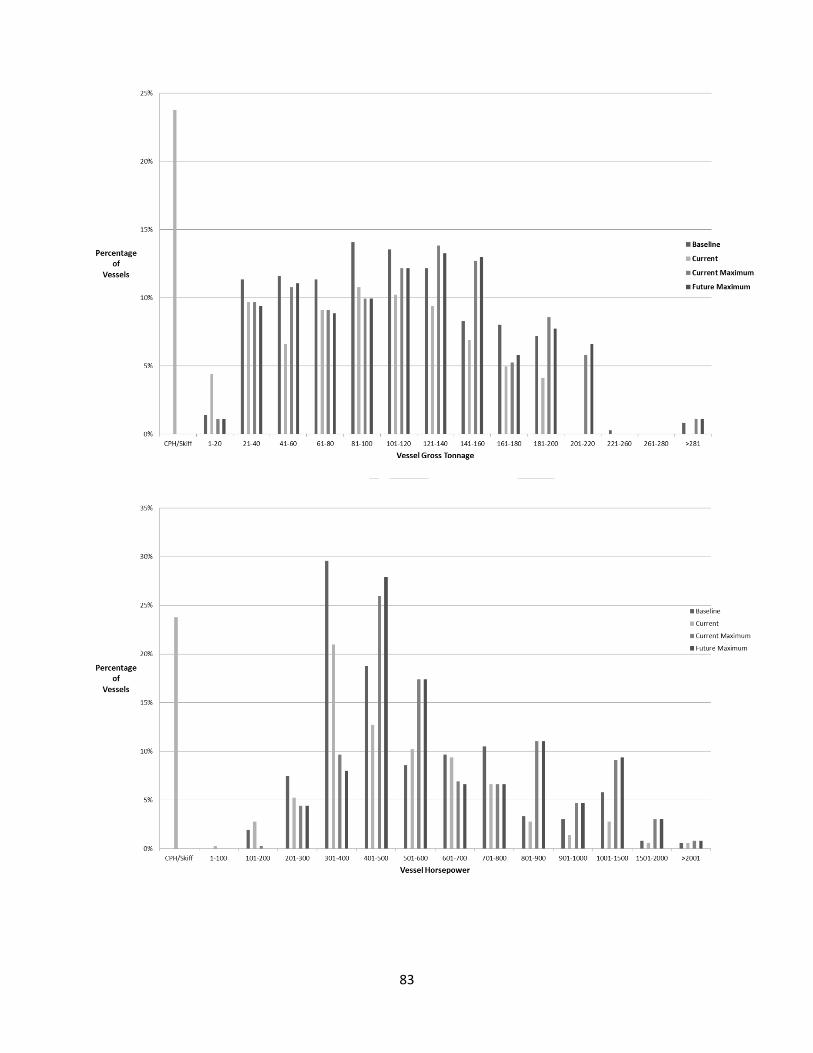
83

Figure 10. Limited Access Atlantic Mackerel Vessel Size and Horsepower Frequency
84
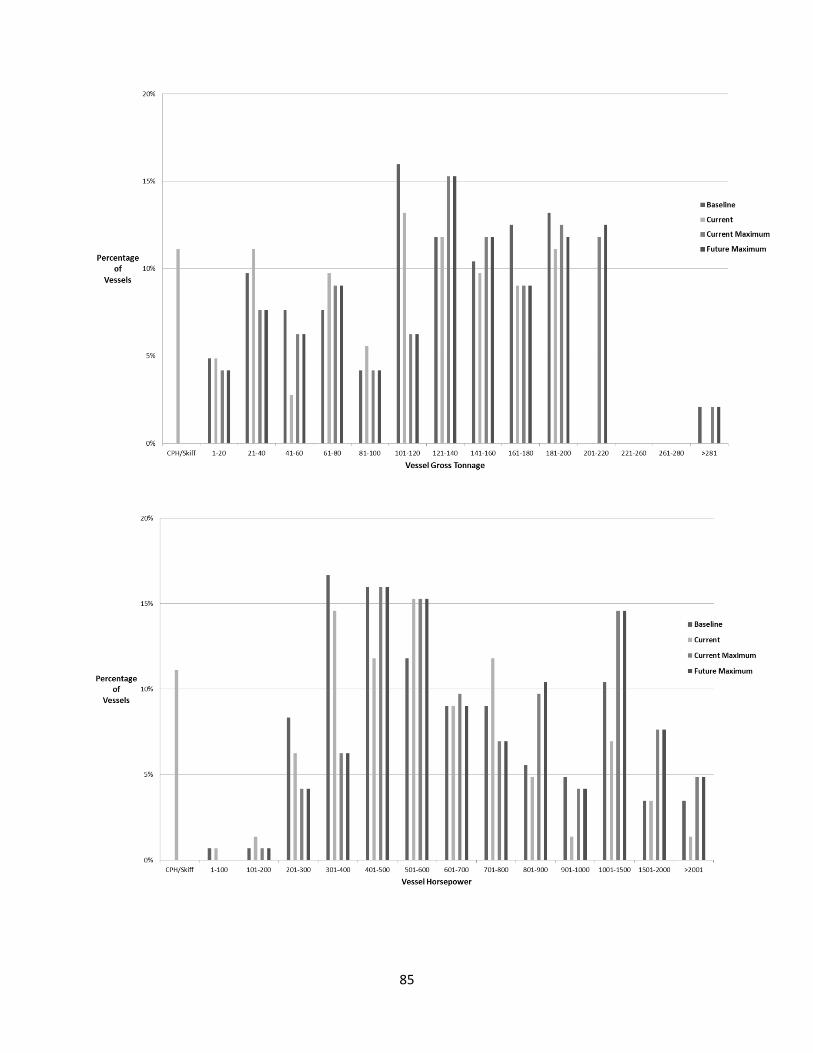
85
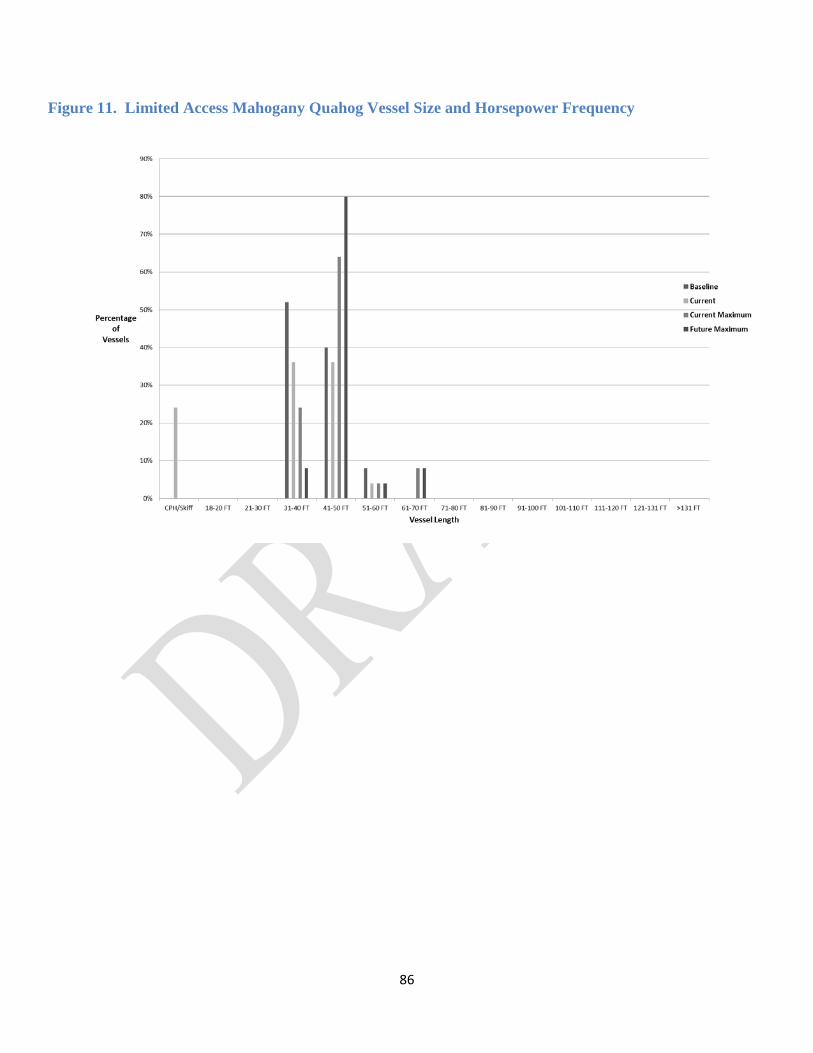
Figure 11. Limited Access Mahogany Quahog Vessel Size and Horsepower Frequency
86
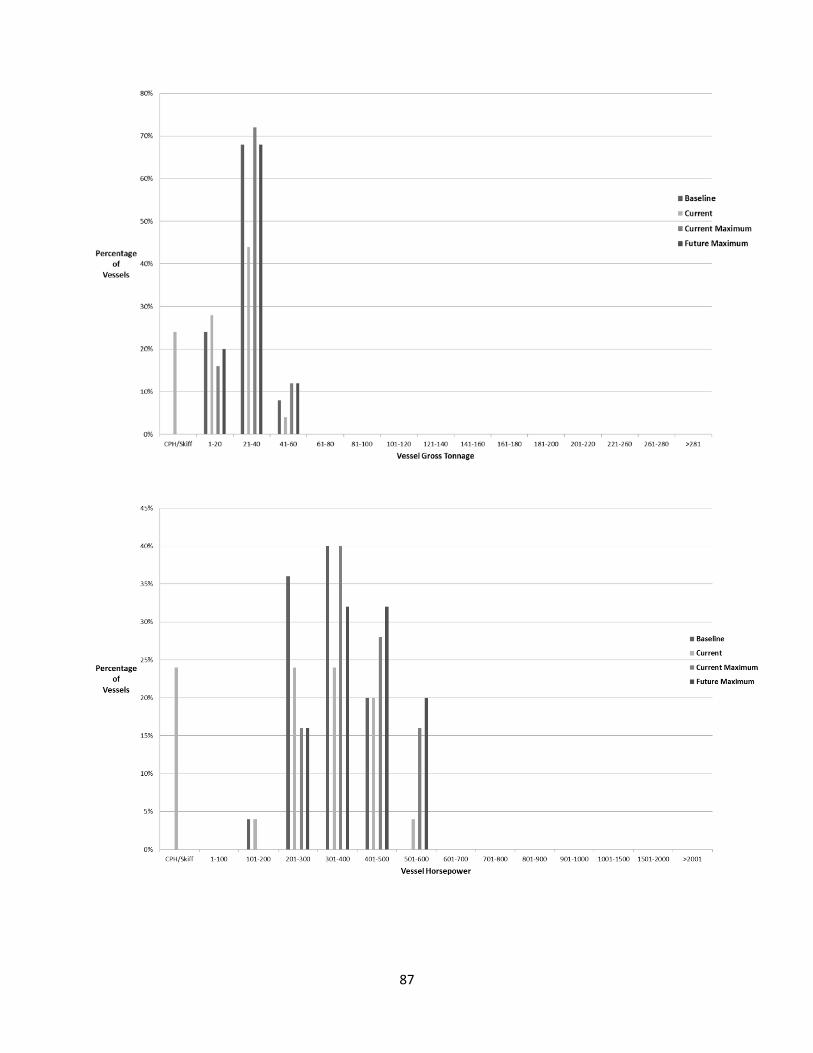
87

Figure 12. Limited Access Monkfish Vessel Size and Horsepower Frequency
88
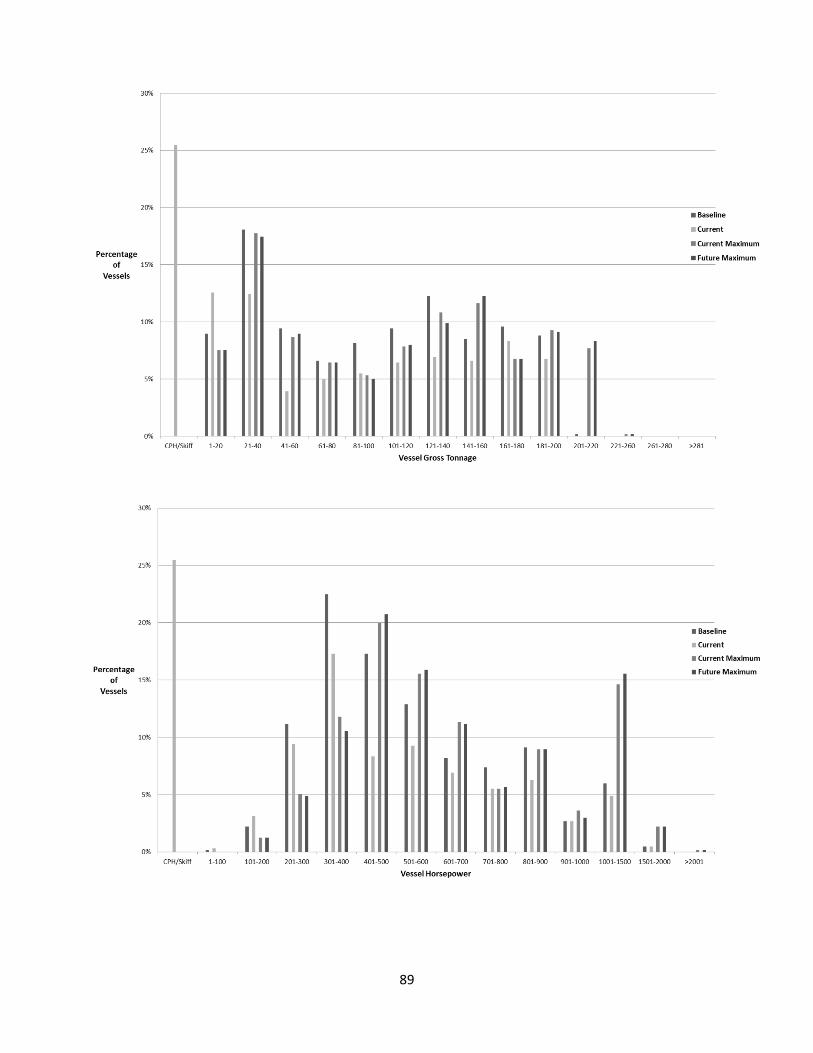
89

Figure 13. Limited Access NE Multispecies Vessel Size and Horsepower Frequency
90
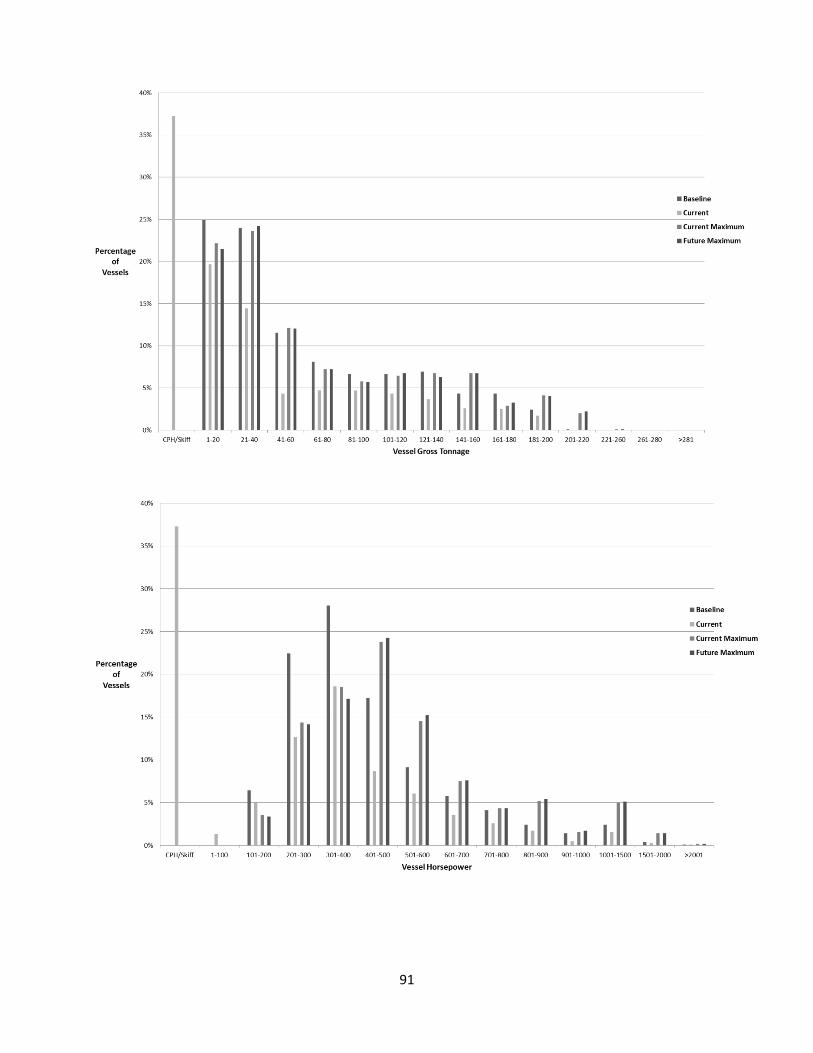
91
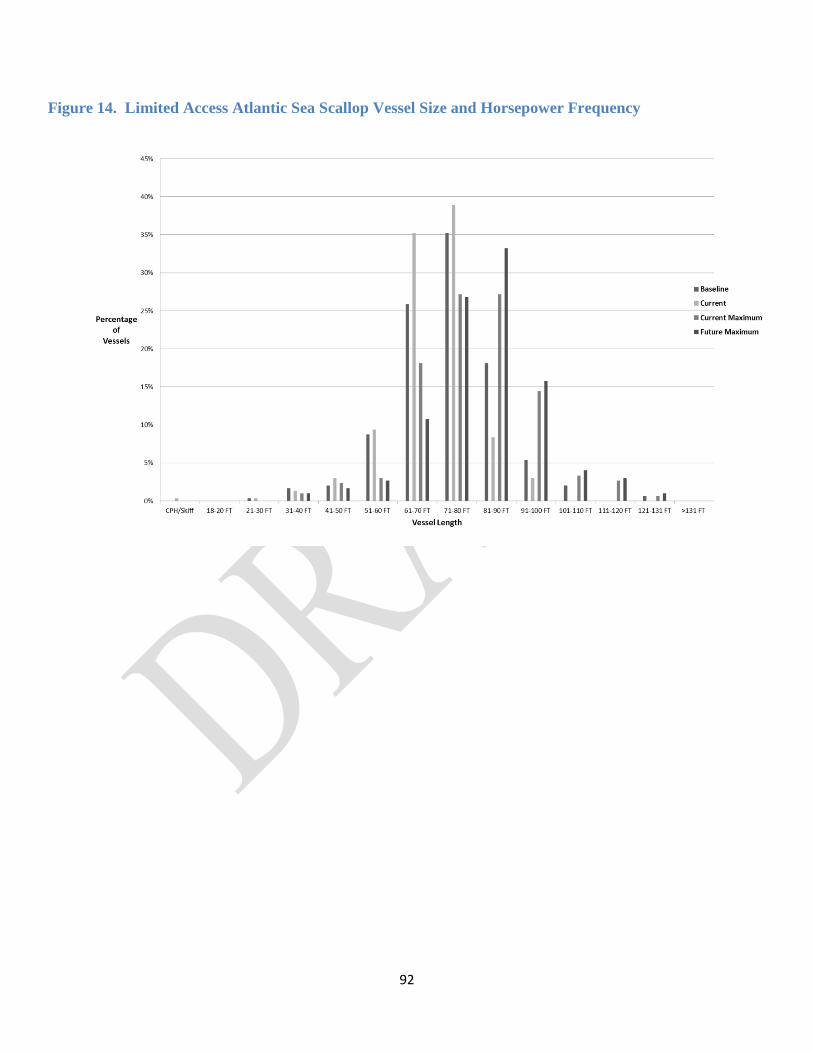
Figure 14. Limited Access Atlantic Sea Scallop Vessel Size and Horsepower Frequency
92
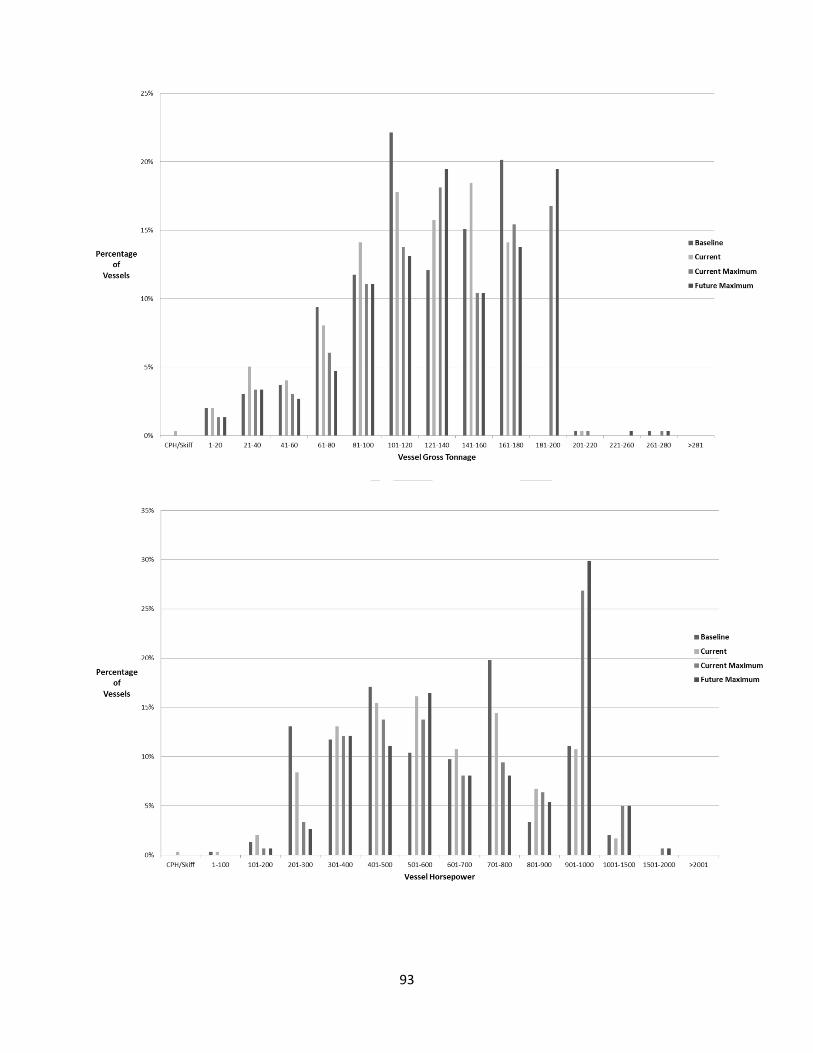
93

Figure 15. Limited Access Red Crab Vessel Size and Horsepower Frequency
94
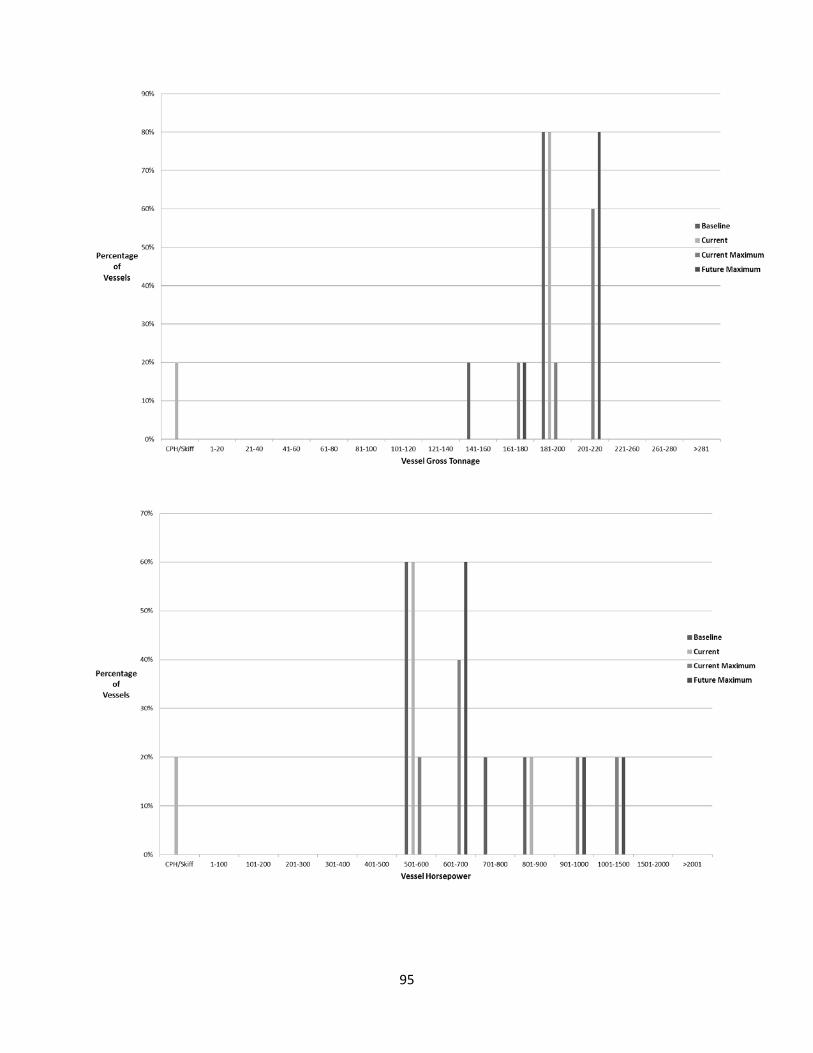
95
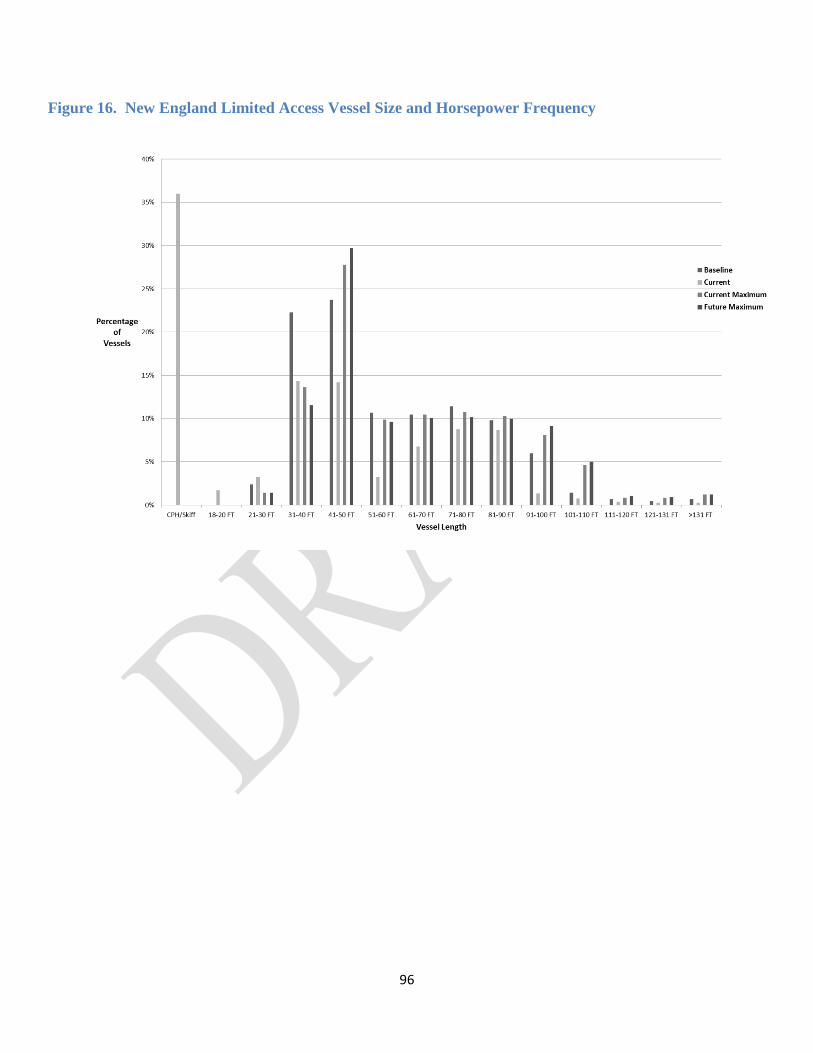
Figure 16. New England Limited Access Vessel Size and Horsepower Frequency
96
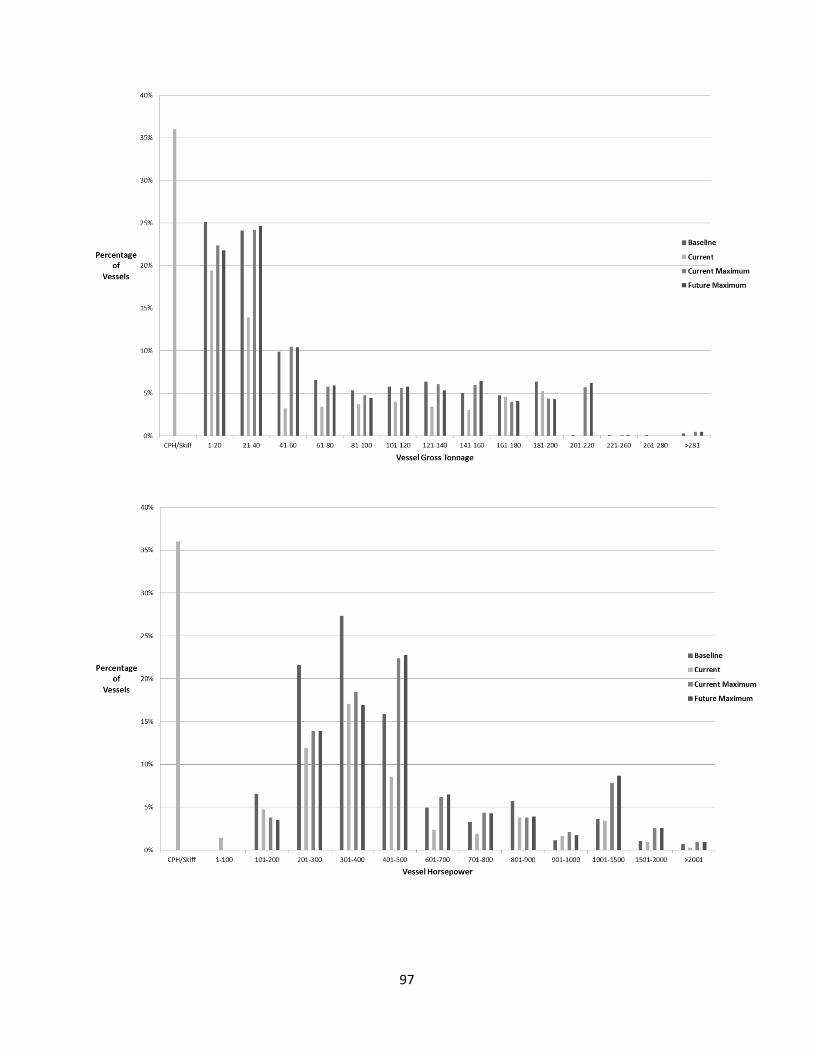
97
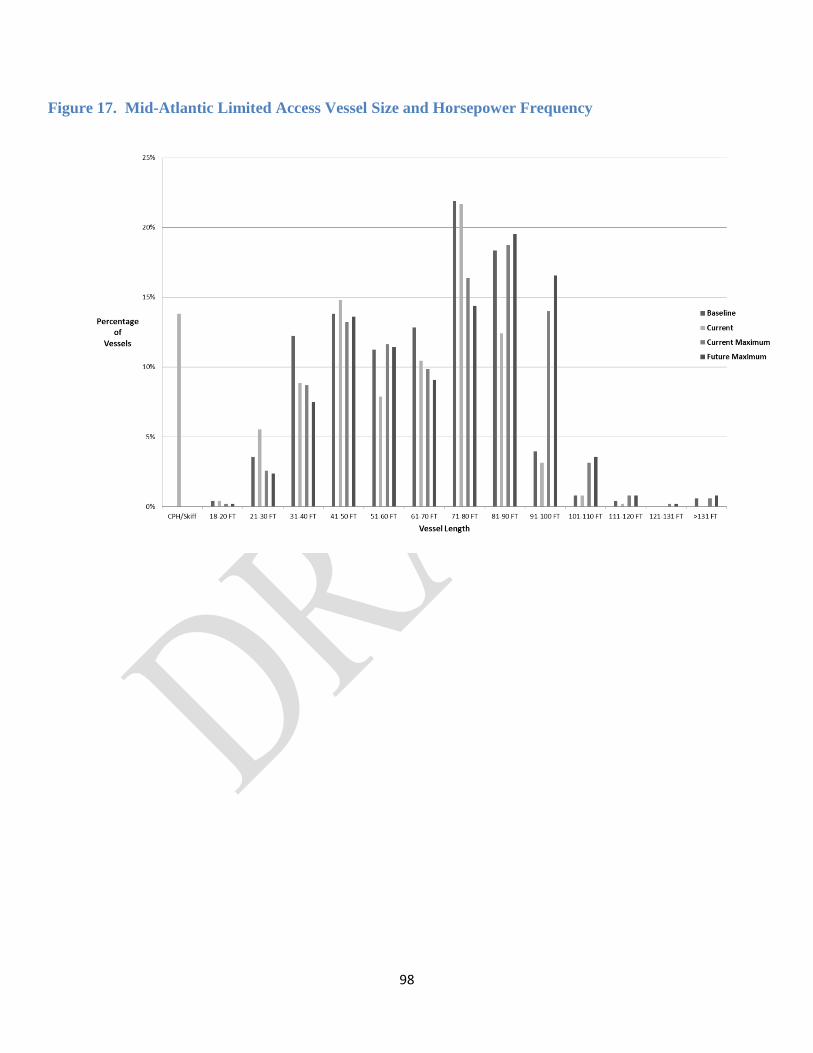
Figure 17. Mid-Atlantic Limited Access Vessel Size and Horsepower Frequency
98
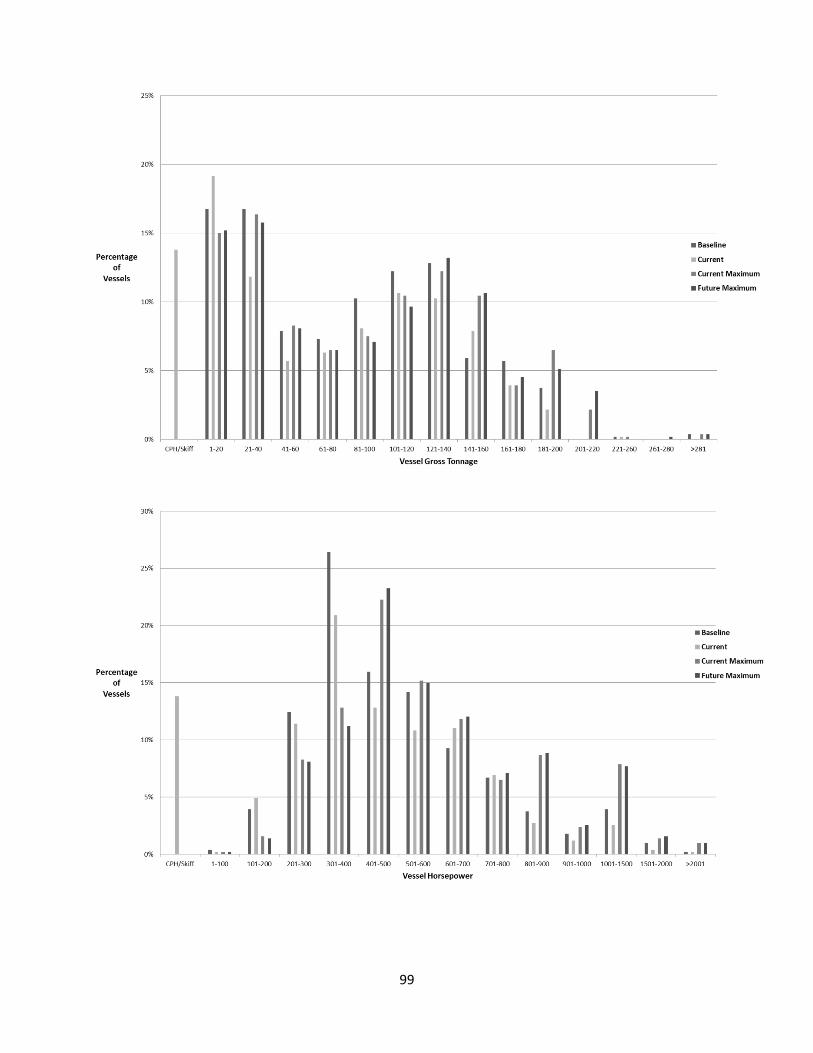
99
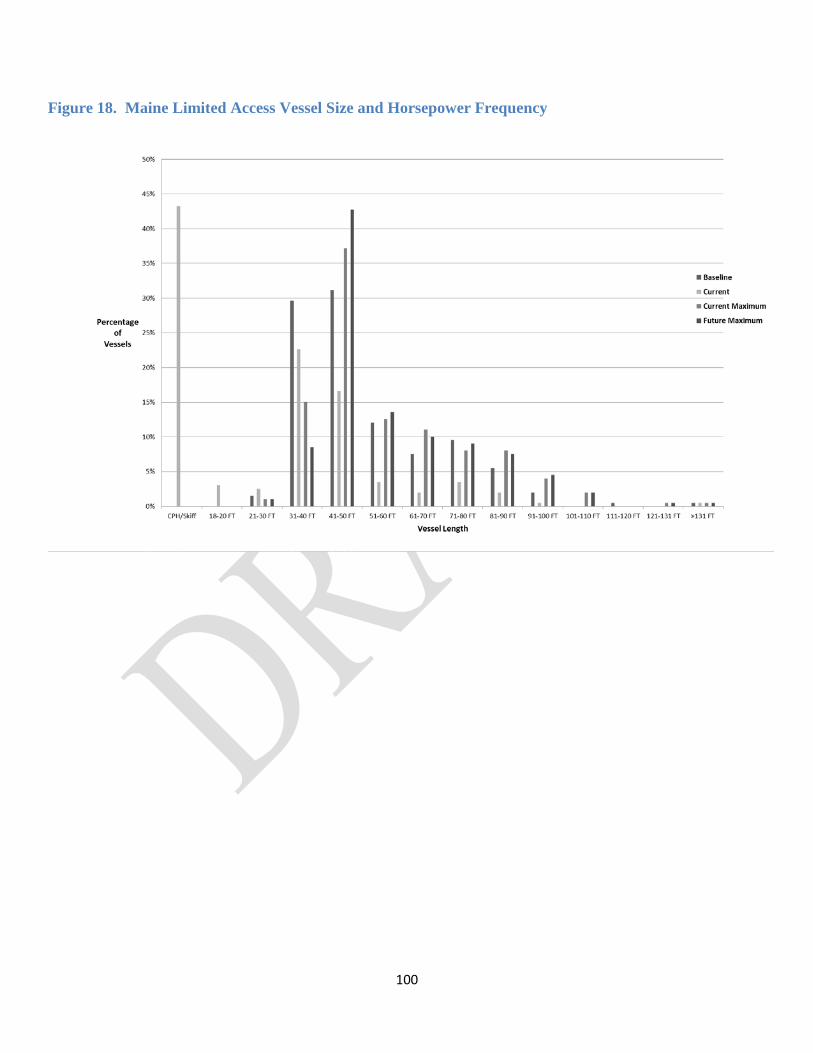
Figure 18. Maine Limited Access Vessel Size and Horsepower Frequency
100
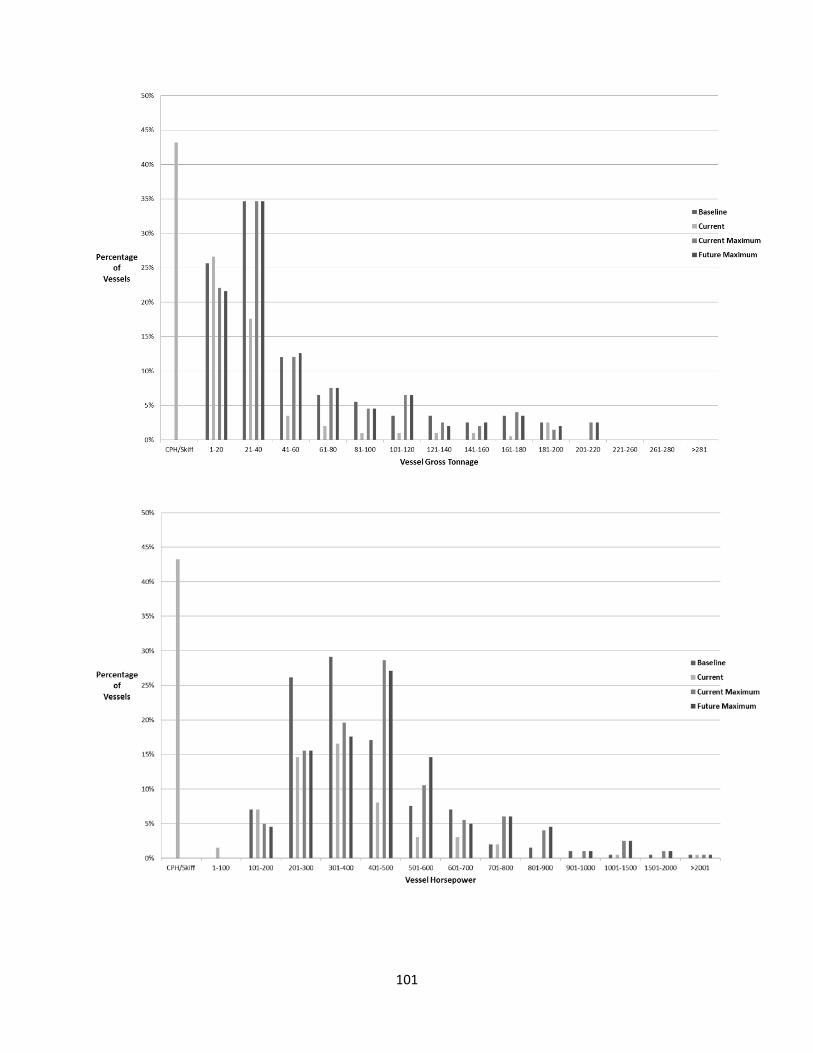
101
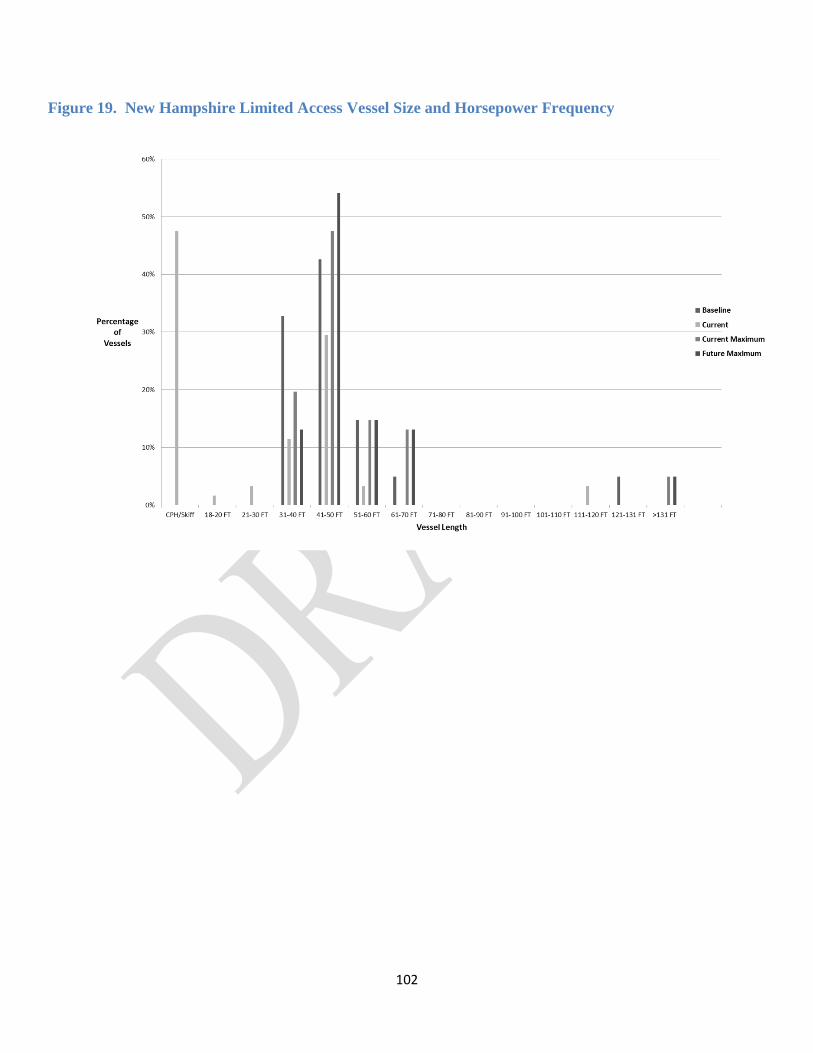
Figure 19. New Hampshire Limited Access Vessel Size and Horsepower Frequency
102
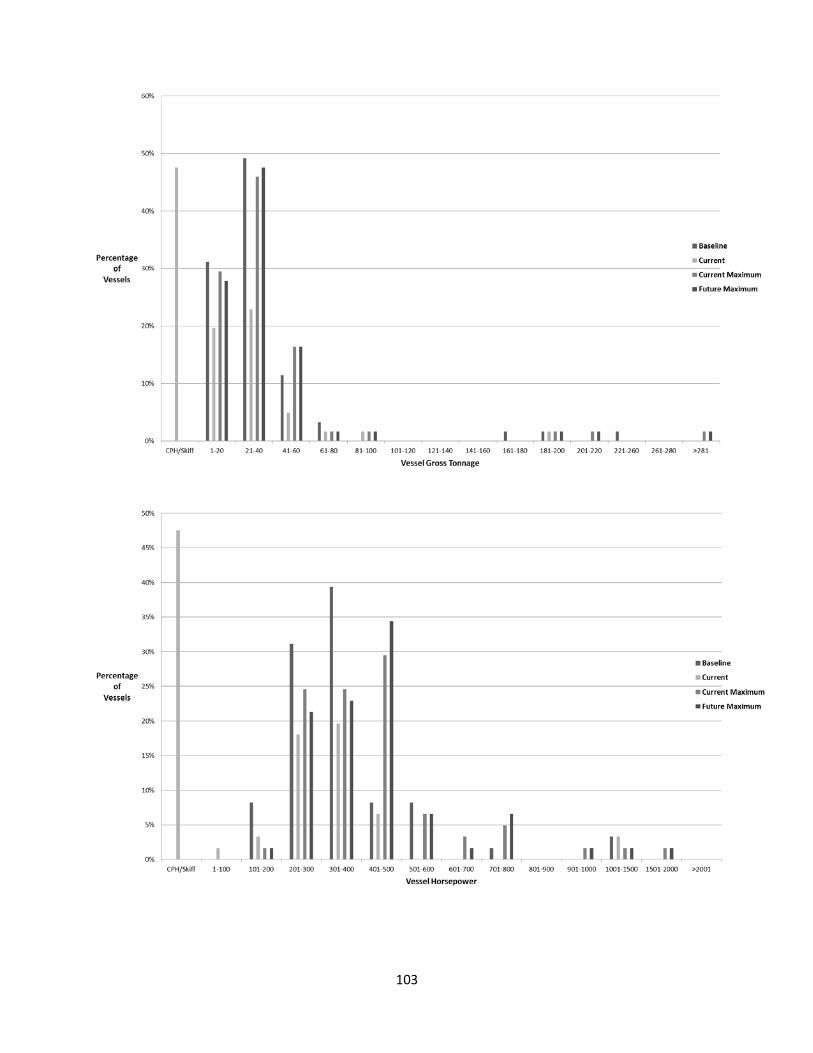
103
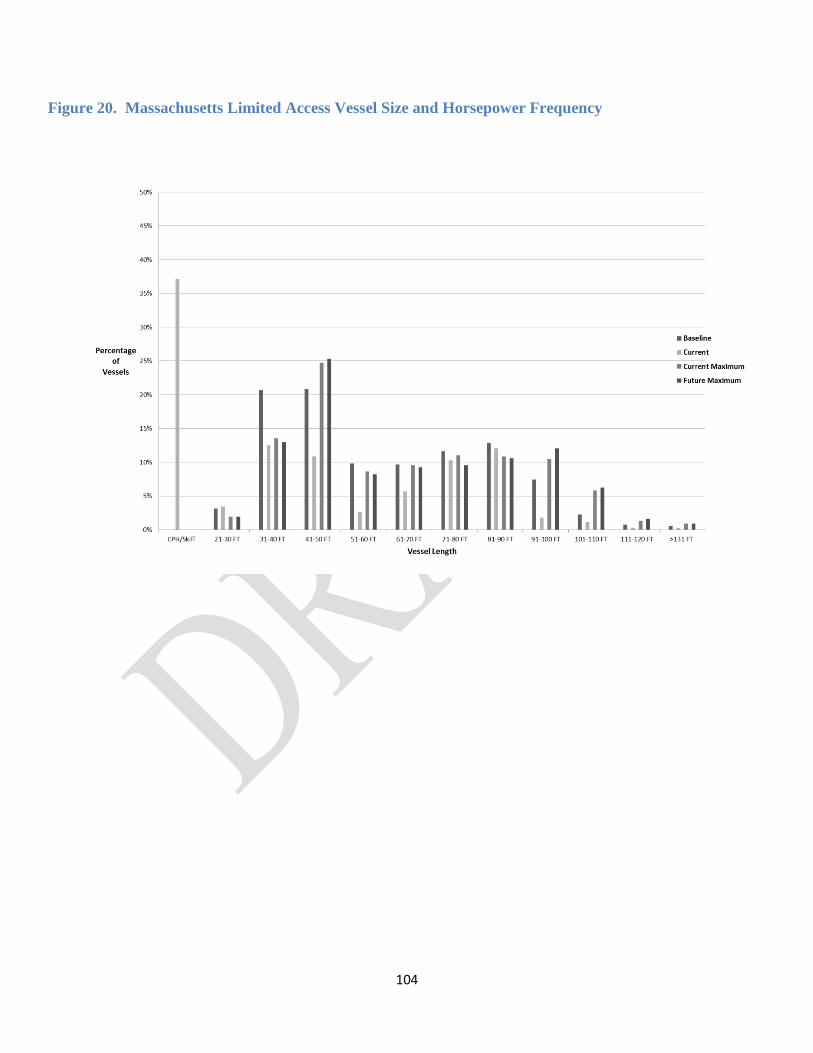
Figure 20. Massachusetts Limited Access Vessel Size and Horsepower Frequency
104
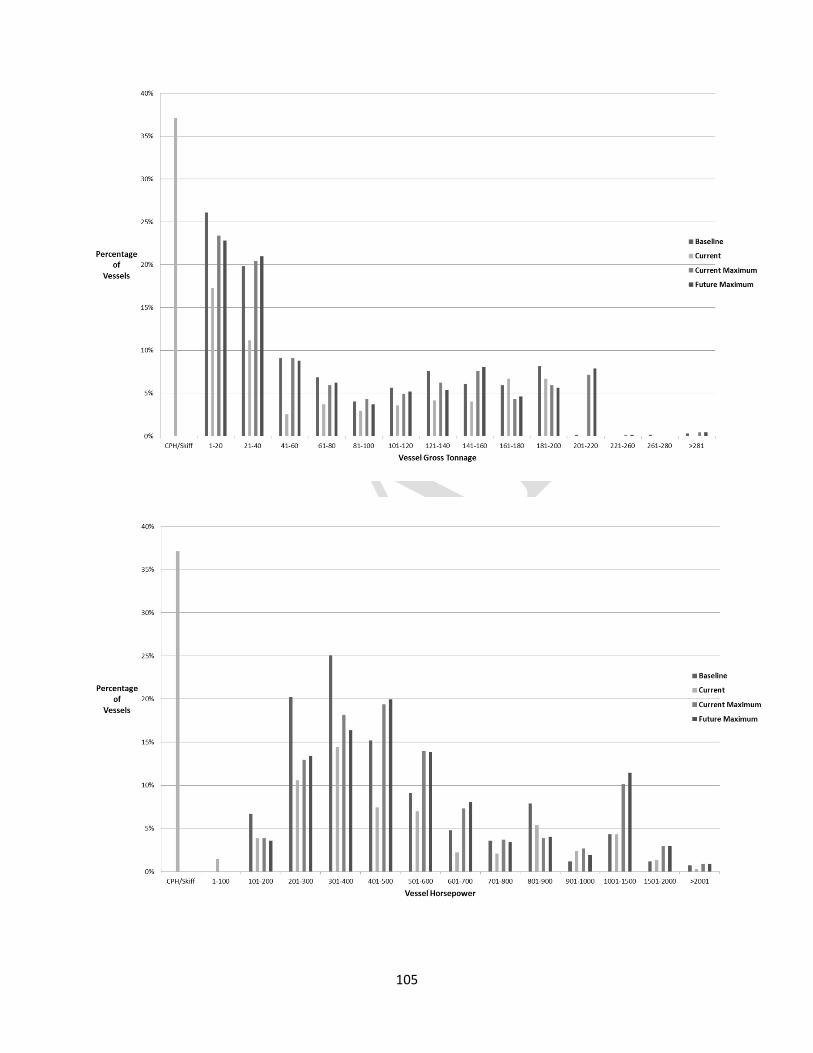
105
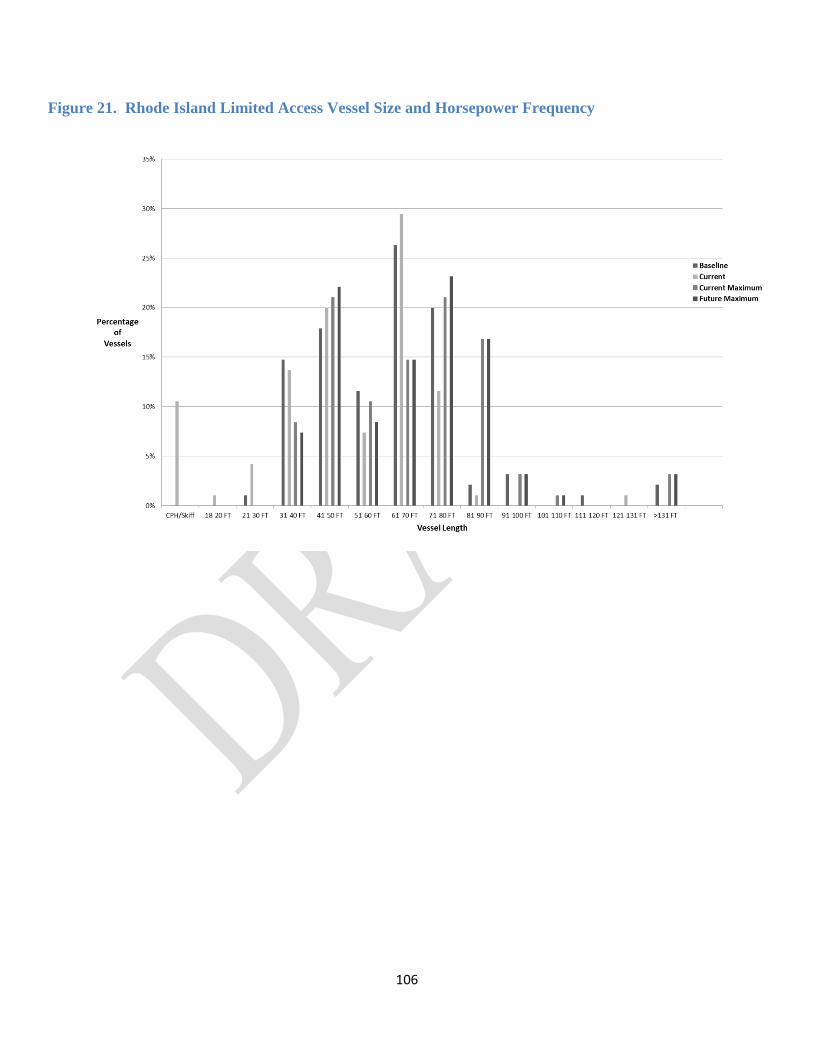
Figure 21. Rhode Island Limited Access Vessel Size and Horsepower Frequency
106
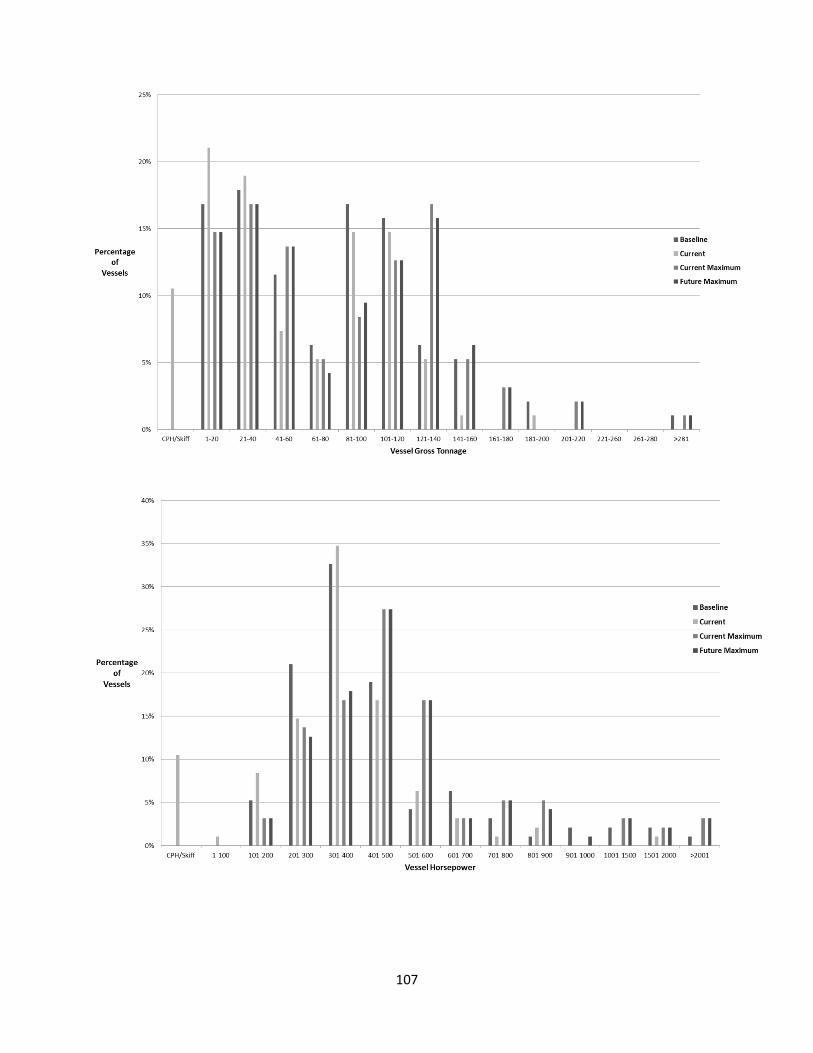
107
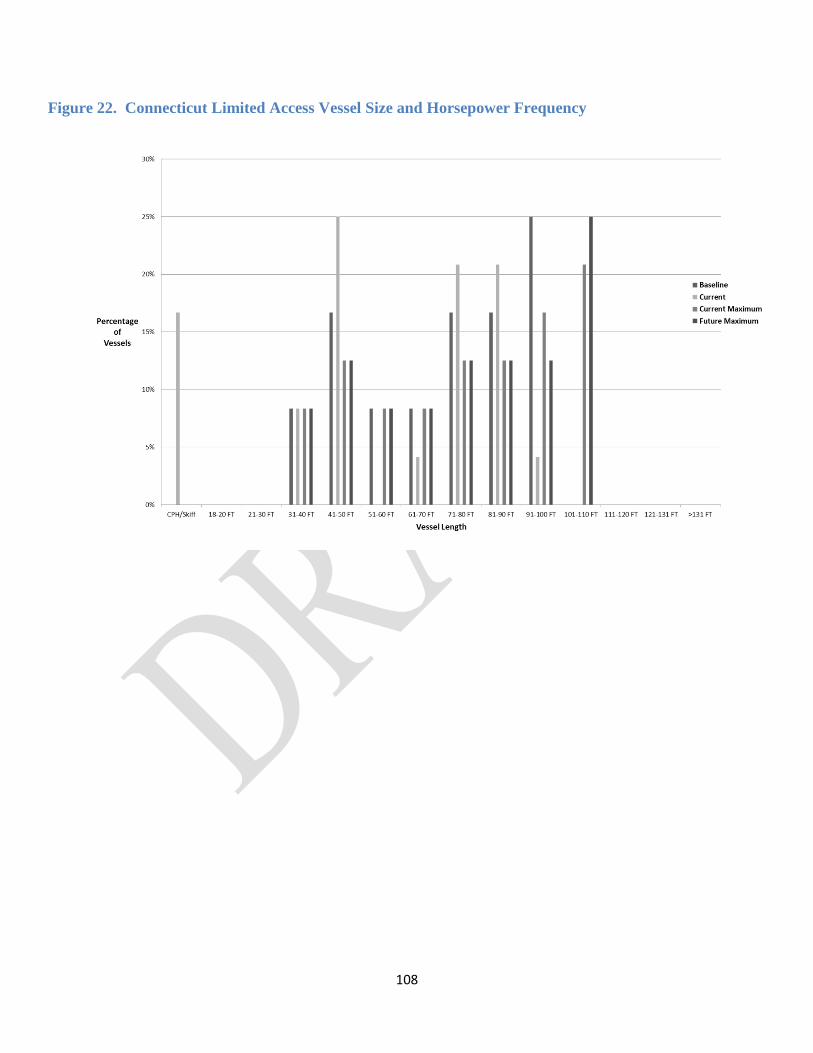
Figure 22. Connecticut Limited Access Vessel Size and Horsepower Frequency
108
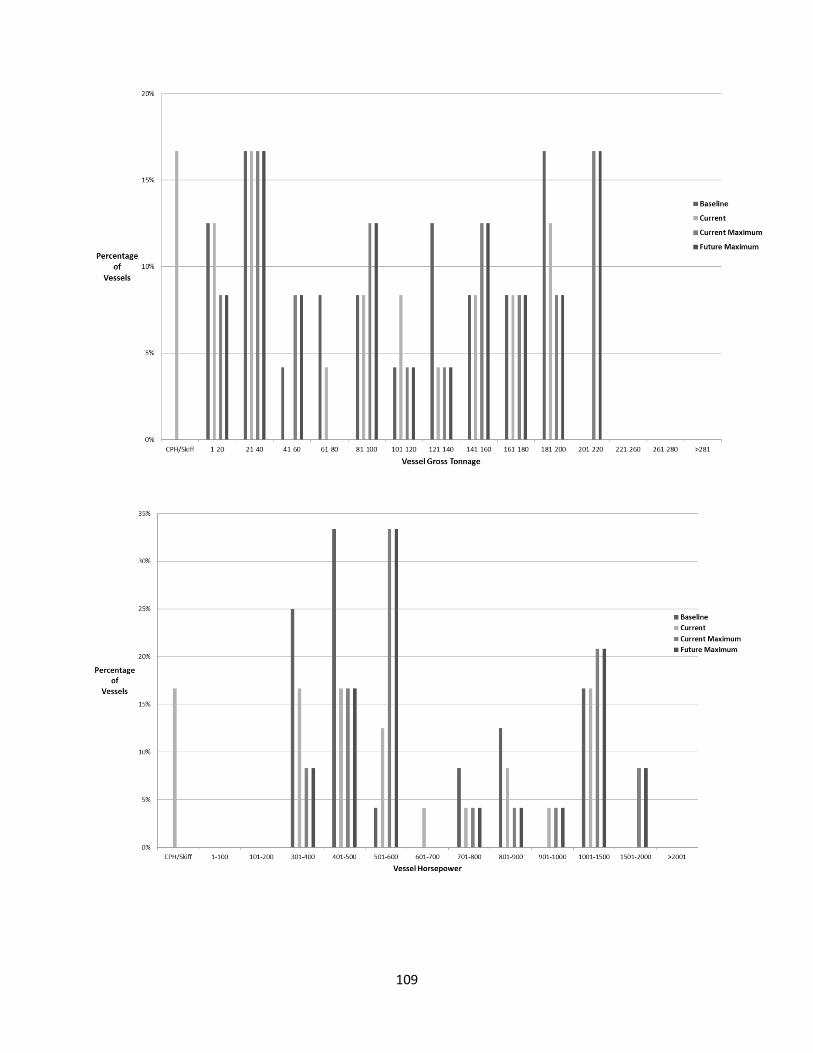
109
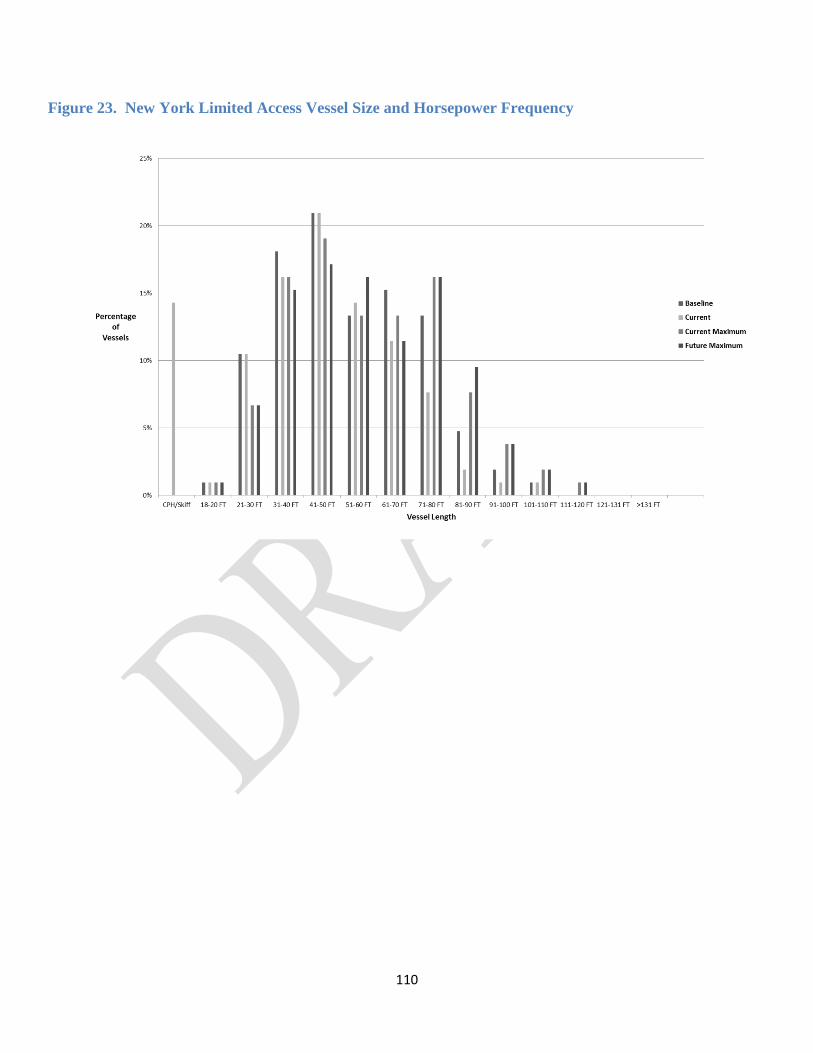
Figure 23. New York Limited Access Vessel Size and Horsepower Frequency
110
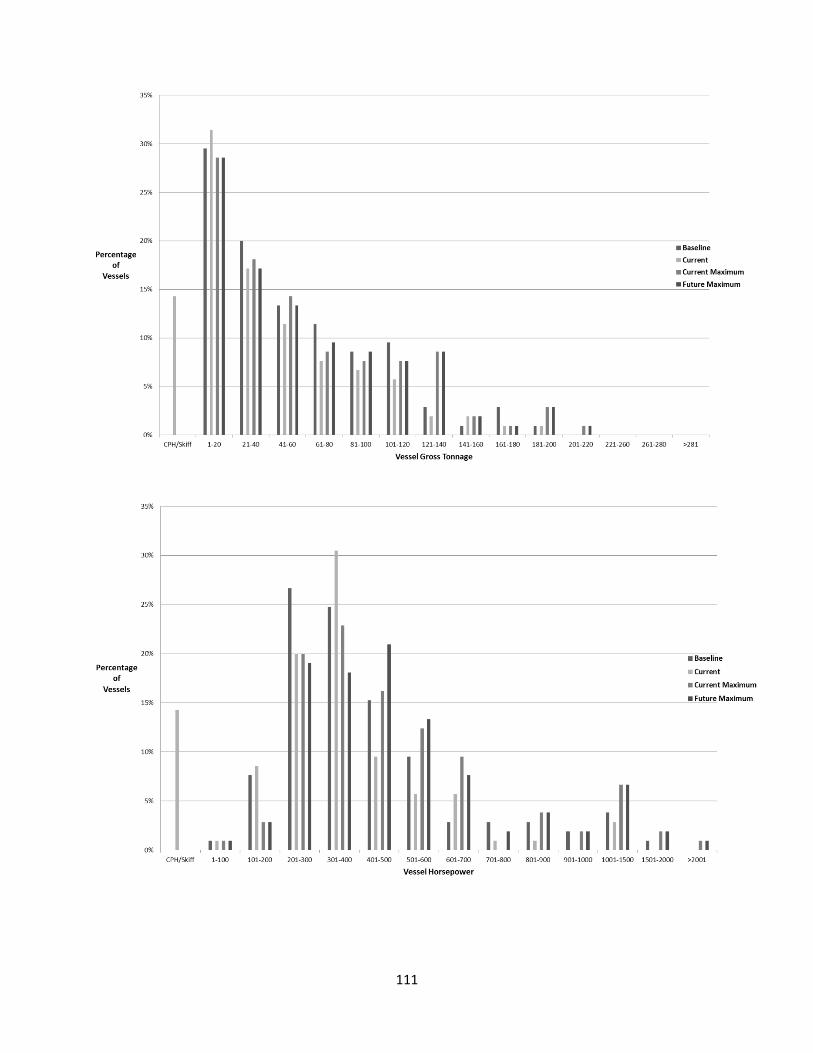
111
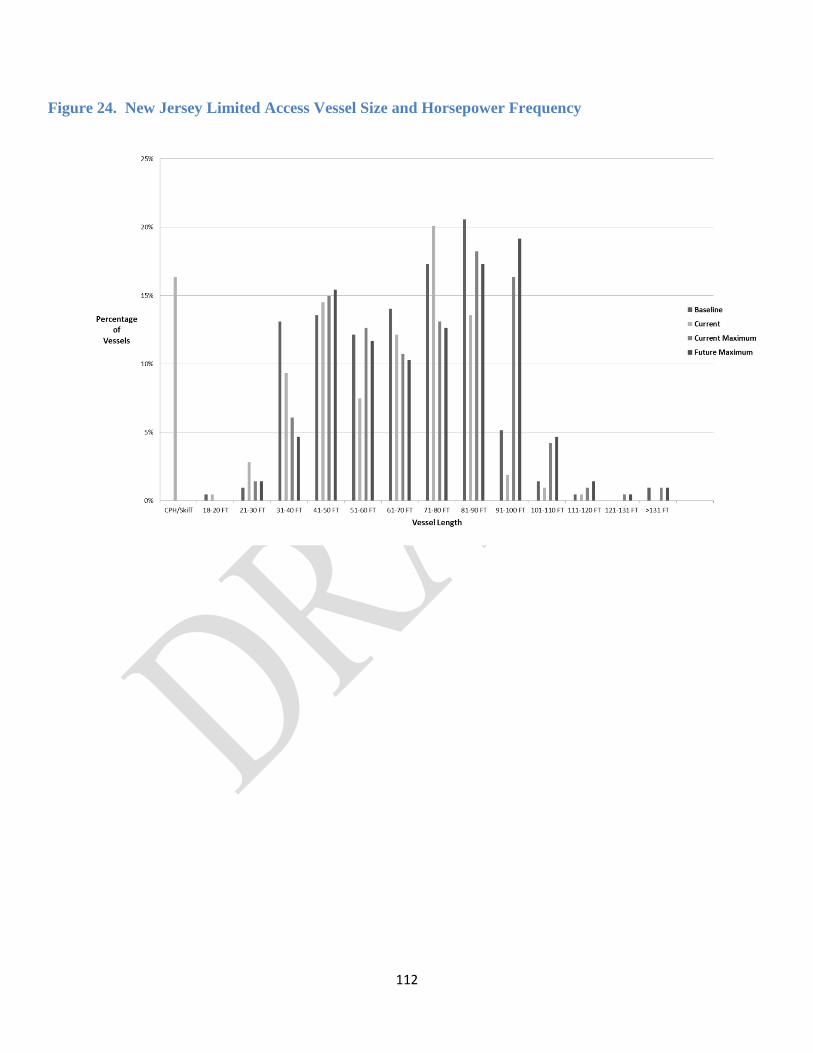
Figure 24. New Jersey Limited Access Vessel Size and Horsepower Frequency
112
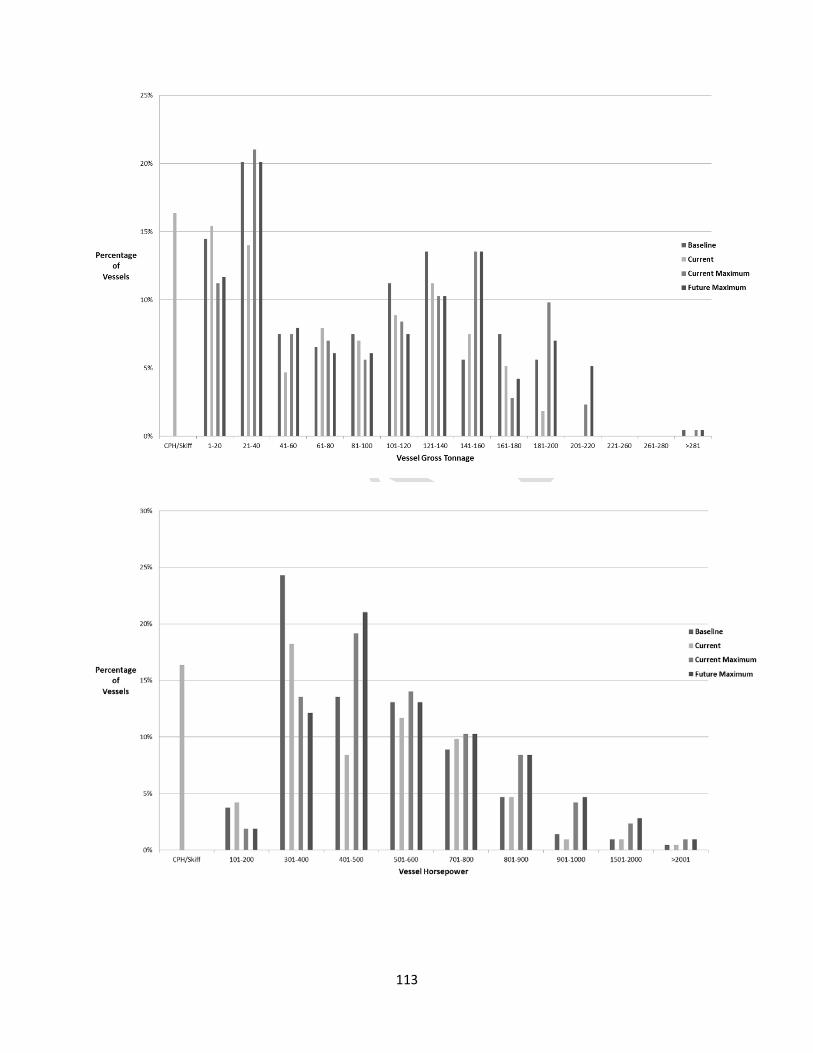
113
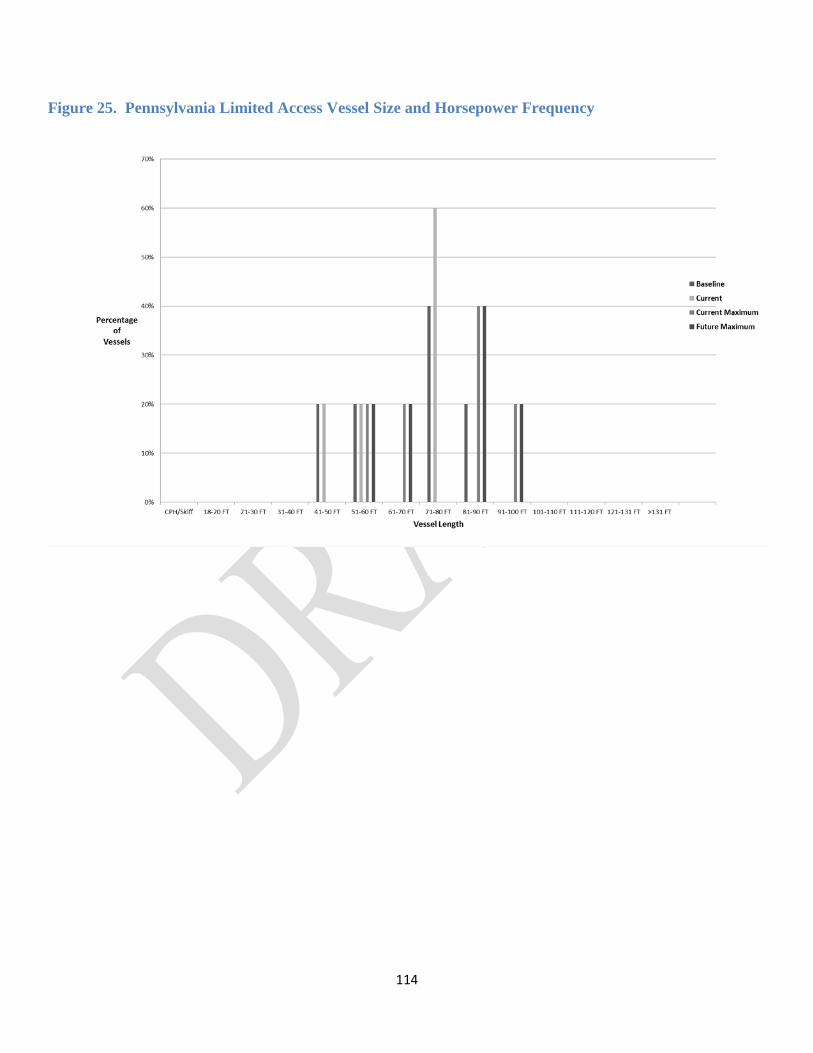
Figure 25. Pennsylvania Limited Access Vessel Size and Horsepower Frequency
114
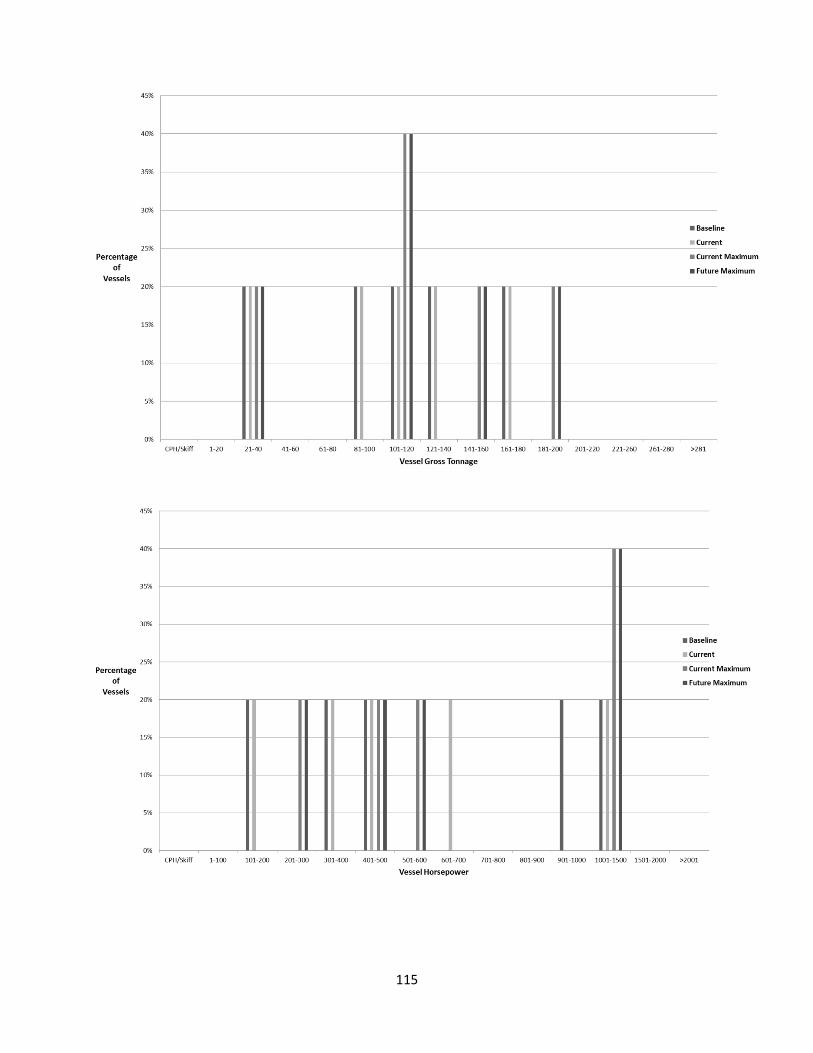
115

Figure 26. Delaware Limited Access Vessel Size and Horsepower Frequency
116

117
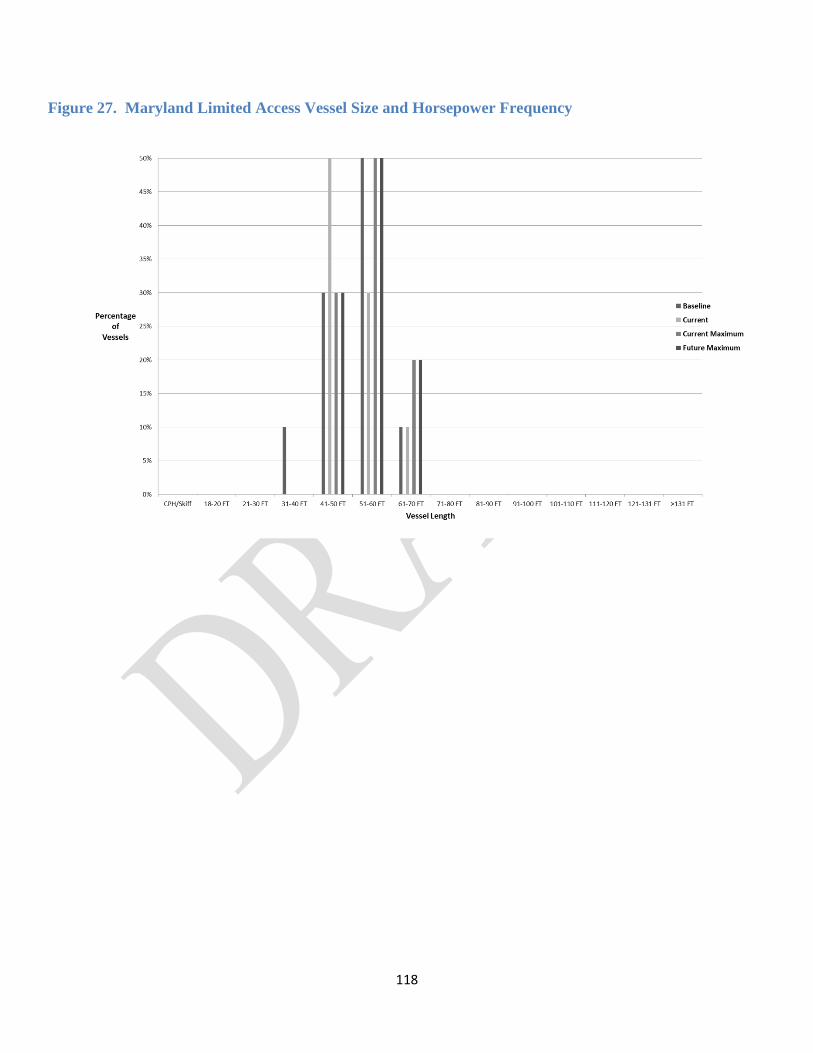
Figure 27. Maryland Limited Access Vessel Size and Horsepower Frequency
118
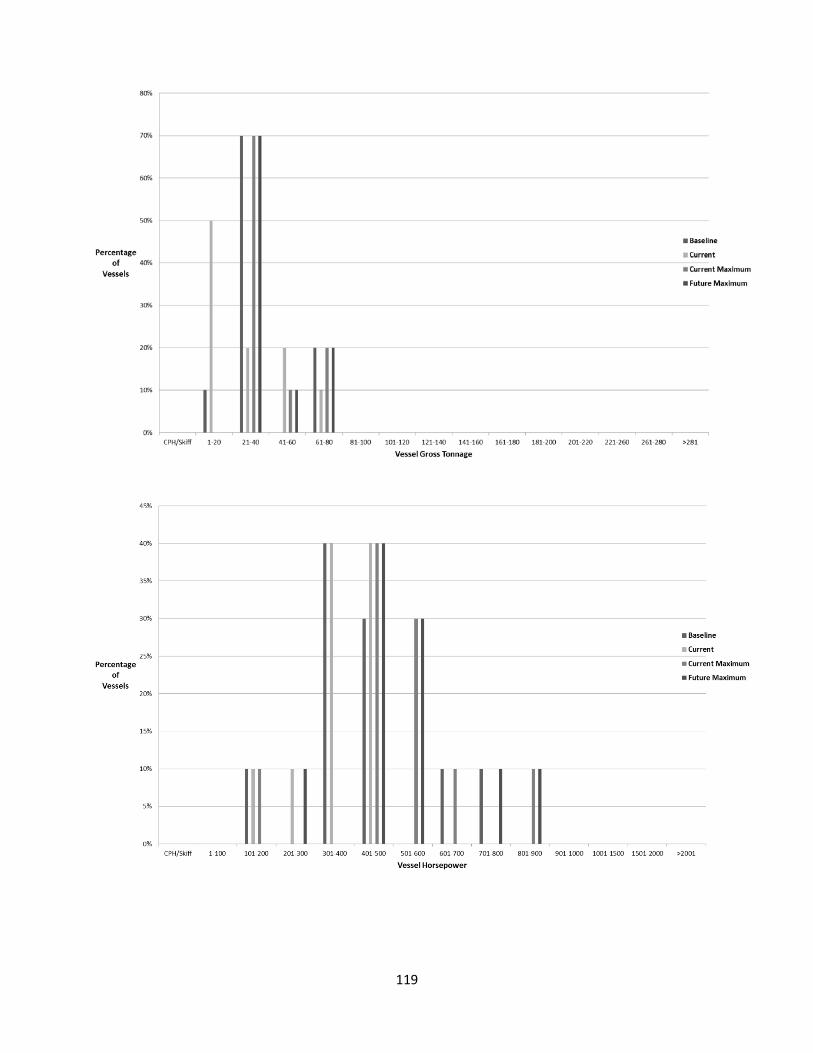
119
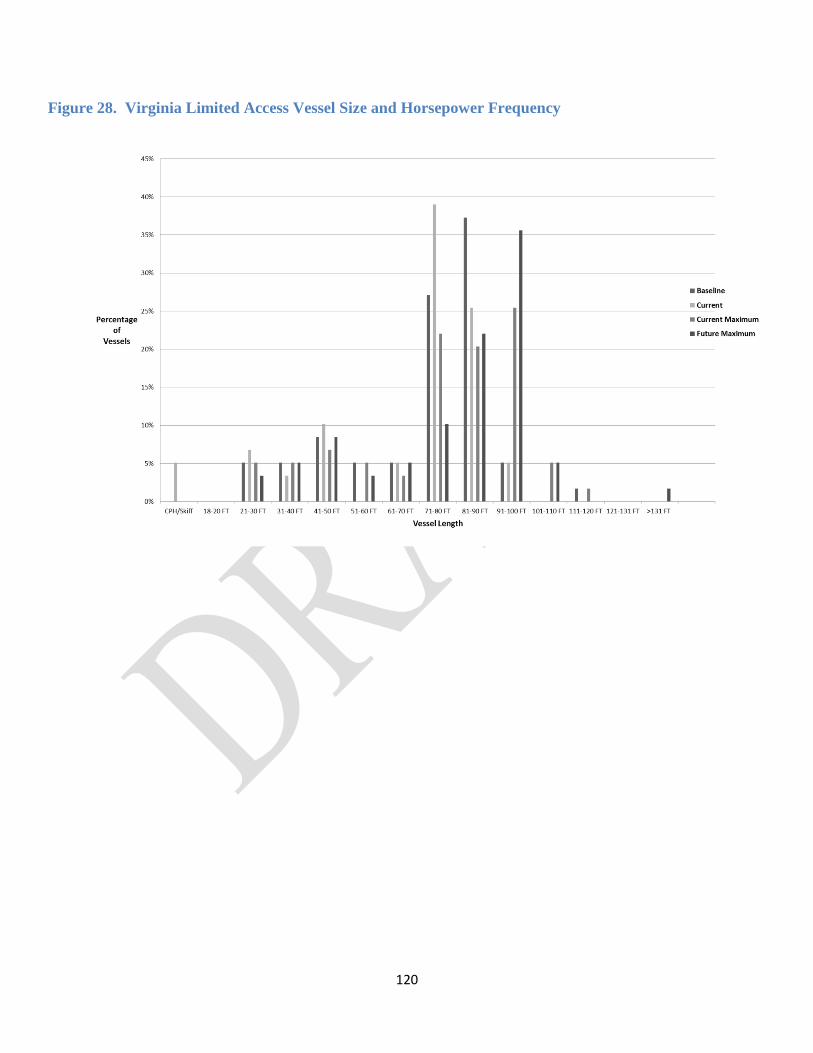
Figure 28. Virginia Limited Access Vessel Size and Horsepower Frequency
120
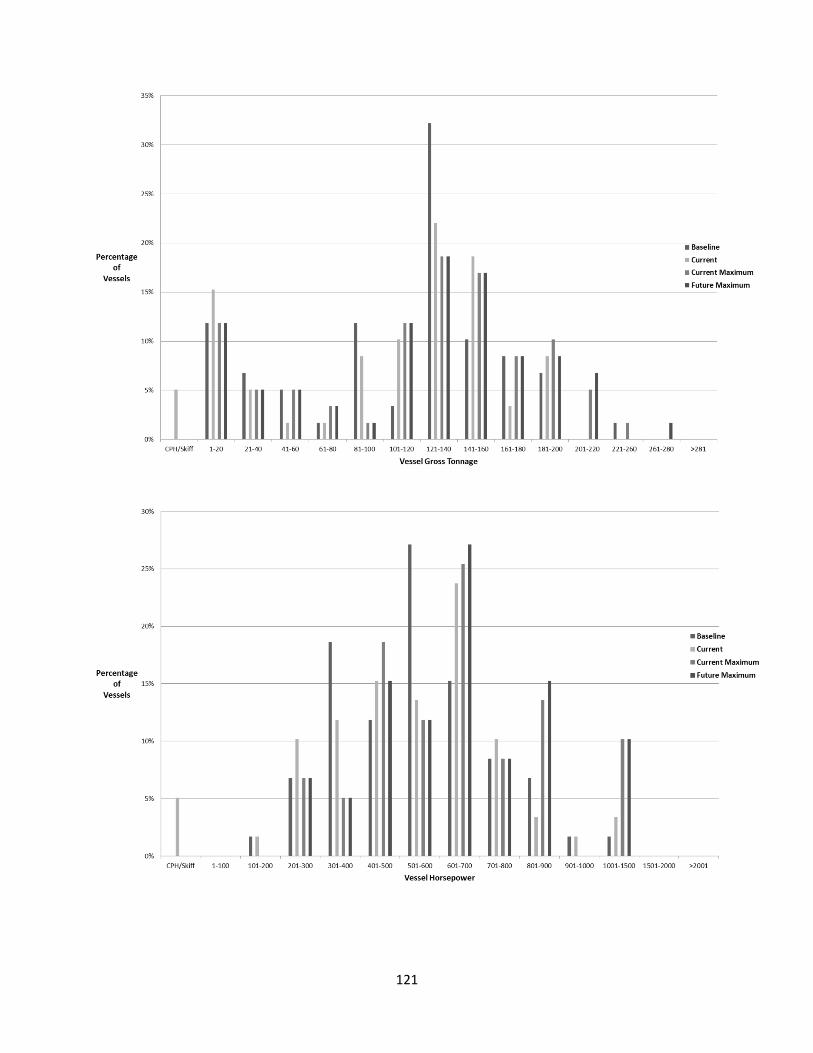
121
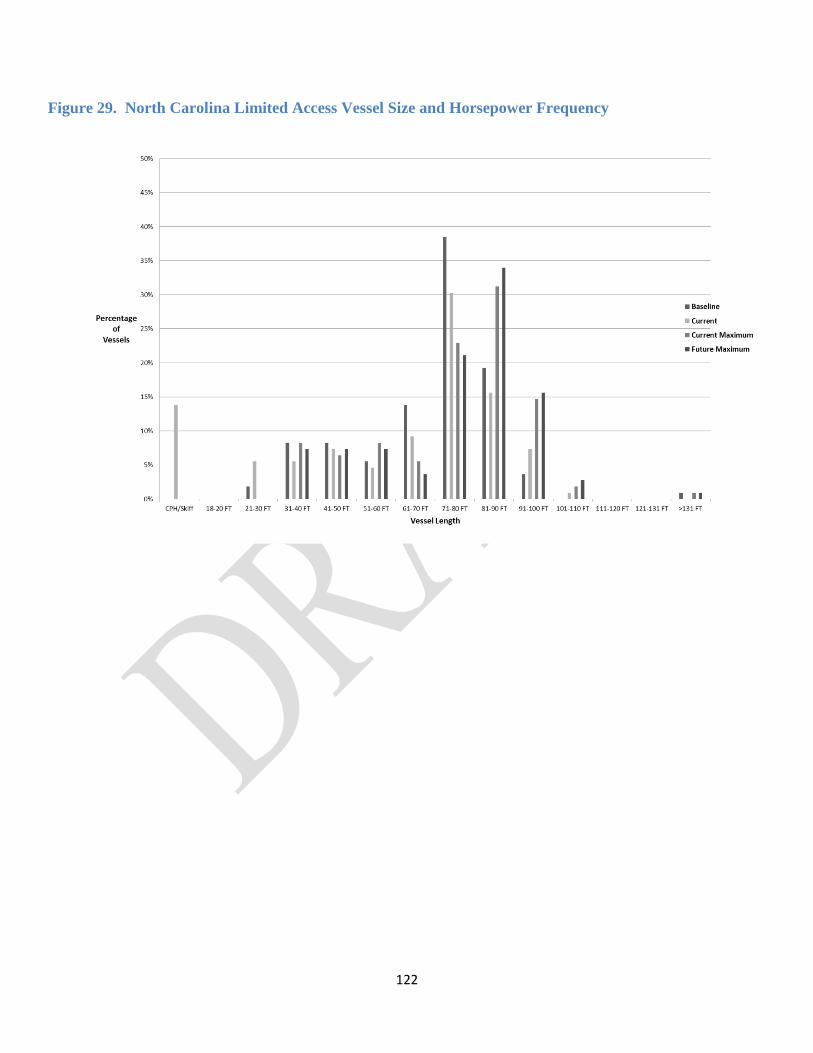
Figure 29. North Carolina Limited Access Vessel Size and Horsepower Frequency
122
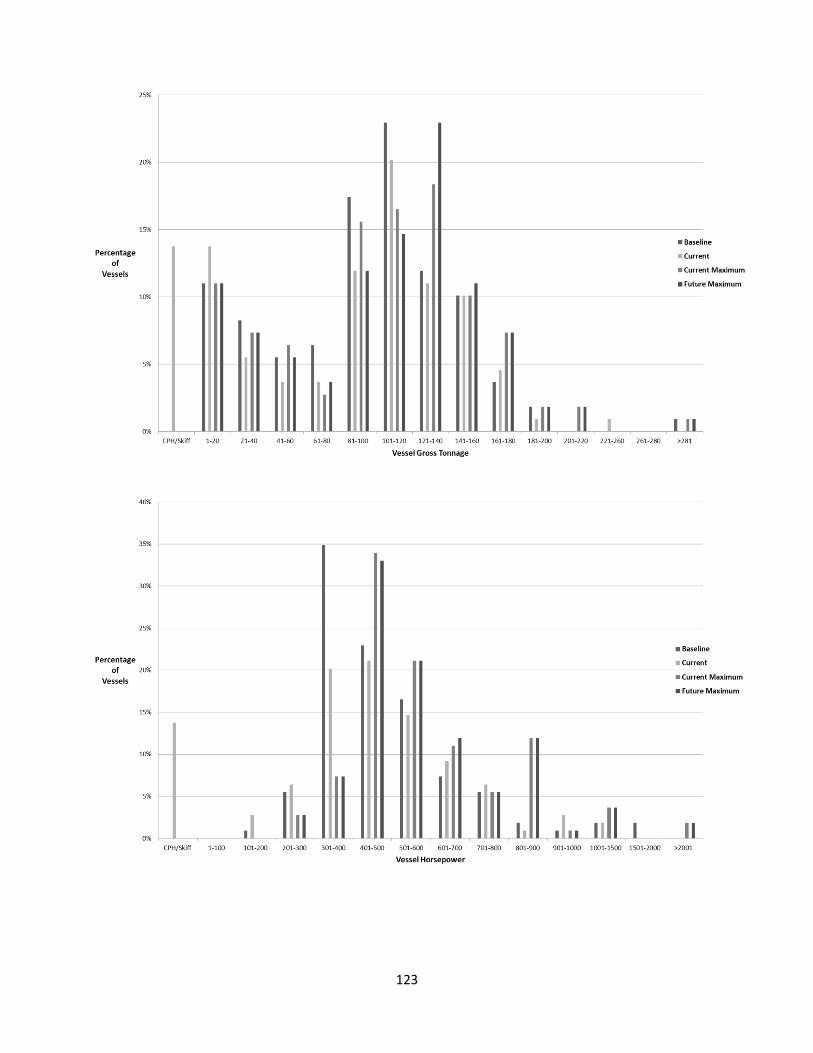
123