Embed Size (px)
Citation preview
October 2017 CCP:HFJU 17/4
This document is printed in limited numbers to minimize the environmental impact of FAO's processes and
contribute to climate neutrality. Delegates and observers are kindly requested to bring their copies to meetings
and to avoid asking for additional copies. Most FAO meeting documents are available on the Internet at
www.fao.org
E
COMMITTEE ON COMMODITY PROBLEMS
JOINT MEETING OF THE THIRTY-NINTH SESSION OF THE
INTERGOVERNMENTAL GROUP ON HARD FIBRES AND THE
FORTY-FIRST SESSION OF THE INTERGOVERNMENTAL GROUP
ON JUTE, KENAF AND ALLIED FIBRES
Tanga, United Republic of Tanzania, 15-17 November 2017
FUTURE DIRECTION OF JUTE: GEO-TEXTILE AND AGRO-
TEXTILE TECHNIQUES AS POTENTIAL AVENUES FOR GROWTH
AND PRODUCT DIVERSIFICATION IN THE INDIAN JUTE
INDUSTRY
I. INTRODUCTION
1. Jute is the second most important natural fibre produced in India, after cotton, and source of
livelihood for about 4 million farmers and their families. Its processing and production of associated
goods provide employment to more than 400 000 people. Jute plays an important role in the economy
of the eastern and north-eastern states, spanning both agriculture and industry sectors.
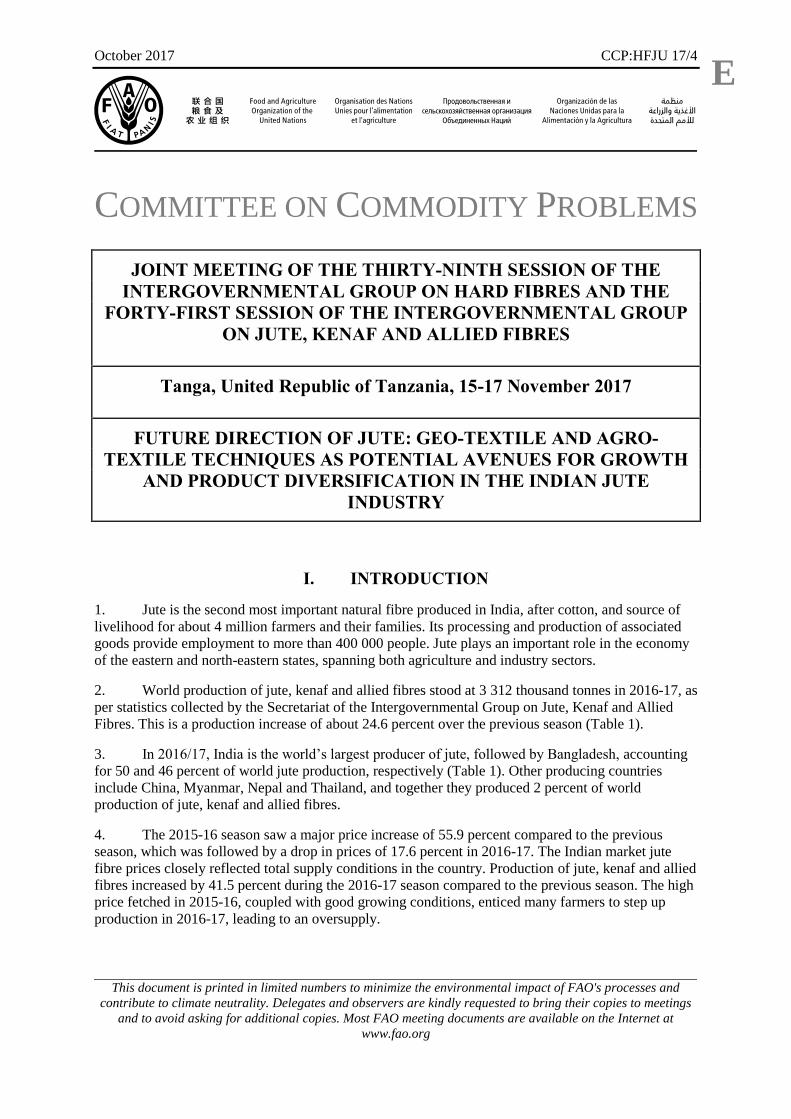
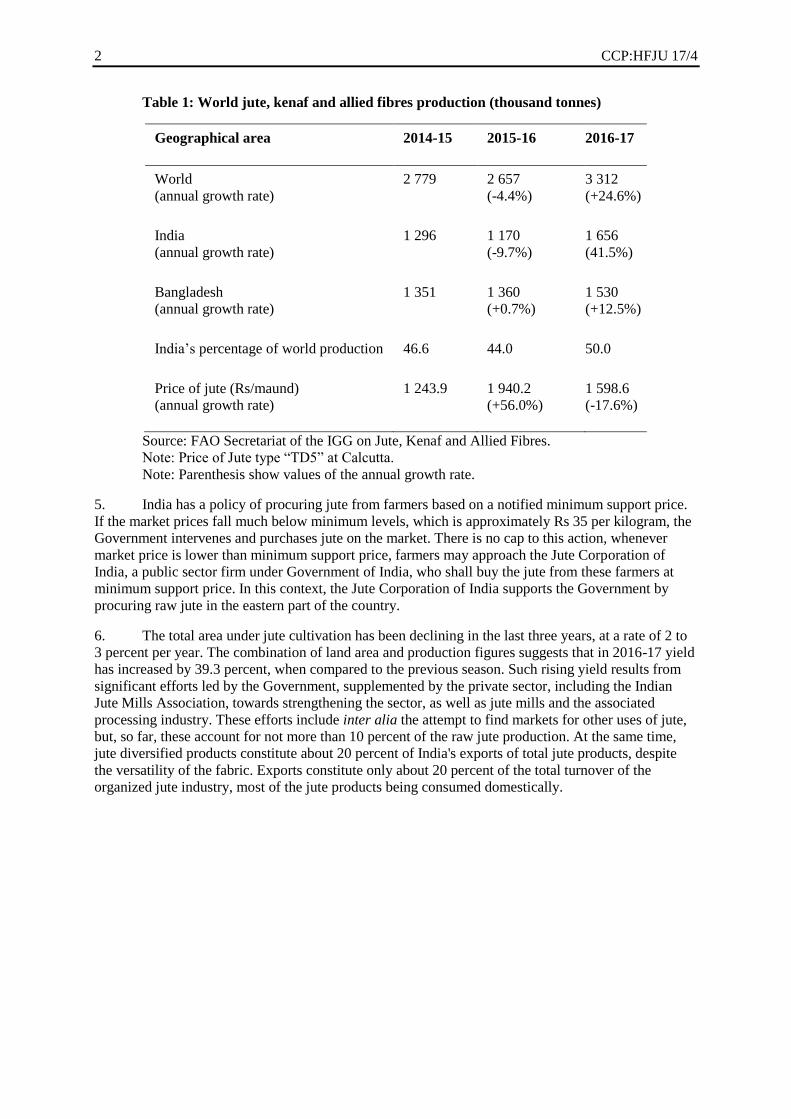
2. World production of jute, kenaf and allied fibres stood at 3 312 thousand tonnes in 2016-17, as
per statistics collected by the Secretariat of the Intergovernmental Group on Jute, Kenaf and Allied
Fibres. This is a production increase of about 24.6 percent over the previous season (Table 1).
3. In 2016/17, India is the world’s largest producer of jute, followed by Bangladesh, accounting
for 50 and 46 percent of world jute production, respectively (Table 1). Other producing countries
include China, Myanmar, Nepal and Thailand, and together they produced 2 percent of world
production of jute, kenaf and allied fibres.
4. The 2015-16 season saw a major price increase of 55.9 percent compared to the previous
season, which was followed by a drop in prices of 17.6 percent in 2016-17. The Indian market jute
fibre prices closely reflected total supply conditions in the country. Production of jute, kenaf and allied
fibres increased by 41.5 percent during the 2016-17 season compared to the previous season. The high
price fetched in 2015-16, coupled with good growing conditions, enticed many farmers to step up
production in 2016-17, leading to an oversupply.
2 CCP:HFJU 17/4
Table 1: World jute, kenaf and allied fibres production (thousand tonnes)
Geographical area 2014-15 2015-16 2016-17
World
(annual growth rate)
2 779 2 657
(-4.4%)
3 312
(+24.6%)
India
(annual growth rate)
1 296 1 170
(-9.7%)
1 656
(41.5%)
Bangladesh
(annual growth rate)
1 351 1 360
(+0.7%)
1 530
(+12.5%)
India’s percentage of world production 46.6 44.0 50.0
Price of jute (Rs/maund)
(annual growth rate)
1 243.9 1 940.2
(+56.0%)
1 598.6
(-17.6%)
Source: FAO Secretariat of the IGG on Jute, Kenaf and Allied Fibres.
Note: Price of Jute type “TD5” at Calcutta.
Note: Parenthesis show values of the annual growth rate.
5. India has a policy of procuring jute from farmers based on a notified minimum support price.
If the market prices fall much below minimum levels, which is approximately Rs 35 per kilogram, the
Government intervenes and purchases jute on the market. There is no cap to this action, whenever
market price is lower than minimum support price, farmers may approach the Jute Corporation of
India, a public sector firm under Government of India, who shall buy the jute from these farmers at
minimum support price. In this context, the Jute Corporation of India supports the Government by
procuring raw jute in the eastern part of the country.
6. The total area under jute cultivation has been declining in the last three years, at a rate of 2 to
3 percent per year. The combination of land area and production figures suggests that in 2016-17 yield
has increased by 39.3 percent, when compared to the previous season. Such rising yield results from
significant efforts led by the Government, supplemented by the private sector, including the Indian
Jute Mills Association, towards strengthening the sector, as well as jute mills and the associated
processing industry. These efforts include inter alia the attempt to find markets for other uses of jute,
but, so far, these account for not more than 10 percent of the raw jute production. At the same time,
jute diversified products constitute about 20 percent of India's exports of total jute products, despite
the versatility of the fabric. Exports constitute only about 20 percent of the total turnover of the
organized jute industry, most of the jute products being consumed domestically.
CCP:HFJU 17/4 3
Table 2: Area under jute cultivation and yield in India
2013-14 2014-15 2015-16 2016-17
Area
838 810
(-3.3%)
785
(-3.1%)
765
(-2.6%)
Yield (tonne per ha) 1.94 1.58
(-18.1%)
1.58
(0.0%)
2.20
(+39.3%)
Source: FAO Secretariat of the IGG on Jute, Kenaf and Allied Fibres.
Note: Parenthesis show values of the annual growth rate.
II. EXPORTS OF JUTE GOODS: TOWARDS A MORE DIVERSIFIED
INDUSTRY
7. The export value of jute goods in 2016-17 is USD 324 million, 10 percent higher than in
2015-16. The main jute-based products exported are hessian, sacking, yarn and jute-diversified
products (JDPs), which include scrim cloth, webbing – especially treated bags – fabric, shopping and
carry bags, floor covering and home textiles.
8. Hessian and sacking represent more than half of the exports of all jute products made in India.
These exports are also characterized by the highest growth rates, reaching a 12.4 and 33.9 percent
increase in 2016-17, respectively. The economic value of JDPs exports has remained constant
throughout the period of analysis, representing nearly 30 percent of the total exports value. The value
of yarn exports has been declining for the last 3 years down to nearly half the amount attained in 2014-
15 (Table 3).
Table 3: Exports of jute products (million USD)
Year Hessian Sacking Yarn JDPs Others Total
2014-15 120.21
(42.4)
46.32
(16.3)
21.67
(7.6)
79.44
(28.0)
15.68
(5.5)
283.32
2015-16 129.23
(43.7)
48.03
(16.2)
18.52
(6.3)
87.85
(29.7)
11.96
(4.0)
295.58
2016-17 145.29
(44.8)
64.32
(19.9)
11.36
(3.5)
92.31
(28.5)
10.70
(3.3)
323.99
Note: Parenthesis values are shares of total exports.
9. The declining trend in exports of jute yarn from India is attributed to a reduction in the use of
jute yarn by the carpet industry in Europe, which has either shifted to more synthetic fibres or to other
jute suppliers, including the Middle East, particularly Egypt. The Middle Eastern region traditionally
relied on jute yarn in weft for manufacturing carpets; it has now largely shifted to synthetic fibres. Jute
as face yarn of woven carpet has been replaced almost completely, inducing the industry to explore
new avenues for diversification.
10. India exports jute goods to a wide set of countries across all continents. Appendix 9 shows
India’s top ten export markets. The USA leads the list with Rs. 3 908 million. The number of countries
4 CCP:HFJU 17/4
where Indian jute products are exported is rather diverse with no other single country enjoying a two-
digit share of the total exports, except the USA. This means that exports of jute-based products from
India may be resilient to macro-economic shocks that can occur in the domestic economies of
consuming countries. It also implies that an effective national policy supporting India’s exports of jute
products will need to take into account the specificities of each country/market.
11. The exports by destination and per type of jute product further reiterates the need for a
promotion and marketing approach that builds on each market’s specificities and preferences.
III. OVERVIEW OF THE INDUSTRY
A. RAW JUTE
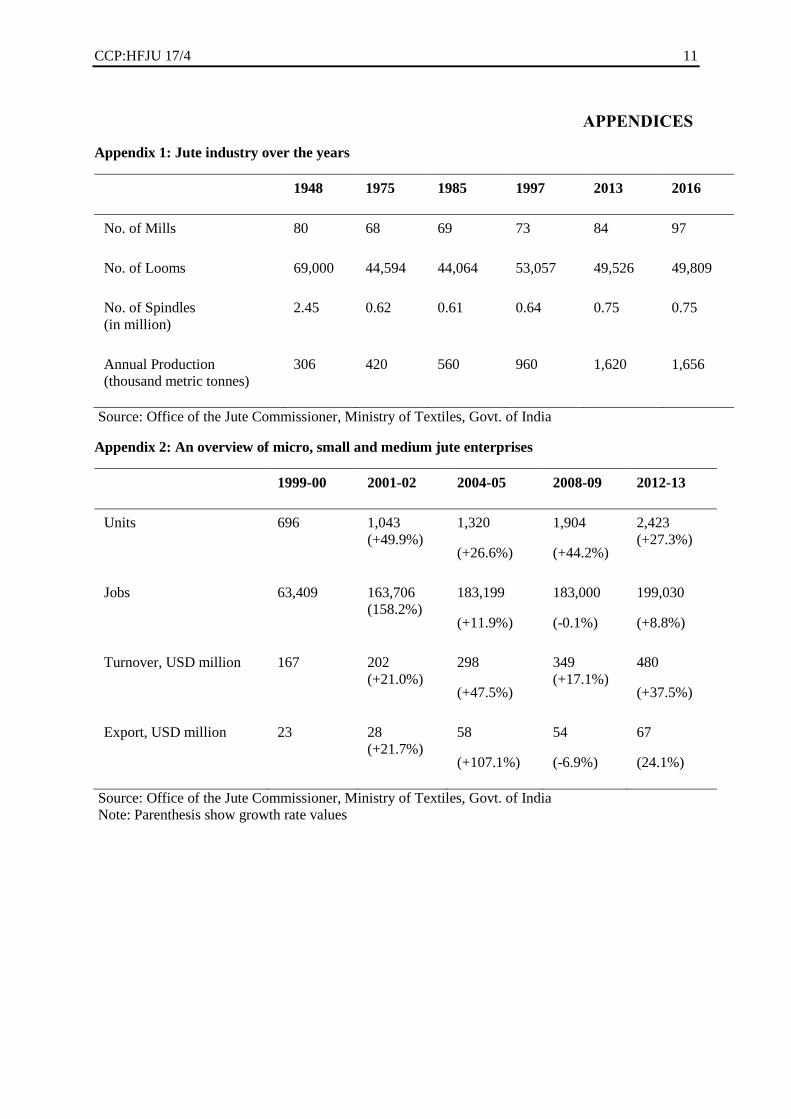
12. India enjoyed a rapid and sustained expansion of its jute industry since the 1940s. Supported
by public investments in infrastructure, production has risen from 306 thousand tonnes of raw jute in
1947 to 1 656 million tonnes in 2016. The industry is made up of a healthy blend of large, medium and
small enterprises, with 97 composite jute mills1 in addition to more than 2 400 micro, small and
medium enterprises (MSMEs) of jute manufacturing units producing both white and tossa jute
(Appendices 1 and 2).
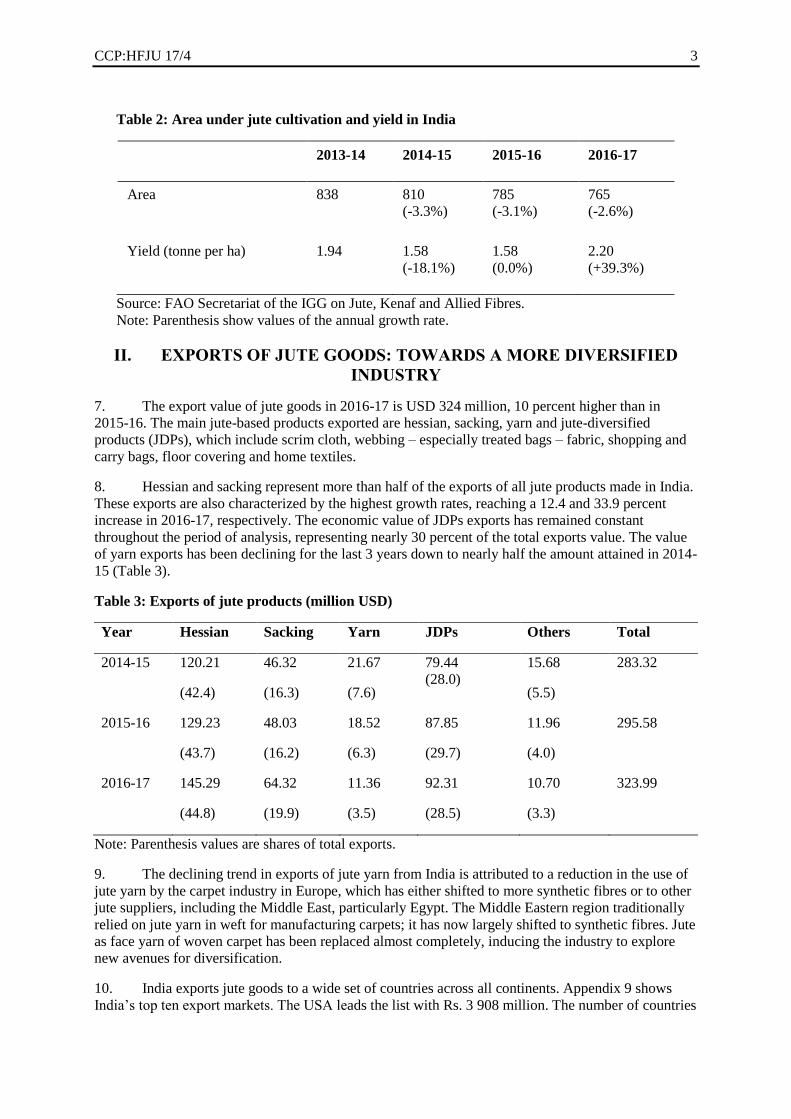
13. The most recent survey shows an increase of 27.3 percent in the number of units of MSMEs
reaching an 8.8 percent increase in jobs created by the jute manufacturing sector between 2008-09 and
2012-13.
1 Most of India’s jute mills are located along the banks of the Hooghly River in West Bengal due to a number of factors, including cost-efficient water transport, good networks of
railways, roadways and waterways to facilitate movement of raw material to mills, an
abundant water supply and cheap labour from neighboring states.
-4,4
-9,7
0,7
24,6
41,5
12.5
-20
-10
0
10
20
30
40
50
World India Bangladesh
Fig.1: Average production growth rates (%) in the jute industry: Bengladesh, India and
the world
2015-16
2016-17
CCP:HFJU 17/4 5
Source: FAO Secretariat of the IGG on Jute, Kenaf and Allied Fibres.
14. This sector generates an average of USD 67 million in annual export earnings, equivalent to
USD 337 per job created by the MSMEs jute manufacturing sector.
15. The Indian Council of Agricultural Research plays a significant role in supporting the Indian
jute industry. The Central Research Institute of Jute and Allied Fibre and the National Institute of
Research on Jute and Allied Fibre Technology promoted quality seeds and better agronomic practices
which lead to higher productivity. The Department of Jute and Fibre Technology in Kolkata remains
the sole institute in the world that offers degree courses in jute technology.
B. JUTE GOODS
16. Indian jute mills recorded a total production of jute goods of 1.142 million tonnes in 2016-17
(Table 4). This represents a decrease of 4 percent when compared to the previous season. The Indian
jute industry has also began producing blended yarn, non-woven fabrics, jute composites, jute felt and
a number of diversified products, ranging from inter alia jute hand and shopping bags, mats/mattings,
furnishing fabrics for textile made-ups, upholstery and wall decorative items, highlighting the fabric’s
unharnessed versatility. These jute-diversified products are produced by MSMEs that generally add
value to the jute products manufactured by the jute mills viz. hessian cloth, yarn, etc. In addition,
handicrafts with raw jute fibre and hand-spun yarns are also part of the jute diversification pattern.
-20
0
20
40
60
80
100
120
140
160
180
(2001-02) (2004-05) (2008-09) (2012-13)
FIG.2.: Growth rates (%) of major indicators related to SMEs in the India Jute sector
Units
Jobs
Turnover USD million
Exports, USD million

6 CCP:HFJU 17/4
Table 4: Production of Jute goods (thousands tonnes)
Year Hessian Sacking Carpet backing
cloths (CBC)
Others Total
2014-15 202.6 892.0 2.5 152.3 1249.4
2015-16 195.8
(-3.4%)
880.3
(-1.3%)
3.7
(+48.0%)
110.0
(-27.8%)
1189.6
(-4.8%)
2016-17 178.6
(-8.8%)
871.6
(-1.0%)
3.1
(-16.2%)
89.1
(-19.0%)
1142.4
(-4.0%)
Source: Secretariat of the IGG on Jute, Kenaf and Allied Fibres (2014-15; 2015-16); Office of the Jute
Commissioner, Ministry of Textiles, India; and Kolkata and Indian Jute Mills Association (2016-17).
Note: Parenthesis show values of the annual growth rate.
17. Innovative uses of jute products in other sectors, such as geo-textiles, offer great opportunities
for further products and demand diversification in the industry.
C. JUTE GEO-TEXTILES
18. Jute geo-textiles offer eco-compatible solutions to some crucial geotechnical problems such as
soil erosion against rain or wind, consolidation of soft soil and construction of rural road, as well as
mitigation of soil related constrains on crop production.
Addressing soil erosion
19. Jute based geo-textile fabrics help in protecting soil and water from various degradation
processes, importantly helping reduce soil erosion and water runoffs. Low-cost, jute-made coarse mats
with an open mesh woven structure can play a critical role in addressing the two phenomena. They act
as "mini-barriers" and reduce the impact of rain or wind, thereby preventing movements of soil
particles, seeds and nutrients.
20. A number of field applications on surficial soil erosion control have been conducted in India
over the past years confirming the potential of jute geo-textiles-based techniques in reducing soil
erosion and loss of nutrients in different regions. The magnitudes are remarkable as the geo-textile-
based management approach guarantees at least 50 percent reduction in soil loss and may curb nutrient
loss by 97 percent, leading therefore to substantial economic gains through savings on fertilizer
consumption (Table 5).
Table 5: Effects of jute agro-textiles on soil and nutrient loss
Location Arcuttipore T.E. Rosekandy T.E.
Soil composition Sand 77%, Silt 18%, Clay 9% Sand 61%, Silt 24%, Clay 14%
Year 1995 1996 1995 1996
Reduction of soil loss 96.32% 96.12% 49.02% 49.11%
Reduction of nutrient loss 97.05% 95.46% 71.97% 71.01%
Source: National Jute Board.
Note: Values are in reference to the use of woven jute type with 400g/m2 and 40 percent of open area.
CCP:HFJU 17/4 7
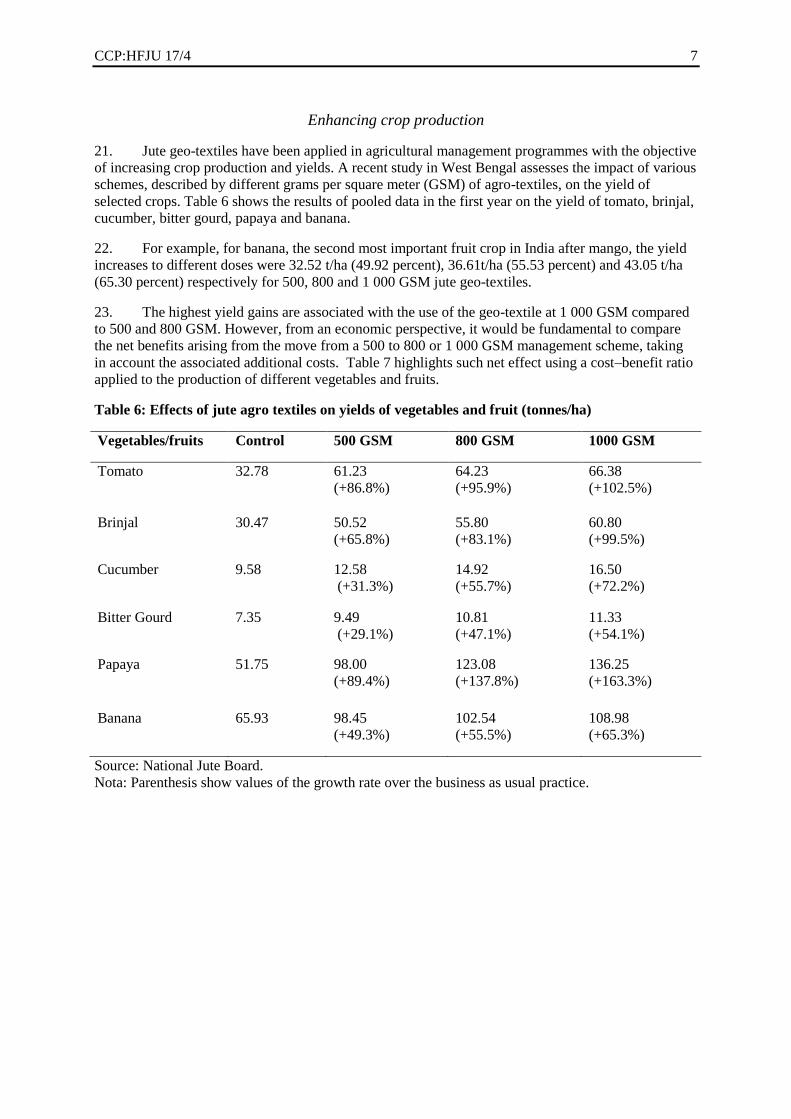
Enhancing crop production
21. Jute geo-textiles have been applied in agricultural management programmes with the objective
of increasing crop production and yields. A recent study in West Bengal assesses the impact of various
schemes, described by different grams per square meter (GSM) of agro-textiles, on the yield of
selected crops. Table 6 shows the results of pooled data in the first year on the yield of tomato, brinjal,
cucumber, bitter gourd, papaya and banana.
22. For example, for banana, the second most important fruit crop in India after mango, the yield
increases to different doses were 32.52 t/ha (49.92 percent), 36.61t/ha (55.53 percent) and 43.05 t/ha
(65.30 percent) respectively for 500, 800 and 1 000 GSM jute geo-textiles.
23. The highest yield gains are associated with the use of the geo-textile at 1 000 GSM compared
to 500 and 800 GSM. However, from an economic perspective, it would be fundamental to compare
the net benefits arising from the move from a 500 to 800 or 1 000 GSM management scheme, taking
in account the associated additional costs. Table 7 highlights such net effect using a cost–benefit ratio
applied to the production of different vegetables and fruits.
Table 6: Effects of jute agro textiles on yields of vegetables and fruit (tonnes/ha)
Vegetables/fruits Control 500 GSM 800 GSM 1000 GSM
Tomato 32.78 61.23
(+86.8%)
64.23
(+95.9%)
66.38
(+102.5%)
Brinjal 30.47 50.52
(+65.8%)
55.80
(+83.1%)
60.80
(+99.5%)
Cucumber 9.58 12.58
(+31.3%)
14.92
(+55.7%)
16.50
(+72.2%)
Bitter Gourd 7.35 9.49
(+29.1%)
10.81
(+47.1%)
11.33
(+54.1%)
Papaya 51.75 98.00
(+89.4%)
123.08
(+137.8%)
136.25
(+163.3%)
Banana 65.93 98.45
(+49.3%)
102.54
(+55.5%)
108.98
(+65.3%)
Source: National Jute Board.
Nota: Parenthesis show values of the growth rate over the business as usual practice.

8 CCP:HFJU 17/4
Table 7: Effects of the jute agro textiles on yield expressed by a cost-benefit ratio
Vegetables/fruits 500 GSM 800 GSM 1000 GSM
Tomato 2.43 2.21 1.93
Brinjal 1.98 1.89 1.71
Cucumber 1.91 1.74 1.72
Bitter Gourd 1.96 1.75 1.68
Papaya 2.24 2.43 2.25
Banana 2.24 2.26 1.99
Source: National Jute Board.
24. For most of the crops, the cost-benefit ratio is at its highest level when the geo-textile is used
at 500 GSM and declines gradually with increasing doses. The exception is for papaya and banana,
where the plots treated with 800 GSM showed marginally higher productivity than 500 GSM. It may
therefore be concluded that farmers would mostly benefit from the treatment based on 500 GSM.
Furthermore, for all the crops under examination, it is not economically efficient to use the 1 000
GSM management scheme given the additional costs associated with it.
25. The efficacy of non-woven jute agro-textile in weed suppression in tea garden plantations has
also been empirically confirmed. Findings from the study on two tea plantations in Assam show a
decline of 65 percent of weeds as a result of agro-textile management techniques, which increases to
up to 78 percent when applied with herbicides and other treatments. Agro-textile management
techniques also increase soil moisture, therefore reducing the underlying demand for water for
irrigation (Table 8). Similar encouraging results were registered with experiments based on 1 000
GSM non-woven in Malda, West Bengal.
Table 8: Effects of non-woven jute on weed suppression and on soil moisture (in percent)
Treatments Weed
Reduction
Soil moisture
increase
Control (without treatment) - -
Jute nonwoven 65 41
Jute nonwoven + Pre-emergent contact herbicide 62 39
Jute nonwoven + Post-emergent translocated herbicide 78 31
Jute nonwoven + Pre-emergent translocated herbicide 75 32
Jute nonwoven + Post –emergent Contact herbicide 75 55
Source: National Jute Board.
26. The positive impact of jute-based geo-techniques on agricultural productivity and rural
infrastructure development opens new avenues for diversification of the Indian jute industry. The
results support the scaling-up of best practices, sharing knowledge and building the necessary capacity
in an industry looking forward to product and demand diversification.

CCP:HFJU 17/4 9
IV. MAINSTREAMING POLICIES THAT PROMOTE A SUSTAINABLE
JUTE INDUSTRY
A. PUBLIC ACTIONS TOWARDS AN EFFICIENT AND PRODUCTIVE
INDUSTRY IN INDIA
27. The Government of India supports its jute industry through a set of policies aiming at
protecting the livelihoods and employment of millions along the jute value chain. However, the main
driver of demand is the Jute Packaging Material Act (1987), which mandates the storage of food
grains in jute sackings. This Act paved the way for the production of sacks for the domestic market,
accounting for almost 60 percent of India’s raw jute production.
28. The National Jute Board is one of the stakeholders that plays a catalytic role in promoting a
sustainable Indian jute industry2. The Board is entrusted with overseeing the exports of jute products,
as well as undertaking research and development studies to increase productivity in the industry. In
recent years, the National Jute Board has been mainstreaming a set of actions supporting jute farmers
in reaching higher yields. An illustration of this line of action is the Improved Cultivation and Retting
Exercise (ICARE), a programme that explores the use of a wide range of innovations, including the
introduction of certified seeds for higher yields; mechanization of the weeding process; and the use of
microbial retting. ICARE was launched in 2015 and initially covered two states, i.e. West Bengal and
Assam. The coverage has been extended to the States of Bihar, Orissa, Andhra Pradesh and
Meghalaya. ICARE currently covers a total area of 70 328 ha of jute, involving the participation of
more than 103 000 farmers (Appendix 5). The programme
29. In response to the ICARE actions, the jute sector has registered an increase in yields of 10
percent, reaching 3 to 3.25 tonnes per hectare. The jute fibre quality has also increased by 1 to 1.5
grades, attracting higher prices and increasing farmers’ income to approximately USD 30 per bigha
(the traditional unit of measurement of land in some states of India, Bangladesh and Nepal).
B. CHALLENGES AND CONSTRAINTS OF THE AGRO-TEXTILE BASED
DIVERSIFICATION "PATH"
30. Despite such positive results, the jute industry faces significant challenges and constraints in
its daily work. The ICARE initiatives face major challenges, including: (1) wide availability of non-
certified jute seeds in market that are being largely used by the farmers; (2) the low availability of
appropriate machineries during pre/post-harvest period; (3) inadequate and shrinking water bodies and
poor value chain in supply of microbial retting technology; and (4) the lack of infrastructure facilities
including human resources for monitoring the programme. Such challenges constrain any ambition
towards diversification of the jute industry, including the geo-textile-based innovations.
31. Specific actions are being taken to address these constraints through a participatory approach
involving all stakeholders including jute growers, MSMEs and the jute mill sector (Appendix 6 and 7).
V. WAY FORWARD AND RECOMMENDATIONS
32. India has great potential to diversify its jute industry beyond the traditional use of sacking.
Greater emphasis should be given to research and development. While rectifying the policy
framework, which should be supportive to the diversification process, the jute industry requires a
2 Appendix 4 provides a comprehensive overview of stakeholders and Governmental actions
in the jute sector.

10 CCP:HFJU 17/4
mixture of new production technologies and modern machinery, supported by holistic workers’
welfare measures and entrepreneurship development schemes3.
33. While design interventions and skill development programmes for jute-diversified products
are being promoted, there is a need to tackle bottlenecks related to accessing finance for SMEs and
strengthening farmers’ market linkages.
34. The vision should therefore further focus on strengthening research and development towards
improving the quality of raw jute, the production of value added jute goods and increasing shares in
the international market by manufacturing “eco-friendly, greener products”.
35. Scaling up best practices and strengthening stakeholders’ capacity towards the development of
jute agro-textile products should be mainstreamed as cross cutting investments during the
diversification process.
3 Appendix 8 provides more details on the focal areas for the recommended policy action
CCP:HFJU 17/4 11
APPENDICES
Appendix 1: Jute industry over the years
1948 1975 1985 1997 2013 2016
No. of Mills 80 68 69 73 84 97
No. of Looms 69,000 44,594 44,064 53,057 49,526 49,809
No. of Spindles
(in million)
2.45 0.62 0.61 0.64 0.75 0.75
Annual Production
(thousand metric tonnes)
306 420 560 960 1,620 1,656
Source: Office of the Jute Commissioner, Ministry of Textiles, Govt. of India
Appendix 2: An overview of micro, small and medium jute enterprises
1999-00 2001-02 2004-05 2008-09 2012-13
Units
696 1,043
(+49.9%)
1,320
(+26.6%)
1,904
(+44.2%)
2,423
(+27.3%)
Jobs 63,409 163,706
(158.2%)
183,199
(+11.9%)
183,000
(-0.1%)
199,030
(+8.8%)
Turnover, USD million 167 202
(+21.0%)
298
(+47.5%)
349
(+17.1%)
480
(+37.5%)
Export, USD million
23 28
(+21.7%)
58
(+107.1%)
54
(-6.9%)
67
(24.1%)
Source: Office of the Jute Commissioner, Ministry of Textiles, Govt. of India
Note: Parenthesis show growth rate values
12 CCP:HFJU 17/4
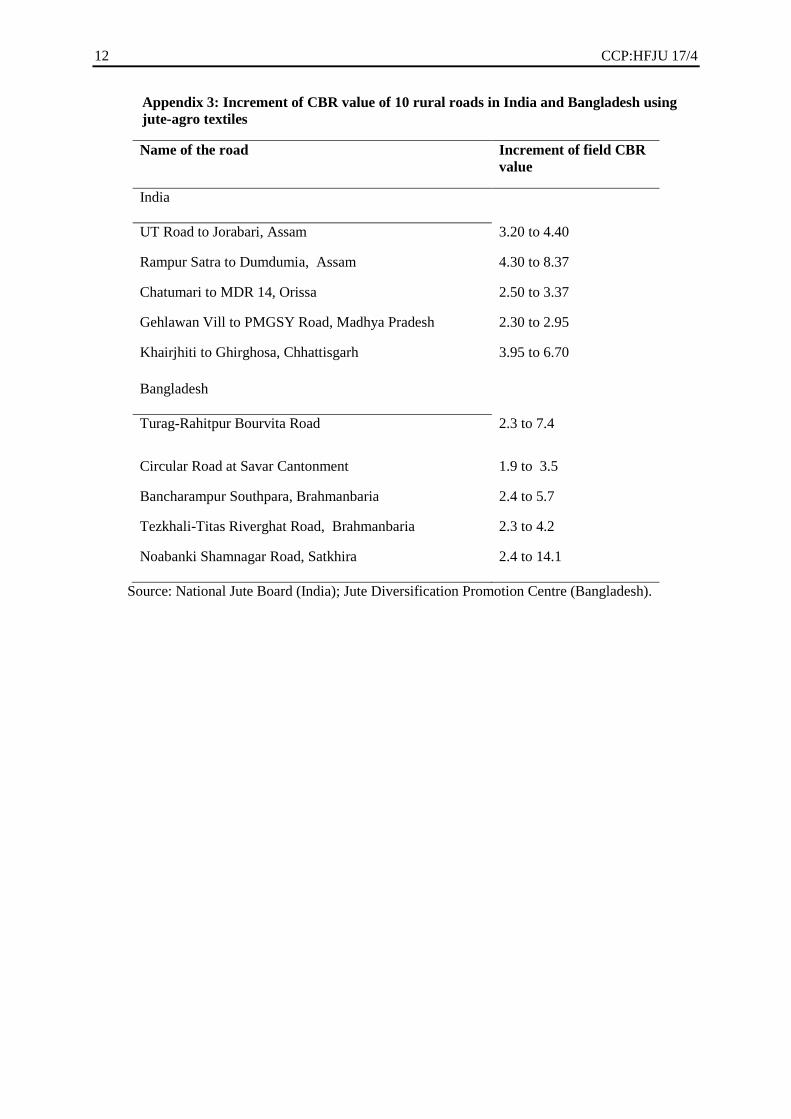
Appendix 3: Increment of CBR value of 10 rural roads in India and Bangladesh using
jute-agro textiles
Name of the road Increment of field CBR
value
India
UT Road to Jorabari, Assam 3.20 to 4.40
Rampur Satra to Dumdumia, Assam 4.30 to 8.37
Chatumari to MDR 14, Orissa 2.50 to 3.37
Gehlawan Vill to PMGSY Road, Madhya Pradesh 2.30 to 2.95
Khairjhiti to Ghirghosa, Chhattisgarh 3.95 to 6.70
Bangladesh
Turag-Rahitpur Bourvita Road 2.3 to 7.4
Circular Road at Savar Cantonment 1.9 to 3.5
Bancharampur Southpara, Brahmanbaria 2.4 to 5.7
Tezkhali-Titas Riverghat Road, Brahmanbaria 2.3 to 4.2
Noabanki Shamnagar Road, Satkhira 2.4 to 14.1
Source: National Jute Board (India); Jute Diversification Promotion Centre (Bangladesh).
CCP:HFJU 17/4 13
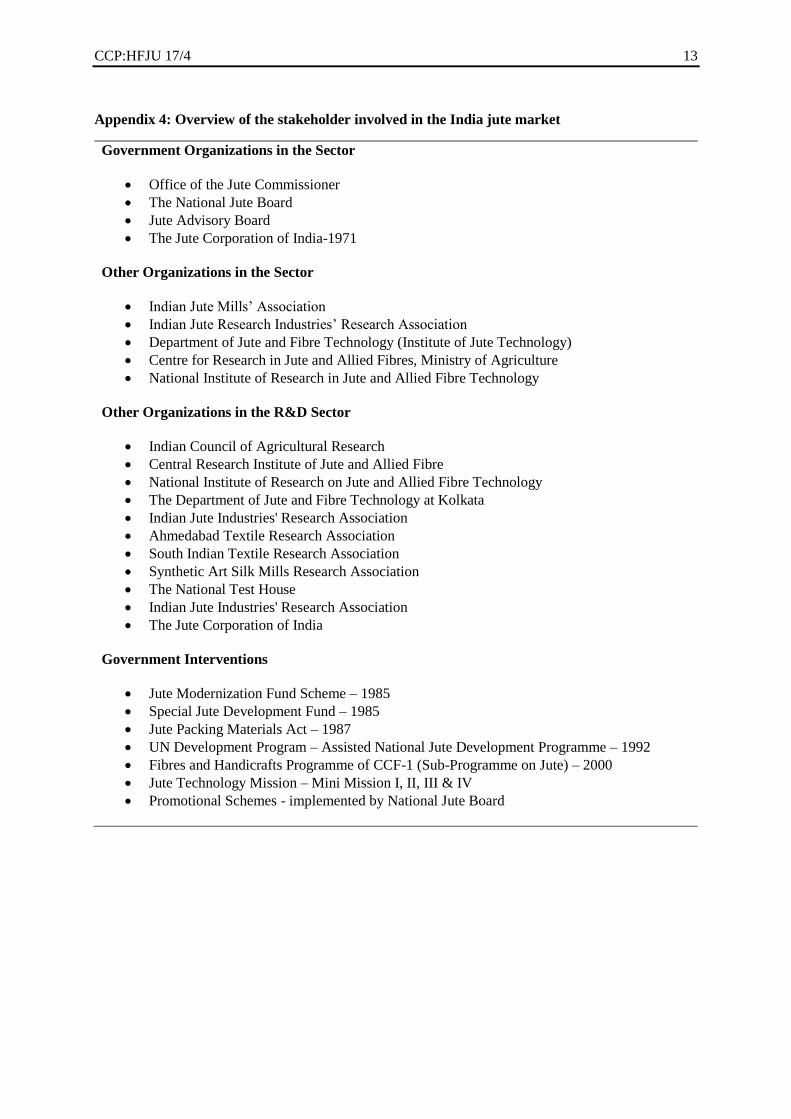
Appendix 4: Overview of the stakeholder involved in the India jute market
Government Organizations in the Sector
Office of the Jute Commissioner
The National Jute Board
Jute Advisory Board
The Jute Corporation of India-1971
Other Organizations in the Sector
Indian Jute Mills’ Association
Indian Jute Research Industries’ Research Association
Department of Jute and Fibre Technology (Institute of Jute Technology)
Centre for Research in Jute and Allied Fibres, Ministry of Agriculture
National Institute of Research in Jute and Allied Fibre Technology
Other Organizations in the R&D Sector
Indian Council of Agricultural Research
Central Research Institute of Jute and Allied Fibre
National Institute of Research on Jute and Allied Fibre Technology
The Department of Jute and Fibre Technology at Kolkata
Indian Jute Industries' Research Association
Ahmedabad Textile Research Association
South Indian Textile Research Association
Synthetic Art Silk Mills Research Association
The National Test House
Indian Jute Industries' Research Association
The Jute Corporation of India
Government Interventions
Jute Modernization Fund Scheme – 1985
Special Jute Development Fund – 1985
Jute Packing Materials Act – 1987
UN Development Program – Assisted National Jute Development Programme – 1992
Fibres and Handicrafts Programme of CCF-1 (Sub-Programme on Jute) – 2000
Jute Technology Mission – Mini Mission I, II, III & IV
Promotional Schemes - implemented by National Jute Board
14 CCP:HFJU 17/4
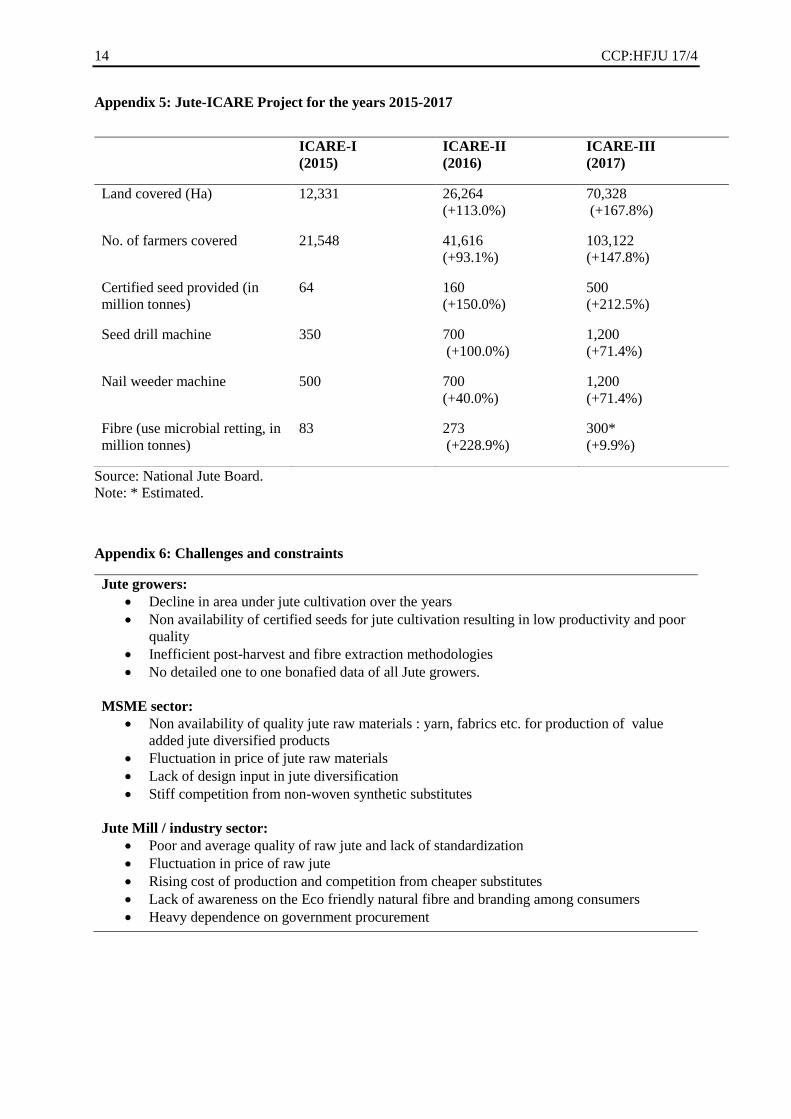
Appendix 5: Jute-ICARE Project for the years 2015-2017
Source: National Jute Board.
Note: * Estimated.
Appendix 6: Challenges and constraints
Jute growers:
Decline in area under jute cultivation over the years
Non availability of certified seeds for jute cultivation resulting in low productivity and poor
quality
Inefficient post-harvest and fibre extraction methodologies
No detailed one to one bonafied data of all Jute growers.
MSME sector:
Non availability of quality jute raw materials : yarn, fabrics etc. for production of value
added jute diversified products
Fluctuation in price of jute raw materials
Lack of design input in jute diversification
Stiff competition from non-woven synthetic substitutes
Jute Mill / industry sector:
Poor and average quality of raw jute and lack of standardization
Fluctuation in price of raw jute
Rising cost of production and competition from cheaper substitutes
Lack of awareness on the Eco friendly natural fibre and branding among consumers
Heavy dependence on government procurement
ICARE-I
(2015)
ICARE-II
(2016)
ICARE-III
(2017)
Land covered (Ha) 12,331 26,264
(+113.0%)
70,328
(+167.8%)
No. of farmers covered 21,548 41,616
(+93.1%)
103,122
(+147.8%)
Certified seed provided (in
million tonnes)
64 160
(+150.0%)
500
(+212.5%)
Seed drill machine 350 700
(+100.0%)
1,200
(+71.4%)
Nail weeder machine 500 700
(+40.0%)
1,200
(+71.4%)
Fibre (use microbial retting, in
million tonnes)
83 273
(+228.9%)
300*
(+9.9%)

CCP:HFJU 17/4 15
Appendix 7: Support policies
Schemes for workers' health and sanitation in the Jute Sector
Incentive scheme for acquisition of plants and machinery
Common Facility Centre Scheme for empowerment of Women
Retail Outlet / Bulk supply of JDPs Scheme
Export Market Development Assistance Scheme
Jute Integrated Development Scheme
Jute Raw Material Bank Scheme
Design development through NID / NIFT
Appendix 8: Policy areas – Future Plan
Research and Development
Modernization
Diversification
Promotion and marketing
Social and Environmental Compliance
16 CCP:HFJU 17/4
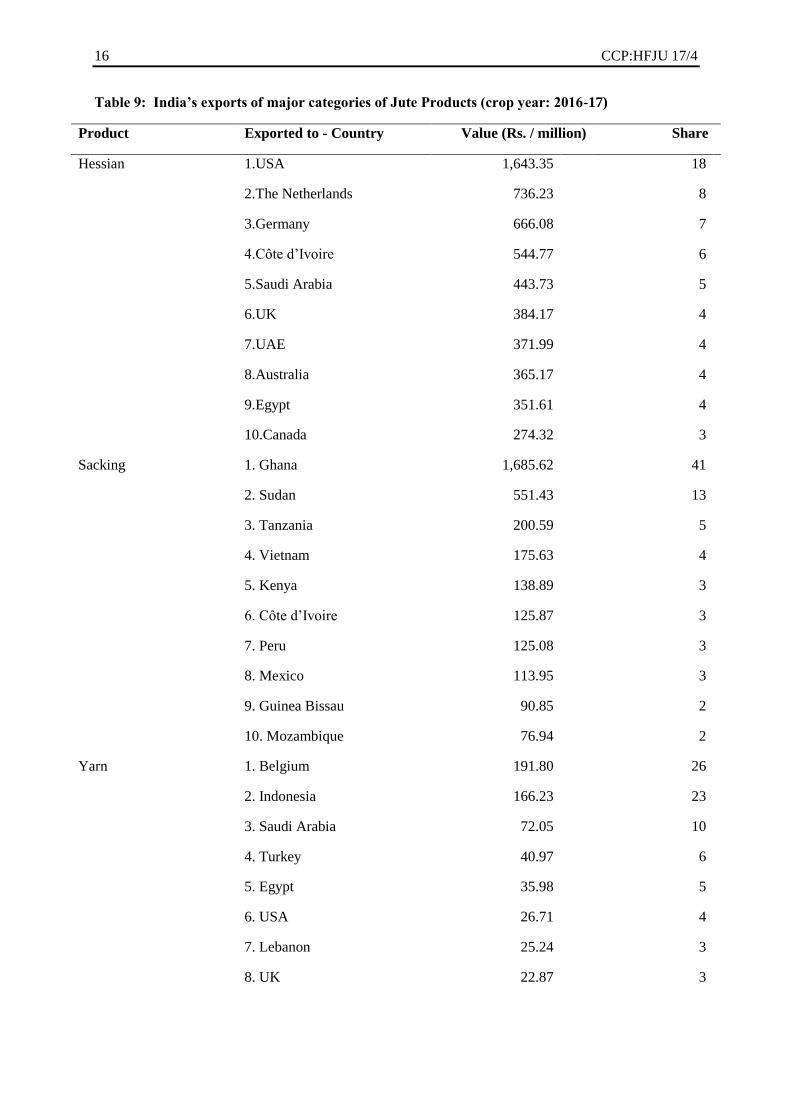
Table 9: India’s exports of major categories of Jute Products (crop year: 2016-17)
Product Exported to - Country Value (Rs. / million) Share
Hessian 1.USA 1,643.35 18
2.The Netherlands 736.23 8
3.Germany 666.08 7
4.Côte d’Ivoire 544.77 6
5.Saudi Arabia 443.73 5
6.UK 384.17 4
7.UAE 371.99 4
8.Australia 365.17 4
9.Egypt 351.61 4
10.Canada 274.32 3
Sacking 1. Ghana 1,685.62 41
2. Sudan 551.43 13
3. Tanzania 200.59 5
4. Vietnam 175.63 4
5. Kenya 138.89 3
6. Côte d’Ivoire 125.87 3
7. Peru 125.08 3
8. Mexico 113.95 3
9. Guinea Bissau 90.85 2
10. Mozambique 76.94 2
Yarn 1. Belgium 191.80 26
2. Indonesia 166.23 23
3. Saudi Arabia 72.05 10
4. Turkey 40.97 6
5. Egypt 35.98 5
6. USA 26.71 4
7. Lebanon 25.24 3
8. UK 22.87 3

CCP:HFJU 17/4 17
Table 9: India’s exports of major categories of Jute Products (crop year: 2016-17) (cont'd)
Product Exported to - Country Value (Rs. / million) Share
Yarn (cont'd) 9. Nigeria 14.92 2
10. Morocco 14.07 2
Jute floor covering 1. USA 1,564.78 61
2. Australia 204.66 8
3. Germany 113.78 4
4. UK 106.87 4
5. China 78.25 3
6. Sweden 76.31 3
7. Spain 51.03 2
8. France 49.48 2
9. South Africa 46.88 2
10. Italy 37.35 1
Jute Shopping Bags 1. UK 950.13 29
2. USA 673.29 21
3. The Netherlands 192.48 6
4. France 147.81 5
5. Australia 143.93 4
6. Germany 145.64 4
7. Saudi Arabia 125.91 4
8. Italy 117.59 4
9. Spain 107.38 3
10. Canada 104.82 3
Source: National Jute Board.


![Mechanical Properties of Jute Spun Yarn/PLA Tubular ... · natural fibers compounded with polymer matrices, could diminish the impact of plastic waste on the environment [2-4]. Jute](https://img.pdfslide.us/doc/110x75/5e9895d0e10b3923ef6d9a45/mechanical-properties-of-jute-spun-yarnpla-tubular-natural-fibers-compounded.jpg)