Embed Size (px)
Citation preview

Oliver Herrmann Ministry of Business, Innovation & Employment of New Zealand
BEYOND SURVEYS: THE RESEARCH FRONTIER MOVES TO THE USE OF ADMINISTRATIVE DATA TO
EVALUATE R&D GRANTS
Overview
• Survey data vs administrative data• Micro data research in New Zealand• Using administrative data for evaluation: an
R&D example• Impact evaluation, causality and methods• Evaluation findings• Limitations
Survey data(Last Millennium)
• Empirical research and evaluation have relied on survey data.
• Using a sample of individuals from a population with a view towards making statistical inferences about the population.
• Examples: Current Population Survey (US), Annual Survey of Hours and Earnings (UK), Business Operation Survey (NZ)
• Political science, sociology, and economics were all “revolutionized” using survey data sources.
Administrative data(New Millennium)
• Governments create comprehensive administrative data that cover socio-economic behaviour from education, earnings, workplace to family composition, health and retirement.
• Administrative data are highly preferable to survey data because– full population files are generally available and offer much larger
sample sizes,– administrative data have a longitudinal structure that enables
evaluators to follow individuals over time and address many critical policy questions,
– administrative data do not suffer from high rates of non-response, attrition, and under-reporting.

New Zealand’s Hotbed of Microdata Research
• Statistics NZ has undertaken a number of projects that integrate data supplied by different government agencies
• The Integrated Data Infrastructure (IDI) is a comprehensive database with longitudinal microdata about individuals, households, and firms
• The IDI pulls together a range of administrative and survey-based data sources (financial performance, employment, merchandise trade, business practices, government assistance).
• The IDI allows for the investigation of previously unanswerable questions. Researchers and evaluators have access to answer research, policy, and evaluation questions to support informed decision making.
Using administrative data for evaluation: An example - publicly funded R&D
Innovation is well known to be an important driver of economic growth and investments in R&D are among the factors that drive innovation.
Governments encourage business investment in R&D, with the aim of correcting or alleviating two main market failures:
– Difficulties by firms to fully appropriate the returns to their investment.
– Difficulties in finding external finance, in particular for small start-up firms.

Policy objectives of R&D grants
• Increase and enhance the R&D.• Increase the economic performance.
• In New Zealand there are different types of government R&D subsidies– assistance to build R&D capability – assistance for R&D projects
Impact evaluation = causal inference
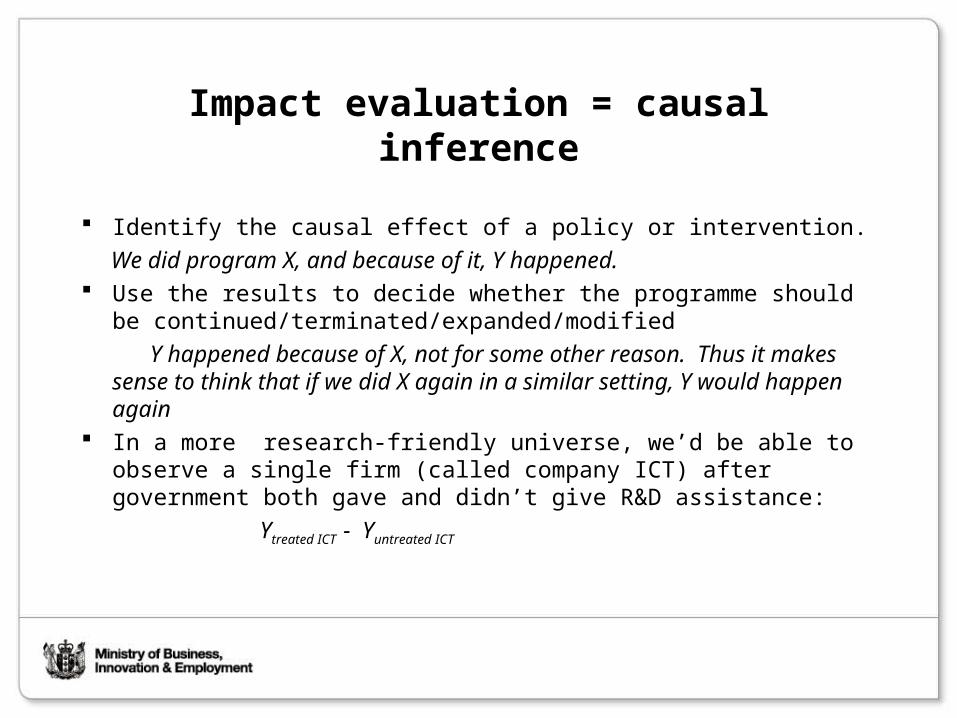
Identify the causal effect of a policy or intervention.
We did program X, and because of it, Y happened. Use the results to decide whether the programme should be
continued/terminated/expanded/modified
Y happened because of X, not for some other reason. Thus it makes sense to think that if we did X again in a similar setting, Y would happen again
In a more research-friendly universe, we’d be able to observe a single firm (called company ICT) after government both gave and didn’t give R&D assistance:
Ytreated ICT - Yuntreated ICT
Evaluation problem (1)
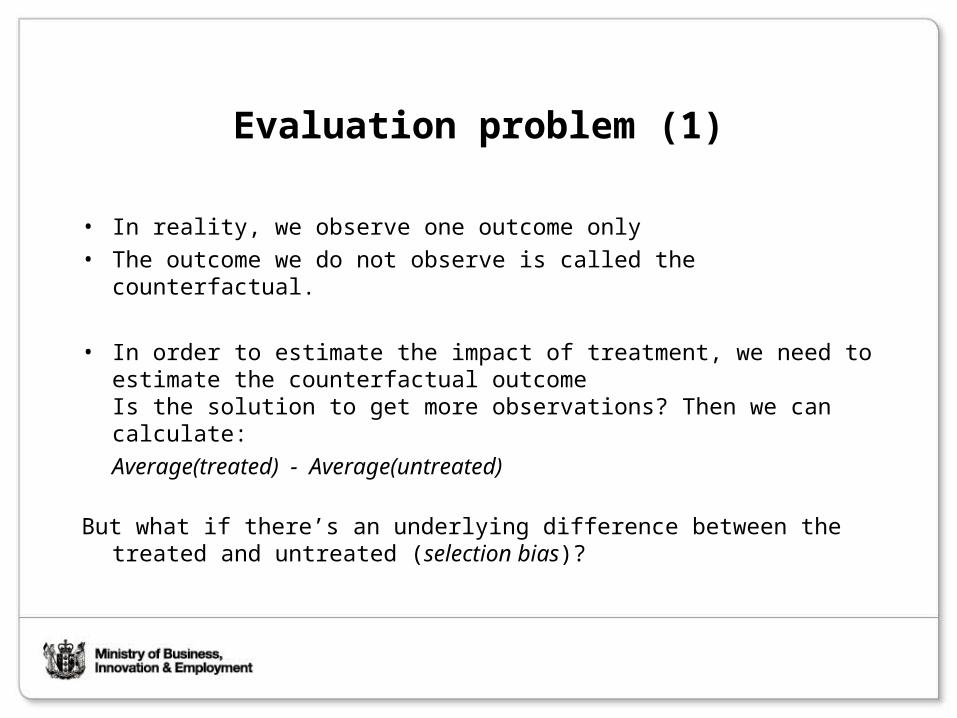
• In reality, we observe one outcome only • The outcome we do not observe is called the counterfactual.
• In order to estimate the impact of treatment, we need to estimate the counterfactual outcomeIs the solution to get more observations? Then we can calculate:
Average(treated) - Average(untreated)
But what if there’s an underlying difference between the treated and untreated (selection bias)?

Evaluation problem (2)
• Simplest world : impact is common across all individuals/firms
• Impact is different across individuals/firms but doesn’t affect participation/selection => variation in impact has few policy implications
• Impact is different across individuals/firms and this affects participation/selection => implications for policy and for unbiased estimation
Non or Quasi-experimental approaches
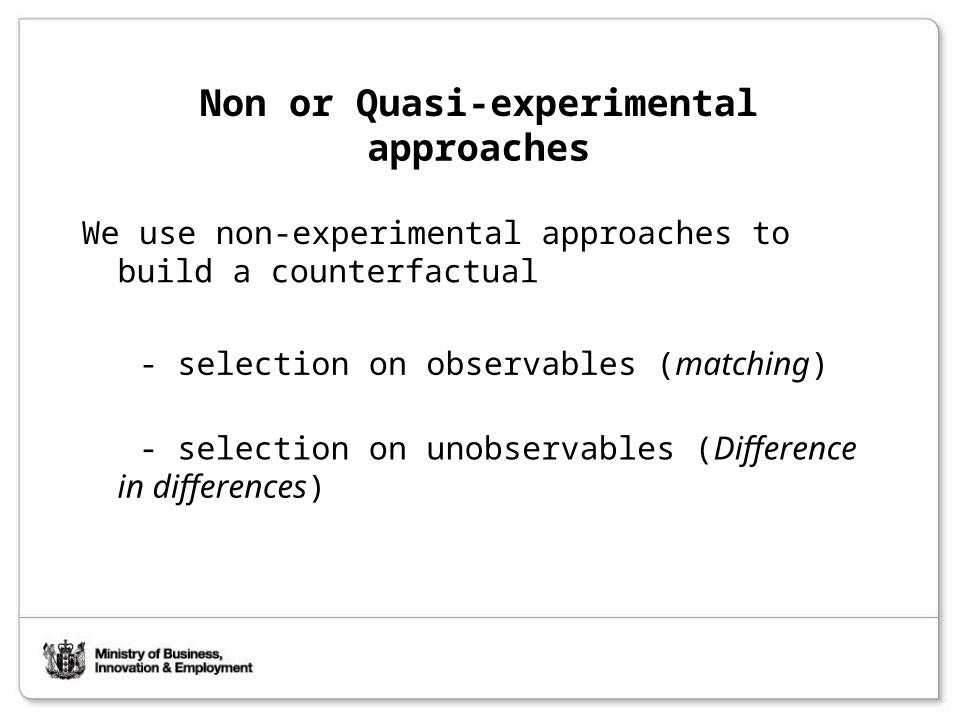
We use non-experimental approaches to build a counterfactual
- selection on observables (matching)
- selection on unobservables (Difference in differences)
Control group and eight matching variables
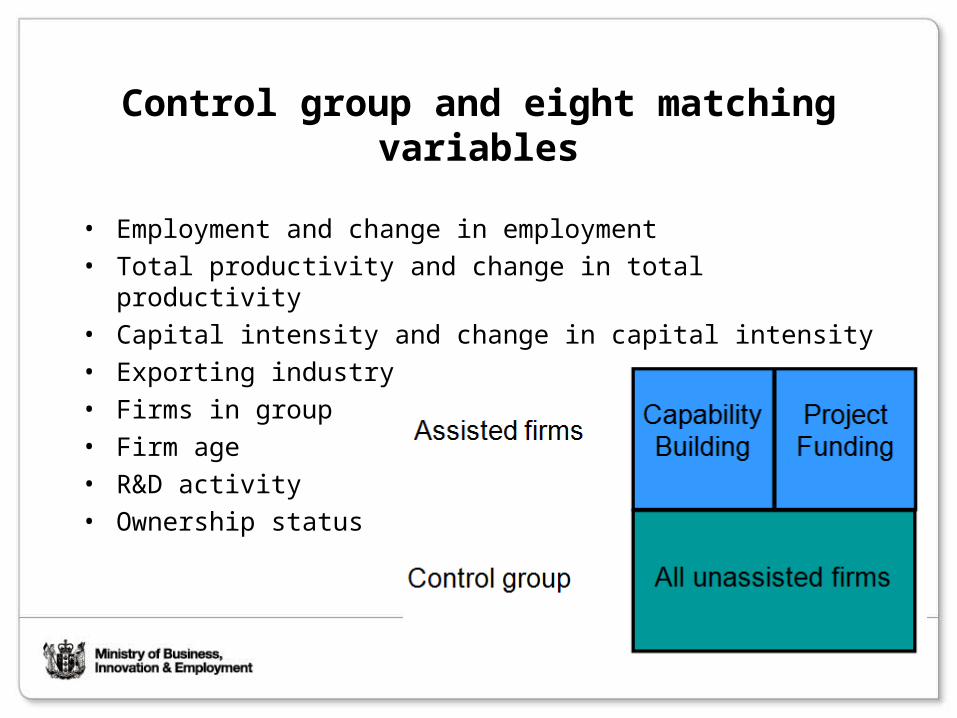
• Employment and change in employment• Total productivity and change in total productivity• Capital intensity and change in capital intensity• Exporting industry • Firms in group • Firm age• R&D activity • Ownership status
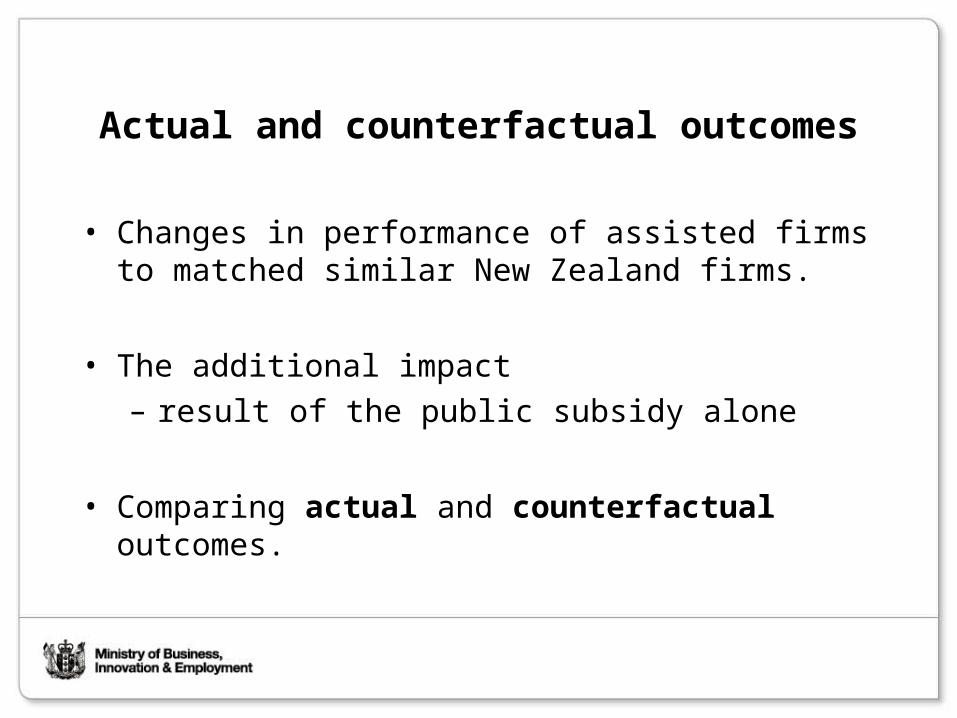
Actual and counterfactual outcomes
• Changes in performance of assisted firms to matched similar New Zealand firms.
• The additional impact – result of the public subsidy alone
• Comparing actual and counterfactual outcomes.
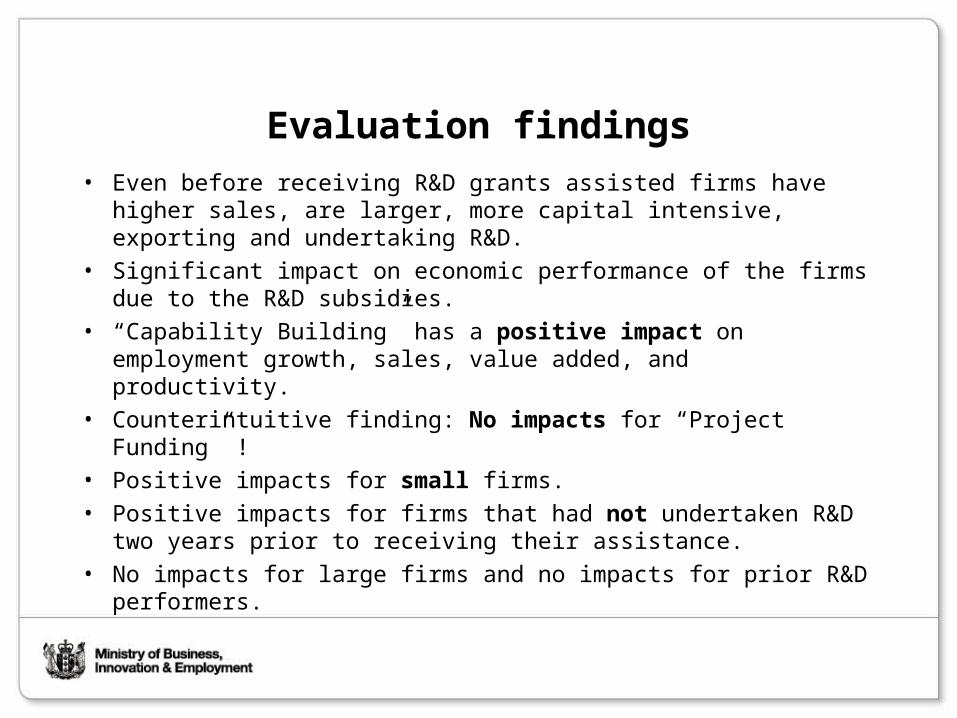
Evaluation findings
• Even before receiving R&D grants assisted firms have higher sales, are larger, more capital intensive, exporting and undertaking R&D.
• Significant impact on economic performance of the firms due to the R&D subsidies.
• “Capability Building” has a positive impact on employment growth, sales, value added, and productivity.
• Counterintuitive finding: No impacts for “Project Funding” !• Positive impacts for small firms. • Positive impacts for firms that had not undertaken R&D two
years prior to receiving their assistance.• No impacts for large firms and no impacts for prior R&D
performers.
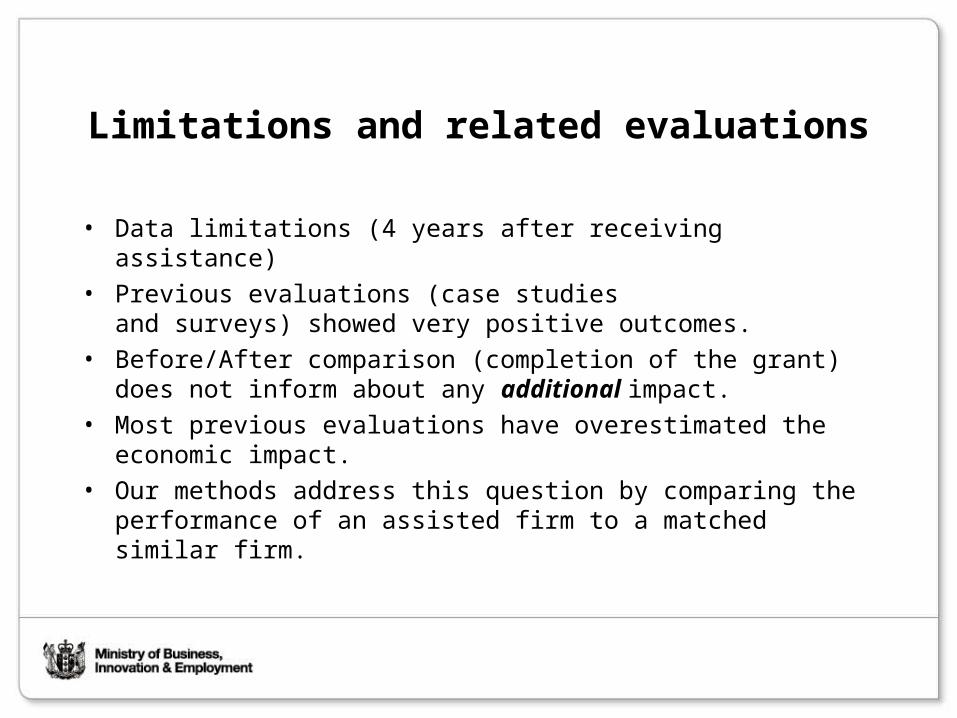
Limitations and related evaluations
• Data limitations (4 years after receiving assistance)• Previous evaluations (case studies
and surveys) showed very positive outcomes.• Before/After comparison (completion of the grant) does not
inform about any additional impact. • Most previous evaluations have overestimated the economic
impact. • Our methods address this question by comparing the
performance of an assisted firm to a matched similar firm.

Additional slides
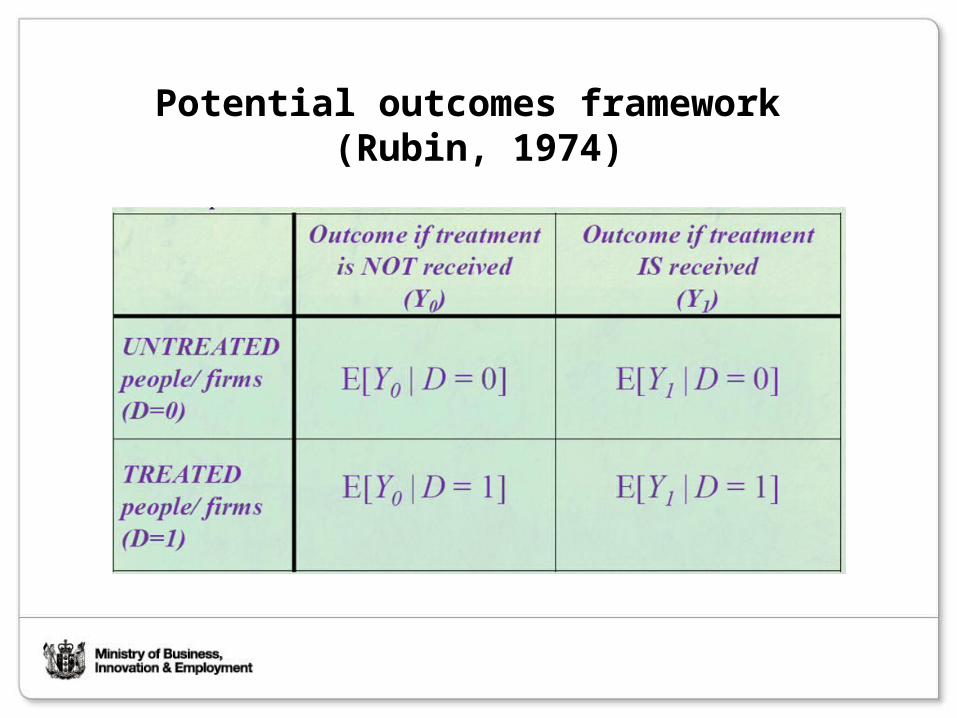
Potential outcomes framework (Rubin, 1974)
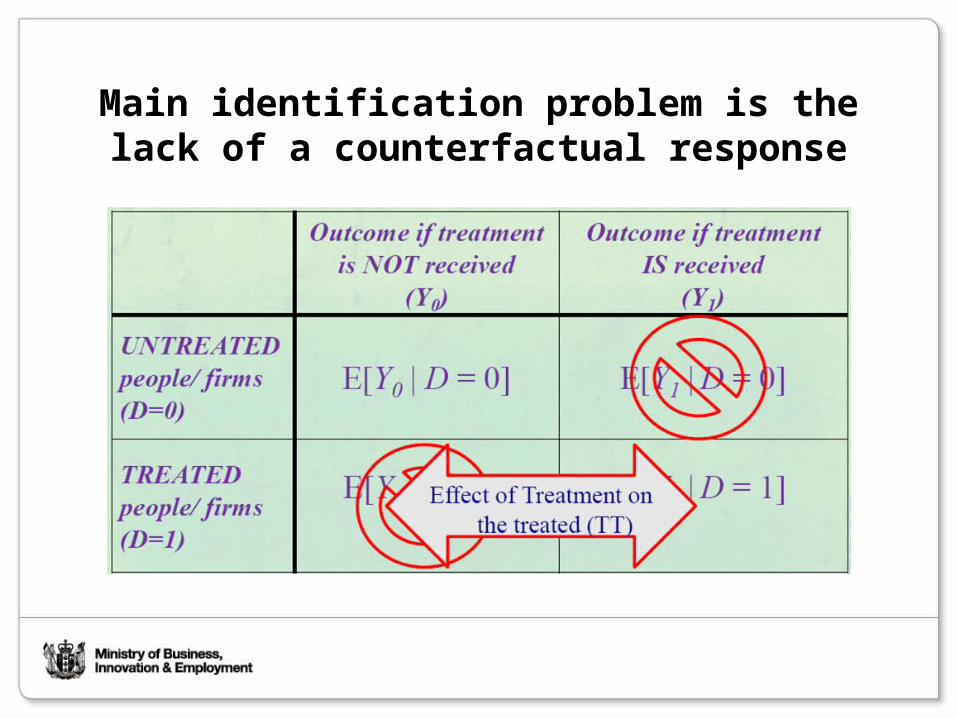
Main identification problem is the lack of a counterfactual response
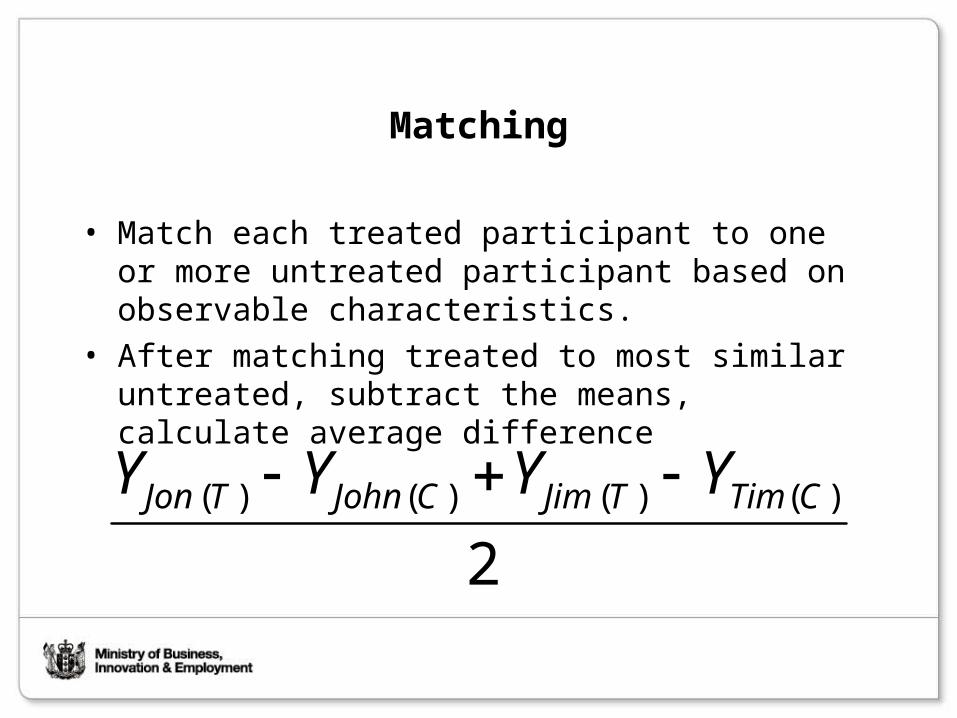
Matching
• Match each treated participant to one or more untreated participant based on observable characteristics.
• After matching treated to most similar untreated, subtract the means, calculate average difference
2)()()()( CTimTJimCJohnTJon YYYY
Issues
• Selection/participation depends only on observable characteristics; it does not depend on unobservables
• Difficult to match on many observables X => condense all observables into one “propensity score,” match on that score.
• Need good data
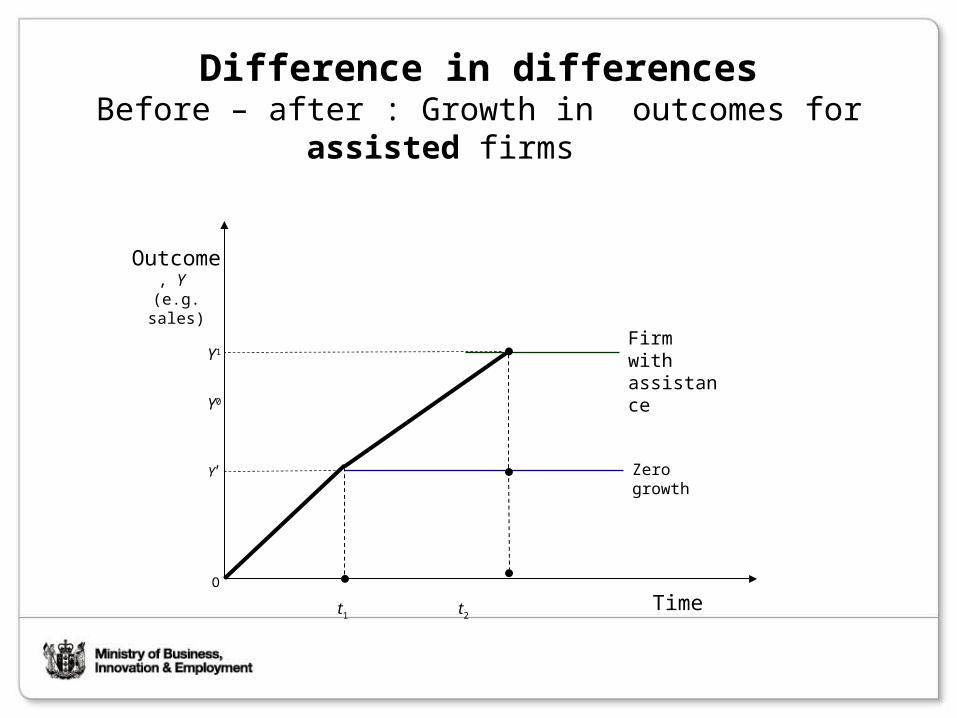
Difference in differencesBefore – after : Growth in outcomes for assisted firms
Firm with assistance
Outcome, Y
(e.g. sales)
Timet1 t2
Zero growth
O
Y0
Y1
Y'
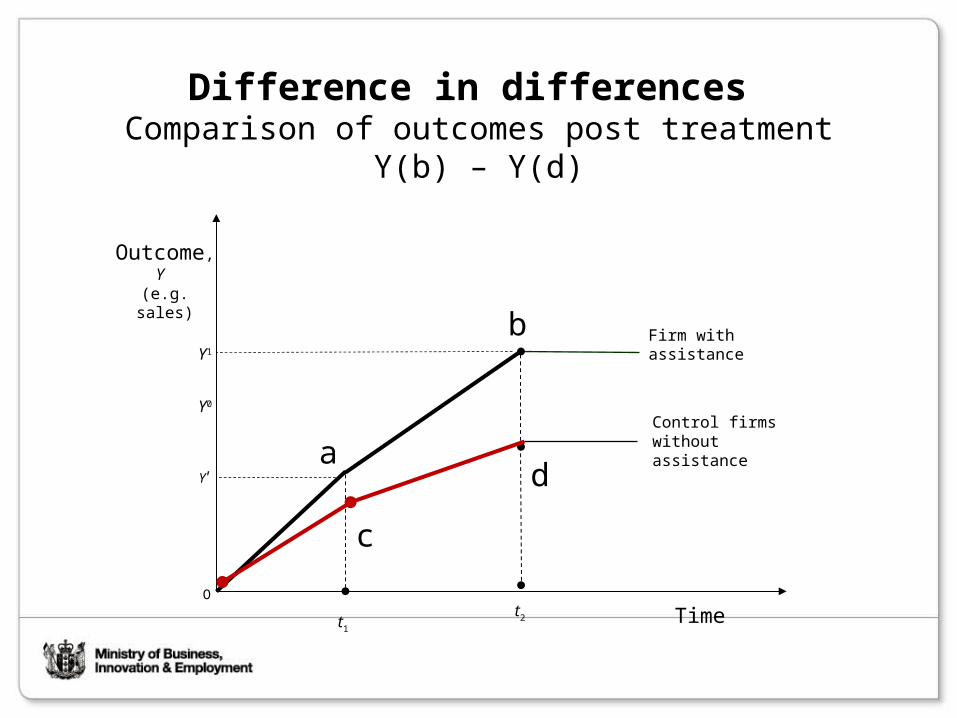
Difference in differences Comparison of outcomes post treatment Y(b) – Y(d)
Firm with assistance
Outcome, Y
(e.g. sales)
Timet1
t2
O
Y0
Y1
Y'
Control firms without assistance
c
b
ad
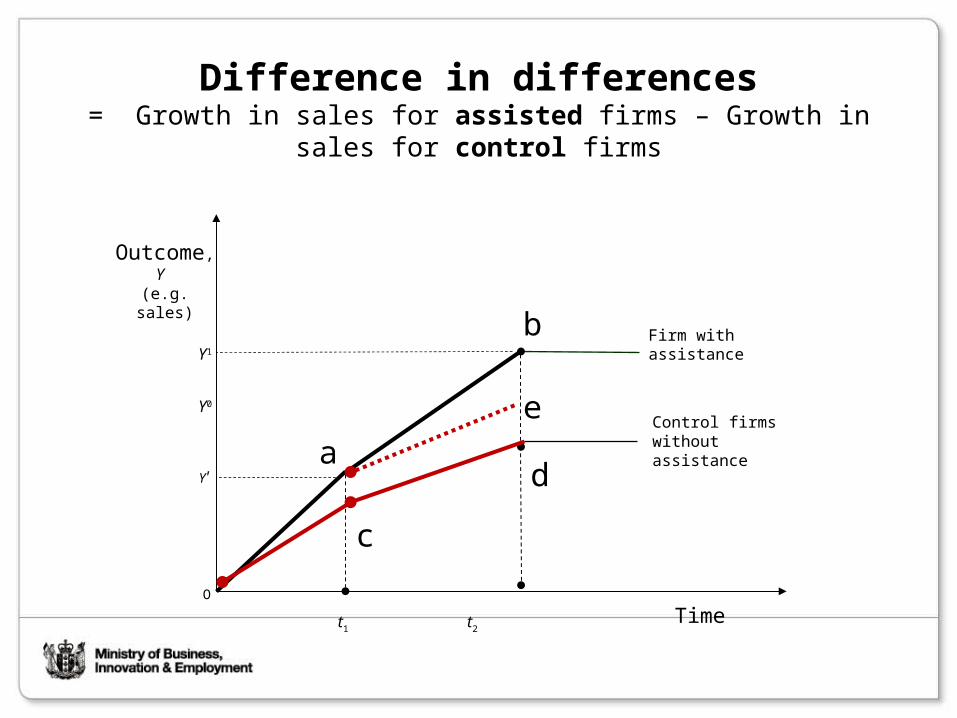
Difference in differences= Growth in sales for assisted firms – Growth in sales for control firms
Firm with assistance
Outcome, Y
(e.g. sales)
Timet1 t2
O
Y0
Y1
Y'
Control firms without assistance
c
b
ad
e