Embed Size (px)
Citation preview
Oklahoma Occupational Health Indicators,
2003
Injury Prevention Service Oklahoma State Department of Health

Oklahoma Occupational Health Indicators,
2003
Injury Prevention Service Oklahoma State Department of Health
1000 N.E. Tenth Street Oklahoma City, OK 73117
http://ips.health.ok.gov

ii
Oklahoma Occupational Safety and Health Surveillance Advisory Committee Kelly Baker, MPH Interim Director Center for Health Statistics Oklahoma State Department of Health Lee McGoodwin, Pharm.D., MS, DABAT Managing Director Oklahoma Poison Control Center Children's Hospital of OU Medical Center Diana Jones Director Public Employee Occupational Safety and Health Unit Oklahoma Department of Labor Margaret Phillips, Ph.D., CIH Associate Professor Department of Occupational and Environmental Health University of Oklahoma Health Sciences Center Andy Beck Fire and Safety Coordinator Autry Technology Center Jim T. Criswell, Ph.D. Professor and Extension Pesticide Coordinator Department of Entomology & Plant Pathology Oklahoma State University
Raymond L. Huhnke, Ph.D., P.E. Professor Biosystems and Agricultural Engineering Oklahoma State University Jim Brown Area Director Occupational Safety and Health Administration U.S. Department of Labor Fahad Khan, MPH Surveillance Coordinator Oklahoma Lead Poisoning Prevention Programs Oklahoma State Department of Health Anne Bliss, MPH Epidemiologist Oklahoma Cancer Programs Oklahoma State Department of Health Gerri Mooney Counselor Oklahoma Workers’ Compensation Court
This publication is issued by the Oklahoma State Department of Health, as authorized by James M. Crutcher, M.D., M.P.H., Commissioner of Health and State Health Officer. Fifty (50) copies have been prepared and distributed at a cost of $200.00. Copies have been deposited with the Publications Clearinghouse of the Oklahoma Department of Libraries. The Oklahoma State Department of Health is an equal opportunity employer.

iii
Table of Contents Executive Summary ....................................................................................................................................... 1 Introduction .................................................................................................................................................... 2 Table 1. Employment Demographic Profile for Oklahoma and the U.S., 2003 ............................................... 3 Indicator 1. Non-Fatal Work-Related Injuries and Illnesses Reported by Employers ................................. 4 Indicator 2. Work-Related Hospitalizations ................................................................................................ 5 Indicator 3. Fatal Work-Related Injuries ..................................................................................................... 6 Indicator 4. Work-Related Amputations with Days Away from Work Reported
by Employers ........................................................................................................................... 7 Indicator 5. Amputations Filed with the State Workers’ Compensation System ......................................... 7 Indicator 6. Hospitalizations for Work-Related Burns ................................................................................. 8 Indicator 7. Work-Related Musculoskeletal Disorders with Days Away from Work
Reported by Employers ........................................................................................................... 9 Indicator 8. Carpal Tunnel Syndrome Cases Filed with the State Workers’
Compensation System ............................................................................................................ 9 Indicator 9. Hospitalizations from or with Pneumoconiosis ...................................................................... 11 Indicator 10. Mortality from or with Pneumoconiosis .................................................................................. 11 Indicator 11. Acute Work-Related Pesticide-Associated Illness and Injury
Reported to Poison Control Centers ...................................................................................... 13 Indicator 12. Incidence of Malignant Mesothelioma ................................................................................... 14 Indicator 13. Elevated Blood Lead Levels Among Adults ........................................................................... 15 Description of Data Sources ......................................................................................................................... 16 References .............................................................................................................................................. 19

1
Executive Summary Work-related injuries, deaths, and illnesses substantially impact Oklahoma’s civilian workforce of 1.6 million persons. These incidents involve multiple risk factors, including workplace procedures and design, work organization, worker characteristics, economics, and a variety of social factors. Although many of these incidents are preventable, they continue to occur and affect the physical, mental, and economic status of Oklahoma workers and their businesses. By collecting data on the magnitude and occurrence of work-related incidents, prevention programs can be targeted to reduce exposures. In 2003, 100 persons died as a result of a work-related injury, and there were more than 48,000 work-related injuries and illnesses reported by employers of persons working in the private sector. More than 13,000 cases involved days away from work, including almost 7000 with more than 10 days away from work. Ninety persons were reported by their employer to have suffered an amputation that involved days away from work. The Oklahoma Workers’ Compensation Court had 94 amputation claims filed in 2003. Almost 4000 Oklahomans who were hospitalized in 2003 had workers’ compensation as their primary source of insurance, including 42 persons with work-related burn injuries. The rates of work-related deaths and hospitalizations in Oklahoma were higher than the U.S. rates. Almost 4500 persons employed in the private sector were reported by their employer to have a musculoskeletal disorder involving days away from work in 2003. Musculoskeletal disorders included sprains, strains, tears, back injuries/pain, soreness, carpal tunnel syndrome, hernia, and any other musculoskeletal system and connective tissue disease. These disorders were due to bending, climbing, crawling, reaching, twisting, overexertion, or repetitive motion. Among the musculoskeletal disorders with days away from work, 1750 involved the back, 1660 the neck, shoulder, and upper
extremities, and 240 were due to carpal tunnel syndrome. The Oklahoma Workers’ Compensation Court had 318 carpal tunnel syndrome cases filed in 2003. The rates of total musculoskeletal disorders and disorders of the back were lower in Oklahoma than in the U.S. However, the rate for disorders of the neck, shoulder, and upper extremities was higher in Oklahoma. For carpal tunnel syndrome, the state and national rates were the same. Although occupational lung disease can be prevented by controlling dust exposure through good ventilation or protective equipment, 148 Oklahomans were hospitalized with pneumoconiosis and 12 died in 2003. Among the specified types of pneumoconiosis, 79 persons had asbestosis (9 deaths), 47 had coal workers’ pneumoconiosis (1 death), and 21 had silicosis (1 death). All rates of pneumoconiosis were lower in Oklahoma than in the U.S., except silicosis hospitalizations. The Oklahoma Poison Control Center/American Association of Poison Control Centers received 53 reports of work-related pesticide poisoning in 2003. Workers in certain occupations, especially agriculture, may be exposed to pesticides while preparing them for use, applying them, or entering areas post application. The rate of reported cases in Oklahoma was higher than in the U.S. In 2003, 28 cases of mesothelioma, a rare form of cancer typically caused by exposure to asbestos and related fibers, were reported in Oklahoma. Most people diagnosed with malignant mesothelioma are over 50 years of age and are already in an advanced stage of the disease. The Oklahoma rate was lower than the U.S. rate. Eighty-five Oklahoma adults had an elevated blood lead level greater than or equal to 25 μg/dL and 19 persons had levels greater than or equal to 40 μg/dL. The vast majority of adults with elevated

2
blood lead levels are exposed in their work environment. Workers can also unknowingly expose their family by bringing home lead from the workplace. Oklahoma blood lead rates were lower than U.S. rates. The Oklahoma State Department of Health is funded by the National Institute for Occupational Safety and Health to collect fundamental data on occupational hazards, diseases, injuries, and deaths in Oklahoma. Although work-related
incidents are likely underreported, information was collected from multiple sources to obtain a more complete profile of important illnesses and injuries affecting Oklahoma’s workforce. These indicators serve as an important tool for occupational health surveillance, which is generally inadequate across the U.S. Trends within Oklahoma will be monitored and compared over time to national and other state data and will be used to help inform program and policy planning.

2
Introduction In 2003, Oklahoma had a civilian workforce of 1.6 million persons. Just over half of workers were male (54%), and 94% were between the ages of 18 and 64 years (Table 1). Two-thirds of employees worked 40 or more hours per week. Ten percent of workers were self-employed. The leading industries included education and health services (21%), wholesale and retail trade (15%), manufacturing (10%), professional and business services (8%), leisure and hospitality (8%), and construction (7%). The most common occupations were professional and related occupations (19%), service (15%), management, business, and financial operations (15%), office and administrative support (14%), and sales and related occupations (11%). The annual incidence rate of work-related injury and illness in Oklahoma in 2003 was 5.0 per 100,000 full time equivalents (FTE), the same as the national rate.1 The work-related fatal injury rate in Oklahoma among persons age 16 years and older, however, was 56% higher than the United States (U.S.) rate.2 The Oklahoma State Department of Health is funded by the National Institute for Occupational Safety and Health (NIOSH) to collect fundamental data on occupational hazards, diseases, injuries, and deaths in Oklahoma. Data are collected on 13 health conditions specified by guidelines produced by the Council of State and Territorial Epidemiologists (CSTE) and NIOSH.3 The indicators were created and selected based on the availability of existing statewide data sources, the public health importance of the health effect or exposure (e.g., magnitude, severity, economic impact, degree of concern, and emergent status), and the potential for workplace interventions (i.e., future program and policy development).3 The data are collected using standardized methodology
from existing data sources, including Oklahoma Vital Statistics, the Oklahoma hospital discharge database, Oklahoma Workers’ Compensation Court, the Bureau of Labor Statistics, the American Association of Poison Control Centers/Oklahoma Poison Control Center, the Oklahoma Central Cancer Registry, and the Oklahoma Adult Blood Lead Epidemiology and Surveillance program. Descriptions of these data sources, including limitations, are on page 16. Although work-related incidents are likely underreported, standardized data are collected in Oklahoma and other states to help fill gaps in knowledge regarding occupational conditions at the state and national levels. Trends within Oklahoma will be compared over time and data will be used to help inform program and policy planning. When other state data for 2003 are available, they will be compared to Oklahoma indicators. Information is collected on the following indicators: • Non-fatal work-related injuries and illnesses
reported by employers • Work-related hospitalizations • Fatal work-related injuries • Work-related amputations with days away from
work reported by employers • Amputations filed with the state workers’
compensation system • Hospitalizations for work-related burns • Work-related musculoskeletal disorders with
days away from work reported by employers • Carpal tunnel syndrome cases filed with the
state workers’ compensation system • Hospitalizations from or with pneumoconiosis • Mortality from or with pneumoconiosis • Acute work-related pesticide-associated illness
and injury reported to poison control centers • Incidence of malignant mesothelioma • Elevated blood lead levels among adults

3
Table 1. Employment Demographic Profile for Oklahoma and the U.S., 2003 Oklahoma U.S.
Number Percentage Percentage Civilian workforce unemployed 96,000 5.7% 6.0% Civilian employment self-employed 157,000 9.8% 7.5% Civilian employment in part-time jobs 276,000 17.3% 17.7% Civilian employment by number of hours worked
0-39 hours worked 518,000 32.4% 30.9% 40 hours worked 659,000 41.2% 41.3% 41+ hours worked 424,000 26.5% 27.8%
Civilian employment by sex Male 859,000 53.7% 53.2% Female 741,000 46.3% 46.8%
Civilian employment by age group 16-17 years 31,818 2.0% 1.7% 18-64 years 1,498,259 93.9% 95.0% 65+ years 64,793 4.1% 3.3%
Civilian employment by race White 1,296,000 81.0% 82.9% Black 98,000 6.1% 10.7% Other 206,000 12.9% 4.2%
Civilian employment by Hispanic origin 73,000 4.6% 12.6% Civilian employment by industry*
Mining 27,000 1.7% 0.4% Construction 113,000 7.0% 7.4% Manufacturing 164,000 10.2% 12.2% Wholesale and retail trade 245,000 15.3% 15.0% Transportation and utilities 82,000 5.1% 5.0% Information 41,000 2.6% 2.7% Financial activities 102,000 6.4% 7.1% Professional and business services 129,000 8.1% 10.1% Education and health services 340,000 21.3% 20.5% Leisure and hospitality 121,000 7.6% 8.4% Other services 97,000 6.1% 4.9% Public Administration 90,000 5.6% 4.5% Agriculture 47,000 2.9% 1.7%
Civilian employment by occupation* Management, business, and financial operations 241,000 15.1% 14.5% Professional and related occupations 305,000 19.1% 20.3% Service 245,000 15.3% 16.0% Sales and related occupations 170,000 10.6% 11.6% Office and administrative support 229,000 14.3% 14.2% Farming, fishing, and forestry 16,000 1.0% 0.8% Construction and extraction 106,000 6.7% 5.9% Installation, maintenance, and repair 77,000 4.8% 3.7% Production 111,000 6.9% 7.0% Transportation and material moving 98,000 6.1% 6.0%
Source: U.S. Department of Labor, Bureau of Labor Statistics * Numbers include only experienced workers.

4
Indicator 1. Non-Fatal Work-Related Injuries and Illnesses Reported by Employers Background In the U.S. in 2003, there was a total of 4.4 million non-fatal injuries and illnesses in private industry; more than 90% of these events (4.1 million) were injuries.4 Almost one-third (32%) of injuries occurred in goods-producing industries (i.e., agriculture, forestry, fishing, and hunting; mining; construction; and manufacturing), although these industries employed only 22% of the private industry workforce. The number of work-related illnesses is an underestimate due to the fact that some conditions have long-term latency and induction periods and may be difficult to associate with the workplace. The impact of these occupational events is far-reaching, placing significant burdens on the healthcare system and workplace productivity. Just over 50% of persons who sustained a non-fatal work-related injury or illness required days away from work, job transfer, or restricted duties at work. In 1999, approximately 3.9 million work-related injuries or illnesses were treated in hospital emergency rooms among workers 15 years of age and older.5 The majority of these visits involved young male workers. An estimated 25% of emergency department-treated injuries were lacerations, punctures, amputations, and avulsions, while another 25% were sprains and strains.6
Data Source Bureau of Labor Statistics, Survey of Occupational Injuries and Illnesses Demographic Group Persons employed in the private sector Inclusion Criteria Persons with work-related injuries and illnesses reported by employers Oklahoma Data 1.1. Estimated annual total number of work-related injuries and illnesses: 48,400 1.2. Estimated annual total work-related injury and illness incidence rate per 100,000 FTEs: 5,000 1.3. Estimated annual total number of cases involving days away from work: 13,500 1.4. Estimated annual total incidence rate for cases involving days away from work per 100,000 FTEs: 1,400 1.5. Estimated annual total number of cases involving more than 10 days away from work: 6,990
5
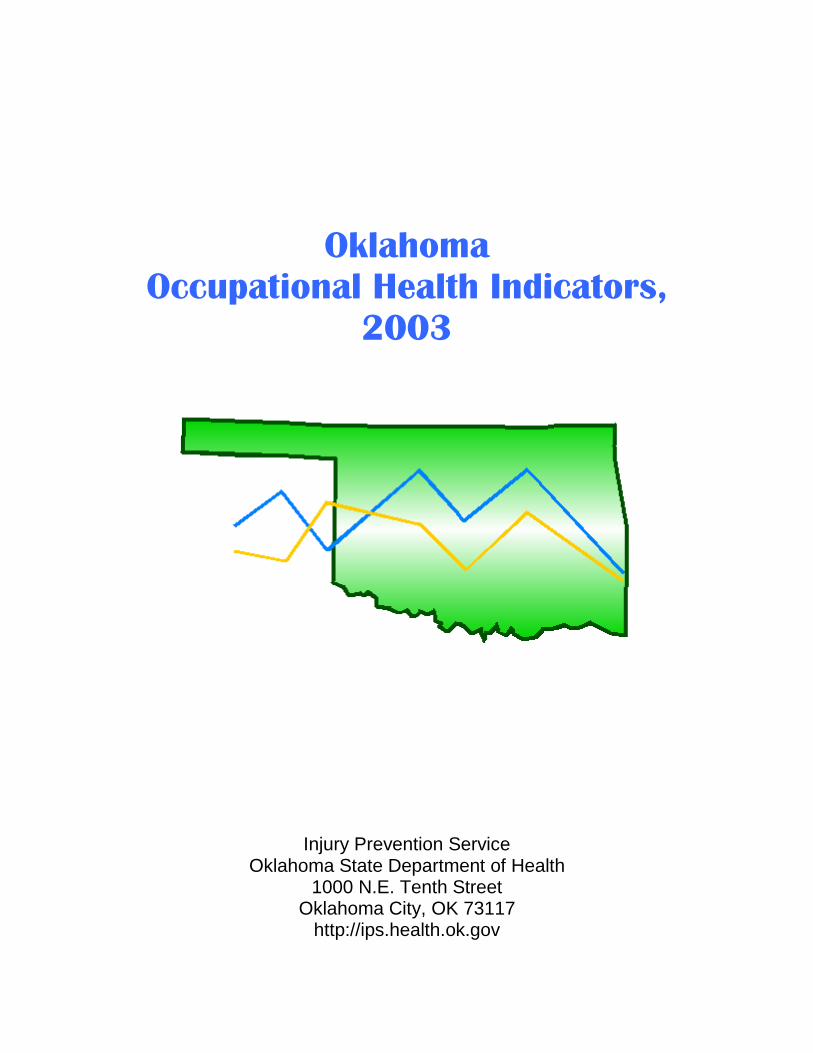
Indicator 2. Work-Related Hospitalizations Background Work-related injuries and illnesses that require hospitalization can be costly and may result in long-term disability. In the U.S., workers’ compensation costs are more than $100 billion annually.3 A study of the Nationwide Inpatient Sample data from 1997-1999 showed that hospitalizations paid by workers’ compensation involved more procedures, had a slightly longer length of stay, and, in some cases, had higher charges than similar non-workers’ compensation cases after adjusting for type of diagnosis and other factors.7 Data Source Oklahoma hospital discharge database
Demographic Group Employed Oklahoma residents 16 years and older Inclusion Criteria Persons with a primary payer of workers’ compensation Oklahoma Data 2.1. Annual number of work-related hospitalizations: 3,867 2.2. Annual crude rate of work-related hospitalizations per 100,000 employed persons: 241.7
Annual crude rate of work-related hospitalizations, U.S. and Oklahoma, 2003
134.3
241.7
0
50
100
150
200
250
300
U.S. Oklahoma
Rate
per 1
00,00
0 Em
ploy
ed P
erso
ns

6
Indicator 3. Fatal Work-Related Injuries Background Workplace fatalities are complex events that involve multiple risk factors, including workplace/procedure design, work organization, worker characteristics, economics, and a variety of social factors.3 Although women constitute just less than half of the workforce, they account for only about 7% of work-related fatalities.2 The highest number of fatalities occur among persons 20-44 years of age. From 1994-2003, the number of occupational fatalities in the U.S. dropped from 6,632 to 5,575 deaths. The four most common work-related fatal events in 2003 were highway incidents (24%), falls (12%), homicides (11%), and struck by object (10%). Workplace homicides have declined considerably since 1992 (1,044 in 1992, 632 in 2003); however, the number of falls has increased (600 in 1992, 696 in 2003) as have highway incidents (1,158 in 1992, 1,353 in 2003). Additional detailed information on work-related fatalities in Oklahoma may be found at http://www.health.state.ok.us/program/injury/ under Summary of Reportable Injuries in Oklahoma and Oklahoma Fatality Assessment and Control Evaluation (OKFACE).
Data Source Bureau of Labor Statistics, Census of Fatal Occupational Injuries Demographic Group Employed persons 16 years and older Inclusion Criteria Persons who died from a traumatic injury while working Oklahoma Data 3.1 Annual number of work-related traumatic
fatalities: 100 3.2 Annual crude fatality rate per 100,000
employed persons: 6.3
Annual crude rate of work-related traumatic fatalities, U.S. and Oklahoma, 2003
4.1
6.3
0
1
2
3
4
5
6
7
U.S. Oklahoma
Rate
per 1
00,00
0 Em
ploy
ed P
erso
ns

7
Indicator 4. Work-Related Amputations with Days Away from Work Reported by Employers
Indicator 5. Amputations Filed with the State Workers’ Compensation System Background Amputations are serious injuries that profoundly impact a worker’s productivity and abilities, in addition to being monetarily costly.3 During 1996-1997, amputation injury claims averaged $18,120, making them the most expensive worker claim.8 In 2003, there were nearly 8,200 non-fatal amputations involving days away from work; 64% occurred in the manufacturing industry.9 Over three-quarters of these non-fatal amputations were fingertip amputations, making fingers the most commonly involved body part.8 Amputations were among the top three major disabling injuries and illnesses with a median number of 30 days away from work.9 Fatal amputations occur far less frequently; there were 171 fatalities from 1992-1999.8 Two-thirds of these deaths happened in three major industry divisions: transportation/public utilities, agriculture, and manufacturing.8
Data Source Indicator 4. Bureau of Labor Statistics, Survey of Occupational Injuries and Illnesses Indicator 5. Oklahoma Workers’ Compensation Court Demographic Group Indicator 4. Persons employed in the private sector
Indicator 5. Persons who are covered by the Oklahoma Workers’ Compensation Court system Inclusion Criteria Indicator 4. Persons with an Occupational Injury and Illness Classification (OIIC) nature code of 031 (amputations) Indicator 5. Persons with a National Council on Compensation Insurance (NCCI) code for amputation (02) (unless the claim involves the eye, back, chest, abdomen, or body systems) regardless of open or closed claim status, age, and state of residence; based on the date of injury Oklahoma Data 4.1. Estimated annual number of work-related amputations involving days away from work: 90 4.2. Estimated annual incidence rate of amputations involving days away from work per 100,000 FTEs: 9.0 5.1. Annual number of amputations filed with Oklahoma Workers’ Compensation Court: 94 5.2. Annual incidence rate of amputations filed with Oklahoma Workers’ Compensation Court: 6.9
Annual crude rate of work-related amputations with days away from work, U.S. and Oklahoma, 2003
9 9
0
2
4
6
8
10
U.S. Oklahoma
Rate
per 1
00,00
0 Em
ploy
ed
Pers
ons

8
Indicator 6. Hospitalizations for Work-Related Burns Background Serious work-related burns are costly, painful, and devastating injuries.3,10 It was been estimated that 20%-40% of burns are work-related.3,10-13 Males have a higher incidence rate than females, and specific occupations have been found to be associated with degree of burn, anatomic site, and exposures.10,14-15 Workers under age 25 years have an incidence rate two to five times higher than that of older age groups, which associates with the level of personal experience and the amount of workplace training.5,10,16 Welders, cooks, laborers, food service workers, and mechanics generally have the highest rates of burn injury, with the majority of injuries being to the upper extremities from heat/scald burns, followed by chemical burns.10,14-16 In 2003 in the U.S., 19,600 heat burn cases and 7,700 chemical burn cases required days away from work.9
Data Source Oklahoma hospital discharge database Demographic Group Oklahoma residents 16 years and older Inclusion Criteria Persons with a primary payer of workers’ compensation and a primary ICD-9-CM diagnosis code between 940 and 949 Oklahoma Data 6.1 Annual number of hospitalizations for work-
related burns: 42 6.2 Annual rate of burn hospitalizations per
100,000 employed persons: 2.6
Annual crude rate of work-related burn hospitalizations, U.S. and Oklahoma, 2003
4
2.6
0
0.5
1
1.5
2
2.5
3
3.5
4
4.5
U.S. Oklahoma
Rate
per 1
00,00
0 Em
ploy
ed P
erso
ns

9
Indicator 7. Work-Related Musculoskeletal Disorders with Days Away from Work Reported by Employers
Indicator 8. Carpal Tunnel Syndrome Cases Filed with the State Workers’ Compensation System Background Musculoskeletal disorders (MSDs), as defined by the U.S. Department of Labor, are injuries or disorders of the muscles, nerves, tendons, joints, cartilage, and spinal discs that are not caused by slips, trips, falls, motor vehicle crashes, or similar events. In 2003, the 435,180 MSDs accounted for 33% of all injuries or illnesses with days away from work (median=8 days).9 Nursing aides/orderlies/ attendants had the highest number of MSDs (33,700 cases), followed by laborers and material movers (33,100 cases) in 2003. Heavy and tractor-trailer truck drivers had the third highest number of cases (20,600), but the highest median number of days away from work (17 days). 9 Of industry divisions, however, it was the mining industry that had the highest median number of days away from work (28 days). 9 Although the number of other work-related illnesses and injuries have declined in the past decade, MSDs have not, despite extensive efforts to change and redesign working environments to improve ergonomics and daily working conditions.17 More than 4 out of 10 injuries and illnesses in the U.S. that resulted in days away from work were due to sprains or strains. 9 Included as a MSD is carpal tunnel syndrome, the most disabling injury in terms of days away from work (median=32 days). 9 Unlike the majority of occupational injuries, nearly 70% of carpal tunnel syndrome cases are among females.5 Of all musculoskeletal disorders, injuries of the back are most common, followed by disorders of the neck, shoulder, and upper extremities.18 Data Source Indicator 7. Bureau of Labor Statistics, Survey of Occupational Injuries and Illnesses; Oklahoma Occupational Safety and Health Profile
Indicator 8. Oklahoma Workers’ Compensation Court Demographic Group Indicator 7. Persons employed in the private sector Indicator 8. Persons who are covered by the Oklahoma Workers’ Compensation Court system Inclusion Criteria Indicator 7. Persons with one or more of the following Occupational Injury and Illness Classification (OIIC) nature codes: 021 (sprains, strains, tears), 0972 (back pain, hurt back), 0973 (soreness, pain, hurt, except the back), 1241 (carpal tunnel syndrome), 153 (hernia), or any nature code that begins with 17 (musculoskeletal system and connective tissue diseases and disorders) AND one of the following OIIC event codes: 211 (bending, climbing, crawling, reaching, twisting), 22 (overexertion), or 23 (repetitive motion). Indicator 8. Includes all cases with a NCCI code for carpal tunnel syndrome (78) regardless of open or closed claim status, age, and state of residence; based on the date of injury Oklahoma Data 7.1. Estimated annual number of all musculoskeletal disorders involving days away from work: 4,440 7.2. Estimated annual incidence rate of all musculoskeletal disorders involving days away from work per 100,000 FTEs: 458 7.3. Estimated annual number of musculoskeletal disorders of the neck, shoulder, and upper extremities involving days away from work: 1,660

10
7.4. Estimated annual incidence rate of musculoskeletal disorders of neck, shoulder, and upper extremities involving days away from work per 100,000 FTEs: 172 7.5. Estimated annual number of carpal tunnel syndrome cases involving days away from work: 240 7.6. Estimated annual incidence rate of carpal tunnel syndrome cases involving days away from work per 100,000 FTEs: 25 7.7. Estimated annual number of musculoskeletal disorders of the back involving days away from work: 1,750
7.8. Estimated annual incidence rate of musculoskeletal disorders of the back involving days away from work per 100,000 FTEs: 181 8.1. Annual number of carpal tunnel syndrome cases filed with Oklahoma Workers’ Compensation Court: 318 8.2. Annual incidence rate of carpal tunnel syndrome cases filed with Oklahoma Workers’ Compensation Court: 23.3
MSD rate* comparisons between the U.S. and Oklahoma, 2003 U.S. Oklahoma
Incidence Rate All musculoskeletal disorders 496 458 Disorders of the neck, shoulder, and upper extremities 140 172 Carpal tunnel syndrome 25 25 Disorders of the back 250 181 *Rate per 100,000 FTEs

11
Indicator 9. Hospitalizations from or with Pneumoconiosis
Indicator 10. Mortality from or with Pneumoconiosis Background Occupational lung disease, the number one work-related illness, may not frequently be curable, but is always preventable.19 Because most pneumoconioses are attributable to occupational exposure, controlling dust exposure is the single most effective prevention strategy, in addition to good ventilation and protective equipment.3 Types of pneumoconioses include asbestosis (exposure to microscopic asbestos fibers), coal workers’ pneumoconiosis (“black lung disease”; inhalation of coal dust), and silicosis (exposure to free crystalline silica), and these conditions may lead to complications such as respiratory infections/failure, renal disease, lung cancer, and emphysema.3,19 During the 1990s, there were over 30,000 deaths from all pneumoconioses combined (median age=77 years). Ninety-eight percent of deaths were among males and 94% were white. Coal mining and construction were the most frequently recorded industries on the death certificates.20
Data Source Indicator 9. Oklahoma hospital discharge database Indicator 10. Oklahoma Vital Statistics Demographic Group Indicator 9. Oklahoma residents 15 years of age and older Indicator 10. Oklahoma residents 15 years of age and older Inclusion Criteria Indicator 9. Persons with any ICD-9-CM diagnosis code of 500 (coal workers’ pneumoconiosis), 501 (asbestosis), 502 (silicosis), and 503, 504, 505 (other and unspecified pneumoconiosis) Indicator 10. Persons with an underlying or contributing ICD-10 cause of death code of J60 (coal workers’ pneumoconiosis), J61 (asbestosis),
J62.0-J62.8 (silicosis), and J63.0-J63.8, J64, J65, J66.0-J66.8 (other and unspecified pneumoconiosis) Oklahoma Data Indicator 9.1.1. Annual number of total pneumoconiosis hospital discharges: 148 Indicator 9.1.2. Annual rate of total pneumoconiosis hospital discharges: 53.1 Indicator 9.1.3. Annual age-standardized rate of total pneumoconiosis hospitalizations: 51.3 Indicator 9.2.1. Annual number of coal workers’ pneumoconiosis hospital discharges: 47 Indicator 9.2.2. Annual rate of coal workers’ pneumoconiosis hospital discharges per million residents: 16.9 Indicator 9.2.3. Annual age-standardized rate of coal workers’ pneumoconiosis hospital discharges per million residents: 16.4 Indicator 9.3.1. Annual number of asbestosis hospital discharges: 79 Indicator 9.3.2. Annual rate of asbestosis hospital discharges per million residents: 28.4 Indicator 9.3.3. Annual age-standardized rate of asbestosis hospital discharges per million residents: 27.2 Indicator 9.4.1. Annual number of silicosis hospital discharges: 21 Indicator 9.4.2. Annual rate of silicosis hospital discharges per million residents: 7.5

12
Indicator 9.4.3. Annual age-standardized rate of silicosis hospital discharges per million residents: 7.3 Indicator 9.5.1. Annual number of other and unspecified pneumoconiosis hospital discharges: 2 Indicator 10.1.1. Annual number of total pneumoconiosis deaths: 12 Indicator 10.1.2. Annual total pneumoconiosis death rate per million residents: 4.3 Indicator 10.1.3. Annual age-standardized total pneumoconiosis death rate per million residents: 4.2 Indicator 10.2.1. Annual number of coal workers’ pneumoconiosis deaths: 1
Indicator 10.3.1. Annual number of asbestosis deaths: 9 Indicator 10.3.2. Annual asbestosis death rate per million residents: 3.2 Indicator 10.3.3. Annual age-standardized asbestosis death rate per million residents: 3.1 Indicator 10.4.1. Annual number of silicosis deaths: 1 Indicator 10.5.1. Annual number of other and unspecified pneumoconiosis deaths: 1
Pneumoconiosis age-standardized rate* comparisons between the U.S. and Oklahoma, 2003 U.S. Oklahoma
Age-Standardized Rate Total pneumoconiosis hospitalization 90.4 51.3 Coal workers’ pneumoconiosis hospitalization 30.3 16.4 Asbestosis hospitalization 54.6 27.2 Silicosis hospitalization 4.1 7.3 Total pneumoconiosis mortality 11.5 4.2 Asbestosis mortality 6.4 3.1 *Rate per million residents

13
Indicator 11. Acute Work-Related Pesticide-Associated Illness and Injury Reported to Poison Control Centers Background In 1995, the Environmental Protection Agency implemented a regulation mandating that farmers, pesticide applicators, and farmworkers be educated about the health effects of pesticide exposure and the need for medical treatment for such effects (Agricultural Worker Protection Standard 40 CFR Parts 156 & 170). After one year, meetings were held across the U.S. to evaluate implementation and progress. One resounding conclusion was the need for better recognition, diagnosis, and treatment of pesticide-related poisonings.21,22 Pesticides, by design, are made to kill and cause harm to living organisms; as a result, workers in certain occupations may be exposed to pesticides either in preparing them for use, in applying them, or in entering areas post application.21 In a study using 1998-1999 pesticide surveillance data from the Sentinel Event Notification System for Occupational Risks (SENSOR) program, these poisonings were found to be a particular health problem in agriculture, which had an illness incidence rate of 18.2 per 100,000 FTEs, compared to 0.53 per 100,000 FTEs in non-agricultural industries.23 Insecticides were responsible for 49% of illnesses and nearly 30% were ranked as moderately severe. Incidence rates peaked among the 20-24 year age group and, in most cases, exposure occurred during routine work activities not involving pesticide application.23
Data Source American Association of Poison Control Centers Data/Oklahoma Poison Control Center Demographic Group Employed persons 16 years and older Inclusion Criteria Oklahoma Poison Control Center callers who meet the following criteria: 1) the reason for the call is occupational or the exposure site is a workplace; 2) the medical outcome is minor effect, moderate effect, major effect, death, not followed (minimal clinical effects possible), or unable to follow (judged as a potentially toxic exposure); and 3) the exposure is to an agent in one of the generic pesticide categories (disinfectants, non-medicinal fungicides, fumigants, herbicides, insecticides, repellents, and rodenticides). Cases are excluded if they were exposed to more than one product or if the reason for the exposure was suspected suicide, intentional abuse, intentional or malicious action, or for an unknown reason. Oklahoma Data Indicator 11.1. Annual number of reported work-related pesticide poisoning cases: 53 Indicator 11.2. Annual incidence rate of reported work-related pesticide poisoning cases per 100,000 employed persons: 3.3
Annual incidence rate of reported work-related pesticide poisonings, U.S. and Oklahoma, 2003
1.8
3.3
0 0.5
1 1.5
2 2.5
3 3.5
4
U.S. Oklahoma
Rate
per 1
00,00
0 Em
ploy
ed
Pers
ons

14
Indicator 12. Incidence of Malignant Mesothelioma Background Mesothelioma, a rare form of cancer, is typically caused by exposure to asbestos and related fibers.3 Approximately 2,500 deaths occur every year, including 20% among females.20 With a long latency period, most people diagnosed with malignant mesothelioma are over 50 years of age and are already in an advanced stage of the disease.19 In most cases, exposure to the carcinogenic material is generally of long duration; however, people (e.g., family members) living with someone who works with asbestos can also be at risk.19 In 1999, occupations with elevated mesothelioma mortality included plumbers, pipefitters, steamfitters, mechanical engineers, electricians, and elementary school teachers.20 Data Source: Oklahoma Central Cancer Registry
Demographic Group Oklahoma residents 15 years and older Inclusion Criteria Persons who have an ICD-O-3 histology code of 9050-9053 Oklahoma Data Indicator 12.1. Annual number of incident mesothelioma cases: 28 Indicator 12.2. Annual mesothelioma incidence rate per million residents: 10.1 Indicator 12.3. Annual age-standardized mesothelioma incidence rate per million residents: 9.7
Annual age-standardized incidence rate of mesothelioma, U.S. and Oklahoma, 2003
13.1
9.7
0
2
4
6
8
10
12
14
U.S. Oklahoma
Age-
stan
dard
ized
Rate
per
Milli
on
Resid
ents

15
Indicator 13. Elevated Blood Lead Levels Among Adults Lead exposure has long been recognized as a health hazard.24 Mainly an occupational health problem, 90%-95% of adults with elevated blood lead levels are exposed in their working environments.3,24 The highest number of elevated blood lead levels were among workers involved in manufacture of storage batteries; painting, paperhanging, and decorating; and mining of lead ores.25 Elevated blood lead levels can produce numerous complications, including anemia, hypertension, kidney problems, decreased fertility, increased miscarriages, and nervous system dysfunction. Workers can also unknowingly expose their family by bringing home lead from the workplace. In 2003, 37 states participating in the Adult Blood Lead Epidemiology and Surveillance Program reported 9,884 resident adults with elevated blood lead levels greater or equal to 25 μg/dL.25 Data Source Adult Blood Lead Epidemiology and Surveillance Program Demographic Group Employed Oklahoma residents 16 years and older Inclusion Criteria Blood lead levels greater than or equal to 25 μg/dL and greater than or equal to 40 μg/dL; all cases regardless of occupational exposure status are included
Oklahoma Data Indicator 13.1.1. Annual number of residents with elevated blood lead levels greater than or equal to 25 μg/dL: 85 Indicator 13.1.2. Annual prevalence rate of residents with elevated blood lead levels greater than or equal to 25 μg/dL per 100,000 employed persons: 5.3 Indicator 13.1.3. Annual number of incident cases of residents with elevated blood lead levels greater than or equal to 25 μg/dL: 48 Indicator 13.1.4. Annual incidence rate of residents with elevated blood lead levels greater than or equal to 25 μg/dL per 100,000 employed persons: 3.0 Indicator 13.2.1. Annual number of residents with blood lead levels greater than or equal to 40 μg/dL: 19 Indicator 13.2.2. Annual prevalence rate of residents with blood lead levels greater than or equal to 40 μg/dL per 100,000 employed persons: 1.2 Indicator 13.2.3. Annual number of incident cases of residents with blood lead levels greater than or equal to 40 μg/dL: 6 Indicator 13.2.4. Annual incidence rate of residents with blood lead levels greater than or equal to 40 μg/dL per 100,000 employed persons: 0.4
Blood lead rate* comparisons between the U.S. and Oklahoma, 2003 U.S. Oklahoma Greater than or equal to 25 μg/dL Prevalence rate 8.2 5.3 Incidence rate 5.1 3.0 Greater than or equal to 40 μg/dL Prevalence rate 1.4 1.2 Incidence rate 0.8 0.4 *Rate per 100,000 employed persons

16
Description of Data Sources Oklahoma Vital Statistics The Oklahoma State Department of Health Vital Records Division maintains death certificates on all deaths that occur in the state. On average, death certificates are received in Vital Records within two to four weeks following the death. Death certificates are scanned and all text regarding cause of death is entered into the computer. The file is then sent to the National Center for Health Statistics for ICD-10 coding; data are typically coded within 45-60 days and the files are returned to the Oklahoma State Department of Health. Deaths are coded to multiple causes of death. Limitations. Causes of death and coding of death certificates may not be accurate for all cases. For example, the injury at work variable may not be correctly coded, particularly for persons working in secondary occupations at the time of death. The decedent’s usual occupation (type of work done during most of working life) may not reflect the source of an occupational exposure. Persons who die from a work-related illness or injury may not have been exposed in the state where the death occurred. Bureau of Labor Statistics The U.S. Department of Labor, Bureau of Labor Statistics, provides a variety of information on labor economics and statistics, including data on employment, unemployment, wages, and safety and health. The Survey of Occupational Injuries and Illnesses uses employer logs to measure non-fatal injuries and illnesses. The Census of Fatal Occupational Injuries collects information on work-related fatalities from a variety of sources, including death certificates, workers' compensation records, and reports to federal and state agencies.26
Limitations. Data may not be collected for military personnel, self-employed persons, small farm operations, youth workers, and federal and state employees. Data reported by employers to the Bureau of Labor Statistics may not be accurate. Some data are based on a probability sample and not a census of all employees; sampling error may be present.3 In 2003, the system to code the industry category changed to the North American Industry Classification System (NAICS). Prior to 2003, the Standard Industrial Classification (SIC) system was used. This change represents a break in series, and industry categories in 2003 cannot be directly compared with results from previous years.4 Oklahoma Hospital Discharge Database Data for the hospital discharge database (HDD) are collected and maintained by the Health Care Information Division of the Oklahoma State Department of Health. Reporting is mandatory for all licensed acute care facilities in Oklahoma, and data are collected on all inpatients. The HDD includes demographic information, length of stay, discharge diagnosis codes, and hospital charges. Limitations. The HDD generally does not obtain data from federal hospitals (military and Native American). Data are not collected on Oklahoma residents who are hospitalized in another state. Identification of cases relies on accurate diagnosis of the condition and proper coding, including payer codes. Persons injured at work who are self-employed, work as independent contractors, work in agriculture, and others may not have the primary payer listed as workers’ compensation.

17
Oklahoma Workers’ Compensation Court The Oklahoma Workers’ Compensation Court provides procedures to resolve disputes and identify issues related to occupational injuries. The Court is composed of 10 judges who are appointed by the Governor for six-year terms. Reports to Oklahoma Workers’ Compensation Court include claims for persons who cannot resolve disputes with their employer or insurance company as well as persons who suffer an injury that requires off-site medical attention or results in more than one shift of time missed. Limitations. Workers’ compensation data are not complete since some persons with work-related injuries or illnesses do not file workers’ compensation claims. Certain workers, including sole proprietors, agriculture workers, and federal government employees are not eligible to use the Oklahoma workers’ compensation system. Claims for amputations must be filed within two years of the injury or death or within two years of the last payment of any compensation or authorized medical treatment. For carpal tunnel syndrome, the claim must be filed within two years of the date of last trauma or hazardous exposure. Because workers’ compensation systems are not uniform across states, national and state comparisons cannot be made. Oklahoma Poison Control Center/American Association of Poison Control Centers The Oklahoma Poison Control Center provides emergency poisoning treatment advice free of charge from specially trained licensed pharmacists and nurses 24 hours a day, 365 days a year. Callers to the nationwide toll free poison control telephone number that have an Oklahoma area code are routed to the Oklahoma Poison Control Center. The Oklahoma Poison Control Center receives approximately 180 calls each day and obtains detailed information on the exposure, including whether or not the exposure was occupationally-related and if the exposure site was the workplace. All data are entered into an
electronic database and are immediately available for analysis. Follow-up information is obtained on all hospitalized cases and home interventions. The Oklahoma Poison Control Center and all other state poison control centers report statewide data to the American Association of Poison Control Centers. Poison control data for this report were obtained from the American Association of Poison Control Centers to maintain consistency for between-state comparisons. Limitations. Poison control data include only persons who call the center. Although the Oklahoma Poison Control Center encourages reporting of all poisonings (not just those for which help is needed), the vast majority of callers are seeking advice. Data on the specific industry or occupation related to the exposure are not systematically collected. Oklahoma Central Cancer Registry The Oklahoma State Department of Health, Chronic Disease Division maintains the Oklahoma Central Cancer Registry. Data collection for the statewide population-based surveillance system began in 1997. The registry includes information on all newly diagnosed and treated cancers among Oklahoma residents. Basal and squamous cell carcinoma of the skin and carcinoma in situ of the cervix are excluded. Case information is obtained from all hospitals, health care facilities, physicians, pathology laboratories, and other medical providers who diagnose or treat cancer patients. Data on Oklahoma residents are also obtained from other cancer registries, including the Cherokee Nation Cancer Registry and registries maintained in other states, the hospital discharge database, and death certificates. Data are also collected on Oklahomans hospitalized in other states through data sharing agreements. It is estimated that the registry is at least 95% complete. Limitations. Federal facilities are not required to report cases to the registry; however, their participation is encouraged and a few do report cases to the Oklahoma registry. Many patients

18
treated by federal facilities are included in the registry because they are served by other hospitals under health contracts and are reported by other health care providers. Adult Blood Lead Epidemiology and Surveillance Program The Oklahoma Adult Blood Lead Epidemiology and Surveillance (ABLES) program collects and analyzes data to identify the prevalence of elevated blood lead levels in the adult population. In addition, the program strives to identify high risk industries and occupations for primary prevention strategies to eliminate adult and childhood lead poisoning. The Oklahoma ABLES program has been collecting data statewide on adult (16 years of age and older) blood lead levels since 1995. Oklahoma state law requires that all blood lead
test results be reported to the Oklahoma State Department of Health. Reports are received on positive and negative results. For persons with blood lead levels greater than or equal to 25 μg/dL, detailed information, including occupation and possible lead exposure sources, is obtained by telephone or mail from the individuals or from their physicians. Limitations. Many adults who are exposed to lead do not routinely have blood lead level testing. Reporting by laboratories may not be complete, especially by laboratories that are in another state. Oklahomans with elevated blood lead levels may work or have been exposed in another state. The occupation and source of exposure are not known for all persons in the ABLES database.

19
References 1. United States Department of Labor, Bureau of Labor Statistics, Occupational injuries and illnesses:
industry data. Available at http://data.bls.gov/cgi-bin/surveymost?ii. Accessed February 20, 2007. 2. United States Department of Labor, Bureau of Labor Statistics, Census of Fatal Occupational Injuries
Charts, 1992-2005. Available at http://www.bls.gov/iif/oshcfoi1.htm#19922002. Accessed February 20, 2007.
3. Council of State and Territorial Epidemiologists. Occupational health indicators: a guide for tracking occupational health conditions and their determinants. August 2006. Available at http://www.cste.org/ pdffiles/howoguide8.3.06.pdf. Accessed February 23, 2007.
4. Bureau of Labor Statistics. Workplace injuries and illnesses in 2003. Washington, DC: United States Department of Labor, Bureau of Labor Statistics, USDL 04-2486, December 14, 2004.
5. National Institute for Occupational Safety and Health. Worker health chartbook, 2004. Centers for Disease Control and Prevention, National Institute for Occupational Safety and Health, 2004-146, May 2004.
6. Jackson LL. Non-fatal occupational injuries and illnesses treated in hospital emergency departments in the United States. Injury Prevention, 2001;7(Suppl 1):i21-i26.
7. Dembe AE, Mastroberti MA, Fox SE, Bigelow C, Banks SM. Inpatient hospital care for work-related injuries and illnesses. American Journal of Industrial Medicine, 2003;44(4):331-342.
8. Brown JD. Amputations: a continuing workplace hazard. Compensation and Working Conditions Online. January 2003. Available at http://stats.bls.gov/opub/cwc/print/sh20030114ar01p1.htm. Accessed February 23, 2007.
9. Bureau of Labor Statistics. Lost-worktime injuries and illnesses: characteristics and resulting days away from work, 2003. Washington, DC: United States Department of Labor, Bureau of Labor Statistics, USDL 05-521, March 30, 2005
10. Islam SS, Nambiar AM, Doyle EJ, Velilla AM, Biswas RS, Ducatman AM. Epidemiology of work-related burn injuries: experience of a state-managed workers’ compensation system. The Journal of Trauma Injury, Infection, and Critical Care, 2000;49:1045-1051.
11. McCullough J, Henderson A, Kaufman J. Occupational burns in Washington state, 1989-1993. J Occup Environ Med, 1998;40:1083-1089.
12. Quinney B, McGwin G, Cross JM, Valent F, Taylor AJ, Rue LW. Thermal burn fatalities in the workplace, United States, 1992 to 1999. J Burn Care Rehabil, 2002;23:305-310.
13. Rossignol AM, Locke JA, Boyle CM, Burke JF. Epidemiology of work-related burn injuries in Massachusetts requiring hospitalization. J Trauma, 1986;26:1097-1101.
14. Baggs J, Curwick C, Silverstein B. Work-related burns in Washington state, 1994 to 1998. J Occup Environ Med, 2002;44:692-699.
15. Horwitz IB, McCall BP. Quantification and risk analysis of occupational burns: Oregon workers’ compensation claims, 1990 to 1997. J Burn Care Rehabil, 2004;25:328-336.
16. Hendricks KJ, Layne LA. Adolescent occupational injuries in fast food restaurants: an examination of the problem from a national perspective. J Occup Environ Med, 1999;41(12):1146-1153.

20
17. Falkiner S, Myers S. When exactly can carpal tunnel syndrome be considered work-related? J Surgery, 2002;72(3):204-209.
18. Bureau of Labor Statistics. Lost-worktime injuries and illnesses: characteristics and resulting days away from work, 2001. Washington, DC: United States Department of Labor, Bureau of Labor Statistics, USDL 03-138, March 27, 2003.
19. American Lung Association. Occupational lung disease fact sheet. January 2005. Available at http://www.lungusa.org/site/pp.asp?c=dvLUK9O0E&b=35334. Accessed February 23, 2007.
20. Division of Respiratory Disease Studies, National Institute for Occupational Safety and Health. Work-related lung disease surveillance report, 2002. Centers for Disease Control and Prevention, National Institute for Occupational Safety and Health, 2003-111, May 2003.
21. Office of Pesticide Programs, Environmental Protection Agency. Promoting safety for America’s future. FY 2002 annual report. Available at http://www.epa.gov/oppfead1/annual/2002/2002annualreport.pdf. Accessed February 23, 2007.
22. Environmental Protection Agency. National Strategies for Health Care Providers: Pesticide Initiative. Available at http://www.epa.gov/pesticides/safety/healthcare/aboutus.htm. Accessed February 23, 2007.
23. Calvert GM, Plate, DK, Das R, Rosales R, Shafey O, Thomsen C, Male D, Beckman J, Arvizu E, Lackovic M. Acute occupational pesticide-related illness in the US, 1998-1999: surveillance findings from the SENSOR-pesticides program. Am J Ind Med, 2004;45:14-23.
24. National Institute for Occupational Safety and Health. The Adult Blood Lead Epidemiology and Surveillance Program (ABLES). May 2004. Available at http://www.cdc.gov/niosh/ables.html. Accessed February 23, 2007.
25. Roscoe RJ, Graydon JR. Adult blood lead epidemiology and surveillance--United States, 2003-2004. MMWR, 2006;55(32):876-879.
26. Bureau of Labor Statistics. National census of fatal occupational injuries in 2003. Washington, DC: United States Department of Labor, Bureau of Labor Statistics, USDL 04-1830, September 22, 2004.