Embed Size (px)
Citation preview
NEBRASKA OCCUPATIONAL HEALTH
INDICATORS, 2000–2009
Nebraska Department of Health and Human Services
Occupational Safety and Health Surveillance Program
February 2014
NEBRASKA OCCUPATIONAL HEALTH INDICATORS, 2000–2009
Nebraska Department of Health and Human Services
Joseph M. Acierno, M.D., J.D.
Chief Medical Officer
Director, Division of Public Health
Jenifer Roberts-Johnson, J.D.
Deputy Director, Division of Public Health
Ming Qu, M.Ed., Ph.D.
Administrator, Epidemiology and Informatics Unit
Tom Safranek, M.D.
State Epidemiologist, Office of Epidemiology
Report prepared by:
Derry Stover, M.P.H.
Epidemiology Surveillance Coordinator
Occupational Safety and Health Surveillance Program
For more information, contact:
Nebraska Department of Health and Human Services
Division of Public Health, Office of Epidemiology
Occupational Safety and Health Surveillance Program
PO Box 95026
Lincoln, NE 68509
Website: http://dhhs.ne.gov/publichealth/occhealth/
Phone: 402-471-2937
iii
Acknowledgements
We acknowledge the following organizations who provided data and technical support for this report, including: Nebraska Department of Health and Human Services’ Office of Vital Records, Nebraska ABLES Program, Nebraska Workers’ Compensation Court, Nebraska Hospital Association, American Association of Poison Control Centers, Council of State and Territorial Epidemiologists, and the National Institute for Occupational Safety and Health.
Appreciation is extended to Bryan Buss, DVM, Robin Williams, MPH, and Leah Bucco-White for contributing to the review process.
Disclaimer
This report was supported by Grant Number 5U600OH09859 from CDC–NIOSH. Its contents are solely the responsibility of the authors and do not necessarily represent the official views of CDC–NIOSH.
List of terms and abbreviations used in this report
ABLES: Adult Blood Lead Epidemiology and Surveillance
AAPCC: American Association of Poison Control Centers
BLS: U.S. Bureau of Labor Statistics
CBP: County Business Patterns
CFOI: Census of Fatal Occupational Injuries
CSTE: Council of State and Territorial Epidemiologists
CPS: Current Population Survey
FTE: Full-time Equivalent Worker
MSD: Musculoskeletal Disorder
NASI: National Academy of Social Insurance
NIOSH: National Institute for Occupational Safety and Health
NOSHP: Nebraska Occupational Safety and Health Program
OHI: Occupational Health Indicator
OSHA: Occupational Safety and Health Administration
SOII: Survey of Occupational Injuries and Illnesses
NEBRASKA OCCUPATIONAL HEALTH INDICATORS, 2000–2009
1
Executive Summary
A safe and healthy workforce supports Nebraska’s economy and helps Nebraskans live healthier lives. Each year thousands of workers experience a work-related injury or illness. These events have significant impacts on workers and their families, employers, and the state of Nebraska.
The Nebraska Occupational Safety and Health Surveillance Program (NOSHP) tracks injuries, illnesses, deaths, and hazards among Nebraska workers. NOSHP also calculates occupational health indicators, which are standard measures of work-related injuries, diseases, or factors associated with occupational health. Indicators were developed to help states evaluate and compare occupational health data.
The following report presents a review of 20 occupational health indicators from 2000 to 2009 and a comparison of Nebraska occupational health data with national data. Methodologies, limitations, and general trends of these data are also discussed. More information about occupational health indicators, including detailed methodologies and data from others states, can be found on the Council of State and Territorial Epidemiologists (CSTE) Occupational Health Indicators website at www.cste.org.
Highlights of the report are listed below:
Employment Changes:
The percent of workers aged 65 years or older more than doubled from 2.4 in 2000 to 5.1 in 2009.
The percent of workers of Hispanic origin increased from 4.2 to 7.4 from 2000 to 2009.
Indicators compared to the U.S.:
Nebraska had a higher rate of non-fatal injuries and illnesses.
Nebraska had a higher rate of fatal work-related injuries.
Nebraska had a higher incidence rate of carpal tunnel syndrome.
The Nebraska rate of work-related pesticide poisoning was two to four times higher than the U.S. rate.
Indicators that increased from 2000 to 2009:
The percent of Nebraska workers in high morbidity risk and high mortality risk occupations.
The age-standardized pneumoconiosis hospitalization rate per million Nebraska residents. The dollar amount of workers’ compensations benefits paid per covered worker.
Indicators that decreased from 2000 to 2009:
Rates and numbers of total occupational non-fatal injuries and illnesses.
Rates and numbers for work-related hospitalizations and amputations.
Rates of musculoskeletal disorders, including carpal tunnel syndrome.
NEBRASKA OCCUPATIONAL HEALTH INDICATORS, 2000–2009
2
Table of Contents
Acknowledgements ................................................................................................................ iii
Disclaimer .............................................................................................................................. iii
List of terms and abbreviations used in this report .................................................................. iii
Executive Summary ................................................................................................................... 1
Table of Contents ....................................................................................................................... 2
Introduction ................................................................................................................................ 3
Employment Demographics ....................................................................................................... 4
Indicator 1 Non-Fatal Work-Related Injuries and Illnesses ......................................................... 5
Indicator 2 Work-Related Hospitalizations .................................................................................. 7
Indicator 3 Fatal Work-Related Injuries ...................................................................................... 8
Indicator 4 Work-Related Amputations with Days Away from Work ............................................ 9
Indicator 5 Workers’ Compensation Claims for Amputations with Lost Work Time ....................10
Indicator 6 Hospitalizations for Work-Related Burns .................................................................12
Indicator 7 Work-Related Musculoskeletal Disorders with Days Away from Work .....................13
Indicator 8 Workers’ Compensation Claims for Carpal Tunnel Syndrome with Lost Work Time 16
Indicator 9 Hospitalizations from or with Pneumoconiosis .........................................................17
Indicator 10 Mortality from or with Pneumoconiosis ..................................................................20
Indicator 11 Acute Work-Related Pesticide-Associated Illnesses and Injuries ...........................22
Indicator 12 Incidence of Malignant Mesothelioma ....................................................................24
Indicator 13 Elevated Blood Lead Levels among Adults ............................................................25
Indicator 14 Workers Employed in Industries at High Risk for Occupational Morbidity ..............27
Indicator 15 Workers Employed in Occupations at High Risk for Occupational Morbidity ..........28
Indicator 16 Workers Employed in Industries and Occupations at High Risk for Occupational Mortality .........................................................................................................................29
Indicator 17 Occupational Safety and Health Professionals ......................................................32
Indicator 18 OSHA Enforcement Activities ................................................................................33
Indicator 19 Workers’ Compensation Awards ............................................................................35
Indicator 20 Work-Related Low Back Disorder Hospitalizations ................................................36
Conclusion ................................................................................................................................38
References ...............................................................................................................................39
NEBRASKA OCCUPATIONAL HEALTH INDICATORS, 2000–2009
3
Introduction Work is a determinate in a persons’ health. More than 900,000 people are employed in Nebraska, and work-related injuries and illnesses affect Nebraskans on a daily basis. Nationally, more than a million injuries and illnesses resulted in days away from work in 2011, and 4,693 workers died as a result of work‐related injuries (1) (2). Significant costs exist for occupational injuries and illnesses—$60.2 billion workers’ compensation benefits were paid in the U.S. in 2011 (3).
In 2010, the Nebraska Occupational Safety and Health Surveillance Program (NOSHP) was established with funding from the National Institute for Occupational Safety and Health (NIOSH), an institute in the Centers for Disease Control and Prevention (CDC). NOSHP exists within the Nebraska Department of Health and Human Services’ (NDHHS) Office of Epidemiology. The primary goal of NOSHP is to conduct occupational health surveillance, which is the systematic collection, analysis, and dissemination of data related to occupational health.
To enhance assessment and comparison of injury and illness data, NIOSH and the Council of State and Territorial Epidemiologists (CSTE) developed a standardized set of occupational health indicators in 1999 (4). An occupational health indicator is a specific measure of a work-related injury or disease, or a factor associated with occupational health, such as workplace exposures, hazards, or interventions in a specified population. Indicators allow a state to determine the health and risk status of workers, compare data with other states, and evaluate trends over time.
The following report presents a review of 20 occupational health indicators from 2000 to 2009 and a comparison of Nebraska occupational health data with national data when available. Indicators were calculated using CSTE guidelines (5). Data used to calculate these indicators are drawn from several sources, such as national surveys, census counts, and state-based health records. At the national level, the Bureau of Labor Statistics’ (BLS) Geographic Profile of Employment, Survey of Occupational Injuries and Illnesses (SOII), and Census of Fatal Occupational Injuries (CFOI) were used. State-based resources include Nebraska hospital discharge data, workers’ compensation records, cancer registry, and death certificate data.
Data in this report do not necessarily capture all occupational illnesses and injuries—many such events are not reported by employees. Limitations exist when comparing indicators between years and when comparing Nebraska and national data, as data collection methods can vary between states and U.S. averages might not include data from all 50 states. Additional limitations of data sources and indicators are described in detail in the CSTE occupational health indicator guidance document (5).
Ongoing collection, analysis, and dissemination of occupational health indicator data allows NOSHP to assess occupational safety and health trends in Nebraska and identify emerging issues. By conducting such occupational health surveillance, NOSHP can guide prevention and intervention efforts with an ultimate goal to reduce the number of occupational injuries and illnesses and thereby improve the health Nebraska workers.
NEBRASKA OCCUPATIONAL HEALTH INDICATORS, 2000–2009
4
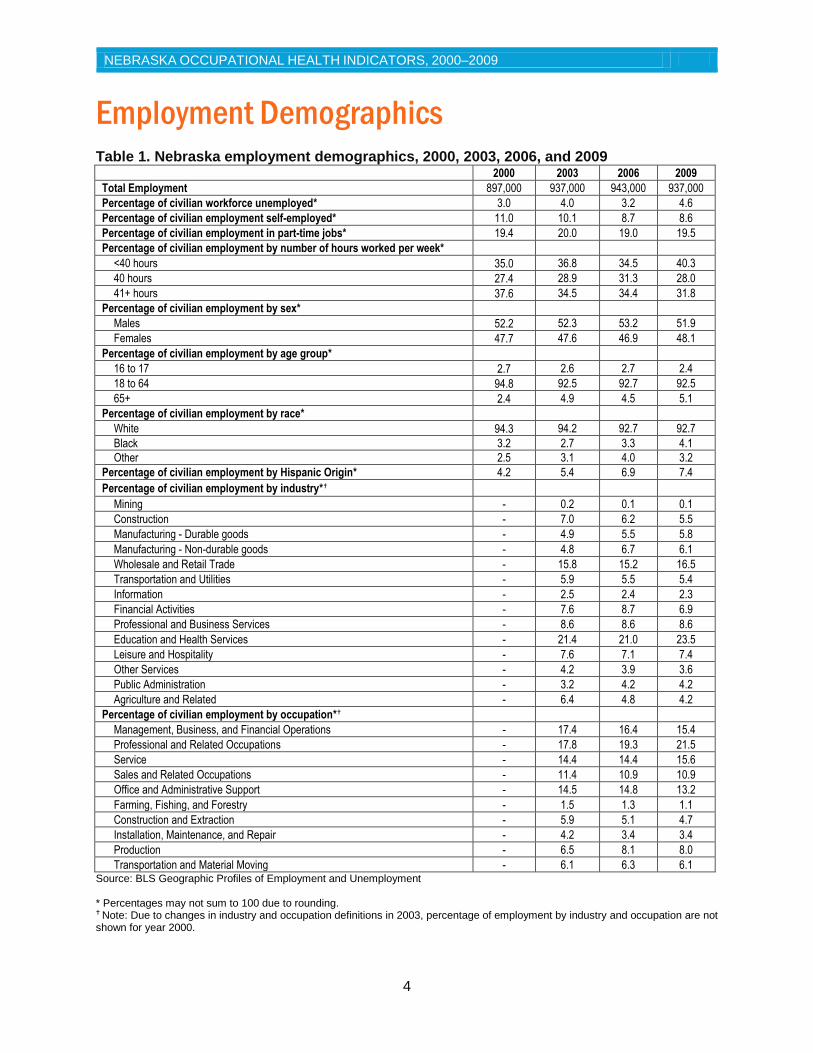
Employment Demographics Table 1. Nebraska employment demographics, 2000, 2003, 2006, and 2009
2000 2003 2006 2009
Total Employment 897,000 937,000 943,000 937,000
Percentage of civilian workforce unemployed* 3.0 4.0 3.2 4.6
Percentage of civilian employment self-employed* 11.0 10.1 8.7 8.6
Percentage of civilian employment in part-time jobs* 19.4 20.0 19.0 19.5
Percentage of civilian employment by number of hours worked per week*
<40 hours 35.0 36.8 34.5 40.3
40 hours 27.4 28.9 31.3 28.0
41+ hours 37.6 34.5 34.4 31.8
Percentage of civilian employment by sex*
Males 52.2 52.3 53.2 51.9
Females 47.7 47.6 46.9 48.1
Percentage of civilian employment by age group*
16 to 17 2.7 2.6 2.7 2.4
18 to 64 94.8 92.5 92.7 92.5
65+ 2.4 4.9 4.5 5.1
Percentage of civilian employment by race*
White 94.3 94.2 92.7 92.7
Black 3.2 2.7 3.3 4.1
Other 2.5 3.1 4.0 3.2
Percentage of civilian employment by Hispanic Origin* 4.2 5.4 6.9 7.4
Percentage of civilian employment by industry*
Mining - 0.2 0.1 0.1
Construction - 7.0 6.2 5.5
Manufacturing - Durable goods - 4.9 5.5 5.8
Manufacturing - Non-durable goods - 4.8 6.7 6.1
Wholesale and Retail Trade - 15.8 15.2 16.5
Transportation and Utilities - 5.9 5.5 5.4
Information - 2.5 2.4 2.3
Financial Activities - 7.6 8.7 6.9
Professional and Business Services - 8.6 8.6 8.6
Education and Health Services - 21.4 21.0 23.5
Leisure and Hospitality - 7.6 7.1 7.4
Other Services - 4.2 3.9 3.6
Public Administration - 3.2 4.2 4.2
Agriculture and Related - 6.4 4.8 4.2
Percentage of civilian employment by occupation*
Management, Business, and Financial Operations - 17.4 16.4 15.4
Professional and Related Occupations - 17.8 19.3 21.5
Service - 14.4 14.4 15.6
Sales and Related Occupations - 11.4 10.9 10.9
Office and Administrative Support - 14.5 14.8 13.2
Farming, Fishing, and Forestry - 1.5 1.3 1.1
Construction and Extraction - 5.9 5.1 4.7
Installation, Maintenance, and Repair - 4.2 3.4 3.4
Production - 6.5 8.1 8.0
Transportation and Material Moving - 6.1 6.3 6.1 Source: BLS Geographic Profiles of Employment and Unemployment * Percentages may not sum to 100 due to rounding.
Note: Due to changes in industry and occupation definitions in 2003, percentage of employment by industry and occupation are not shown for year 2000.
NEBRASKA OCCUPATIONAL HEALTH INDICATORS, 2000–2009
5
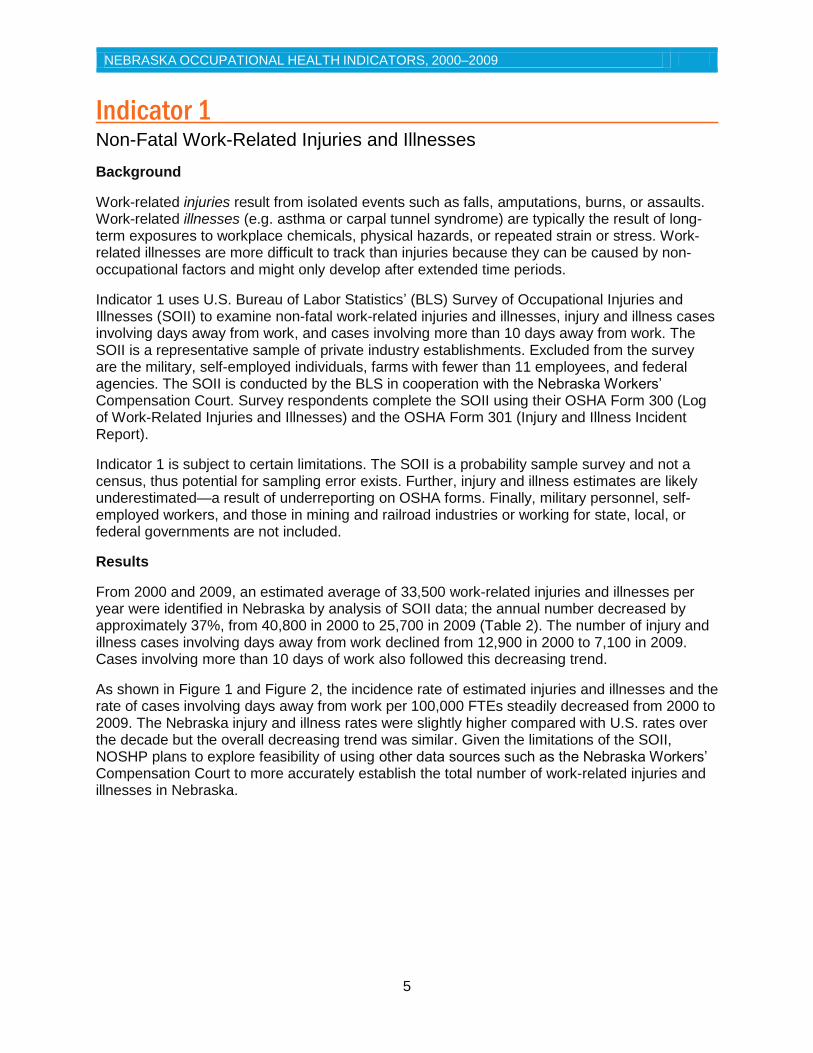
Indicator 1 Non-Fatal Work-Related Injuries and Illnesses Background
Work-related injuries result from isolated events such as falls, amputations, burns, or assaults. Work-related illnesses (e.g. asthma or carpal tunnel syndrome) are typically the result of long-term exposures to workplace chemicals, physical hazards, or repeated strain or stress. Work-related illnesses are more difficult to track than injuries because they can be caused by non-occupational factors and might only develop after extended time periods.
Indicator 1 uses U.S. Bureau of Labor Statistics’ (BLS) Survey of Occupational Injuries and Illnesses (SOII) to examine non-fatal work-related injuries and illnesses, injury and illness cases involving days away from work, and cases involving more than 10 days away from work. The SOII is a representative sample of private industry establishments. Excluded from the survey are the military, self-employed individuals, farms with fewer than 11 employees, and federal agencies. The SOII is conducted by the BLS in cooperation with the Nebraska Workers’ Compensation Court. Survey respondents complete the SOII using their OSHA Form 300 (Log of Work-Related Injuries and Illnesses) and the OSHA Form 301 (Injury and Illness Incident Report).
Indicator 1 is subject to certain limitations. The SOII is a probability sample survey and not a census, thus potential for sampling error exists. Further, injury and illness estimates are likely underestimated—a result of underreporting on OSHA forms. Finally, military personnel, self-employed workers, and those in mining and railroad industries or working for state, local, or federal governments are not included.
Results
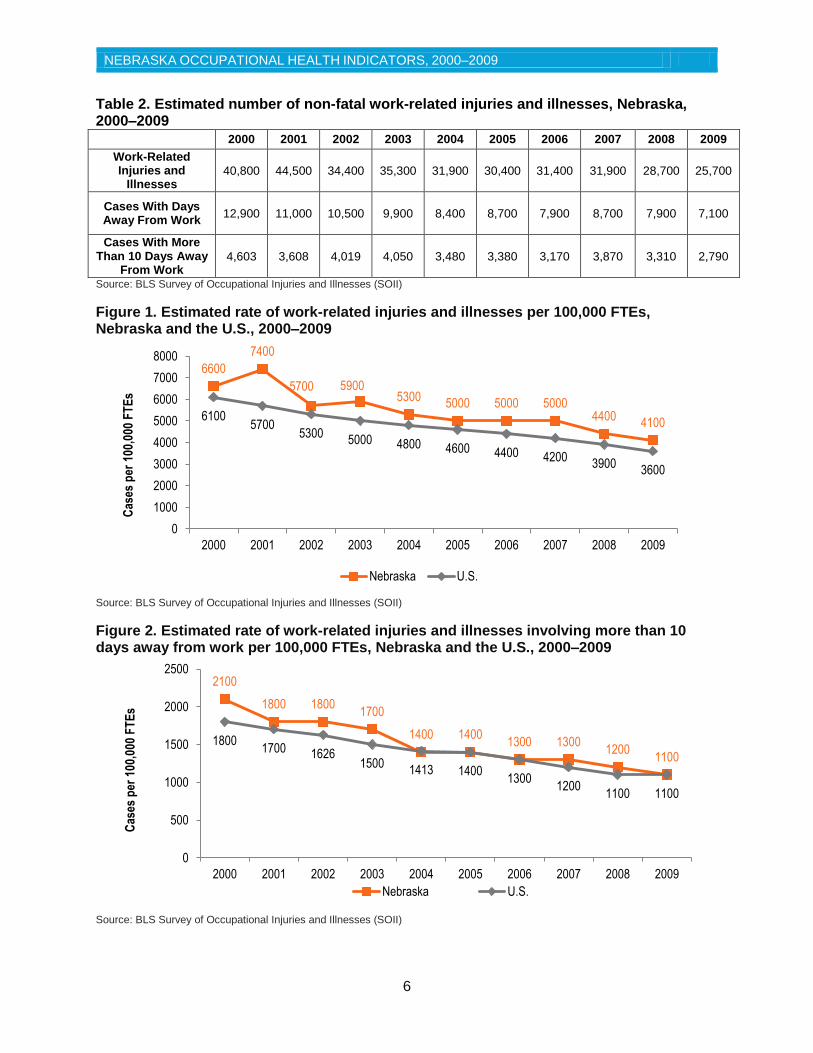
From 2000 and 2009, an estimated average of 33,500 work-related injuries and illnesses per year were identified in Nebraska by analysis of SOII data; the annual number decreased by approximately 37%, from 40,800 in 2000 to 25,700 in 2009 (Table 2). The number of injury and illness cases involving days away from work declined from 12,900 in 2000 to 7,100 in 2009. Cases involving more than 10 days of work also followed this decreasing trend.
As shown in Figure 1 and Figure 2, the incidence rate of estimated injuries and illnesses and the rate of cases involving days away from work per 100,000 FTEs steadily decreased from 2000 to 2009. The Nebraska injury and illness rates were slightly higher compared with U.S. rates over the decade but the overall decreasing trend was similar. Given the limitations of the SOII, NOSHP plans to explore feasibility of using other data sources such as the Nebraska Workers’ Compensation Court to more accurately establish the total number of work-related injuries and illnesses in Nebraska.
NEBRASKA OCCUPATIONAL HEALTH INDICATORS, 2000–2009
6
Table 2. Estimated number of non-fatal work-related injuries and illnesses, Nebraska, 2000–2009
2000 2001 2002 2003 2004 2005 2006 2007 2008 2009
Work-Related Injuries and
Illnesses 40,800 44,500 34,400 35,300 31,900 30,400 31,400 31,900 28,700 25,700
Cases With Days Away From Work
12,900 11,000 10,500 9,900 8,400 8,700 7,900 8,700 7,900 7,100
Cases With More Than 10 Days Away
From Work 4,603 3,608 4,019 4,050 3,480 3,380 3,170 3,870 3,310 2,790
Source: BLS Survey of Occupational Injuries and Illnesses (SOII)
Figure 1. Estimated rate of work-related injuries and illnesses per 100,000 FTEs, Nebraska and the U.S., 2000–2009
Source: BLS Survey of Occupational Injuries and Illnesses (SOII)
Figure 2. Estimated rate of work-related injuries and illnesses involving more than 10 days away from work per 100,000 FTEs, Nebraska and the U.S., 2000–2009
Source: BLS Survey of Occupational Injuries and Illnesses (SOII)
6600
7400
5700 5900 5300
5000 5000 5000 4400
4100 6100
5700 5300
5000 4800 4600 4400 4200 3900
3600
0
1000
2000
3000
4000
5000
6000
7000
8000
2000 2001 2002 2003 2004 2005 2006 2007 2008 2009
Cas
es p
er 1
00,0
00 F
TE
s
Nebraska U.S.
2100
1800 1800 1700
1400 1400 1300 1300
1200 1100
1800 1700 1626
1500 1413 1400
1300 1200
1100 1100
0
500
1000
1500
2000
2500
2000 2001 2002 2003 2004 2005 2006 2007 2008 2009
Cas
es p
er 1
00,0
00 F
TE
s
Nebraska U.S.
NEBRASKA OCCUPATIONAL HEALTH INDICATORS, 2000–2009
7
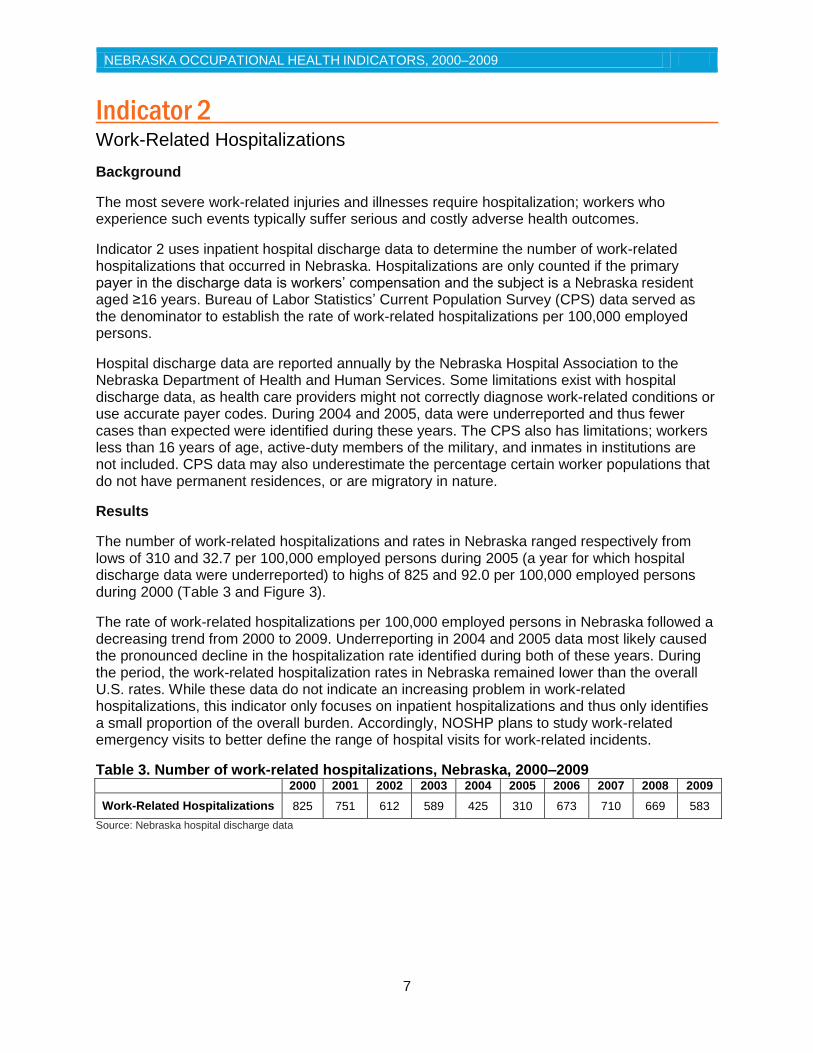
Indicator 2 Work-Related Hospitalizations Background
The most severe work-related injuries and illnesses require hospitalization; workers who experience such events typically suffer serious and costly adverse health outcomes.
Indicator 2 uses inpatient hospital discharge data to determine the number of work-related hospitalizations that occurred in Nebraska. Hospitalizations are only counted if the primary payer in the discharge data is workers’ compensation and the subject is a Nebraska resident aged ≥16 years. Bureau of Labor Statistics’ Current Population Survey (CPS) data served as the denominator to establish the rate of work-related hospitalizations per 100,000 employed persons.
Hospital discharge data are reported annually by the Nebraska Hospital Association to the Nebraska Department of Health and Human Services. Some limitations exist with hospital discharge data, as health care providers might not correctly diagnose work-related conditions or use accurate payer codes. During 2004 and 2005, data were underreported and thus fewer cases than expected were identified during these years. The CPS also has limitations; workers less than 16 years of age, active-duty members of the military, and inmates in institutions are not included. CPS data may also underestimate the percentage certain worker populations that do not have permanent residences, or are migratory in nature.
Results
The number of work-related hospitalizations and rates in Nebraska ranged respectively from lows of 310 and 32.7 per 100,000 employed persons during 2005 (a year for which hospital discharge data were underreported) to highs of 825 and 92.0 per 100,000 employed persons during 2000 (Table 3 and Figure 3).
The rate of work-related hospitalizations per 100,000 employed persons in Nebraska followed a decreasing trend from 2000 to 2009. Underreporting in 2004 and 2005 data most likely caused the pronounced decline in the hospitalization rate identified during both of these years. During the period, the work-related hospitalization rates in Nebraska remained lower than the overall U.S. rates. While these data do not indicate an increasing problem in work-related hospitalizations, this indicator only focuses on inpatient hospitalizations and thus only identifies a small proportion of the overall burden. Accordingly, NOSHP plans to study work-related emergency visits to better define the range of hospital visits for work-related incidents.
Table 3. Number of work-related hospitalizations, Nebraska, 2000–2009
2000 2001 2002 2003 2004 2005 2006 2007 2008 2009
Work-Related Hospitalizations 825 751 612 589 425 310 673 710 669 583
Source: Nebraska hospital discharge data
NEBRASKA OCCUPATIONAL HEALTH INDICATORS, 2000–2009
8
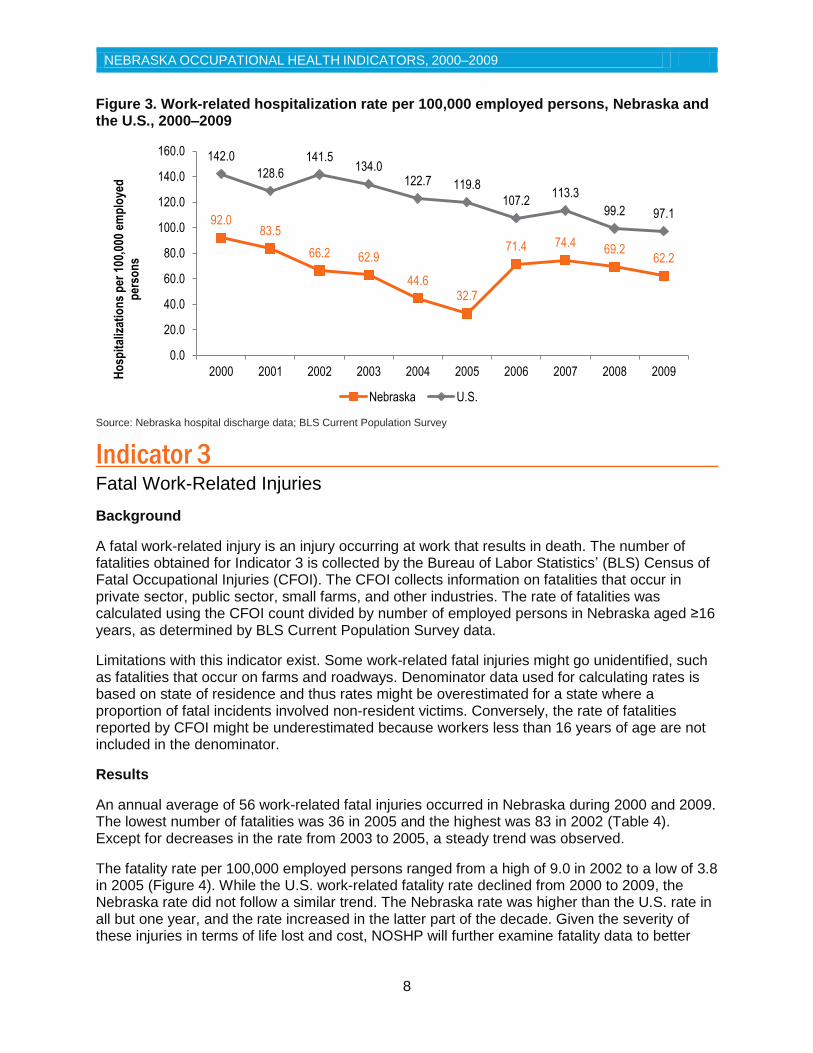
Figure 3. Work-related hospitalization rate per 100,000 employed persons, Nebraska and the U.S., 2000–2009
Source: Nebraska hospital discharge data; BLS Current Population Survey
Indicator 3 Fatal Work-Related Injuries
Background
A fatal work-related injury is an injury occurring at work that results in death. The number of fatalities obtained for Indicator 3 is collected by the Bureau of Labor Statistics’ (BLS) Census of Fatal Occupational Injuries (CFOI). The CFOI collects information on fatalities that occur in private sector, public sector, small farms, and other industries. The rate of fatalities was calculated using the CFOI count divided by number of employed persons in Nebraska aged ≥16 years, as determined by BLS Current Population Survey data.
Limitations with this indicator exist. Some work-related fatal injuries might go unidentified, such as fatalities that occur on farms and roadways. Denominator data used for calculating rates is based on state of residence and thus rates might be overestimated for a state where a proportion of fatal incidents involved non-resident victims. Conversely, the rate of fatalities reported by CFOI might be underestimated because workers less than 16 years of age are not included in the denominator.
Results
An annual average of 56 work-related fatal injuries occurred in Nebraska during 2000 and 2009. The lowest number of fatalities was 36 in 2005 and the highest was 83 in 2002 (Table 4). Except for decreases in the rate from 2003 to 2005, a steady trend was observed.
The fatality rate per 100,000 employed persons ranged from a high of 9.0 in 2002 to a low of 3.8 in 2005 (Figure 4). While the U.S. work-related fatality rate declined from 2000 to 2009, the Nebraska rate did not follow a similar trend. The Nebraska rate was higher than the U.S. rate in all but one year, and the rate increased in the latter part of the decade. Given the severity of these injuries in terms of life lost and cost, NOSHP will further examine fatality data to better
92.0 83.5
66.2 62.9
44.6 32.7
71.4 74.4 69.2
62.2
142.0
128.6
141.5 134.0
122.7 119.8
107.2 113.3
99.2 97.1
0.0
20.0
40.0
60.0
80.0
100.0
120.0
140.0
160.0
2000 2001 2002 2003 2004 2005 2006 2007 2008 2009Ho
spit
aliz
atio
ns
per
100
,000
em
plo
yed
p
erso
ns
Nebraska U.S.

NEBRASKA OCCUPATIONAL HEALTH INDICATORS, 2000–2009
9
understand the causes of fatal work injuries. The program aims to conduct education and outreach activities aimed at industries with high fatality rates.
Table 4. Number of fatal work-related injuries, Nebraska, 2000–2009
2000 2001 2002 2003 2004 2005 2006 2007 2008 2009
Number of fatalities 59 57 83 51 46 36 57 63 53 57
Source: BLS Census of Fatal Occupational Injuries (CFOI)
Figure 4. Work-related fatality rate per 100,000 employed persons, Nebraska and the U.S., 2000–2009
Source: BLS Census of Fatal Occupational Injuries; BLS Current Population Survey
Indicator 4
Work-Related Amputations with Days Away from Work
Background
An amputation occurs when an individual experiences a full or partial loss of a protruding body part, such as an arm, hand, finger, leg, foot, or toe. Amputations can greatly reduce job skills and earning potential, which can significantly affect a person’s quality of life.
Indicator 4 uses the Bureau of Labor Statistics’ Survey of Occupational Injuries and Illnesses (SOII) to examine work-related amputations. The SOII is a survey of employers to determine injuries and illnesses reported on employer OSHA logs. This indicator is based on the survey estimates, rather than a count or census of all amputations, thus sampling error and underreporting are known limitations.
Results
An annual average of 61 amputations occurred per year from 2000 to 2009 in Nebraska. Amputations ranged from 30 in 2009 to 104 in 2000 (Table 5). The rate of amputations per 100,000 full-time equivalent (FTE) workers ranged from 5.0 in 2003 to 17.0 in 2000 (Figure 5).
6.6 6.3
9.0
5.4 4.8
3.8
6.0 6.6
5.5 6.1
4.4 4.4 4.1 4.0 4.1 4.0 4.0 3.9
3.6 3.3
0.0
1.0
2.0
3.0
4.0
5.0
6.0
7.0
8.0
9.0
10.0
2000 2001 2002 2003 2004 2005 2006 2007 2008 2009
Dea
ths
per
100
,000
em
plo
yed
per
son
s
Nebraska U.S.
NEBRASKA OCCUPATIONAL HEALTH INDICATORS, 2000–2009
10
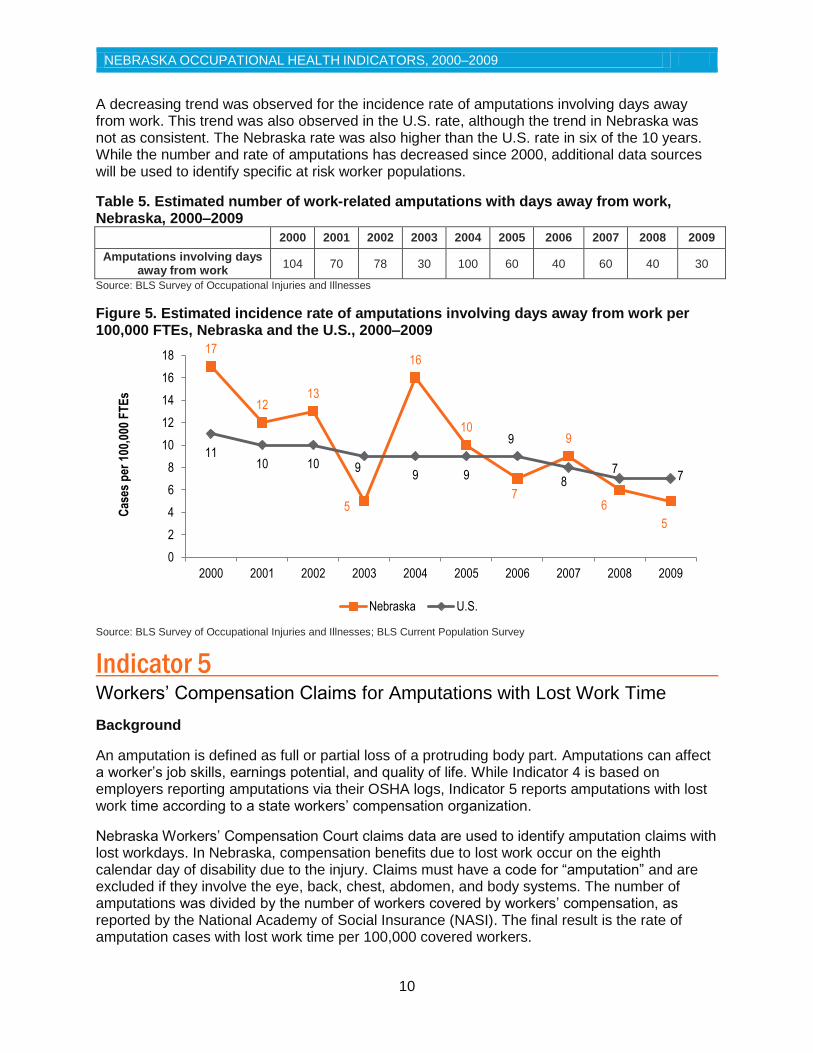
A decreasing trend was observed for the incidence rate of amputations involving days away from work. This trend was also observed in the U.S. rate, although the trend in Nebraska was not as consistent. The Nebraska rate was also higher than the U.S. rate in six of the 10 years. While the number and rate of amputations has decreased since 2000, additional data sources will be used to identify specific at risk worker populations.
Table 5. Estimated number of work-related amputations with days away from work, Nebraska, 2000–2009
2000 2001 2002 2003 2004 2005 2006 2007 2008 2009
Amputations involving days away from work
104 70 78 30 100 60 40 60 40 30
Source: BLS Survey of Occupational Injuries and Illnesses
Figure 5. Estimated incidence rate of amputations involving days away from work per 100,000 FTEs, Nebraska and the U.S., 2000–2009
Source: BLS Survey of Occupational Injuries and Illnesses; BLS Current Population Survey
Indicator 5 Workers’ Compensation Claims for Amputations with Lost Work Time Background
An amputation is defined as full or partial loss of a protruding body part. Amputations can affect a worker’s job skills, earnings potential, and quality of life. While Indicator 4 is based on employers reporting amputations via their OSHA logs, Indicator 5 reports amputations with lost work time according to a state workers’ compensation organization.
Nebraska Workers’ Compensation Court claims data are used to identify amputation claims with lost workdays. In Nebraska, compensation benefits due to lost work occur on the eighth calendar day of disability due to the injury. Claims must have a code for “amputation” and are excluded if they involve the eye, back, chest, abdomen, and body systems. The number of amputations was divided by the number of workers covered by workers’ compensation, as reported by the National Academy of Social Insurance (NASI). The final result is the rate of amputation cases with lost work time per 100,000 covered workers.
17
12 13
5
16
10
7
9
6
5
11 10 10 9
9 9
9
8 7
7
0
2
4
6
8
10
12
14
16
18
2000 2001 2002 2003 2004 2005 2006 2007 2008 2009
Cas
es p
er 1
00,0
00 F
TE
s
Nebraska U.S.
NEBRASKA OCCUPATIONAL HEALTH INDICATORS, 2000–2009
11
Amputation claims might be underestimated, as not all individuals with work-related injuries or illnesses file claims with workers’ compensation. Self-employed individuals such as farmers and independent contractors, federal employees, and railroad workers are not typically covered by workers’ compensation systems.
Results
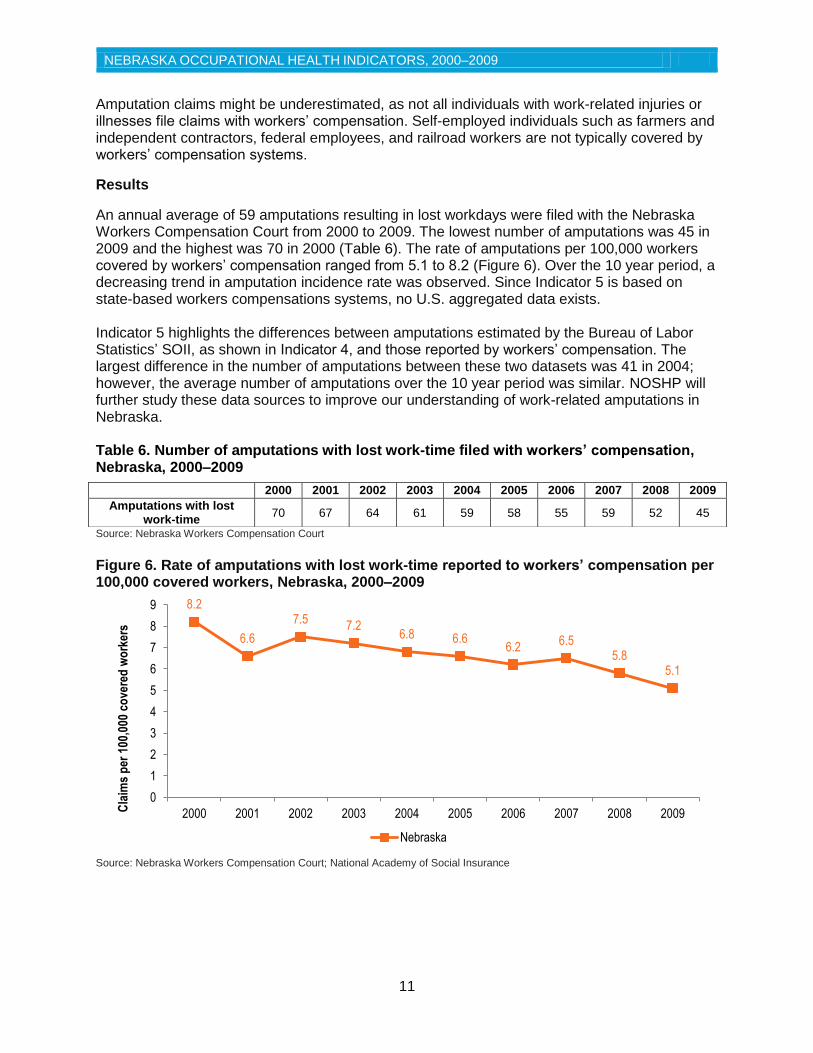
An annual average of 59 amputations resulting in lost workdays were filed with the Nebraska Workers Compensation Court from 2000 to 2009. The lowest number of amputations was 45 in 2009 and the highest was 70 in 2000 (Table 6). The rate of amputations per 100,000 workers covered by workers’ compensation ranged from 5.1 to 8.2 (Figure 6). Over the 10 year period, a decreasing trend in amputation incidence rate was observed. Since Indicator 5 is based on state-based workers compensations systems, no U.S. aggregated data exists. Indicator 5 highlights the differences between amputations estimated by the Bureau of Labor Statistics’ SOII, as shown in Indicator 4, and those reported by workers’ compensation. The largest difference in the number of amputations between these two datasets was 41 in 2004; however, the average number of amputations over the 10 year period was similar. NOSHP will further study these data sources to improve our understanding of work-related amputations in Nebraska. Table 6. Number of amputations with lost work-time filed with workers’ compensation, Nebraska, 2000–2009
Source: Nebraska Workers Compensation Court
Figure 6. Rate of amputations with lost work-time reported to workers’ compensation per 100,000 covered workers, Nebraska, 2000–2009
Source: Nebraska Workers Compensation Court; National Academy of Social Insurance
8.2
6.6
7.5 7.2
6.8 6.6 6.2
6.5 5.8
5.1
0
1
2
3
4
5
6
7
8
9
2000 2001 2002 2003 2004 2005 2006 2007 2008 2009Cla
ims
per
100
,000
co
vere
d w
ork
ers
Nebraska
2000 2001 2002 2003 2004 2005 2006 2007 2008 2009
Amputations with lost work-time
70 67 64 61 59 58 55 59 52 45

NEBRASKA OCCUPATIONAL HEALTH INDICATORS, 2000–2009
12
Indicator 6 Hospitalizations for Work-Related Burns
Background
Work-related burns include injuries to tissues caused by contact with heat, chemicals, electricity, friction, or radiation. Burns are among the most expensive work-related injuries to treat and can result in significant disability. Thermal and chemical burns are frequent types of work-related burn injury.
Indicator 6 examines hospitalizations for work-related burns using hospital discharge data. A work-related burn is defined as having an ICD-9-CM diagnosis code of 940 through 949 in the principle diagnosis field. The patient must have been admitted for an inpatient hospitalization, be a resident of Nebraska 16 years of age or older, and have workers’ compensation as the primary payer. The rate of hospitalizations was determined by dividing the number of cases by the number of employed persons aged 16 years or older from the Bureau of Labor Statistics’ (BLS) Current Population Survey (CPS) data.
Both hospital discharge data and the CPS have several limitations. The CPS excludes workers less than 16 years of age, active-duty members of the military, and inmates in institutions. These data may underestimate the percentage of certain racial or ethnic worker populations that do not have permanent residences or are migratory in nature. Underreporting of hospital discharge data occurred in 2004 and 2005 and the data during this time are fewer than expected.
Results
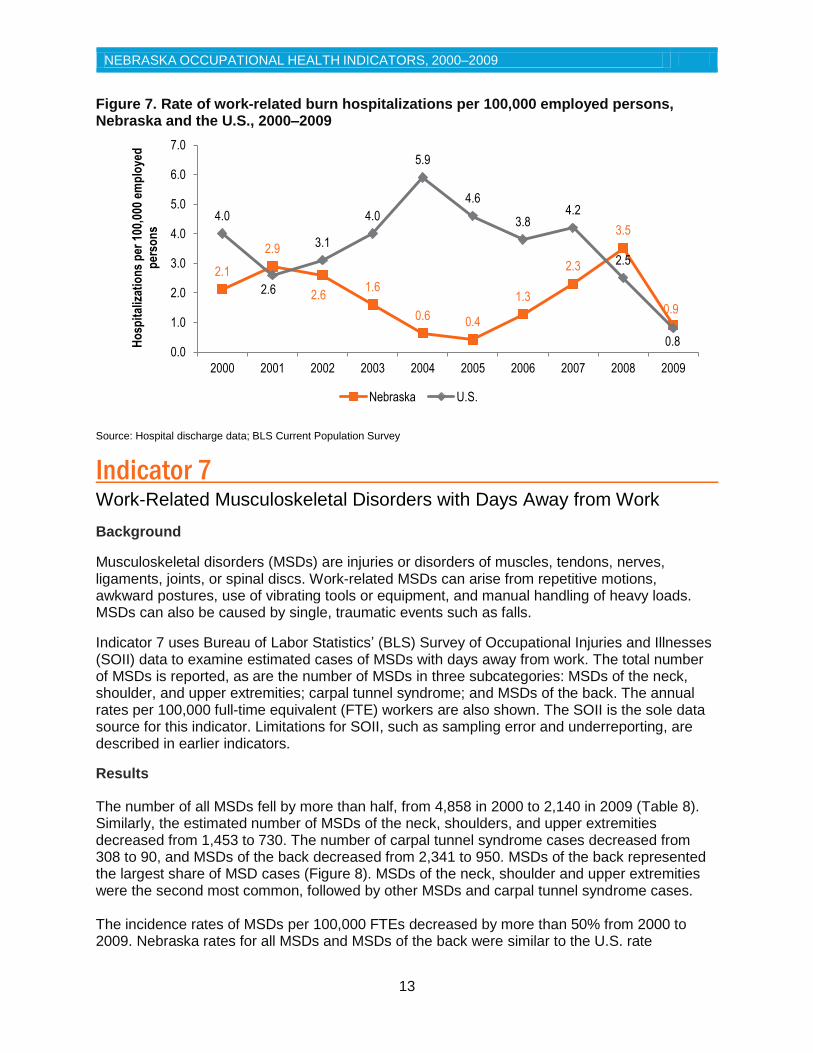
The number of work-related burn hospitalizations ranged from four cases in 2005 to 34 cases in 2008 (Table 7). The rate of work-related burn hospitalizations per 100,000 employed persons ranged from 0.4 in 2005 to 3.5 in 2008 (Figure 7).
A consistent trend was not observed in the rate of work-related burn hospitalizations from 2000 and 2009. The U.S. rate of burn hospitalizations decreased from 2004 to 2008, while Nebraska’s rate increased. Underreporting of the data in 2004 and 2005 likely contributed to this increase. Nebraska’s rate was lower than the U.S. average for all but three years. NOSHP plans to study emergency department data for a more complete understanding of work-related burns.
Table 7. Number work-related burn hospitalizations, Nebraska, 2000–2009
Source: Nebraska hospital discharge data
2000 2001 2002 2003 2004 2005 2006 2007 2008 2009
Work-related burn hospitalizations
19 26 24 15 6 4 12 22 34 8
NEBRASKA OCCUPATIONAL HEALTH INDICATORS, 2000–2009
13
Figure 7. Rate of work-related burn hospitalizations per 100,000 employed persons, Nebraska and the U.S., 2000–2009
Source: Hospital discharge data; BLS Current Population Survey
Indicator 7 Work-Related Musculoskeletal Disorders with Days Away from Work Background
Musculoskeletal disorders (MSDs) are injuries or disorders of muscles, tendons, nerves, ligaments, joints, or spinal discs. Work-related MSDs can arise from repetitive motions, awkward postures, use of vibrating tools or equipment, and manual handling of heavy loads. MSDs can also be caused by single, traumatic events such as falls.
Indicator 7 uses Bureau of Labor Statistics’ (BLS) Survey of Occupational Injuries and Illnesses (SOII) data to examine estimated cases of MSDs with days away from work. The total number of MSDs is reported, as are the number of MSDs in three subcategories: MSDs of the neck, shoulder, and upper extremities; carpal tunnel syndrome; and MSDs of the back. The annual rates per 100,000 full-time equivalent (FTE) workers are also shown. The SOII is the sole data source for this indicator. Limitations for SOII, such as sampling error and underreporting, are described in earlier indicators.
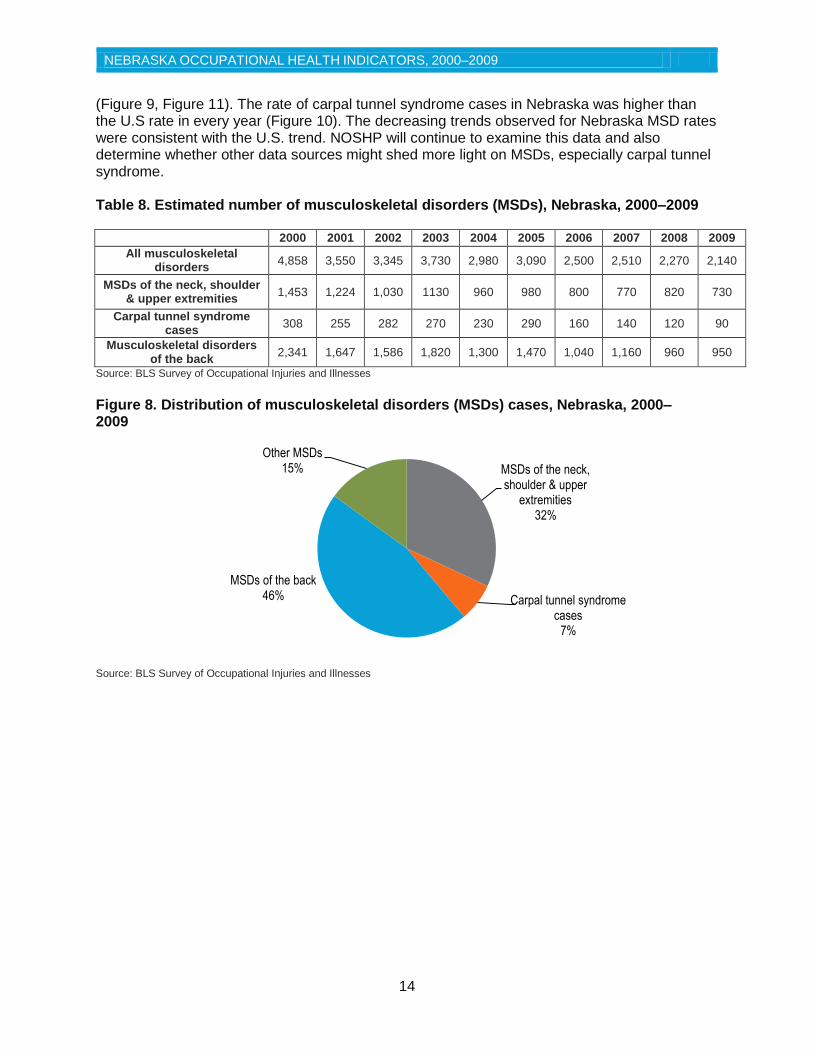
Results
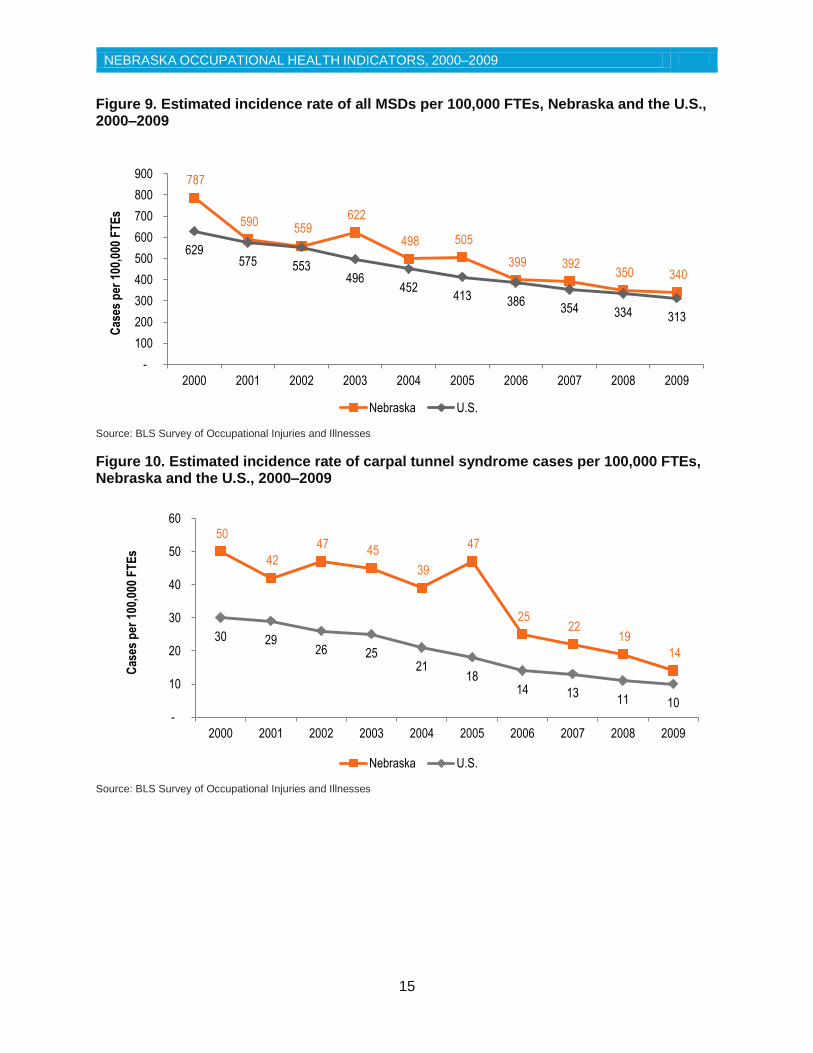
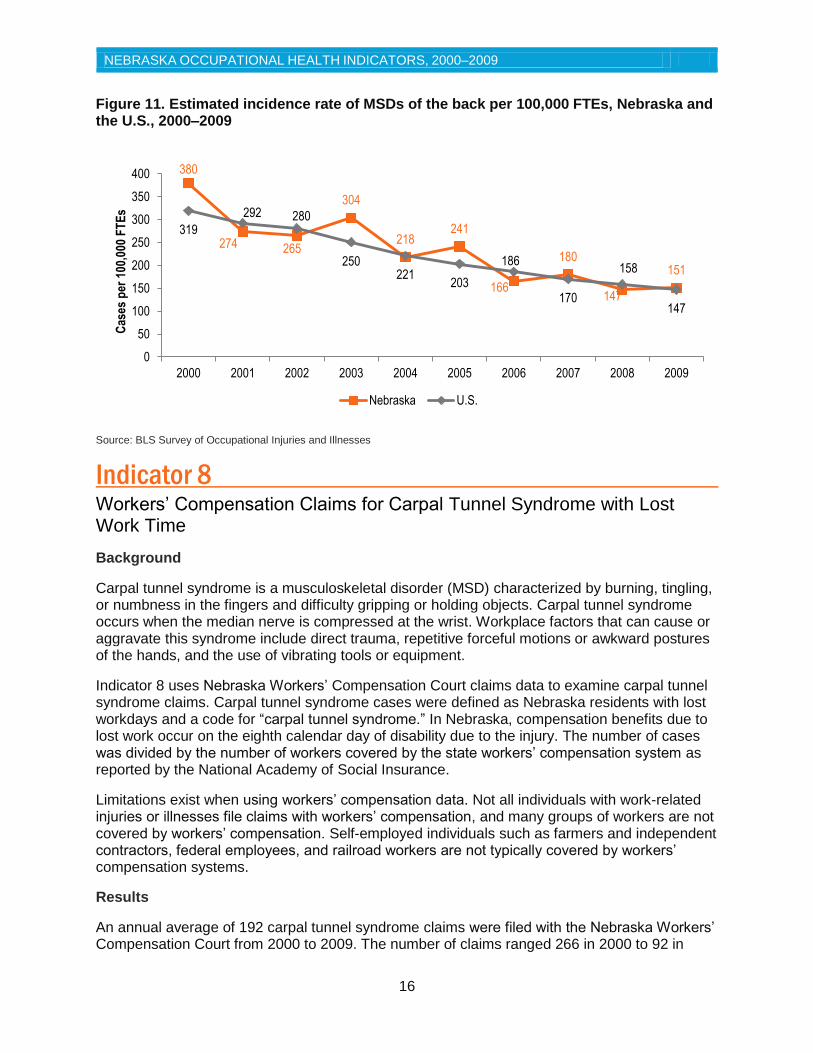
The number of all MSDs fell by more than half, from 4,858 in 2000 to 2,140 in 2009 (Table 8). Similarly, the estimated number of MSDs of the neck, shoulders, and upper extremities decreased from 1,453 to 730. The number of carpal tunnel syndrome cases decreased from 308 to 90, and MSDs of the back decreased from 2,341 to 950. MSDs of the back represented the largest share of MSD cases (Figure 8). MSDs of the neck, shoulder and upper extremities were the second most common, followed by other MSDs and carpal tunnel syndrome cases. The incidence rates of MSDs per 100,000 FTEs decreased by more than 50% from 2000 to 2009. Nebraska rates for all MSDs and MSDs of the back were similar to the U.S. rate
2.1
2.9
2.6 1.6
0.6 0.4
1.3
2.3
3.5
0.9
4.0
2.6
3.1
4.0
5.9
4.6
3.8 4.2
2.5
0.8 0.0
1.0
2.0
3.0
4.0
5.0
6.0
7.0
2000 2001 2002 2003 2004 2005 2006 2007 2008 2009
Ho
spit
aliz
atio
ns
per
100
,000
em
plo
yed
p
erso
ns
Nebraska U.S.
NEBRASKA OCCUPATIONAL HEALTH INDICATORS, 2000–2009
14
(Figure 9, Figure 11). The rate of carpal tunnel syndrome cases in Nebraska was higher than the U.S rate in every year (Figure 10). The decreasing trends observed for Nebraska MSD rates were consistent with the U.S. trend. NOSHP will continue to examine this data and also determine whether other data sources might shed more light on MSDs, especially carpal tunnel syndrome. Table 8. Estimated number of musculoskeletal disorders (MSDs), Nebraska, 2000–2009
2000 2001 2002 2003 2004 2005 2006 2007 2008 2009
All musculoskeletal disorders
4,858 3,550 3,345 3,730 2,980 3,090 2,500 2,510 2,270 2,140
MSDs of the neck, shoulder & upper extremities
1,453 1,224 1,030 1130 960 980 800 770 820 730
Carpal tunnel syndrome cases
308 255 282 270 230 290 160 140 120 90
Musculoskeletal disorders of the back
2,341 1,647 1,586 1,820 1,300 1,470 1,040 1,160 960 950
Source: BLS Survey of Occupational Injuries and Illnesses
Figure 8. Distribution of musculoskeletal disorders (MSDs) cases, Nebraska, 2000–2009
Source: BLS Survey of Occupational Injuries and Illnesses
MSDs of the neck, shoulder & upper
extremities 32%
Carpal tunnel syndrome cases
7%
MSDs of the back 46%
Other MSDs 15%
NEBRASKA OCCUPATIONAL HEALTH INDICATORS, 2000–2009
15
Figure 9. Estimated incidence rate of all MSDs per 100,000 FTEs, Nebraska and the U.S., 2000–2009
Source: BLS Survey of Occupational Injuries and Illnesses
Figure 10. Estimated incidence rate of carpal tunnel syndrome cases per 100,000 FTEs, Nebraska and the U.S., 2000–2009
Source: BLS Survey of Occupational Injuries and Illnesses
787
590 559
622
498 505
399 392 350 340
629 575 553
496 452
413 386 354 334 313
-
100
200
300
400
500
600
700
800
900
2000 2001 2002 2003 2004 2005 2006 2007 2008 2009
Cas
es p
er 1
00,0
00 F
TE
s
Nebraska U.S.
50
42
47 45
39
47
25 22
19
14
30 29 26 25
21 18
14 13 11 10
-
10
20
30
40
50
60
2000 2001 2002 2003 2004 2005 2006 2007 2008 2009
Cas
es p
er 1
00,0
00 F
TE
s
Nebraska U.S.
NEBRASKA OCCUPATIONAL HEALTH INDICATORS, 2000–2009
16
Figure 11. Estimated incidence rate of MSDs of the back per 100,000 FTEs, Nebraska and the U.S., 2000–2009
Source: BLS Survey of Occupational Injuries and Illnesses
Indicator 8 Workers’ Compensation Claims for Carpal Tunnel Syndrome with Lost Work Time
Background
Carpal tunnel syndrome is a musculoskeletal disorder (MSD) characterized by burning, tingling, or numbness in the fingers and difficulty gripping or holding objects. Carpal tunnel syndrome occurs when the median nerve is compressed at the wrist. Workplace factors that can cause or aggravate this syndrome include direct trauma, repetitive forceful motions or awkward postures of the hands, and the use of vibrating tools or equipment.
Indicator 8 uses Nebraska Workers’ Compensation Court claims data to examine carpal tunnel syndrome claims. Carpal tunnel syndrome cases were defined as Nebraska residents with lost workdays and a code for “carpal tunnel syndrome.” In Nebraska, compensation benefits due to lost work occur on the eighth calendar day of disability due to the injury. The number of cases was divided by the number of workers covered by the state workers’ compensation system as reported by the National Academy of Social Insurance.
Limitations exist when using workers’ compensation data. Not all individuals with work-related injuries or illnesses file claims with workers’ compensation, and many groups of workers are not covered by workers’ compensation. Self-employed individuals such as farmers and independent contractors, federal employees, and railroad workers are not typically covered by workers’ compensation systems.
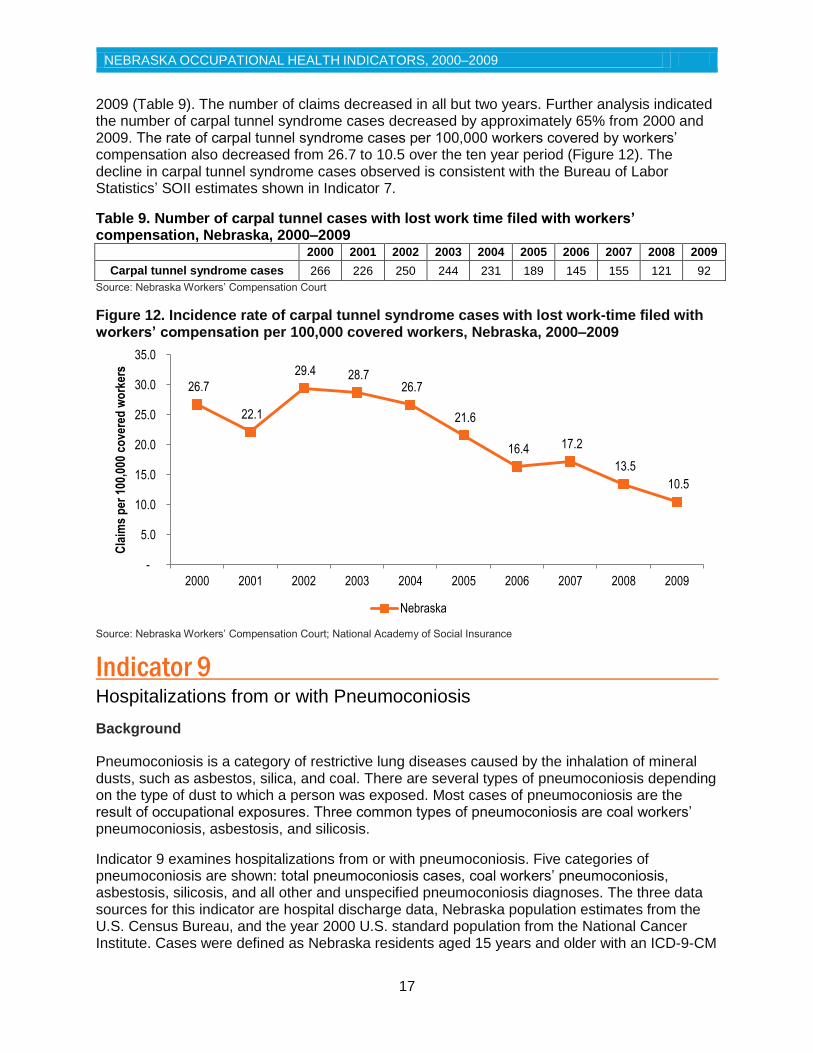
Results
An annual average of 192 carpal tunnel syndrome claims were filed with the Nebraska Workers’ Compensation Court from 2000 to 2009. The number of claims ranged 266 in 2000 to 92 in
380
274 265
304
218 241
166
180
147
151
319
292 280
250 221
203
186
170
158
147
0
50
100
150
200
250
300
350
400
2000 2001 2002 2003 2004 2005 2006 2007 2008 2009
Cas
es p
er 1
00,0
00 F
TE
s
Nebraska U.S.
NEBRASKA OCCUPATIONAL HEALTH INDICATORS, 2000–2009
17
2009 (Table 9). The number of claims decreased in all but two years. Further analysis indicated the number of carpal tunnel syndrome cases decreased by approximately 65% from 2000 and 2009. The rate of carpal tunnel syndrome cases per 100,000 workers covered by workers’ compensation also decreased from 26.7 to 10.5 over the ten year period (Figure 12). The decline in carpal tunnel syndrome cases observed is consistent with the Bureau of Labor Statistics’ SOII estimates shown in Indicator 7.
Table 9. Number of carpal tunnel cases with lost work time filed with workers’ compensation, Nebraska, 2000–2009
2000 2001 2002 2003 2004 2005 2006 2007 2008 2009
Carpal tunnel syndrome cases 266 226 250 244 231 189 145 155 121 92
Source: Nebraska Workers’ Compensation Court
Figure 12. Incidence rate of carpal tunnel syndrome cases with lost work-time filed with workers’ compensation per 100,000 covered workers, Nebraska, 2000–2009
Source: Nebraska Workers’ Compensation Court; National Academy of Social Insurance
Indicator 9 Hospitalizations from or with Pneumoconiosis
Background
Pneumoconiosis is a category of restrictive lung diseases caused by the inhalation of mineral dusts, such as asbestos, silica, and coal. There are several types of pneumoconiosis depending on the type of dust to which a person was exposed. Most cases of pneumoconiosis are the result of occupational exposures. Three common types of pneumoconiosis are coal workers’ pneumoconiosis, asbestosis, and silicosis.
Indicator 9 examines hospitalizations from or with pneumoconiosis. Five categories of pneumoconiosis are shown: total pneumoconiosis cases, coal workers’ pneumoconiosis, asbestosis, silicosis, and all other and unspecified pneumoconiosis diagnoses. The three data sources for this indicator are hospital discharge data, Nebraska population estimates from the U.S. Census Bureau, and the year 2000 U.S. standard population from the National Cancer Institute. Cases were defined as Nebraska residents aged 15 years and older with an ICD-9-CM
26.7
22.1
29.4 28.7 26.7
21.6
16.4 17.2
13.5
10.5
-
5.0
10.0
15.0
20.0
25.0
30.0
35.0
2000 2001 2002 2003 2004 2005 2006 2007 2008 2009
Cla
ims
per
100
,000
co
vere
d w
ork
ers
Nebraska
NEBRASKA OCCUPATIONAL HEALTH INDICATORS, 2000–2009
18
diagnosis code between 500 and 505 in any diagnosis field. The number of hospital discharges for each type of pneumoconiosis, by age category, was divided by the Nebraska population for the given year and multiplied by the U.S. 2000 standard population to yield age-adjusted hospitalization rates.
Hospital discharge data has limitations, such as errors in diagnosis of conditions and data underreporting in 2004 and 2005. Indicator 9 is also limited in that the latency for pneumoconiosis is very long and therefore the state in which a person is diagnosed with pneumoconiosis is not necessarily indicative of the state in which they were exposed.
Results
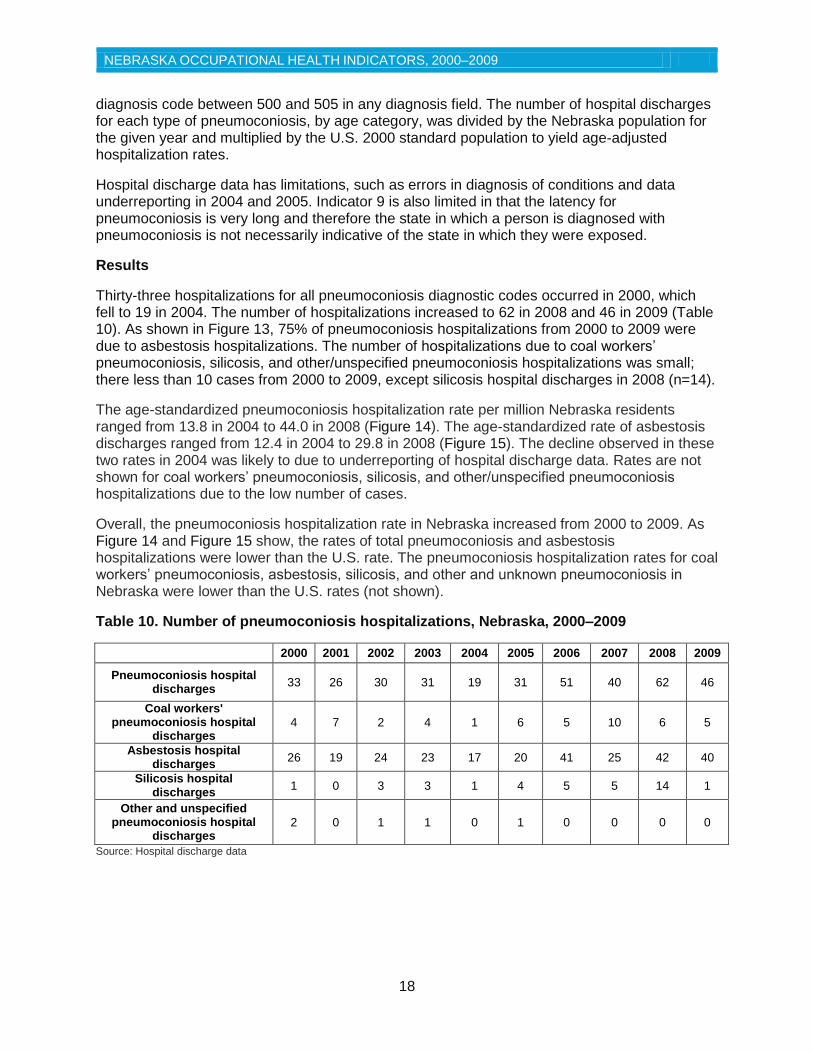
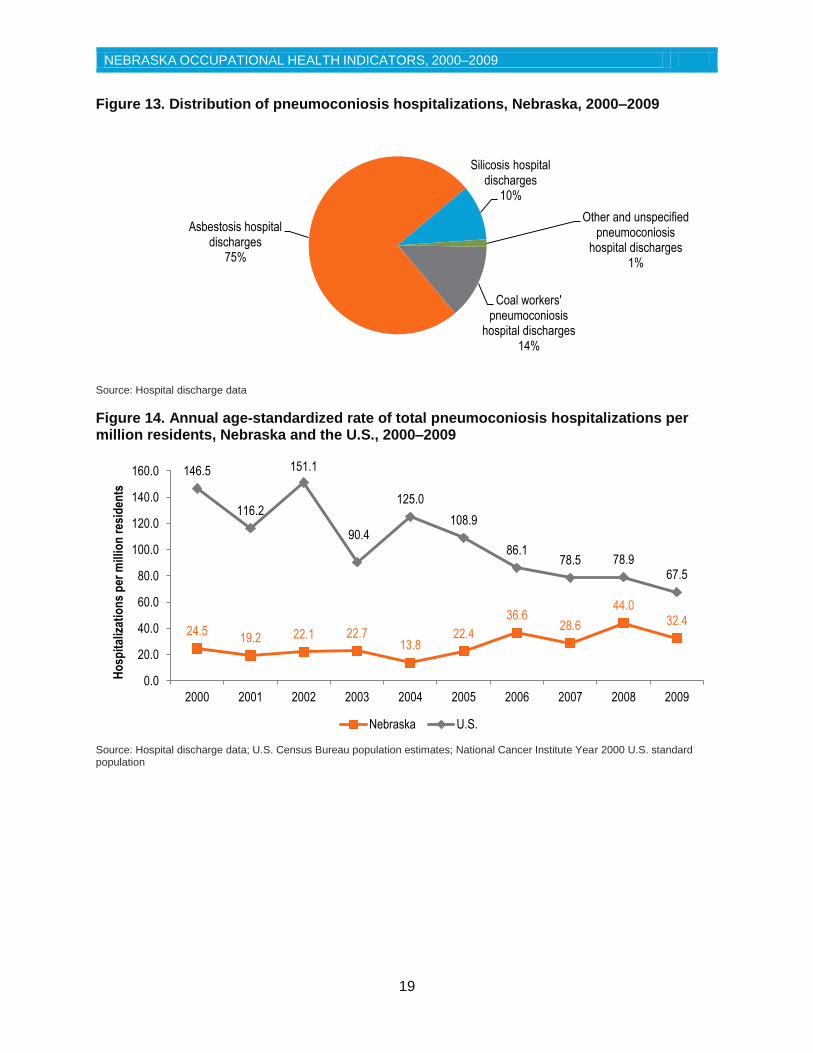
Thirty-three hospitalizations for all pneumoconiosis diagnostic codes occurred in 2000, which fell to 19 in 2004. The number of hospitalizations increased to 62 in 2008 and 46 in 2009 (Table 10). As shown in Figure 13, 75% of pneumoconiosis hospitalizations from 2000 to 2009 were due to asbestosis hospitalizations. The number of hospitalizations due to coal workers’ pneumoconiosis, silicosis, and other/unspecified pneumoconiosis hospitalizations was small; there less than 10 cases from 2000 to 2009, except silicosis hospital discharges in 2008 (n=14).
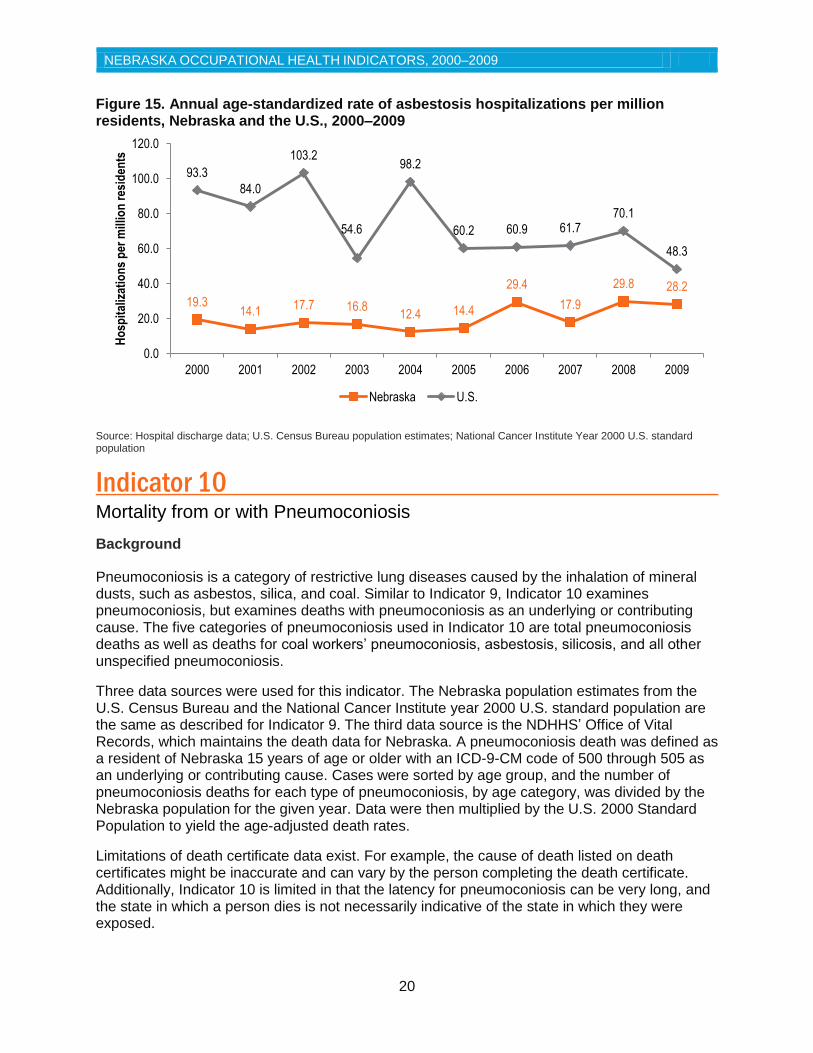
The age-standardized pneumoconiosis hospitalization rate per million Nebraska residents ranged from 13.8 in 2004 to 44.0 in 2008 (Figure 14). The age-standardized rate of asbestosis discharges ranged from 12.4 in 2004 to 29.8 in 2008 (Figure 15). The decline observed in these two rates in 2004 was likely to due to underreporting of hospital discharge data. Rates are not shown for coal workers’ pneumoconiosis, silicosis, and other/unspecified pneumoconiosis hospitalizations due to the low number of cases.
Overall, the pneumoconiosis hospitalization rate in Nebraska increased from 2000 to 2009. As Figure 14 and Figure 15 show, the rates of total pneumoconiosis and asbestosis hospitalizations were lower than the U.S. rate. The pneumoconiosis hospitalization rates for coal workers’ pneumoconiosis, asbestosis, silicosis, and other and unknown pneumoconiosis in Nebraska were lower than the U.S. rates (not shown).
Table 10. Number of pneumoconiosis hospitalizations, Nebraska, 2000–2009
2000 2001 2002 2003 2004 2005 2006 2007 2008 2009
Pneumoconiosis hospital discharges
33 26 30 31 19 31 51 40 62 46
Coal workers' pneumoconiosis hospital
discharges 4 7 2 4 1 6 5 10 6 5
Asbestosis hospital discharges
26 19 24 23 17 20 41 25 42 40
Silicosis hospital discharges
1 0 3 3 1 4 5 5 14 1
Other and unspecified pneumoconiosis hospital
discharges 2 0 1 1 0 1 0 0 0 0
Source: Hospital discharge data
NEBRASKA OCCUPATIONAL HEALTH INDICATORS, 2000–2009
19
Figure 13. Distribution of pneumoconiosis hospitalizations, Nebraska, 2000–2009
Source: Hospital discharge data
Figure 14. Annual age-standardized rate of total pneumoconiosis hospitalizations per million residents, Nebraska and the U.S., 2000–2009
Source: Hospital discharge data; U.S. Census Bureau population estimates; National Cancer Institute Year 2000 U.S. standard population
Coal workers' pneumoconiosis
hospital discharges 14%
Asbestosis hospital discharges
75%
Silicosis hospital discharges
10%
Other and unspecified pneumoconiosis
hospital discharges 1%
24.5 19.2 22.1 22.7
13.8 22.4
36.6 28.6
44.0 32.4
146.5
116.2
151.1
90.4
125.0
108.9
86.1 78.5 78.9
67.5
0.0
20.0
40.0
60.0
80.0
100.0
120.0
140.0
160.0
2000 2001 2002 2003 2004 2005 2006 2007 2008 2009
Ho
spit
aliz
atio
ns
per
mill
ion
res
iden
ts
Nebraska U.S.
NEBRASKA OCCUPATIONAL HEALTH INDICATORS, 2000–2009
20
Figure 15. Annual age-standardized rate of asbestosis hospitalizations per million residents, Nebraska and the U.S., 2000–2009
Source: Hospital discharge data; U.S. Census Bureau population estimates; National Cancer Institute Year 2000 U.S. standard population
Indicator 10 Mortality from or with Pneumoconiosis
Background
Pneumoconiosis is a category of restrictive lung diseases caused by the inhalation of mineral dusts, such as asbestos, silica, and coal. Similar to Indicator 9, Indicator 10 examines pneumoconiosis, but examines deaths with pneumoconiosis as an underlying or contributing cause. The five categories of pneumoconiosis used in Indicator 10 are total pneumoconiosis deaths as well as deaths for coal workers’ pneumoconiosis, asbestosis, silicosis, and all other unspecified pneumoconiosis.
Three data sources were used for this indicator. The Nebraska population estimates from the U.S. Census Bureau and the National Cancer Institute year 2000 U.S. standard population are the same as described for Indicator 9. The third data source is the NDHHS’ Office of Vital Records, which maintains the death data for Nebraska. A pneumoconiosis death was defined as a resident of Nebraska 15 years of age or older with an ICD-9-CM code of 500 through 505 as an underlying or contributing cause. Cases were sorted by age group, and the number of pneumoconiosis deaths for each type of pneumoconiosis, by age category, was divided by the Nebraska population for the given year. Data were then multiplied by the U.S. 2000 Standard Population to yield the age-adjusted death rates.
Limitations of death certificate data exist. For example, the cause of death listed on death certificates might be inaccurate and can vary by the person completing the death certificate. Additionally, Indicator 10 is limited in that the latency for pneumoconiosis can be very long, and the state in which a person dies is not necessarily indicative of the state in which they were exposed.
19.3 14.1
17.7 16.8 12.4 14.4
29.4
17.9
29.8 28.2
93.3
84.0
103.2
54.6
98.2
60.2 60.9 61.7 70.1
48.3
0.0
20.0
40.0
60.0
80.0
100.0
120.0
2000 2001 2002 2003 2004 2005 2006 2007 2008 2009
Ho
spit
aliz
atio
ns
per
mill
ion
res
iden
ts
Nebraska U.S.
NEBRASKA OCCUPATIONAL HEALTH INDICATORS, 2000–2009
21
Results
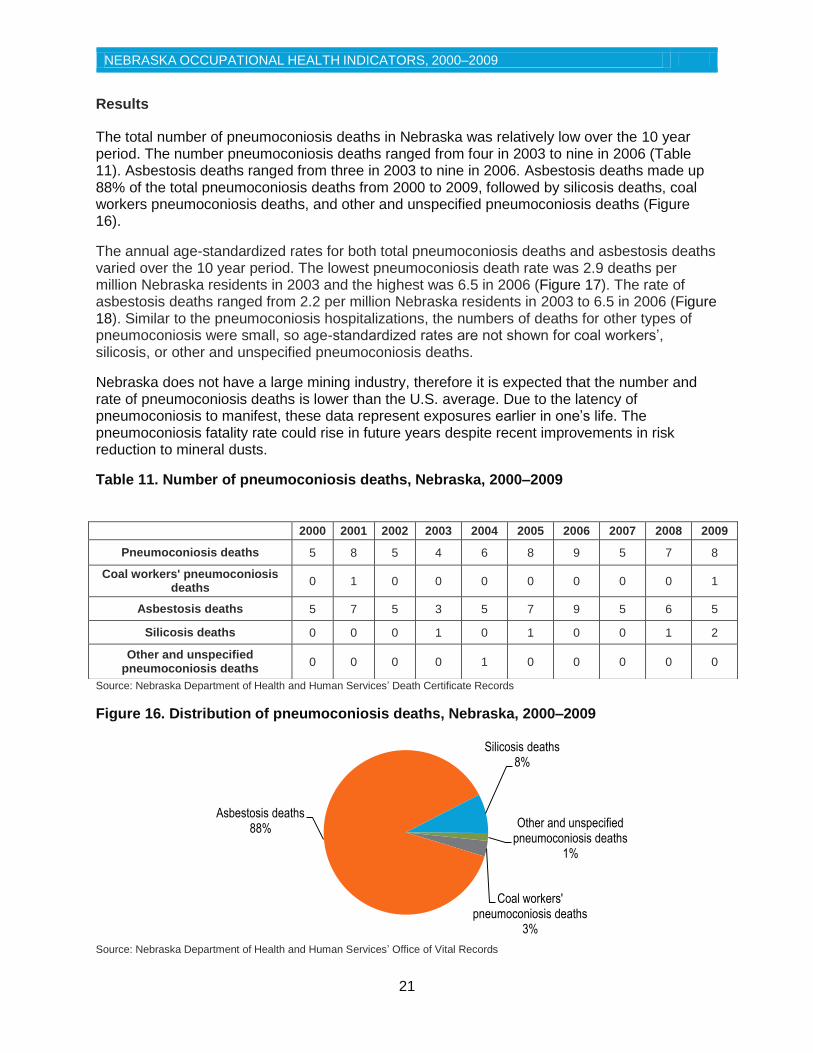
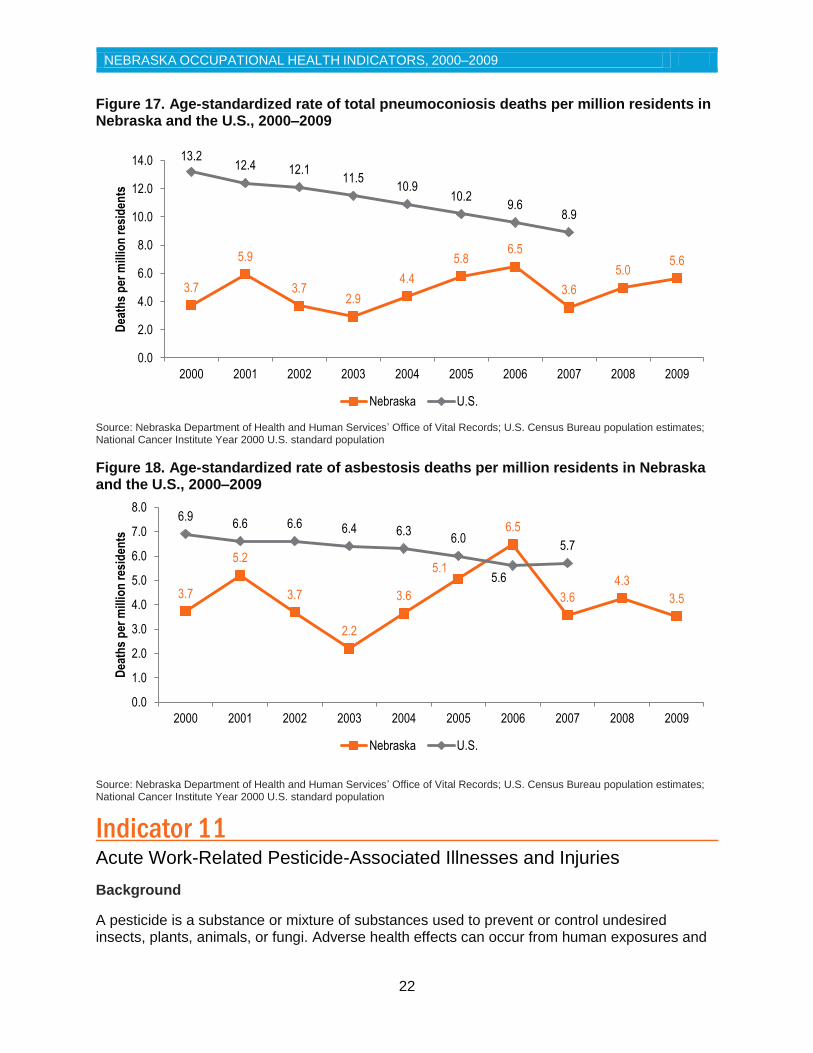
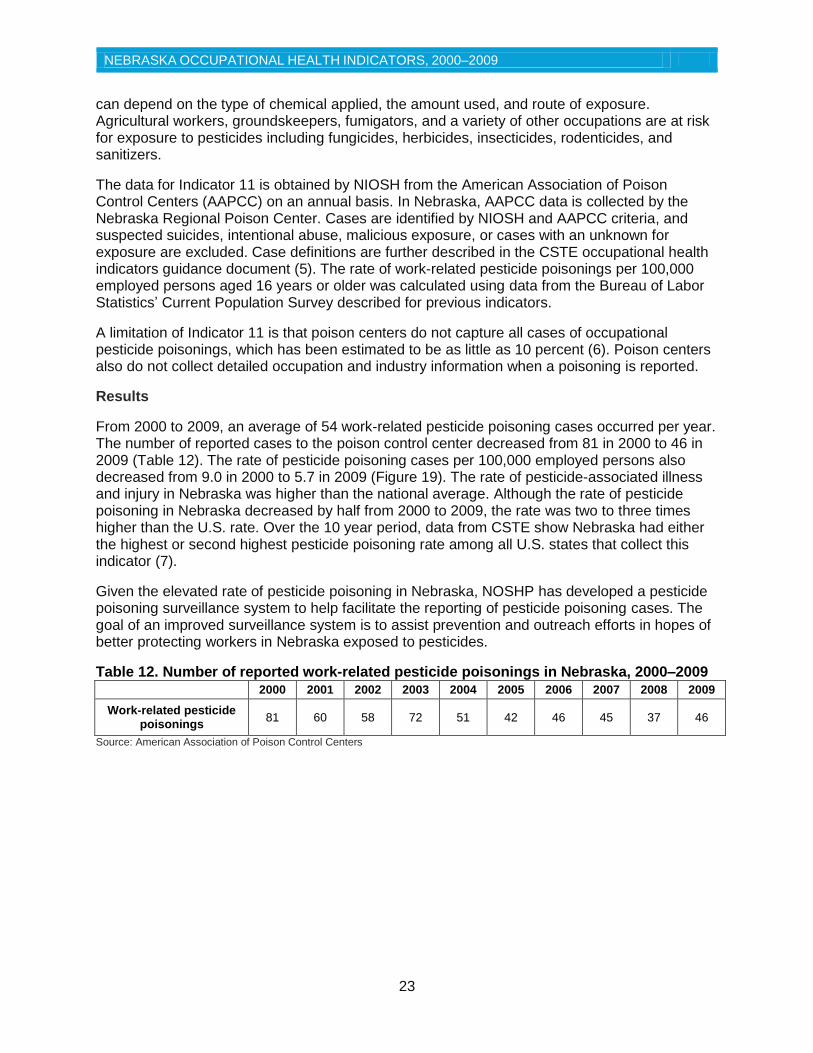
The total number of pneumoconiosis deaths in Nebraska was relatively low over the 10 year period. The number pneumoconiosis deaths ranged from four in 2003 to nine in 2006 (Table 11). Asbestosis deaths ranged from three in 2003 to nine in 2006. Asbestosis deaths made up 88% of the total pneumoconiosis deaths from 2000 to 2009, followed by silicosis deaths, coal workers pneumoconiosis deaths, and other and unspecified pneumoconiosis deaths (Figure 16).
The annual age-standardized rates for both total pneumoconiosis deaths and asbestosis deaths varied over the 10 year period. The lowest pneumoconiosis death rate was 2.9 deaths per million Nebraska residents in 2003 and the highest was 6.5 in 2006 (Figure 17). The rate of asbestosis deaths ranged from 2.2 per million Nebraska residents in 2003 to 6.5 in 2006 (Figure 18). Similar to the pneumoconiosis hospitalizations, the numbers of deaths for other types of pneumoconiosis were small, so age-standardized rates are not shown for coal workers’, silicosis, or other and unspecified pneumoconiosis deaths.
Nebraska does not have a large mining industry, therefore it is expected that the number and rate of pneumoconiosis deaths is lower than the U.S. average. Due to the latency of pneumoconiosis to manifest, these data represent exposures earlier in one’s life. The pneumoconiosis fatality rate could rise in future years despite recent improvements in risk reduction to mineral dusts.
Table 11. Number of pneumoconiosis deaths, Nebraska, 2000–2009
Source: Nebraska Department of Health and Human Services’ Death Certificate Records
Figure 16. Distribution of pneumoconiosis deaths, Nebraska, 2000–2009
Source: Nebraska Department of Health and Human Services’ Office of Vital Records
Coal workers' pneumoconiosis deaths
3%
Asbestosis deaths 88%
Silicosis deaths 8%
Other and unspecified pneumoconiosis deaths
1%
2000 2001 2002 2003 2004 2005 2006 2007 2008 2009
Pneumoconiosis deaths 5 8 5 4 6 8 9 5 7 8
Coal workers' pneumoconiosis deaths
0 1 0 0 0 0 0 0 0 1
Asbestosis deaths 5 7 5 3 5 7 9 5 6 5
Silicosis deaths 0 0 0 1 0 1 0 0 1 2
Other and unspecified pneumoconiosis deaths
0 0 0 0 1 0 0 0 0 0
NEBRASKA OCCUPATIONAL HEALTH INDICATORS, 2000–2009
22
Figure 17. Age-standardized rate of total pneumoconiosis deaths per million residents in Nebraska and the U.S., 2000–2009
Source: Nebraska Department of Health and Human Services’ Office of Vital Records; U.S. Census Bureau population estimates; National Cancer Institute Year 2000 U.S. standard population
Figure 18. Age-standardized rate of asbestosis deaths per million residents in Nebraska and the U.S., 2000–2009
Source: Nebraska Department of Health and Human Services’ Office of Vital Records; U.S. Census Bureau population estimates; National Cancer Institute Year 2000 U.S. standard population
Indicator 11 Acute Work-Related Pesticide-Associated Illnesses and Injuries Background
A pesticide is a substance or mixture of substances used to prevent or control undesired insects, plants, animals, or fungi. Adverse health effects can occur from human exposures and
3.7
5.9
3.7 2.9
4.4
5.8 6.5
3.6
5.0 5.6
13.2 12.4 12.1
11.5 10.9
10.2 9.6
8.9
0.0
2.0
4.0
6.0
8.0
10.0
12.0
14.0
2000 2001 2002 2003 2004 2005 2006 2007 2008 2009
Dea
ths
per
mill
ion
res
iden
ts
Nebraska U.S.
3.7
5.2
3.7
2.2
3.6
5.1
6.5
3.6
4.3
3.5
6.9 6.6 6.6 6.4 6.3
6.0
5.6
5.7
0.0
1.0
2.0
3.0
4.0
5.0
6.0
7.0
8.0
2000 2001 2002 2003 2004 2005 2006 2007 2008 2009
Dea
ths
per
mill
ion
res
iden
ts
Nebraska U.S.
NEBRASKA OCCUPATIONAL HEALTH INDICATORS, 2000–2009
23
can depend on the type of chemical applied, the amount used, and route of exposure. Agricultural workers, groundskeepers, fumigators, and a variety of other occupations are at risk for exposure to pesticides including fungicides, herbicides, insecticides, rodenticides, and sanitizers.
The data for Indicator 11 is obtained by NIOSH from the American Association of Poison Control Centers (AAPCC) on an annual basis. In Nebraska, AAPCC data is collected by the Nebraska Regional Poison Center. Cases are identified by NIOSH and AAPCC criteria, and suspected suicides, intentional abuse, malicious exposure, or cases with an unknown for exposure are excluded. Case definitions are further described in the CSTE occupational health indicators guidance document (5). The rate of work-related pesticide poisonings per 100,000 employed persons aged 16 years or older was calculated using data from the Bureau of Labor Statistics’ Current Population Survey described for previous indicators.
A limitation of Indicator 11 is that poison centers do not capture all cases of occupational pesticide poisonings, which has been estimated to be as little as 10 percent (6). Poison centers also do not collect detailed occupation and industry information when a poisoning is reported.
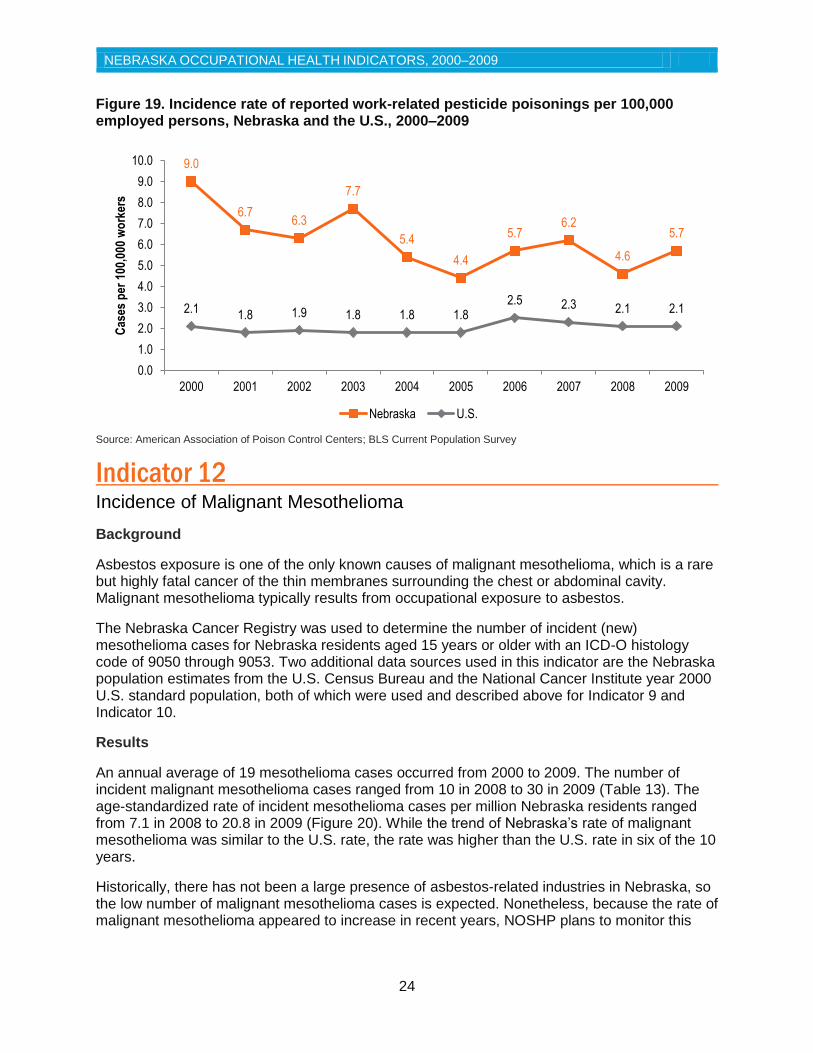
Results
From 2000 to 2009, an average of 54 work-related pesticide poisoning cases occurred per year. The number of reported cases to the poison control center decreased from 81 in 2000 to 46 in 2009 (Table 12). The rate of pesticide poisoning cases per 100,000 employed persons also decreased from 9.0 in 2000 to 5.7 in 2009 (Figure 19). The rate of pesticide-associated illness and injury in Nebraska was higher than the national average. Although the rate of pesticide poisoning in Nebraska decreased by half from 2000 to 2009, the rate was two to three times higher than the U.S. rate. Over the 10 year period, data from CSTE show Nebraska had either the highest or second highest pesticide poisoning rate among all U.S. states that collect this indicator (7).
Given the elevated rate of pesticide poisoning in Nebraska, NOSHP has developed a pesticide poisoning surveillance system to help facilitate the reporting of pesticide poisoning cases. The goal of an improved surveillance system is to assist prevention and outreach efforts in hopes of better protecting workers in Nebraska exposed to pesticides.
Table 12. Number of reported work-related pesticide poisonings in Nebraska, 2000–2009
2000 2001 2002 2003 2004 2005 2006 2007 2008 2009
Work-related pesticide poisonings
81 60 58 72 51 42 46 45 37 46
Source: American Association of Poison Control Centers
NEBRASKA OCCUPATIONAL HEALTH INDICATORS, 2000–2009
24
Figure 19. Incidence rate of reported work-related pesticide poisonings per 100,000 employed persons, Nebraska and the U.S., 2000–2009
Source: American Association of Poison Control Centers; BLS Current Population Survey
Indicator 12 Incidence of Malignant Mesothelioma Background
Asbestos exposure is one of the only known causes of malignant mesothelioma, which is a rare but highly fatal cancer of the thin membranes surrounding the chest or abdominal cavity. Malignant mesothelioma typically results from occupational exposure to asbestos.
The Nebraska Cancer Registry was used to determine the number of incident (new) mesothelioma cases for Nebraska residents aged 15 years or older with an ICD-O histology code of 9050 through 9053. Two additional data sources used in this indicator are the Nebraska population estimates from the U.S. Census Bureau and the National Cancer Institute year 2000 U.S. standard population, both of which were used and described above for Indicator 9 and Indicator 10.
Results
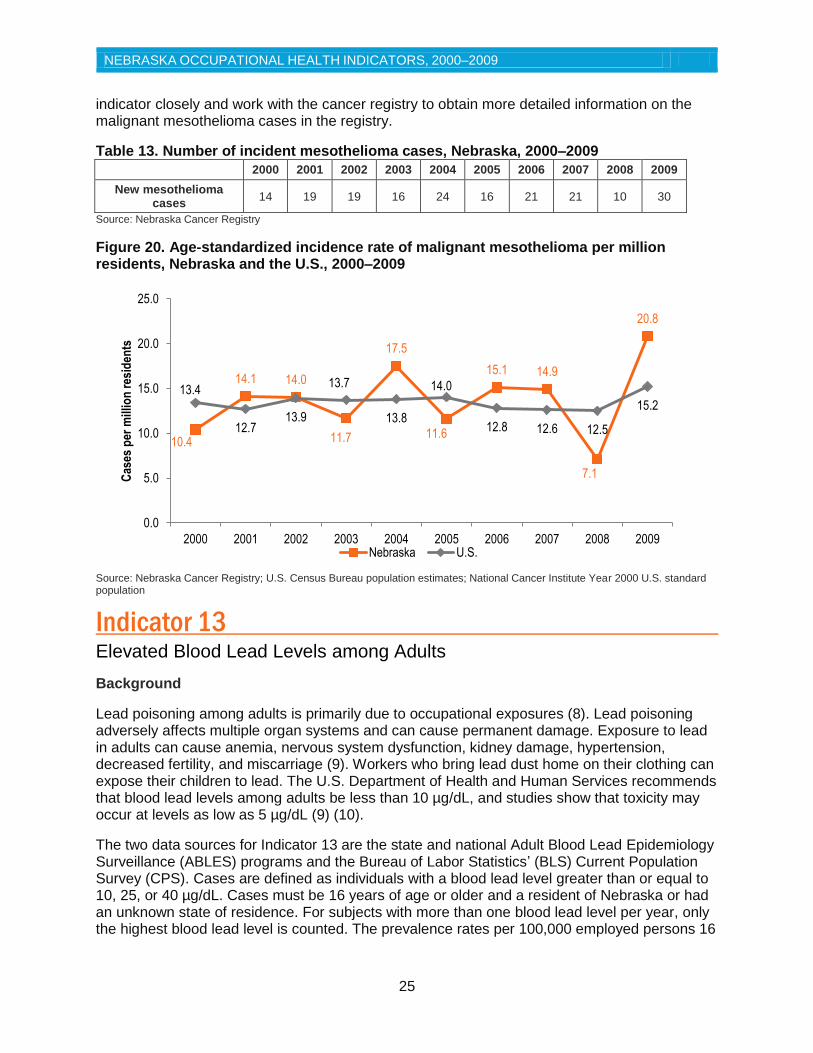
An annual average of 19 mesothelioma cases occurred from 2000 to 2009. The number of incident malignant mesothelioma cases ranged from 10 in 2008 to 30 in 2009 (Table 13). The age-standardized rate of incident mesothelioma cases per million Nebraska residents ranged from 7.1 in 2008 to 20.8 in 2009 (Figure 20). While the trend of Nebraska’s rate of malignant mesothelioma was similar to the U.S. rate, the rate was higher than the U.S. rate in six of the 10 years.
Historically, there has not been a large presence of asbestos-related industries in Nebraska, so the low number of malignant mesothelioma cases is expected. Nonetheless, because the rate of malignant mesothelioma appeared to increase in recent years, NOSHP plans to monitor this
9.0
6.7 6.3
7.7
5.4
4.4
5.7 6.2
4.6
5.7
2.1 1.8 1.9 1.8 1.8 1.8
2.5 2.3 2.1 2.1
0.0
1.0
2.0
3.0
4.0
5.0
6.0
7.0
8.0
9.0
10.0
2000 2001 2002 2003 2004 2005 2006 2007 2008 2009
Cas
es p
er 1
00,0
00 w
ork
ers
Nebraska U.S.
NEBRASKA OCCUPATIONAL HEALTH INDICATORS, 2000–2009
25
indicator closely and work with the cancer registry to obtain more detailed information on the malignant mesothelioma cases in the registry.
Table 13. Number of incident mesothelioma cases, Nebraska, 2000–2009
2000 2001 2002 2003 2004 2005 2006 2007 2008 2009
New mesothelioma cases
14 19 19 16 24 16 21 21 10 30
Source: Nebraska Cancer Registry
Figure 20. Age-standardized incidence rate of malignant mesothelioma per million residents, Nebraska and the U.S., 2000–2009
Source: Nebraska Cancer Registry; U.S. Census Bureau population estimates; National Cancer Institute Year 2000 U.S. standard population
Indicator 13 Elevated Blood Lead Levels among Adults
Background
Lead poisoning among adults is primarily due to occupational exposures (8). Lead poisoning adversely affects multiple organ systems and can cause permanent damage. Exposure to lead in adults can cause anemia, nervous system dysfunction, kidney damage, hypertension, decreased fertility, and miscarriage (9). Workers who bring lead dust home on their clothing can expose their children to lead. The U.S. Department of Health and Human Services recommends that blood lead levels among adults be less than 10 µg/dL, and studies show that toxicity may occur at levels as low as 5 µg/dL (9) (10).
The two data sources for Indicator 13 are the state and national Adult Blood Lead Epidemiology Surveillance (ABLES) programs and the Bureau of Labor Statistics’ (BLS) Current Population Survey (CPS). Cases are defined as individuals with a blood lead level greater than or equal to 10, 25, or 40 µg/dL. Cases must be 16 years of age or older and a resident of Nebraska or had an unknown state of residence. For subjects with more than one blood lead level per year, only the highest blood lead level is counted. The prevalence rates per 100,000 employed persons 16
10.4
14.1 14.0
11.7
17.5
11.6
15.1 14.9
7.1
20.8
13.4
12.7 13.9
13.7
13.8
14.0
12.8 12.6 12.5
15.2
0.0
5.0
10.0
15.0
20.0
25.0
2000 2001 2002 2003 2004 2005 2006 2007 2008 2009
Cas
es p
er m
illio
n r
esid
ents
Nebraska U.S.
NEBRASKA OCCUPATIONAL HEALTH INDICATORS, 2000–2009
26
years of age or older were calculated by dividing the number of cases by the number of employed workers from the CPS.
Results
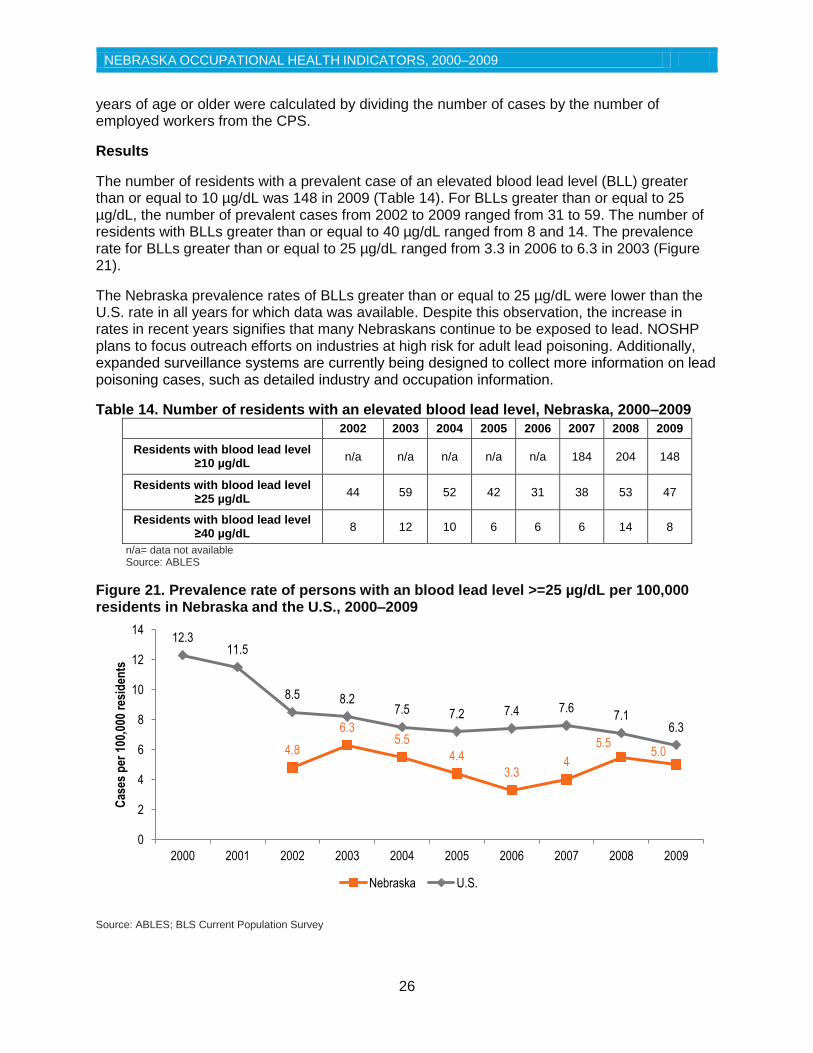
The number of residents with a prevalent case of an elevated blood lead level (BLL) greater than or equal to 10 µg/dL was 148 in 2009 (Table 14). For BLLs greater than or equal to 25 µg/dL, the number of prevalent cases from 2002 to 2009 ranged from 31 to 59. The number of residents with BLLs greater than or equal to 40 µg/dL ranged from 8 and 14. The prevalence rate for BLLs greater than or equal to 25 µg/dL ranged from 3.3 in 2006 to 6.3 in 2003 (Figure 21).
The Nebraska prevalence rates of BLLs greater than or equal to 25 µg/dL were lower than the U.S. rate in all years for which data was available. Despite this observation, the increase in rates in recent years signifies that many Nebraskans continue to be exposed to lead. NOSHP plans to focus outreach efforts on industries at high risk for adult lead poisoning. Additionally, expanded surveillance systems are currently being designed to collect more information on lead poisoning cases, such as detailed industry and occupation information.
Table 14. Number of residents with an elevated blood lead level, Nebraska, 2000–2009
2002 2003 2004 2005 2006 2007 2008 2009
Residents with blood lead level ≥10 µg/dL
n/a n/a n/a n/a n/a 184 204 148
Residents with blood lead level ≥25 µg/dL
44 59 52 42 31 38 53 47
Residents with blood lead level ≥40 µg/dL
8 12 10 6 6 6 14 8
n/a= data not available Source: ABLES
Figure 21. Prevalence rate of persons with an blood lead level >=25 µg/dL per 100,000 residents in Nebraska and the U.S., 2000–2009
Source: ABLES; BLS Current Population Survey
4.8
6.3 5.5
4.4
3.3 4
5.5 5.0
12.3 11.5
8.5 8.2 7.5 7.2 7.4 7.6
7.1 6.3
0
2
4
6
8
10
12
14
2000 2001 2002 2003 2004 2005 2006 2007 2008 2009
Cas
es p
er 1
00,0
00 r
esid
ents
Nebraska U.S.
NEBRASKA OCCUPATIONAL HEALTH INDICATORS, 2000–2009
27
Indicator 14 Workers Employed in Industries at High Risk for Occupational Morbidity
Background
Workers in certain industries are at a higher risk for sustaining non-fatal injuries and illnesses compared to the overall workforce. Industries such as foundries, agricultural implement manufacturing, animal slaughtering (except poultry), refrigerated warehousing and storage, and air transportation are identified as high morbidity risk industries. The proportion of workers employed in these high risk industries is an important indicator for occupational health in Nebraska.
High morbidity risk industries are determined every five years by CSTE and include industries that had an injury and illness rate twice that of the overall national injury and illness rate according to the Bureau of Labor Statistics’ (BLS) Survey of Occupational Injuries and Illnesses (SOII). The number of workers employed in high risk industries is based on the U.S. Census Bureau’s County Business Patterns (CBP). The percent of workers in high risk industries was calculated by dividing the number of workers by the total number of employees as indicated in the CBP.
Limitations of the SOII are described in Indicator 1. Regional industry differences may result in different high risk industries from region to region that are not reflected in the national data. Since the definition of high risk changes every five years, the number of employees in high risk industries can change from one year to another when the definition changes. For data reported from 2000 to 2009, the definition of high risk changed once in 2003 and once in 2008. The most recent list of industries identified as high risk for morbidity can be found in the CSTE guidance document for occupational health indicators (5).
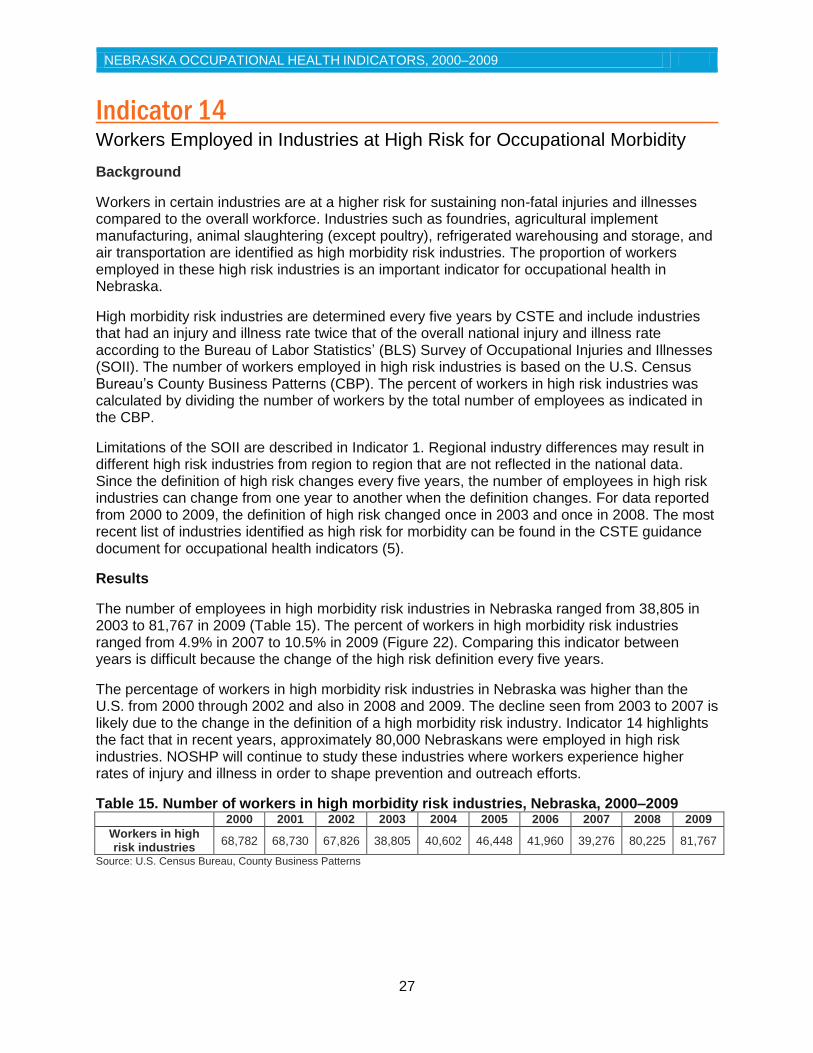
Results
The number of employees in high morbidity risk industries in Nebraska ranged from 38,805 in 2003 to 81,767 in 2009 (Table 15). The percent of workers in high morbidity risk industries ranged from 4.9% in 2007 to 10.5% in 2009 (Figure 22). Comparing this indicator between years is difficult because the change of the high risk definition every five years.
The percentage of workers in high morbidity risk industries in Nebraska was higher than the U.S. from 2000 through 2002 and also in 2008 and 2009. The decline seen from 2003 to 2007 is likely due to the change in the definition of a high morbidity risk industry. Indicator 14 highlights the fact that in recent years, approximately 80,000 Nebraskans were employed in high risk industries. NOSHP will continue to study these industries where workers experience higher rates of injury and illness in order to shape prevention and outreach efforts.
Table 15. Number of workers in high morbidity risk industries, Nebraska, 2000–2009
2000 2001 2002 2003 2004 2005 2006 2007 2008 2009
Workers in high risk industries
68,782 68,730 67,826 38,805 40,602 46,448 41,960 39,276 80,225 81,767
Source: U.S. Census Bureau, County Business Patterns
NEBRASKA OCCUPATIONAL HEALTH INDICATORS, 2000–2009
28
Figure 22. Percent of workers in high morbidity risk industries, Nebraska and the U.S., 2000–2009
Source: U.S. Census Bureau, County Business Patterns
Indicator 15 Workers Employed in Occupations at High Risk for Occupational Morbidity
Background
Nebraskans employed in occupations that are high risk for morbidity have an above average risk for sustaining non-fatal injuries and illnesses. Examples of these high risk occupations include construction laborers, emergency medical technicians and paramedics, automotive service technicians and mechanics, and highway maintenance workers.
High risk occupations for morbidity are determined every five years and include those occupations that had an injury and illness rate higher than the overall national injury and illness rate according to the Bureau of Labor Statistics’ (BLS) Survey of Occupational Injuries and Illnesses (SOII). The number of workers employed in these high risk occupations is based on the BLS’ Current Population Survey (CPS). The percent of workers in high risk occupations was calculated by dividing the number of workers by the total number of employees in Nebraska as reported in the CPS.
Limitations to the SOII are described in Indicator 1. Regional differences may result in different high risk occupations that are not reflected in the national data. As the case definition of high risk occupations changes every five years, the number of employees in high risk occupations can change from one year to another when the definition changes. For 2000 to 2009 data, the definition of high risk changed in 2003 and in 2008. The most recent list of occupations identified as high risk for morbidity can be found in the CSTE guidance document for occupational health indicators (5).
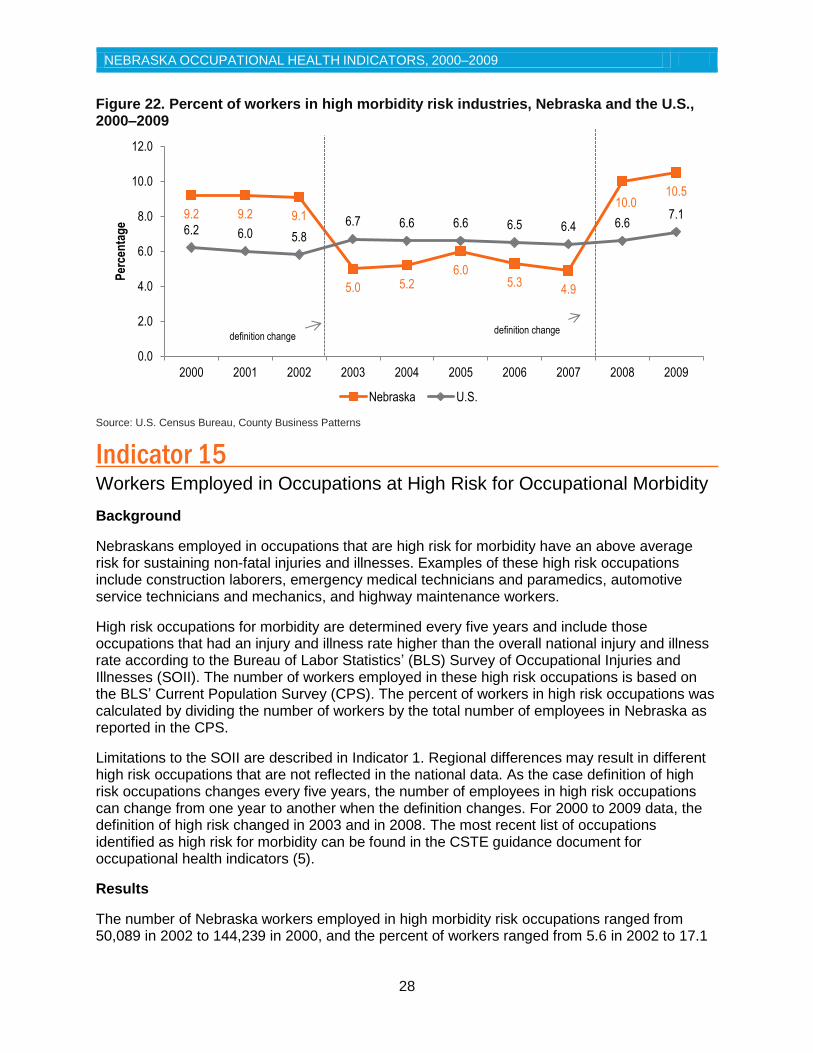
Results
The number of Nebraska workers employed in high morbidity risk occupations ranged from 50,089 in 2002 to 144,239 in 2000, and the percent of workers ranged from 5.6 in 2002 to 17.1
9.2 9.2 9.1
5.0 5.2 6.0
5.3 4.9
10.0 10.5
6.2 6.0 5.8
6.7 6.6 6.6 6.5 6.4 6.6 7.1
0.0
2.0
4.0
6.0
8.0
10.0
12.0
2000 2001 2002 2003 2004 2005 2006 2007 2008 2009
Per
cen
tag
e
Nebraska U.S.
definition change definition change
NEBRASKA OCCUPATIONAL HEALTH INDICATORS, 2000–2009
29
in 2008 (Table 16, Figure 23). Similar to Indicator 14, it is difficult to interpret the comparison between years given the changing definition of high risk.
Overall, the percentage of workers with high morbidity risk occupations more than doubled from 2002 to 2009. This increase was similar to the U.S. trend; however, the percentage was lower than the U.S for most years. More than 100,000 employees worked in high risk jobs by the end of the decade. The NOSHP plans to study the injury and illness data for high risk occupations to prioritize prevention and outreach efforts.
Table 16. Number of workers in high morbidity risk occupations, Nebraska, 2000–2009
2000 2001 2002 2003 2004 2005 2006 2007 2008 2009
Workers in high risk occupations
144,239 110,754 50,089 99,646 105,209 101,423 92,748 98,956 117,880 102,494
Source: BLS Current Population Survey
Figure 23. Percent of workers in high morbidity risk occupations, Nebraska and the U.S., 2000–2009
Source: BLS Current Population Survey
Indicator 16
Workers Employed in Industries and Occupations at High Risk for Occupational Mortality
Background
Workers in certain industries and occupations experience fatal injuries at higher rates than the overall workforce. High mortality risk industries include industries such as animal production, construction, truck transportation, and crop production. High mortality risk occupations include jobs such as farmers and ranchers, industrial truck and tractor operators, and roofers. Indicator 16 examines both industries and occupations in which workers are at high risk for occupational mortality.
High risk industries and occupations are defined as having fatal injury rates of 7.5 deaths per 100,000 workers or higher, as reported by the Bureau of Labor Statistics’ (BLS) Census of Fatal
8.7
6.8 5.6
10.6 11.0 10.7 9.7 10.3
17.1
15.3
6.3 6.3 6.3
12.2 12.4 13.0 12.7 12.8 16.1
15.6
0.0
2.0
4.0
6.0
8.0
10.0
12.0
14.0
16.0
18.0
2000 2001 2002 2003 2004 2005 2006 2007 2008 2009
Per
cen
tag
e
Nebraska U.S.
definition change definition change
NEBRASKA OCCUPATIONAL HEALTH INDICATORS, 2000–2009
30
Occupational Injuries (CFOI). The number of workers employed in these high risk industries and occupations is based on the BLS Current Population Survey (CPS). The percent of workers in high risk industries and occupations was calculated by dividing the number of workers as indicated by the CPS by the total number of employees in a state, also reported to the CPS.
Limitations of the CFOI are described in Indicator 3. Regional differences may result in differing high risk industries and occupations that are not reflected in the national data. Similar to Indicators 14 and 15, the case definition of high risk industries and occupations for mortality changes every five years. Because of this, the number of employees in these industries and occupations can change from one year to another when the definition of high risk changes. The definition of high risk changed in 2003 and 2008. The most recent list of industries and occupations identified as high risk for occupational mortality can be found in the CSTE guidance document for occupational health indicators (5).
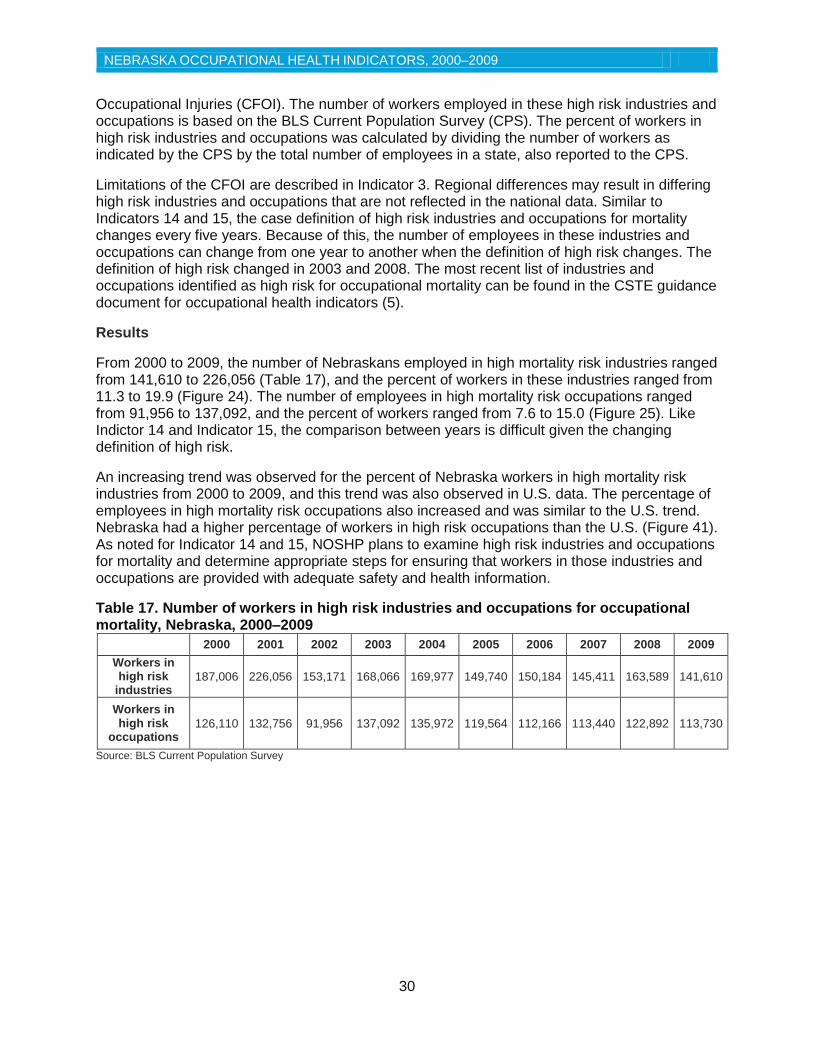
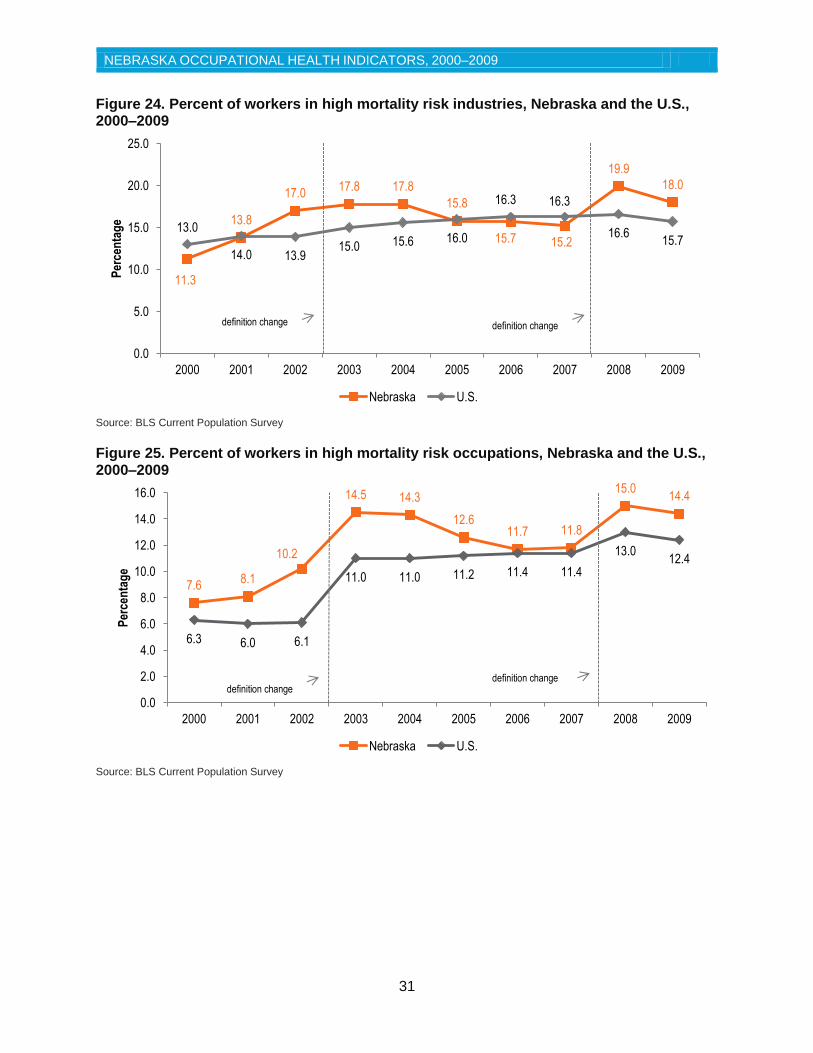
Results
From 2000 to 2009, the number of Nebraskans employed in high mortality risk industries ranged from 141,610 to 226,056 (Table 17), and the percent of workers in these industries ranged from 11.3 to 19.9 (Figure 24). The number of employees in high mortality risk occupations ranged from 91,956 to 137,092, and the percent of workers ranged from 7.6 to 15.0 (Figure 25). Like Indictor 14 and Indicator 15, the comparison between years is difficult given the changing definition of high risk.
An increasing trend was observed for the percent of Nebraska workers in high mortality risk industries from 2000 to 2009, and this trend was also observed in U.S. data. The percentage of employees in high mortality risk occupations also increased and was similar to the U.S. trend. Nebraska had a higher percentage of workers in high risk occupations than the U.S. (Figure 41). As noted for Indicator 14 and 15, NOSHP plans to examine high risk industries and occupations for mortality and determine appropriate steps for ensuring that workers in those industries and occupations are provided with adequate safety and health information.
Table 17. Number of workers in high risk industries and occupations for occupational mortality, Nebraska, 2000–2009
2000 2001 2002 2003 2004 2005 2006 2007 2008 2009
Workers in high risk
industries 187,006 226,056 153,171 168,066 169,977 149,740 150,184 145,411 163,589 141,610
Workers in high risk
occupations 126,110 132,756 91,956 137,092 135,972 119,564 112,166 113,440 122,892 113,730
Source: BLS Current Population Survey
NEBRASKA OCCUPATIONAL HEALTH INDICATORS, 2000–2009
31
Figure 24. Percent of workers in high mortality risk industries, Nebraska and the U.S., 2000–2009
Source: BLS Current Population Survey
Figure 25. Percent of workers in high mortality risk occupations, Nebraska and the U.S., 2000–2009
Source: BLS Current Population Survey
11.3
13.8
17.0 17.8 17.8
15.8
15.7 15.2
19.9
18.0
13.0
14.0 13.9 15.0 15.6 16.0
16.3 16.3
16.6 15.7
0.0
5.0
10.0
15.0
20.0
25.0
2000 2001 2002 2003 2004 2005 2006 2007 2008 2009
Per
cen
tag
e
Nebraska U.S.
7.6 8.1
10.2
14.5 14.3
12.6 11.7 11.8
15.0 14.4
6.3 6.0 6.1
11.0 11.0 11.2 11.4 11.4
13.0 12.4
0.0
2.0
4.0
6.0
8.0
10.0
12.0
14.0
16.0
2000 2001 2002 2003 2004 2005 2006 2007 2008 2009
Per
cen
tag
e
Nebraska U.S.
definition change definition change
definition change definition change
NEBRASKA OCCUPATIONAL HEALTH INDICATORS, 2000–2009
32
Indicator 17 Occupational Safety and Health Professionals
Background
Occupational safety and health professionals play a vital role in the prevention and treatment of work-related injuries and illnesses. Determining the occupational health capacity in Nebraska is important in assessing the availability of such professionals to deliver occupational health preventive services.
Indicator 17 examines the number of registered members of various professional organizations that focus on occupational safety and health issues. The two components of this indicator are the number of occupational safety and health professionals and the rate of professionals per 100,000 employees in the state. The number of registered members of occupational safety and health professional organizations is provided each year by NIOSH. The rate of occupational safety and health professionals was calculated by dividing the number of professionals by the number of employed persons aged 16 years or older per the Bureau of Labor Statistics’ (BLS) Current Population Survey (CPS). Not all occupational safety and health professionals belong to such organizations or have obtained certification, so this data may undercount the true number of safety and health professionals.
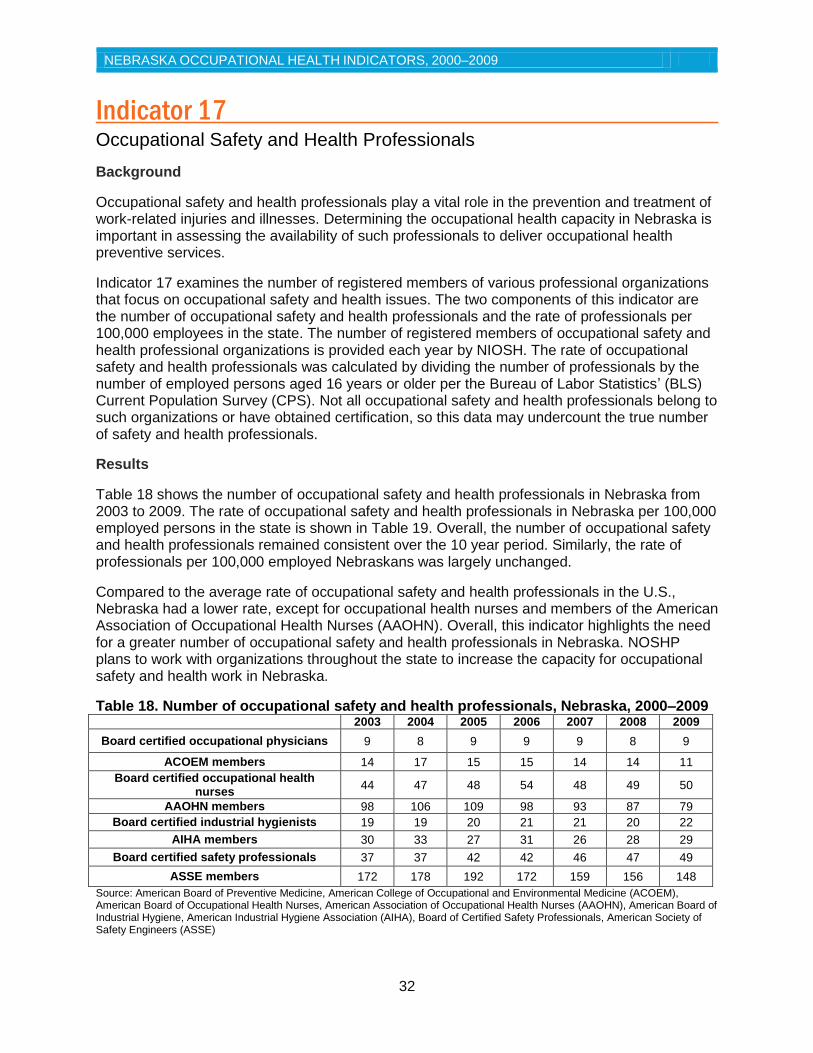
Results
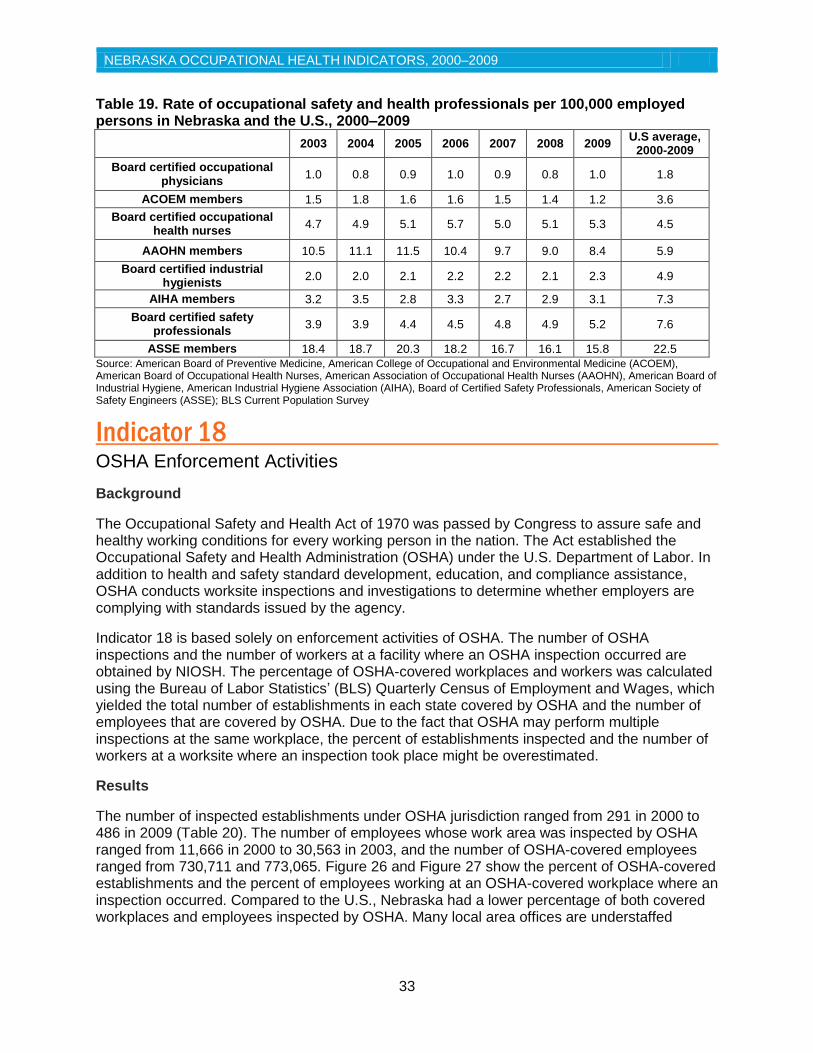
Table 18 shows the number of occupational safety and health professionals in Nebraska from 2003 to 2009. The rate of occupational safety and health professionals in Nebraska per 100,000 employed persons in the state is shown in Table 19. Overall, the number of occupational safety and health professionals remained consistent over the 10 year period. Similarly, the rate of professionals per 100,000 employed Nebraskans was largely unchanged.
Compared to the average rate of occupational safety and health professionals in the U.S., Nebraska had a lower rate, except for occupational health nurses and members of the American Association of Occupational Health Nurses (AAOHN). Overall, this indicator highlights the need for a greater number of occupational safety and health professionals in Nebraska. NOSHP plans to work with organizations throughout the state to increase the capacity for occupational safety and health work in Nebraska.
Table 18. Number of occupational safety and health professionals, Nebraska, 2000–2009
2003 2004 2005 2006 2007 2008 2009
Board certified occupational physicians 9 8 9 9 9 8 9
ACOEM members 14 17 15 15 14 14 11
Board certified occupational health nurses
44 47 48 54 48 49 50
AAOHN members 98 106 109 98 93 87 79
Board certified industrial hygienists 19 19 20 21 21 20 22
AIHA members 30 33 27 31 26 28 29
Board certified safety professionals 37 37 42 42 46 47 49
ASSE members 172 178 192 172 159 156 148
Source: American Board of Preventive Medicine, American College of Occupational and Environmental Medicine (ACOEM), American Board of Occupational Health Nurses, American Association of Occupational Health Nurses (AAOHN), American Board of Industrial Hygiene, American Industrial Hygiene Association (AIHA), Board of Certified Safety Professionals, American Society of Safety Engineers (ASSE)
NEBRASKA OCCUPATIONAL HEALTH INDICATORS, 2000–2009
33
Table 19. Rate of occupational safety and health professionals per 100,000 employed persons in Nebraska and the U.S., 2000–2009
2003 2004 2005 2006 2007 2008 2009
U.S average, 2000-2009
Board certified occupational physicians
1.0 0.8 0.9 1.0 0.9 0.8 1.0 1.8
ACOEM members 1.5 1.8 1.6 1.6 1.5 1.4 1.2 3.6
Board certified occupational health nurses
4.7 4.9 5.1 5.7 5.0 5.1 5.3 4.5
AAOHN members 10.5 11.1 11.5 10.4 9.7 9.0 8.4 5.9
Board certified industrial hygienists
2.0 2.0 2.1 2.2 2.2 2.1 2.3 4.9
AIHA members 3.2 3.5 2.8 3.3 2.7 2.9 3.1 7.3
Board certified safety professionals
3.9 3.9 4.4 4.5 4.8 4.9 5.2 7.6
ASSE members 18.4 18.7 20.3 18.2 16.7 16.1 15.8 22.5
Source: American Board of Preventive Medicine, American College of Occupational and Environmental Medicine (ACOEM), American Board of Occupational Health Nurses, American Association of Occupational Health Nurses (AAOHN), American Board of Industrial Hygiene, American Industrial Hygiene Association (AIHA), Board of Certified Safety Professionals, American Society of Safety Engineers (ASSE); BLS Current Population Survey
Indicator 18 OSHA Enforcement Activities
Background
The Occupational Safety and Health Act of 1970 was passed by Congress to assure safe and healthy working conditions for every working person in the nation. The Act established the Occupational Safety and Health Administration (OSHA) under the U.S. Department of Labor. In addition to health and safety standard development, education, and compliance assistance, OSHA conducts worksite inspections and investigations to determine whether employers are complying with standards issued by the agency.
Indicator 18 is based solely on enforcement activities of OSHA. The number of OSHA inspections and the number of workers at a facility where an OSHA inspection occurred are obtained by NIOSH. The percentage of OSHA-covered workplaces and workers was calculated using the Bureau of Labor Statistics’ (BLS) Quarterly Census of Employment and Wages, which yielded the total number of establishments in each state covered by OSHA and the number of employees that are covered by OSHA. Due to the fact that OSHA may perform multiple inspections at the same workplace, the percent of establishments inspected and the number of workers at a worksite where an inspection took place might be overestimated.
Results
The number of inspected establishments under OSHA jurisdiction ranged from 291 in 2000 to 486 in 2009 (Table 20). The number of employees whose work area was inspected by OSHA ranged from 11,666 in 2000 to 30,563 in 2003, and the number of OSHA-covered employees ranged from 730,711 and 773,065. Figure 26 and Figure 27 show the percent of OSHA-covered establishments and the percent of employees working at an OSHA-covered workplace where an inspection occurred. Compared to the U.S., Nebraska had a lower percentage of both covered workplaces and employees inspected by OSHA. Many local area offices are understaffed
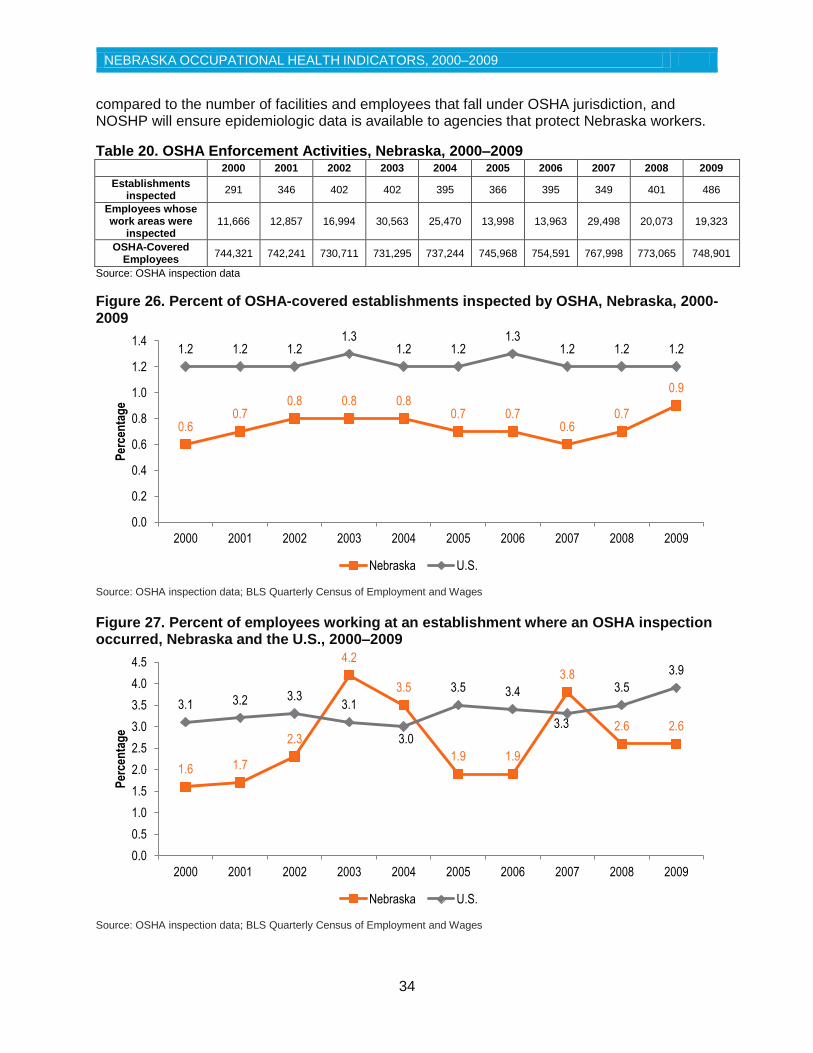
NEBRASKA OCCUPATIONAL HEALTH INDICATORS, 2000–2009
34
compared to the number of facilities and employees that fall under OSHA jurisdiction, and NOSHP will ensure epidemiologic data is available to agencies that protect Nebraska workers.
Table 20. OSHA Enforcement Activities, Nebraska, 2000–2009
2000 2001 2002 2003 2004 2005 2006 2007 2008 2009
Establishments inspected
291 346 402 402 395 366 395 349 401 486
Employees whose work areas were
inspected 11,666 12,857 16,994 30,563 25,470 13,998 13,963 29,498 20,073 19,323
OSHA-Covered Employees
744,321 742,241 730,711 731,295 737,244 745,968 754,591 767,998 773,065 748,901
Source: OSHA inspection data
Figure 26. Percent of OSHA-covered establishments inspected by OSHA, Nebraska, 2000-2009
Source: OSHA inspection data; BLS Quarterly Census of Employment and Wages
Figure 27. Percent of employees working at an establishment where an OSHA inspection occurred, Nebraska and the U.S., 2000–2009
Source: OSHA inspection data; BLS Quarterly Census of Employment and Wages
0.6 0.7
0.8 0.8 0.8 0.7 0.7
0.6 0.7
0.9
1.2 1.2 1.2 1.3
1.2 1.2 1.3
1.2 1.2 1.2
0.0
0.2
0.4
0.6
0.8
1.0
1.2
1.4
2000 2001 2002 2003 2004 2005 2006 2007 2008 2009
Per
cen
tag
e
Nebraska U.S.
1.6 1.7
2.3
4.2
3.5
1.9 1.9
3.8
2.6 2.6
3.1 3.2 3.3 3.1
3.0
3.5 3.4
3.3
3.5
3.9
0.0
0.5
1.0
1.5
2.0
2.5
3.0
3.5
4.0
4.5
2000 2001 2002 2003 2004 2005 2006 2007 2008 2009
Per
cen
tag
e
Nebraska U.S.
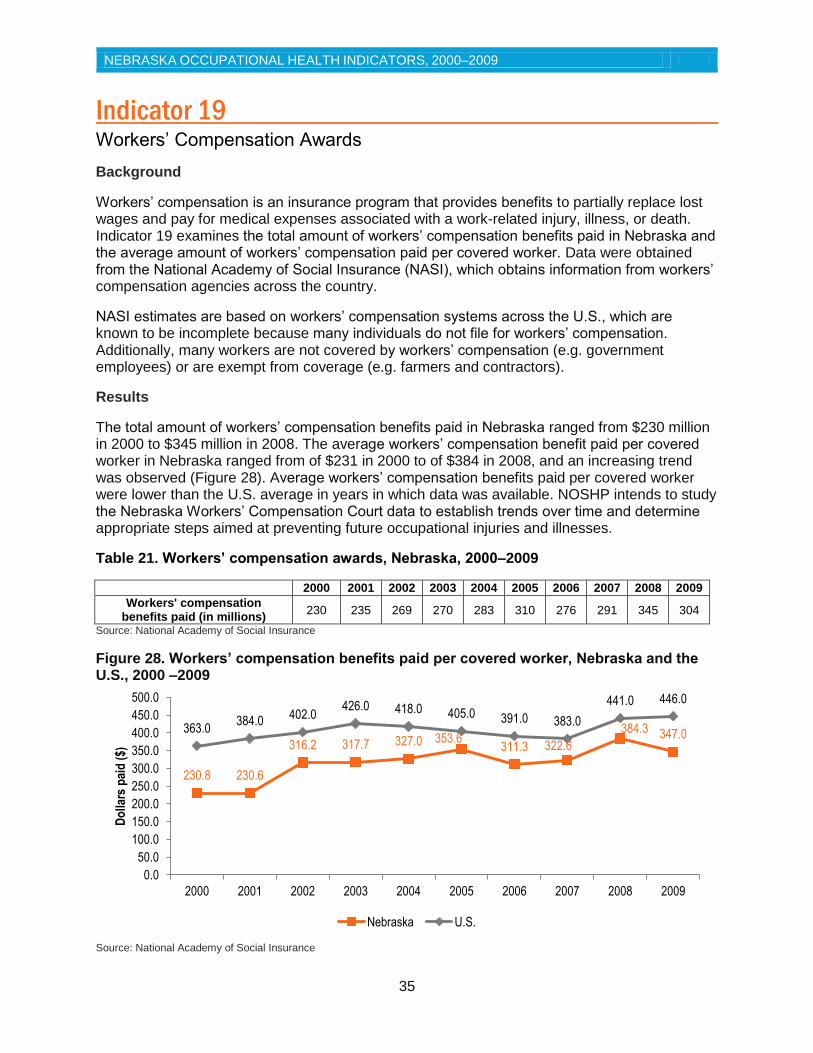
NEBRASKA OCCUPATIONAL HEALTH INDICATORS, 2000–2009
35
Indicator 19 Workers’ Compensation Awards
Background
Workers’ compensation is an insurance program that provides benefits to partially replace lost wages and pay for medical expenses associated with a work-related injury, illness, or death. Indicator 19 examines the total amount of workers’ compensation benefits paid in Nebraska and the average amount of workers’ compensation paid per covered worker. Data were obtained from the National Academy of Social Insurance (NASI), which obtains information from workers’ compensation agencies across the country.
NASI estimates are based on workers’ compensation systems across the U.S., which are known to be incomplete because many individuals do not file for workers’ compensation. Additionally, many workers are not covered by workers’ compensation (e.g. government employees) or are exempt from coverage (e.g. farmers and contractors).
Results
The total amount of workers’ compensation benefits paid in Nebraska ranged from $230 million in 2000 to $345 million in 2008. The average workers’ compensation benefit paid per covered worker in Nebraska ranged from of $231 in 2000 to of $384 in 2008, and an increasing trend was observed (Figure 28). Average workers’ compensation benefits paid per covered worker were lower than the U.S. average in years in which data was available. NOSHP intends to study the Nebraska Workers’ Compensation Court data to establish trends over time and determine appropriate steps aimed at preventing future occupational injuries and illnesses.
Table 21. Workers’ compensation awards, Nebraska, 2000–2009
2000 2001 2002 2003 2004 2005 2006 2007 2008 2009
Workers' compensation benefits paid (in millions)
230 235 269 270 283 310 276 291 345 304
Source: National Academy of Social Insurance
Figure 28. Workers’ compensation benefits paid per covered worker, Nebraska and the U.S., 2000 –2009
Source: National Academy of Social Insurance
230.8 230.6
316.2 317.7 327.0 353.6 311.3 322.6
384.3 347.0 363.0 384.0
402.0 426.0 418.0 405.0 391.0 383.0
441.0 446.0
0.0
50.0
100.0
150.0
200.0
250.0
300.0
350.0
400.0
450.0
500.0
2000 2001 2002 2003 2004 2005 2006 2007 2008 2009
Do
llars
pai
d (
$)
Nebraska U.S.
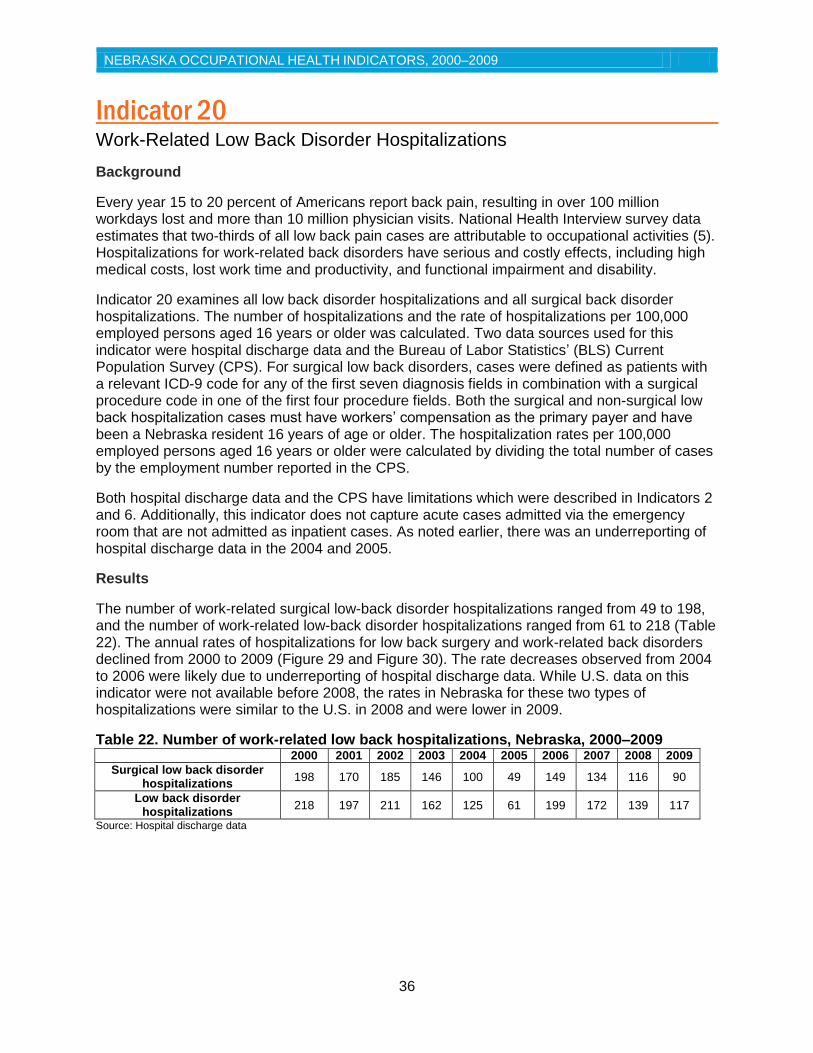
NEBRASKA OCCUPATIONAL HEALTH INDICATORS, 2000–2009
36
Indicator 20 Work-Related Low Back Disorder Hospitalizations
Background
Every year 15 to 20 percent of Americans report back pain, resulting in over 100 million workdays lost and more than 10 million physician visits. National Health Interview survey data estimates that two-thirds of all low back pain cases are attributable to occupational activities (5). Hospitalizations for work-related back disorders have serious and costly effects, including high medical costs, lost work time and productivity, and functional impairment and disability.
Indicator 20 examines all low back disorder hospitalizations and all surgical back disorder hospitalizations. The number of hospitalizations and the rate of hospitalizations per 100,000 employed persons aged 16 years or older was calculated. Two data sources used for this indicator were hospital discharge data and the Bureau of Labor Statistics’ (BLS) Current Population Survey (CPS). For surgical low back disorders, cases were defined as patients with a relevant ICD-9 code for any of the first seven diagnosis fields in combination with a surgical procedure code in one of the first four procedure fields. Both the surgical and non-surgical low back hospitalization cases must have workers’ compensation as the primary payer and have been a Nebraska resident 16 years of age or older. The hospitalization rates per 100,000 employed persons aged 16 years or older were calculated by dividing the total number of cases by the employment number reported in the CPS.
Both hospital discharge data and the CPS have limitations which were described in Indicators 2 and 6. Additionally, this indicator does not capture acute cases admitted via the emergency room that are not admitted as inpatient cases. As noted earlier, there was an underreporting of hospital discharge data in the 2004 and 2005.
Results
The number of work-related surgical low-back disorder hospitalizations ranged from 49 to 198, and the number of work-related low-back disorder hospitalizations ranged from 61 to 218 (Table 22). The annual rates of hospitalizations for low back surgery and work-related back disorders declined from 2000 to 2009 (Figure 29 and Figure 30). The rate decreases observed from 2004 to 2006 were likely due to underreporting of hospital discharge data. While U.S. data on this indicator were not available before 2008, the rates in Nebraska for these two types of hospitalizations were similar to the U.S. in 2008 and were lower in 2009.
Table 22. Number of work-related low back hospitalizations, Nebraska, 2000–2009
2000 2001 2002 2003 2004 2005 2006 2007 2008 2009
Surgical low back disorder hospitalizations
198 170 185 146 100 49 149 134 116 90
Low back disorder hospitalizations
218 197 211 162 125 61 199 172 139 117
Source: Hospital discharge data
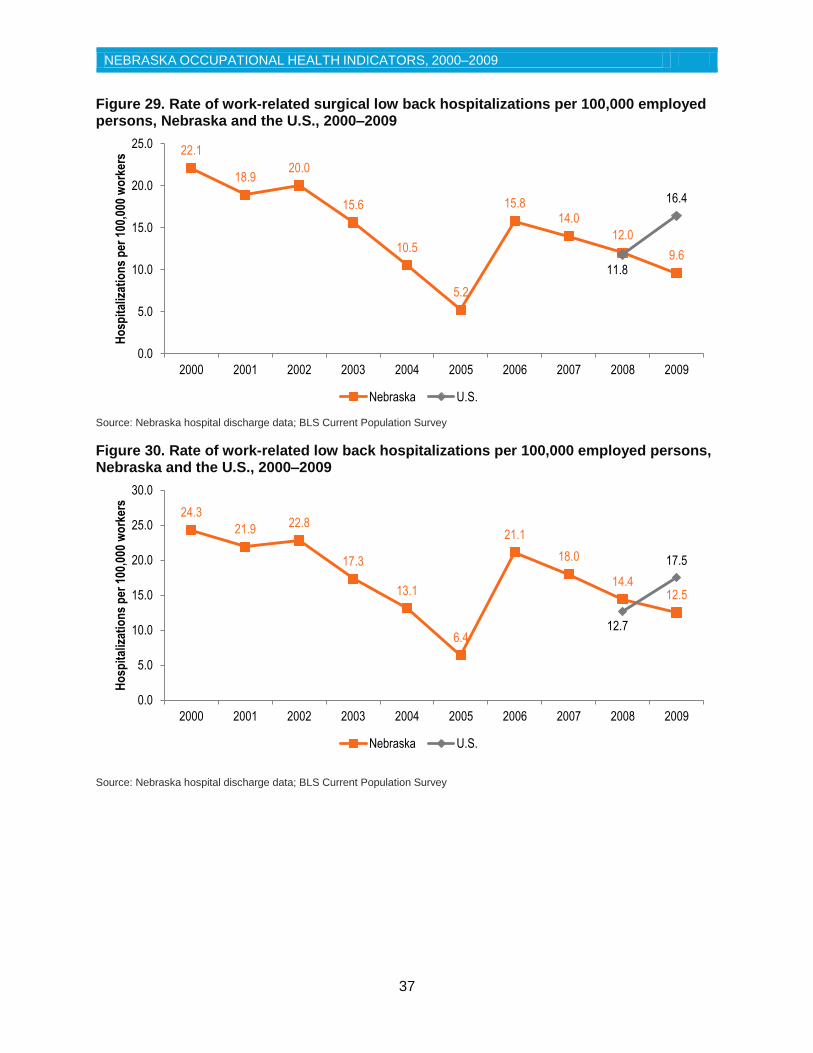
NEBRASKA OCCUPATIONAL HEALTH INDICATORS, 2000–2009
37
Figure 29. Rate of work-related surgical low back hospitalizations per 100,000 employed persons, Nebraska and the U.S., 2000–2009
Source: Nebraska hospital discharge data; BLS Current Population Survey
Figure 30. Rate of work-related low back hospitalizations per 100,000 employed persons, Nebraska and the U.S., 2000–2009
Source: Nebraska hospital discharge data; BLS Current Population Survey
22.1
18.9 20.0
15.6
10.5
5.2
15.8 14.0
12.0
9.6 11.8
16.4
0.0
5.0
10.0
15.0
20.0
25.0
2000 2001 2002 2003 2004 2005 2006 2007 2008 2009
Ho
spit
aliz
atio
ns
per
100
,000
wo
rker
s
Nebraska U.S.
24.3
21.9 22.8
17.3
13.1
6.4
21.1
18.0
14.4 12.5
12.7
17.5
0.0
5.0
10.0
15.0
20.0
25.0
30.0
2000 2001 2002 2003 2004 2005 2006 2007 2008 2009
Ho
spit
aliz
atio
ns
per
100
,000
wo
rker
s
Nebraska U.S.
NEBRASKA OCCUPATIONAL HEALTH INDICATORS, 2000–2009
38
Conclusion Each year, millions of workers in the U.S are injured or become ill as a result of their work. The impact of these occupational injuries and illnesses on workers and their families, employers, and the U.S. economy can be significant. According to the Bureau of Labor Statistics’, 1,181,290 work-related injuries and illnesses with days away from work occurred in 2011 in the
U.S., and 4,693 workers died as a result of work‐related injuries. Workers’ compensation programs in the U.S. paid $60.2 billion in benefits in 2011.
Occupational health surveillance is the systematic monitoring of health events in working populations. The Nebraska Department of Health and Human Services’ Occupational Safety and Health Surveillance Program (NOSHP) conducts surveillance of injuries, illnesses, deaths, and hazards among Nebraska workers in order to prevent and control workplace injuries and illnesses.
Employment demographic data show important changes in the Nebraska workforce throughout the previous decade. Total employment grew by approximately 40,000 from 2000 to 2009. The percent of workers aged 65 years or older increased from 2.4 to 5.1 from 2000 to 2009. The percent of the black workers increased from 3.2 to 4.1, while the percent of workers of Hispanic origin increased more than 75%, from 4.2 in 2000 to 7.4 in 2009.
In Nebraska, the total work-related injuries and illnesses rate per 100,000 FTEs was higher than the average U.S. rate (4,100 vs. 3,600 in 2009). The rate of work-related fatal injuries per 100,000 FTEs in Nebraska was also higher than the U.S. rate (6.1 vs. 3.5 in 2009). An average of 56 fatal work-related injuries occurred per year in Nebraska. The incidence rates of carpal tunnel syndrome cases and pesticide poisonings were also higher than the U.S. average.
Although some rates were higher in Nebraska compared to the U.S., many types of injuries and illnesses declined from 2000 to 2009. Rates of total occupational non-fatal injuries and illnesses, work-related hospitalizations, amputations, and musculoskeletal disorders fell during the previous decade.
Occupational health indicators highlight the increasing economic impact of work-related illnesses and injuries. While workers’ compensations benefits paid per year were lower than the U.S. average, benefits paid increased by $74 million from 2000 to 2009. Occupational safety and health professionals are vital for the prevention and treatment of these costly injuries and illnesses, yet Nebraska had fewer of these professionals per worker compared to the U.S.
Occupational health surveillance remains an important priority in Nebraska. NOSHP plans to further study surveillance data to identify high risk occupations, industries, and worker populations. NOSHP will also work with public health stakeholders to develop and implement prevention and intervention efforts with the goal of reducing the number of occupational injuries and illnesses and thereby improving the health Nebraska workers.
NEBRASKA OCCUPATIONAL HEALTH INDICATORS, 2000–2009
39
References 1. Bureau of Labor Statistics, U.S. Department of Labor. Survey of Occupational Injuries and Illnesses. 2011.
2. Bureau of Labor Statistics, U.S. Department of Labor. Census of Fatal Occupational Injuries. 2011.
3. National Academy of Social Insurance. Workers' Compensation: Benefits, Coverage, and Costs, 2011. http://www.nasi.org/research/2013/report-workers-compensation-benefits-coverage-costs-2011
4. Council of State and Territorial Epidemiologists. The Role of the States in a Nationwide, Comprehensive Surveillance System for Work-Related Diseases, Injuries, and Hazards. 2001. http://c.ymcdn.com/sites/www.cste.org/resource/resmgr/OccupationalHealth/NIOSH.pdf.
5. Council of State and Territorial Epidemiologists. Occupational Health Indicators: A Guide for Tracking Occupational Health Conditions and their Determinants. March 2013. http://www.cste.org/group/OHIndicators/.
6. Calvert G, Mehier L, Rosales R. Acute Pesticide-Related Illnesses Among Working Youths, 1988-1999. American Journal Of Public Health. April 2003;93(4):605-610.
7. Council of State and Territorial Epidemiologists. Occupational Health Indicators - Indicator 11: Acute Work-Related Pesticide Poisonings Reported to Poison Control Centers. 2013. http://www.cste.org/?OHIndicators.
8. Centers for Disease Control and Prevention. Adult Blood Lead Epidemiology and Surveillance --- United States, 2008--2009. Morbidity and Mortality Weekly Report (MMWR). July 2011, 60 (25): 841-845.
9. Kosnett M, Wedeen R, Rothenberg S. Recommendations for Medical Management of Adult Lead Exposure. Environmental Health Perspectives. March 2007;115(3):463-471.
10. U.S. Department of Health and Human Services. Healthy People 2020: Occupational Safety and Health: Indicator 7. http://www.healthypeople.gov/2020/topicsobjectives2020/ objectiveslist.aspx?topicid=30.
11. Nebraska Workers’ Compensation Court. Statistical report for injury years 2002-2011. 2012. http://www.wcc.ne.gov/publications/statisticalreport_02-11.pdf.
40
Nebraska Department of Health and Human Services
Division of Public Health Epidemiology and Informatics Unit
Office of Epidemiology Occupational Safety and Health Surveillance Program
301 Centennial Mall South Lincoln, NE 68509
Phone: 402-471-2937
Fax: 402-471-3601 Website: www.dhhs.ne.gov/publichealth/occhealth/