Embed Size (px)
Citation preview

THIS REPORT CONTAINS ASSESSMENTS OF COMMODITY AND TRADE ISSUES MADE BY
USDA STAFF AND NOT NECESSARILY STATEMENTS OF OFFICIAL U.S. GOVERNMENT
POLICY
Date:
GAIN Report Number:
Approved By:
Prepared By:
Report Highlights:
Due to a government program incentivizing a decrease in rice production, FAS Seoul projects that
soybean production for Marketing Year (MY) 2018/19 will increase by approximately 20 percent from
the previous year, to around 100,000 metric tons (MT). Consumption is forecast to remain unchanged
from the previous year, at 1.37 million MT (MMT). Imports are also projected to remain unchanged,
staying at 1.27 MMT. MY 2018/19 soybean meal production and consumption are forecast to remain
unchanged from 792,000 MT and 2.72 MMT respectively. MY 2018/19 rapeseed meal production and
consumption are also forecast to remain relatively constant at 3,000 MT and 260,000MT
Sunchul Choi//Amanda F. Hinkle
Ron Verdonk
Government Rice Production Policy Should Lead To Expanded
Soybean Acreage
Oilseeds and Products Annual
Korea - Republic of
KS1808
3/7/2018
Required Report - public distribution

respectively. Soybean oil production is also projected to remain unchanged, at 190,000 MT, and of a
total 310,000 MT in imports, about 160,000 MT will be bought from the United States. Soybean oil
consumption is forecast to remain steady at 490,000 MT. Palm oil imports will continue increasing to
meet the demand of biodiesel as Korea increased the blend mandate to three percent from the previous
biodiesel blend requirement of 2.5 percent beginning this year.

Commodities:
Production:
Soybeans accounted for approximately 49 percent of Korea’s total oilseed production in MY 2016/17,
followed by perilla (32 percent), peanuts (10 percent) and sesame (9 percent) (Table 3). Korea also
produces a small amount of rapeseed. However, the Korean government has not released rapeseed
production numbers since 2010.
The Korean Rural Economic Institute (KREI) conducted a nationwide survey December 18-21, 2017 to
ascertain the planting intentions of soybean farmers. According to the survey results, MY 2018/19
soybean area is forecast to increase to 45,775 hectares, up 219 hectares (0.5 percent) from official
harvested area in MY 2017/18 (Table 2). However, KREI estimated this increase seemed not to reflect
the effect of domestic rice area reduction programs that encourage rice farmers to cultivate soybeans on
their paddy land; KREI is expecting about 12,000 ha of rice paddy area to be converted to soybean
area. Using the KREI survey results and the rice reduction program as a benchmark, post is forecasting
that soybean production for MY 2018/19 will increase by 20 percent from KOSTAT official data in the
previous year based on a five-year average yield. Yields are expected to be similar to last year’s yields,
which had rebounded from the preceding year due to favorable weather conditions.
In MY 2017/18, KOSTAT announced that soybean production increased to 85,644 metric tons (MT), up
10,196 MT (7 percent) from the previous year. Despite declining soybean acreage, this increase was
due mainly to higher yields caused by favorable weather over the growing period (Table 1).
So far in 2018, government purchases of the 2017 soybean crop have increased to approximately 10,700
MT (Table 4), reaching about 36 percent of the purchasing target of 30,000 MT as the Korean
government increased the purchasing price to Korea won 4,011 per KG (equivalent to USD 3,553 per
metric ton), up four percent from the previous four years’ buying prices.
Table 1
Korea: Soybean Production
Crop Year Area (ha) Yield (Kg/ha) Production (MT)
2010 71,422 1,475 105,345
2011 77,849 1,662 129,394
2012 80,842 1,516 122,519
2013 80,031 1,925 154,067
2014 74,652 1,866 139,267
2015 56,666 1,830 103,504
2016 49,014 1,540 75,448
Oil, Soybean

2017 45,556 1,880 85,644
2018 1/ 57,000a/ 1,800b/ 103,000
Source: Statistics Korea (KOSTAT); Ministry for Agriculture, Food, and Rural Affairs (MAFRA)
1/ FAS Seoul forecast based on KREI analysis.
a/ KREI estimate based on telephone survey for December 18-20, 2017, reflecting the impact of the rice area reduction
program
b/ Based on previous five-year average
Table 2
Korea: 2018 Soybean Planting Intentions
Crop Year Upland (ha) Paddy Land (ha) Total (ha)
2017 Harvest (A) 39,221 6,335 45,556
2018 Intention1/ 38,038 7,736 45,775
2018 Plan 2/ (B) 38,038 18,962 57,000
Growth Rate (%) (B/A) -3 +199 +25
Source: Korea Rural Economic Institute (KREI)
1/ Based on KREI telephone survey for December 18-20, 2017
2/ Estimated plan reflected the conversion of rice paddy into soybean crop under the rice reduction program in CY 2018.
Table 3
Korea: Oilseed Area and Production
(Hectares and Metric tons)
Crops MY 2015 MY 2016 MY 2017
Area Production Area Production Area Production
Soybean 56,666 103,504 49,014 75,448 45,556 85,644
Peanuts1/
4,589 11,651 5,632 15,530 NA2/
NA2/
Sesame 25,139 11,678 27,170 13,575 29,682 14,258
Perilla 42,570 50,932 45,474 50,024 NA2/
NA2/
Total 128,964 177,765 127,290 154,577 NA2/
NA2/
Source: Ministry for Agriculture, Food, and Rural Affairs (MAFRA) and KOSTAT
Notes:
1/ In-shell
2/ Data should be available May 2018
Table 4
Korea: Government Purchases of Soybeans
Year
Grown in rice paddy area Grown in upland area
Total Purchase
(MT) Price (KRW/Kg)1/
Quantity
(MT) Price (KRW/Kg)1/
Quantity
(MT)
2009 3,168 509 3,168 763 1,272
2010 3,168 0 3,168 0 0
2011 3,168 0 3,168 0 0
2012 3,618 0 3,618 0 0
2013 3,868 1,373 3,868 7,571 8,943
2014 3,868 na 3,868 na 9,409

2015 3,868 na 3,868 na 11,424
2016 3,868 na 3,868 na 2,114
2017 4,011 na 4,011 na 10,700
Source: Korea Agro-Fishery & Food Trade Corporation (aT); National Agricultural Cooperative Federation (NACF)
1/ Price based on No. 1 grade of large-sized kernel
Table 5
Korea: Wholesale Prices of Domestic Soybeans
(High Quality, Korean Won per Kg)
Mont
h Jan Feb Mar Apr May Jun July Aug Sep Oct Nov Dec
2011
7,02
7
7,12
1
7,18
5
7,25
0
7,24
4
7,16
3
7,08
0
6,97
1
6,85
5
6,14
5
5,58
1
5,32
0
2012
5,17
7
5,22
9
5,25
4
5,43
6
5,54
8
5,58
0
5,58
3
5,58
3
5,58
3
5,64
7
5,96
1
6,15
5
2013
6,22
9
6,31
1
6,31
4
6,31
4
6,33
3
6,32
6
6,33
8
6,28
6
6,28
6
5,88
5
5,19
3
4,59
4
2014
4,43
5
4,14
2
4,05
7
4,05
7
4,05
7
4,05
7
4,05
7
4,05
7
4,05
7
3,93
1
3,99
7
3,97
3
2015
3,97
7
4,00
0
3,88
8
3,88
6
3,92
9
3,97
1
3,97
1
3,94
6
3,91
4
3,95
2
4,16
5
4,22
5
2016
4,25
5
4,27
3
4,28
6
4,28
6
4,28
6
4,28
6
4,31
6
4,34
3
4,34
4
4,34
3
4,86
1
5,29
9
2017
5,08
6
4,95
9
4,91
4
4,91
4
4,90
8
4,87
5
4,89
1
4,90
9
4,91
9
4,94
9
4,72
2
4,67
0
2018
4,68
6
4,68
6
Source: Korea Agro-Fishery& Food Trade Corporation (aT)
Applicable Exchange Rate (Korean Won per USD): 1,129 on average in 2017
Consumption:
Soybeans account for the majority of oilseed consumption. Total domestic consumption in MY 2018/19
is forecast to stay around 1.37 million MT (MMT), remaining unchanged from the current marketing
year’s estimate, amid stagnant domestic production and flat consumer demand. Of this total, 1 MMT
will be used for crush, 320,000 MT will be used for domestic food use in products like tofu, soymilk
and soy sauce, and the remaining 50,000 MT will be consumed as domestic feed and waste. All
domestic production goes to food use. Future growth in overall soybean consumption is expected to be
minimal. Consumption for crushing will be constant at the level of 1 MMT if CJ Corporation, a leading
Korean soybean crusher, continues soybean crushing in their flexible crushing facilities, which are
converted depending on the comparison of crushing margins between rapeseed and soybeans.
As is projected for the next marketing year, in MY 2017/18, soybean consumption is expected to stay
around 1.37 MMT, due to lower consumption of soybeans as food, caused by higher prices resulting
from lower domestic soybean production. This total consists of 1 MMT for crushing, 320,000 MT for
food and 50,000 MT for feed, seed and waste.

In MY 2016/17, because of lower crushing margins, Korean processors decreased soybean crushing to
990,130 MT, down five percent from the previous year. The slight bullish trend in international
soybean prices led to the decrease of locally processed soybeans for soybean meal for feed. Total
soybean consumption decreased to 1.35 MMT, down 30,000 MT or three percent from the previous
year due to lower production of domestic soybeans, despite steady consumer demand.
Table 6
Korea: Soybean Consumption for Crushing
(Metric Ton)
Month MY 15/16 MY 16/17 MY 17/18
October 72,600 67,000 91,600
November 81,150 89,000 85,500
December 87,830 90,000 92,000
January 89,000 86,200 Na
February 84,000 77,130 Na
March 88,000 87,100 Na
April 86,000 74,000 Na
May 90,000 80,100 Na
June 90,000 80,100 Na
July 93,000 83,100 Na
August 88,000 87,900 Na
September 87,000 88,500 Na
Total 1,040,580 990,130 Na
Source: Korea Soybean Processing Association
Table 7
Korea: Distribution of Imported Soybeans for Food Manufacturing
by the Korea Agro Fisheries & Food Trade Corp. (aT)
(Calendar Year, Metric Ton)
Item\Year CY 2015 CY 2016 CY 2017
Soybean Curd 103,720 102,112 100,993
Soy Paste 33,225 33,730 32,891
Soy Paste/Soy Flour 4,062 4,650 4,344
Soy Milk 25,550 26,553 25,772
Soy Sprout 28,173 25,077 17,966
Others 1/ 225 224 237
Sub. Total 194,955 192,346 182,203
By product 2/ 36,306 44,629 38,103
Total (A) 231,261 236,975 220,306
TRQ Allocation to End-Users Direct Commercial Purchases
Soybean Curd
2,253 2,560 3,500 Soymilk

Soy-Paste/Red Pepper
Soy Sprout 8,920 9,980 11,980
Total (B) 11,173 12,540 15,480
Soy-sauce/protein (after crushing) (C) 2,580 0 0
Grand Total (A+B+C) 245,014 249,515 235,786 Source: Korea Agro-Fishery & Food Trade Corporation (aT)
Note: Quantity is on the basis of cleaned soybeans.
1/ Government, military employees and others
2/ for feed
Trade:
Soybeans accounted for more than 82 percent of total oilseed imports, of which approximately 83
percent were used for crushing in the last marketing year. Due to constant demand for imported
soybeans, MY 2018/19 soybean imports are forecast to remain unchanged from the current marketing
year estimate of 1.27 MMT. MY 2017/18 soybean imports are expected to decrease one percent from
the previous year due to an increase of domestic soybean production for food processing with stagnant
demand for crushing purposes.
In MY 2016/17, total soybean imports were 1.29 MMT on a customs-cleared basis, consisting of 1.07
MMT used for crushing and 221,143 MT used for food processing (Table 8).
Crushing
Imports of crushing soybeans in MY 2018/19 are forecast to remain unchanged from the current
marketing year’s estimate of 1 MMT based on crushers’ continued preference for processing soybeans
rather than rapeseed.
Imports during the first three months of MY 2017/18 (Oct-Dec) totaled slightly less than 248,000 MT,
down 11 percent compared to the same period of MY 2016/17(Table 9). For the rest of this marketing
year, crushers are expected to import soybeans in quantities similar to MY2016/17 to meet increased
demand for locally processed soybean meal for feed (Table 25).
The CY 2018 autonomous crushing soybean quota (a voluntary quantity above the World Trade
Organization (WTO) quota) is 1.5 MMT with an adjustable in-quota tariff, which was cut from three
percent (WTO quota) to zero (under the autonomous quota) (Table 17). Under the KORUS FTA, the
duty on U.S. soybeans for crushing fell to zero as of March 15, 2012. In MY 2016/17, the majority of
crushing beans came from Brazil (45%), followed by the United States (42%) and Paraguay (12%). The
U.S. share increased by 13 percentage points over the previous marketing year (Table10).
Table 8
Korea: Total Soybean Imports
(Unit: MT)
Marketing Year (Oct/Sep) Crushing Soybean Food Grade Soybean Total
2008/09 893,445 273,465 1,166,910
2009/10 924,491 272,733 1,197,224
2010/11 934,281 304,647 1,238,928

2011/12 786,654 352,335 1,138,989
2012/13 811,886 299,659 1,111,545
2013/14 930,277 340,559 1,270,836
2014/15a/ 1,005,645 240,127 1,245,772
2014/15 1,005,645 115,284 1,120,928
2015/16 b/
1,000,661 248,664 1,249,325
2015/16 1,000,661 373,508 1,374,169
2016/17 1,065,030 220,728 1,285,758
Source: Korea Customs Service (KCS)
a/ FAS Seoul adjusted imports of food-grade soybeans to 240,127 MT from 115,284 MT based on customs clearance
because Korea Customs Service reported cumulative numbers of food-grade soybeans imports in December 2015.
b/ FAS Seoul adjusted the imports of food-grade soybeans to 246,733MT from 373,508 MT which included cumulative
numbers of food-grade soybeans imports in December 2015.
Table 9
Korea: Soybean Imports for Oct.-Dec. by Origin
(Unit: MT)
Soybean for Crushing (HS1201.90.1000)
MY2017/18 USA Brazil China Others Total
Oct. 2017 0 28,087 0 0 28,087
Nov 0 59,462 0 44,261 103,723
Dec 99,771 11,836 0 4,206 115,813
Subtotal 99,771 99,385 0 48,467 247,623
MY2016/17a/ 162,399 87,975 0 28,000 278,374
Soybean for Sprouting (HS1201.90.3000)
MY2017/18 USA Brazil China Others Total
Oct. 2017 0 0 280 0 280
Nov 60 0 5,060 0 5,120
Dec 660 0 4,422 80 5,162
Subtotal 720 0 9,762 80 10,562
MY2016/17a/ 100 0 10,758 805 12,853
Soybean for Food Processing (HS1201.90.9000)
MY2017/18 USA Brazil China Others Total
Oct. 2017 53,076 0 601 185 53,862
Nov 32,574 0 2,544 2,116 37,234
Dec 36,532 0 1,216 401 38,150
Subtotal 122,182 0 4,361 2,702 129,246
MY2016/17a/ 83,713 0 4,608 7,277 95,598
Soybeans Total
MY2017/18 USA Brazil China Others Total
Oct. 2017 53,076 28,087 881 185 82,229
Nov 32,634 59,462 7,604 46,377 146,077
Dec 136,963 11,836 5,638 4,687 159,125
Subtotal 222,673 99,385 14,123 51,249 387,431

MY2016/17a/ 246,212 87,975 15,366 36,082 386,825
Source: Korea Customs Service (KCS)
a/ October – December 2016
Table 10
Korea: Crushing Soybean Imports by Origin
(Unit: MT)
Marketing Year (Oct/Sep) USA Brazil Paraguay Others Total
2007/08 374,940 552,887 20 0 927,847
2008/09 327,900 565,545 0 0 893,445
2009/10 492,776 431,715 0 0 924,491
2010/11 485,109 405,551 43,621 0 934,281
2011/12 173,447 418,292 194,915 0 786,654
2012/13 374,167 384,262 53,461 0 811,886
2013/14 372,504 455,920 101,853 0 930,277
2014/15 326,169 628,209 51,025 200 1,005,603
2015/16 291,894 573,836 134,769 120 1,000,661
2016/17 451,193 484,505 129,123 201 1,065,030
Source: Korea Customs Service (KCS)
a/ Paraguay
Food Use
The Korea Agro-Fishery and Food Trade Corporation (aT), the government’s state trading arm, controls
the bulk of marketing of non-GMO food-grade soybeans for food processing under its autonomous
WTO Tariff Rate Quota (TRQ). aT distributes soybeans to end-users and charges a mark-up that
supports domestic crop production and pays for some costs of handling and cleaning, which involves
removing any foreign material and broken soybeans upon arrival.
In preparation for its CY 2019 WTO TRQ-based procurement plan, aT forward contracted or purchased
170,000 MT of soybeans on basis trading contracts at the end of CY 2017, with delivery planned during
the first half of CY 2019. Accordingly, in MY 2018/19 imports of food-grade soybeans are forecast to
be 270,000 MT under the autonomous WTO TRQ and FTA TRQs, with the majority coming from the
United States followed by China, Canada and Australia. The United States is expected to retain 70 – 80
percent of the import market for food-use soybeans. The gains under the KORUS FTA have further
strengthened the U.S. position. U.S. food-grade soybeans are primarily used in products like tofu,
soybean paste/sauce and soymilk, while China mainly supplies soybeans for sprouting.
Despite the fact that the government hasn’t announced its CY 2018 autonomous WTO TRQ for food
grade soybeans yet, the volume of the WTO TRQ is estimated in the range between 230,000 and
250,000 MT. aT expects the government to release the TRQ in early March 2018, anticipating 83
percent for food processing, 12 percent for sprouting and five percent for import license for end-users
who can contract with soybean suppliers directly. In late 2016, under the CY 2018 TRQ regime, aT had
already purchased 170,000 MT through basis trading contracts from the United States for delivery
during the first half of CY 2018. The remainder will likely be purchased off the spot market sometime
in CY 2018, with delivery during the second half the year. Korea is also expected to import a total of
about 51,337 MT under 2018 FTA TRQs from the United States (28,137 MT), China (10,000 MT),
Australia (750 MT) and Canada (12,500 MT); that is, those countries which have FTA TRQ agreements
with Korea. Therefore, total imports of food-grade soybeans will be around 270,000 MT in CY 2018.
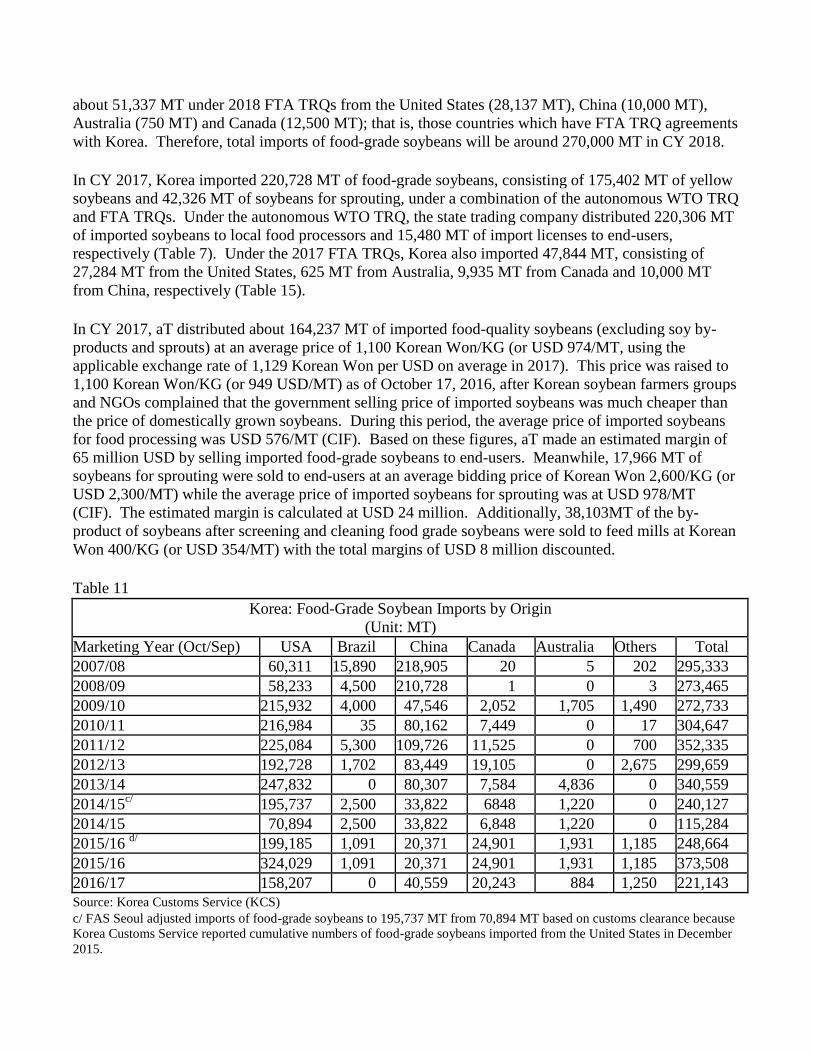
In CY 2017, Korea imported 220,728 MT of food-grade soybeans, consisting of 175,402 MT of yellow
soybeans and 42,326 MT of soybeans for sprouting, under a combination of the autonomous WTO TRQ
and FTA TRQs. Under the autonomous WTO TRQ, the state trading company distributed 220,306 MT
of imported soybeans to local food processors and 15,480 MT of import licenses to end-users,
respectively (Table 7). Under the 2017 FTA TRQs, Korea also imported 47,844 MT, consisting of
27,284 MT from the United States, 625 MT from Australia, 9,935 MT from Canada and 10,000 MT
from China, respectively (Table 15).
In CY 2017, aT distributed about 164,237 MT of imported food-quality soybeans (excluding soy by-
products and sprouts) at an average price of 1,100 Korean Won/KG (or USD 974/MT, using the
applicable exchange rate of 1,129 Korean Won per USD on average in 2017). This price was raised to
1,100 Korean Won/KG (or 949 USD/MT) as of October 17, 2016, after Korean soybean farmers groups
and NGOs complained that the government selling price of imported soybeans was much cheaper than
the price of domestically grown soybeans. During this period, the average price of imported soybeans
for food processing was USD 576/MT (CIF). Based on these figures, aT made an estimated margin of
65 million USD by selling imported food-grade soybeans to end-users. Meanwhile, 17,966 MT of
soybeans for sprouting were sold to end-users at an average bidding price of Korean Won 2,600/KG (or
USD 2,300/MT) while the average price of imported soybeans for sprouting was at USD 978/MT
(CIF). The estimated margin is calculated at USD 24 million. Additionally, 38,103MT of the by-
product of soybeans after screening and cleaning food grade soybeans were sold to feed mills at Korean
Won 400/KG (or USD 354/MT) with the total margins of USD 8 million discounted.
Table 11
Korea: Food-Grade Soybean Imports by Origin
(Unit: MT)
Marketing Year (Oct/Sep) USA Brazil China Canada Australia Others Total
2007/08 60,311 15,890 218,905 20 5 202 295,333
2008/09 58,233 4,500 210,728 1 0 3 273,465
2009/10 215,932 4,000 47,546 2,052 1,705 1,490 272,733
2010/11 216,984 35 80,162 7,449 0 17 304,647
2011/12 225,084 5,300 109,726 11,525 0 700 352,335
2012/13 192,728 1,702 83,449 19,105 0 2,675 299,659
2013/14 247,832 0 80,307 7,584 4,836 0 340,559
2014/15c/ 195,737 2,500 33,822 6848 1,220 0 240,127
2014/15 70,894 2,500 33,822 6,848 1,220 0 115,284
2015/16 d/
199,185 1,091 20,371 24,901 1,931 1,185 248,664
2015/16 324,029 1,091 20,371 24,901 1,931 1,185 373,508
2016/17 158,207 0 40,559 20,243 884 1,250 221,143
Source: Korea Customs Service (KCS)
c/ FAS Seoul adjusted imports of food-grade soybeans to 195,737 MT from 70,894 MT based on customs clearance because
Korea Customs Service reported cumulative numbers of food-grade soybeans imported from the United States in December
2015.

d/ FAS Seoul adjusted imports of food-grade soybeans to 199,185 MT from 324,029 MT to include cumulative numbers of
food-grade soybeans imported from the United States in December 2015.
Tariffs
The government is expected to announce the 2018 autonomous WTO TRQ in early March 2018, which
will be composed of 86 percent for food processing, nine percent for sprouting and five percent for
import licenses for end-users. The portion for import licenses will effectively allow end-users or
importers to bypass aT and buy from direct sources. The applicable in-quota tariff rate is five percent,
while the out-of-quota tariff rate is a prohibitive 487 percent, or 956 Korean won (or 0.85 USD) per kg,
whichever is greater (Table 17).
Under the KORUS-FTA, Korea established a zero-duty TRQ for 10,000 MT of food-grade identity-
preserved (IP) soybeans in the first year of the agreement (CY 2012), increasing to 20,000 MT in
CY2013 and 25,000 MT in CY2014. From 2015, the TRQ grows three percent annually in
perpetuity. Korea is expected to import 28,137 MT of IP soybeans from the United States under 2018
KORUS FTA TRQ (Table 12 & 14). The TRQ is administered by an association of food-grade soybean
processors, which gives U.S. suppliers direct market access to these processing companies (Table 13).
The KORUS FTA TRQ of 28,137 MT in CY 2018 has already been allocated to soybean processors as
shown in Table 13. The TRQ fill rate under the KORUS FTA reached almost 100 percent in CY 2017,
a distinct improvement from 35 percent in CY 2012. In CY 2017, Korean soybean processors
successfully imported 27,284 MT, nearly 100 percent of the 27,319 MT of the KORUS FTA TRQ by
securing IP food-grade soybeans through forward contracting with farmers (Table 13).
When the Korea-Canada FTA went into effect on January 1, 2015, Korea established a duty-free quota
for 5,000 MT of food-grade identity-preserved soybeans in the first year, increasing by 2,500 MT
annually up to 15,000 MT in 2019 (the first five years), and then continuing to increase by 400 MT
annually up to 17,000 MT in 2024 (the 10th
year). For years eleven and beyond, the in-quota quantity
will be fixed at 17,000 MT annually (Table 14). Accordingly, in CY 2018, Korea is expected to import
12,500 MT of Canadian IP soybeans under the FTA TRQ. In CY 2017, Korean soybean processors
imported 9,935 MT from Canada, a 99.4 percent FTA TRQ fill rate (Table 15).
Korea set up a duty-free quota for 500 MT of Australian food-grade IP soybeans in 2014 for the first
year when the Korea-Australia FTA took effect on December 12, 2014. An annual increment of 50 MT
meant 550 MT duty-free in 2015 (the second year), reaching 1,000 MT in 2024 (the eleventh year). The
in-quota quantity shall remain fixed at 1,000 MT for years 12 and beyond. In CY 2018, Korea is
expected to import 700 MT of Australian IP soybeans under the FTA TRQ. In CY 2017, Korean
soybean processors imported 625 MT from Australia or 96 percent of the FTA TRQ (Table 15).
Korea established a duty-free quota of 10,000 MT of Chinese food-grade IP soybeans under the Korea-
China FTA, effective on December 20, 2015. This quota consists of 7,000 MT for IP soybeans for food
processing and 3,000 MT for soybeans for sprouting, in perpetuity. In CY 2017, Korea imported 10,000
MT soybeans from China, 100 percent of the 10,000 MT FTA TRQ (Table 15).
Table 12
Korea: IP Soybeans Quota Allocation under KORUS FTA

(Metric Ton)
Calendar Year Allocation Imported Fill Rate (%)
2012 10,000 3,453 35
2013 20,000 12,046 60
2014 25,000 23,832 95
2015 25,750 25,293 98
2016 26,523 26,510 100
2017 27,319 27,284 100
2018 28,137 na na
Source: Korea Agro-Fishery & Food Trade Corporation (aT)
Table 13
Korea: KORUS FTA IP Soybeans Quota Allocation and Imports per Processor Association
(Metric Ton)
Trade Association of Food Soybeans Processors CY 2017 CY 2018
Allocation Import Allocation
Korea Federation of Tofu Coop.(KFTC) 9,490 9,490 9,829
Korea Jang Cooperative 5,360 5,328 5,363
Korea Foods Industry Association 3,950 3,947 4,190
Korea Soybean Foodstuffs Association 1,800 1,800 2,068
Korea Bean Curd Manufacture Coop. 2,570 2,570 2,575
Seoul Kyung In Beancurd Manufacture Cooperation 360 360 295
Korea Beansprout Association 3,070 3,070 3,042
Korea Dhyana Food Industry Cooperative 149 149 146
Seoul Soybean-Processed Foods Cooperative 540 540 537
Korea Bean Curd Manufacture Coop. 30 30 93
Total 27,319 27,284 28,138
Source: Korea Customs Service (KCS); Korea Agro-Fishery & Food Trade Corporation (aT)
Table 14
Korea: IP Soybeans TRQ Scheme under FTAs
(Metric Ton, Calendar Year)
Year 2014 2015 2016 2017 2018 2019 2020 2021 2022 2023 2024
USA 25,
000
25,7
50
26,5
23
27,3
19 28,1
37
28,9
81
29,8
51
30,7
47
31,6
69
32,6
19
33,5
98
Austra
lia
500 550 600 650 700 750 800 850 900 950 1,00
0
Canad
a
na 5,00
0
7,50
0
10,0
00 12,5
00
15,0
00
15,4
00
15,8
00
16,2
00
16,6
00
17,0
00
China na na 10,0
00
10,0
00 10,0
00
10,0
00
10,0
00
10,0
00
10,0
00
10,0
00
10,0
00
Total 25,500 31,3
00
44,6
23
47,9
69 51,3
37
54,7
31
56,0
51
57,3
97
58,7
69
60,1
69
61,5
98
Source: FAS/Seoul based on Korea’s FTAs

Table 15
Korea: Actual Imports of IP Soybeans by Supplier under FTA TRQ
(Metric Ton)
Calendar Year 2013 2014 2015 2016 2017
USA 12,046 23,832 25,293 26,510 27,284
Australia na 0 476 588 625
Canada na na 4,847 7,477 9,935
China na na 0 9,300 10,000
Total 12,046 23,832 30,616 43,875 47,844
Source: FAS/Seoul based on Korea’s FTAs
Production, Supply and Demand Data Statistics:
Soybean, Oilseed PS&D
Oilseed, Soybean 2016/2017 2017/2018 2018/2019
Market Begin Year Oct 2016 Oct 2017 Oct 2018
Korea, Republic of USDA
Official
New
Post
USDA
Official
New
Post
USDA
Official
New
Post
Area Planted 70 49 70 46 0 57
Area Harvested 49 49 67 46 0 57
Beginning Stocks 69 69 69 81 0 67
Production 75 75 120 86 0 100
MY Imports 1286 1286 1275 1270 0 1270
MY Imp. from U.S. 609 609 600 600 0 600
MY Imp. from EU 0 0 0 0 0 0
Total Supply 1430 1430 1464 1437 0 1437
MY Exports 0 0 0 0 0 0
MY Exp. to EU 0 0 0 0 0 0
Crush 1011 990 1000 1000 0 1000
Food Use Dom.
Cons.
300 308 320 320 0 320
Feed Waste Dom.
Cons.
50 51 50 50 0 50
Total Dom. Cons. 1361 1349 1370 1370 0 1370
Ending Stocks 69 81 94 67 0 67
Total Distribution 1430 1430 1464 1437 0 1437
CY Imports 1287 1287 1300 1300 0 1300
CY Imp. from U.S. 585 585 620 600 0 600
CY Exports 0 0 0 0 0 0
CY Exp. to U.S. 0 0 0 0 0 0

Yield 1.5306 1.5306 1.791 1.8696 0 1.7544
(1000 HA) ,(1000 MT) ,(MT/HA)
Soybean Import Trade Matrix
Import Trade Matrix Country Korea, Republic of
Commodity Oilseed, Soybean Time Period OCT/SEP Units: 1,000MT
Imports for: 2015
2016
U.S. 491a/ U.S. 609
Others
Others Brazil 575 Brazil 485
China 20 China 41
Paraguay 135 Paraguay 129
Canada 25 Canada 20
Total for Others 755
675
Others not Listed 3
2
Grand Total 1249a/
1286
Source: Korea Customs Service (KCS)
a/ FAS/Seoul reflects statistical adjustment of food grade soybean imports.
Table 16
Korea: Oilseed Imports
(Metric Tons, USD1,000)
MY 2014/15 MY 2015/16 MY 2016/17
Volume Value Volume Value Volume Value
Soybean 1,245,730a/ 629,456
a/ 1,249,325
a/ 563,445
a/ 1,286,131 602,057
Peanuts 437 676 757 1,266 602 935
Copra 1,289 1,567 203 239 424 482
Linseed 1,700 1,404 8,531 7,533 3,204 2,795
Rapeseed 2,626 465 2,071 1,263 3,753 2,073
Sunflower Seed 3,695 6,515 3,547 5,608 3,710 5,406
Cotton Seed 173,236 64,121 153,219 48,092 157,003 47,297

Castor Bean 2 2 5 4 8 10
Sesame Seed 81,457 162,634 74,406 109,487 73,660 105,869
Mustard Seed 1,772 1,850 2,594 2,090 1,262 1,209
Safflower Seed 200 203 393 235 360 242
Perilla Seed 26,726 52,388 25,294 39,091 24,976 31,635
Others 3,781 5,837 6,720 34,009 6,386 29,295
Total 1,542,651a/ 927,118
a/ 1,527,065
a/ 812,362
a/ 1,561,479 829,305
Source: Korea Customs Service
a/ FAS/Seoul reflects statistical adjustment of food grade soybean imports.
Table 17
Korea: Applied Tariff Schedule for Oilseeds
(Percent)
Commodity H.S. Code 2016 2017 2018
Soybean, Seed 1201.10.xxxx 3 3 3
Soybean, Crushing 1/ 1201.90.1000 3(0) 3(0) 3(0)
Soybean, Feed 1/ 1201.90.2000 3(0) 3(0) 3(0)
Soybean, Sprouting 2/ 1201.90.3000 3(5) 3(5) 3(5)
Soybean, Food Grade 2/ 1201.90.9000 3(5) 3(5) 3(5)
Peanuts, Seed, in shell 1202.30.1000 40 40 40
Peanuts, Seed, shelled 1202.30.1000 24 24 24
Peanuts, in Shell 3/ 1202.41.0000 40 40 40
Peanuts, Shelled 3/ 1202.42.0000 24 24 24
Copra 1203.00.0000 3 3 3
Linseed 1204.00.0000 3 3 3
Rapeseed 1205.xx.xxxx 10 10 10
Sunflower Seed 1206.00.0000 25 25 25
Cottonseed 4/ 1207.29.1000 2 (0) 2 (0) 2 (0)
Sesame Seed 5/ 1207.40.0000 40 40 40
Mustard Seed 1207.50.0000 3 3 3
Perilla Seed 6/ 1207.99.1000 40 40 40
Castor Beans 1207.99.4000 3 3 3
Safflower Seed 1207.99.5000 3 3 3
Others 1207.99.9000 3 3 3 Source: Korea Customs Research Institute, Tariff Schedules of Korea.
Note: The Seed Industry Act restricts imports of listed commodities for planting seed purposes.
1/The number in parenthesis is the in-quota autonomous TRQ tariff rate assessed on 1.5 million tons of soybeans imported
for crushing and feed purposes. The number not in parenthesis is the in-quota WTO TRQ tariff rate.
2/ applied duty rate of 5 percent for food grade soybeans imported and administered by the Korea Agro-Fishery & Food
Trade Corporation (aT) under the WTO TRQ. Soybeans imported out-of-quota by private importers will be assessed a tariff
rate of 487 percent or Korean won 956/Kg, whichever is greater.
3/The in-quota amount is 4,907.3 tons on a shelled basis. Peanuts imported out-of-quota are assessed a tariff of 230.5
percent.
4/The number in parenthesis is the in-quota tariff rate assessed on all cotton seed for feed in the CY 2018.
5/The in-quota amount under the WTO TRQ is 6,731 tons. Sesame imported out-of-quota is assessed a tariff of 630 percent
or Korean won 6,660/Kg, whichever is greater.
6/ 40 percent or Korean won 410/Kg, whichever is greater.

Commodities:
Production:
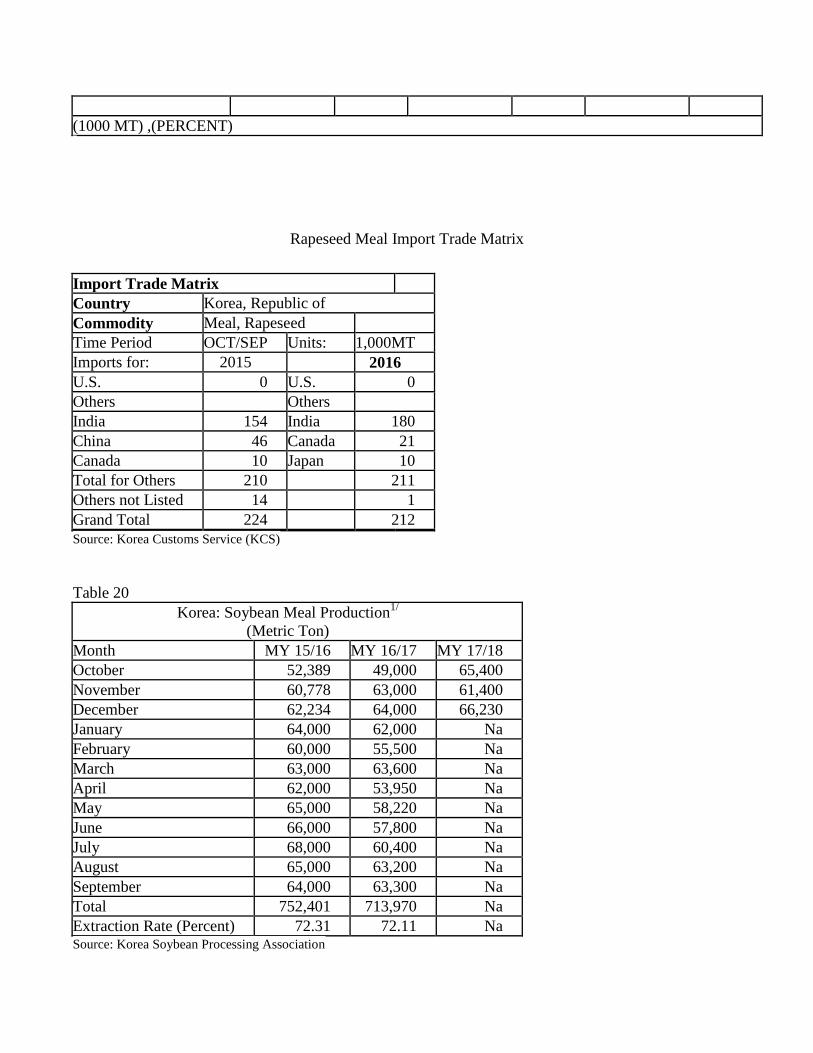
Essentially all of the vegetable meal produced in Korea is made from imported soybeans. Soybean meal
production in MY 2016/17 decreased to 784,000 MT (79.2 percent applicable extraction rate basis),
down five percent from the previous year, reflecting sluggish demand for poultry feed after the industry
was hit by a severe Highly Pathogenic Avian Influenza (HPAI) outbreak in November 2016 (KS1648).
There are only two soybean crushers in Korea, CJ Corporation and Sajo O&F Co Ltd, with a crushing
ratio of 65:35 percent. In MY 2017/18, CJ Corp’s crushing capacity remained unchanged at 2,100 MT
per day. Sajo O&F’s crushing capacity also remained unchanged from the previous year, at 1,100 MT
per day (Table 18).
MY 2018/19 demand for crushing soybeans will remain flat at 1 MMT as long as crushing margins
remain steady. Soybean demand for crushing is steady, equivalent to the country’s 1 MMT crushing
capacity. Soybean meal production for MY 2018/19 is forecast to hold steady at 792,000 MT with an
extraction rate of 79.2 percent and crude protein content at 44 percent.
MY 2017/18 soybean meal production is estimated at 792,000 MT, a slightly higher level compared to
the previous year based on better soybean crushing margins with reasonable soybean prices in the
international markets.
In an effort to strengthen their competitiveness against imported meal from South America, local
crushing companies have continued producing de-hulled hi-pro soybean meal with a 47-percent protein
content by blending U.S. and Brazilian soybeans. In 2017, production of de-hulled hi-pro, 47-percent
protein soybean meal remained stable at 24 percent of total soybean meal production to meet a constant
demand for this meal from feed millers who maintain formulas with high protein levels (Table 20).
The breakdown of production by company and product follows. In CY 2017, CJ produced 47-percent
protein de-hulled meal and 45-percent protein meal in a ratio of 35:65, slightly increasing the
production of 47-percent protein meal from the previous 34:66 ratio. However, Sajo produced 46-
percent and 45-percent protein meal at a ratio of 59:41, decreasing the production of 46-percent protein
meal, in view of their previous 62:38 ratio.
This change was made because some feed millers preferred using higher protein meal to produce
compound feed for poultry and swine in recognition of the feed value of hi-pro meals. The
USSEC/Seoul office continues to educate Korean feed millers about the economic value of hi-pro
meals.
Meal, Rapeseed
Meal, Soybean
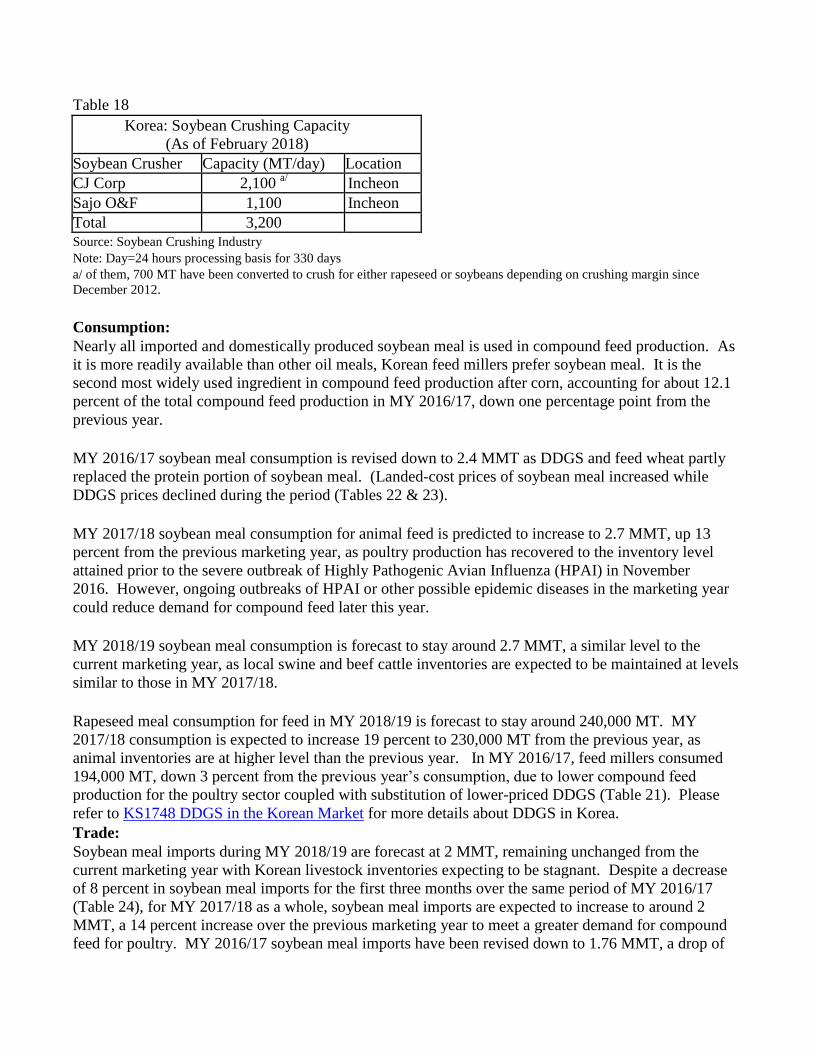
Table 18
Korea: Soybean Crushing Capacity
(As of February 2018)
Soybean Crusher Capacity (MT/day) Location
CJ Corp 2,100 a/ Incheon
Sajo O&F 1,100 Incheon
Total 3,200
Source: Soybean Crushing Industry
Note: Day=24 hours processing basis for 330 days
a/ of them, 700 MT have been converted to crush for either rapeseed or soybeans depending on crushing margin since
December 2012.
Consumption:
Nearly all imported and domestically produced soybean meal is used in compound feed production. As
it is more readily available than other oil meals, Korean feed millers prefer soybean meal. It is the
second most widely used ingredient in compound feed production after corn, accounting for about 12.1
percent of the total compound feed production in MY 2016/17, down one percentage point from the
previous year.
MY 2016/17 soybean meal consumption is revised down to 2.4 MMT as DDGS and feed wheat partly
replaced the protein portion of soybean meal. (Landed-cost prices of soybean meal increased while
DDGS prices declined during the period (Tables 22 & 23).
MY 2017/18 soybean meal consumption for animal feed is predicted to increase to 2.7 MMT, up 13
percent from the previous marketing year, as poultry production has recovered to the inventory level
attained prior to the severe outbreak of Highly Pathogenic Avian Influenza (HPAI) in November
2016. However, ongoing outbreaks of HPAI or other possible epidemic diseases in the marketing year
could reduce demand for compound feed later this year.
MY 2018/19 soybean meal consumption is forecast to stay around 2.7 MMT, a similar level to the
current marketing year, as local swine and beef cattle inventories are expected to be maintained at levels
similar to those in MY 2017/18.
Rapeseed meal consumption for feed in MY 2018/19 is forecast to stay around 240,000 MT. MY
2017/18 consumption is expected to increase 19 percent to 230,000 MT from the previous year, as
animal inventories are at higher level than the previous year. In MY 2016/17, feed millers consumed
194,000 MT, down 3 percent from the previous year’s consumption, due to lower compound feed
production for the poultry sector coupled with substitution of lower-priced DDGS (Table 21). Please
refer to KS1748 DDGS in the Korean Market for more details about DDGS in Korea.
Trade:
Soybean meal imports during MY 2018/19 are forecast at 2 MMT, remaining unchanged from the
current marketing year with Korean livestock inventories expecting to be stagnant. Despite a decrease
of 8 percent in soybean meal imports for the first three months over the same period of MY 2016/17
(Table 24), for MY 2017/18 as a whole, soybean meal imports are expected to increase to around 2
MMT, a 14 percent increase over the previous marketing year to meet a greater demand for compound
feed for poultry. MY 2016/17 soybean meal imports have been revised down to 1.76 MMT, a drop of

17 percent from the previous year due to a greater decline in compound feed production for poultry
affected by HPAI in November 2016.
Rapeseed meal imports during MY 2018/19 are forecast at 250,000 MT, remaining unchanged from the
current marketing year to meet normal demand for feed production. In MY 2017/18, rapeseed meal
imports are expected to increase slightly due to constant demand from the feed sector. Korean feed
millers imported 212,026 MT of rapeseed meal in MY 2016/17, down five percent from the previous
marketing year due to a lack of availability from India, along with a bearish international soybean meal
market which took hold in 2015. India has been the major supplier of rapeseed meal to Korea, followed
by Canada and Japan, and it will remain the top supplier for the foreseeable future.
Palm kernel meal and copra meal imports are forecast to remain major protein resources for animal feed
in both MY 2017 and MY 2018. DDGS imports are also forecast to be strong to meet a greater demand
for vegetable protein from feed sectors in Korea (Table 22).
The CY 2018 autonomous soybean meal WTO TRQ is set at 2.451 MMT with a zero percent in-quota
import duty, unchanged from the previous year. The CY 2018 WTO TRQ for DDGS is set at unlimited
volume, with a zero percent in-quota import duty for countries under FTAs. In order to help the
livestock industry, the Korean government has maintained an autonomous zero-duty TRQ for other
vegetable protein meals such as cottonseed meal and cottonseed hulls. TRQ volumes for copra meal
and palm kernel meal were eliminated when the zero duty under the Korean-ASEAN FTA was
implemented.
Under the Korean-ASEAN FTA, copra and palm kernel meals are imported duty free from South East
Asian countries such as Indonesia, Malaysia and the Philippines. Indian soybean meal is imported duty
free under the Korea-India Comprehensive Economic Partnership Agreement (CEPA). As part of the
KORUS FTA, Korea eliminated import duties on vegetable protein meals such as soybean meal
(2304.00.0000), DDGS (2303.30.0000), and cottonseed meal (2306.10.0000) since March 15, 2012.
Export
Korea exports some locally-crushed soybean meal that is less competitive than imported meal. Soybean
meal exports for MY 2018/19 are forecast to remain unchanged from the current marketing year’s
estimate of 100,000 MT. The major markets for Korean soybean meal are Japan, followed by China,
Vietnam and Malaysia, countries where there are overseas feed mills established by Korean crushers
(Table 19).
Table 19
Korea: Soybean Meal Exports
(Metric Ton)
Country MY 14/15 MY 15/16 MY 16/17
Japan 104,210 61,312 89,038
Vietnam 5,720 12,040 3,480
Malaysia 600 600 407
Philippine 160 180 180
China 0 986 6,840

Cambodia 864 0 0
Others 566 519 371
Total 112,136 75,637 100,316
Source: Korea Customs Service
Production, Supply and Demand Data Statistics:
Soybean Meal PS&D
Meal, Soybean 2016/2017 2017/2018 2018/2019
Market Begin Year Oct 2016 Oct 2017 Oct 2018
Korea, Republic of USDA
Official
New
Post
USDA
Official
New
Post
USDA
Official
New
Post
Crush 1011 990 1000 1000 0 1000
Extr. Rate,
999.9999
0.7864 0.7919 0.795 0.792 0 0.792
Beginning Stocks 304 304 88 219 0 191
Production 795 784 795 792 0 792
MY Imports 1764 1764 2000 2000 0 2000
MY Imp. from U.S. 9 7 5 50 0 50
MY Imp. from EU 0 0 0 0 0 0
Total Supply 2863 2852 2883 3011 0 2983
MY Exports 100 100 100 100 0 100
MY Exp. to EU 0 0 0 0 0 0
Industrial Dom.
Cons.
0 0 0 0 0 0
Food Use Dom.
Cons.
25 20 20 20 0 20
Feed Waste Dom.
Cons.
2650 2513 2680 2700 0 2700
Total Dom. Cons. 2675 2533 2700 2720 0 2720
Ending Stocks 88 219 83 191 0 163
Total Distribution 2863 2852 2883 3011 0 2983
(1000 MT) ,(PERCENT)
Soybean Meal Import Trade Matrix
Import Trade Matrix Country Korea, Republic of
Commodity Meal, Soybean Time Period OCT/SEP Units: 1,000MT

Imports for: 2015
2016
U.S. 8 U.S. 7
Others
Others Brazil 1437 Brazil 1443
Argentina 548 Argentina 217
China 45 China 28
India 40 India 51
Total for Others 2070
1739
Others not Listed 26
1
Grand Total 2104
1747 Source: Korea Customs Service (KCS)
Note: H.S. 2304 only
Rapeseed Meal PS&D
Meal, Rapeseed 2016/2017 2017/2018 2018/2019
Market Begin Year Oct 2016 Oct 2017 Oct 2018
Korea, Republic of USDA
Official
New
Post
USDA
Official
New
Post
USDA
Official
New
Post
Crush 5 5 5 5 0 5
Extr. Rate,
999.9999
0.6 0.6 0.6 0.6 0 0.6
Beginning Stocks 25 25 16 26 0 29
Production 3 3 3 3 0 3
MY Imports 212 212 200 250 0 250
MY Imp. from U.S. 0 0 0 0 0 0
MY Imp. from EU 0 0 0 0 0 0
Total Supply 240 240 219 279 0 282
MY Exports 0 0 0 0 0 0
MY Exp. to EU 0 0 0 0 0 0
Industrial Dom.
Cons.
50 20 50 20 0 20
Food Use Dom.
Cons.
0 0 0 0 0 0
Feed Waste Dom.
Cons.
174 194 156 230 0 240
Total Dom. Cons. 224 214 206 250 0 260
Ending Stocks 16 26 13 29 0 22
Total Distribution 240 240 219 279 0 282
(1000 MT) ,(PERCENT)
Rapeseed Meal Import Trade Matrix
Import Trade Matrix Country Korea, Republic of
Commodity Meal, Rapeseed Time Period OCT/SEP Units: 1,000MT
Imports for: 2015
2016
U.S. 0 U.S. 0
Others
Others India 154 India 180
China 46 Canada 21
Canada 10 Japan 10
Total for Others 210 211
Others not Listed 14 1
Grand Total 224
212
Source: Korea Customs Service (KCS)
Table 20
Korea: Soybean Meal Production1/
(Metric Ton)
Month MY 15/16 MY 16/17 MY 17/18
October 52,389 49,000 65,400
November 60,778 63,000 61,400
December 62,234 64,000 66,230
January 64,000 62,000 Na
February 60,000 55,500 Na
March 63,000 63,600 Na
April 62,000 53,950 Na
May 65,000 58,220 Na
June 66,000 57,800 Na
July 68,000 60,400 Na
August 65,000 63,200 Na
September 64,000 63,300 Na
Total 752,401 713,970 Na
Extraction Rate (Percent) 72.31 72.11 Na Source: Korea Soybean Processing Association

1/ based on crushers’ applicable extraction rate
Table 21
Korea: Feed Ingredients for Animal Use
(October/September Basis)
Items MY 2014/2015 MY 2015/2016 MY 2016/2017
1,000 MT Percent 1,000
MT
Percent 1,000
MT
Percent
Total Grains and Grain
Substitution
12,046 63.4 12,395 63.8 12,116 63.9
- Wheat 1,480 7.8 1,910 9.8 2,025 10.7
- Corn 8,035 42.3 7,841 40.4 7,031 37.1
- Others 2,531 13.3 2,644 13.6 3,060 16.1
Total Vegetable Protein 4,867 25.6 4,937 25.4 4,764 25.1
- Soybean Meal 1/ 2,272 12.0 2,531 13.0 2,296 12.1
- Rapeseed Meal 489 2.6 200 1.0 194 1.0
- Cottonseed Meal 1 0.0 0 0.0 1 0.0
- Palm Kernel Meal 686 3.6 721 3.7 738 3.9
-Copra Meal 403 2.1 317 1.6 203 1.1
-Sesame Meal 33 0.2 37 0.2 32 0.2
-Perilla seed Meal 1 0.0 3 0.0 1 0.0
-Corn Gluten Meal 82 0.4 71 0.4 68 0.4
DDGS 654 3.4 779 4.0 945 5.0
- Others 246 1.3 274 1.4 286 1.4
Total Animal Protein 189 1.0 205 1.1 184 1.0
- Fish meal 18 0.1 15 0.1 14 0.1
-Meat & Bone Meal 24 0.1 30 0.2 23 0.1
-Others 147 0.8 160 0.8 147 0.8
Total Others 1,895 10.0 1,886 9.7 1,896 10.0
TOTAL COMPOUND FEED 18,997 100.0 19,423 100.0 18,960 100.0 Source: Korea Feed Association
1/ include dehullled locally processed soybean meal
Table 22
Korea: Imports of Major Protein Meals
(October/September)
MY 2014/015 MY 2015/016 MY 2016/017
Volume
(MT)
Value
(1,000USD)
Volume
(MT)
Value
(1,000USD)
Volume
(MT)
Value
(1,000USD)
Soybean Meal 1,735,694 834,364 2,104,092 807,293 1,747,046 687,196
Rapeseed Meal 499,300 137,364 223,484 67,095 212,026 58,085
Fish Meal 47,933 96,092 49,910 86,077 48,812 84,409

Bone Meal 279 302 246 399 322 471
Cottonseed Meal 12,851 5,940 10,281 5,248 12,351 5,638
Sunflower Seed
Meal 1,559 631 3,747 1,200 8,668 2,154
Copra Meal 415,632 81,495 289,902 53,437 210,406 40,952
Palm Kernel Meal 727,855 92,968 724,064 76,744 789,602 92,382
Corn Germ Meal 6,022 1,508 27,507 4,914 25,708 5,009
Others 391,038 52,327 465,317 53,698 391,178 34,595
Total 3,838,298 1,303,061 3,898,550 1,156,105 3,446,217 1,010,992
DDGS 656,307 160,458 849,401 185,831 1,036,935 203,325 Source: Korean Customs Service (KCS)
Table 23
Korea: Price Comparison of Major Imported Protein Meals
(USD/MT, CIF, Arrival Basis on annual average)
MY 2011 MY 2012 MY 2013 MY 2014 MY 2015 MY 2016
Soybean Meal 426.32 543.00 549.23 480.71 383.68 393.35
Rapeseed Meal 232.98 337.98 276.47 275.11 300.22 273.95
Fish Meal 1,558.53 1,776.74 1,654.13 2,004.71 1,724.64 1,729.27
Bone Meal 1,530.36 1,567.31 1,305.88 1,082.44 1,621.95 1,462.73
Cottonseed Meal 330.39 424.89 479.07 462.22 510.46 456.48
Sunflower Seed Meal 408.85 416.46 424.81 404.75 320.26 248.50
Copra Meal 227.14 224.27 261.21 196.07 184.33 194.63
Palm Kernel Meal 147.74 182.12 189.55 127.73 105.99 117.00
Corn Germ Meal 266.46 302.48 306.84 250.42 178.65 194.84
Others 144.04 134.01 127.40 133.82 115.16 88.44
DDGS 305.61 348.62 320.18 244.49 218.78 196.08 Source: Korean Customs Service (KCS)
Table 24
Korea: Soybean Meal Imports for Oct.-Dec. by Origin
(Unit: MT, H.S. 2304 basis)
MY 2017/18 USA Brazil Argentina India China Others Total
Oct. 2017 0 127,949 0 3,983 721 175 132,828
Nov 334 131,839 0 6,695 358 159 139,385
Dec 73 177,254 5,000 4,714 443 0 187,483
Subtotal 407 437,042 5,000 15,392 1,522 334 459,697
MY 2016/17 a/ 3,124 383,542 89,866 7,765 17,041 0 501,339 Source: Korea Customs Service (KCS)
a/ October – December 2016
Table 25

Korea: Compound Feed Production
(October/September, 1,000 MT)
Animal Type MY 2015/16 MY 2016/17 MY 2017/18a/
Poultry 5,797 5,402 5,700
Swine 6,247 6,327 6,400
Cattle 5,820 5,807 5,850
Others b/
1,529 1,381 1,400
Sub. Total 19,393 18,917 19,350
Aquaculture 132 148 150
Milk Substitute 51 52 55
Grand Total 19,576 19,117 19,555 Source: Korea Feed Association (KFA), Ministry for Agriculture, Food, and Rural Affairs (MAFRA)
a/ FAS/ Seoul forecast
b/ include ducks, pet food, rabbit, horse, sheep, deer, quail etc.
Table 26
Korea: Animal Inventory (1,000 Head, 1,000 Birds, as of January 2018)
Animal Year March June September December
Beef Cattle 2014 3,083 3,149 3,103 3,028
2015 2,896 2,984 2,996 2,909
2016 2,821 2,996 3,016 2,963
2017 2,885 3,034 3,120 2,997
Dairy Cattle 2014 437 436 442 445
2015 439 433 430 428
2016 425 420 421 418
2017 416 414 411 409
Swine 2014 9,698 9,680 9,966 10,090
2015 9,971 10,018 10,332 10,187
2016 10,315 10,355 10,699 10,367
2017 10,328 10,432 10,782 10,514
Layer a/ 2014 64,572 62,851 65,263 67,674
2015 68,878 67,907 72,090 71,877
2016 70,177 68,281 69,853 71,043
2017 51,608 57,383 67,833 72,710
Broiler b/ 2014 77,879 103,593 75,846 77,746
2015 82,749 110,489 81,184 81,851
2016 86,541 101,014 76,420 87,830
2017 79,332 104,205 80,546 85,436 Source: Korea Statistics (KOSTAT)
a/ Excluding breeders
b/ Excluding multi-use broilers
Table 27
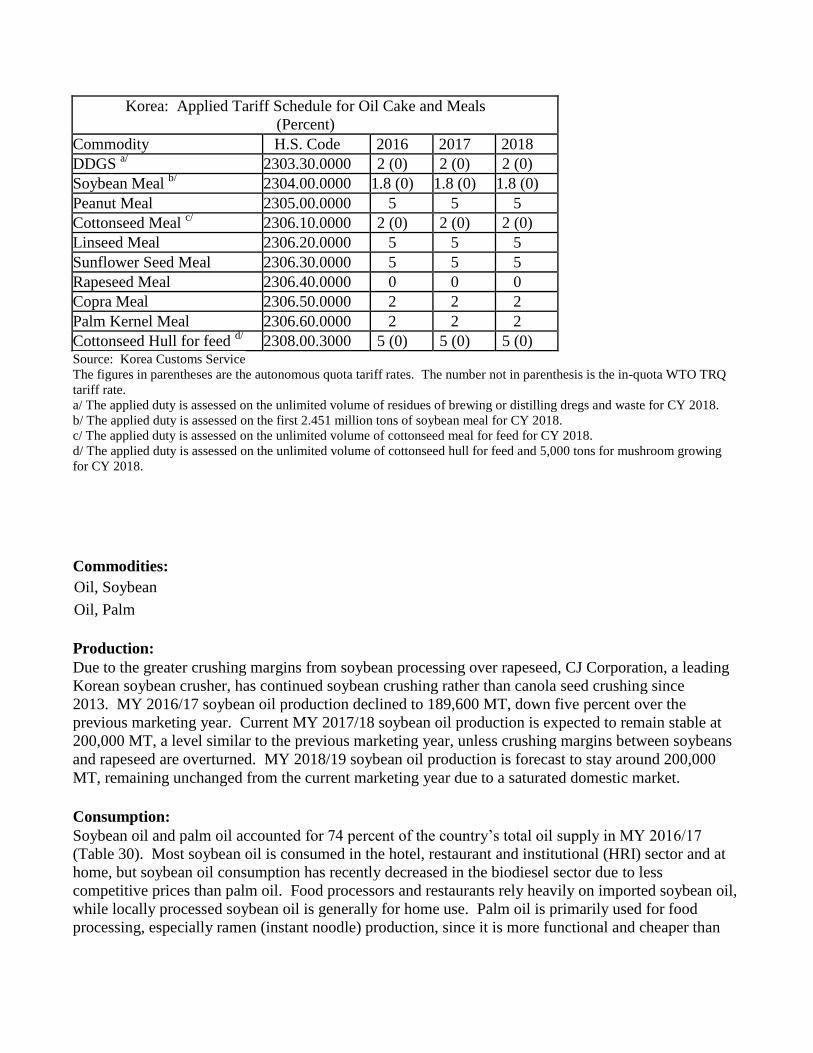
Korea: Applied Tariff Schedule for Oil Cake and Meals
(Percent)
Commodity H.S. Code 2016 2017 2018
DDGS a/ 2303.30.0000 2 (0) 2 (0) 2 (0)
Soybean Meal b/
2304.00.0000 1.8 (0) 1.8 (0) 1.8 (0)
Peanut Meal 2305.00.0000 5 5 5
Cottonseed Meal c/ 2306.10.0000 2 (0) 2 (0) 2 (0)
Linseed Meal 2306.20.0000 5 5 5
Sunflower Seed Meal 2306.30.0000 5 5 5
Rapeseed Meal 2306.40.0000 0 0 0
Copra Meal 2306.50.0000 2 2 2
Palm Kernel Meal 2306.60.0000 2 2 2
Cottonseed Hull for feed d/
2308.00.3000 5 (0) 5 (0) 5 (0) Source: Korea Customs Service
The figures in parentheses are the autonomous quota tariff rates. The number not in parenthesis is the in-quota WTO TRQ
tariff rate.
a/ The applied duty is assessed on the unlimited volume of residues of brewing or distilling dregs and waste for CY 2018.
b/ The applied duty is assessed on the first 2.451 million tons of soybean meal for CY 2018.
c/ The applied duty is assessed on the unlimited volume of cottonseed meal for feed for CY 2018.
d/ The applied duty is assessed on the unlimited volume of cottonseed hull for feed and 5,000 tons for mushroom growing
for CY 2018.
Commodities:
Production:
Due to the greater crushing margins from soybean processing over rapeseed, CJ Corporation, a leading
Korean soybean crusher, has continued soybean crushing rather than canola seed crushing since
2013. MY 2016/17 soybean oil production declined to 189,600 MT, down five percent over the
previous marketing year. Current MY 2017/18 soybean oil production is expected to remain stable at
200,000 MT, a level similar to the previous marketing year, unless crushing margins between soybeans
and rapeseed are overturned. MY 2018/19 soybean oil production is forecast to stay around 200,000
MT, remaining unchanged from the current marketing year due to a saturated domestic market.
Consumption:
Soybean oil and palm oil accounted for 74 percent of the country’s total oil supply in MY 2016/17
(Table 30). Most soybean oil is consumed in the hotel, restaurant and institutional (HRI) sector and at
home, but soybean oil consumption has recently decreased in the biodiesel sector due to less
competitive prices than palm oil. Food processors and restaurants rely heavily on imported soybean oil,
while locally processed soybean oil is generally for home use. Palm oil is primarily used for food
processing, especially ramen (instant noodle) production, since it is more functional and cheaper than
Oil, Palm
Oil, Soybean

soybean oil. Palm oil has been increasingly used in local biodiesel production. Please refer to KS1801
for additional details on the vegetable oils market in Korea.
Soybean oil consumption in MY 2018/19 is forecast at 495,000 MT, unchanged from the current
marketing year’s estimate because of tapering demand for soybean oil used in bio-diesel production, as
it is less cost effective than palm oil. Meanwhile, palm oil consumption during this period is forecast at
560,000 MT, up two percent from the current marketing year because of increasing demand from the
bio-diesel sector, and stable demand from other food processing sub-sectors. Palm oil consumption in
the current marketing year (MY 2017/18) is expected to increase to 550,000 MT, up five percent from
the previous year due to the increasing mandate of biodiesel to three percent in CY 2018 from the
previous 2.5 percent minimum.
Trade:
The biodiesel sector has been the main driver behind rising edible oil imports since MY
2007/08. However, MY 2018/19 soybean oil imports are forecast at 310,000 MT, unchanged from the
current marketing year’s estimate, due to lowered demand for biodiesel caused by comparatively
cheaper palm oil. In MY 2017/18, soybean oil imports are expected to remain at 310,000 MT,
unchanged from the previous year.
Soybean oil imported from South America, particularly Argentina, was much more price-competitive
than domestically-produced soybean oil made from imported soybeans. However, U.S. soybean oil
exporters’ market share has risen from 19 percent in MY 2014/15 to 47 percent in MY 2016/17 by
taking market share from Argentina in recent years. Three reasons influenced the Korean buyers’ pivot
to U.S. soybean oil. First, Argentinian drought conditions caused the oil content of their soybeans to
fall. Second, Korean end users prefer colorless oil, but the Argentinian oil has a red tint. Third, the
KORUS FTA reduced the tariff on U.S. soybean oil from 2.7 percent in 2016 to 2.16 percent in
2017. The applicable tariff on U.S. soybean oils in 2018 is 1.62 percent with the out-of-quota rate at
five percent. (The KORUS FTA annually cuts tariff rates on American oil exports over a ten-year period
before reaching zero in 2021.)
In MY 2018/19, palm oil imports are forecast to increase to 560,000 MT, up two percent from the
current marketing year mainly due to rising demand from the biodiesel industry. The Korean
government has implemented revised regulations increasing the mandatory inclusion rate from 2.5
percent to three percent from 2018 through 2020. Palm oil imports for biodiesel are expected to reach
550,000 MT, up four percent in the current marketing year as it is more competitively-priced than other
oil-based feed stocks. Palm oil imports for use in the local soap industry are expected to remain steady
at 20,000 MT. In MY 2016/17, palm oil imports increased to 527,137 MT to meet demand for biodiesel
production, up ten percent from the previous year.
Palm oil has been imported duty free under the Korea-ASEAN FTA since June 2007.
Under the KORUS FTA, effective since March 2012, Korea’s 5.4 percent duty on imports of crude
soybean oil is scheduled to be phased out in 10 equal annual reductions. Meanwhile, the 5.4 percent
rate on refined soybean oil was phased out in five equal annual reductions. Since 2016, U.S. refined
soybean oil has been imported duty free. Korea also eliminated the import duty on palm oil
immediately under the KORUS FTA.
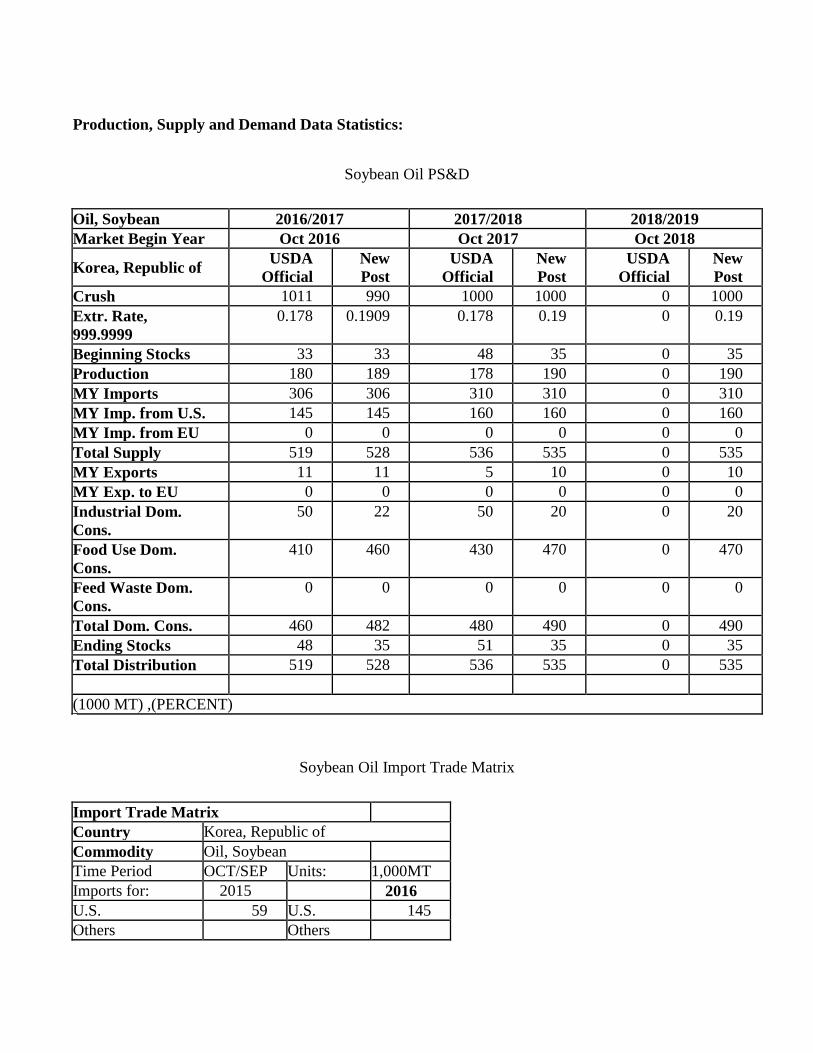
Production, Supply and Demand Data Statistics:
Soybean Oil PS&D
Oil, Soybean 2016/2017 2017/2018 2018/2019
Market Begin Year Oct 2016 Oct 2017 Oct 2018
Korea, Republic of USDA
Official
New
Post
USDA
Official
New
Post
USDA
Official
New
Post
Crush 1011 990 1000 1000 0 1000
Extr. Rate,
999.9999
0.178 0.1909 0.178 0.19 0 0.19
Beginning Stocks 33 33 48 35 0 35
Production 180 189 178 190 0 190
MY Imports 306 306 310 310 0 310
MY Imp. from U.S. 145 145 160 160 0 160
MY Imp. from EU 0 0 0 0 0 0
Total Supply 519 528 536 535 0 535
MY Exports 11 11 5 10 0 10
MY Exp. to EU 0 0 0 0 0 0
Industrial Dom.
Cons.
50 22 50 20 0 20
Food Use Dom.
Cons.
410 460 430 470 0 470
Feed Waste Dom.
Cons.
0 0 0 0 0 0
Total Dom. Cons. 460 482 480 490 0 490
Ending Stocks 48 35 51 35 0 35
Total Distribution 519 528 536 535 0 535
(1000 MT) ,(PERCENT)
Soybean Oil Import Trade Matrix
Import Trade Matrix Country Korea, Republic of
Commodity Oil, Soybean Time Period OCT/SEP Units: 1,000MT
Imports for: 2015
2016
U.S. 59 U.S. 145
Others
Others

Argentina 165 Argentina 117
Vietnam 16 Vietnam 27
Thailand 5
Total for Others 186
144
Others not Listed 5
17
Grand Total 250
306
Source: Korea Customs Service (KCS)
Palm Oil PS&D
Oil, Palm 2016/2017 2017/2018 2018/2019
Market Begin Year Oct 2016 Oct 2017 Oct 2018
Korea, Republic of USDA
Official
New
Post
USDA
Official
New
Post
USDA
Official
New
Post
Area Planted 0 0 0 0 0 0
Area Harvested 0 0 0 0 0 0
Trees 0 0 0 0 0 0
Beginning Stocks 54 54 71 61 0 61
Production 0 0 0 0 0 0
MY Imports 527 527 530 550 0 560
MY Imp. from U.S. 0 0 0 0 0 0
MY Imp. from EU 0 0 0 0 0 0
Total Supply 581 581 601 611 0 621
MY Exports 0 0 0 0 0 0
MY Exp. to EU 0 0 0 0 0 0
Industrial Dom.
Cons.
255 300 265 330 0 340
Food Use Dom.
Cons.
255 220 265 220 0 220
Feed Waste Dom.
Cons.
0 0 0 0 0 0
Total Dom. Cons. 510 520 530 550 0 560
Ending Stocks 71 61 71 61 0 61
Total Distribution 581 581 601 611 0 621
CY Imports 507 507 520 550 0 560
CY Imp. from U.S. 0 0 0 0 0 0
CY Exports 0 0 0 0 0 0
CY Exp. to U.S. 0 0 0 0 0 0
Yield 0 0 0 0 0 0

(1000 HA) ,(1000 TREES) ,(1000 MT) ,(MT/HA)
Palm Oil Import Trade Matrix
Import Trade Matrix Country Korea, Republic of
Commodity Oil, Palm Time Period OCT/SEP Units: 1,000MT
Imports for: 2015
2016
U.S. 0 U.S. 0
Others
Others Malaysia 267 Malaysia 267
Indonesia 212 Indonesia 258
Total for Others 479
525
Others not Listed 1
2
Grand Total 480
527 Source: Korea Customs Service (KCS)
Table 28
Korea: Domestic Production of Vegetable Oils1/
(Metric Ton)
Commodities MY 2014/15 MY 2015/16 MY 2016/17
Soybean Oil 195,300 199,500 189,600
Corn Oil 47,443 49,719 51,520
Sesame Oil 23,404 21,521 21,809
Rice Bran Oil 10,000 10,000 10,000
Rapeseed Oil 1,523 1,290 1,996
Perilla Seed Oil 27,994 30,491 30,200
Total 305,664 312,521 306,315 Source: Foreign Agriculture Service, Seoul, Korea
1/ FAS/Seoul estimates
Table 29
Korea: Soybean Oil Production
(Metric Ton)
Month MY 15/16 MY 16/17 MY 17/18
October 14,100 13,000 18,000
November 16,700 17,000 16,800
December 16,700 17,000 17,790
January 17,000 16,500 Na

February 16,000 14,600 Na
March 16,000 16,300 Na
April 17,000 14,700 Na
May 17,000 13,900 Na
June 17,000 15,500 Na
July 18,000 16,300 Na
August 17,000 17,300 Na
September 17,000 17,500 Na
Total 199,500 189,600 Na
Extraction Rate 19.17% 19.15 Na Source: Korea Soybean Processing Association (KSPA)
Table 30
Korea: Total Supply of Edible Oils
(Metric Ton)
Commodity MY 2014/15 MY 2015/16 MY 2016/17
Soybean Oil 452,770 449,298 496,005
Palm Oil 445,071 479,503 527,137
Corn Oil 51,026 53,910 58,319
Rapeseed Oil 102,915 116,764 128,870
Coconut Oil 50,432 41,411 42,787
Olive Oil 13,326 12,908 13,378
Cottonseed Oil 245 326 204
Sesame Oil 23,710 22,003 22,519
Rice Bran Oil 23,755 22,967 22,273
Perilla Seed Oil 29,009 31,346 31,066
Fish Oil 8,363 6,552 8,162
Sunflower Oil 25,207 26,849 25,265
Total 1,225,829 1,263,837 1,375,985 Source: Foreign Agriculture Service, Seoul, Korea
Table 31
Korea: Fats and Oils Imports
(MT & US$1,000, Oct/Sep)
Commodity MY 2014/15 MY 2015/16 MY 2016/17
Volume Value Volume Value Volume Value
Palm Oil 445,072 299,371 479,503 291,130 527,137 374,846
Tallow 22,971 16,055 12,512 7,817 10,824 8,025
Lard 93 79 1 3 4 8
Coconut Oil 49,852 63,463 41,042 69,050 42,596 76,108
Cottonseed Oil 245 380 326 499 204 362
Fish Oil 7,363 13,705 5,552 12,429 7,162 12,205
Soy Oil 257,472 220,071 249,798 191,436 306,405 260,717
Corn Oil 3,583 3,255 4,191 3,736 6,799 6,278

Rapeseed Oil 101,392 89,916 115,474 90,711 126,874 107,869
Palm Kernel Oil 9,346 10,604 3,584 4,251 8,091 11,625
Rice Bran Oil 13,755 20,114 12,967 19,027 12,273 18,611
Castor Oil 7,420 11,096 7,775 10,177 9,133 13,975
Linseed Oil 6,197 9,756 6,073 8,566 5,645 6,608
Sunflower Oil 25,207 33,727 26,849 32,281 25,265 30,243
Safflower Oil 103 347 72 273 70 349
Olive Oil 13,326 55,952 12,908 57,847 13,378 64,547
Jojoba Oil 39 879 60 1,285 63 1,302
Peanut Oil 26 129 14 88 23 142
Sesame Oil 306 1,503 482 1,855 710 2,497
Perilla Oil 1,015 4,188 855 2,850 866 1,768
Camellia Oil 37 664 49 772 44 682
Babassu Oil 8 73 13 132 15 144
Other Oil 13,472 45,492 10,227 40,317 10,555 42,899
Total 978,297 900,818 990,327 846,532 1,114,136 1,041,810 Source: Korea Customs Service (KCS)
Table 32
Korea: Soybean Oil Imports for Oct.-Dec. by Origin
(Unit: MT)
MY 2017/18 USA Argentina Brazil Vietnam Others Total
Oct. 2017 6,962 6,209 0 0 795 13,966
Nov 18,791 5,198 0 0 1166 25,155
Dec 13,059 1,130 0 0 229 14,418
Subtotal 38,812 12,537 0 0 2190 53,539
MY2016/17 a/ 13,218 40,848 783 11,307 494 66,650 Source: Korea Customs Service (KCS)
a/ October – December 2016
Table 33
Korea: Applied Tariff Schedule For Fats And Oils
(Percent)
Commodity H.S. Code General Rate 2017 2018
Lard 1501.00.10xx 3 3 3
Beef Tallow 1502.00.10xx 2 2 2
Other Tallow 1502.00.90xx 3 3 3
Fish Oil 1504.xx.xxxx 3 3 3
Soybean Oil for Food, Crude 1507.10.1000 5 5 5
Soybean Oil For Biodiesel, Crude 1507.10.2000 5 5 5
Soybean Oil for Other, Crude 1507.10.9000 5 5 5
Soybean Oil for Food, Refined 1507.90.1010 5 5 5
Soybean Oil For Biodiesel, Refined 1507.90.1020 5 5 5
Soybean Oil for Other, Refined 1507.90.1090 5 5 5

Soybean Oil, Other 1507.90.9000 5 8 8
Peanut Oil 1508.xx.xxxx 27 27 27
Olive Oil 1509.xx.xxxx 5 5 5
Palm Crude Oil 1511.10.0000 3 3 3
Palm Oil 1511.90.xxxx 2 2 2
Sunflower Oil 1512.1x.xxxx 5 5 5
Safflower Oil 1512.1x.xxxx 5 5 5
Cotton Seed Oil 1512.2x.xxxx 5 5 5
Coconut Oil 1513.1x.xxxx 3 3 3
Palm Kernel Oil 1513.2x.xxxx 8 8 8
Rapeseed Oil, Crude 1514.11.0000 5 5 5
Rapeseed Oil, Refined 1514.19.xxxx 5 5 5
Rapeseed Oil, Other, Crude 1514.91.1000 5 5 5
Linseed Oil 1515.1x.xxxx 5 5 5
Corn Oil 1515.2x.xxxx 5 5 5
Castor Oil 1515.30.xxxx 5 8 8
Tung Oil 1515.90.9040 8 8 8
Sesame Oil 1/
1515.50.0000 40 40 40
Perilla Seed Oil 1515.90.1000 36 36 36
Rice Bran Oil 1515.90.9010 5 5 5
Other, Crude 1515.90.9090 5 5 5 Source: Korea Customs Research Institute, Tariff Schedules for Korea
1/ In-Quota tariff rate under the WTO TRQ. Quota is 668 tons. The out-of-quota tariff rate is 630 percent or 12,060
Won/Kg, whichever is greater.