Embed Size (px)
Citation preview
Oil Spill Monitoring and Forecasting on the Prestige-Nassau Accident
P. Montero, J. Blanco, J.M. Cabanas, J. Maneiro, Y. Pazos and A. Moroño, Unidade de Observación Próxima – CPAM, Vilaxoán, Pontevedra, Spain
P. Montero, C.F. Balseiro, P. Carracedo, B. Gomez, E. Penabad and
V. Pérez-Muñuzuri MeteoGalicia – CMA, Santiago de Compostela, Spain
F. Braunschweig, R. Fernandes, P.C. Leitao and R. Neves MARETEC – IST, Lisboa
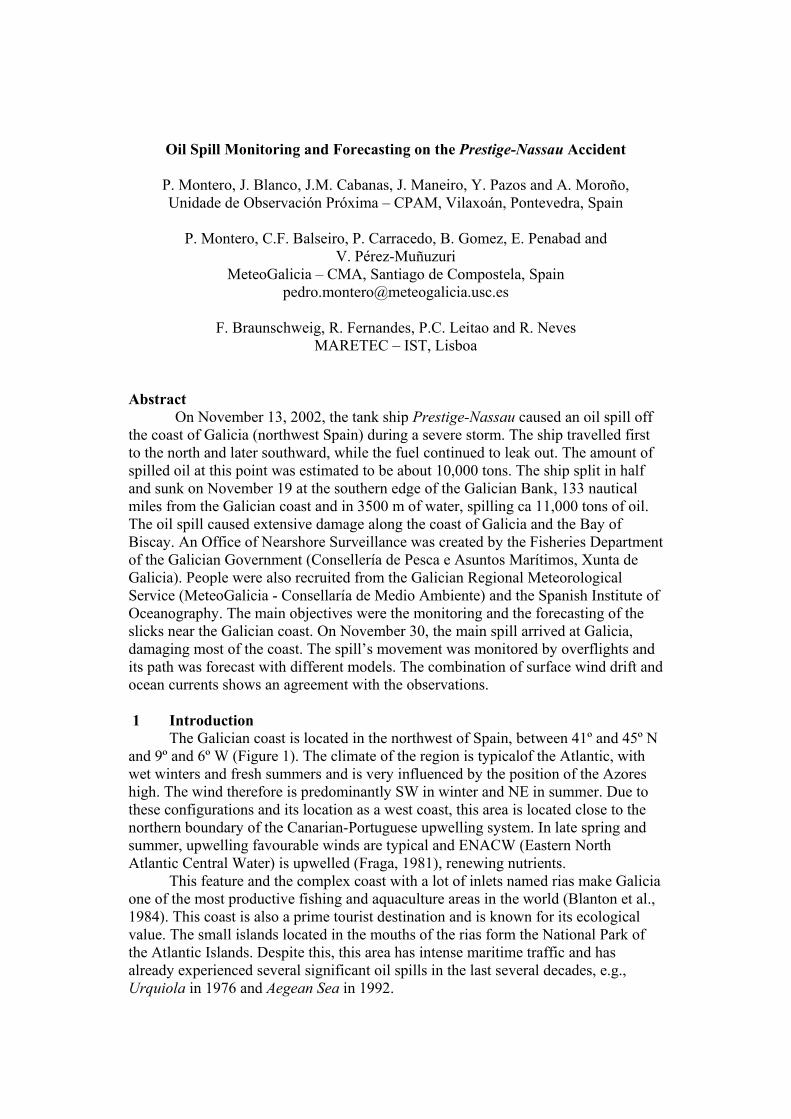
Abstract On November 13, 2002, the tank ship Prestige-Nassau caused an oil spill off the coast of Galicia (northwest Spain) during a severe storm. The ship travelled first to the north and later southward, while the fuel continued to leak out. The amount of spilled oil at this point was estimated to be about 10,000 tons. The ship split in half and sunk on November 19 at the southern edge of the Galician Bank, 133 nautical miles from the Galician coast and in 3500 m of water, spilling ca 11,000 tons of oil. The oil spill caused extensive damage along the coast of Galicia and the Bay of Biscay. An Office of Nearshore Surveillance was created by the Fisheries Department of the Galician Government (Consellería de Pesca e Asuntos Marítimos, Xunta de Galicia). People were also recruited from the Galician Regional Meteorological Service (MeteoGalicia - Consellaría de Medio Ambiente) and the Spanish Institute of Oceanography. The main objectives were the monitoring and the forecasting of the slicks near the Galician coast. On November 30, the main spill arrived at Galicia, damaging most of the coast. The spill’s movement was monitored by overflights and its path was forecast with different models. The combination of surface wind drift and ocean currents shows an agreement with the observations. 1 Introduction The Galician coast is located in the northwest of Spain, between 41º and 45º N and 9º and 6º W (Figure 1). The climate of the region is typicalof the Atlantic, with wet winters and fresh summers and is very influenced by the position of the Azores high. The wind therefore is predominantly SW in winter and NE in summer. Due to these configurations and its location as a west coast, this area is located close to the northern boundary of the Canarian-Portuguese upwelling system. In late spring and summer, upwelling favourable winds are typical and ENACW (Eastern North Atlantic Central Water) is upwelled (Fraga, 1981), renewing nutrients. This feature and the complex coast with a lot of inlets named rias make Galicia one of the most productive fishing and aquaculture areas in the world (Blanton et al., 1984). This coast is also a prime tourist destination and is known for its ecological value. The small islands located in the mouths of the rias form the National Park of the Atlantic Islands. Despite this, this area has intense maritime traffic and has already experienced several significant oil spills in the last several decades, e.g., Urquiola in 1976 and Aegean Sea in 1992.
Figure 1 Area of the Study At 14h00 UTC on November 13, 2002, coincidental with the passage of a severe squall line, the old tank-steamer named Prestige carrying about 77.000 tons of fuel oil began to leak approximately 30 nautical miles off the Galician coast (Le Cedre, 2002). Between November 13 and 14, the vessel was practically adrift about 4 miles from the coast of Cape Fisterra. Considering an eventual risk of severe damage, the vessel was moved away from the coast. It then travelled northwestward until November 15 when it was 60 miles from the coast. From this point, it was carried southwestward, spreading the oil spill into a long “fuel front” exactly to the west, exposing the Atlantic coastline of Galicia. While the first fuel spilled had already beached on November19 at 7h00 UTC, the tanker split in half about 130 miles off the Galician coast and about 20,000 tons of fuel were spilled. At around noon, the ship sunk at a depth of about 3500 m. The fuel oil travelled toward the east driven by westerly winds and arrived at the Galician coast in the next few days. Afterwards, the main spill remained off the Galician and Portuguese coasts and then it continued moving to the Cantabric Sea. After the vessel sank, the fuel in the tanks was still leaking out through the breaches in the hull. Initially a flow of 125 tons/day was measured. This amount began to decrease as the French submarine Nautile blocked the holes up. By December 26, however, more than 4000 tons of oil had leaked out of the vessel and gave rise to a large slick behind the main head of the second spill. This tail was formed by a lot of tarballs that could not be seen from the aircraft. This third oil spill flow diminished to 2 tons/day by February 29. The creation of an Office of Nearshore Surveillance by the Galician regional government is discussed in the next section and the aims of monitoring and forecasting are explained. The movement of the different spills is then described. The next section discusses the monitoring efforts and presents the results of the
forecasting. The paper ends with the conclusions of this experience. 2 Monitoring and Forecast System From the first stages of the accident, different regional agencies started to work on the monitoring and forecasting of the oil spill. Initially, the Galician Meteorological Service (MeteoGalicia) and MARETEC group (Instituto Superior Técnico, IST, Lisbon) began to use a meteorological (ARPS) and oceanographic model (MOHID2000) coupled to a lagrangian model to forecast the position of the slick. Moreover, the Fisheries Department of the Galician Government (Consellería de Pesca e Asuntos Marítimos, Xunta de Galicia) promoted the creation of the Office of Nearshore Surveillance (UOP) (Unidade de Observación Próxima). This agency was made up of people from the Consellería de Pesca e Asuntos Marítimos, MeteoGalicia and the Spanish Institute of Oceanography and was helped by several institutions and agencies from Spain and other countries such as Portugal, France and the United Kingdom. The main objectives of the UOP were to monitor the oil spill and operatively forecast its evolution near the Galician coast to help manage the crisis. 2.1 Monitoring System To monitor the oil spill, the UOP obtained two helicopters and several ships to directly observe the tarmats. This was coordinated with SASEMAR (Spanish Safeguard Agency), fishermen and volunteers to share information obtained during the overflights. All this information was analyzed and filtered to avoid repetition of patches corresponding to different observations. All this information (observations, kind of patches, overflight paths) was entered in a Geographical Information System (GIS) to obtain a picture of the situation to be used later to manage the crisis and to forecast the movement of the oil spill. The monitoring included observations of the spill on the sea surface from aircraft and ships as well as observations of beached oil by ground teams from SASEMAR. This information was made available to the general public twice a day on a web site (http://www.ccmm-prestige.cesga.es). Information was published in two formats: maps and text, specifying the location, extent, patch type, and damaged areas. 2.2 Forecast System
In order to forecast the spill movement, the UOP used different oil spill numerical model outputs, such as Mothy from MeteoFrance (Daniel et al., 1998) and DERIVA from the Portuguese Hydrographic Institute. Among them, two models were developed by MeteoGalicia and MARETEC. The most simple was a drift model that involved using the numerical meteorological model ARPS forecast and calculating the trajectories from surface wind. The track of the oil spill is obtained by considering that its speed is about 3% of the surface wind module with the same direction. The most complex model, MeteoMohid, consists of a one-way coupling of the meteorological model ARPS with the oceanographic model MOHID. In order to obtain oil tracks, a lagragian MOHID module was used coupled to the MeteoMohid forecasts. These models were run whenever new positions of the oil slicks were available. The ARPS model was chosen because of its nonhydrostatic dynamics,
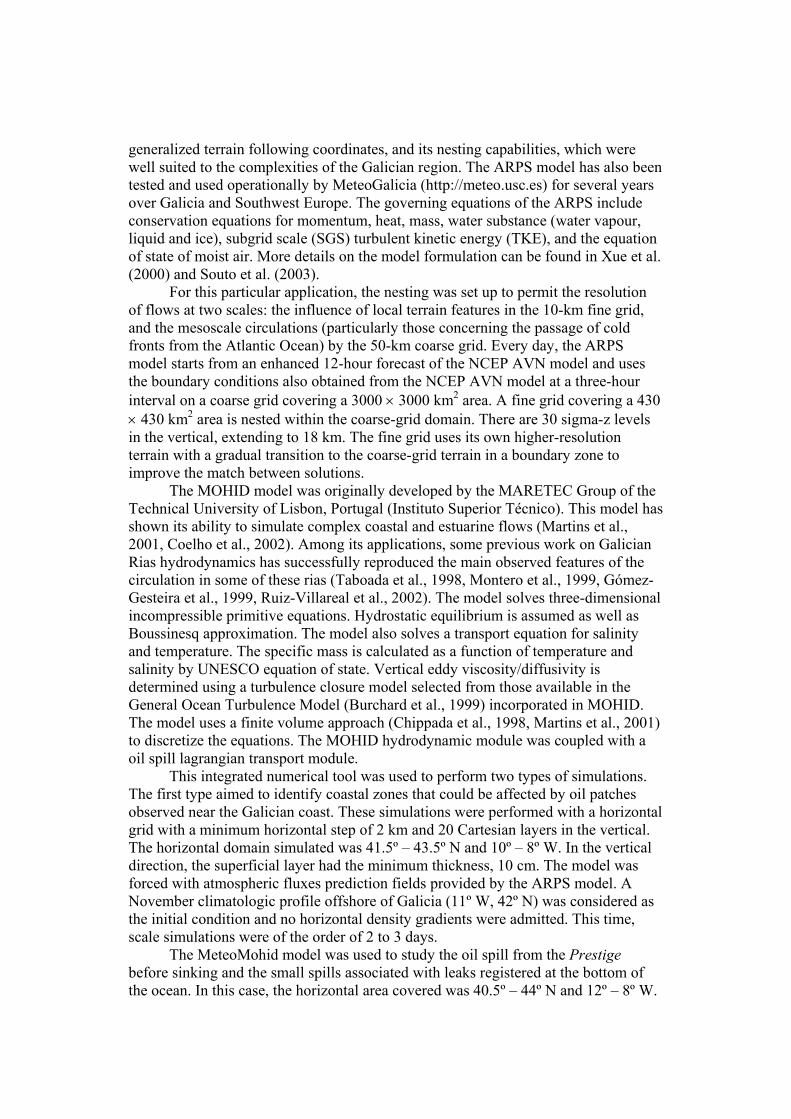
generalized terrain following coordinates, and its nesting capabilities, which were well suited to the complexities of the Galician region. The ARPS model has also been tested and used operationally by MeteoGalicia (http://meteo.usc.es) for several years over Galicia and Southwest Europe. The governing equations of the ARPS include conservation equations for momentum, heat, mass, water substance (water vapour, liquid and ice), subgrid scale (SGS) turbulent kinetic energy (TKE), and the equation of state of moist air. More details on the model formulation can be found in Xue et al. (2000) and Souto et al. (2003). For this particular application, the nesting was set up to permit the resolution of flows at two scales: the influence of local terrain features in the 10-km fine grid, and the mesoscale circulations (particularly those concerning the passage of cold fronts from the Atlantic Ocean) by the 50-km coarse grid. Every day, the ARPS model starts from an enhanced 12-hour forecast of the NCEP AVN model and uses the boundary conditions also obtained from the NCEP AVN model at a three-hour interval on a coarse grid covering a 3000 × 3000 km2 area. A fine grid covering a 430 × 430 km2 area is nested within the coarse-grid domain. There are 30 sigma-z levels in the vertical, extending to 18 km. The fine grid uses its own higher-resolution terrain with a gradual transition to the coarse-grid terrain in a boundary zone to improve the match between solutions. The MOHID model was originally developed by the MARETEC Group of the Technical University of Lisbon, Portugal (Instituto Superior Técnico). This model has shown its ability to simulate complex coastal and estuarine flows (Martins et al., 2001, Coelho et al., 2002). Among its applications, some previous work on Galician Rias hydrodynamics has successfully reproduced the main observed features of the circulation in some of these rias (Taboada et al., 1998, Montero et al., 1999, Gómez-Gesteira et al., 1999, Ruiz-Villareal et al., 2002). The model solves three-dimensional incompressible primitive equations. Hydrostatic equilibrium is assumed as well as Boussinesq approximation. The model also solves a transport equation for salinity and temperature. The specific mass is calculated as a function of temperature and salinity by UNESCO equation of state. Vertical eddy viscosity/diffusivity is determined using a turbulence closure model selected from those available in the General Ocean Turbulence Model (Burchard et al., 1999) incorporated in MOHID. The model uses a finite volume approach (Chippada et al., 1998, Martins et al., 2001) to discretize the equations. The MOHID hydrodynamic module was coupled with a oil spill lagrangian transport module. This integrated numerical tool was used to perform two types of simulations. The first type aimed to identify coastal zones that could be affected by oil patches observed near the Galician coast. These simulations were performed with a horizontal grid with a minimum horizontal step of 2 km and 20 Cartesian layers in the vertical. The horizontal domain simulated was 41.5º – 43.5º N and 10º – 8º W. In the vertical direction, the superficial layer had the minimum thickness, 10 cm. The model was forced with atmospheric fluxes prediction fields provided by the ARPS model. A November climatologic profile offshore of Galicia (11º W, 42º N) was considered as the initial condition and no horizontal density gradients were admitted. This time, scale simulations were of the order of 2 to 3 days. The MeteoMohid model was used to study the oil spill from the Prestige before sinking and the small spills associated with leaks registered at the bottom of the ocean. In this case, the horizontal area covered was 40.5º – 44º N and 12º – 8º W.
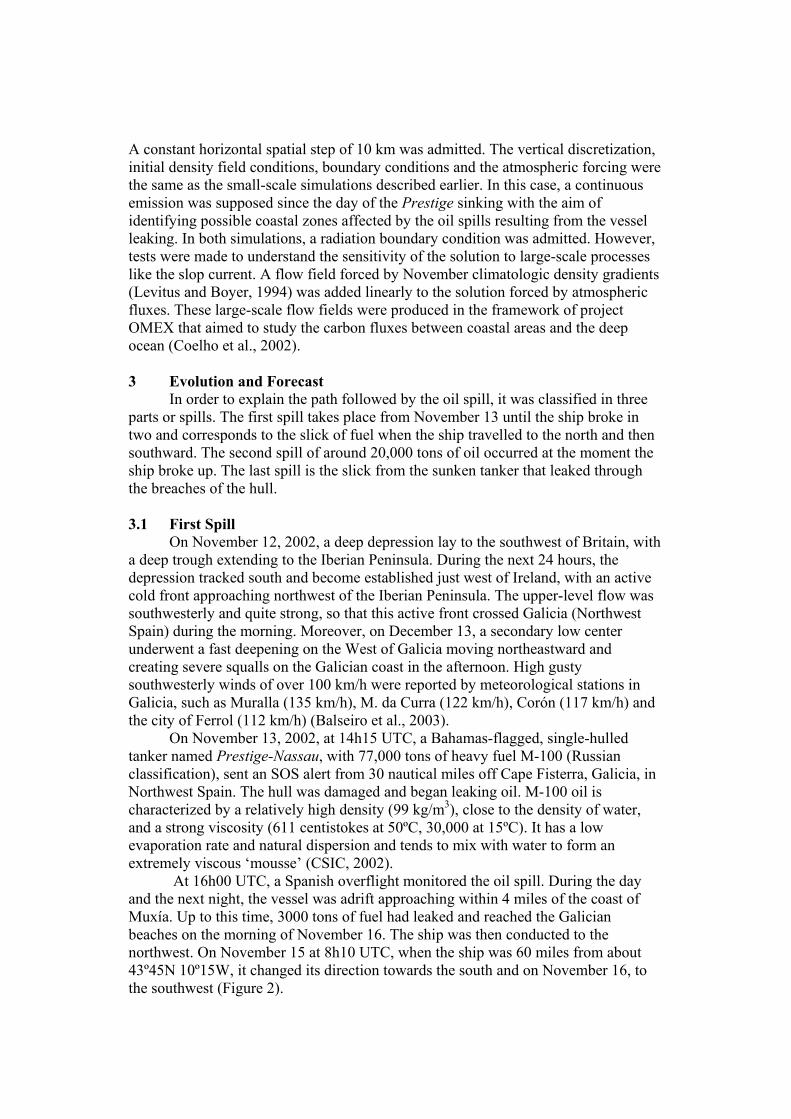
A constant horizontal spatial step of 10 km was admitted. The vertical discretization, initial density field conditions, boundary conditions and the atmospheric forcing were the same as the small-scale simulations described earlier. In this case, a continuous emission was supposed since the day of the Prestige sinking with the aim of identifying possible coastal zones affected by the oil spills resulting from the vessel leaking. In both simulations, a radiation boundary condition was admitted. However, tests were made to understand the sensitivity of the solution to large-scale processes like the slop current. A flow field forced by November climatologic density gradients (Levitus and Boyer, 1994) was added linearly to the solution forced by atmospheric fluxes. These large-scale flow fields were produced in the framework of project OMEX that aimed to study the carbon fluxes between coastal areas and the deep ocean (Coelho et al., 2002). 3 Evolution and Forecast In order to explain the path followed by the oil spill, it was classified in three parts or spills. The first spill takes place from November 13 until the ship broke in two and corresponds to the slick of fuel when the ship travelled to the north and then southward. The second spill of around 20,000 tons of oil occurred at the moment the ship broke up. The last spill is the slick from the sunken tanker that leaked through the breaches of the hull. 3.1 First Spill On November 12, 2002, a deep depression lay to the southwest of Britain, with a deep trough extending to the Iberian Peninsula. During the next 24 hours, the depression tracked south and become established just west of Ireland, with an active cold front approaching northwest of the Iberian Peninsula. The upper-level flow was southwesterly and quite strong, so that this active front crossed Galicia (Northwest Spain) during the morning. Moreover, on December 13, a secondary low center underwent a fast deepening on the West of Galicia moving northeastward and creating severe squalls on the Galician coast in the afternoon. High gusty southwesterly winds of over 100 km/h were reported by meteorological stations in Galicia, such as Muralla (135 km/h), M. da Curra (122 km/h), Corón (117 km/h) and the city of Ferrol (112 km/h) (Balseiro et al., 2003). On November 13, 2002, at 14h15 UTC, a Bahamas-flagged, single-hulled tanker named Prestige-Nassau, with 77,000 tons of heavy fuel M-100 (Russian classification), sent an SOS alert from 30 nautical miles off Cape Fisterra, Galicia, in Northwest Spain. The hull was damaged and began leaking oil. M-100 oil is characterized by a relatively high density (99 kg/m3), close to the density of water, and a strong viscosity (611 centistokes at 50ºC, 30,000 at 15ºC). It has a low evaporation rate and natural dispersion and tends to mix with water to form an extremely viscous ‘mousse’ (CSIC, 2002). At 16h00 UTC, a Spanish overflight monitored the oil spill. During the day and the next night, the vessel was adrift approaching within 4 miles of the coast of Muxía. Up to this time, 3000 tons of fuel had leaked and reached the Galician beaches on the morning of November 16. The ship was then conducted to the northwest. On November 15 at 8h10 UTC, when the ship was 60 miles from about 43º45N 10º15W, it changed its direction towards the south and on November 16, to the southwest (Figure 2).
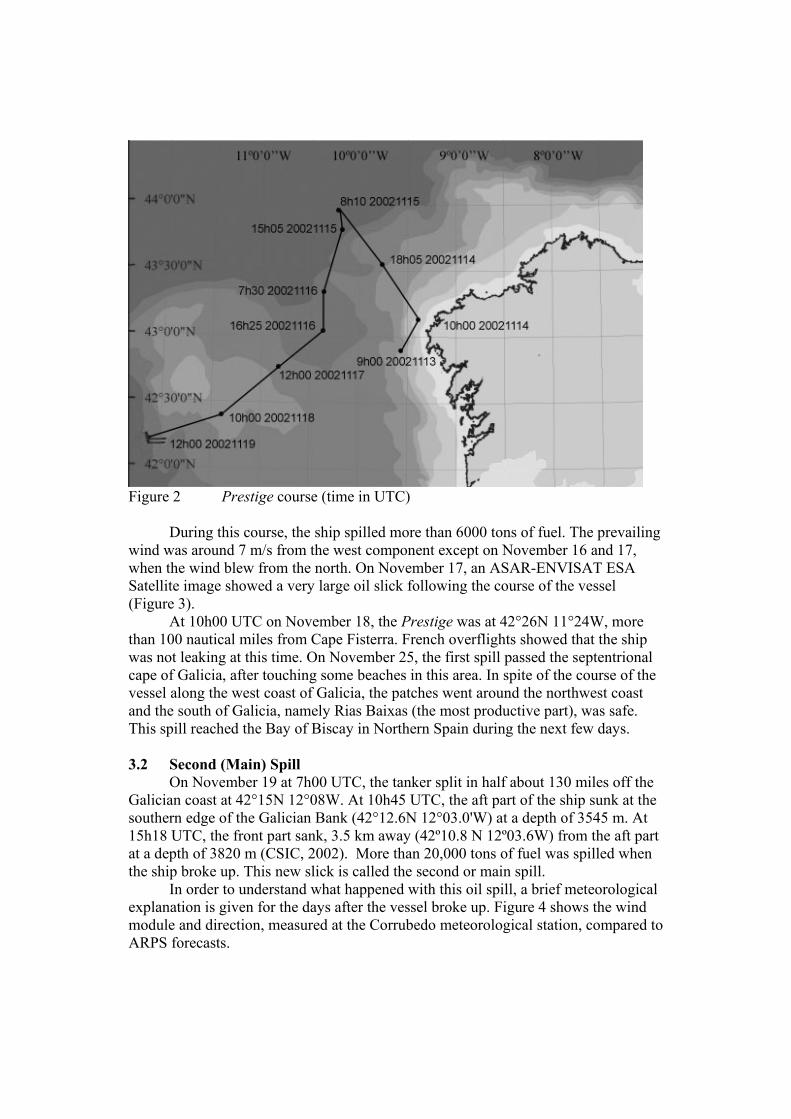
Figure 2 Prestige course (time in UTC) During this course, the ship spilled more than 6000 tons of fuel. The prevailing wind was around 7 m/s from the west component except on November 16 and 17, when the wind blew from the north. On November 17, an ASAR-ENVISAT ESA Satellite image showed a very large oil slick following the course of the vessel (Figure 3). At 10h00 UTC on November 18, the Prestige was at 42°26N 11°24W, more than 100 nautical miles from Cape Fisterra. French overflights showed that the ship was not leaking at this time. On November 25, the first spill passed the septentrional cape of Galicia, after touching some beaches in this area. In spite of the course of the vessel along the west coast of Galicia, the patches went around the northwest coast and the south of Galicia, namely Rias Baixas (the most productive part), was safe. This spill reached the Bay of Biscay in Northern Spain during the next few days. 3.2 Second (Main) Spill On November 19 at 7h00 UTC, the tanker split in half about 130 miles off the Galician coast at 42°15N 12°08W. At 10h45 UTC, the aft part of the ship sunk at the southern edge of the Galician Bank (42°12.6N 12°03.0'W) at a depth of 3545 m. At 15h18 UTC, the front part sank, 3.5 km away (42º10.8 N 12º03.6W) from the aft part at a depth of 3820 m (CSIC, 2002). More than 20,000 tons of fuel was spilled when the ship broke up. This new slick is called the second or main spill. In order to understand what happened with this oil spill, a brief meteorological explanation is given for the days after the vessel broke up. Figure 4 shows the wind module and direction, measured at the Corrubedo meteorological station, compared to ARPS forecasts.
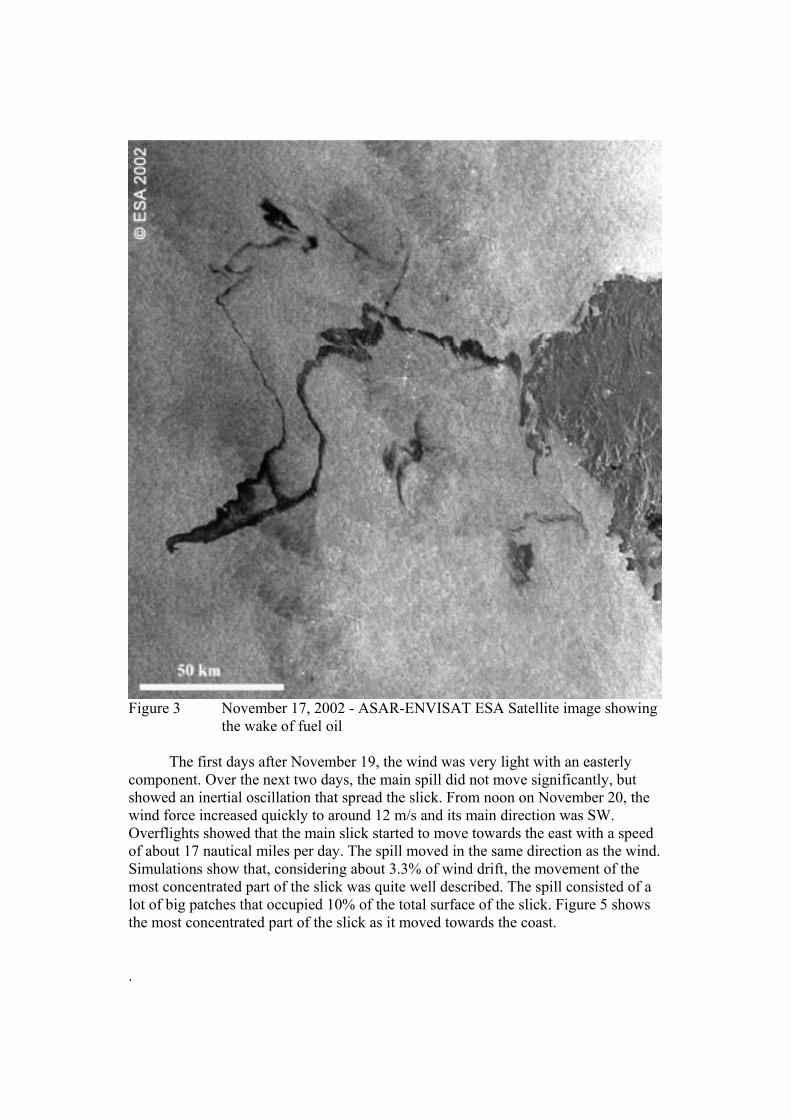
Figure 3 November 17, 2002 - ASAR-ENVISAT ESA Satellite image showing
the wake of fuel oil The first days after November 19, the wind was very light with an easterly component. Over the next two days, the main spill did not move significantly, but showed an inertial oscillation that spread the slick. From noon on November 20, the wind force increased quickly to around 12 m/s and its main direction was SW. Overflights showed that the main slick started to move towards the east with a speed of about 17 nautical miles per day. The spill moved in the same direction as the wind. Simulations show that, considering about 3.3% of wind drift, the movement of the most concentrated part of the slick was quite well described. The spill consisted of a lot of big patches that occupied 10% of the total surface of the slick. Figure 5 shows the most concentrated part of the slick as it moved towards the coast. .
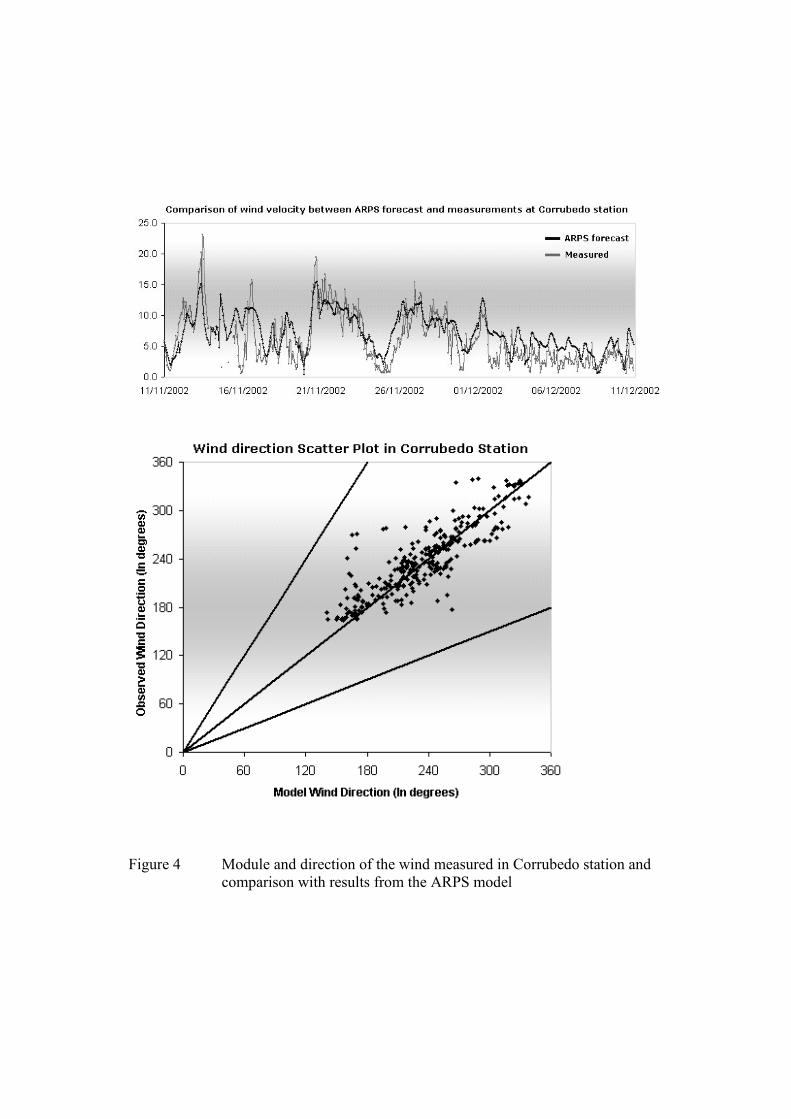
Figure 4 Module and direction of the wind measured in Corrubedo station and
comparison with results from the ARPS model
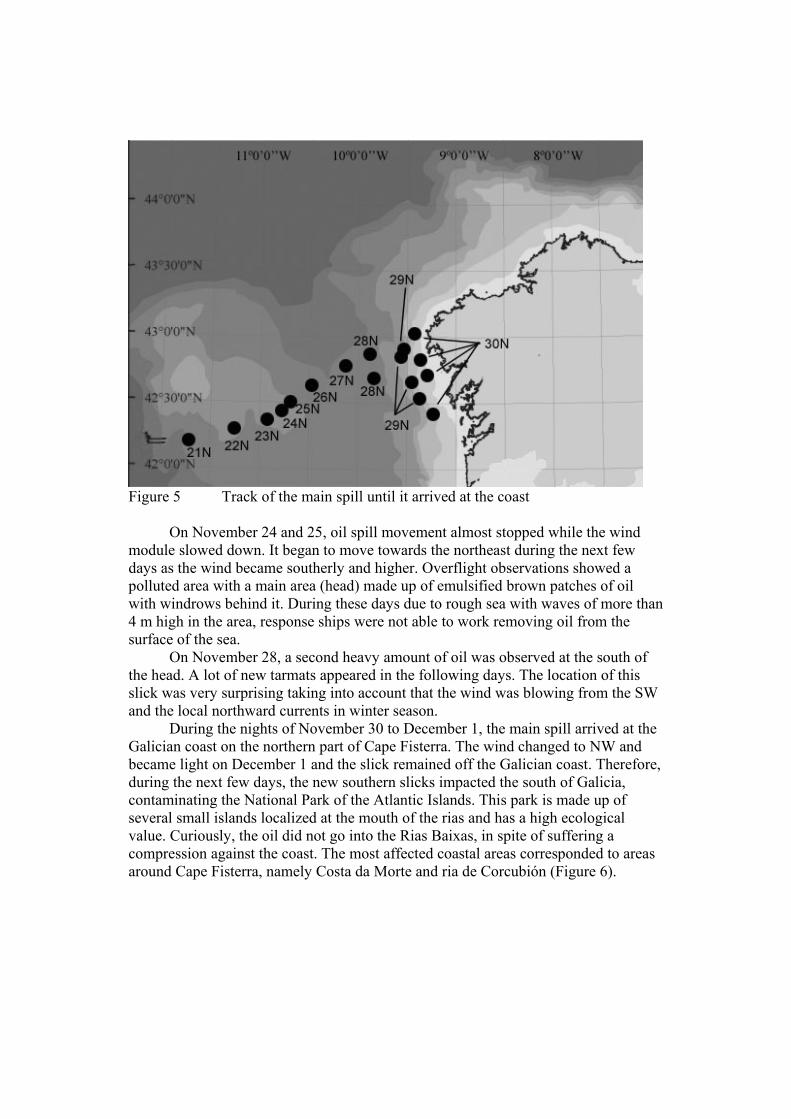
Figure 5 Track of the main spill until it arrived at the coast On November 24 and 25, oil spill movement almost stopped while the wind module slowed down. It began to move towards the northeast during the next few days as the wind became southerly and higher. Overflight observations showed a polluted area with a main area (head) made up of emulsified brown patches of oil with windrows behind it. During these days due to rough sea with waves of more than 4 m high in the area, response ships were not able to work removing oil from the surface of the sea. On November 28, a second heavy amount of oil was observed at the south of the head. A lot of new tarmats appeared in the following days. The location of this slick was very surprising taking into account that the wind was blowing from the SW and the local northward currents in winter season. During the nights of November 30 to December 1, the main spill arrived at the Galician coast on the northern part of Cape Fisterra. The wind changed to NW and became light on December 1 and the slick remained off the Galician coast. Therefore, during the next few days, the new southern slicks impacted the south of Galicia, contaminating the National Park of the Atlantic Islands. This park is made up of several small islands localized at the mouth of the rias and has a high ecological value. Curiously, the oil did not go into the Rias Baixas, in spite of suffering a compression against the coast. The most affected coastal areas corresponded to areas around Cape Fisterra, namely Costa da Morte and ria de Corcubión (Figure 6).
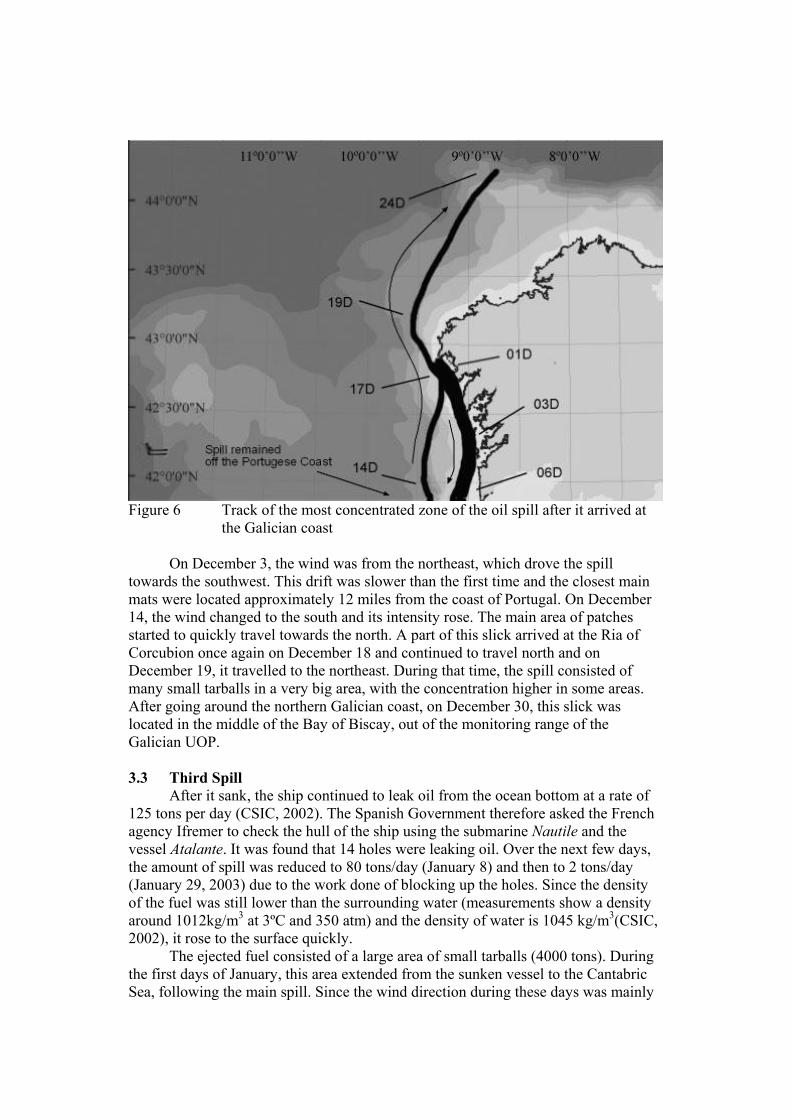
Figure 6 Track of the most concentrated zone of the oil spill after it arrived at
the Galician coast On December 3, the wind was from the northeast, which drove the spill towards the southwest. This drift was slower than the first time and the closest main mats were located approximately 12 miles from the coast of Portugal. On December 14, the wind changed to the south and its intensity rose. The main area of patches started to quickly travel towards the north. A part of this slick arrived at the Ria of Corcubion once again on December 18 and continued to travel north and on December 19, it travelled to the northeast. During that time, the spill consisted of many small tarballs in a very big area, with the concentration higher in some areas. After going around the northern Galician coast, on December 30, this slick was located in the middle of the Bay of Biscay, out of the monitoring range of the Galician UOP. 3.3 Third Spill After it sank, the ship continued to leak oil from the ocean bottom at a rate of 125 tons per day (CSIC, 2002). The Spanish Government therefore asked the French agency Ifremer to check the hull of the ship using the submarine Nautile and the vessel Atalante. It was found that 14 holes were leaking oil. Over the next few days, the amount of spill was reduced to 80 tons/day (January 8) and then to 2 tons/day (January 29, 2003) due to the work done of blocking up the holes. Since the density of the fuel was still lower than the surrounding water (measurements show a density around 1012kg/m3 at 3ºC and 350 atm) and the density of water is 1045 kg/m3(CSIC, 2002), it rose to the surface quickly. The ejected fuel consisted of a large area of small tarballs (4000 tons). During the first days of January, this area extended from the sunken vessel to the Cantabric Sea, following the main spill. Since the wind direction during these days was mainly
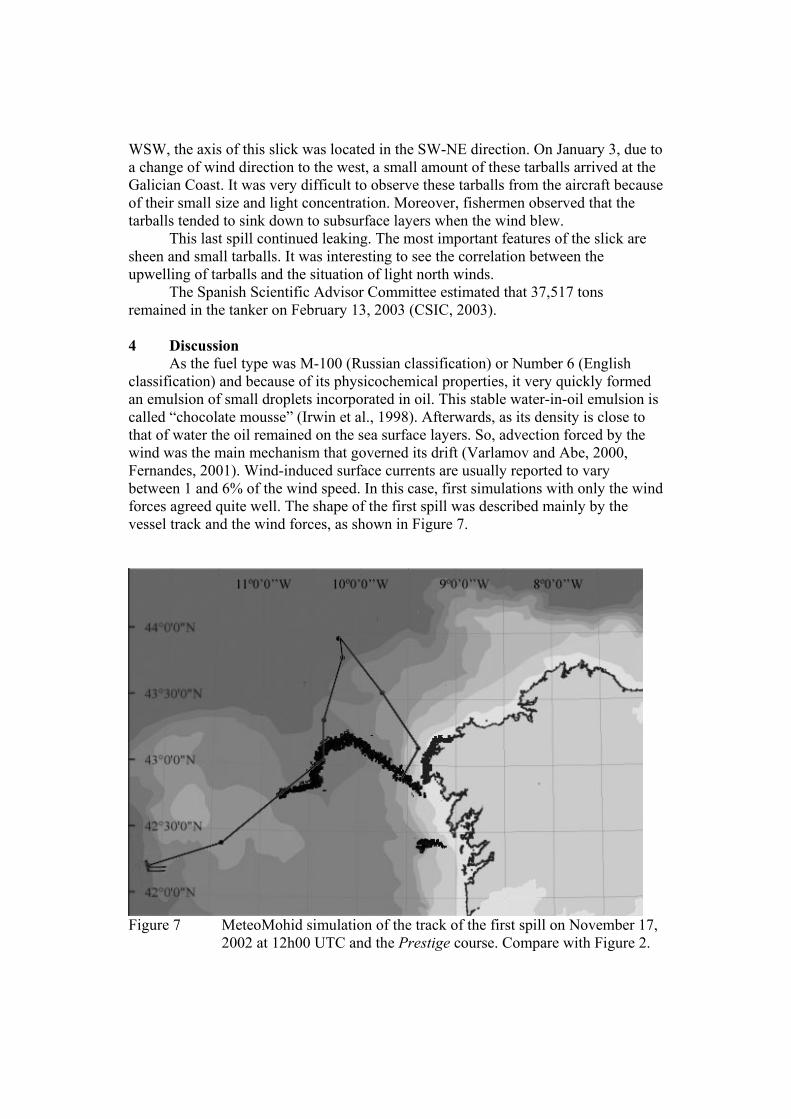
WSW, the axis of this slick was located in the SW-NE direction. On January 3, due to a change of wind direction to the west, a small amount of these tarballs arrived at the Galician Coast. It was very difficult to observe these tarballs from the aircraft because of their small size and light concentration. Moreover, fishermen observed that the tarballs tended to sink down to subsurface layers when the wind blew. This last spill continued leaking. The most important features of the slick are sheen and small tarballs. It was interesting to see the correlation between the upwelling of tarballs and the situation of light north winds. The Spanish Scientific Advisor Committee estimated that 37,517 tons remained in the tanker on February 13, 2003 (CSIC, 2003). 4 Discussion As the fuel type was M-100 (Russian classification) or Number 6 (English classification) and because of its physicochemical properties, it very quickly formed an emulsion of small droplets incorporated in oil. This stable water-in-oil emulsion is called “chocolate mousse” (Irwin et al., 1998). Afterwards, as its density is close to that of water the oil remained on the sea surface layers. So, advection forced by the wind was the main mechanism that governed its drift (Varlamov and Abe, 2000, Fernandes, 2001). Wind-induced surface currents are usually reported to vary between 1 and 6% of the wind speed. In this case, first simulations with only the wind forces agreed quite well. The shape of the first spill was described mainly by the vessel track and the wind forces, as shown in Figure 7.
Figure 7 MeteoMohid simulation of the track of the first spill on November 17,
2002 at 12h00 UTC and the Prestige course. Compare with Figure 2.
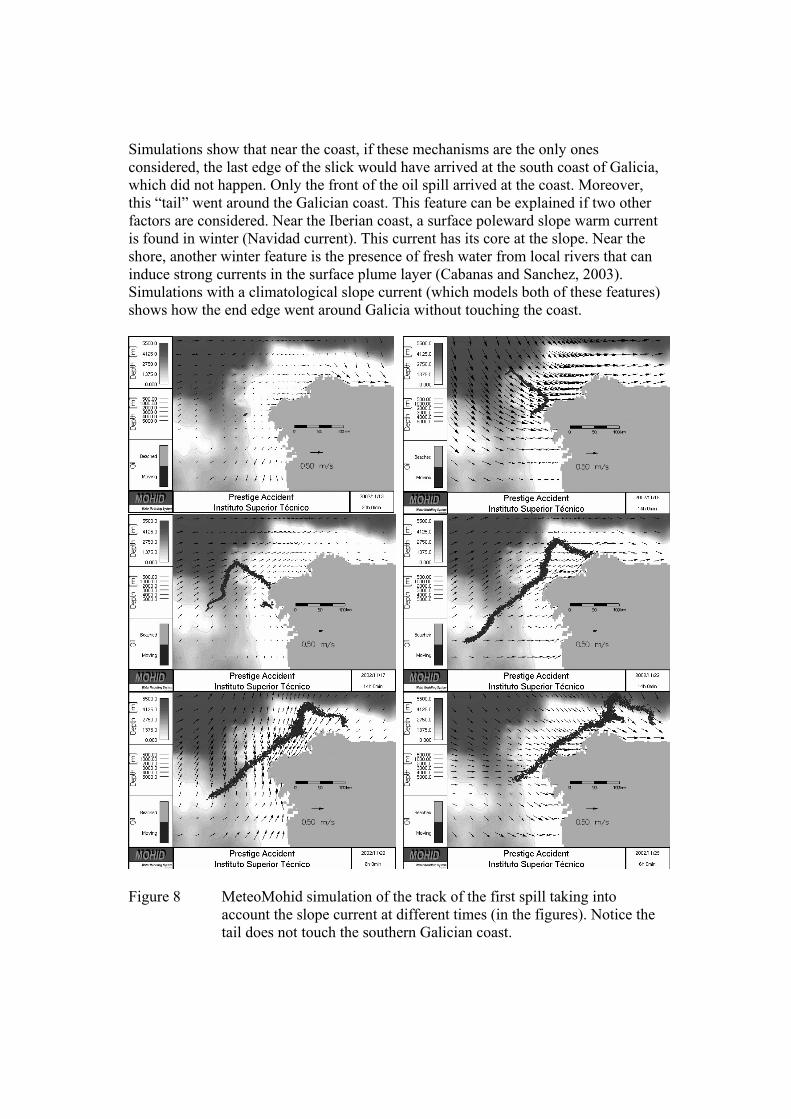
Simulations show that near the coast, if these mechanisms are the only ones considered, the last edge of the slick would have arrived at the south coast of Galicia, which did not happen. Only the front of the oil spill arrived at the coast. Moreover, this “tail” went around the Galician coast. This feature can be explained if two other factors are considered. Near the Iberian coast, a surface poleward slope warm current is found in winter (Navidad current). This current has its core at the slope. Near the shore, another winter feature is the presence of fresh water from local rivers that can induce strong currents in the surface plume layer (Cabanas and Sanchez, 2003). Simulations with a climatological slope current (which models both of these features) shows how the end edge went around Galicia without touching the coast.
Figure 8 MeteoMohid simulation of the track of the first spill taking into
account the slope current at different times (in the figures). Notice the tail does not touch the southern Galician coast.
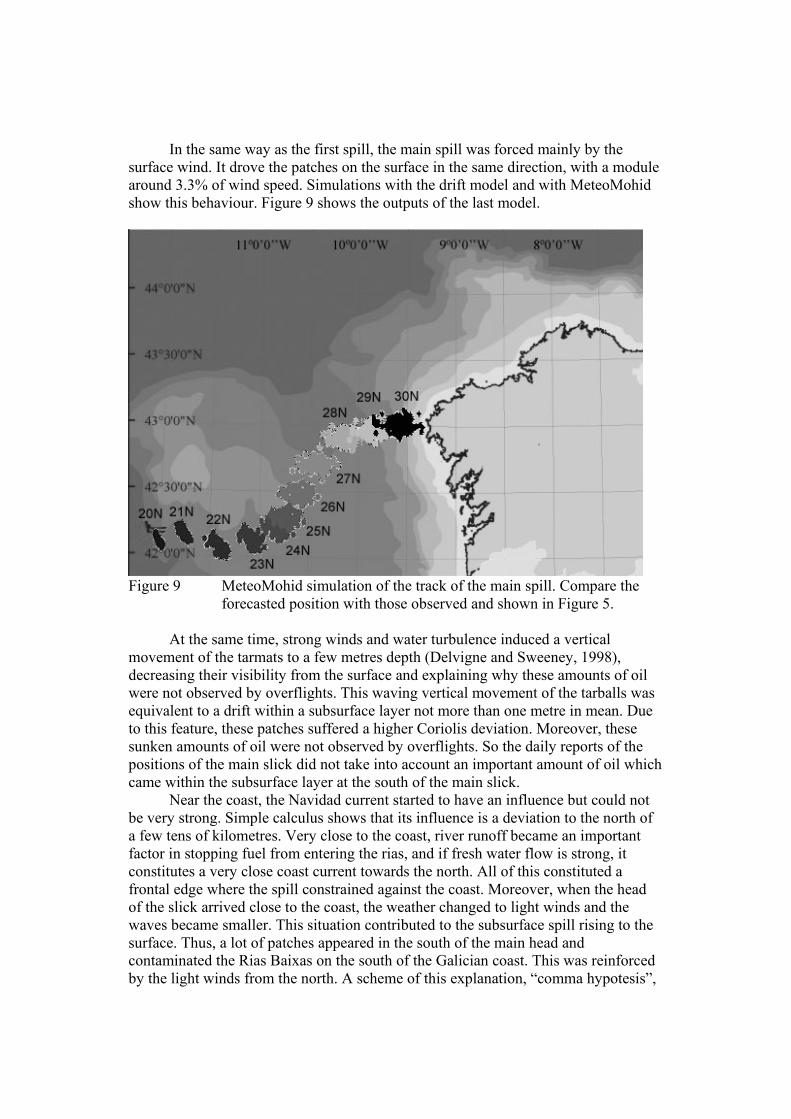
In the same way as the first spill, the main spill was forced mainly by the surface wind. It drove the patches on the surface in the same direction, with a module around 3.3% of wind speed. Simulations with the drift model and with MeteoMohid show this behaviour. Figure 9 shows the outputs of the last model.
Figure 9 MeteoMohid simulation of the track of the main spill. Compare the
forecasted position with those observed and shown in Figure 5. At the same time, strong winds and water turbulence induced a vertical movement of the tarmats to a few metres depth (Delvigne and Sweeney, 1998), decreasing their visibility from the surface and explaining why these amounts of oil were not observed by overflights. This waving vertical movement of the tarballs was equivalent to a drift within a subsurface layer not more than one metre in mean. Due to this feature, these patches suffered a higher Coriolis deviation. Moreover, these sunken amounts of oil were not observed by overflights. So the daily reports of the positions of the main slick did not take into account an important amount of oil which came within the subsurface layer at the south of the main slick. Near the coast, the Navidad current started to have an influence but could not be very strong. Simple calculus shows that its influence is a deviation to the north of a few tens of kilometres. Very close to the coast, river runoff became an important factor in stopping fuel from entering the rias, and if fresh water flow is strong, it constitutes a very close coast current towards the north. All of this constituted a frontal edge where the spill constrained against the coast. Moreover, when the head of the slick arrived close to the coast, the weather changed to light winds and the waves became smaller. This situation contributed to the subsurface spill rising to the surface. Thus, a lot of patches appeared in the south of the main head and contaminated the Rias Baixas on the south of the Galician coast. This was reinforced by the light winds from the north. A scheme of this explanation, “comma hypotesis”,
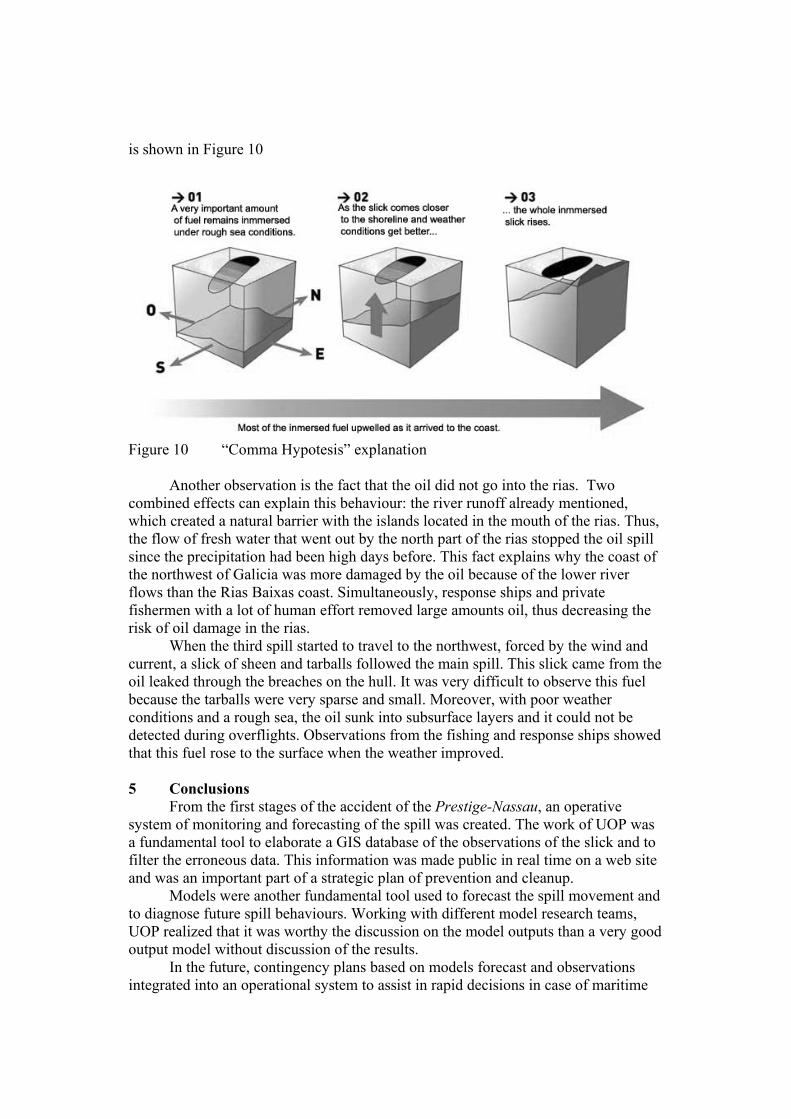
is shown in Figure 10
Figure 10 “Comma Hypotesis” explanation Another observation is the fact that the oil did not go into the rias. Two combined effects can explain this behaviour: the river runoff already mentioned, which created a natural barrier with the islands located in the mouth of the rias. Thus, the flow of fresh water that went out by the north part of the rias stopped the oil spill since the precipitation had been high days before. This fact explains why the coast of the northwest of Galicia was more damaged by the oil because of the lower river flows than the Rias Baixas coast. Simultaneously, response ships and private fishermen with a lot of human effort removed large amounts oil, thus decreasing the risk of oil damage in the rias. When the third spill started to travel to the northwest, forced by the wind and current, a slick of sheen and tarballs followed the main spill. This slick came from the oil leaked through the breaches on the hull. It was very difficult to observe this fuel because the tarballs were very sparse and small. Moreover, with poor weather conditions and a rough sea, the oil sunk into subsurface layers and it could not be detected during overflights. Observations from the fishing and response ships showed that this fuel rose to the surface when the weather improved.
5 Conclusions From the first stages of the accident of the Prestige-Nassau, an operative system of monitoring and forecasting of the spill was created. The work of UOP was a fundamental tool to elaborate a GIS database of the observations of the slick and to filter the erroneous data. This information was made public in real time on a web site and was an important part of a strategic plan of prevention and cleanup. Models were another fundamental tool used to forecast the spill movement and to diagnose future spill behaviours. Working with different model research teams, UOP realized that it was worthy the discussion on the model outputs than a very good output model without discussion of the results. In the future, contingency plans based on models forecast and observations integrated into an operational system to assist in rapid decisions in case of maritime
accidents should be undertaken. 6 Acknowledgements The Office of Nearshore Surveillance, UOP, created during the Prestige accident received financial support from the Fisheries Department, MeteoGalicia of Xunta de Galicia and the Spanish Institute of Oceanography. The combined efforts of different agencies to support the work done by the Office is gratefully acknowledged. 7 References Balseiro, C.F., P. Carracedo, B. Gómez, P.C. Leitao, P. Montero, L. Naranjo, E. Penabad and V. Pérez-Muñuzuri, “Tracking the ‘Prestige’ Oil Spill. An Operational Experience in Simulation at MeteoGalicia” to appear in Weather, Vol. 58, 2003. Blanton, J.O., L.P. Atkinson, F. Fernandez de Castillejo and A. Lavin, “Coastal Upwelling off the Rías Bajas, Galicia, Northwest Spain. I: Hydrographic Studies”, Rapports et Procés Verbaux CIEM, Vol. 183, pp. 79-90, 1984. Burchard, H., K. Bolding and M. Ruiz-Villarreal, GOTM, A General Ocean Turbulence Model. Theory, Implementation and Test Cases, European Commission, EUR 18745, 103 p., 1999. Cabanas, J.M. and F. Sanchez, Informe 04: Características Oceanográficas de la Plataforma de Galicia en Diciembre de 2002, http://www.ieo.es/prestige.htm, Instituto Español de Oceanografía, 2003. Chippada, S., C. Dawson and M. Wheeler, “A Godonov-type Finite Volume Method for the System of Shallow Water Equations”, Computer Methods in Applied Mechanics and Engineering , Vol. 151, No. 01, pp. 105-130, 1998. Coelho, H., R.J.J. Neves, M. White, P.C. Leitao, and A.J. Santos, “A Circulation Model for Western Iberia”, Journal of Marine Systems, Vol. 32 No 1-3, pp. 153-179, 2002. CSIC, Informe Técnico CSIC ‘Prestige’: Caracterización del Vertido y Evolución en el Medio ,CSIC, http://csicprestige.iim.cesic.es/, 2002. CSIC, Informe No. 1 del Comité Científico Asesor, CSIC, http://www.ccaprestige.es, 2002. CSIC, Informe Final del Comité Científico Asesor, CSIC, http://www.ccaprestige.es, 2003. Daniel, P., J. Poitevin, C. Tiercelin and M. Marchand, “Forecasting Accidental Marine Pollution Drift: The French Operational Plan”, Oil and Hydrocarbon Spills, Modelling, Analysis and Control, Computational Mechanics Publications, WIT Press, pp. 43-52, 1998.
Delvigne, G.A.L. and C.E. Sweeney, “Natural Dispersion of Oil”, Oil & Chemical Pollution, Vol. 4, pp. 281-310, 1998. Fraga, F., “Upwelling off the Galician Coast, Northwest Spain”, in Coastal Upwelling, American Geophysical Union, Washington, DC, USA, pp. 176-182, 1981. Fernandes, R., Modelação de Derrames de Hidrocarbonetos. Relatório Final, Licenciatura em Engenharia do Ambiente, Instituto Superior Técnico, Lisbon, 2001. Gómez-Gesteira, M., P. Montero, R. Prego, J.J. Taboada, P. Leitão, M. Ruiz-Villarreal, R. Neves and V. Pérez-Villar, “A Two-Dimensional Particle Tracking Model for Pollution Dispersion in A Coruña and Vigo Rias (NW Spain)”, Oceanologica Acta, Vol. 22, No. 2, pp. 167-177, 1999. Irwin, R.J., M. VanMouwerik, L. Stevens, M.D. Seese and W. Basham, Environmental Contaminants Encyclopedia. http://www.nature.nps.gov/toxic/, National Park Service, Water Resources Division, Fort Collins, USA 1998 Le Cedre, “Naufrage du Petrolier Prestige”, Le lettre du Cedre, No. 90, http://www.le-cedre.fr/images/02nov.pdf, 2002. Levitus, S. and., T.P. Boyer, World Ocean Atlas 1994. Volume 4: NOAA Atlas NESDIS 4, 117 p., 1994. Martins, F., R. Neves, P. Leitao and A. Silva, “3D Modelling in the Sado Estuary using a New Generic Vertical Discretization Approach”, Oceanologica Acta, Vol. 24, No. 1, pp. S51-S62, 2001. Montero, P., M. Gómez-Gesteira, J.J. Taboada, M. Ruíz-Villarreal, A.P. Santos, R.R. Neves, R. Prego and V. Pérez-Villar, “On Residual Circulation of Vigo Ria using a 3D Baroclinic Model”, Boletín Español de Oceanografía, No. 15(1), 1999. Ruiz-Villarreal, M., P. Montero, J.J. Taboada, R. Prego, P.C. Leitão and V. Pérez-Villar, “Hydrodynamic Model Study of the Ria de Pontevedra under Estuarine Conditions”, Estuarine, Coastal and Shelf Science, Vol. 54, pp. 101-113, 2002. Souto, M.J., C.F. Balseiro, V. Pérez-Muñuzuri, M. Xue and K. Brewster, “Impact of Cloud Analysis on Numerical Weather Prediction in the Galician Region of Spain”, Journal of Applied Meteorology, Vol. 42, pp. 129-140, 2003. Taboada, J.J., R. Prego, M. Ruiz-Villarreal, P. Montero, M. Gómez-Gesteira, A.P. Santos and V. Pérez-Villar, “Evaluation of the Seasonal Variations in the Residual Patterns in the Ría de Vigo (NW Spain) by Means of a 3D Baroclinic Model”, Estuarine, Coastal and Shelf Science, Vol. 47, No. 5, pp. 661-670, 1998.

Varlamov, S.M. and K. Abe, “Oil Spill Initial Stage Spreading and Physical Properties Model”, Reports of Research Institute for Applied Mechanics, Kyushu University, No. 119, pp. 89-101, 2000. Xue, M., K.K. Droegemeier and V. Wong, “The Advanced Regional Prediction System (ARPS) - A Multiscale Nonhydrostatic Atmospheric Simulation and Prediction Tool. Part I: Model Dynamics and Verification”, Meteor. Atmos. Phys., Vol. 75, pp. 161-193, 2000.