Embed Size (px)
Citation preview
7072 2018
May 2018
Oil Prices and GCC Stock Markets: New Evidence from Smooth Transition Models Nidhaleddine Ben Cheikh, Sami Ben Naceur, Oussama Kanaan, Christophe Rault
Impressum:
CESifo Working Papers ISSN 2364‐1428 (electronic version) Publisher and distributor: Munich Society for the Promotion of Economic Research ‐ CESifo GmbH The international platform of Ludwigs‐Maximilians University’s Center for Economic Studies and the ifo Institute Poschingerstr. 5, 81679 Munich, Germany Telephone +49 (0)89 2180‐2740, Telefax +49 (0)89 2180‐17845, email [email protected] Editors: Clemens Fuest, Oliver Falck, Jasmin Gröschl www.cesifo‐group.org/wp An electronic version of the paper may be downloaded ∙ from the SSRN website: www.SSRN.com ∙ from the RePEc website: www.RePEc.org ∙ from the CESifo website: www.CESifo‐group.org/wp

CESifo Working Paper No. 7072 Category 10: Energy and Climate Economics
Oil Prices and GCC Stock Markets: New Evidence from Smooth Transition Models
Abstract Our paper examines the effect of oil price changes on Gulf Cooperation Council (GCC) stock markets using nonlinear smooth transition regression (STR) models. Contrary to conventional wisdom, our empirical results reveal that GCC stock markets do not have similar sensitivities to oil price changes. We document the presence of stock market returns’ asymmetric reactions in some GCC countries, but not for others. In Kuwait’s case, negative oil price changes exert larger impacts on stock returns than positive oil price changes. When considering the asymmetry with respect to the magnitude of oil price variation, we find that Oman’s and Qatar’s stock markets are more sensitive to large oil price changes than to small ones. Our results highlight the importance of economic stabilization and reform policies that can potentially reduce the sensitivity of stock returns to oil price changes, especially with regard to the existence of asymmetric behavior.
JEL-Codes: G120, F300, Q430.
Keywords: GCC stock markets, oil prices, smooth transition regression models.
Nidhaleddine Ben Cheikh ESSCA School of Management / France
Sami Ben Naceur International Monetary Fund / USA
Oussama Kanaan International Monetary Fund / Kuwait
Christophe Rault* University of Orléans / France
*corresponding author May 2018 Nidhaleddine Ben Cheikh is an Associate Professor of Economics at the ESSCA School of Management, France; Sami Ben Naceur is Deputy Division Chief in the Institute for Capacity Development at the International Monetary Fund; Oussama Kanaan is the Director of the IMF Middle East Center of Economics and Finance in Kuwait (CEF); and Christophe Rault is a Full Professor of Economics at the University of Orléans (CNRS, LEO FRE 2014), France. The authors would like to thank Basil Awad from the CEF for preparing the database and writing Section 2 of the paper; Noor Tarawneh, Margarita Guissela Aguilar Calvay, Botir Baltabaev, and Ling Zhu for their comments on an earlier version of our paper; Lisette Atiyeh for editorial assistance; and Aliya Levinstein, Natalie Tate, Jennifer Azar, and Theresa Nakamura for administrative assistance. All errors and omissions are our own.
I. INTRODUCTION
Over the past decade, many papers have been investigating the relationships between oil
prices and macroeconomic variables. They provide evidence proving that oil price
fluctuations exert large impacts on economic activity in developed and emerging economies
(see Gronwald, 2008; Cologni and Manera, 2008; or Kilian, 2008). However, less emphasis
has been placed on studying the link between oil price movement and the stock market.
Furthermore, most of the existing papers have studied stock markets in developed economies,
while developing and emerging market countries, including Gulf Cooperation Council
(GCC) countries, have remained relatively unexplored. Additionally, most of these studies
have relied on linear econometric frameworks for modelling the interactions between oil
price shocks and stock markets, and it is now well established that overlooking potential
nonlinearity can lead to misleading results (see Balcilar et al., 2015).
There are at least four reasons for studying the GCC region. First, these countries are large
suppliers of oil for the global economy, so their stock markets may be influenced by oil price
movements. Second, GCC markets are, to some extent, segmented from international
markets, but very sensitive to regional political events. Third, GCC markets are unique, very
promising places for international portfolio diversification. Fourth, only a few studies have
investigated the nonlinear relationship between oil prices and stock markets in the GCC
region.
During the last ten years, the crude oil market has experienced huge swings, such as the
spectacular increase in oil price in 2007 and early 2008, and the subsequent dramatic decline
at the end of 2008. In conjunction with the dramatic change in the financial environment
since the eruption of the US subprime crisis, the presence of structural breaks and regime
shifts has revived the belief in an asymmetric, nonlinear relationship between oil prices and
stock markets.2 A more thorough understanding of this relationship would be especially
valuable for policymakers in countries that are heavily reliant on oil for their export earnings
and fiscal revenues, such as GCC countries, which are seeking to predict and temper the
impact of oil price change on the stock market more effectively. It could also serve to
identify the macroeconomic stabilization and reform measures that are key to reducing stock
market sensitivity to oil price changes.
As is well known, the sign of the relationship between oil prices and stock indices depends
on whether a country is a net oil-importing or oil-exporting economy.3 The literature finds
GCC stock markets and oil prices to be significantly and positively correlated. In a recent
paper, Dutta et al. (2017) report a positive, significant relationship between oil prices and
realized stock market uncertainties—even after controlling for global stock market
2 As argued by Koop and Potter (2000), much of the evidence for nonlinearity in economic time series might, in
fact, be due to structural changes. 3 For instance, Park and Ratti (2008) revealed that oil price spikes have negative impacts on stock returns in the
US and 12 European countries, whereas stock markets in Norway (an oil-exporting country) respond positively
to oil price increases.

3
3
uncertainty—in Saudi Arabia, Kuwait, the United Arab Emirates (UAE), and Qatar. Using a
VAR-GARCH model, Al-Maadid et al. (2016) also find that GCC stock markets and oil
prices are highly and positively correlated. Others have studied volatility spillovers between
oil prices and GCC stock markets. Arouri et al. (2011) find return and volatility spillovers
between oil prices and GCC stock markets. Almohaimeed and Harrathi (2013) report a
significant volatility spillover between the Saudi stock market and oil prices. Jouini and
Harrathi (2014) observe a volatility spillover running from oil market volatility to GCC stock
price volatility, and vice versa.
More recently, there has been increasing interest in studying the potential asymmetric effects
of oil price shocks on stock returns, although the number of studies is still relatively sparse.
The existing empirical literature has focused on the asymmetry arising from the direction of
oil price change, in the sense that stock prices respond asymmetrically to oil price decreases
and increases (see Park and Ratti, 2008; Sim and Zhou, 2015; Reboredo and Ugolini, 2016;
and Mohanty et al., 2011).4 However, in spite of its policy relevance, little is said about
whether oil price shocks are asymmetric in magnitude, namely, if the effects of large oil price
changes on stock prices prove to be different from the effects of smaller shocks. Furthermore,
ad hoc methods have often been implemented to measure the asymmetric reactions of stock
market returns to oil price changes. For instance, in a sample of GCC countries, Mohanty et
al. (2011) introduce a dummy variable to capture the asymmetry with respect to oil price
decreases and increases. While declines in oil prices negatively impact all GCC stock
markets, Mohanty et al. (2011) reveal that oil price increases have mixed effects on stock
returns. Since linear and ad hoc approaches would potentially lead to counterintuitive, mixed
results, we propose the use of a class-regime-switching model, where the nonlinear dynamic
is generated endogenously from the data.
Our paper aims to shed further light on the asymmetries in the sensitivity levels of GCC
stock markets to oil prices. We propose to implement a relevant econometric method that
enables us to explore the two possible sources of asymmetry in stock price reactions, namely,
the direction and magnitude of oil price change. We use the class of nonlinear smooth
transition regression (STR) models, where different regimes can be identified with respect to
estimated thresholds. To capture the asymmetry arising from the direction of oil price shock,
we use a logistic specification of the STR model (LSTR), which is appropriate for separating
oil price into positive and negative changes. However, an exponential form of the STR model
(ESTR) is more suitable for distinguishing between large and small oil price changes when
capturing asymmetric behavior with respect to the size of oil price’s movement. Our study is
conducted for a sample of six GCC countries (Bahrain, Kuwait, Oman, Qatar, Saudi Arabia,
and the UAE), using monthly data over January 2004–December 2015. To the best of our
knowledge, no other study has applied a nonlinear STR approach in this context.
Despite the apparent common economic and political characteristics shared by GCC
countries, our results reveal heterogeneous reactions in their respective equity markets with
4 It is worth highlighting that a great deal of literature has studied the asymmetric effects of oil price shock on
economic activity (see Mork, 1989; Hamilton, 1996; and Sadorsky, 1999).

4
4
respect to oil price variations. We find that Kuwait’s stock market responds asymmetrically
to oil price decreases and increases, with negative deviations exerting larger impacts than
positive ones. When testing for the asymmetry relating to the magnitude of oil price changes,
we find that stock return sensitivities are significantly higher for large oil variations in Oman
and Qatar. These dissimilarities, in terms of stock market reactions, confirm that GCC
countries still differ in their levels of dependency on oil, especially in their efforts to
diversify their economies through structural reforms. Our research emphasizes the
importance of accounting for differences in stock return sensitivities across GCC countries—
including potential asymmetric mechanisms—when making portfolio diversification
decisions and forming oil-price-related hedging strategies. Ongoing and expected structural
reforms are important, insofar as they serve to reduce stock market returns’ sensitivities to oil
movements.
The paper proceeds as follows: Section 2 provides a short overview of GCC stock markets
and discusses the role of oil. Section 3 presents the data and their statistical properties, and
Section 4 describes the econometric methodology. Section 5 is devoted to the empirical
results, and Section 6 discusses several policy implications for the GCC region. Finally,
Section 7 offers some concluding remarks.
II. GCC STOCK MARKETS AND OIL PRICES
The GCC region holds 30 percent of the world’s crude oil proven reserves and represented
roughly 34 percent of world oil exports in 2016.5 GCC countries share similar economic and
political characteristics, but Bahrain, for example, is less reliant on oil than Saudi Arabia and
Kuwait. Oil rents (difference between the price of crude oil production and total cost of
production) range from 2.6 percent of GDP for Bahrain to 38.5 percent of GDP for Kuwait,
totaling $255 billion in oil rents for the region (18.3 percent of GDP) in 2015 (see Figure 1).
Petrodollar accumulation, with the oil price nearly tripling from $50 in early 2007 to $147
before the global financial crisis (GFC), began to take hold in late 2008. This situation, along
with the global investment of their sovereign wealth funds, and important economic reforms,
such as financial liberalization, has given GCC countries greater exposure to international
markets.
5 Data for crude oil proven reserves are from the US Energy Information Administration (EIA). Crude oil export
statistics are taken from The World Factbook.

5
5
Figure 1. Brent Oil Prices vs. GCC Oil Rents
Source: Data are obtained from the EIA and the World Bank.
The first formal stock market in the GCC region was the Kuwait Stock Exchange, established
in 1977. Saudi Arabia, Oman, and Bahrain established their own formal stock markets in the
1980s, followed by Qatar in the 1990s.6 The UAE brought the total number of stock
exchanges in the GCC region to seven, with the opening of both the Dubai Financial Market
and the Abu Dhabi Securities Exchange in 2000.7 In more recent years, GCC countries have
loosened restrictions for foreign investors and implemented a wide range of legal, regulatory,
and supervisory changes to strengthen market transparency. This financial liberalization has
contributed to the further development of formal stock markets in the region. Figure 2 shows
the rapid increase of listed companies from 2002 to 2015.
Figure 2. GCC Stock Market: Listed Companies and Market Capitalization
Source: Arab Monetary Fund.
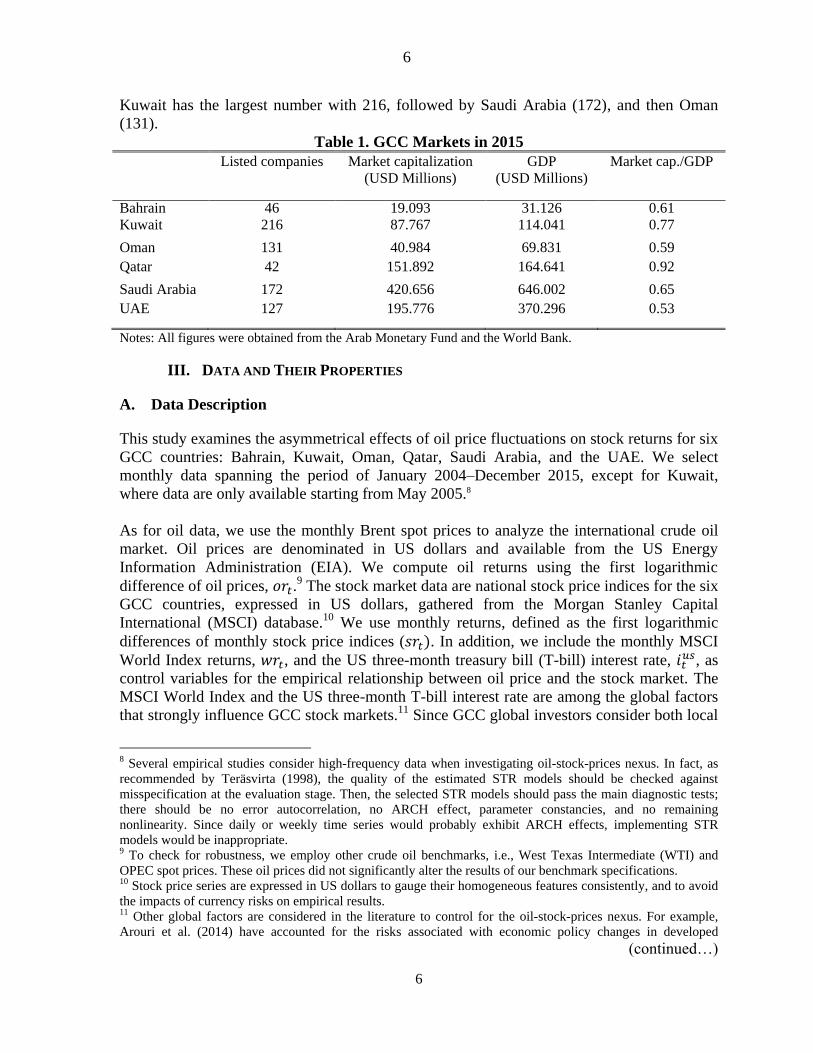
The total market capitalization of GCC stock markets was $916 billion in Q4 2015, an almost
sevenfold increase from $137 billion in Q1 2002 (see Table 1). Saudi Arabia’s stock market,
the largest in the region, accounts for 46 percent of stock market capitalization in the GCC.
The smallest stock market in the region is Bahrain’s. In terms of total listed companies,
6 The Saudi stock market, known as the Tadawul, was mostly informal throughout the 1970s, with only 14
companies listed, but in 1984, the government created a ministerial committee to develop and regulate the
market. In 2003, the government created the Capital Market Authority (CMA), the sole regulator of the market,
and in 2007, the Saudi Stock Exchange (Tadawul) Company was formed. 7 Saudi Arabia was the first country in the Gulf region to launch a parallel market, called Nomu (meaning
“growth” in Arabic), which was established on February 26, 2017.
-
200
400
600
800
0 20 40 60 80
100 120 140 160
1997 1999 2001 2003 2005 2007 2009 2011 2013 2015
Brent Oil GCC Oil Rents (Billions USD) RHS
100 300 500 700 900 1100 1300
300
400
500
600
700
800
2002Q1 2004Q2 2006Q3 2008Q4 2011Q1 2013Q2 2015Q3
Listed Companies Market Capitalization (Billions USD) RHS
6
6
Kuwait has the largest number with 216, followed by Saudi Arabia (172), and then Oman
(131).
Table 1. GCC Markets in 2015
Listed companies Market capitalization
(USD Millions)
GDP
(USD Millions)
Market cap./GDP
Bahrain 46 19.093 31.126 0.61
Kuwait 216 87.767 114.041 0.77
Oman 131 40.984 69.831 0.59
Qatar 42 151.892 164.641 0.92
Saudi Arabia 172 420.656 646.002 0.65
UAE 127 195.776 370.296 0.53
Notes: All figures were obtained from the Arab Monetary Fund and the World Bank.
III. DATA AND THEIR PROPERTIES
A. Data Description
This study examines the asymmetrical effects of oil price fluctuations on stock returns for six
GCC countries: Bahrain, Kuwait, Oman, Qatar, Saudi Arabia, and the UAE. We select
monthly data spanning the period of January 2004–December 2015, except for Kuwait,
where data are only available starting from May 2005.8
As for oil data, we use the monthly Brent spot prices to analyze the international crude oil
market. Oil prices are denominated in US dollars and available from the US Energy
Information Administration (EIA). We compute oil returns using the first logarithmic
difference of oil prices, .9 The stock market data are national stock price indices for the six
GCC countries, expressed in US dollars, gathered from the Morgan Stanley Capital
International (MSCI) database.10
We use monthly returns, defined as the first logarithmic
differences of monthly stock price indices ( . In addition, we include the monthly MSCI
World Index returns, , and the US three-month treasury bill (T-bill) interest rate, , as
control variables for the empirical relationship between oil price and the stock market. The
MSCI World Index and the US three-month T-bill interest rate are among the global factors
that strongly influence GCC stock markets.11
Since GCC global investors consider both local
8 Several empirical studies consider high-frequency data when investigating oil-stock-prices nexus. In fact, as
recommended by Teräsvirta (1998), the quality of the estimated STR models should be checked against
misspecification at the evaluation stage. Then, the selected STR models should pass the main diagnostic tests;
there should be no error autocorrelation, no ARCH effect, parameter constancies, and no remaining
nonlinearity. Since daily or weekly time series would probably exhibit ARCH effects, implementing STR
models would be inappropriate. 9 To check for robustness, we employ other crude oil benchmarks, i.e., West Texas Intermediate (WTI) and
OPEC spot prices. These oil prices did not significantly alter the results of our benchmark specifications. 10 Stock price series are expressed in US dollars to gauge their homogeneous features consistently, and to avoid
the impacts of currency risks on empirical results. 11 Other global factors are considered in the literature to control for the oil-stock-prices nexus. For example,
Arouri et al. (2014) have accounted for the risks associated with economic policy changes in developed
(continued…)

7
7
and world markets, GCC stock markets can be affected by World Index fluctuations. The US
interest rate is used here as a proxy for the GCC interest rate, since GCC monetary policies
follow US monetary policy, due to the links between their national currencies and the US
dollar. These financial data are obtained from the MSCI database.
Compared to previous studies (see Arouri and Rault, 2012; Akoum et al., 2012; and Mohanty
et al., 2011), our sample period is, to some extent, shorter, but more recent, which allows us
to cover some major events, such as the spectacular increases in oil prices throughout 2007
and early 2008, as well as the dramatic change in the financial environment since the
eruption of the subprime crisis in the summer of 2007.12 Also, as reported in Figure 3, after
nearly five years of stability from 2010 to mid-2014, the Brent crude oil price has fallen to its
lowest level in 10 years. The time series plots of our six stock price indices reveal that the
oil-boom-bust cycle of 2007–2009—compounded by the spillover of the subprime crisis—
has strongly impacted the GCC stock market. Significantly, the log levels of GCC stocks and
Brent oil prices plotted in Figure 3 show common trending behaviors, which may be
indicative of some interdependence between all markets. Over the same period, the stock
market indices in GCC countries continue to increase (decrease) as oil prices continue to rise
(fall).
Figure 3. GCC Stock Market Indices and Brent Oil Prices over the Last Decade
Note: Data are monthly log levels of GCC stocks and Brent oil prices. Data are obtained from the EIA and
MSCI database.
Table 2 presents some summary statistics on stock market indices and oil returns over 2004–
2014. For example, monthly average returns on Bahrain’s and Kuwait’s national stock
markets are negative throughout our sample, which may indicate the effect of the oil price
decline in late 2008, as well as that of the recent 2007–2009 GFC. For the rest of our GCC
countries, we document positive average stock returns, with the UAE market showing the
best performance (0.81 percent). Only Qatar’s and the UAE’s stock markets have performed
better than the global equity market proxied by the MSCI World Index (0.65 percent). When
countries (USA and Europe), and how they might spillover into GCC stock markets. The authors rely on the
indices of economic policy uncertainty (EPU), as proposed by Baker et al. (2016). For instance, the EPU index
constructed for the US economy strongly correlates with our control variables, the MSCI global index, and the
three-month US T-bill. 12 Due to lack of data availability, our study does not cover the very recent episode of political tensions in the
GCC region.

8
8
excluding the turbulent year of 2006, Saudi Arabia’s monthly average stock return becomes
comparable to the UAE’s (about 0.79). At the same time, Qatari and Emirati markets are
shown to have recorded the highest variabilities as measured by the standard deviation. Table
2 also reveals a positive average return of 0.13 percent for the Brent oil prices, as well as a
higher volatility rate, which may be due to the past decade’s boom-bust in oil prices.
Table 2. Descriptive Statistics for Stock and Crude Market Returns
Mean (%) Min. (%) Max. (%) Std. Dev. Stock prices
Bahrain -0.04 -12.15 10.35 0.04
Kuwait -0.39 -21.12 19.08 0.07
Oman 0.50 -25.76 15.93 0.05
Qatar 0.68 -28.83 39.61 0.09
Saudi Arabia 0.36 -25.38 18.02 0.08
UAE 0.81 -38.66 35.61 0.11
Brent oil prices 0.13 -31.10 19.60 0.09
MSCI World Index 0.65 -32.16 15.41 0.07
Note: Data are monthly returns on stock market indices and oil prices using first log differences of monthly series. Data are obtained from the EIA and MSCI database.
We also compute the pairwise return correlations for all pairs of indices in our sample, as
reported in Table 3. Of the six GCC countries, the highest positive correlation is found
between the Qatar and UAE stock indices (0.63). Bahrain and Kuwait share the lowest
correlation coefficient (0.29). We note that the country pairs Bahrain/Qatar, Oman/Qatar, and
Oman/UAE each exhibit the same positive correlation coefficient of 0.55. This is not
surprising, as the major GCC stock markets were engaged in several financial liberalization
reforms in the 1990s. These relationships, resulting from the interdependence between
national stock indices and the MSCI Global Index, are positive and vary from 0.04
(Bahrain/world) to 0.45 (Kuwait/world). Evidently, Kuwait is more sensitive to global factors
than (the) other GCC countries. This could be seen as higher sensitivity to global factors in
comparison to the rest of GCC group.
Very similar comovements are observed between the Brent oil index and the national stock
indices across most GCC countries. Each correlation coefficient is close to 0.40, except for
Bahrain (0.18), suggesting that GCC stock markets move jointly with oil prices.
Nevertheless, the positive correlations between national stock markets are, in general, higher
than those between national equity returns and oil markets, indicating that GCC stock
markets are significantly integrated with one another. Finally, the US three-month treasury
bill’s interest rate, as a global factor, seems to influence GCC stock markets weakly. The
same positive relationship is found in each country in the GCC region, but does not exceed
0.16 as a correlation coefficient.

9
9
Table 3. Cross-Correlation Coefficients Among Stock Markets and Oil Returns
Bahrain Kuwait Oman Qatar Saudi Arabia UAE Brent oil MSCI Index US T-bill
Bahrain 1.00
Kuwait 0.29 1.00
Oman 0.58 0.36 1.00
Qatar 0.55 0.32 0.55 1.00
Saudi Arabia 0.41 0.24 0.49 0.52 1.00
UAE 0.59 0.31 0.55 0.63 0.57 1.00
Brent oil 0.18 0.35 0.40 0.35 0.37 0.36 1.00
MSCI Index 0.04 0.45 0.21 0.13 0.13 0.09 0.38 1.00
US T-bill 0.02 0.16 0.05 0.10 0.08 0.08 0.18 0.23 1.00
Note: The table reports correlation coefficients for six GCC stock returns (Bahrain, Kuwait, Oman, Qatar, Saudi
Arabia, and the UAE), the MSCI global return, and the Brent crude oil return. The sample period is between
January 2004 and December 2015, except for Kuwait, where data are only available starting from May 2005.
B. Unit Root Tests
We examine the properties of our key variables by checking stationarity. We test for the
presence of unit roots in the levels (price series in logarithm) and first differences (return
series) of oil and stock market price indices.13 We perform the DF-GLS test, proposed by
Elliott et al. (1996), which is an augmented Dickey-Fuller test, where the time series is
transformed via a generalized least squares (GLS) regression before the test is performed.
Elliott et al. (1996) have shown that this test has significantly greater power than the previous
versions of the augmented Dickey-Fuller approach. Since our study period covers episodes of
high fluctuations in oil and stock markets, structural changes would occur in the oil and stock
return series. Thus, a DF-GLS unit root test might not be powerful in the presence of a
structural break in the considered series. To check whether our unit root test results are robust
to the presence of potential structural breaks, we implement Zivot and Andrews’s (1992) ZA
test and Lumsdaine and Papell’s (1997) LP test henceforth, these being unit root tests that
allow for possible breaks in series.14 In constructing the unit root tests, the level variables
were tested in the presence of both an intercept and a trend. The subsequent tests of first
differences each include only an intercept, given the lack of trending behavior in the first
difference series.
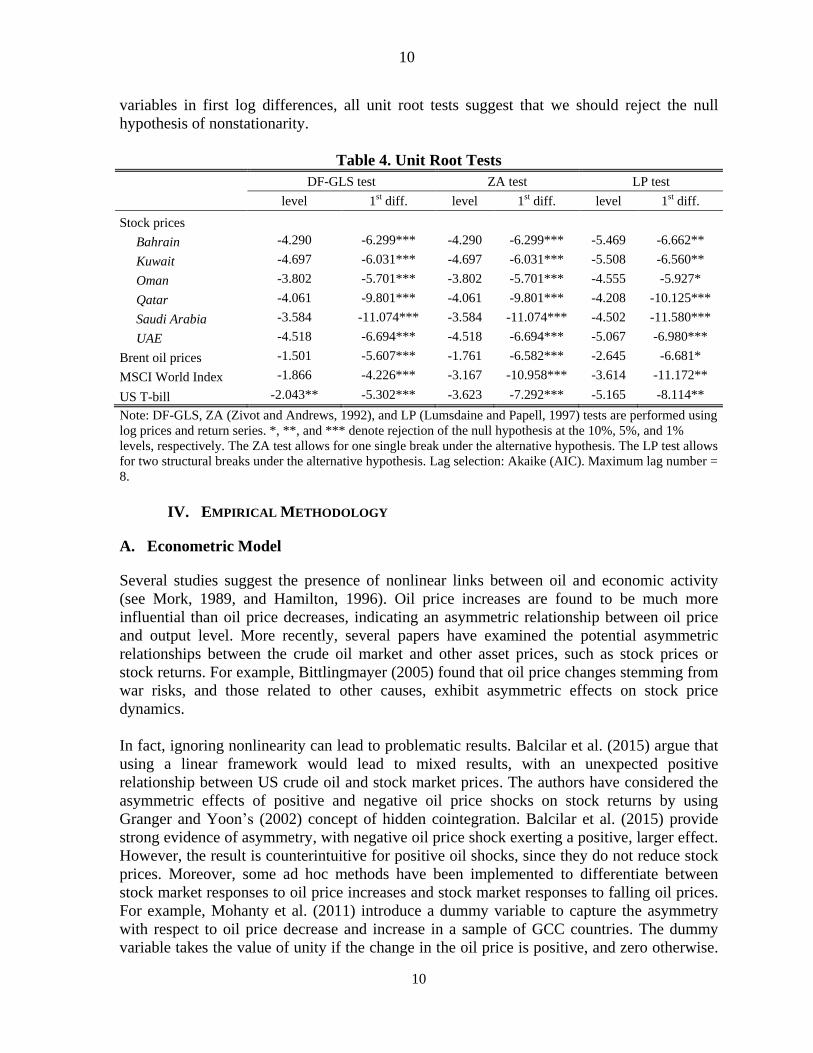
Summary results of these statistical tests for both price and return series are reported in Table
4. Our findings show that, when using DF-GLS unit root tests, the null hypothesis of a unit
root cannot be rejected for all variables across levels, except for the US three-month treasury
bill. In fact, there was a dramatic fall in US interest rates following the recent financial crisis,
which may indicate the presence of structural changes in the data. Hence, when using ZA and
LP unit root tests, the US three-month treasury bill series are found to be nonstationary. For
13 Interest rates are in percentages; therefore, the logarithm is defined as . 14 In the ZA and LP unit root tests, break dates are endogenously determined within the models. The ZA test
allows for one single break under the alternative hypothesis. The LP test is an extension of the Zivot and
Andrews (1992) model, allowing for two structural breaks under the alternative hypothesis.
10
10
variables in first log differences, all unit root tests suggest that we should reject the null
hypothesis of nonstationarity.
Table 4. Unit Root Tests
DF-GLS test ZA test LP test
level 1st diff. level 1st diff. level 1st diff.
Stock prices Bahrain -4.290 -6.299*** -4.290 -6.299*** -5.469 -6.662**
Kuwait -4.697 -6.031*** -4.697 -6.031*** -5.508 -6.560**
Oman -3.802 -5.701*** -3.802 -5.701*** -4.555 -5.927*
Qatar -4.061 -9.801*** -4.061 -9.801*** -4.208 -10.125***
Saudi Arabia -3.584 -11.074*** -3.584 -11.074*** -4.502 -11.580***
UAE -4.518 -6.694*** -4.518 -6.694*** -5.067 -6.980***
Brent oil prices -1.501 -5.607*** -1.761 -6.582*** -2.645 -6.681*
MSCI World Index -1.866 -4.226*** -3.167 -10.958*** -3.614 -11.172**
US T-bill -2.043** -5.302*** -3.623 -7.292*** -5.165 -8.114**
Note: DF-GLS, ZA (Zivot and Andrews, 1992), and LP (Lumsdaine and Papell, 1997) tests are performed using
log prices and return series. *, **, and *** denote rejection of the null hypothesis at the 10%, 5%, and 1%
levels, respectively. The ZA test allows for one single break under the alternative hypothesis. The LP test allows
for two structural breaks under the alternative hypothesis. Lag selection: Akaike (AIC). Maximum lag number =
8.
IV. EMPIRICAL METHODOLOGY
A. Econometric Model
Several studies suggest the presence of nonlinear links between oil and economic activity
(see Mork, 1989, and Hamilton, 1996). Oil price increases are found to be much more
influential than oil price decreases, indicating an asymmetric relationship between oil price
and output level. More recently, several papers have examined the potential asymmetric
relationships between the crude oil market and other asset prices, such as stock prices or
stock returns. For example, Bittlingmayer (2005) found that oil price changes stemming from
war risks, and those related to other causes, exhibit asymmetric effects on stock price
dynamics.
In fact, ignoring nonlinearity can lead to problematic results. Balcilar et al. (2015) argue that
using a linear framework would lead to mixed results, with an unexpected positive
relationship between US crude oil and stock market prices. The authors have considered the
asymmetric effects of positive and negative oil price shocks on stock returns by using
Granger and Yoon’s (2002) concept of hidden cointegration. Balcilar et al. (2015) provide
strong evidence of asymmetry, with negative oil price shock exerting a positive, larger effect.
However, the result is counterintuitive for positive oil shocks, since they do not reduce stock
prices. Moreover, some ad hoc methods have been implemented to differentiate between
stock market responses to oil price increases and stock market responses to falling oil prices.
For example, Mohanty et al. (2011) introduce a dummy variable to capture the asymmetry
with respect to oil price decrease and increase in a sample of GCC countries. The dummy
variable takes the value of unity if the change in the oil price is positive, and zero otherwise.
11
11
While declines in oil prices negatively impact all GCC stock markets, Mohanty et al. (2011)
reveal that oil price increases have mixed effects on stock returns.
In this paper, we adopt a different econometric approach, based on the implementation of
regime-switching models, where it is possible to model two sources of asymmetry. On the
one hand, we analyze the asymmetric effects of positive and negative oil price variations on
stock returns. On the other hand, we check whether large shocks have more pronounced
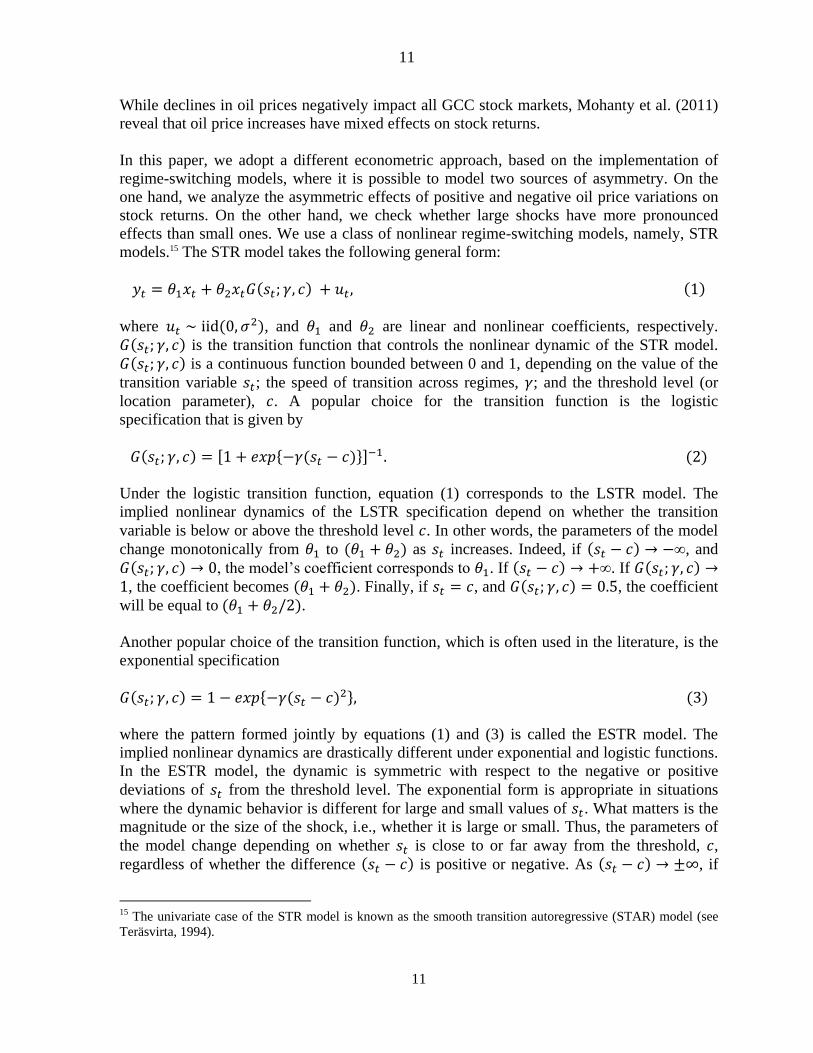
effects than small ones. We use a class of nonlinear regime-switching models, namely, STR
models.15 The STR model takes the following general form:
where , and and are linear and nonlinear coefficients, respectively.
is the transition function that controls the nonlinear dynamic of the STR model.
is a continuous function bounded between 0 and 1, depending on the value of the
transition variable ; the speed of transition across regimes, ; and the threshold level (or
location parameter), . A popular choice for the transition function is the logistic
specification that is given by
Under the logistic transition function, equation (1) corresponds to the LSTR model. The
implied nonlinear dynamics of the LSTR specification depend on whether the transition
variable is below or above the threshold level . In other words, the parameters of the model
change monotonically from to as increases. Indeed, if , and
, the model’s coefficient corresponds to . If . If , the coefficient becomes . Finally, if , and , the coefficient
will be equal to .
Another popular choice of the transition function, which is often used in the literature, is the
exponential specification
where the pattern formed jointly by equations (1) and (3) is called the ESTR model. The
implied nonlinear dynamics are drastically different under exponential and logistic functions.
In the ESTR model, the dynamic is symmetric with respect to the negative or positive
deviations of from the threshold level. The exponential form is appropriate in situations
where the dynamic behavior is different for large and small values of . What matters is the
magnitude or the size of the shock, i.e., whether it is large or small. Thus, the parameters of
the model change depending on whether is close to or far away from the threshold, ,
regardless of whether the difference is positive or negative. As , if
15 The univariate case of the STR model is known as the smooth transition autoregressive (STAR) model (see
Teräsvirta, 1994).
12
12
the exponential transition function is the model coefficients will be equal to
. If , then and the coefficients will correspond to .
Since LSTR and ESTR models allow for different nonlinear behaviors, we must be careful
when implementing these specifications in our analyses of oil price changes’ impacts on
stock returns. The use of LSTR would be appropriate in accounting for asymmetry with
respect to the direction of oil price change, (the asymmetry between negative or positive oil
shocks), especially when the threshold value is close to zero .16 On the other hand, the
exponential form would be more useful in capturing asymmetry with respect to the
magnitude of oil price change, that is, whether an oil shock is small or large.
B. Empirical Specification
In our study, we consider the following nonlinear STR model in order to investigate the
asymmetric effects of oil price changes on stock markets:
where oil return is used as a transition variable ( . All variables included in
equation (4) are return series and, as discussed above, are stationary in first differences.17
According to equation (4), the long-run impact of oil price change is given by the following
time-varying coefficients:
.18
As we experiment with both transition functions, takes the form of a logistic or
exponential function. For the LSTR specifications, the effects of oil prices on stock markets
takes different values depending on whether the transition variable is below or above
16 LSTR models have frequently been implemented for modelling business cycles. By considering an indicator
of economic activity as a transition variable, the logistic model enables us to distinguish between periods of
positive and negative economic growth, i.e., between expansions and contractions (see van Dijk et al., 2002). 17 As variables in levels are integrated of order one, we have tested for the presence of a possible long-run
relationship. We have implemented Gregory and Hansen’s (1996) cointegration test, which explicitly
incorporates a break in the cointegrating relationship. Our results reveal that a long-run cointegrating
“cointegrated” relationship exists only for Saudi Arabia. However, this finding is not robust to a modification of
the significance level considered. Results from Gregory and Hansen’s (1996) cointegration tests are not reported
here in order to save space, but are available upon request. Note that the first differences variables (return
series) are considered here when estimating the impacts of oil prices on stock prices for all GCC countries, as in
equation (4). 18 Following van Dijk et al. (2002), the lag lengths of the variables entering equation (4) are determined by
adopting a general-to-specific approach to select the final specifications. We start with a model with a
maximum lag length of , and then sequentially drop the lagged variables for which the -statistic of the
corresponding parameter is less than 1.0 in absolute value.

13
13
threshold of . If (for a negative oil shock), the impact on stock price
corresponds to
. If (for a positive oil shock), oil
effect becomes
. In the case of the ESTR model, oil price
change’s impact depends on whether is close to or far away from the threshold ,
regardless of whether the difference is positive or negative. Therefore, if
(for a large oil shock), the effect on the stock market will be equal to
. If (for a small oil shock), oil price’s impact
becomes
.
We first use the STR model to test for nonlinearity, in order to select the appropriate lagged
oil return as a threshold variable, and the most suitable form of the transition function,
namely, the logistic or exponential specification. The linearity tests are conducted for each
lagged oil return, , with . Next, the parameters of our STR equation (4) are
estimated using the nonlinear least squares (NLS) estimation technique, which provides
estimators that are consistent and asymptotically normal. In the final step, we check the
quality of our estimated model using some misspecification tests. Of the most frequently
used tests in the STR literature, we implement the Lagrange Multiplier (LM) test of no error
autocorrelation, an LM-type test of no ARCH, the LM test of no remaining nonlinearity, and
an LM-type test of parameter constancy.19
V. EMPIRICAL RESULTS
Over the last decade, oil prices and stock prices have been very volatile following the Global
Financial Crisis (GFC). These have revived the theory that there is a nonlinear relationship
between oil and stock prices. In this paper, we investigate the presence of asymmetric
behaviors on the impacts of oil prices on GCC stock markets. We imagine that a nonlinear
model is more appropriate to account for structural instability, and to capture the existence of
potential asymmetry. As discussed above, there are two types of asymmetry that can be
modeled using nonlinear STR models. On the one hand, asymmetry may arise with respect to
a shift in the direction of oil price change (difference between negative and positive oil
shocks). On the other hand, there is a second type of asymmetry related to the magnitude of
oil prices shocks (whether oil prices changes are small or large).
Following the modelling strategy of Teräsvirta (1994, 1998), we begin by conducting
linearity tests to select the appropriate lagged transition variable . Also, no remaining
nonlinearity tests are conducted after the estimation of our choice of transition variable. The
transition variables to be selected should provide the strongest rejection of both the null of
linearity (against the STR alternative), and of the lack of additive nonlinearity, after the
estimation of the nonlinear model’s estimation20 As reported in Table 5, linearity tests reveal
19 See Eitrheim and Teräsvirta (1996) for a detailed discussion of misspecification tests. 20 The Saudi stock market experienced a rigorous crash in 2006 after the stock price index collapsed, losing
roughly 65 percent of its value. This could possibly be considered an outlier when conducting linearity tests. To
check for robustness, we have tested for smooth transition nonlinearity by adjusting for outliers using iterated
(continued…)

14
14
strong evidence for the presence of nonlinearity in our six GCC countries, except for the
UAE. Accordingly, there is potential asymmetry in the transmission of oil price change to the
stock market. Once linearity has been rejected, the next step is to employ the sequence of the
null hypotheses for selecting the relevant transition function (logistic or exponential). In
Table 5, the best specifications, in terms of rejection of linearity, and of no additive
nonlinearity, are indicated in bold.
As discussed in the STR literature, the increases in computational power have made the
decision rule—which is based on testing a sequence of nested null hypotheses—less
important in practice (van Dijk et al., 2002). Therefore, it would be more convenient to
estimate both LSTR and ESTR models and choose between them at the evaluation stage by
implementing misspecification tests. In addition, economic intuition must be considered in
selecting the adequate transition function. In our study, we aim to explore the two possible
sources of asymmetry with respect to both the direction and magnitude of oil price shock.
Then, we estimate both LSTAR and ESTAR models for each of our GCC countries. This is a
sensible way to determine what kind of asymmetry really drives the impact of oil price on the
stock market. In each case, the best specification is selected with respect to the
misspecification test (no error autocorrelation, no conditional heteroscedasticity, parameter
constancy, and no remaining nonlinearity).
weighted least squares, as in van Dijk et al. (1999). The obtained results are quite similar to those reported in
Table 5. To save space, the results are not reported here, but are available upon request.
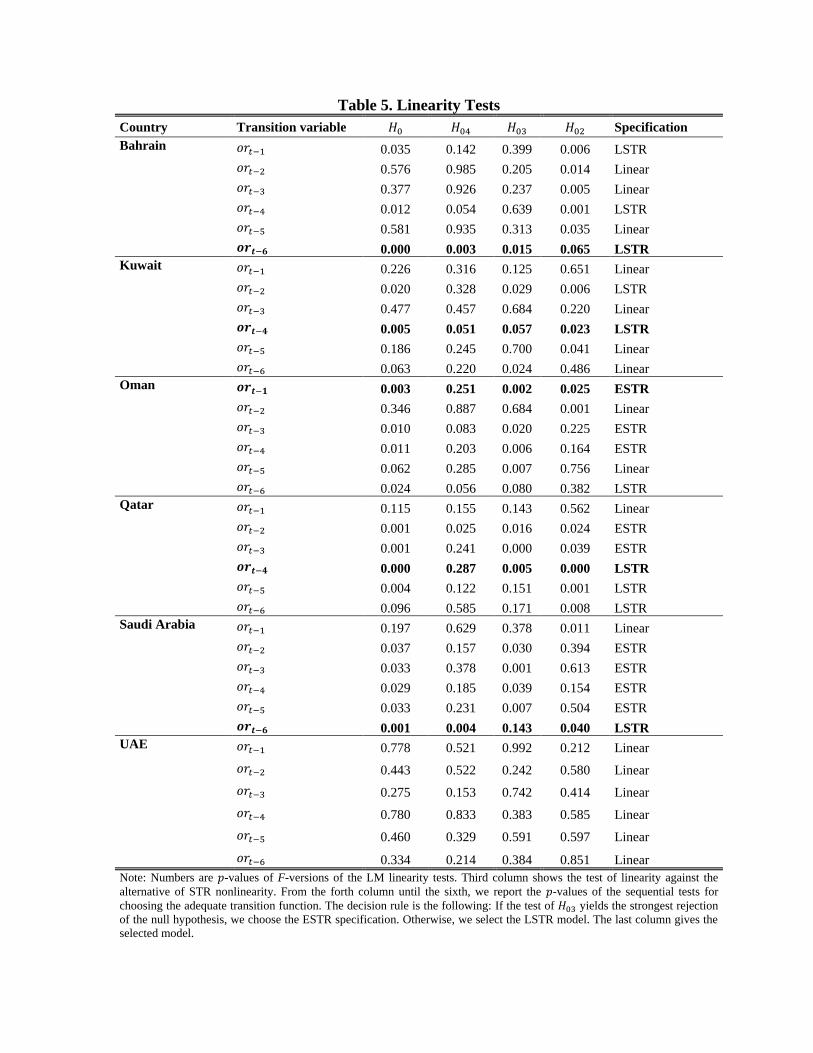
Table 5. Linearity Tests
Country Transition variable Specification
Bahrain 0.035 0.142 0.399 0.006 LSTR
0.576 0.985 0.205 0.014 Linear
0.377 0.926 0.237 0.005 Linear
0.012 0.054 0.639 0.001 LSTR
0.581 0.935 0.313 0.035 Linear
0.000 0.003 0.015 0.065 LSTR
Kuwait 0.226 0.316 0.125 0.651 Linear
0.020 0.328 0.029 0.006 LSTR
0.477 0.457 0.684 0.220 Linear
0.005 0.051 0.057 0.023 LSTR
0.186 0.245 0.700 0.041 Linear
0.063 0.220 0.024 0.486 Linear
Oman 0.003 0.251 0.002 0.025 ESTR
0.346 0.887 0.684 0.001 Linear
0.010 0.083 0.020 0.225 ESTR
0.011 0.203 0.006 0.164 ESTR
0.062 0.285 0.007 0.756 Linear
0.024 0.056 0.080 0.382 LSTR
Qatar 0.115 0.155 0.143 0.562 Linear
0.001 0.025 0.016 0.024 ESTR
0.001 0.241 0.000 0.039 ESTR
0.000 0.287 0.005 0.000 LSTR
0.004 0.122 0.151 0.001 LSTR
0.096 0.585 0.171 0.008 LSTR
Saudi Arabia 0.197 0.629 0.378 0.011 Linear
0.037 0.157 0.030 0.394 ESTR
0.033 0.378 0.001 0.613 ESTR
0.029 0.185 0.039 0.154 ESTR
0.033 0.231 0.007 0.504 ESTR
0.001 0.004 0.143 0.040 LSTR
UAE 0.778 0.521 0.992 0.212 Linear
0.443 0.522 0.242 0.580 Linear
0.275 0.153 0.742 0.414 Linear
0.780 0.833 0.383 0.585 Linear
0.460 0.329 0.591 0.597 Linear
0.334 0.214 0.384 0.851 Linear
Note: Numbers are -values of F-versions of the LM linearity tests. Third column shows the test of linearity against the
alternative of STR nonlinearity. From the forth column until the sixth, we report the -values of the sequential tests for
choosing the adequate transition function. The decision rule is the following: If the test of yields the strongest rejection
of the null hypothesis, we choose the ESTR specification. Otherwise, we select the LSTR model. The last column gives the
selected model.

A. Asymmetry Between Positive and Negative Oil Price Changes
We begin by investigating whether stock returns in GCC countries respond asymmetrically to
oil price decreases and increases. To capture the asymmetry arising from the direction of oil
price shock, we implement the LSTR specification, which is appropriate for separating oil
price into positive and negative changes. We expect negative oil price changes to have larger
impacts on stock returns than their positive counterparts (Sim and Zhou, 2015, and Mohanty
et al., 2011). This is valid for oil-exporting countries. The higher sensitivity of stock returns
to negative oil shocks can be explained by the lower corporate earnings caused by the decline
in industrial production activity.
The NLS estimates of our LSTR equations are reported in Table 6. We indicate a coefficient
for each of the two extreme regimes, namely, for negative oil shock when ,
and for positive oil shock when . Full results from all STR models are
presented in Table A1 and Table A2 in the appendix.21 We compute the sum of the squared
residual ratio, , between the LSTR model and the linear specification, which
provides a better fit for the nonlinear model. We also check the quality of the estimated
LSTR models by conducting several misspecification tests. In most cases, the selected LSTR
models pass the main diagnostic tests (no error autocorrelation, no conditional
heteroscedasticity, parameter constancy, and no remaining nonlinearity).22 In Table 6, we
provide results only for countries for which linearity is rejected, specifically, all GCC
countries except the UAE.
The results related to the asymmetries between the impacts of oil price increases and
decreases on stock returns in GCC countries are summarized as follows: According to Table
6, the estimated threshold values of oil returns are highly significant for all GCC countries,
except Saudi Arabia. Also, they are quite similar for the pairs Bahrain/Kuwait (threshold of
around ) and Oman/Qatar (threshold of around ).
As for the estimated long-run effects of oil price changes, we find that stock return responses
are not statistically significant in Bahrain and Saudi Arabia across the two regimes (for
negative and positive oil price changes). Moreover, Table 6 reveals that negative (or small
positive) oil price changes have significant effects on the stock market returns of Kuwait,
Oman, and Qatar. For instance, when an oil variation is below the threshold of 9 percent
, the response of Qatar’s stock return to a 1 percent oil change is equal to 0.42
percent. For Oman, stock return increases by 0.59 percent for a negative or small oil price
deviation, being below the threshold of 10 percent . For Kuwait, when the oil
21 Lags on MSCI World Index returns and US three-month T-bills are found to be statistically insignificant
across different estimated models. Hence, we retain only contemporaneous coefficients on MSCI index. In this
context, returns and the three-month T-bill in the selection of our final specification. 22 The best selected specifications in Tables 6 and 7 are, to some extent, different from those indicated by the
sequential linearity tests in Table 5. As explained above, at this stage of estimation, the best specification is
selected with respect to the misspecification test (no error autocorrelation, no conditional heteroscedasticity,
parameter constancy, and no remaining nonlinearity).

17
17
return decreases by over 10 percent , the response of the stock return, following
a 1 percent oil price change, is equal to 0.66 percent.
It is important to note that only Kuwait shows a significant reaction to stock price (about 0.33
percent), when oil price change is above the estimated threshold, such as when oil shock is
positive (or slightly negative, with a decrease of less than 10 percent) According to Table 6,
Kuwait’s stock market exposure to oil price change is significantly unequal across the two
regimes. When oil price changes are higher than the estimated thresholds in Oman and Qatar,
the responses of stock price returns are weak and insignificant.
Table 6. Estimated Impacts of Oil Returns on GCC Stock Markets Using LSTR Specifications
Bahrain Kuwait Oman Qatar Saudi Arabia
Transition variable )
Threshold -0.095*** -0.100*** 0.099*** 0.091*** 0.040
(0.019) (0.012) (0.019) (0.011) (0.034)
Speed of transition 6.766 8.654 7.341 14.052 4.032
(7.401) (13.941) (5.747) (16.130) (4.492)
Negative oil changes:
Long-run effect 0.116 0.663*** 0.587*** 0.419*** 0.418
(0.406) (0.161) (0.166) (0.132) (0.286)
Positive oil changes:
Long-run effect -0.108 0.330** 0.133 0.220 0.178
(0.168) (0.159) (0.361) (0.509) (0.484)
0.464 0.422 0.402 0.444 0.458
0.715 0.700 0.693 0.683 0.716
0.488 0.654 0.351 0.937 0.923
0.539 0.805 0.984 0.358 0.007
0.547 0.276 0.387 0.343 0.295
0.397 0.237 0.339 0.268 0.226
Note: Table reports the impacts of oil price changes on GCC stock returns over 2004–2015. Results are
obtained from the STR equation (4) using the LSTR. Numbers in parentheses are the standard errors. *, **, and
*** denote significance at the 10%, 5%, and 1% levels, respectively. denotes the coefficient of
determination. is the ratio of the sum of squared residuals between the LSTR model and the linear
specification. The following rows correspond to the misspecification tests: is the -value of the LM
test of no error autocorrelation up to the sixth order. is the -value of the LM test of no ARCH
effects up to the sixth order. is the -value of the LM test of parameter constancy, and is the -
value of the LM test of no remaining nonlinearity.
To clarify the picture in Kuwait’s case, we plotted both the estimated logistic functions and
the stock return responses as functions of lagged oil returns in Figure 4.23
23 Plots for Bahrain, Oman, and Qatar are not displayed because long-run coefficients are not significant for
positive oil price deviations.

18
18
The plotted logistic transition function is an increasing function of the transition variable
, and is obtained using the estimated values of and as
. Similarly, the stock return response depends on the value
taken by , and is calculated using the formula for the long-run impact of oil return:
. As shown in Figure 4, the transition
between both extreme regimes, and , is smooth for Kuwait.
Also, after observing Figure 4, we note that the reaction of the stock market is higher in
negative oil return cases in Kuwait.
Figure 4. Logistic Functions and Long-Run Effects of Oil Prices
Kuwait
Note: The estimated logistic functions and long-run oil return impacts on stock markets are plotted on the y-
axis. The x-axis features/includes the different values taken by the transition variable, . The estimated
logistic function is calculated using
. The long-run oil impact on
stock return is obtained from the following formula:
.
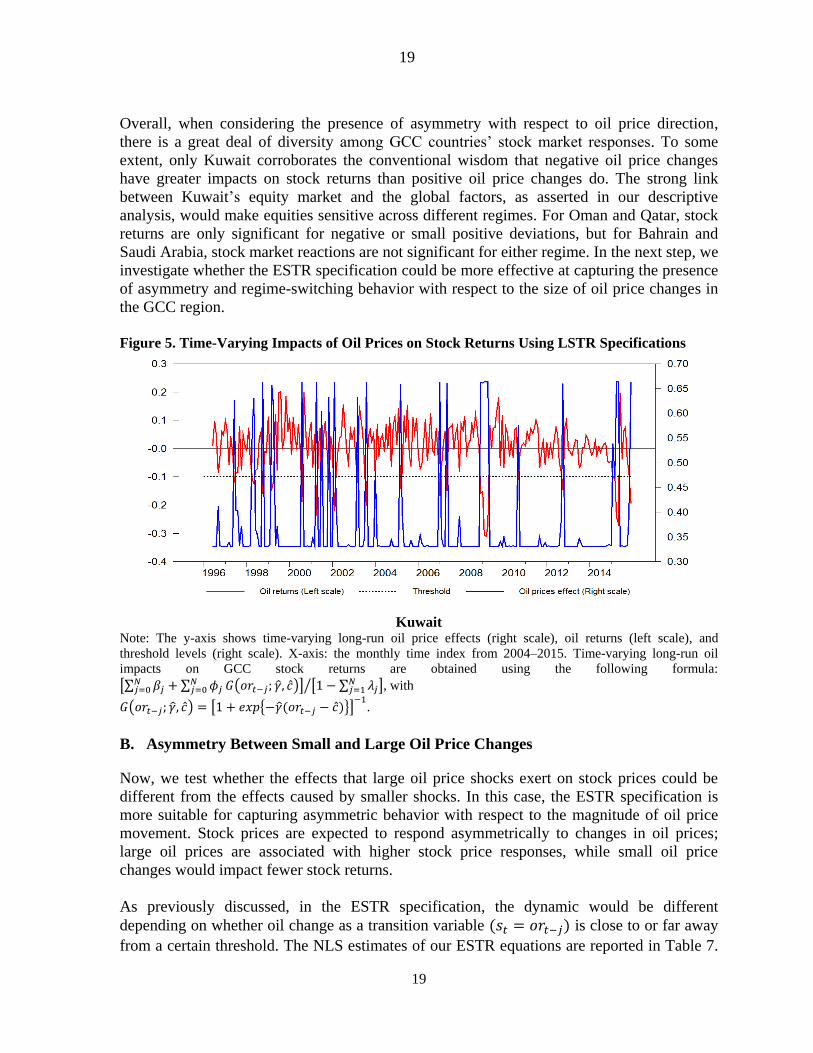
To gain further insight into the responses of GCC stock returns to oil price decreases and
increases, we provide the plots of long-run oil effect estimates over time in Figure 5, with the
estimated threshold levels superimposed. In Figure 5, the long-run oil effect is a time-varying
coefficient that depends on the evolution of oil returns, , over time:
. The displayed plots reveal that each time
the oil return falls below a given threshold, the stock return’s reaction is more pronounced in
Kuwait.
Indeed, when using the LSTR specification, the estimated threshold should be very close to
zero in order to determine whether an oil price change is positive or negative.
However, in most of cases, our LSTR models provide estimated thresholds that are, to some
degree, different from the expected threshold level of , ranging from in
Kuwait to in Oman. This might explain why we do not find significant asymmetric
effects for positive and negative oil price changes on stock returns for most of our GCC
countries.
19
19
Overall, when considering the presence of asymmetry with respect to oil price direction,
there is a great deal of diversity among GCC countries’ stock market responses. To some
extent, only Kuwait corroborates the conventional wisdom that negative oil price changes
have greater impacts on stock returns than positive oil price changes do. The strong link
between Kuwait’s equity market and the global factors, as asserted in our descriptive
analysis, would make equities sensitive across different regimes. For Oman and Qatar, stock
returns are only significant for negative or small positive deviations, but for Bahrain and
Saudi Arabia, stock market reactions are not significant for either regime. In the next step, we
investigate whether the ESTR specification could be more effective at capturing the presence
of asymmetry and regime-switching behavior with respect to the size of oil price changes in
the GCC region.
Figure 5. Time-Varying Impacts of Oil Prices on Stock Returns Using LSTR Specifications
Kuwait
Note: The y-axis shows time-varying long-run oil price effects (right scale), oil returns (left scale), and
threshold levels (right scale). X-axis: the monthly time index from 2004–2015. Time-varying long-run oil
impacts on GCC stock returns are obtained using the following formula:
, with
.
B. Asymmetry Between Small and Large Oil Price Changes
Now, we test whether the effects that large oil price shocks exert on stock prices could be
different from the effects caused by smaller shocks. In this case, the ESTR specification is
more suitable for capturing asymmetric behavior with respect to the magnitude of oil price
movement. Stock prices are expected to respond asymmetrically to changes in oil prices;
large oil prices are associated with higher stock price responses, while small oil price
changes would impact fewer stock returns.
As previously discussed, in the ESTR specification, the dynamic would be different
depending on whether oil change as a transition variable is close to or far away
from a certain threshold. The NLS estimates of our ESTR equations are reported in Table 7.
20
20
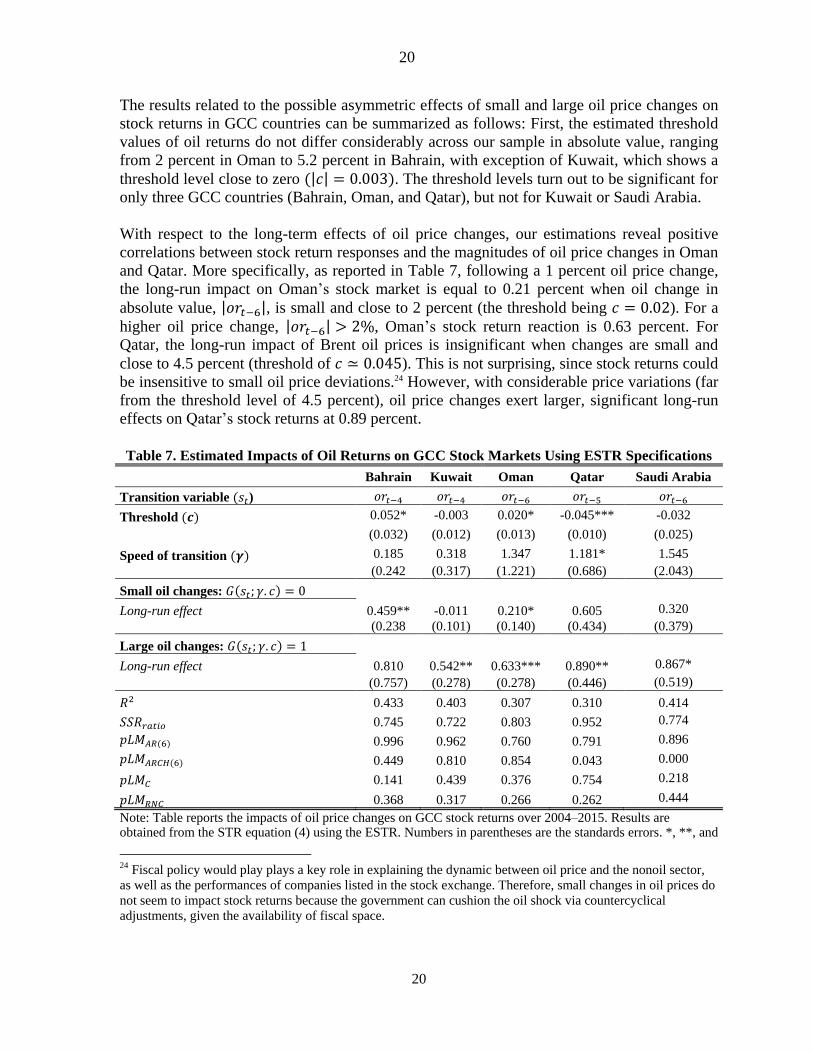
The results related to the possible asymmetric effects of small and large oil price changes on
stock returns in GCC countries can be summarized as follows: First, the estimated threshold
values of oil returns do not differ considerably across our sample in absolute value, ranging
from 2 percent in Oman to 5.2 percent in Bahrain, with exception of Kuwait, which shows a
threshold level close to zero . The threshold levels turn out to be significant for
only three GCC countries (Bahrain, Oman, and Qatar), but not for Kuwait or Saudi Arabia.
With respect to the long-term effects of oil price changes, our estimations reveal positive
correlations between stock return responses and the magnitudes of oil price changes in Oman
and Qatar. More specifically, as reported in Table 7, following a 1 percent oil price change,
the long-run impact on Oman’s stock market is equal to 0.21 percent when oil change in
absolute value, , is small and close to 2 percent (the threshold being ). For a
higher oil price change, , Oman’s stock return reaction is 0.63 percent. For
Qatar, the long-run impact of Brent oil prices is insignificant when changes are small and
close to 4.5 percent (threshold of ). This is not surprising, since stock returns could
be insensitive to small oil price deviations.24 However, with considerable price variations (far
from the threshold level of 4.5 percent), oil price changes exert larger, significant long-run
effects on Qatar’s stock returns at 0.89 percent.
Table 7. Estimated Impacts of Oil Returns on GCC Stock Markets Using ESTR Specifications
Bahrain Kuwait Oman Qatar Saudi Arabia
Transition variable )
Threshold 0.052* -0.003 0.020* -0.045*** -0.032
(0.032) (0.012) (0.013) (0.010) (0.025)
Speed of transition 0.185 0.318 1.347 1.181* 1.545
(0.242 (0.317) (1.221) (0.686) (2.043)
Small oil changes:
Long-run effect 0.459** -0.011 0.210* 0.605 0.320
(0.238 (0.101) (0.140) (0.434) (0.379)
Large oil changes:
Long-run effect 0.810 0.542** 0.633*** 0.890** 0.867*
(0.757) (0.278) (0.278) (0.446) (0.519)
0.433 0.403 0.307 0.310 0.414
0.745 0.722 0.803 0.952 0.774
0.996 0.962 0.760 0.791 0.896
0.449 0.810 0.854 0.043 0.000
0.141 0.439 0.376 0.754 0.218
0.368 0.317 0.266 0.262 0.444
Note: Table reports the impacts of oil price changes on GCC stock returns over 2004–2015. Results are obtained from the STR equation (4) using the ESTR. Numbers in parentheses are the standards errors. *, **, and
24 Fiscal policy would play plays a key role in explaining the dynamic between oil price and the nonoil sector,
as well as the performances of companies listed in the stock exchange. Therefore, small changes in oil prices do
not seem to impact stock returns because the government can cushion the oil shock via countercyclical
adjustments, given the availability of fiscal space.
21
21
*** denote significance at the 10%, 5%, and 1% levels, respectively. denotes the coefficient of determination. is the ratio of the sum of squared residuals between the LSTR model and the linear specification. The following rows correspond to the misspecification tests: is the -value of the LM test of no error autocorrelation up to the sixth order. is the -value of the LM test of no ARCH effects up to the sixth order. is the -value of the LM test of parameter constancy, and is the -value of the LM test of no remaining nonlinearity.
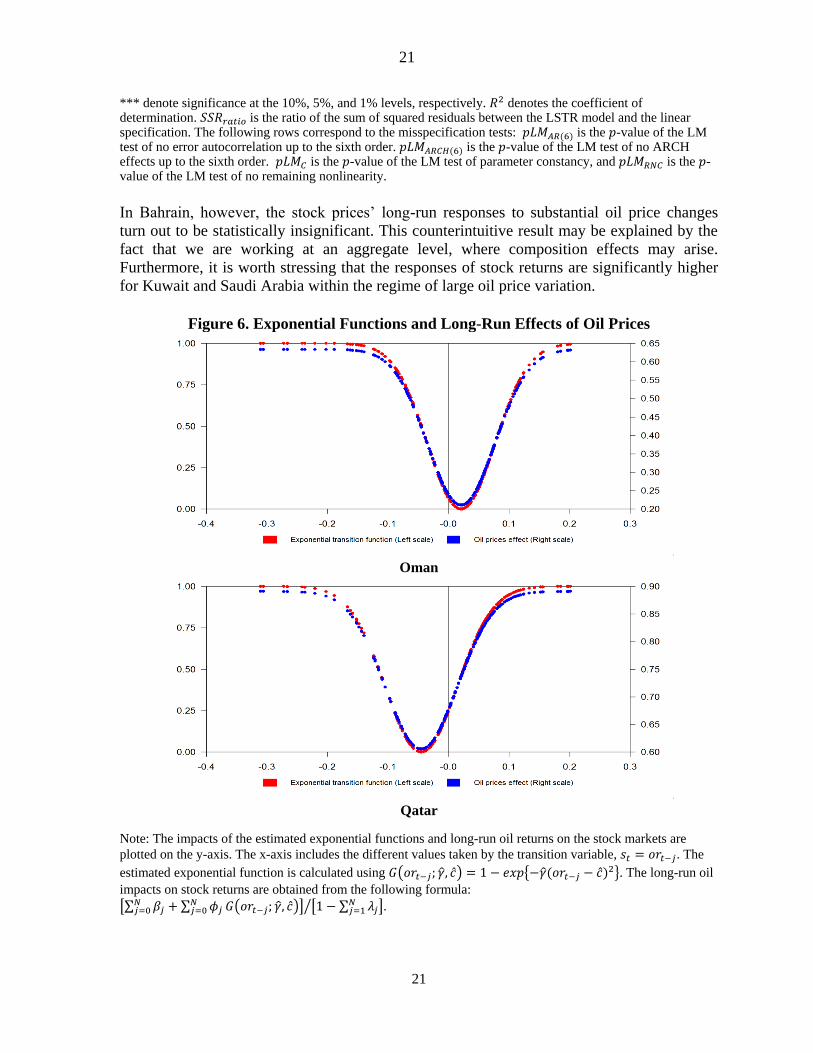
In Bahrain, however, the stock prices’ long-run responses to substantial oil price changes
turn out to be statistically insignificant. This counterintuitive result may be explained by the
fact that we are working at an aggregate level, where composition effects may arise.
Furthermore, it is worth stressing that the responses of stock returns are significantly higher
for Kuwait and Saudi Arabia within the regime of large oil price variation.
Figure 6. Exponential Functions and Long-Run Effects of Oil Prices
Oman
Qatar
Note: The impacts of the estimated exponential functions and long-run oil returns on the stock markets are
plotted on the y-axis. The x-axis includes the different values taken by the transition variable, . The
estimated exponential function is calculated using . The long-run oil
impacts on stock returns are obtained from the following formula:
.
22
22
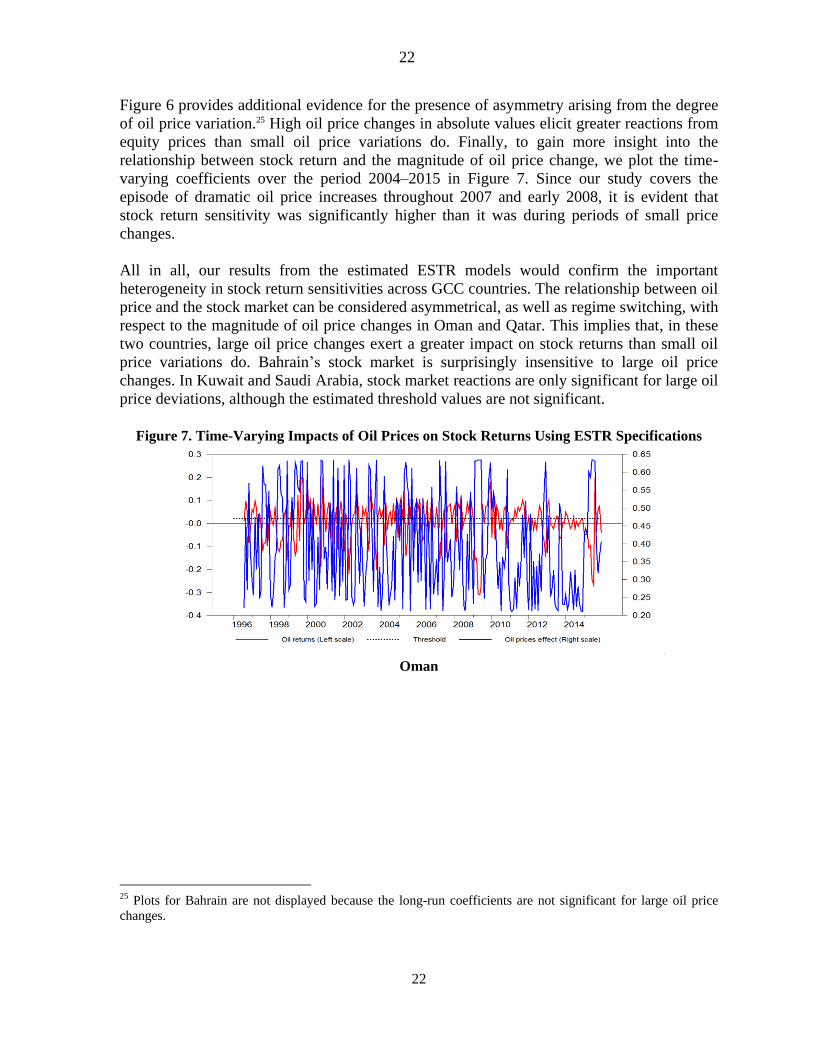
Figure 6 provides additional evidence for the presence of asymmetry arising from the degree
of oil price variation.25 High oil price changes in absolute values elicit greater reactions from
equity prices than small oil price variations do. Finally, to gain more insight into the
relationship between stock return and the magnitude of oil price change, we plot the time-
varying coefficients over the period 2004–2015 in Figure 7. Since our study covers the
episode of dramatic oil price increases throughout 2007 and early 2008, it is evident that
stock return sensitivity was significantly higher than it was during periods of small price
changes.
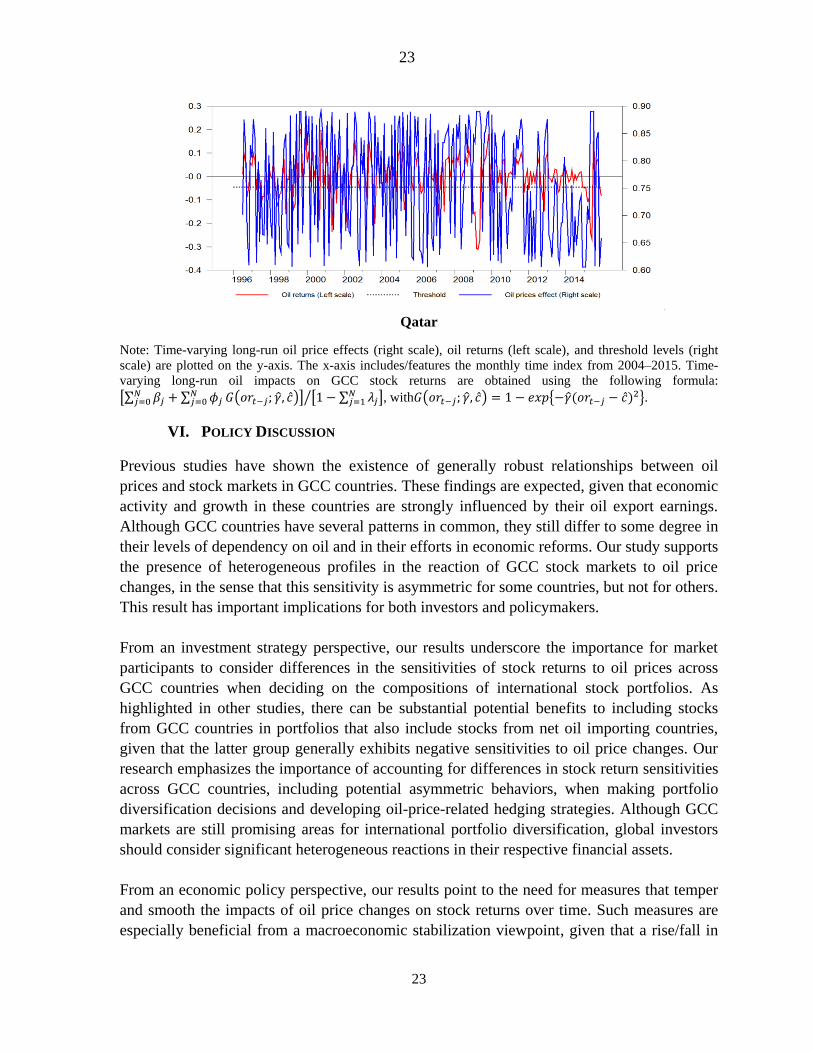
All in all, our results from the estimated ESTR models would confirm the important
heterogeneity in stock return sensitivities across GCC countries. The relationship between oil
price and the stock market can be considered asymmetrical, as well as regime switching, with
respect to the magnitude of oil price changes in Oman and Qatar. This implies that, in these
two countries, large oil price changes exert a greater impact on stock returns than small oil
price variations do. Bahrain’s stock market is surprisingly insensitive to large oil price
changes. In Kuwait and Saudi Arabia, stock market reactions are only significant for large oil
price deviations, although the estimated threshold values are not significant.
Figure 7. Time-Varying Impacts of Oil Prices on Stock Returns Using ESTR Specifications
Oman
25 Plots for Bahrain are not displayed because the long-run coefficients are not significant for large oil price
changes.
23
23
Qatar
Note: Time-varying long-run oil price effects (right scale), oil returns (left scale), and threshold levels (right
scale) are plotted on the y-axis. The x-axis includes/features the monthly time index from 2004–2015. Time-
varying long-run oil impacts on GCC stock returns are obtained using the following formula:
, with
.
VI. POLICY DISCUSSION
Previous studies have shown the existence of generally robust relationships between oil
prices and stock markets in GCC countries. These findings are expected, given that economic
activity and growth in these countries are strongly influenced by their oil export earnings.
Although GCC countries have several patterns in common, they still differ to some degree in
their levels of dependency on oil and in their efforts in economic reforms. Our study supports
the presence of heterogeneous profiles in the reaction of GCC stock markets to oil price
changes, in the sense that this sensitivity is asymmetric for some countries, but not for others.
This result has important implications for both investors and policymakers.
From an investment strategy perspective, our results underscore the importance for market
participants to consider differences in the sensitivities of stock returns to oil prices across
GCC countries when deciding on the compositions of international stock portfolios. As
highlighted in other studies, there can be substantial potential benefits to including stocks
from GCC countries in portfolios that also include stocks from net oil importing countries,
given that the latter group generally exhibits negative sensitivities to oil price changes. Our
research emphasizes the importance of accounting for differences in stock return sensitivities
across GCC countries, including potential asymmetric behaviors, when making portfolio
diversification decisions and developing oil-price-related hedging strategies. Although GCC
markets are still promising areas for international portfolio diversification, global investors
should consider significant heterogeneous reactions in their respective financial assets.
From an economic policy perspective, our results point to the need for measures that temper
and smooth the impacts of oil price changes on stock returns over time. Such measures are
especially beneficial from a macroeconomic stabilization viewpoint, given that a rise/fall in

24
24
equity price increases/reduces the corporate sector’s wealth, thereby reinforcing the adverse
impact on aggregate demand.
In GCC countries’ equity markets, most stocks are held in domestic nonoil companies.26
Therefore, from a policymaker’s viewpoint, stabilizing the impact of oil price change on
nonoil growth is key. The main channel for such stabilization has been fiscal policy, given
the GCC group’s adherence to the exchange rate peg, particularly through public expenditure
policy, and in view of the fledgling taxation system. Ongoing and expected structural reforms
are important because they serve to diversify the economic base and increase nonoil sources
of financing, thereby reducing the expected sensitivity of nonoil growth to oil-related
influences over time. To illustrate, in the case of an oil price decline (the opposite channels
operate for an oil price increase), oil revenue falls, leading to weaker fiscal and external
positions. Equity returns fall to the extent that market participants expect an adverse impact
on nonoil growth, of which the expected fiscal adjustment (especially government spending)
is a key determinant. The sensitivity of stock return to price decline is likely to improve
while oil price declines, insofar as market participants expect a higher probability of an
adverse impact on nonoil growth due to fiscal adjustment. That impact is tempered, in that
the fiscal adjustment is complemented by reforms that diversify the economic base and
increase nonoil growth resilience over time.
Given the above linkages, the sensitivity of equity return to oil price depends on economic
conditions and policy-related considerations that can be grouped into three broad categories.
The first category involves the market expectations relating to the impacts of oil price
changes on a country’s fiscal balances under current policy trends, and the magnitude of the
fiscal adjustment that needs to be undertaken to achieve economically sound, or “desirable,”
fiscal balances that are in line with the country’s fiscal sustainability and intergenerational
equity objectives. The fiscal gaps between the projected fiscal balances and desirable
balances have been estimated by the IMF (2015, 2016, 2017)27 in the aftermath of the 2014–
15 oil price drop. These gaps are a function of the expected path of oil prices, and the degree
of the country’s dependence on oil, as well as the paths of expenditure and revenue-
generating measures under current trends. Assuming that lower oil prices are expected to
persist over the longer term, we estimate these fiscal gaps to be in the range of 10 to 25
percentage points of nonoil GDP for Bahrain, Kuwait, Oman, and Saudi Arabia, and 5
percent for Qatar and the UAE.
26 Saudi Arabia’s equity market is notable in the GCC, in that it also has significant direct exposure to the oil
sector through stocks in the domestic petrochemical sector. Nevertheless, over three-quarters of Saudi market
shares are in nonoil companies. 27 See the issues of the IMF’s Regional Economic Outlook relating to the Middle East and Central Asia for the
years 2015 to 2017.

25
25
The second key category is the pace at which fiscal adjustment measures are implemented to
raise fiscal balances toward their desired levels and eliminate fiscal gaps. Fiscal adjustment
that is smoothed over time, ceteris paribus, tends to limit the adverse impact on nonoil
growth, corporate profits, and equity markets. That pace, in turn, is determined by the fiscal
space available, as measured by the size of a government’s financial assets (fiscal buffers),
and its capacity to borrow. A higher fiscal space enables a smoother fiscal adjustment,
thereby reducing the impact of oil price change on the equity market. In addition, the greater
space, by enabling easier access to international bond markets, tempers the impact of oil
price change on domestic financing requirements and liquidity, further limiting the impacts
on equity prices. The IMF’s (2015) assessment—measured in terms of financial assets—is
that Kuwait, Qatar, and the UAE have relatively comfortable buffers; current trends show
that their assets are sufficient to finance their fiscal deficits for 20 more years. On the other
hand, Bahrain’s, Oman’s, and Saudi Arabia’s financial assets are sufficient to finance their
deficits for less than five years, according to current trends. As measured by their borrowing
capacities, the assessments of the debt-to-GDP projected paths for 2015 to 2020 suggests that
Kuwait, Saudi Arabia, and the UAE have the widest fiscal spaces, and Oman and Qatar have
intermediate positions, while Bahrain is in a relatively vulnerable position.
The third key category relates to the degree of diversity within the GCC economy, as
reflected in the share of oil fiscal revenue in total revenues (about 70 percent for the UAE,
and between 84 and 91 percent for the other GCC countries, using the average for 2011–
2014). The GCC economy’s diversification hinges on the prospect of reducing that share
over time through structural reform.
In terms of structural reform signals, all six GCC countries have set out broadly similar
reform plans in the aftermath of the 2014 oil price decline. They have also made progress in
setting out and clearly communicating credible, well-defined medium-term fiscal
frameworks. Within each framework, an important objective has been the implementation of
adjustment policies that are supported by structural reforms to diversify their economies
away from the hydrocarbon sector, and expand the contribution of the private sector. In that
regard, the UAE has made a head start in diversifying its export base, including in the areas
of tourism, business, and transport services. Bahrain has also made important strides in
expanding financial services and food processing. Saudi Arabia, in line with its strategic
development plan (Vision 2030), has initiated significant reforms in the equity and bond
markets to encourage greater foreign investment, and has also made progress in privatization.
However, GCC countries have been uniformly slow in expanding their nonoil revenue bases,
delaying the implementation of regional VAT frameworks.28
28 Saudi Arabia and the UAE began implementing VATs in January 2018.
26
26
Key determinants of asymmetry in stock price reaction include the interplay between the
three aforementioned factors, and the impact on nonoil growth. However, it is difficult to
predict a priori the weight that market participants for a particular country would give each of
the three factors in forming expectations regarding the impact of a given oil price change. In
particular, the econometric results of our paper indicate that asymmetrical stock price
reactions occur in Kuwait, Oman, and Qatar, but not in the other GCC countries.
What is special about these three countries with respect to the considerations set out above?
In Kuwait’s and Oman’s cases, the fiscal gaps are relatively high, estimated at 10 and 25
percent of nonoil GDP (respectively). However, for Qatar, the fiscal gap is among the lowest
in the GCC group, at 5 percent of nonoil GDP. In terms of fiscal space, Oman’s financial
assets are insufficient to finance its deficits for more than five years, and it has an
intermediate position in terms of the path of the public debt-to-GDP ratio. Both Kuwait and
Qatar fare relatively well in terms of their fiscal spaces, with ample financial assets and
relatively good positions regarding their public debt-to-GDP ratios. All three countries’
economies are inadequately diversified, with ratios of hydrocarbon fiscal revenue to total
revenue being well above 80 percent.
In sum, Kuwait, Oman, and Qatar each have at least one feature that, as a result of a negative
or large oil price change, could potentially signal a high likelihood of substantial fiscal
adjustment. However, the combination of relevant factors is different in each of the three
countries. While Oman faces challenges due to all three factors, in Kuwait and Qatar, the
main operative factors appear to be their high degrees of reliance on hydrocarbon revenues.
VII. CONCLUSION
This paper investigates the asymmetric mechanisms in stock markets’ responses to oil price
changes. The recent spectacular swings in the crude oil market, as well as the dramatic
changes in the financial environment since the eruption of the subprime crisis, have revived
interest in the asymmetric, nonlinear relationship between oil price and the stock market.
While the bulk of the existing empirical literature has devoted more attention to the
asymmetry arising from the direction of oil price change, our study proposes to implement a
relevant econometric method that enables us to explore the two possible sources of
asymmetry in stock price reactions: the direction and magnitude of oil price change. We use
the class of nonlinear STR models, where different regimes can be identified with respect to
estimated thresholds. To capture the asymmetry arising from the direction of oil price shock,
we use the LSTR, which is appropriate for separating oil price into positive and negative
changes. However, the ESTR is more suitable for distinguishing between large and small oil
price changes when capturing asymmetric behavior with respect to the size of oil price
movement. Our study includes six GCC countries (Bahrain, Kuwait, Oman, Qatar, Saudi
Arabia, and the UAE), and uses monthly data from January 2004–December 2015. When
investigating the presence of asymmetry with respect to the direction of oil price change, our
results reveal a great deal of diversity in the individual responses of GCC stock markets. For
example, only Kuwait’s stock market reactions to oil price changes are not significantly
27
27
equal for both rising and falling oil prices. The ESTR specification, which helps us to
examine asymmetry with respect to oil price change’s magnitude, confirms the presence of
heterogeneous profiles in GCC equity markets. More specifically, we find that Omani and
Qatari stock markets exhibit higher sensitivities to large oil price changes than to small ones.
Our empirical results document stock markets’ heterogeneous reactions across GCC
countries, which researchers, regulators, and market actors should consider. Being OPEC
members, and therefore, part of the Organization's decision-making process, GCC countries
should carefully study the impacts of oil price variations on their own economies and stock
markets. The significant asymmetries in the relationships between oil prices and stock
markets in some GCC nations (Kuwait, Oman, and Qatar), but not in others (Bahrain, Saudi
Arabia, and the UAE), means investors should exercise more caution when deciding on the
compositions of international stock portfolios.
Our findings also underline the role of economic policy in reducing the sensitivity of stock
return to oil price change. From a policy perspective, our framework could serve to identify
countries in which asymmetries prevail, where policy action would be especially beneficial
from the economic stabilization and reform perspectives. These include policies that ensure
consistency with fiscal sustainability and intergenerational equity goals, as well as structural
reforms that diversify economic and revenue bases.
Further research is required to extend our analysis. First, the asymmetric mechanisms in
stock markets’ responses to oil price variations in GCC countries are likely to be different
across various economic sectors. Therefore, a sectoral analysis of this link could provide
additional and disaggregated results and complement our analysis. Second, since our analysis
does not cover the more recent GCC diplomatic crisis (2017) due to lack of data availability,
future studies should consider such episodes of geopolitical tensions. Recently, Caldara and
Iacoviello (2018) have proposed a monthly index of geopolitical risk, which is constructed to
measure risks associated with wars, tensions between states, and terrorist acts that affect the
normal course of international relations. Third, to gain insight into the phenomenon of
asymmetry, it would be beneficial to test for nonlinear causal relationships between oil and
stock markets in GCC countries. One option would be to conduct a nonlinear Granger
causality test based on the STR framework developed by Skalin and Teräsvirta (1999).

REFERENCES
Akoum, I., M. Graham, J. Kivihaho, J. Nikkinen, and M. Omran, 2012, “Co-movement of oil
and stock prices in the GCC region: A wavelet analysis,” The Quarterly Review of
Economics and Finance, Vol. 52, pp. 385-394.
Al-Maadid, A., F. Spagnolo, and N. Spagnolo, 2016. “Stock Prices and Crude Oil Shocks:
The Case of GCC Countries,” in Handbook of Frontier Markets.
Almohaimeed, A., and N. Harrathi, 2013, “Volatility Transmission and Conditional
Correlation between Oil prices, Stock Market and Sector Indexes: Empirics for Saudi Stock
Market,” Journal of Applied Finance and Banking, Vol. 3, No. 4, pp. 125-141.
Arouri, M., A. Lahiani, and D. Nguyen, 2011, “Return and volatility transmission between
world oil prices and stock markets of the GCC countries,” Economic Modeling, Vol. 28, No.
4, pp. 1815-1825.
Arouri, M., and C. Rault, 2012, “Oil prices and stock markets in GCC countries: empirical
evidence from panel analysis,” International Journal of Finance and Economics, Vol.17, pp.
242-253.
Arouri, M., Rault C., and F. Teulon, 2014, “Economic policy uncertainty, oil price shocks
and GCC stock markets”, Economics Bulletin, Vol. 34 No. 3 pp. 1822-1834.
Baker, S. R., N. Bloom, and S. J. Davis, 2016, "Measuring Economic Policy
Uncertainty", The Quarterly Journal of Economics, Volume 131, Issue 4, pp. 1593–1636.
Balcilar, M., R. Gupta, and S. M. Miller, 2015, “Regime switching model of US crude oil
and stock market prices: 1859 to 2013,” Energy Economics Vol. 49, pp. 317–327.
Bittlingmayer, G, 2005, “Oil and stocks: Is it war risk?”: University of Kansas manuscript,
December 29, 2005.
Caldara, D. and M., Iacoviello, 2018, Measuring Geopolitical Risk. FRB International
Finance Discussion Paper No. 1222.
Caporale, G.M.; Rault, C.; Sova, A.D.; Sova, R. 2015, "Financial Developement and
Economic Growth: Evidence From 10 New European Union Members”, International
Journal of Finance and Economics, Volume 20, Issue 1, pp 48–60.
Cologni A, and M. Manera, 2008, “Oil prices, inflation and interest rates in a structural
cointegrated VAR model for the G-7 countries,” Energy Economics, Vol. 30, No. 3, pp. 856-
888.
Drine, I. and Rault, C. 2006, "Testing for inflation convergence between the Euro Zone and
its CEE partners", Applied Economics Letters, 13 (4), 235-240.

29
29
Dutta A., J. Nikkinen, and T. Rothovius, 2017, “Impact of oil price uncertainty on Middle
East and African stock markets,” Energy 123, pp. 189–197.
Elliott, G., T. Rothenberg, and J. Stock, 1996, “Efficient Tests for an Autoregressive Unit
Root,” Econometrica, Vol. 64, No. 4, pp. 813–836.
Eitrheim. Ø., and T. Teräsvirta, 1996, “Testing the adequacy of smooth transition
autoregressive models,” Journal of Econometrics, Vol. 74, pp. 59–76.
Granger, C. W., and G. Yoon, 2002, “Hidden Cointegration,” Department of Economics
Discussion Paper 2002-02, University of California, San Diego.
Gregory, A., and H. Hansen, 1996, “Residual-based tests for cointegration in models with
regime shifts,” Journal of Econometrics, Vol. 70, No 4, pp. 99–126.
Gronwald M., 2008, ““Large Oil Shocks and the US Economy: Infrequent Incidents with
Large Effects,” Energy Journal, Vol. 29, No. 1, pp.151–171.
Hamilton, J. D., 1996, “This is what happened to the oil price–macroeconomy relationship,”
Journal of Monetary Economics, Vol. 38, No.2, pp. 215-220.
Jouini, J., and N. Harrathi, 2014, “Revisiting the shock and volatility transmissions among
GCC, stock and oil markets: a further investigation,” Economic Modelling, Vol. 38, pp. 486-
494.
Kilian L, 2008, “Exogenous Oil Supply Shocks: How Big Are They and How Much Do They
Matter for the U.S. Economy?” Review of Economics and Statistics, Vol. 90, No. 2, pp. 216-
240.
Koop, G. and S.M. Potter 2000, Nonlinearity, structural breaks or outliers in economic time
series? in W. A. Barnett, D. F. Hendry, S. Hylleberg, T. Teräsvirta, D. TjØstheim and A. H.
Würtz (eds.), Nonlinear Econometric Modeling in Time Series Analysis, Cambridge:
Cambridge University Press.
Lumsdaine, R. L., and D. H. Papell, 1997, “Multiple Trend Breaks and the Unit-Root
Hypothesis,” Review of Economics and Statistics, Vol. 79, No. 2, pp. 212-218.
Mohanty, S. K., M. Nandha, A. Q. Turkistani, and M. Y. Alaitani, 2011, “Oil price
movements and stock market returns: Evidence from Gulf Cooperation Council (GCC)
countries,” Global Finance Journal, Vol. 22, No.1, pp. 42–55.
Mork, K., 1989, “Oil and the Macroeconomy When Prices Go Up and Down: An Extension
of Hamilton's Results,” Journal of Political Economy, Vol. 97, No. 3, pp. 740-744.
Park, J., and R. A. Ratti, 2008, “Oil price shocks and stock markets in the U.S. and 13
European countries,” Energy Economics, Vol. 30, No. 5, pp. 2587-2608.

30
30
Reboredo J. C., and A., Ugolini, 2016, “Quantile dependence of oil price movements and
stock returns,” Energy Economics Vol. 54, No 1, pp. 33-49.
Sadorsky, P., 1999, “Oil price shocks and stock market activity,” Energy Economics Vol 21,
No 5, pp. 449-469.
Sim, N., and H. Zho, 2015, "Oil prices, US stock return, and the dependence between their
quantiles," Journal of Banking and Finance, Vol. 55, pp. 1-8.
Skalin, J. and T. Teräsvirta, 1999, "Another Look at Swedish Business Cycles, 1861-1988",
Journal of Applied Econometrics, Vol. 14, no 4, pp 359-78.
Teräsvirta. T., 1994, “Specification, Estimation, and Evaluation of Smooth Transition
Autoregressive Models, Journal of the American Statistical Association, Vol. 29, No. 425,
pp. 208-218.
Teräsvirta, T., 1998, “Modelling economic relationships with smooth transition regressions,”
in Handbook of Applied Economic Statistics, ed. by A. Ullah and D. E. A. Giles, (New York:
Marcel Dekker).
van Dijk, D., P. Franses, and Lucas 1999, "Testing for smooth transition nonlinearity in the
presence of additive outliers", Journal of Business and Economic Statistics, Vol. 17, No. 2,
pp. 217-235.
van Dijk, D., T. Teräsvirta, and P. Franses, 2002, “Smooth Transition Autoregressive
Models: A Survey of Recent Developments,” Econometric Reviews, Vol. 21, No 1, pp. 1-47.
Zivot. E., and K. Andrews, 1992, “Further Evidence on the Great Crash, the Oil-Price Shock,
and the Unit-Root Hypothesis,” Journal of Business and Economic Statistics, Vol. 10, No 3,
pp. 251-70.

APPENDIX. FULL RESULTS FROM LSTR AND ESTR MODELS
Table A1. Full Estimation Results from LSTR Specifications
Bahrain Kuwait Oman Qatar Saudi Arabia
Transition variable )
Threshold -0.095*** -0.100*** 0.099*** 0.091*** 0.040
(0.019) (0.012) (0.019) (0.012) (0.034)
Speed of transition 6.766 8.654 7.341 14.052 4.032
(7.401) (13.941) (5.747) (16.131) (4.492)
Linear part: Constant 0.002 0.022 0.027 0.057 0.008
(0.019) (0.017) (0.012) (0.025) (0.022)
0.184*
0.169** 0.168* 0.097
(0.099)
(0.087) (0.100) (0.086)
0.133 -0.267***
(0.0902) (0.097)
-0.153*
(0.088)
-0.160*
0.133*
(0.090)
(0.083)
0.104
(0.088)
0.371** 0.082 0.284*** 0.201*
(0.190) (0.055) (0.099) (0.114)
0.059
(0.0534)
0.505*** 0.493*** 0.098**
0.261***
(0.139) (0.123) (0.0506)
(0.104)
0.176*
(0.098)
0.087*
-0.184*
(0.052)
(0.111)
0.903***
(0.324)
-1.314***
0.081
(0.364)
(0.057)
0.315*** 0.337*** 0.097* -0.003 0.428***
(0.091) (0.084) (0.061) (0.126) (0.106)
-0.010 0.024 -0.039* -0.028 0.009
(0.0351) (0.031) (0.023) (0.047) (0.041)
Nonlinear part:
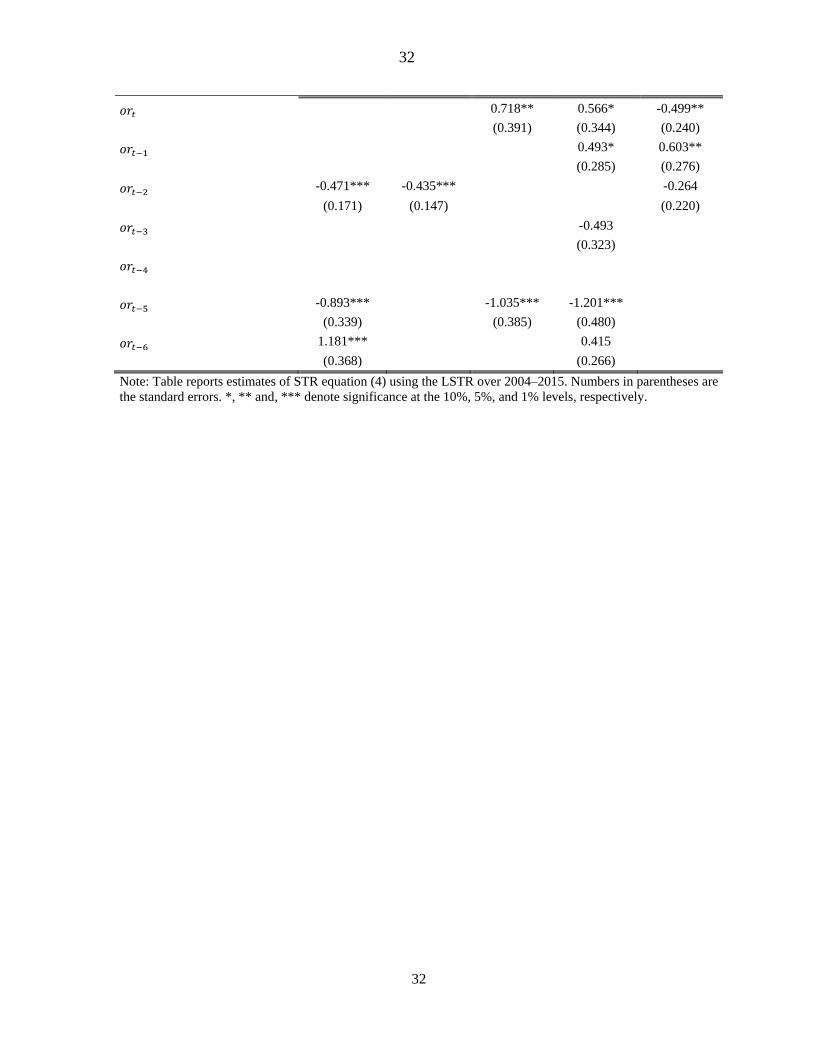
32
32
0.718** 0.566* -0.499**
(0.391) (0.344) (0.240)
0.493* 0.603**
(0.285) (0.276)
-0.471*** -0.435***
-0.264
(0.171) (0.147)
(0.220)
-0.493
(0.323)
-0.893***
-1.035*** -1.201***
(0.339)
(0.385) (0.480)
1.181***
0.415
(0.368)
(0.266)
Note: Table reports estimates of STR equation (4) using the LSTR over 2004–2015. Numbers in parentheses are
the standard errors. *, ** and, *** denote significance at the 10%, 5%, and 1% levels, respectively.
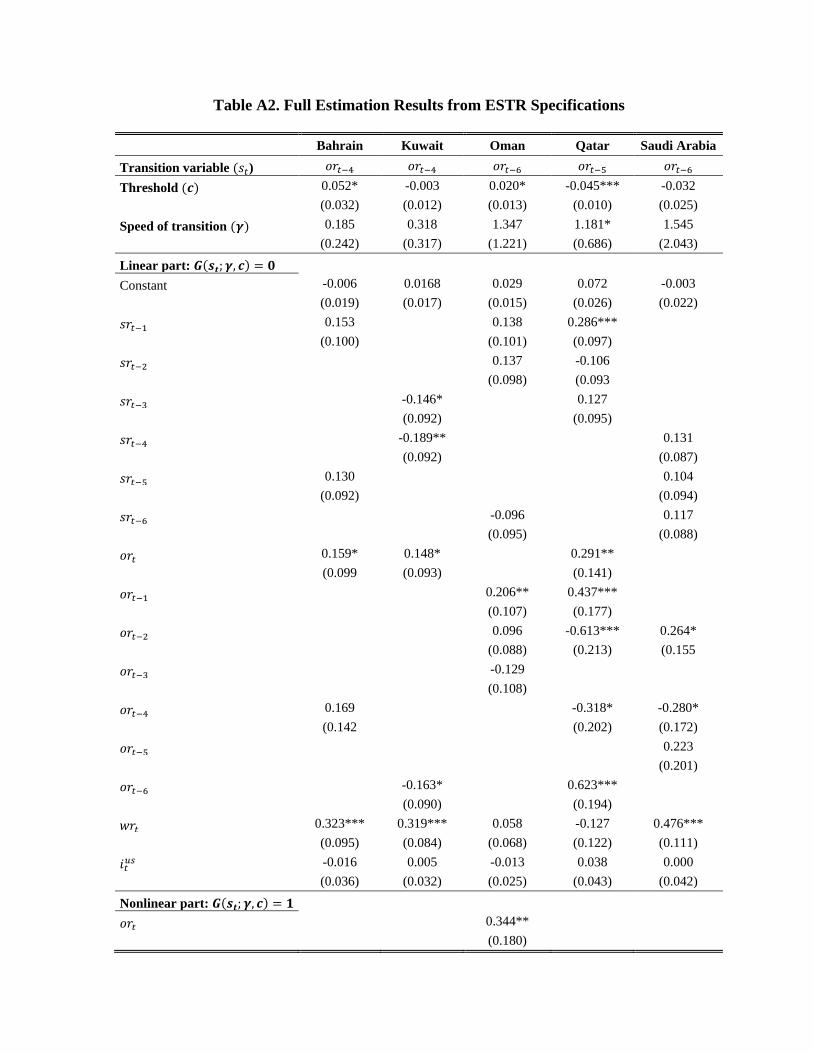
Table A2. Full Estimation Results from ESTR Specifications
Bahrain Kuwait Oman Qatar Saudi Arabia
Transition variable )
Threshold 0.052* -0.003 0.020* -0.045*** -0.032
(0.032) (0.012) (0.013) (0.010) (0.025)
Speed of transition 0.185 0.318 1.347 1.181* 1.545
(0.242) (0.317) (1.221) (0.686) (2.043)
Linear part:
Constant -0.006 0.0168 0.029 0.072 -0.003
(0.019) (0.017) (0.015) (0.026) (0.022)
0.153
0.138 0.286***
(0.100)
(0.101) (0.097)
0.137 -0.106
(0.098) (0.093
-0.146*
0.127
(0.092)
(0.095)
-0.189**
0.131
(0.092)
(0.087)
0.130
0.104
(0.092)
(0.094)
-0.096
0.117
(0.095)
(0.088)
0.159* 0.148*
0.291**
(0.099 (0.093)
(0.141)
0.206** 0.437***
(0.107) (0.177)
0.096 -0.613*** 0.264*
(0.088) (0.213) (0.155
-0.129
(0.108)
0.169
-0.318* -0.280*
(0.142
(0.202) (0.172)
0.223
(0.201)
-0.163*
0.623***
(0.090)
(0.194)
0.323*** 0.319*** 0.058 -0.127 0.476***
(0.095) (0.084) (0.068) (0.122) (0.111)
-0.016 0.005 -0.013 0.038 0.000
(0.036) (0.032) (0.025) (0.043) (0.042)
Nonlinear part:
0.344**
(0.180)
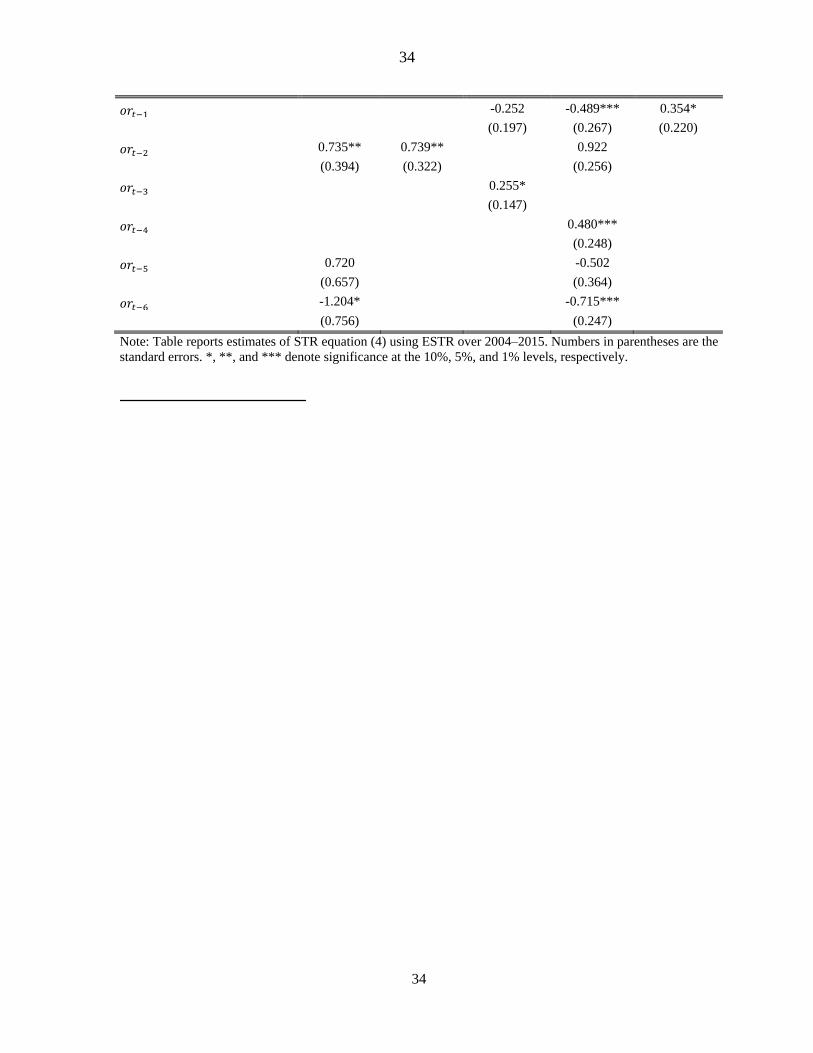
34
34
-0.252 -0.489*** 0.354*
(0.197) (0.267) (0.220)
0.735** 0.739**
0.922
(0.394) (0.322)
(0.256)
0.255*
(0.147)
0.480***
(0.248)
0.720
-0.502
(0.657)
(0.364)
-1.204*
-0.715***
(0.756) (0.247)
Note: Table reports estimates of STR equation (4) using ESTR over 2004–2015. Numbers in parentheses are the
standard errors. *, **, and *** denote significance at the 10%, 5%, and 1% levels, respectively.