Embed Size (px)
Citation preview

Solid growth in GCC as MENA ‘transition’ countries struggleOPEC cuts output to keep oil prices close to $100Egyptian growth improves, though fiscal challenges loom
GCC Economic Outlook
January 2014
MENA Economic Outlook


MENA Economic Outlook January 2014
Contents
MENA outlook 2
Bahrain 4 Macro and finance: Growth to remain modest 4 Kuwait 6 Macro forecasts: Better project activity in 2014 6 Money and finance: Signs of a pick-up in credit growth 8
Oman 10 Macro and finance: Non-oil investments to drive growth 10 Qatar 12 Macro forecasts: State spearheads non-oil investments 12 Money and finance: MSCI upgrade to boost fund inflows 14
Saudi Arabia 16 Macro forecasts: Private sector activity moderates 16 Money and finance: Lending growth eases, but still solid 18
UAE 20 Macro forecasts: Growth improves as confidence returns 20 Money and finance: Equity markets outperform 22
Egypt 24 Macro forecasts: Slow recovery seen in 2014 24 Money and finance: GCC support helps stabilize pound 26
Regional data and forecasts 28
MENA Economic Outlook - January 2014
NBK Economic ResearchAbdullah Al-Ahmed Street, P.O. Box 95, Safat 13001Kuwait City, KuwaitTel: +965 2259 5500 Fax: +965 2224 6973www.nbk.com

MENA Economic Outlook - January 2014
2
MENA outlookSolid growth in GCC as MENA ‘transition’ countries struggle; GCC to pay greater attention to fiscal reforms…
• Ongoing challenges in countries undergoing
transition – including Egypt, Jordan, Libya,
Morocco, Syria, Tunisia and Yemen – will continue
to affect economic performance in the MENA
region. Although growth could rise to 4% in
2014 from 3% in 2013, growth in most transition
countries will remain below par, averaging closer to
3%. While regional and international aid has helped
to stabilize transition economies and reduce short-
term external funding pressures, better medium-
term prospects depend upon achieving the political
consensus needed to bolster economic reforms and
the return of foreign capital. For many countries,
this still seems some way off.
• In the resource-rich GCC region, by
contrast, growth prospects remain favorable,
supported by high oil prices, a steady flow of
government development spending and – in some
cases – an increasingly buoyant private sector.
Real GCC non-oil GDP growth is forecast at
around 5.5% per year in 2014 and 2015, 0.5%
points higher than in 2013. (Chart 1.) Qatar will
remain the best performer, but the UAE economy
– boosted by returning confidence and renewed
impetus from infrastructure investment – appears
to be improving the quickest. (Chart 2.)
• We maintain our forecast for oil prices at
$100 per barrel (pb), on average, for 2014, a fall of
8% from 2013. Although oil prices held up well last
year, continued strong growth in non-OPEC supplies
GCC forecast summary2014f 2015f
Real GDP % y/y 3.1 4.2- Non-Oil % y/y 5.4 5.7
Inflation (yr avg) % 2.7 3.4Budget balance % GDP 7.2 6.1
and a potential rise in output from OPEC members
Iran, Iraq and Libya are expected to loosen oil
market fundamentals in 1H 2014. Key GCC OPEC
members – led by Saudi Arabia – are forecast to cut
oil output from current elevated levels early in 2014
in order to balance the market. (Chart 3.) Real oil
sector GDP is therefore seen declining 2% in 2014,
pushing overall GDP growth down to 3%.
• Inflation across the GCC region could be
pushed higher by a combination of solid growth
and rising pressures on housing rents. But at around
3% on a weighted basis, it is unlikely to concern
policymakers very much. (Chart 4.) Meanwhile,
the decline in oil revenues will reduce the GCC’s
aggregate fiscal surplus to 7% of GDP, from 10% in
2013. (Chart 5.) Although this is still very strong by
international standards, we expect GCC countries
to pay growing attention to the sustainability of
their fiscal positions going forward. This could
translate into slower growth in overall spending
than before, and tighter curbs on current spending
in particular. This, in turn, will have implications for
macroeconomic performance in the years ahead.
• In Egypt – a pivotal economy for the
MENA region – a combination of capital controls,
a managed depreciation of the pound and financial
support from the GCC helped ease pressures on
the external position in 2013. Along with a slight
improvement in the political climate, this has set the
stage for a modest acceleration in growth to 3% in
FY14/15. (Chart 6.) But major challenges remain.
As well as sustaining progress with the political
transition, the government must navigate the need
to protect living standards and social stability on the
one hand, and enact major deficit-reducing fiscal
reforms (particularly on subsidies) on the other.

MENA Economic Outlook - January 2014
3
Source: Official sources / NBK estimates and forecasts1 Includes condensate output in Oman and estimates for Bahrain2 Includes NBK estimates of off-balance sheet revenues in the UAE and Oman
MENA outlook charts
Chart 1. GCC real GDP Chart 2. Real non-oil GDP by GCC country
Chart 3. GCC crude oil output 1 Chart 4. GCC consumer price inflation
Chart 5. GCC budget balance 2 Chart 6. Egypt real GDP(% y/y) (% GDP)
(mn barrels per day) (% y/y, year average)
(% y/y) (% y/y)
-8-6-4-202468101214
-8-6-4-202468
101214
2002 2004 2006 2008 2010 2012 2014F
Oil Non-oil Total
NBK f'cast
3.0
4.5 4.0
9.7
4.5 5.0
5.4
3.0
4.5 5.0
10.5
4.5 5.0
5.7
0
2
4
6
8
10
12
0
2
4
6
8
10
12
Bhn Kwt Oma Qat KSA UAE GCC
2014 2015
14.0
14.5
15.0
15.5
16.0
16.5
17.0
17.5
18.0
14.0
14.5
15.0
15.5
16.0
16.5
17.0
17.5
18.0
Jan-09 Jan-10 Jan-11 Jan-12 Jan-130
2
4
6
8
10
12
0
2
4
6
8
10
12
2002 2004 2006 2008 2010 2012 2014F
NBK f'cast
-5
0
5
10
15
20
25
-5
0
5
10
15
20
25
2002 2004 2006 2008 2010 2012 2014F
NBK f'cast
0
1
2
3
4
5
6
7
8
0
1
2
3
4
5
6
7
8
FY02/03 FY05/06 FY08/09 FY11/12 FY14/15
NBK f'cast

MENA Economic Outlook - January 2014
4
Bahrain: macro and financeGrowth to remain modest; reform required to put budget on a more stable long-term footing…
• A strong recovery in oil production pushed
Bahrain’s economic growth to 4% in 2013,
following output disruptions in the previous
year. (Chart 7.) This came despite a significant
slowdown in non-oil sector growth (from 7% to
an estimated 3%), partly related to a base effect.
The execution of large infrastructure projects –
funded by GCC peers – may provide some support
to non-oil sector growth over the medium-term.
However, this is expected to be offset by sluggish
private sector activity, which continues to be
undermined by weak confidence levels. With oil
output gradually stabilizing, we expect real GDP
growth to trend lower, averaging under 3% over
the next two years.
• Consumer price inflation edged higher in
2013, averaging 3.1% in the first ten months.
Housing rents have been a large source of upward
pressure on prices, with inflation in this segment
climbing to as high as 11% y/y during 2013. The
government has progressed with several schemes
aimed at addressing the shortage of housing,
through GCC assistance and private sector
involvement. Coupled with modest growth and
softer food prices, we expect inflation to remain
at a moderate rate of 3% over the forecast period.
(Chart 8.)
• Additional expenditures for the 2013/2014
budget were approved in June, increasing
allocations for subsidies and pensions – despite
the existence of a budget deficit. While current
expenditures continue to rise, capital spending
is budgeted to decline, although various social
infrastructure projects should be financed off-
budget through GCC grants. As oil prices soften
and revenues dip, Bahrain’s fiscal position is likely
to weaken further. The budget deficit is expected
to widen from an estimated 3% in 2013 to around
5% over the next two years. (Chart 9.)
• Private sector credit growth remained
relatively flat through 2013, averaging a modest
5% y/y in the first nine months. (Chart 10.) This is
significantly down from the 14% average recorded
in the previous year. Growth in personal loans has
been robust, picking-up to 15% y/y in September
2013, from 10% at the start of the year. But this
has been more than offset by a deceleration in
business loans, which make up around two-thirds of
total retail bank lending.
• Bahrain’s banking sector continues to face
challenges. Commercial bank assets fell by some
5% y/y in September, dragged down by continued
deleveraging in the wholesale banking segment.
Domestically-focused retail banks – who have fared
far better in recent years – saw growth in assets
slow from 13% y/y at the start of the year to just
2%. Bahrain’s financial sector, the second largest
contributor to GDP, has yet to see a sustained
recovery from the effects of the financial crisis and
subsequent social unrest.
• A brief rally in the Bahrain stock market
subsided in mid-2013, with the index remaining
relatively flat during the remainder of the year.
Despite this, the index was still up by some 18% in
the year to November. (Chart 12.)
Bahrain forecast summary2014f 2015f
Real GDP % y/y 2.8 2.6- Non-Oil % y/y 3.0 3.0
Inflation (yr avg) % 3.0 3.0Budget balance % GDP -5.0 -5.0

MENA Economic Outlook - January 2014
5
Source: Official sources / NBK estimates and forecasts
Bahrain: macro and finance charts
Chart 7. Real GDP Chart 8. Consumer price inflation
Chart 9. Budget balance Chart 10. Bank claims on private sector
Chart 11. Policy interest rates Chart 12. Stock market indices (%)
(% GDP) (% y/y)
(% y/y)
-15
-10
-5
0
5
10
15
-15
-10
-5
0
5
10
15
2002 2004 2006 2008 2010 2012 2014F
OilNon-oilTotal
NBK f'cast
-1
0
1
2
3
4
-1
0
1
2
3
4
2002 2004 2006 2008 2010 2012 2014F
NBK f'cast
-6
-4
-2
0
2
4
6
8
-6
-4
-2
0
2
4
6
8
2002 2004 2006 2008 2010 2012 2014F
NBK f'cast
-10
0
10
20
30
40
50
60
-10
0
10
20
30
40
50
60
Jan-07 Jan-08 Jan-09 Jan-10 Jan-11 Jan-12 Jan-13
0
1
2
3
4
5
6
0
1
2
3
4
5
6
Jan-07 Jan-08 Jan-09 Jan-10 Jan-11 Jan-12 Jan-13
US Fed Funds target
CBB one week deposit rate
80
100
120
140
160
180
200
220
240
260
80
100
120
140
160
180
200
220
240
260
Jan-07 Jan-08 Jan-09 Jan-10 Jan-11 Jan-12 Jan-13
Dow Jones Bahrain Index
(% y/y, year average)

MENA Economic Outlook - January 2014
6
Kuwait: macro forecastsNon-oil growth solid despite sluggish project implementation; budget surplus to decline, though remain huge...
• High oil prices, large fiscal and trade
surpluses, and the government’s vast financial
reserves continue to provide a positive near-term
backdrop for the Kuwaiti economy. Although the
headline rate of economic growth will look weak in
2014, this is entirely driven by cuts in oil output;
non-oil growth, while far from firing on all cylinders,
is forecast to improve slightly to 4.5% thanks to
better project execution and continued strength
in the consumer sector. (Chart 13.) Both of these
factors could disappoint, however, resulting in
softer economic growth than forecast. We expect
gradual progress on much-needed economic reforms
to boost private investment levels and improve the
economy’s longer-term performance.
• The consumer sector remains an important
growth driver, but there are signs that growth
may be softening a little. Consumer credit growth
has come off its peak (though remains strong),
employment growth has eased, and the impact
of earlier increases in wages and benefits may be
fading. Early figures also suggest that take-up of
debt relief under the Family Fund law implemented
in 4Q 2013 has been much lower than the KD 0.8
billion in loans applicable under the scheme. The
boost to disposable incomes and additional lending
will therefore be smaller than initially assumed.
• Following a brief cut in 1Q 2013, crude oil
output rebounded to around 3.0 mbpd in mid-year,
close to its full capacity. (Chart 14.) As demand
Kuwait forecast summary2014f 2015f
Real GDP % y/y -0.6 3.1- Non-Oil % y/y 4.5 4.5
Inflation (yr avg) % 3.0 3.5Budget balance % GDP 20.0 19.0
weakens and non-OPEC supply continues to rise,
we expect OPEC – including Kuwait – to cut output
significantly in 1H 2014 in order to balance the
market and keep prices close to $100 pb. Real
hydrocarbon GDP is seen falling by 4% in 2014
before registering a small rise in 2015.
• Despite continued strength in the consumer
sector, inflation remained low through 2013,
averaging 2.7% in the first 10 months. (Chart
15.) This was in spite of a pick-up in housing
rent pressures, which were more or less offset by
decelerating inflation in the food segment. Inflation
in the remaining segments – sometimes thought
of as ‘core’ – reached just 0.7% y/y in August, its
lowest for years. Some upward drift in inflation is
seen in 2014, as core pressures rise and food price
inflation stabilizes. But inflation should remain in the
3-4% range over the next two years. (Chart 16.)
• The budget is set to record another huge
surplus in FY2013/14, at 22% of GDP. (Chart
17.) This is slightly down from the 25% of GDP
recorded a year earlier. Oil revenues are expected
to dip slightly on softer oil prices while spending
posts a small rise of 4%. Comments from senior
government ministers in late 2013 about the need
to control growth in subsidy payments suggest
that the government will maintain tighter control of
spending in future, compared to the 15% average
annual increase seen over the past decade. So long
as oil prices remain high, this will limit the decline
in the surplus going forward.
• A similar moderation is likely in Kuwait’s
giant current account surplus, due to a combination
of peaking oil receipts and rising imports. But the
surplus will remain above 30% of GDP. (Chart 18.)

MENA Economic Outlook - January 2014
7
Source: Official sources / NBK estimates
Kuwait: macro forecast charts
Chart 13. Real GDP Chart 14. Crude oil output
Chart 15. Consumer price inflation by sector Chart 16. Consumer price inflation
Chart 17. Budget balance Chart 18. Current account balance
(% y/y, year average)
(% y/y) (mn barrels per day)
-15
-10
-5
0
5
10
15
20
25
-15
-10
-5
0
5
10
15
20
25
2002 2004 2006 2008 2010 2012 2014f
Oil Non-oil Total
NBK f'cast
2.12.22.32.42.52.62.72.82.93.03.1
2.12.22.32.42.52.62.72.82.93.03.1
Jan-07 Jan-08 Jan-09 Jan-10 Jan-11 Jan-12 Jan-13
012345678910
0123456789
10
Jan-09 Jan-10 Jan-11 Jan-12 Jan-13
Food (18%)
Housing (27%)
Total CPI
0
1
2
3
4
5
6
7
0
1
2
3
4
5
6
7
2002 2004 2006 2008 2010 2012 2014f
NBK f'cast
0
5
10
15
20
25
30
35
0
5
10
15
20
25
30
35
2002 2004 2006 2008 2010 2012 2014f
NBK f'cast
0
10
20
30
40
50
60
70
80
90
0
10
20
30
40
50
60
70
80
90
2002 2004 2006 2008 2010 2012 2014f
$ billions
% of GDP
NBK f'cast
(% y/y)
(% GDP, fiscal year)

MENA Economic Outlook - January 2014
8
Kuwait: money and financeSigns of credit growth shifting gear; stock market holds on to gains made in 1H 2013…
• Improvements in the broader economic
climate have been reflected in financial conditions.
Deposit and credit growth have generally
accelerated, spurred on by low interest rates,
comfortable liquidity conditions, a buoyant
consumer sector and better business confidence.
Meanwhile, corporate profitability has improved
and the stock market has held on to the advances
made in 1H 2013. We expect further steady
improvements in the financial climate in 2014,
though acknowledge the uncertainties for global
markets of the US Fed easing the pace of monetary
stimulus early in the year.
• Annual growth in broad money (M2)
averaged 10% in the first 10 months of 2013, up
from a 7% average in 2012 and consistent with
decent growth in the broader economy. (Chart 19.)
Growth in the more volatile short-term measure,
M1, has been much stronger – helped by the low
interest rate environment. Private sector deposit
growth has provided further evidence of improved
economic activity, accelerating to 10% y/y in the
first 10 months of 2013, up from 6% through
2012. Overall liquidity conditions would have been
stronger still were it not for government deposits,
which have dipped following a surge in 2012.
• Growth in private credit accelerated to 8%
in October 2013, its fastest for more than four
years. (Chart 20.) The improvement has been driven
by a pick-up in lending to industry, particularly the
real estate and oil sectors. Although this may
partly reflect some one-off factors, we see it as
supportive of our view of a pick-up in business
sentiment more generally. Moreover, stronger
lending growth has come despite a slight easing in
consumer sector borrowing. The latter, although
still very strong at 17% y/y, may soon be affected
by implementation of the Family Fund law, which
could see around KD 0.4 billion in household debt
– 4% of the total – acquired by the government.
• Growth in commercial bank assets has also
improved slightly, reaching 10% y/y in October,
supported by stronger credit conditions. (Chart 21.)
Private sector credit accounts for the majority of
all bank assets. The rise in foreign assets – which
had been a driving force behind bank balance
sheet expansion since 2011 – abated in 1H 2013.
This could suggest that banks were utilizing funds
overseas in the absence of better domestic lending
opportunities, which are now materializing.
• The Central Bank of Kuwait (CBK) has
maintained its main lending rate, the discount rate,
at 2.0% since October 2012. (Chart 22.) The
benchmark deposit rate – the one-week repo rate –
has remained at 1.5%. Banks’ weighted commercial
lending rates drifted 20 bps lower to 4.6% through
2013 as the impact of the CBK discount rate cut
filtered through the system. Meanwhile, the Kuwaiti
dinar remained more or less unchanged against the
US dollar in 2013, and by extension fell by around
3% against the strengthening euro. (Chart 23.)
• The 7-month rally in the Kuwait stock
market subsided in mid-2013, but equities managed
to hold onto most of their earlier gains. Despite the
leveling off, the main price-weighted KSE index was
still up by 31% in the year to mid-December, while
the value-weighted index was up a more modest
10%. (Chart 24.) The quieter domestic political
environment, optimism on project implementation
and the Syrian crisis were among the key factors
affecting the market during 2013.

MENA Economic Outlook - January 2014
9
Source: Official sources / NBK estimates
N.B. Real exchange rate uses Jan 2008 as base period. Calculation based upon Kwt/US/Euro area CPIs.
(% y/y)
Kuwait: money and finance charts
Chart 19. Money supply Chart 20. Total bank credit
Chart 21. Commercial bank assets Chart 22. Policy interest rates
Chart 23. Exchange rate Chart 24. Stock market indices
(%)
(% y/y)
-10
-5
0
5
10
15
20
25
30
-10
-5
0
5
10
15
20
25
30
Jan-07 Jan-08 Jan-09 Jan-10 Jan-11 Jan-12 Jan-13
M1
M2
-5
0
5
10
15
20
25
30
35
40
-5
0
5
10
15
20
25
30
35
40
Jan-07 Jan-08 Jan-09 Jan-10 Jan-11 Jan-12 Jan-13
0
5
10
15
20
25
30
35
40
25
30
35
40
45
50
55
Jan-07 Jan-08 Jan-09 Jan-10 Jan-11 Jan-12 Jan-13
Bank assets (KD bn, LHS)Bank assets (% y/y, RHS)
0
1
2
3
4
5
6
7
0
1
2
3
4
5
6
7
Jan-07 Jan-08 Jan-09 Jan-10 Jan-11 Jan-12 Jan-13
US Fed funds targetKD discountKD repo
0.20
0.25
0.30
0.35
0.40
0.45
0.20
0.25
0.30
0.35
0.40
0.45
Jan-07 Jan-08 Jan-09 Jan-10 Jan-11 Jan-12 Jan-13
KD/USD KD/USD (real)KD/Euro KD/Euro (real)
KD stronger
200
300
400
500
600
700
800
900
4000
6000
8000
10000
12000
14000
16000
Jan-08 Jan-09 Jan-10 Jan-11 Jan-12 Jan-13
KSE General Index (LHS)Value Weighted Index (RHS)

MENA Economic Outlook - January 2014
10
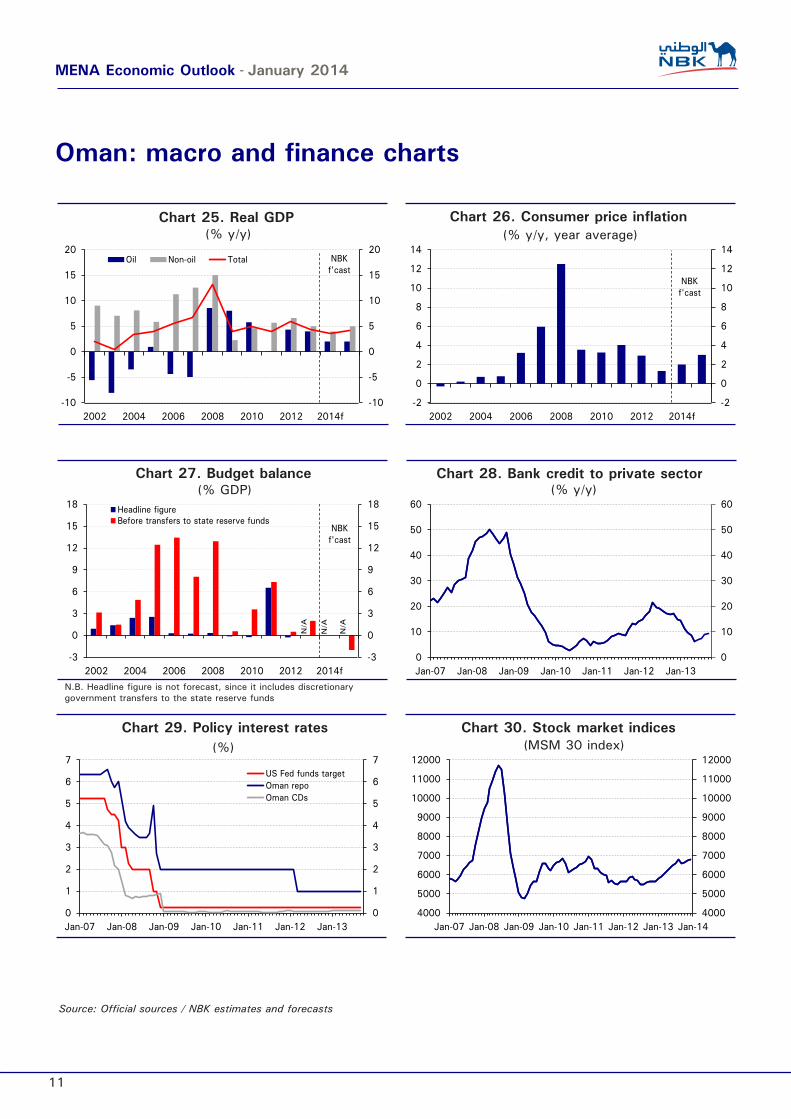
Oman: macro and financeNon-oil economy to drive growth going forward; fiscal situation remains vulnerable…
• Oman’s economy should maintain
considerable momentum as the government
sustains its investment expenditures and oil prices
remain favorable. Some $50 billion of investments
– split between the public and private sectors – are
planned over the coming years, of which $33 billion
will be targeted towards the non-hydrocarbon
sector. The real economy is expected to expand
by 4.5% in 2013, slowing to 3.5% in 2014 due to
softer growth in the hydrocarbon sector. Growth
could pick up again in 2015, supported by the
aforementioned investment spending. (Chart 25.)
• Consumer price inflation continued to
decelerate through 2013, owing largely to declining
global food prices. Inflation stood at just 0.3% y/y
in October, its lowest rate in recent years, and
is expected to have averaged 1.5% in 2013 as
a whole. Strong consumer demand coupled with
decreased power subsidies for some industries may
lead to a modest pick-up in price pressures. Inflation
is expected to average 2.5% over the next two
years. (Chart 26.)
• After a rapid build-up in recent years, the
Omani government is expected to contain future
growth in current spending with an eye on fiscal
sustainability. We project spending growth of
around 5% per year in 2014 and 2015. Even so,
the budget could move from a 2% surplus in 2013
to a 2% deficit by 2015, as oil revenues dip and
investment expenditures rise in order to fulfill the
Oman forecast summary2014f 2015f
Real GDP % y/y 3.6 4.2- Non-Oil % y/y 4.0 5.0
Inflation (yr avg) % 2.0 3.0Budget balance % GDP 0.0 -2.0
Sultanate’s diversification ambitions. (Chart 27.)
Any deficit can be comfortably financed through
reserves or sovereign debt financing. But further
measures to reform spending and boost non-oil
revenues are likely in the medium-term.
• Monetary growth eased to its slowest
pace for three years in September, at 4.8% y/y
and 4.6% y/y for M1 and M2, respectively. Credit
growth, on the other hand, remained weaker than
in 2012, but has begun to recover, rising to 9.3%
y/y in September. (Chart 28.) Given the solid
economic backdrop, credit growth is expected to
remain healthy going forward. New regulations
by the Central Bank of Oman reduced the share
of personal loans in banks’ portfolios in favor of
mortgages, as it moved to limit exposure to risky
loans. The interest rate cap on new loans has also
been decreased to 6% in order to further support
growth. Meanwhile, policy rates remain at record
lows, with the last change in the benchmark repo
rate a 1% cut in early 2012. (Chart 29.)
• Decent economic growth and relative
domestic stability helped the Muscat Securities
Market recover from a disappointing 2012. The
main price index rose 17% in the year to mid-
December, edging close to a post-financial crisis
high. (Chart 30.) But the gains, although decent,
still lagged some other GCC markets, which were
up 13-86%. The industrial segment continued to
lead the way, up 38% by of the end of November.
The sector may continue to drive the market’s
resurgence as newly tendered projects begin to be
executed.
MENA Economic Outlook - January 2014
11
Source: Official sources / NBK estimates and forecasts
N.B. Headline figure is not forecast, since it includes discretionary government transfers to the state reserve funds
Oman: macro and finance charts
Chart 25. Real GDP Chart 26. Consumer price inflation
Chart 27. Budget balance Chart 28. Bank credit to private sector
Chart 29. Policy interest rates Chart 30. Stock market indices (%)
(% GDP) (% y/y)
(% y/y) (% y/y, year average)
-10
-5
0
5
10
15
20
-10
-5
0
5
10
15
20
2002 2004 2006 2008 2010 2012 2014f
Oil Non-oil Total NBK f'cast
-2
0
2
4
6
8
10
12
14
-2
0
2
4
6
8
10
12
14
2002 2004 2006 2008 2010 2012 2014f
NBK f'cast
-3
0
3
6
9
12
15
18
-3
0
3
6
9
12
15
18
2002 2004 2006 2008 2010 2012 2014f
Headline figureBefore transfers to state reserve funds
NBK f'cast
N/A
N/A
N/A
0
10
20
30
40
50
60
0
10
20
30
40
50
60
Jan-07 Jan-08 Jan-09 Jan-10 Jan-11 Jan-12 Jan-13
0
1
2
3
4
5
6
7
0
1
2
3
4
5
6
7
Jan-07 Jan-08 Jan-09 Jan-10 Jan-11 Jan-12 Jan-13
US Fed funds targetOman repoOman CDs
4000
5000
6000
7000
8000
9000
10000
11000
12000
4000
5000
6000
7000
8000
9000
10000
11000
12000
Jan-07 Jan-08 Jan-09 Jan-10 Jan-11 Jan-12 Jan-13 Jan-14
(MSM 30 index)

MENA Economic Outlook - January 2014
12
Qatar: macro forecastsGovernment spending to drive non-hydrocarbon and private sector activity; rising rents causing moderate inflation; fiscal space to narrow…
• Economic growth has been slowing since
maximum LNG production capacity was reached in
2011; a moratorium on further projects in Qatar’s
giant North Field and conservative management
of Qatar’s aging oil fields have effectively capped
the country’s hydrocarbon output. The focus has
now shifted to the non-hydrocarbon sector, with
the government spearheading activities through its
ambitious $225 billion infrastructure development
plan. As public investment increases, private sector
growth is also likely to be stimulated through
positive spill-over effects.
• Real GDP growth is forecast to continue to
slow, to 5.8% y/y in 2014, before increasing by
6.6% y/y in 2015 as activity in the manufacturing,
financial services, tourism and construction
sectors accelerates. (Chart 31.) In addition, the
full commissioning of the Barzan gas production
facility in 2015 will bring additional volumes
of hydrocarbon products such as condensates
and natural gas liquids to the market, boosting
hydrocarbon GDP. Crude oil production, however,
is not expected to increase substantially above its
current band of 0.72-0.74 mbpd. (Chart 32.)
• Rising rental prices and costs in the
entertainment, recreation and culture category were
the dominant drivers of inflation in Qatar in 2013.
Food price inflation, meanwhile, was relatively
restrained compared to previous years. (Chart 33.)
Over the next two years, burgeoning consumer
Qatar forecast summary2014f 2015f
Real GDP % y/y 5.8 6.6- Non-Oil % y/y 9.7 10.5
Inflation (yr avg) % 4.0 4.5Budget balance % GDP 5.1 2.9
demand, underpinned by population growth of
above 7% y/y, should push headline inflation to 4%
y/y and 4.5% y/y in 2014 and 2015, respectively.
(Chart 34.) Moreover, tight conditions in the
residential market will exert upward pressure on
rents in the medium-term. Rent carries the most
weight in the CPI basket.
• Qatar’s budget and current account
surpluses are forecast to narrow over the next
two years, to 3% and 23% of GDP, respectively.
(Charts 35 and 36.) On the fiscal side, expenditure
growth will outpace revenue growth due to the
impact of lower projected oil prices on hydrocarbon
revenues. Note that exports of manufactured
products, receipts from corporate taxes and
income from investments are, however, expected
to rise and boost the state coffers during the
forecast period. Capital spending is also expected
to increase substantially in order to catch up
with the development plan’s ambitious spending
targets.
• Qatar faces challenges both unique and
common to regional oil exporters as a whole. In the
former, the authorities will need to be cognisant of
inflationary impulses associated with double-digit
growth (non-hydrocarbon sector), mounting public
debt (35% of GDP) – largely due to the issuance of
bonds – and capacity constraints that have delayed
the rollout of the development plan. Sensitivity to
oil and gas prices remains a key issue among GCC
hydrocarbon exporters, especially in the context
of fiscal sustainability. The Qatari authorities are,
however, committed to balance the budget entirely
through non-oil revenues by 2020.

MENA Economic Outlook - January 2014
13
Source: Official sources / NBK estimates and forecasts
Qatar: macro forecast charts
Chart 31. Real GDP Chart 32. Crude oil output
Chart 33. Consumer price inflation by sector Chart 34. Consumer price inflation
Chart 35. Budget balance Chart 36. Current account balance
(% y/y) (% y/y, year average)
(% y/y) (mn barrels per day)
05101520253035404550
05
101520253035404550
2002 2004 2006 2008 2010 2012 2014F
HydrocarbonNon-hydrocarbonTotal
NBK f'cast
0.700.720.740.760.780.800.820.840.860.880.90
0.700.720.740.760.780.800.820.840.860.880.90
Jan-07 Jan-08 Jan-09 Jan-10 Jan-11 Jan-12 Jan-13
-20
-15
-10
-5
0
5
10
-20
-15
-10
-5
0
5
10
Jan-10 Jan-11 Jan-12 Jan-13
Total CPIFood (13%)Rent, fuel & energy (32%)
-10
-5
0
5
10
15
20
-10
-5
0
5
10
15
20
2002 2004 2006 2008 2010 2012 2014F
NBK f'cast
0
5
10
15
20
25
30
0
5
10
15
20
25
30
2002 2004 2006 2008 2010 2012 2014F
$ billions % of GDP NBK f'cast
0
10
20
30
40
50
60
70
0
10
20
30
40
50
60
70
2002 2004 2006 2008 2010 2012 2014F
$ billions % of GDPNBK f'cast
MENA Economic Outlook - January 2014
14
Qatar: money and financeQCB focusing on financial stability and liquidity management; government projects drive credit growth; MSCI upgrade to stimulate portfolio inflows…
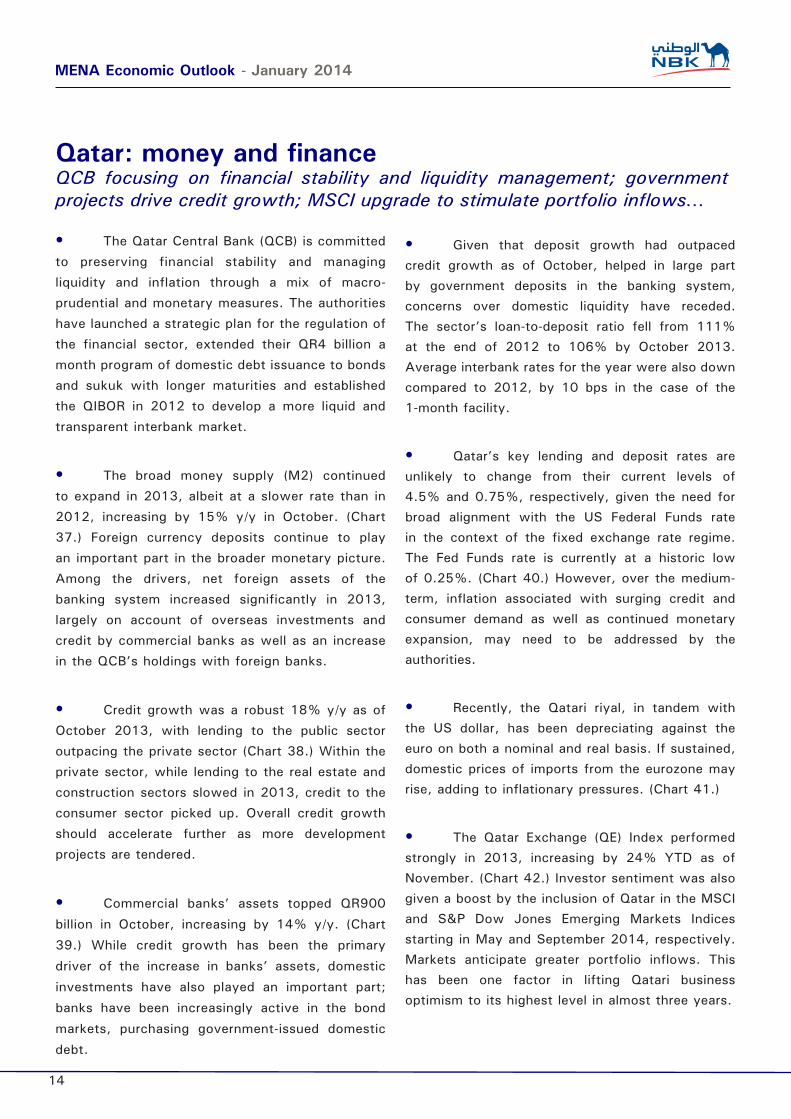
• The Qatar Central Bank (QCB) is committed
to preserving financial stability and managing
liquidity and inflation through a mix of macro-
prudential and monetary measures. The authorities
have launched a strategic plan for the regulation of
the financial sector, extended their QR4 billion a
month program of domestic debt issuance to bonds
and sukuk with longer maturities and established
the QIBOR in 2012 to develop a more liquid and
transparent interbank market.
• The broad money supply (M2) continued
to expand in 2013, albeit at a slower rate than in
2012, increasing by 15% y/y in October. (Chart
37.) Foreign currency deposits continue to play
an important part in the broader monetary picture.
Among the drivers, net foreign assets of the
banking system increased significantly in 2013,
largely on account of overseas investments and
credit by commercial banks as well as an increase
in the QCB’s holdings with foreign banks.
• Credit growth was a robust 18% y/y as of
October 2013, with lending to the public sector
outpacing the private sector (Chart 38.) Within the
private sector, while lending to the real estate and
construction sectors slowed in 2013, credit to the
consumer sector picked up. Overall credit growth
should accelerate further as more development
projects are tendered.
• Commercial banks’ assets topped QR900
billion in October, increasing by 14% y/y. (Chart
39.) While credit growth has been the primary
driver of the increase in banks’ assets, domestic
investments have also played an important part;
banks have been increasingly active in the bond
markets, purchasing government-issued domestic
debt.
• Given that deposit growth had outpaced
credit growth as of October, helped in large part
by government deposits in the banking system,
concerns over domestic liquidity have receded.
The sector’s loan-to-deposit ratio fell from 111%
at the end of 2012 to 106% by October 2013.
Average interbank rates for the year were also down
compared to 2012, by 10 bps in the case of the
1-month facility.
• Qatar’s key lending and deposit rates are
unlikely to change from their current levels of
4.5% and 0.75%, respectively, given the need for
broad alignment with the US Federal Funds rate
in the context of the fixed exchange rate regime.
The Fed Funds rate is currently at a historic low
of 0.25%. (Chart 40.) However, over the medium-
term, inflation associated with surging credit and
consumer demand as well as continued monetary
expansion, may need to be addressed by the
authorities.
• Recently, the Qatari riyal, in tandem with
the US dollar, has been depreciating against the
euro on both a nominal and real basis. If sustained,
domestic prices of imports from the eurozone may
rise, adding to inflationary pressures. (Chart 41.)
• The Qatar Exchange (QE) Index performed
strongly in 2013, increasing by 24% YTD as of
November. (Chart 42.) Investor sentiment was also
given a boost by the inclusion of Qatar in the MSCI
and S&P Dow Jones Emerging Markets Indices
starting in May and September 2014, respectively.
Markets anticipate greater portfolio inflows. This
has been one factor in lifting Qatari business
optimism to its highest level in almost three years.

MENA Economic Outlook - January 2014
15
Source: Official sources / NBK estimates
N.B. Real exchange rate uses Jan 2008 as base period. Calculation based upon Qatar/US/Euro area CPIs.
Qatar: money and finance charts
Chart 37. Money supply Chart 38. Bank credit
Chart 39. Commercial bank assets Chart 40. Policy interest rates
Chart 41. Exchange rate Chart 42. Stock market
(%)
(% y/y) (% y/y)
-40
-20
0
20
40
60
80
-40
-20
0
20
40
60
80
Jan-08 Jan-09 Jan-10 Jan-11 Jan-12 Jan-13
M1
M2
-20
0
20
40
60
80
100
120
140
160
-20
0
20
40
60
80
100
120
140
160
Jan-07 Jan-08 Jan-09 Jan-10 Jan-11 Jan-12 Jan-13
Total Public sector Private sector
0
10
20
30
40
50
60
70
80
90
0
100
200
300
400
500
600
700
800
900
Jan-07 Jan-08 Jan-09 Jan-10 Jan-11 Jan-12 Jan-13
Bank assets (QR bn, LHS)
Bank assets (% y/y, RHS)
0
2000
4000
6000
8000
10000
12000
14000
0
2000
4000
6000
8000
10000
12000
14000
Jan-07 Jan-08 Jan-09 Jan-10 Jan-11 Jan-12 Jan-13
QE Index
3.0
3.5
4.0
4.5
5.0
5.5
6.0
6.5
7.0
3.0
3.5
4.0
4.5
5.0
5.5
6.0
6.5
7.0
Jan-07 Jan-08 Jan-09 Jan-10 Jan-11 Jan-12 Jan-13
QAR/USDQAR/EuroQAR/USD (real)QAR/Euro (real)
QAR weaker
0
1
2
3
4
5
6
0
1
2
3
4
5
6
Jan-07 Jan-08 Jan-09 Jan-10 Jan-11 Jan-12 Jan-13
QMR lending rateQMR deposit rateUS Federal funds target rate

MENA Economic Outlook - January 2014
16
Saudi Arabia: macro forecastsNon-oil growth moderates on weaker private-sector activity; budget surplus to shrink despite slowing pace of government spending…
• Economic growth in Saudi Arabia slowed
in 2013 on the back of a small contraction in oil
GDP and a moderation in non-oil sector growth.
Recent labor market disruptions are believed to
have impacted activity in the latter. Over the
medium-term, growth should remain relatively solid,
supported by high oil prices and implementation of
large government projects. Nevertheless, an easing
in private sector activity and a moderation in the
pace of overall government spending – as well as
heavy downward revisions to official data – have
seen us lower our growth forecasts; we now expect
non-oil growth of 4-5% in both 2014 and 2015,
compared to up to 6% before. (Chart 43.)
• Recent data point to softening in the pace
of non-oil private sector activity. The Purchasing
Managers’ Index trended lower through 2013, credit
growth has eased slightly (though remains strong),
and ATM and point-of-sale figures are off their highs.
This may be partly linked to recent labor market
initiatives and Saudization efforts which have led
to a crackdown on illegal foreign workers. The full
impact of these policies on private sector activity
has yet to manifest, but there are downside risks
in the near-term: increased labor costs, disruptions
to labor-intensive sectors (especially construction
and retail), and weaker domestic consumption
levels. Government infrastructure projects and rapid
population growth should nevertheless continue to
provide underlying support for steady growth in
non-oil GDP.
KSA forecast summary2014f 2015f
Real GDP % y/y 3.3 3.7- Non-Oil % y/y 4.5 4.5
Inflation (yr avg) % 3.5 4.0Budget balance % GDP 7.0 6.0
• Saudi Arabian oil production rebounded by
more than 1 mbpd in the 10 months to September
2013 to a peak of 10.2 mbpd, partly to compensate
for output disruptions in Libya and Iraq. (Chart 44.)
Since then, output has once again fallen back. As
demand weakens and non-OPEC supply continues
to rise, Saudi Arabia – given its unofficial role as
OPEC’s swing producer – is seen making more
significant cuts in 1H 2014 in order to keep prices
close to $100 pb. We expect real oil GDP to fall in
2014 by some 2%, before stabilizing in 2015.
• Inflation edged higher in 2013, averaging
3.6% in the first 10 months. (Chart 45.) This was
driven by higher inflation in the food and housing
segments, both of which have eased of late. While
food price inflation is expected to remain contained,
pressures from residential rents could rise amid a
shortage in affordable housing – a challenge that
the government is trying to address through a
house building program and new mortgage law.
However, steady economic growth and softer food
prices should keep inflation at a moderate rate of
around 3-4% over the forecast period. (Chart 46.)
• The budget is estimated to have registered
a lower, but still large, surplus of 11% of GDP
in 2013. (Chart 47.) As oil prices slip further
and revenues decline, the surplus is projected to
continue to shrink to around 6-7% of GDP in 2014
and 2015 – despite moderating expenditure growth.
Further fiscal consolidation could conceivably affect
capital spending allocations. Nevertheless, a large
number of infrastructure projects – including major
transportation and power projects – will be financed
off-budget, thereby mitigating the impact of any
curb in spending.

MENA Economic Outlook - January 2014
17
Source: Official sources / NBK estimates and forecasts
Saudi Arabia: macro forecast charts
Chart 43. Real GDP Chart 44. Crude oil output
Chart 45. Consumer price inflation by sector Chart 46. Consumer price inflation
Chart 47. Budget balance Chart 48. Current account balance (% GDP)
(% y/y) (% y/y, year average)
(% y/y) (mn barrels per day)
-10
-5
0
5
10
15
20
-10
-5
0
5
10
15
20
2002 2004 2006 2008 2010 2012 2014F
Oil Non-oil TotalNBK
f'cast
7.8
8.2
8.6
9.0
9.4
9.8
10.2
7.8
8.2
8.6
9.0
9.4
9.8
10.2
Jan-07 Jan-08 Jan-09 Jan-10 Jan-11 Jan-12 Jan-13
-202468101214161820
-202468
101214161820
Jan-07 Jan-08 Jan-09 Jan-10 Jan-11 Jan-12 Jan-13
Food (22%)Housing (20%)Total CPI
Structural break in series
0
1
2
3
4
5
6
7
0
1
2
3
4
5
6
7
2002 2004 2006 2008 2010 2012 2014F
NBK f'cast
-10
-5
0
5
10
15
20
25
30
35
-10
-5
0
5
10
15
20
25
30
35
2002 2004 2006 2008 2010 2012 2014F
NBK f'cast
0
20
40
60
80
100
120
140
160
0
20
40
60
80
100
120
140
160
2002 2004 2006 2008 2010 2012 2014F
$ billions % of GDP NBK f'cast

MENA Economic Outlook - January 2014
18
Saudi Arabia: money and financePrivate sector credit growth eases, but remains strong; stock market hits post-financial crisis peak…
• Some financial indicators have shown a
slight softening in market conditions: both credit
and monetary growth have slowed from their
peaks. But overall, the Saudi financial sector still
looks in robust shape: banks are profitable and
well-capitalized, lending growth is still strong and
the stock market staged a significant rally in 2013.
Solid economic growth and implementation of large
government projects should provide continued
support for the financial sector in 2014. Downside
risks stem from a prolonging of the recent softening
in private sector activity and possible instability in
global markets.
• Growth in liquidity has eased somewhat
in recent months. Annual growth in the broad
money supply (M3) decelerated from a 2-year high
of 16% in May 2013 to 10% in October. (Chart
49.) Growth in the short-term measure M1 also
slowed from 19% in mid-2013 to an 11-month low
of 15%, as a result of weaker growth in demand
deposits – which make up more than 60% of total
banking system deposits.
• Growth in private credit eased back slightly
in 2H 2013, though is still very firm. Lending
growth edged down from its 4-year high of 17%
in May 2013 to 13% in October. (Chart 50.) The
latest softening could be partly explained by the
recent slowdown in private sector activity. But the
slowdown may also be reducing credit growth to
healthier, more sustainable levels.
• While corporate loans have traditionally
accounted for the bulk of lending, banks have
increasingly focused their attention on the smaller
retail lending segment. The latter has offered
higher margins in a low interest-rate environment.
In 2Q13, consumer loans grew by some 22% y/y
compared with 13% for corporate loans. The new
mortgage law should also help lift demand for home
loans, although its impact will likely be gradual.
• The continuing flow of major infrastructure
projects is expected to provide Saudi banks with
new lending opportunities going forward. Given the
low interest rate environment and reliance on short-
term deposit-based funding, Saudi banks have
increasingly tapped the Islamic bond market as an
alternative source of funds. This should support
loan growth, and provide longer-term funding for
large-scale projects and mortgages.
• Saudi banks’ balance sheets have continued
to make significant gains. Commercial bank assets
increased by 11% y/y in the first ten months
of 2013, driven by the continued rise in private
sector claims. (Chart 51.) However, purchases of
government securities have recently been growing
at a much faster pace, and now account for 12% of
all bank assets, up from 10% at the end of 2012.
• SAMA has maintained its key policy rates –
the repo and reverse repo rates – at 2% and 0.25%
respectively. (Chart 52.) The three-month interbank
rate (SAIBOR) was more or less unchanged through
2013, at 1%. This could suggest that – despite
slower monetary growth – liquidity levels in the
system remain comfortable.
• The Saudi stock market made significant
gains in 2013, with the index reaching its highest
level since the financial crisis. (Chart 54.) The
market was up 22% in the eleven months to
November, led by strong growth in the tourism,
retail, real estate and transportation sectors.

MENA Economic Outlook - January 2014
19
Source: Official sources / NBK estimates
N.B. Real exchange rate uses Jan 2008 as base period. Calculation based upon KSA/US/Euro area CPIs.
Saudi Arabia: money and finance charts
Chart 49. Money supply Chart 50. Bank credit to the private sector
Chart 51. Commercial bank assets Chart 52. Policy interest rates
Chart 53. Exchange rate Chart 54. Stock market indices(All share index)
(%)
(% y/y) (% y/y)
0
5
10
15
20
25
30
35
0
5
10
15
20
25
30
35
Jan-07 Jan-08 Jan-09 Jan-10 Jan-11 Jan-12 Jan-13
M1
M3
-5
0
5
10
15
20
25
30
35
40
-5
0
5
10
15
20
25
30
35
40
Jan-07 Jan-08 Jan-09 Jan-10 Jan-11 Jan-12 Jan-13
0
5
10
15
20
25
30
35
40
800
1000
1200
1400
1600
1800
2000
Jan-07 Jan-08 Jan-09 Jan-10 Jan-11 Jan-12 Jan-13
Thousa
nds Bank assets (SAR bn, LHS)
Bank assets (%y/y, RHS)
0
1
2
3
4
5
6
0
1
2
3
4
5
6
Jan-07 Jan-08 Jan-09 Jan-10 Jan-11 Jan-12 Jan-13
KSA repo
US Fed funds target
3.0
3.5
4.0
4.5
5.0
5.5
6.0
3.0
3.5
4.0
4.5
5.0
5.5
6.0
Jan-07 Jan-08 Jan-09 Jan-10 Jan-11 Jan-12 Jan-13
SAR/USD SAR/USD (real)
SAR stronger
4000
5000
6000
7000
8000
9000
10000
11000
12000
4000
5000
6000
7000
8000
9000
10000
11000
12000
Jan-07 Jan-08 Jan-09 Jan-10 Jan-11 Jan-12 Jan-13

MENA Economic Outlook - January 2014
20
UAE: macro forecastsNon-oil growth strengthens as confidence returns… Inflation edges higher on rising rents…
• UAE real non-oil GDP is expected to grow
by 4% in 2013 and 5% in 2014 and 2015. (Chart
55.) A wide range of indicators show that economic
activity has gained momentum. The Purchasing
Managers’ Index has risen to an all-time high,
activity and prices in the real estate sector have
rebounded, mothballed projects have been revived
and equity markets have seen a major rally. Indeed,
while economic growth remains well below the
annual average of 9% seen between 2001 and
2008, the buoyancy of asset markets has led to
concerns that optimism has gone too far, and that
preventative policy measures may be needed to
prevent another cycle of boom and bust.
• Fundamentally, the combination of
government-led infrastructure investment in Abu
Dhabi and Dubai’s ever-building status as a trading
hub remain supportive of the growth outlook.
Dubai’s recent win to host the Expo 2020 will give
the trade, tourism and business services sectors a
further boost: some estimates suggest it will add
0.5% per year to growth in the run-up to the event.
Aside from over-exuberance and a global downturn
to which Dubai in particular would be exposed, the
main economic risk concerns debt restructuring and
repayment issues at government related entities.
However, strong growth and rising asset prices
boost the prospects that debt can be serviced
through revenues and/or asset sales.
• UAE crude oil output – having risen strongly
over the past 2 years to above 2.8 mbpd – is
UAE forecast summary2014f 2015f
Real GDP % y/y 2.4 3.7- Non-Oil % y/y 5.0 5.0
Inflation (yr avg) % 2.0 3.0Budget balance % GDP 5.0 4.0
expected to fall in early 2014 as OPEC’s leadership
looks to maintain oil prices at around $100 pb in
light of moderate demand and increased supplies
elsewhere. (Chart 56.) However, some recovery in
output could be seen later on in the year, limiting
the average decline for 2014 overall. Overall real
GDP is expected to grow by 2.4% in 2014 and
3.7% in 2015.
• Inflation has picked-up from extremely low
2012 levels, but remained modest at 1.3% y/y
in October 2013. (Chart 57.) The recovery in the
real estate sector has been evident in the housing
component, where y/y inflation turned positive in
mid-2013 after falling for the previous three years.
However, given the low starting point for inflation,
lower global food prices, and modest inflation
elsewhere in the region, overall price pressures
should remain contained. We expect an average
inflation rate of 1% in 2013, rising to 2% 2014 and
around 3% in 2015. (Chart 58.)
• Consolidated government spending is
expected to have fallen in 2013, led by a reduction
in government bailout spending. Despite the billions
of dollars’ worth of projects that the Abu Dhabi
government has proposed to spend on industry,
tourism and infrastructure between 2013 and
2017, aggregate government spending may grow at
a moderate pace in the short-term, especially as the
Dubai government pays off a bulk of its maturing
debt. This will help the budget remain in surplus at
around 4-5% of GDP (including investment income
and oil profits), despite a dip in oil revenues. (Chart
59.) Meanwhile, the current account surplus is
expected to remain buoyant on strong growth in
non-oil exports, which are now worth nearly double
hydrocarbon exports. (Chart 60.)

MENA Economic Outlook - January 2014
21
Source: Official sources / NBK estimates and forecasts
UAE: macro forecast charts
Chart 55. Real GDP Chart 56. Crude oil output
Chart 57. Consumer price inflation by sector Chart 58. Consumer price inflation
Chart 59. Budget balance Chart 60. Current account balance (% GDP)
(% y/y) (% y/y, year average)
(% y/y) (mn barrels per day)
-10
-5
0
5
10
15
-10
-5
0
5
10
15
2002 2004 2006 2008 2010 2012 2014F
Oil Non-oil Total NBK f'cast
2.0
2.1
2.2
2.3
2.4
2.5
2.6
2.7
2.8
2.9
2.0
2.1
2.2
2.3
2.4
2.5
2.6
2.7
2.8
2.9
Jan-07 Jan-08 Jan-09 Jan-10 Jan-11 Jan-12 Jan-13
-6
-4
-2
0
2
4
6
8
10
Jan-09 Jan-10 Jan-11 Jan-12 Jan-13-6
-4
-2
0
2
4
6
8
10Total CPI Food (14%) Housing (39%)
0
2
4
6
8
10
12
14
0
2
4
6
8
10
12
14
2002 2004 2006 2008 2010 2012 2014F
NBK f'cast
-20
-15
-10
-5
0
5
10
15
20
-20
-15
-10
-5
0
5
10
15
20
2002 2004 2006 2008 2010 2012 2014F
Headline figureIncl inv inc & ADNOC profits
NBK f'cast
0
10
20
30
40
50
60
70
0
10
20
30
40
50
60
70
2002 2004 2006 2008 2010 2012 2014F
$ billions
% of GDP
NBK f'cast
MENA Economic Outlook - January 2014
22
UAE: money and financeFinancial sector recovery continues, though debt burden remains large… Equity markets rally on improved confidence levels…
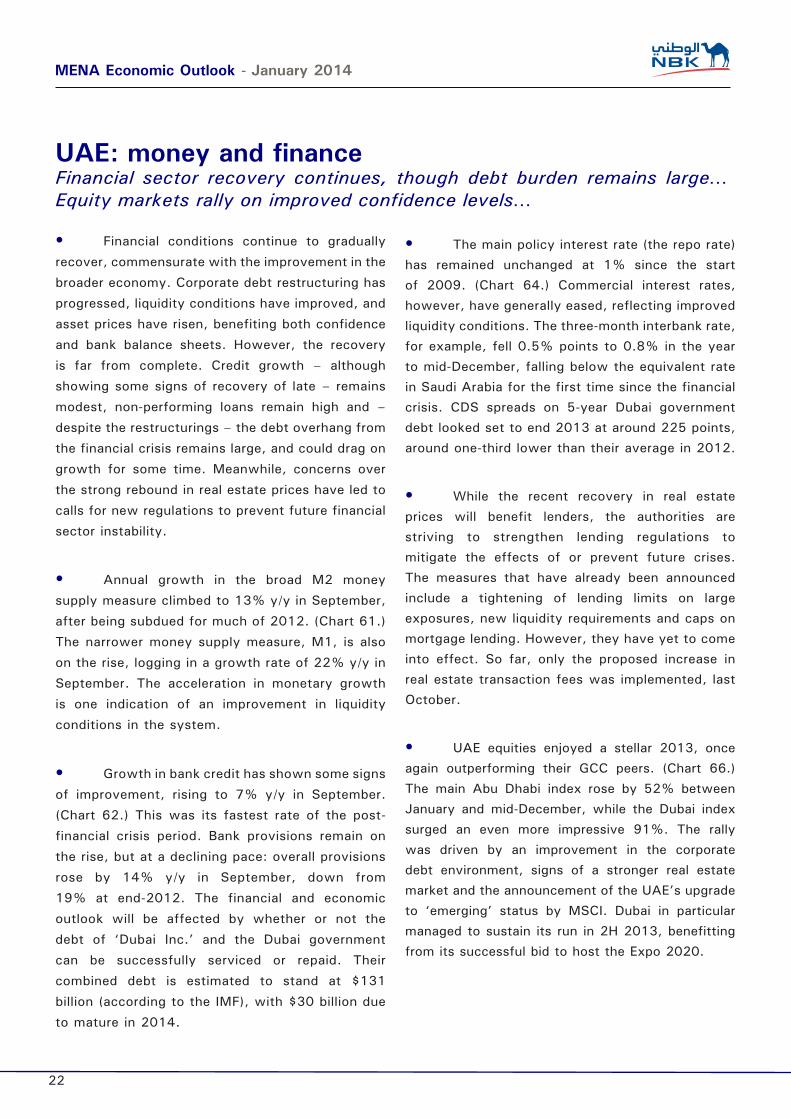
• Financial conditions continue to gradually
recover, commensurate with the improvement in the
broader economy. Corporate debt restructuring has
progressed, liquidity conditions have improved, and
asset prices have risen, benefiting both confidence
and bank balance sheets. However, the recovery
is far from complete. Credit growth – although
showing some signs of recovery of late – remains
modest, non-performing loans remain high and –
despite the restructurings – the debt overhang from
the financial crisis remains large, and could drag on
growth for some time. Meanwhile, concerns over
the strong rebound in real estate prices have led to
calls for new regulations to prevent future financial
sector instability.
• Annual growth in the broad M2 money
supply measure climbed to 13% y/y in September,
after being subdued for much of 2012. (Chart 61.)
The narrower money supply measure, M1, is also
on the rise, logging in a growth rate of 22% y/y in
September. The acceleration in monetary growth
is one indication of an improvement in liquidity
conditions in the system.
• Growth in bank credit has shown some signs
of improvement, rising to 7% y/y in September.
(Chart 62.) This was its fastest rate of the post-
financial crisis period. Bank provisions remain on
the rise, but at a declining pace: overall provisions
rose by 14% y/y in September, down from
19% at end-2012. The financial and economic
outlook will be affected by whether or not the
debt of ‘Dubai Inc.’ and the Dubai government
can be successfully serviced or repaid. Their
combined debt is estimated to stand at $131
billion (according to the IMF), with $30 billion due
to mature in 2014.
• The main policy interest rate (the repo rate)
has remained unchanged at 1% since the start
of 2009. (Chart 64.) Commercial interest rates,
however, have generally eased, reflecting improved
liquidity conditions. The three-month interbank rate,
for example, fell 0.5% points to 0.8% in the year
to mid-December, falling below the equivalent rate
in Saudi Arabia for the first time since the financial
crisis. CDS spreads on 5-year Dubai government
debt looked set to end 2013 at around 225 points,
around one-third lower than their average in 2012.
• While the recent recovery in real estate
prices will benefit lenders, the authorities are
striving to strengthen lending regulations to
mitigate the effects of or prevent future crises.
The measures that have already been announced
include a tightening of lending limits on large
exposures, new liquidity requirements and caps on
mortgage lending. However, they have yet to come
into effect. So far, only the proposed increase in
real estate transaction fees was implemented, last
October.
• UAE equities enjoyed a stellar 2013, once
again outperforming their GCC peers. (Chart 66.)
The main Abu Dhabi index rose by 52% between
January and mid-December, while the Dubai index
surged an even more impressive 91%. The rally
was driven by an improvement in the corporate
debt environment, signs of a stronger real estate
market and the announcement of the UAE’s upgrade
to ‘emerging’ status by MSCI. Dubai in particular
managed to sustain its run in 2H 2013, benefitting
from its successful bid to host the Expo 2020.

MENA Economic Outlook - January 2014
23
Source: Official sources / NBK estimates
N.B. Real exchange rate uses Jan 2008 as base period. Calculation based upon UAE/US/Euro area CPIs. Not available before 2008.
UAE: money and finance charts
Chart 61. Money supply Chart 62. Bank lending
Chart 63. Commercial bank assets Chart 64. Policy interest rates
Chart 65. Exchange rate Chart 66. Stock market indices
(%)
(% y/y) (% y/y)
N.B. Claims data exclude official entities & non-bank financial institutions. Private sector accounts for around 75% of all domestic claims.
N.B. UAE repo rate was established in November 2007.
-20
-10
0
10
20
30
40
50
60
70
-20
-10
0
10
20
30
40
50
60
70
Jan-07 Jan-08 Jan-09 Jan-10 Jan-11 Jan-12 Jan-13
M1 M2
-10
0
10
20
30
40
50
60
70
-10
0
10
20
30
40
50
60
70
Jan-07 Jan-08 Jan-09 Jan-10 Jan-11 Jan-12 Jan-13
Loans and advancesPrivate sector claims
0
10
20
30
40
50
60
700800900
10001100120013001400150016001700180019002000
Jan-07 Jan-08 Jan-09 Jan-10 Jan-11 Jan-12 Jan-13
Bank assets (AED bn, LHS)Bank assets (% y/y, RHS)
0
1
2
3
4
5
6
0
1
2
3
4
5
6
Jan-07 Jan-08 Jan-09 Jan-10 Jan-11 Jan-12 Jan-13
UAE repoUS Fed funds target
3.0
3.5
4.0
4.5
5.0
5.5
6.0
3.0
3.5
4.0
4.5
5.0
5.5
6.0
Jan-07 Jan-08 Jan-09 Jan-10 Jan-11 Jan-12 Jan-13
AED/USD AED/USD (real)
AED/Euro AED/Euro (real)
AED stronger
0
1000
2000
3000
4000
5000
6000
0
1000
2000
3000
4000
5000
6000
Jan-07 Jan-08 Jan-09 Jan-10 Jan-11 Jan-12 Jan-13
Dubai General IndexAbu Dhabi All Securities Index

MENA Economic Outlook - January 2014
24
Egypt: macro forecastsSlow recovery expected later in 2014, as risks moderate…
• Egypt’s economic recovery came to a halt
in 2013 following the political impasse reached
months into the presidency of Muhammad Mursi
and his removal from office in July this year. The
economy has yet to show signs of a return to
accelerating growth, though the political outlook
has improved. We expect this fiscal year ending
June 2014 (FY13/14) to show real growth steady
at around 2.2%, with the pace accelerating
somewhat next year to 3%. (Chart 67.)
• The tourism sector was the hardest hit as
visitors stayed away. The number of tourist nights
during the first eight months of 2013 was down
by 5.5% compared to the previous year. As a
result, the restaurants & hotels and transportation
sectors have been negatively affected. Other
sectors also saw slower growth, including oil &
gas, manufacturing and construction. We expect
all these sectors to improve in the coming months
as political risk diminishes and investor sentiment
improves.
• The country has seen its external position
stabilize in part as new capital controls were
imposed at the start of 2013 and the currency was
allowed to depreciate. Pressures eased further with
the GCC pledging substantial financial support in the
form of deposits and grants (at least $12 billion),
which have shored up Egypt’s official reserves.
The current account deficit also improved notably
in FY12/13, narrowing nearly by half to 2.1% of
GDP. (Chart 72.) While reserves remain relatively
Egypt forecast summary (fiscal year)2014f 2015f
Real GDP % y/y 3.0 4.0Inflation (yr avg) % 9.0 9.0Budget balance % GDP -10.1 -9.5
low at an estimated 3.7 months of imports, they
should improve further as the political transition is
completed and investors return.
• The fiscal position remains tenuous with the
fiscal deficit rising to 13.6% of GDP in FY 12/13.
With the government focused on security and the
political transition, addressing ballooning subsidies
remains a challenge. To be sure, the government
has taken some steps in recent months to bring
fuel subsidies under control, including introducing
a “smart card” to better target subsidies to lower
income citizens. Still, cuts in key subsidies have
been avoided. As a result, the cost of subsidies
alone rose to 11% of GDP. We expect the
government to make some progress on the fiscal
deficit in the coming months, which should help
reduce the deficit to 12.5% of GDP in FY13/14
and further to 10% in FY14/15. (Chart 71.) We
do not expect the government to face difficulties
funding the deficit for the time being, especially
with the massive GCC support and ample funding
from banks. The public debt reached 102% of GDP
in June 2013.
• Inflation accelerated substantially in 2013,
reaching 13% y/y in November, from a low of 4.3%
in December 2012. (Chart 69.) While the pound’s
depreciation was responsible for much of that rise
in the early part of 2013, it has recently picked up
again for other reasons. Part of the rise was linked
to strong seasonal increases in food prices. In
addition, recent months have seen large increases
in the price of “regulated items” including butane
cylinders (cooking fuel) and water prices. The latter
saw the first official price adjustment in nearly four
years.

MENA Economic Outlook - January 2014
25
Source: Official sources / NBK estimates and forecasts
Egypt: macro forecast charts
Chart 67. Real GDP Chart 68. Production index
Chart 69. Consumer price inflation by sector Chart 70. Consumer price inflation
Chart 71. Budget balance Chart 72. Current account balance (% GDP)
(% y/y) (% y/y, year average)
(% y/y) (% y/y)
012345678910
0123456789
10
FY02/03 FY05/06 FY08/09 FY11/12 FY14/15
NBK f'cast
-30
-20
-10
0
10
20
30
40
-30
-20
-10
0
10
20
30
40
Jan-07 Jan-08 Jan-09 Jan-10 Jan-11 Jan-12 Jan-13
12 mth avg Monthly
0
5
10
15
20
25
0
5
10
15
20
25
Jan-07 Jan-08 Jan-09 Jan-10 Jan-11 Jan-12 Jan-13
Core Headline
0
2
4
6
8
10
12
14
16
18
0
2
4
6
8
10
12
14
16
18
FY02/03 FY05/06 FY08/09 FY11/12 FY14/15
NBK f'cast
-16
-14
-12
-10
-8
-6
-4
-2
0
-16
-14
-12
-10
-8
-6
-4
-2
0
FY04/05 FY07/08 FY10/11 FY13/14
NBK f'cast
-5-4-3-2-1012345
-5-4-3-2-1012345
FY02/03 FY05/06 FY08/09 FY11/12
(% GDP)

MENA Economic Outlook - January 2014
26
Egypt: money and financeStock market recovers on improved outlook; GCC financial support helps stabilize pound…
• While political instability and slow growth
have taken their toll, financial conditions in Egypt
remain in check. New capital controls and the
decision to depreciate the pound have helped reduce
the pressure on the currency. The pound has
now stabilized, especially following the substantial
financial support pledged by GCC allies. (Chart 77.)
This has allowed the Central Bank of Egypt (CBE) to
reduce policy rates in an effort to ease pressure on
the fiscal deficit and give authorities the space to
raise rates in the event of renewed pressure.
• Money supply growth picked up considerably
after the CBE restricted the availability of foreign
currency at the start of 2013. M2 growth
accelerated to 19% y/y through October 2013
from 12% in December 2012, to reach its most
rapid pace since 2008. (Chart 73.)
• The boost in liquidity has helped alleviate
the funding pressures faced by the government,
with lending to the public sector by local banks
rising to 51% of system assets. The ratio doubled
from three years ago. As a result, the interest rate
on domestic government debt has eased to its
lowest level since Mubarak’s ouster. The 3-month
treasury bill rate fell to 11.4%, reflecting the
abundance of domestic funding. (Chart 76.)
• Credit to the private sector, meanwhile, has
suffered in tandem with the slowdown in economic
activity. Growth in lending to the private sector
was only just beginning to recover in early 2013
when it slowed once again as a result of political
uncertainty. Bank claims on the corporate sector
grew by only 7.4% y/y in October. With inflation in
the double digits, this amounts to a real growth rate
of -3%. Credit growth had picked up in the spring,
when the annualized 2-month moving average rate
of growth reached 16%. It has since slowed to a
negative 3%. (Chart 74.)
• Despite the uncertainty, the Egyptian
banking system remains robust. While the level
of nonperforming loans (NPLs) at Egyptian banks
remains elevated by international standards for
historic reasons, they have not increased since
2011. NPLs to gross loans were 9.5% in June
2013 and provisions are ample. While capitalization
has come off somewhat, the capital adequacy
ratio remains healthy at 13.4%. Meanwhile, the
increased exposure of banks to Egyptian sovereign
debt is a growing concern for banks.
• Egypt’s stock market rallied since June,
reflecting improved general sentiment felt by
investors and the feeling that the current political
transition is more likely to produce an inclusive and
more business-friendly government. The EGX30
rose by 43% between late June and mid-December
2013. However, Egypt’s market has underperformed
other regional markets in 2013, and it remains 10%
below levels pre-dating the removal of Mubarak in
early 2011. (Chart 78.)
• Still, investors remain wary of Egypt’s
elevated risks. This is particularly apparent in
the country’s credit default swap (CDS), which
continued to trade at elevated levels. At 667 basis
points in November 2013, the rate remained well
above the 393 bps level registered a year earlier.
Egypt’s 2020 USD bond issue also reflected the
heightened risk, yielding 7.4% in November 2013,
compared to 5.3% a year before.

MENA Economic Outlook - January 2014
27
Source: Official sources / NBK estimates
Egypt: money and finance charts
Chart 73. Money supply Chart 74. Bank lending
Chart 75. Commercial bank assets Chart 76. Policy interest rates
Chart 77. Exchange rate Chart 78. Stock market indices
(%)
(% y/y) (% y/y)
0
5
10
15
20
25
30
35
0
5
10
15
20
25
30
35
Jan-07 Jan-08 Jan-09 Jan-10 Jan-11 Jan-12 Jan-13
M1 M2
-5
0
5
10
15
20
25
30
35
-5
0
5
10
15
20
25
30
35
Jan-07 Jan-08 Jan-09 Jan-10 Jan-11 Jan-12 Jan-13
HouseholdCorporateTotal
-2
0
2
4
6
8
10
12
14
16
18
1000
1100
1200
1300
1400
1500
1600
1700
Jun-09 Jun-10 Jun-11 Jun-12 Jun-13
EGP bn (LHS)
% y/y (RHS)
0
2
4
6
8
10
12
14
16
18
0
2
4
6
8
10
12
14
16
18
Jan-07 Jan-08 Jan-09 Jan-10 Jan-11 Jan-12 Jan-13
CBE discount rate 3-month t-bill
5.0
5.5
6.0
6.5
7.0
7.540
42
44
46
48
50
52
54
56
58
Jan-07 Jan-08 Jan-09 Jan-10 Jan-11 Jan-12 Jan-13
Nominal Effective Exchange Rate (LHS)
EGP/USD (RHS, inverted)
0
2000
4000
6000
8000
10000
12000
14000
0
2000
4000
6000
8000
10000
12000
14000
Jan-07 Jan-08 Jan-09 Jan-10 Jan-11 Jan-12 Jan-13
EGX30 index

MENA Economic Outlook - January 2014
28
Regional macroeconomic data and forecasts
GCC Unit 2009 2010 2011 2012 2013 2014f 2015f
Bahrain
Nominal GDP $ bn 22.9 25.6 29.0 30.3 32.1 33.1 34.7Real GDP %y/y 2.5 4.3 2.1 3.4 3.9 2.8 2.6- Hydrocarbon sector %y/y -0.4 0.1 3.6 -8.5 8.0 2.0 1.0- Non-hydrocarbon sector %y/y 3.4 5.5 1.7 6.7 3.0 3.0 3.0Budget balance % GDP -5.2 -4.8 -0.3 -2.0 -3.0 -5.0 -5.0Current account balance % GDP 2.4 3.0 11.2 7.3 6.0 4.0 4.0Consumer prices % y/y 2.8 2.0 -0.4 2.8 3.2 3.0 3.0
Kuwait
Nominal GDP $ bn 106.0 119.9 160.6 183.4 179.0 174.2 181.9Real GDP %y/y -7.1 -2.4 10.2 8.3 0.3 -0.6 3.1- Hydrocarbon sector %y/y -12.8 0.5 14.9 11.8 -2.0 -4.0 2.0- Non-hydrocarbon sector %y/y -3.2 -4.1 4.0 3.1 4.0 4.5 4.5Budget balance (financial year) % GDP 21.1 15.4 29.8 24.8 22.0 20.0 19.0Current account balance % GDP 26.8 31.0 41.9 43.3 40.0 35.0 33.0Consumer prices % y/y 4.6 4.6 4.8 3.3 2.6 3.0 3.5
Oman
Nominal GDP $ bn 48.2 58.8 69.9 78.0 79.8 81.3 83.4Real GDP %y/y 3.9 5.0 4.0 6.0 4.4 3.6 4.2- Hydrocarbon sector %y/y 8.1 5.8 0.0 4.3 4.0 2.0 2.0- Non-hydrocarbon sector %y/y 2.3 4.6 5.7 6.6 5.0 4.0 5.0Budget balance % GDP 0.6 3.6 7.3 0.5 2.0 0.0 -2.0Current account balance % GDP -1.0 8.6 12.8 10.4 9.9 8.0 6.0Consumer prices % y/y 3.5 3.3 4.0 2.9 1.3 2.0 3.0
Qatar
Nominal GDP $ bn 97.8 127.4 171.4 192.2 207.6 215.6 229.1Real GDP %y/y 12.0 16.7 13.0 6.2 6.1 5.8 6.6- Hydrocarbon sector %y/y 4.5 28.8 15.8 1.7 0.8 0.4 0.6
- Non-hydrocarbon sector %y/y 17.6 8.6 10.7 10.0 10.2 9.7 10.5
Budget balance (financial year) % GDP 15.2 2.9 7.7 11.8 9.1 5.1 2.9Current account balance % GDP 6.1 22.8 30.4 32.4 29.3 26.4 22.9Consumer prices % y/y -4.9 -2.4 1.9 1.9 3.2 4.0 4.5
Saudi Arabia
Nominal GDP $ bn 429.1 526.8 669.5 711.0 727.7 728.1 765.6Real GDP %y/y 1.8 7.4 8.6 5.1 3.0 3.3 3.7- Hydrocarbon sector %y/y -8.8 0.2 12.4 5.7 -1.0 -2.0 0.0- Non-hydrocarbon sector %y/y 4.9 9.2 7.7 5.0 4.0 4.5 4.5Budget balance % GDP -5.4 4.4 11.6 14.0 11.0 7.0 6.0Current account balance % GDP 4.7 12.5 21.8 21.1 16.0 10.0 9.0Consumer prices % y/y 4.1 3.8 3.7 2.9 3.5 3.5 4.0
UAE
Nominal GDP $ bn 254.8 287.4 348.6 383.8 387.6 399.2 403.9Real GDP %y/y -4.8 1.7 3.9 4.4 4.7 2.4 3.7- Hydrocarbon sector %y/y -8.9 3.8 6.6 6.3 5.0 -3.0 1.0- Non-hydrocarbon sector %y/y -2.9 0.7 2.6 3.5 4.0 5.0 5.0Budget balance % GDP -12.9 -1.8 3.2 7.7 6.0 5.0 4.0Current account balance % GDP 3.1 2.5 14.6 17.3 15.0 14.0 13.0Consumer prices % y/y 1.6 0.9 0.8 0.7 1.0 2.0 3.0
MENA
Egypt (financial year)
Nominal GDP $ bn 219.4 236.3 261.3 276.1 288.0 322.9 365.4Real GDP % y/y 5.1 1.8 2.2 2.1 2.2 3.0 4.0Budget balance % GDP -8.2 -10.0 -10.6 -13.6 -12.6 -10.1 -9.5Current account balance % GDP -2.4 -2.0 -2.6 -3.9 -2.1 - -Consumer prices % y/y 11.7 11.1 8.6 6.9 10.8 9.0 9.0
International data (end year unless otherwise stated)
Brent crude oil spot price (yr avg) US $ p/b 61.5 79.5 11.2 111.6 108.9 100.0 100.0CRB commodity price index Index 421.1 520.3 482.0 484.1 457.3 - -Eur/USD 1$ = € 0.698 0.747 0.773 0.758 0.736 - -US Fed Fund Rate % 0.25 0.25 0.25 0.25 0.25 - -World MSCI stock market index Index 1,168 1,280 1,183 1,339 1,603 - -MENA real GDP (IMF, yr avg) %y/y 3.0 5.5 3.9 4.6 2.1 3.8 4.2World real GDP (IMF, yr avg) %y/y -0.4 5.2 3.9 3.2 2.9 3.6 4.0
Source: Thomson Reuters Datasteam, official sources, and NBK Economic Research. Includes some NBK estimates.


Head Office
KuwaitNational Bank of Kuwait SAKAbdullah Al-Ahmed StreetP.O. Box 95, Safat 13001Kuwait City, KuwaitTel: +965 2242 2011Fax: +965 2259 5804Telex: 22043-22451 NATBANK
www.nbk.com
International Network BahrainNational Bank of Kuwait SAKBahrain BranchZain Tower, Building 401, Road 2806, Seef Area 428, P.O. Box 5290, Manama Kingdowm of BahrainTel: +973 17 155 555Fax: +973 17 104 860
National Bank of KuwaitBahrain Branch (H.O)GB Corp TowerBlock 346, Road 4626Building 1411P.O. Box 5290, ManamaKingdom of BahrainTel: +973 17 155 555Fax: +973 17 104 860
JordanNational Bank of Kuwait SAKAmman BranchShareef Abdul Hamid Sharaf StP.O. Box 941297Shmeisani, Amman 11194JordanTel: +962 6 580 0400Fax: +962 6 580 0441
Saudi ArabiaNational Bank of Kuwait SAKJeddah BranchAl Khalidiah District,Al Mukmal Tower, JeddahP.O. Box 15385, Jeddah 21444, Kingdom of Saudi ArabiaTel: +966 2 603 6300Fax: +966 2 603 6318
LebanonNational Bank of Kuwait(Lebanon) SALBAC BuildingJustinian Street, SanayehP.O. Box 11-5727, Riyad El SolhBeirut 1107 2200, LebanonTel: +961 1 759700Fax: +961 1 747866
IraqCredit Bank of IraqStreet 9, Building 178Sadoon Street, District 102P.O. Box 3420, Baghdad, IraqTel: +964 1 7182198/7191944 +964 1 7188406/7171673Fax: +964 1 7170156
EgyptAl Watany Bank of EgyptPlot 155, City Center, First Sector5th Settlement, New CairoEgyptTel: +20 2 26149300
United Arab EmiratesNational Bank of Kuwait SAKDubai Branch, Sheikh Rashed RoadPort Saeed AreaACICO Business ParkP.O. Box 88867, Dubai UAETel: +971 4 292 9222Fax: +971 4 294 3337
National Bank of Kuwait, Abu Dhabi BranchAirport Road, next to Abu Dhabi Education Council, Abu Dhabi, UAE P.O.Box:113567, Abu DhabiTel: +971 2 222 2727 Fax: +971 2 222 2477
United States of AmericaNational Bank of Kuwait SAKNew York Branch, 299 Park AvenueNew York, NY 10171, USATel: +1 212 303 9800Fax: +1 212 319 8269 United KingdomNational Bank of Kuwait(International) PlcHead Office, 13 George StreetLondon W1U 3QJ, UKTel: +44 20 7224 2277Fax: +44 20 7224 2101
National Bank of Kuwait(International) PlcPortman Square Branch7 Portman SquareLondon W1H 6NA, UKTel: +44 20 7224 2277Fax: +44 20 7486 3877
FranceNational Bank of Kuwait(International) PlcParis Branch90 Avenue des Champs-Elysees75008 Paris, FranceTel: +33 1 5659 8600 Fax: +33 1 5659 8623
SingaporeNational Bank of Kuwait SAKSingapore Branch9 Raffles Place #24-01/02Republic PlazaSingapore 048619Tel: +65 6222 5348Fax: +65 6224 5438
ChinaNational Bank of Kuwait SAKShanghai Representative OfficeSuite 1003, 10th Floor, Azia Center1233 Lujiazui Ring RoadShanghai 200120, ChinaTel: +86 21 6888 1092Fax: +86 21 5047 1011
NBK Capital
Kuwait NBK Capital 38th Floor, Arraya II BuildingShuhada’a Street, SharqP.O. Box 4950, Safat 13050KuwaitTel: +965 2224 6900Fax: +965 2224 6904 United Arab EmiratesNBK Capital Limited Precinct Building 3, Office 404Dubai International Financial CenterP.O. Box 506506, DubaiUnited Arab EmiratesTel: +971 4 365 2800Fax: +971 4 365 2805
TurkeyNBK CapitalArastima ve Musavirlik ASSUN Plaza, 30th FloorDereboyu Sk. No.24Maslak 34398, Istanbul, TurkeyTel: +90 212 276 5400Fax: +90 212 276 5401
Associates
QatarInternational Bank of Qatar (QSC)Suhaim bin Hamad StreetP.O. Box 2001Doha, QatarTel: +974 4447 8000Fax: +974 4447 3710
TurkeyTurkish BankValikonagl CAD. 7Nisantasi 34371,Istanbul, TurkeyTel: +90 212 373 6373Fax: +90 212 225 0353
© Copyright Notice. Economic Brief is a publication of National Bank of Kuwait. No part of this publication may be reproduced or duplicated without the prior consent of NBK.
While every care has been taken in preparing this publication, National Bank of Kuwait accepts no liability whatsoever for any direct or consequential losses arising from its use. Economic Brief is distributed on a complimentary and discretionary basis to NBK clients and associates. This report and previous issues can be found in the “Reports” section of the National Bank of Kuwait’s web site. Please visit our web site, www.nbk.com, for other bank publications. For further information please contact NBK Economic Research at:Tel: (965) 2259 5500Fax: (965) 2224 6973Email: [email protected]