Embed Size (px)
DESCRIPTION
Polymers
Citation preview
Chemicals & PlasticsOutlook
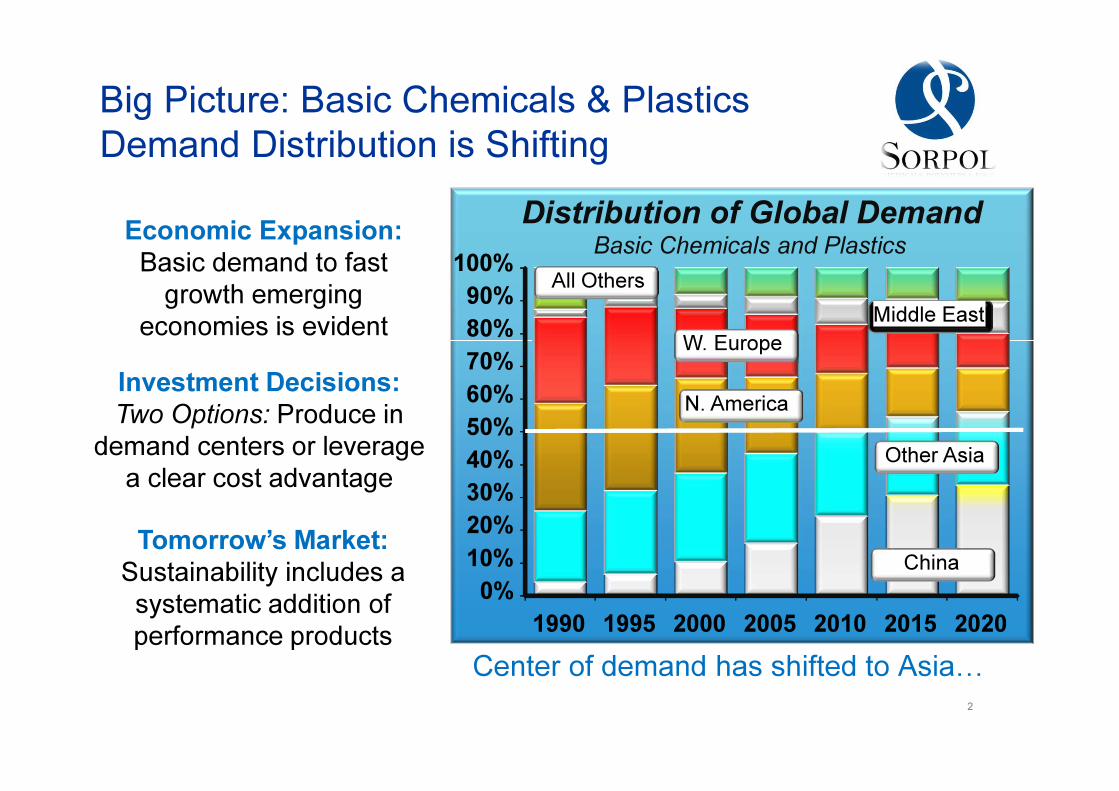
Center of demand has shifted to Asia�
Economic Expansion:
Basic demand to fast
growth emerging
economies is evident
Investment Decisions:
Two Options: Produce in
demand centers or leverage
a clear cost advantage
Tomorrow’s Market:
Sustainability includes a
systematic addition of
performance products
0%
10%
20%
30%
40%
50%
60%
70%
80%
90%
100%
1990 1995 2000 2005 2010 2015 2020
W. Europe
Middle East
All Others
Other Asia
China
N. America
Basic Chemicals and Plastics
Distribution of Global Demand
Big Picture: Basic Chemicals & Plastics
Demand Distribution is Shifting
2
NaturalGas
Gas
Separation
Unit
RefineryCrudeOil
Reformer
Reformate BTXExtraction
Steam
Cracker
ButaneHydrogen
Propylene
Pygas
BTX
Raffinate
EthyleneEO/EG
POLYETHYLENE
ETHYLENE
DICHLORIDE / PVC
EP RUBBER
ETHANOL
NaphthaGas Oil
EthanePropaneButane
TOLUENE
m-XYLENE
p-XYLENE
BENZENE
o-XYLENE
XYLENES
PTA/DMT PET
PIA
PAN/DOP/Plasticizers
POLYPROPYLENE
Butadiene
Methanol
SBR / PBR
ETHYLBENZENE/
STYRENE
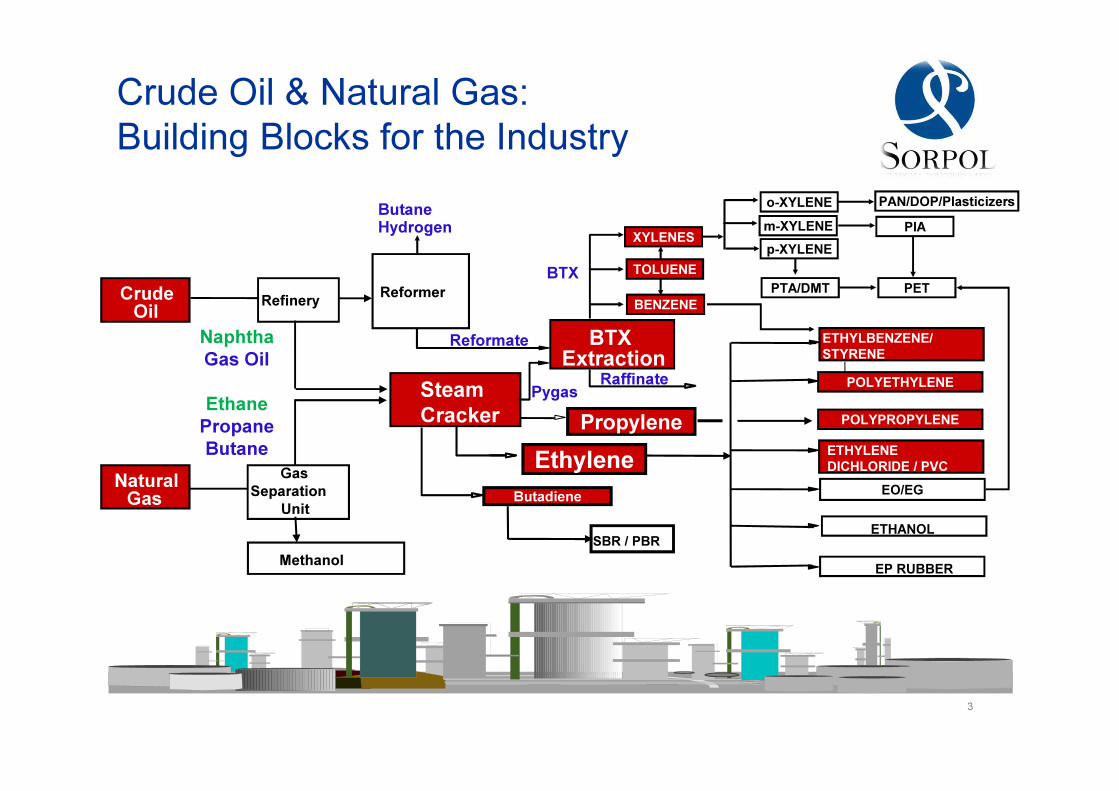
Crude Oil & Natural Gas:
Building Blocks for the Industry
3
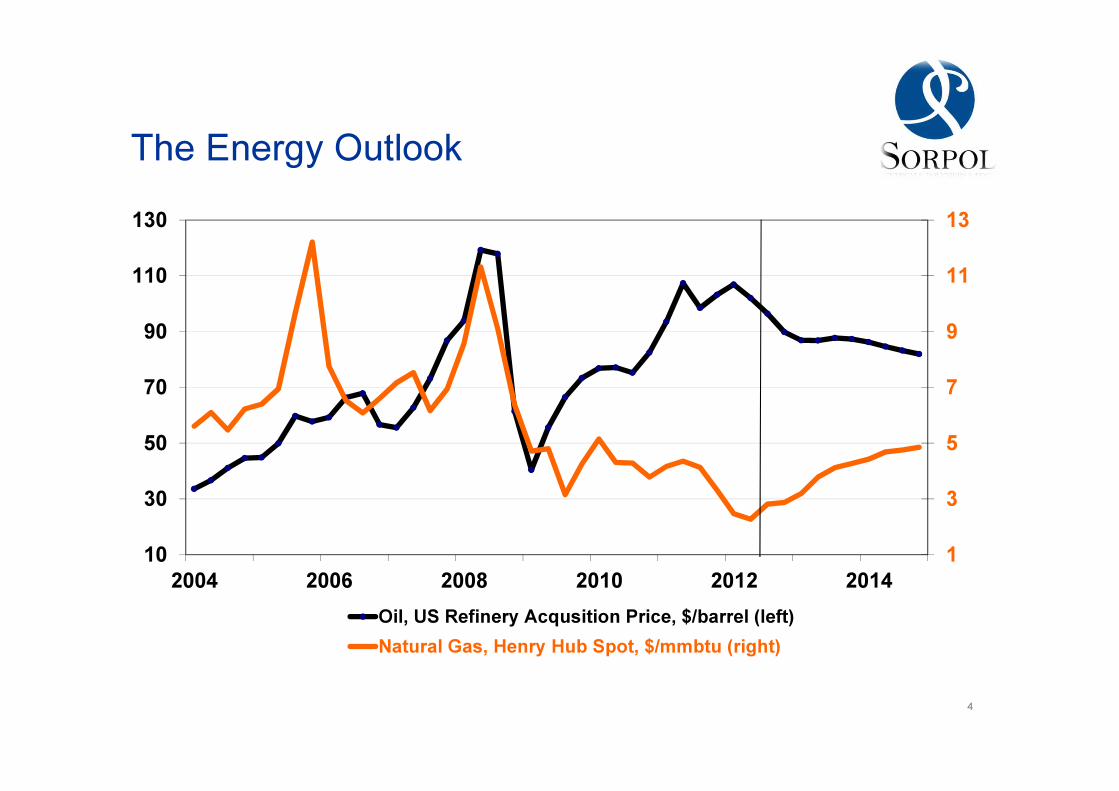
The Energy Outlook
4
1
3
5
7
9
11
13
10
30
50
70
90
110
130
2004 2006 2008 2010 2012 2014
Oil, US Refinery Acqusition Price, $/barrel (left)
Natural Gas, Henry Hub Spot, $/mmbtu (right)
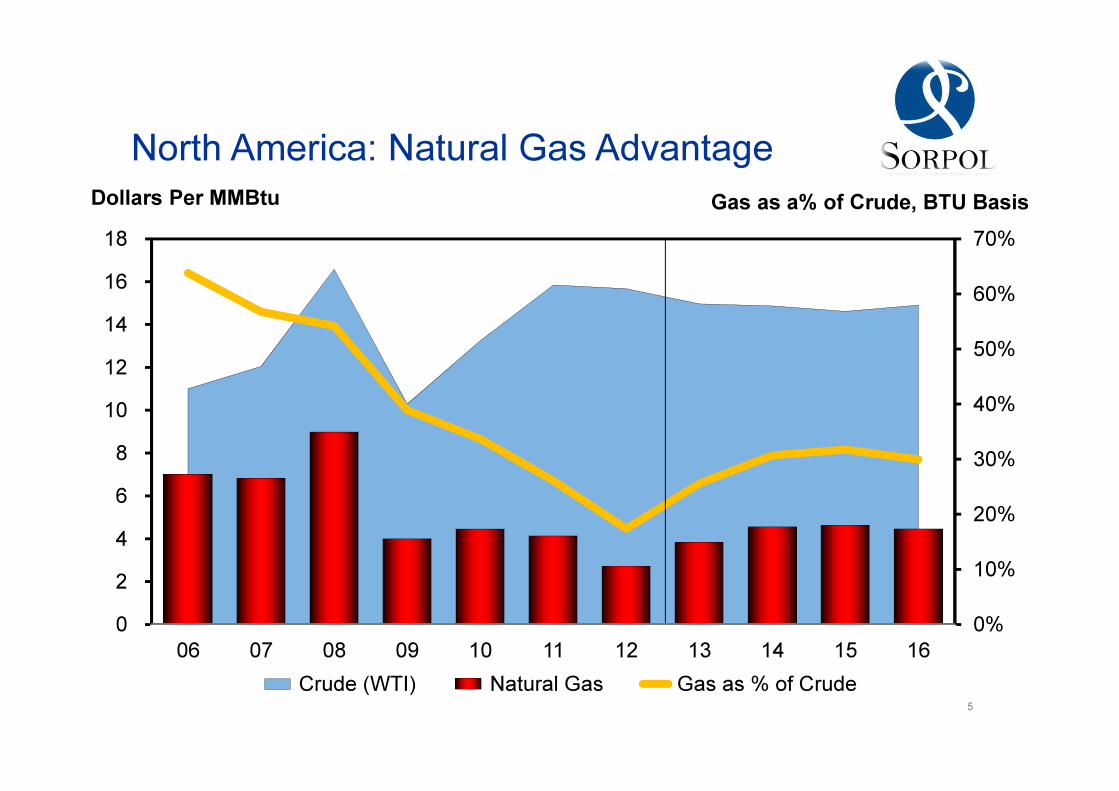
0%
10%
20%
30%
40%
50%
60%
70%
0
2
4
6
8
10
12
14
16
18
06 07 08 09 10 11 12 13 14 15 16
Crude (WTI) Natural Gas Gas as % of Crude
Dollars Per MMBtu Gas as a% of Crude, BTU Basis
5
North America: Natural Gas Advantage
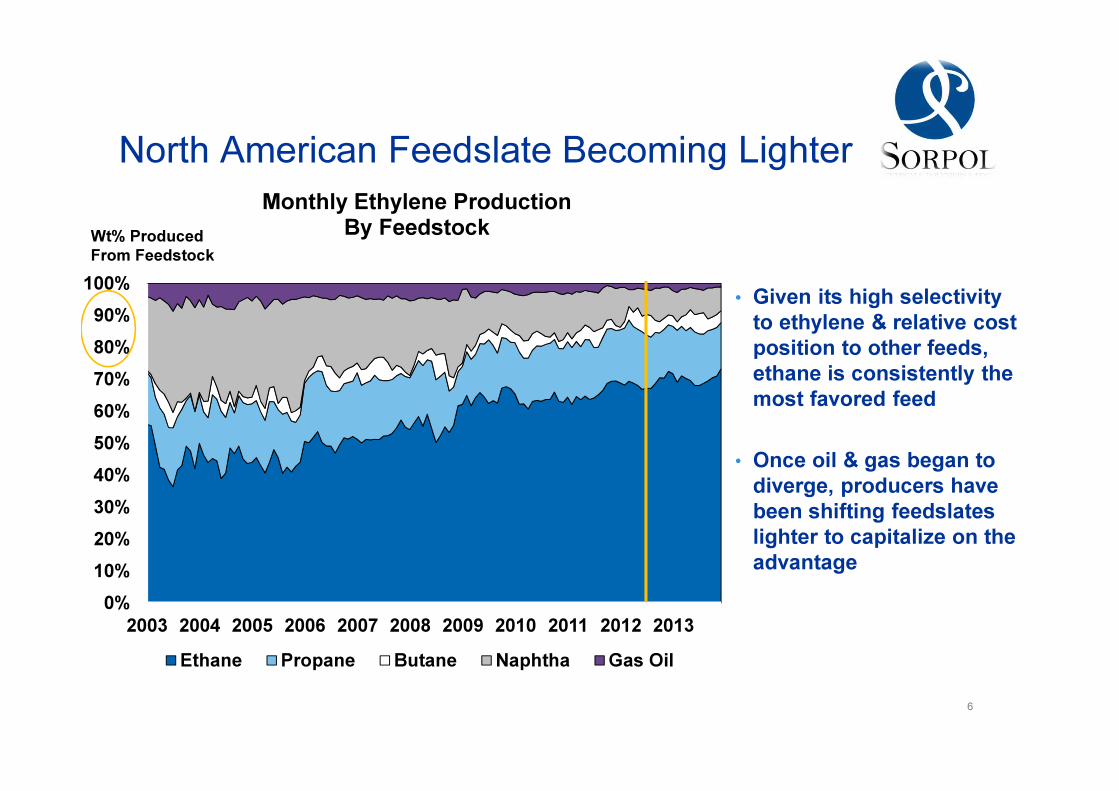
North American Feedslate Becoming Lighter
• Given its high selectivity
to ethylene & relative cost
position to other feeds,
ethane is consistently the
most favored feed
• Once oil & gas began to
diverge, producers have
been shifting feedslates
lighter to capitalize on the
advantage
6
0%
10%
20%
30%
40%
50%
60%
70%
80%
90%
100%
2003 2004 2005 2006 2007 2008 2009 2010 2011 2012 2013
Monthly Ethylene ProductionBy Feedstock
Ethane Propane Butane Naphtha Gas Oil
Wt% Produced
From Feedstock
Ethylene & Polyethylene
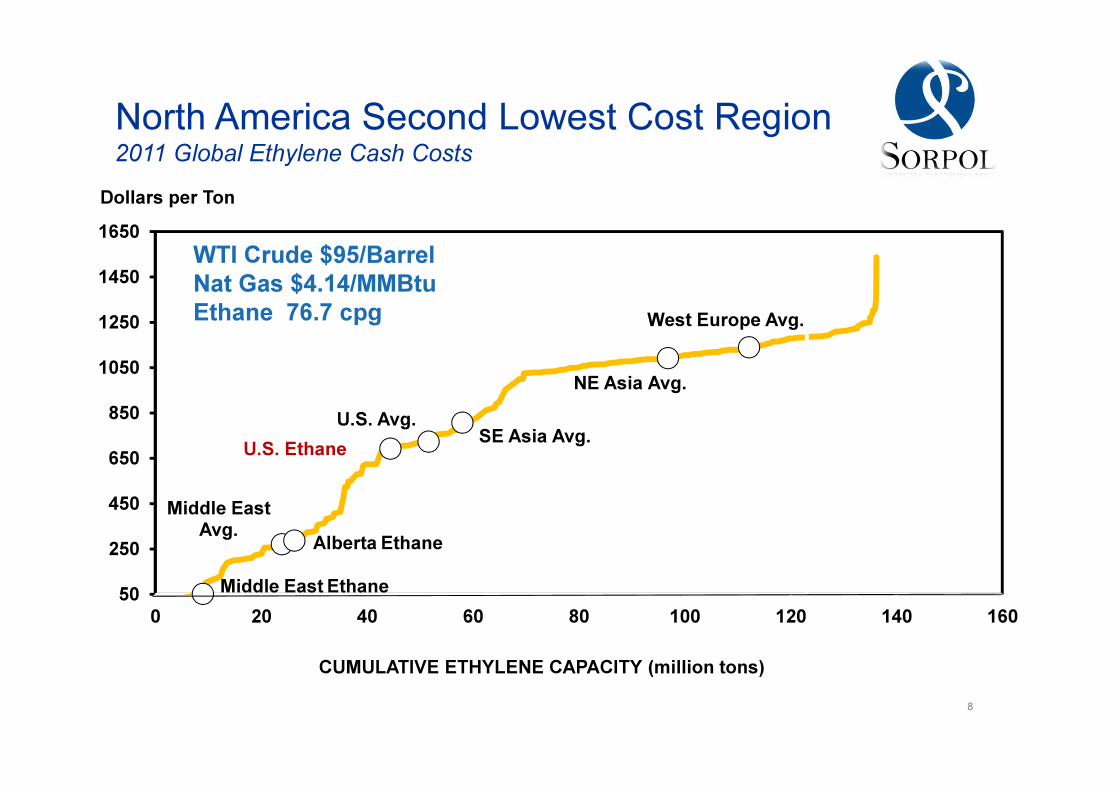
SE Asia Avg.
NE Asia Avg.
West Europe Avg.
Middle East Avg.
U.S. Avg.
U.S. Ethane
50
250
450
650
850
1050
1250
1450
1650
0 20 40 60 80 100 120 140 160
Dollars per Ton
CUMULATIVE ETHYLENE CAPACITY (million tons)
WTI Crude $95/Barrel Nat Gas $4.14/MMBtuEthane 76.7 cpg
North America Second Lowest Cost Region2011 Global Ethylene Cash Costs
Alberta Ethane
Middle East Ethane
8
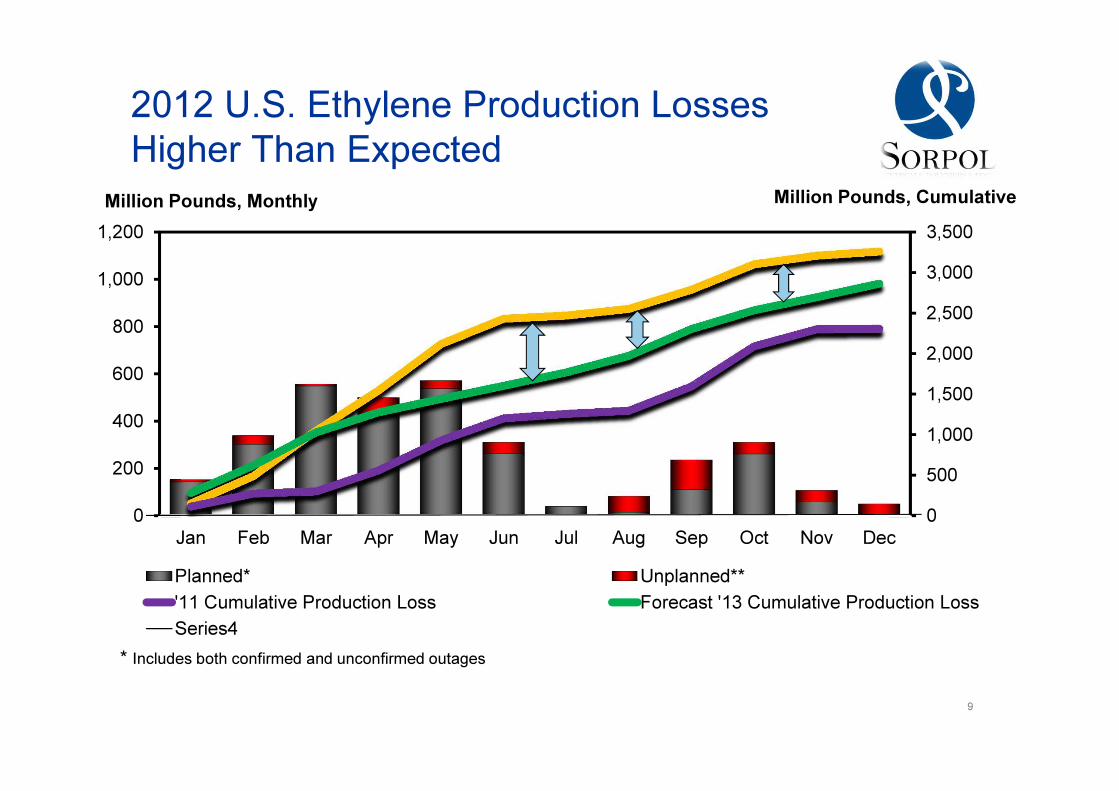
2012 U.S. Ethylene Production Losses
Higher Than Expected
0
500
1,000
1,500
2,000
2,500
3,000
3,500
0
200
400
600
800
1,000
1,200
Jan Feb Mar Apr May Jun Jul Aug Sep Oct Nov Dec
Planned* Unplanned**
'11 Cumulative Production Loss Forecast '13 Cumulative Production Loss
Series4
* Includes both confirmed and unconfirmed outages
Million Pounds, Monthly Million Pounds, Cumulative
9
300
500
700
900
1,100
1,300
1,500
1,700
1,900
2,100
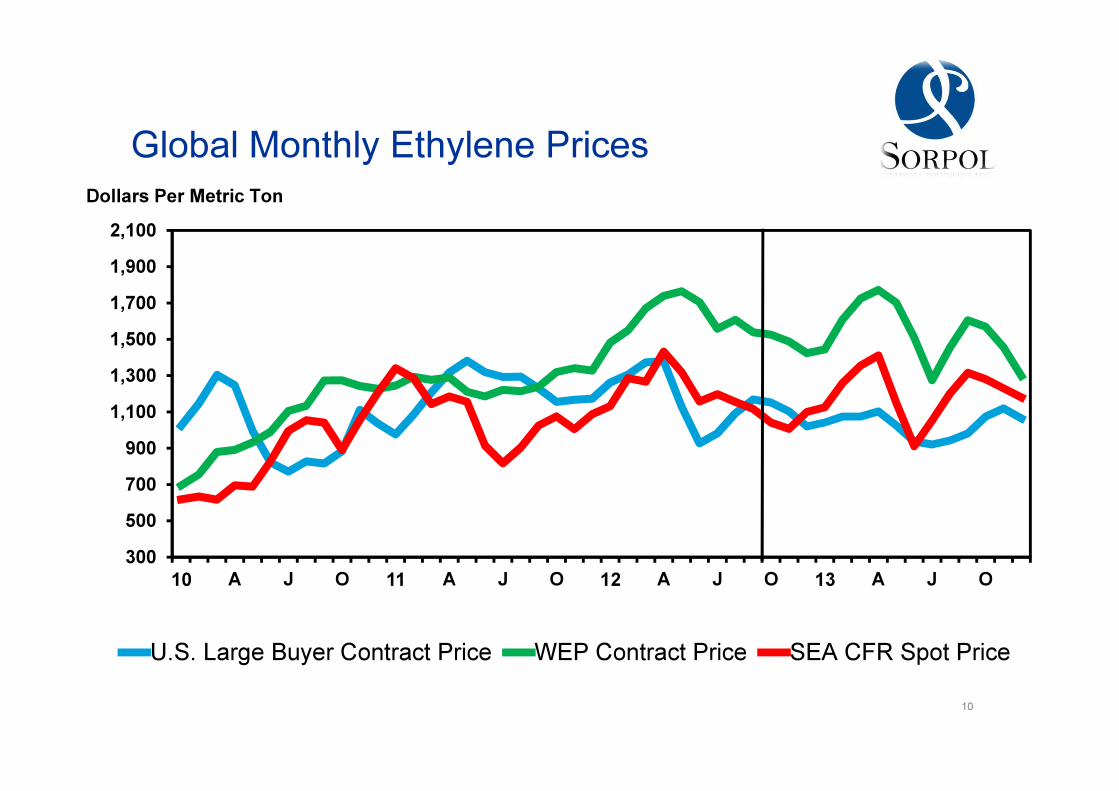
10 A J O 11 A J O 12 A J O 13 A J O
U.S. Large Buyer Contract Price WEP Contract Price SEA CFR Spot Price
Dollars Per Metric Ton
Forecast
Global Monthly Ethylene Prices
10
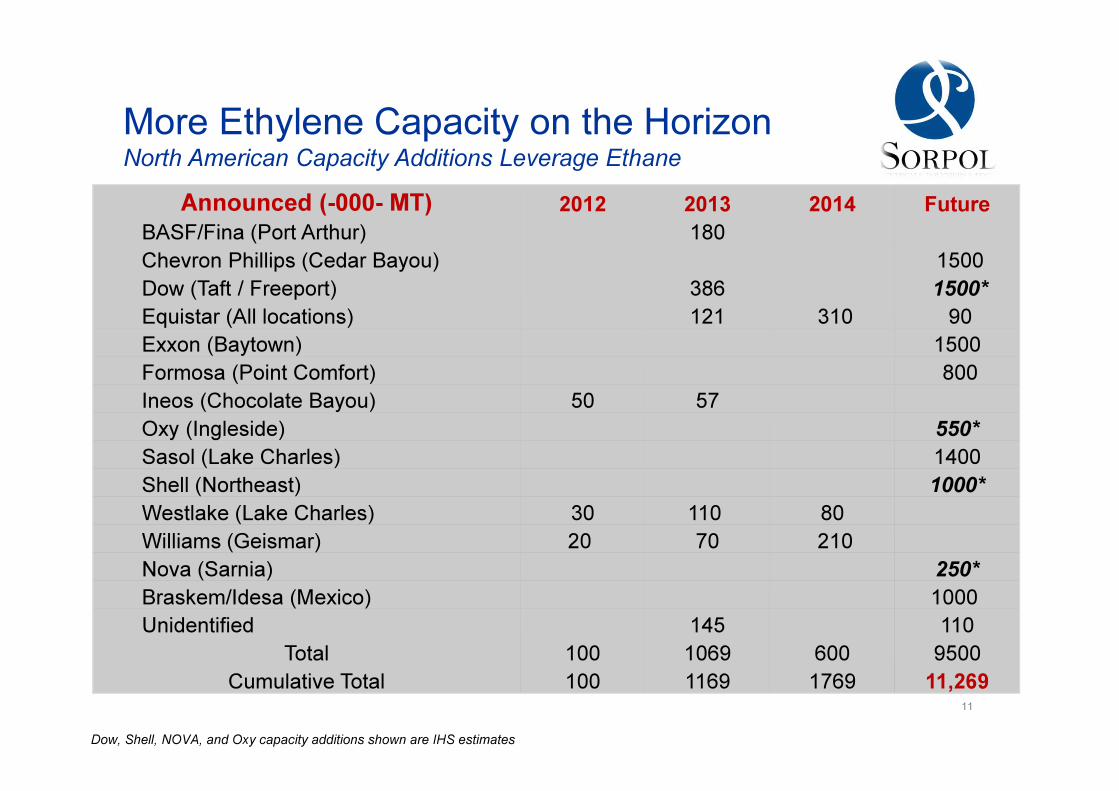
Dow, Shell, NOVA, and Oxy capacity additions shown are IHS estimates
Announced (-000- MT) 2012 2013 2014 Future
BASF/Fina (Port Arthur) 180
Chevron Phillips (Cedar Bayou) 1500
Dow (Taft / Freeport) 386 1500*
Equistar (All locations) 121 310 90
Exxon (Baytown) 1500
Formosa (Point Comfort) 800
Ineos (Chocolate Bayou) 50 57
Oxy (Ingleside) 550*
Sasol (Lake Charles) 1400
Shell (Northeast) 1000*
Westlake (Lake Charles) 30 110 80
Williams (Geismar) 20 70 210
Nova (Sarnia) 250*
Braskem/Idesa (Mexico) 1000
Unidentified 145 110
Total 100 1069 600 9500
Cumulative Total 100 1169 1769 11,269
More Ethylene Capacity on the HorizonNorth American Capacity Additions Leverage Ethane
11
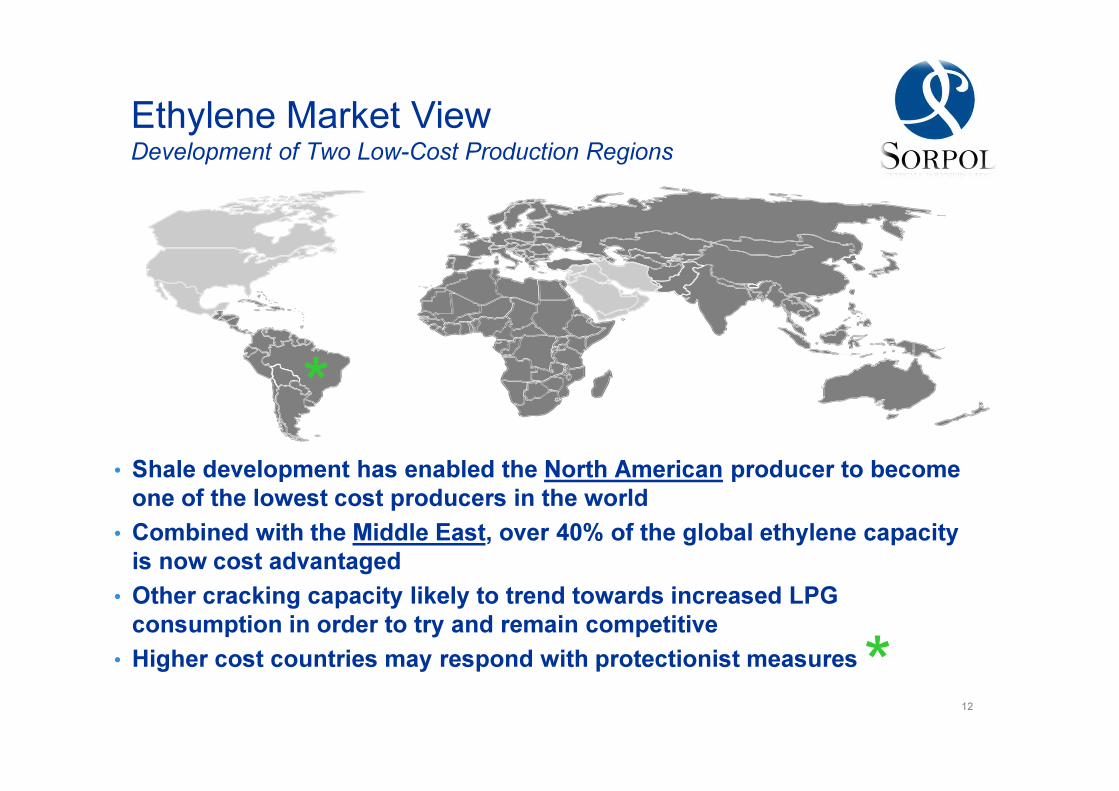
• Shale development has enabled the North American producer to become one of the lowest cost producers in the world
• Combined with the Middle East, over 40% of the global ethylene capacity is now cost advantaged
• Other cracking capacity likely to trend towards increased LPG consumption in order to try and remain competitive
• Higher cost countries may respond with protectionist measures
Ethylene Market ViewDevelopment of Two Low-Cost Production Regions
*
*12
• Short Term: Global demand growth for PE may be slowing as China
demand weakens and Europe contends with recession
• Longer Term: Two “low cost” regions (North America and the Middle East)
are set to compete for much of the global demand growth. The industry
has never before included two major “cost advantaged” regions• Numerous capacity additions expected in North America as producers in the
region seek to leverage cost advantage driven by “shale gas”
• Continued demand strength anticipated for specialty polyethylene products
such as metalocenes and bio-based resins
• While annual integrated margins are generally expected to trend higher,
most of the margin is forecast to remain upstream with the ethylene
molecule
Key Issues: Polyethylene
13
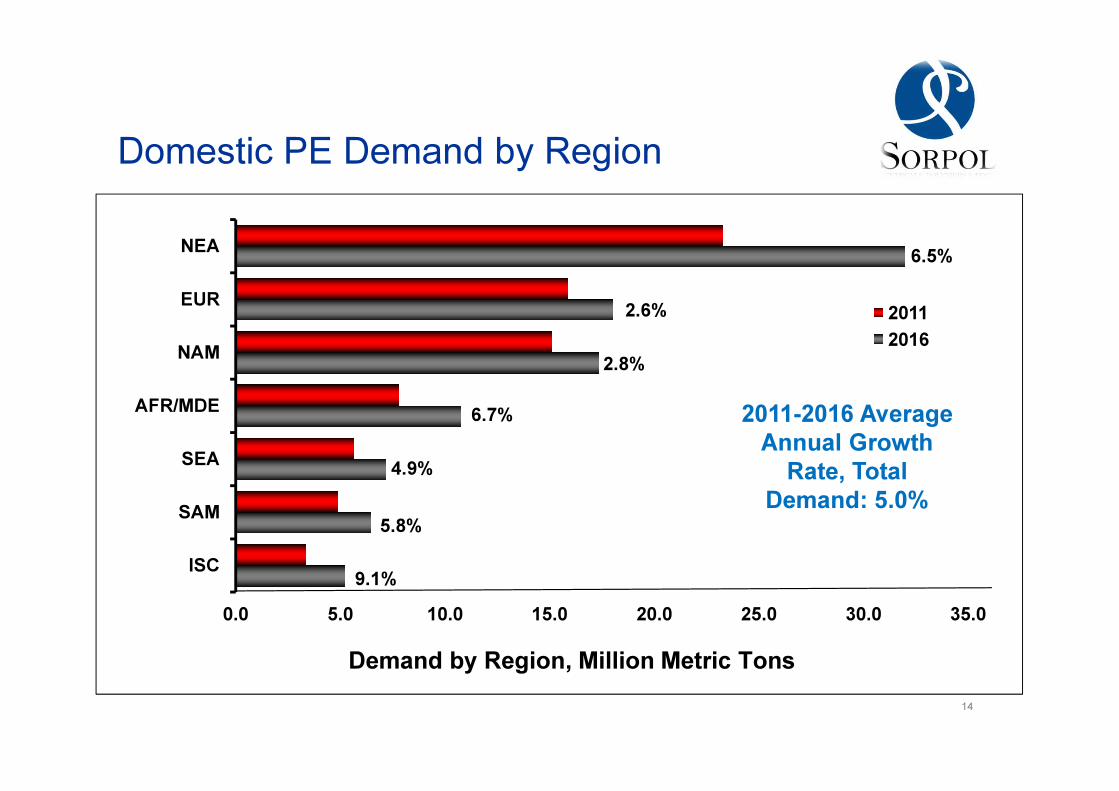
%: 11-16 Average Annual Growth Rate
Domestic PE Demand by Region
0.0 5.0 10.0 15.0 20.0 25.0 30.0 35.0
ISC
SAM
SEA
AFR/MDE
NAM
EUR
NEA
2011
2016
Demand by Region, Million Metric Tons
2.8%
9.1%
5.8%
4.9%
6.5%
2.6%
6.7% 2011-2016 Average Annual Growth Rate, Total
Demand: 5.0%
14
-4
-2
0
2
4
6
8
10
2006 2007 2008 2009 2010 2011 2012 2013 2014 2015 2016
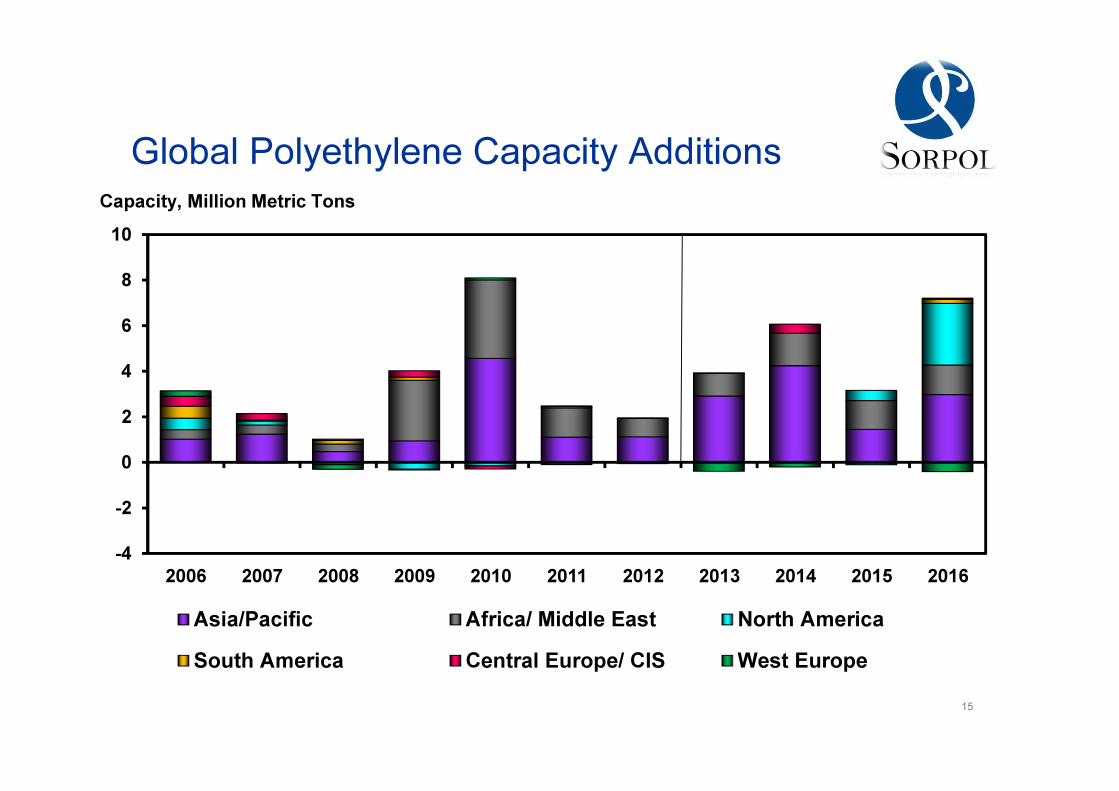
Asia/Pacific Africa/ Middle East North America
South America Central Europe/ CIS West Europe
Capacity, Million Metric Tons
Global Polyethylene Capacity Additions
15
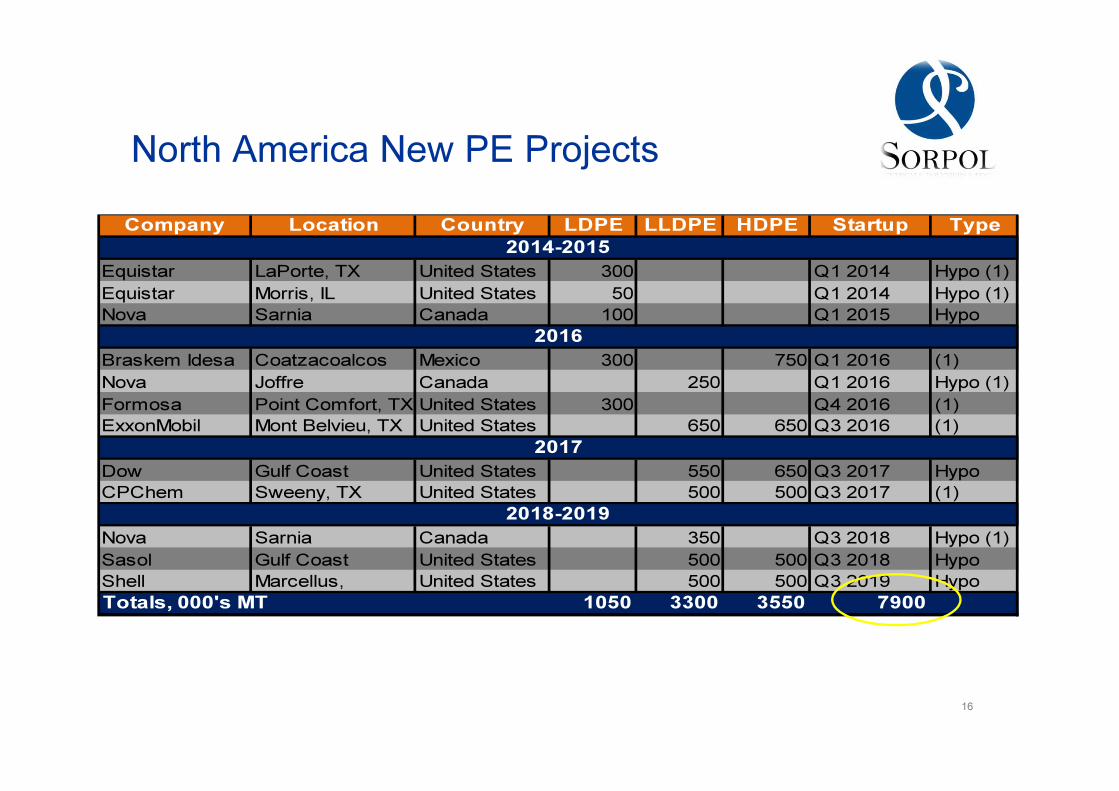
North America New PE Projects
Company Location Country LDPE LLDPE HDPE Startup Type
2014-2015
Equistar LaPorte, TX United States 300 Q1 2014 Hypo (1)
Equistar Morris, IL United States 50 Q1 2014 Hypo (1)
Nova Sarnia Canada 100 Q1 2015 Hypo
2016
Braskem Idesa Coatzacoalcos Mexico 300 750 Q1 2016 (1)
Nova Joffre Canada 250 Q1 2016 Hypo (1)
Formosa Point Comfort, TX United States 300 Q4 2016 (1)
ExxonMobil Mont Belvieu, TX United States 650 650 Q3 2016 (1)
2017
Dow Gulf Coast United States 550 650 Q3 2017 Hypo
CPChem Sweeny, TX United States 500 500 Q3 2017 (1)
2018-2019
Nova Sarnia Canada 350 Q3 2018 Hypo (1)
Sasol Gulf Coast United States 500 500 Q3 2018 Hypo
Shell Marcellus, United States 500 500 Q3 2019 Hypo
Totals, 000's MT 1050 3300 3550 7900
Notes: (1): Announced projects included in our capacity database; (2): Announced expansions with IHS
estimate of product and size, also not included in database; Hypo (1): reported projects not fully verified
or approved and not included in the database; Hypo: IHS estimates of product and size for announced
ethylene crackers - PE not in database.
16
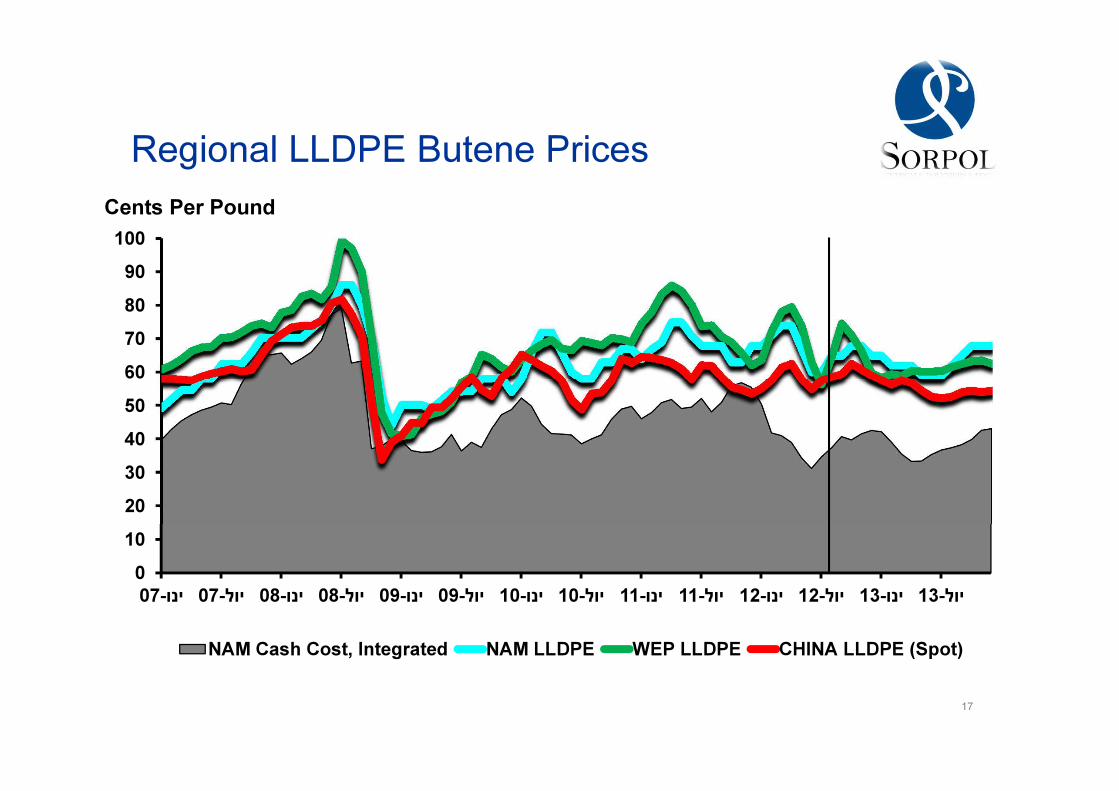
0
10
20
30
40
50
60
70
80
90
100
07-ינו 07-יול 08-ינו 08-יול 09-ינו 09-יול 10-ינו 10-יול 11-ינו 11-יול 12-ינו 12-יול 13-ינו 13-יול
NAM Cash Cost, Integrated NAM LLDPE WEP LLDPE CHINA LLDPE (Spot)
Cents Per Pound
17
Regional LLDPE Butene Prices
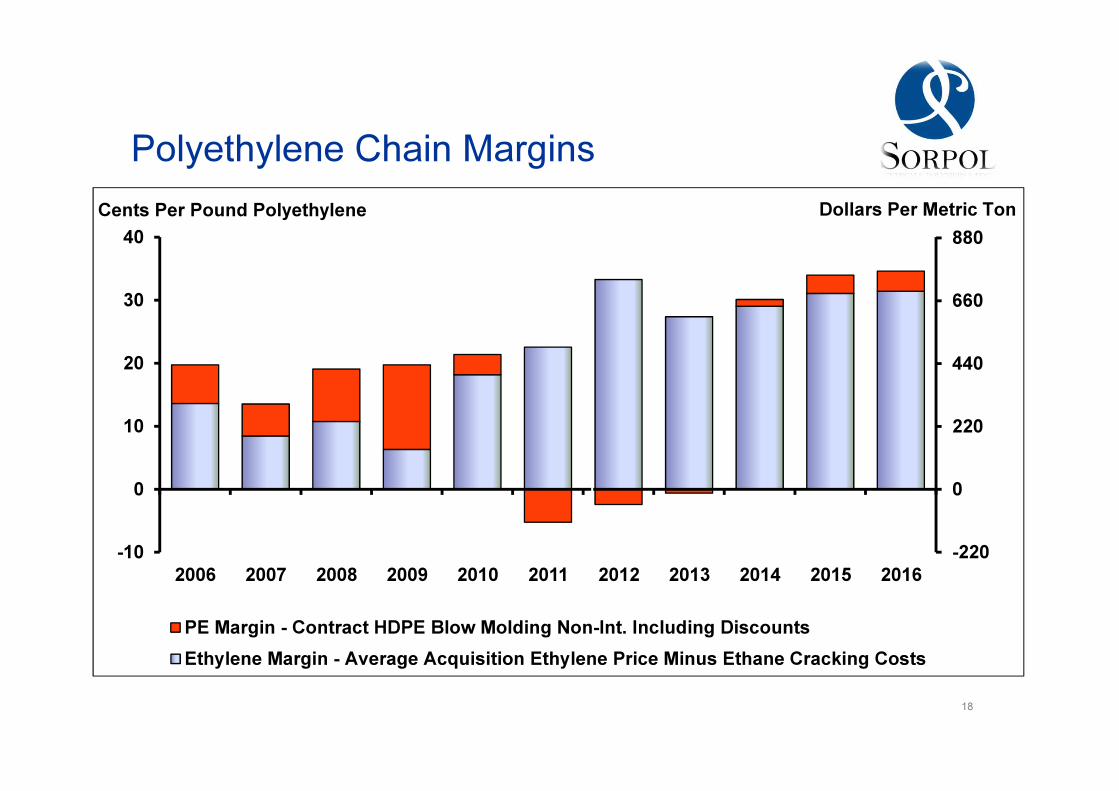
Polyethylene Chain Margins
-220
0
220
440
660
880
-10
0
10
20
30
40
2006 2007 2008 2009 2010 2011 2012 2013 2014 2015 2016
PE Margin - Contract HDPE Blow Molding Non-Int. Including Discounts
Ethylene Margin - Average Acquisition Ethylene Price Minus Ethane Cracking Costs
Cents Per Pound Polyethylene Dollars Per Metric Ton
18
PE North America: Near Term Pricing
• Contract PE prices increased 6.0 cents Jan – April due to
tight ethylene and high spot / contract ethylene prices, but
later declined by 14.0 cents over May/June as supplies
improved and ethylene prices collapsed. Prices rebounding
with +5 in August achieved and +5 in October announced.
• Integrated margins were recently at record levels = 28 cents
per pound in August versus year to date average of 28.75
cpp. Rest of year average margin is 25.5 cpp and 2013
average of 25.3 cpp. Margins forecast to move higher and
peak in 2015/2016 prior to start up of new capacity.
19
• Nearly 6.7 MMT of “cost advantaged” new production capacity is
anticipated to be added within the region during the next five years*
• Nearly 5.4 MMT of the referenced capacity is expected in the US
• An additional 6.5 MMT tons of new production capacity is expected to
come on line in the 2017 – 2022 timeframe
• While most of the new production capacity will be targeted into the export
market, the domestic price premium that has existed within the region is
expected to erode as competition for the domestic demand increases
• The first new major complex to start up in the region (Braskem / Idesa) will
impact trade flows from the US to Mexico when production begins
• US producers are likely to look further south in an effort to move any
displaced sales volume
Implications for Buyers: Polyethylene
20
Propylene & Polypropylene
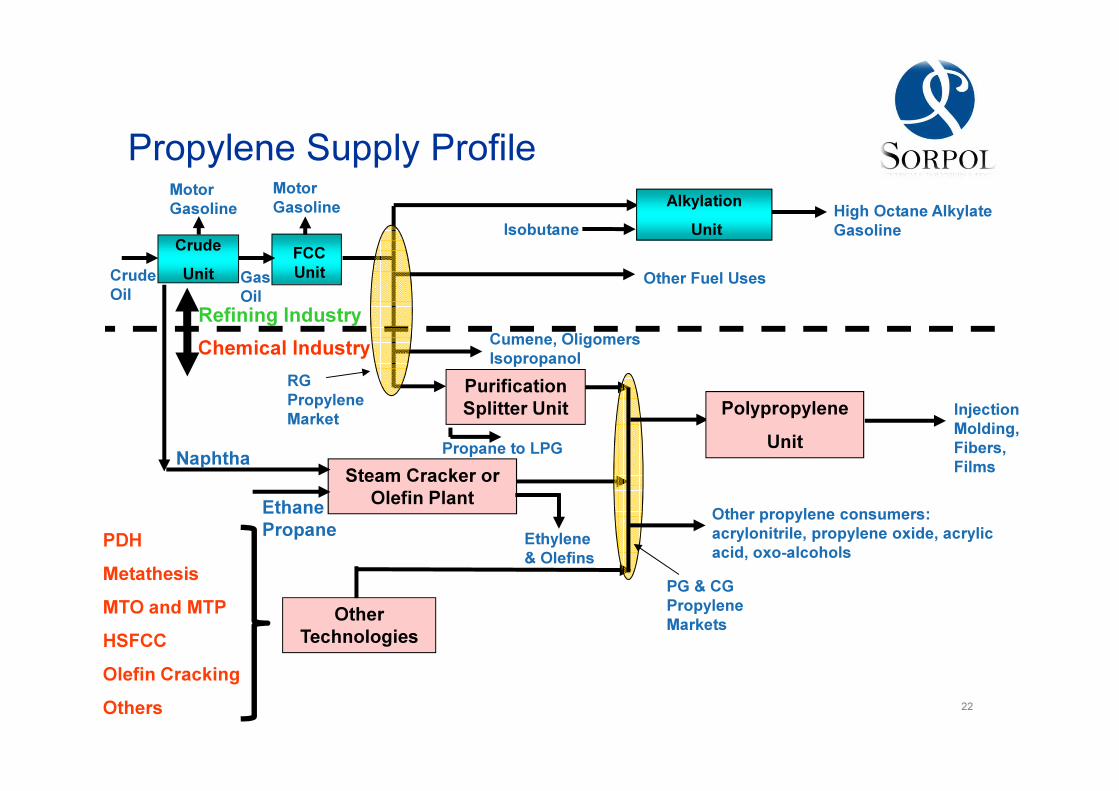
Propylene Supply Profile
Other Technologies
Steam Cracker or Olefin Plant
Ethane Propane
Other propylene consumers:
acrylonitrile, propylene oxide, acrylic
acid, oxo-alcohols
PG & CG
Propylene
Markets
Propane to LPG
Cumene, Oligomers
Isopropanol
FCC
Unit
Alkylation
UnitIsobutaneHigh Octane Alkylate
Gasoline
Other Fuel Uses
Purification Splitter Unit
Refining Industry
Chemical Industry
Gas
Oil
RG
Propylene
Market
Crude
UnitCrude
Oil
Motor
Gasoline
Motor
Gasoline
Naphtha
Ethylene
& Olefins
Polypropylene
Unit
Injection
Molding,
Fibers,
Films
PDH
Metathesis
MTO and MTP
HSFCC
Olefin Cracking
Others 22
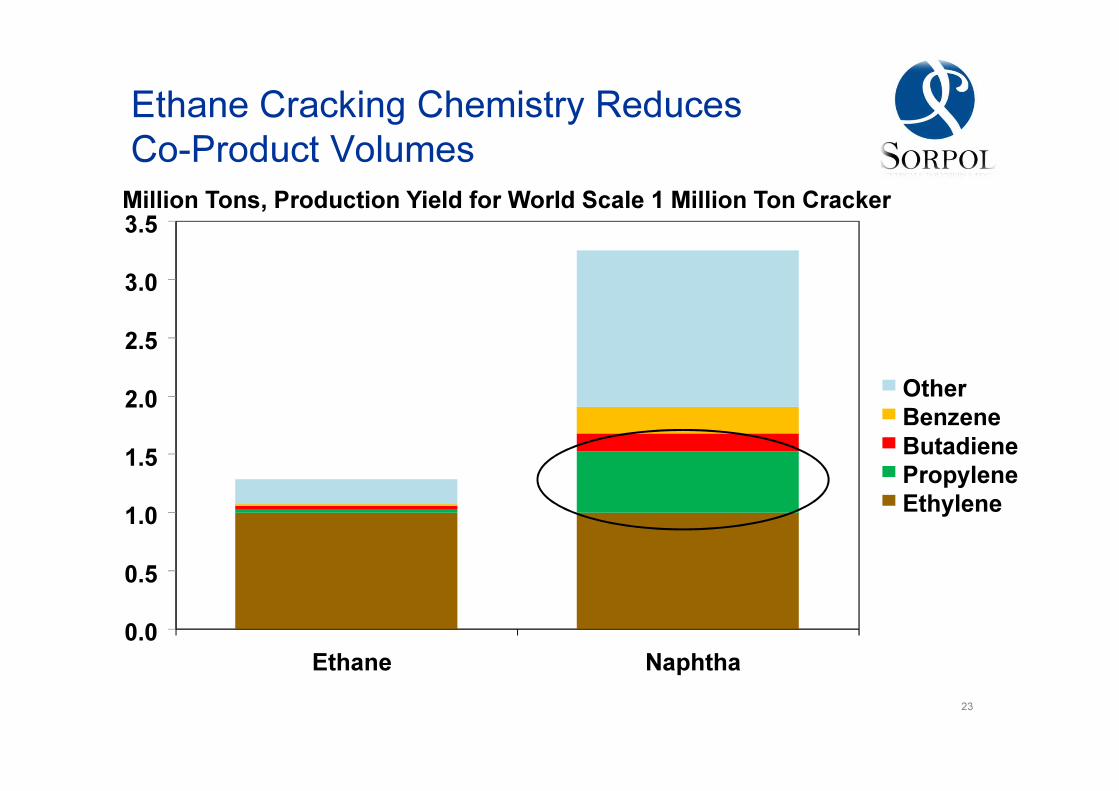
Ethane Cracking Chemistry Reduces
Co-Product Volumes
0.0
0.5
1.0
1.5
2.0
2.5
3.0
3.5
Ethane Naphtha
Million Tons, Production Yield for World Scale 1 Million Ton Cracker
OtherBenzeneButadienePropyleneEthylene
23
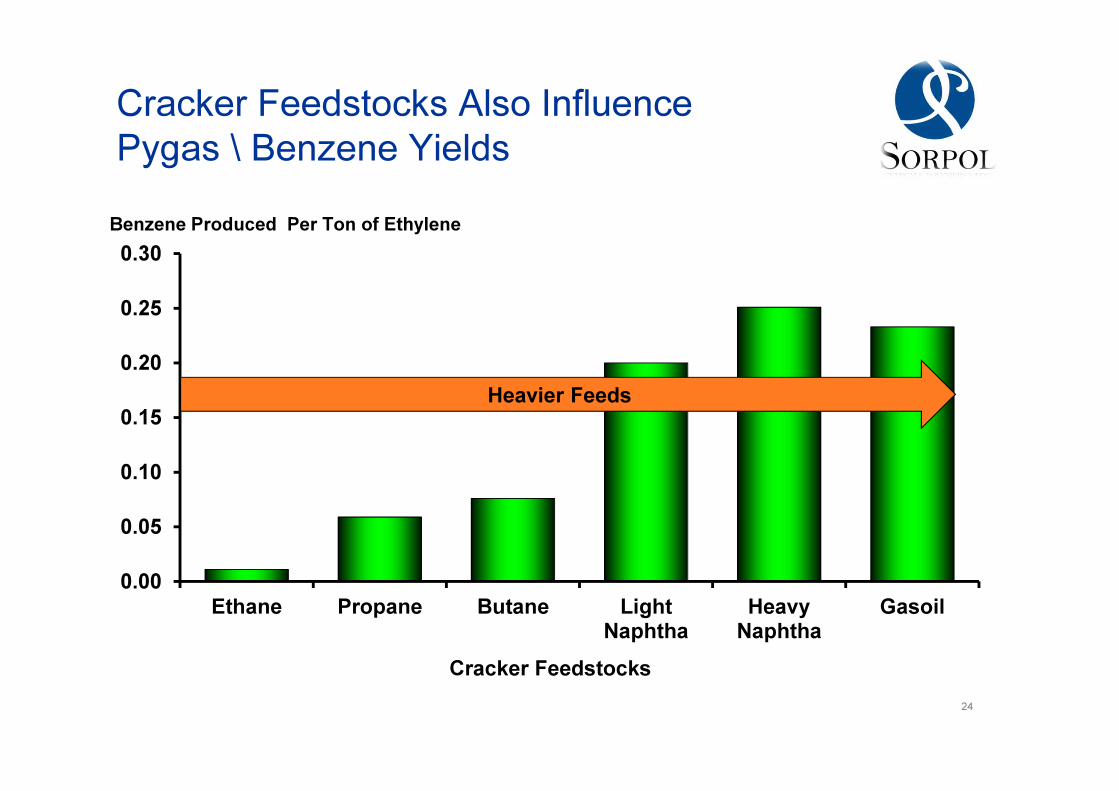
Cracker Feedstocks Also Influence
Pygas \ Benzene Yields
0.00
0.05
0.10
0.15
0.20
0.25
0.30
Ethane Propane Butane LightNaphtha
HeavyNaphtha
Gasoil
Cracker Feedstocks
Benzene Produced Per Ton of Ethylene
Heavier Feeds
24
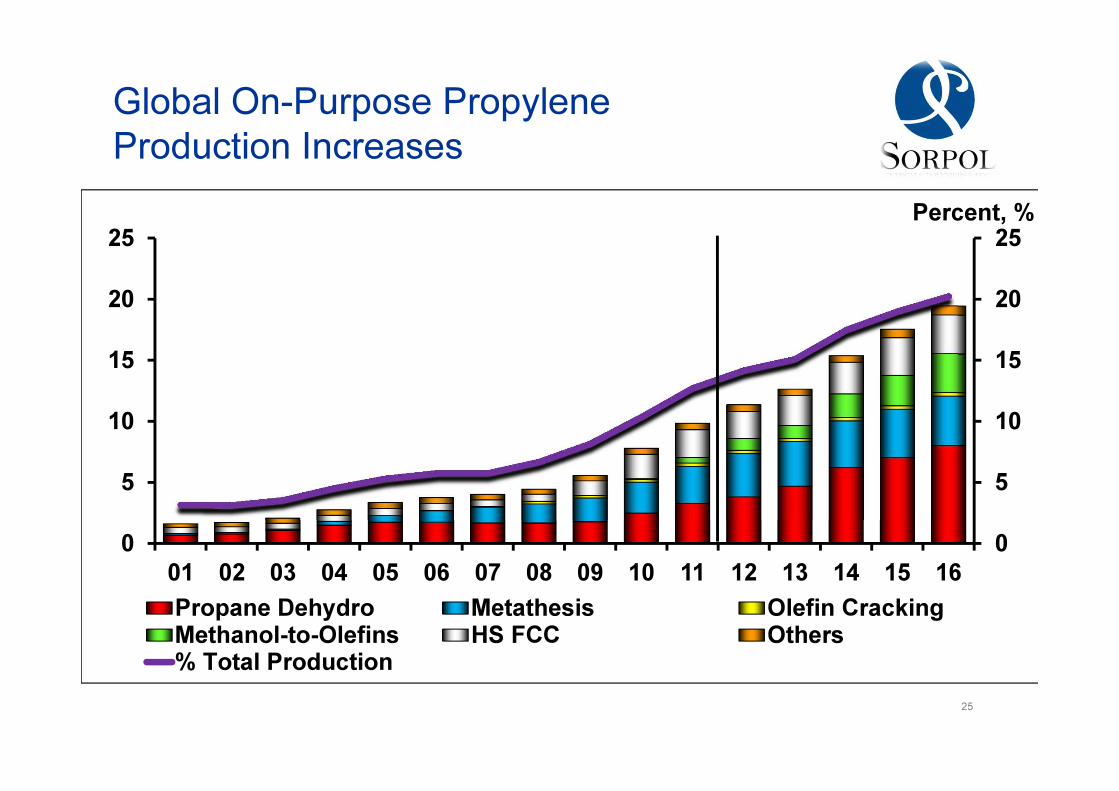
0
5
10
15
20
25
0
5
10
15
20
25
01 02 03 04 05 06 07 08 09 10 11 12 13 14 15 16
Percent, %
Propane Dehydro Metathesis Olefin CrackingMethanol-to-Olefins HS FCC Others% Total Production
Million Metric Tons
Global On-Purpose Propylene
Production Increases
25
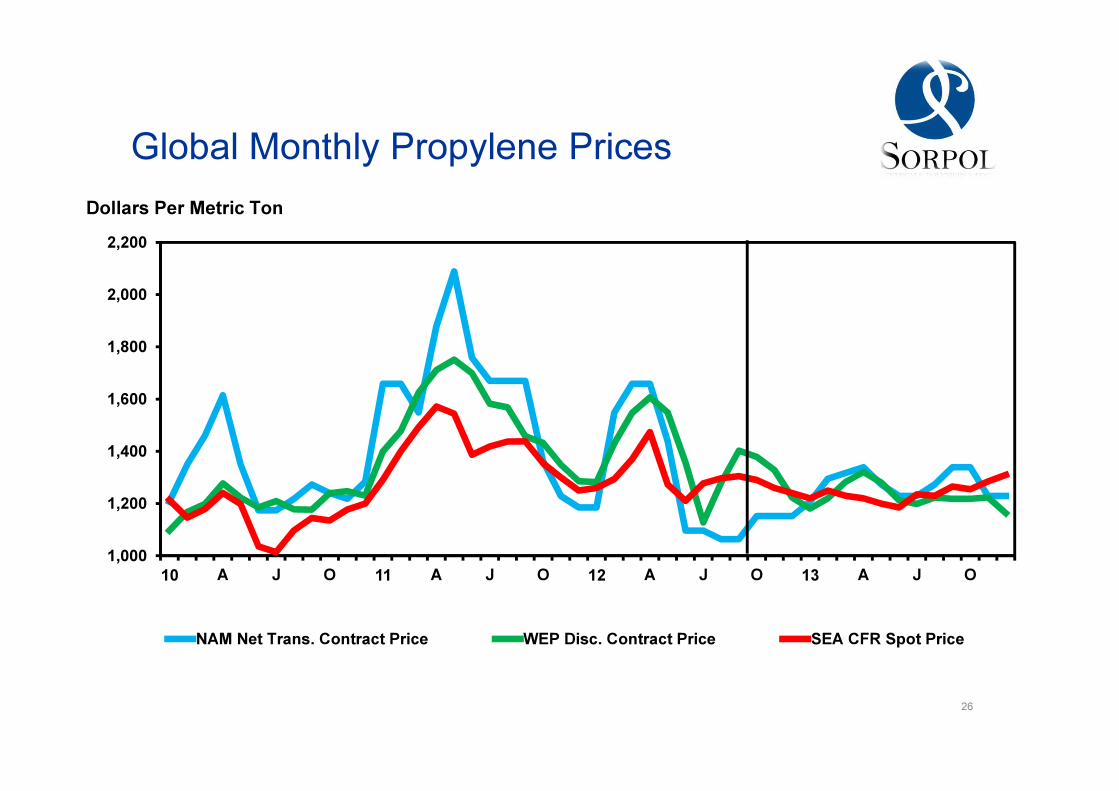
Global Monthly Propylene Prices
26
1,000
1,200
1,400
1,600
1,800
2,000
2,200
10 A J O 11 A J O 12 A J O 13 A J O
NAM Net Trans. Contract Price WEP Disc. Contract Price SEA CFR Spot Price
Dollars Per Metric Ton
Forecast
• Expensive nature of polypropylene still affecting industry• Relative prices versus other materials, but particularly to polyethylene, is high
• Demand will still grow• Concerns with elevated prices do not translate into severe reductions in demand growth
• Improving economic conditions in developing regions that lift consumers from lower
income categories, creates positive environment for demand growth
• Certain applications will benefit more than others (durable vs non-durable)
• Price differentials across regions to remain in place• Asian prices remain depressed due to global oversupply
• North American prices remain volatile and elevated due to tight propylene supply
• Europe continues to track North American price trends
• Lower Asian prices have affected demand growth in regions that have trade protection
for polymers but not for finished goods
• Global oversupply and increasing self sufficiency in China altering trade flows
• Investment in PP may resurface in North America, due to lower cost propane
de-hydro technology
Key Issues: Polypropylene
27
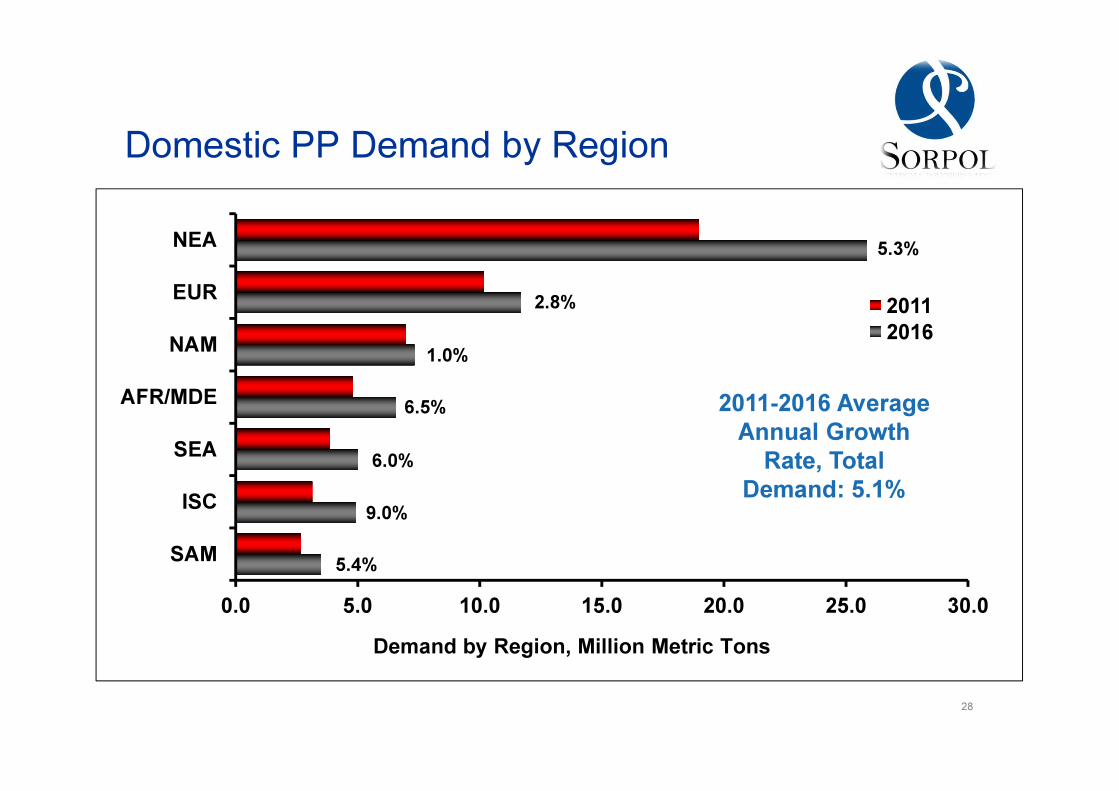
%: 11-16 Average Annual Growth Rate
Domestic PP Demand by Region
0.0 5.0 10.0 15.0 20.0 25.0 30.0
SAM
ISC
SEA
AFR/MDE
NAM
EUR
NEA
2011
2016
Demand by Region, Million Metric Tons
1.0%
5.4%
9.0%
6.0%
5.3%
2.8%
6.5% 2011-2016 Average Annual Growth Rate, Total
Demand: 5.1%
28
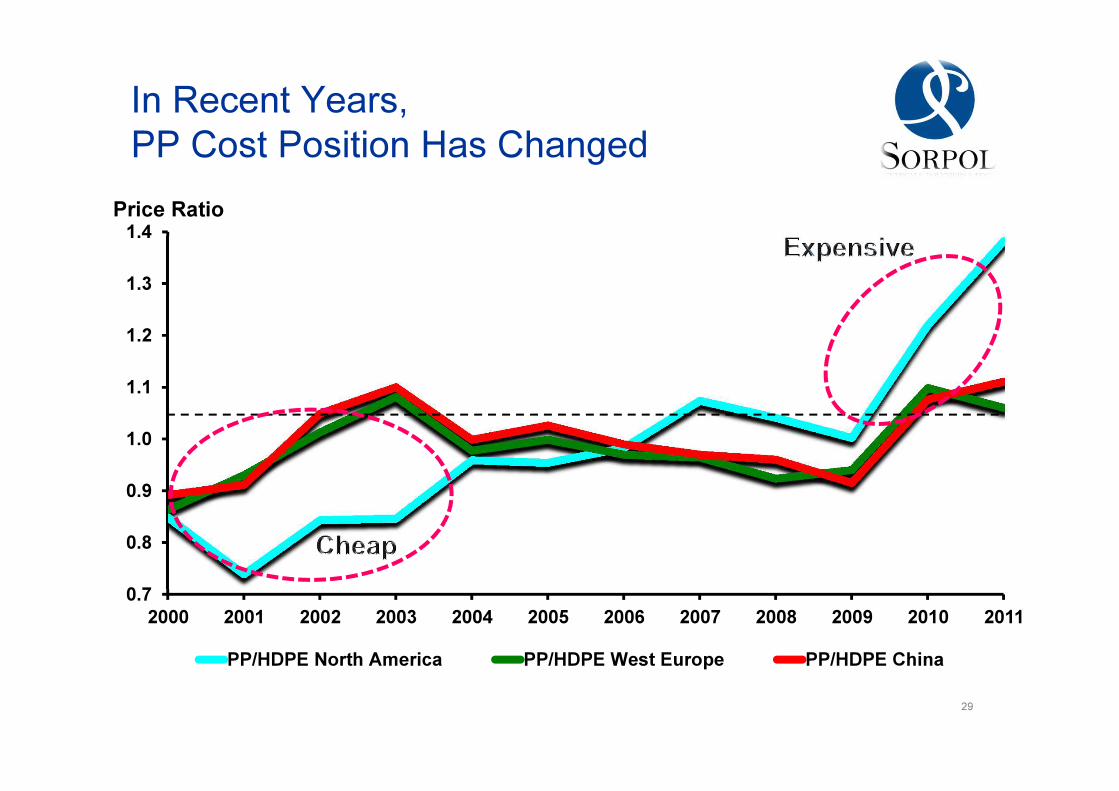
In Recent Years,
PP Cost Position Has Changed
0.7
0.8
0.9
1.0
1.1
1.2
1.3
1.4
2000 2001 2002 2003 2004 2005 2006 2007 2008 2009 2010 2011
PP/HDPE North America PP/HDPE West Europe PP/HDPE China
Price Ratio
29
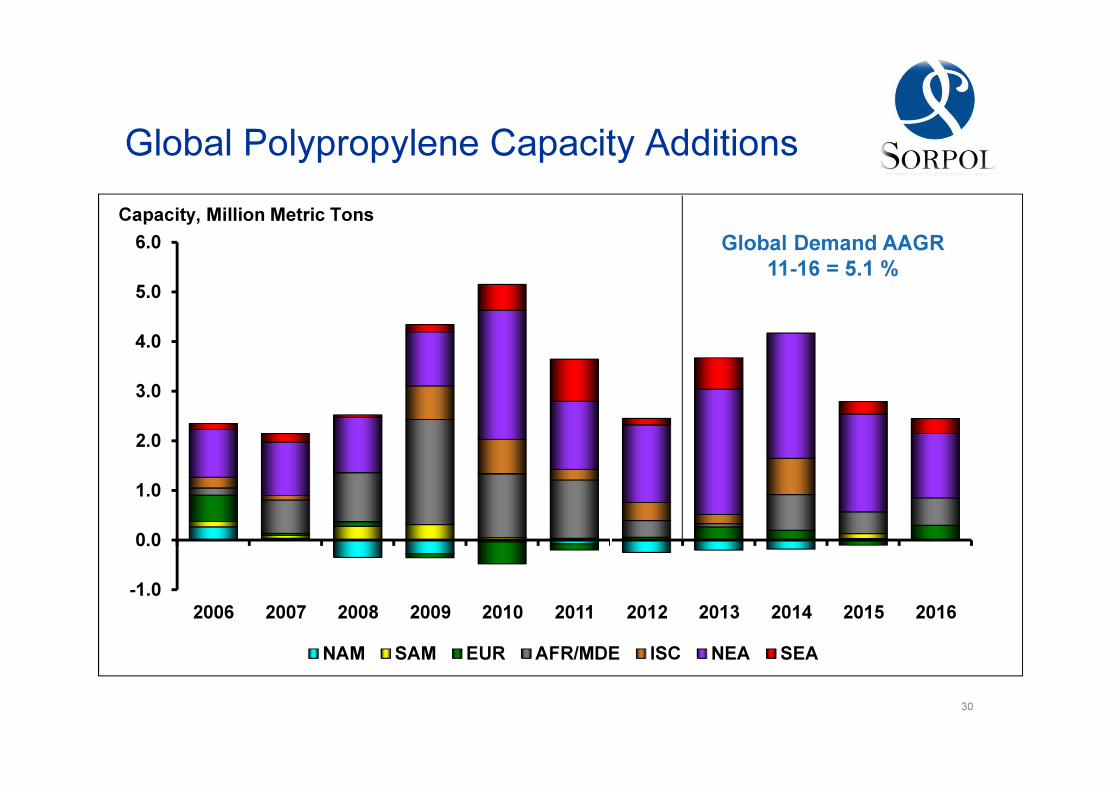
Global Polypropylene Capacity Additions
-1.0
0.0
1.0
2.0
3.0
4.0
5.0
6.0
2006 2007 2008 2009 2010 2011 2012 2013 2014 2015 2016
NAM SAM EUR AFR/MDE ISC NEA SEA
Capacity, Million Metric Tons
Global Demand AAGR
11-16 = 5.1 %
30
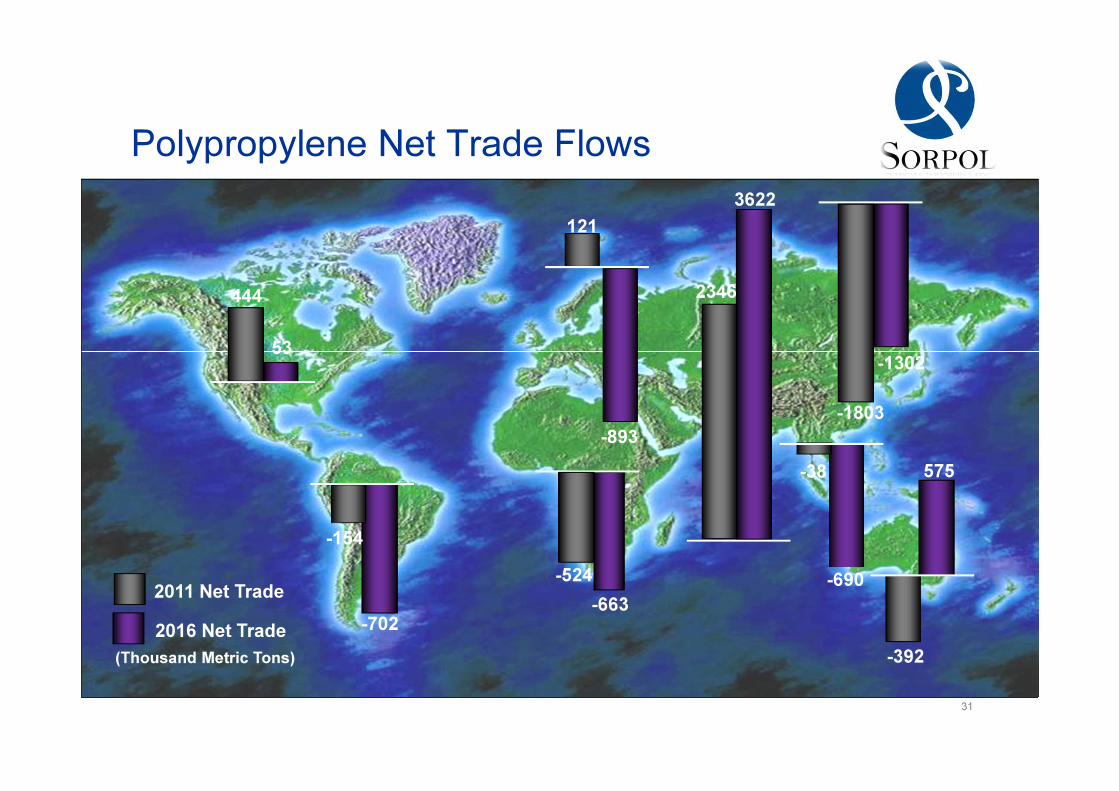
Polypropylene Net Trade Flows
-702-663
3622
-690
-1302
575
53
-893
-154
-524
2346
-1803
-38
-392
444
121
2011 Net Trade
2016 Net Trade
(Thousand Metric Tons)
31
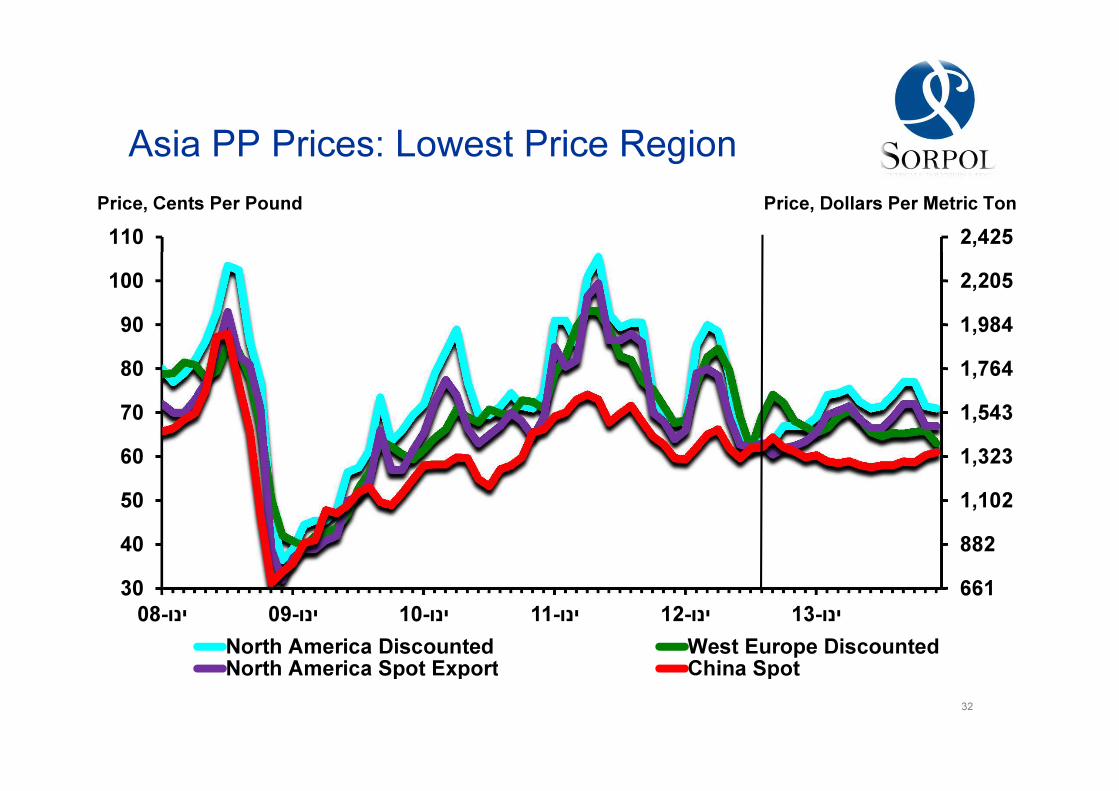
Asia PP Prices: Lowest Price Region
661
882
1,102
1,323
1,543
1,764
1,984
2,205
2,425
30
40
50
60
70
80
90
100
110
08-ינו 09-ינו 10-ינו 11-ינו 12-ינו 13-ינו
North America Discounted West Europe DiscountedNorth America Spot Export China Spot
Price, Dollars Per Metric TonPrice, Cents Per Pound
32
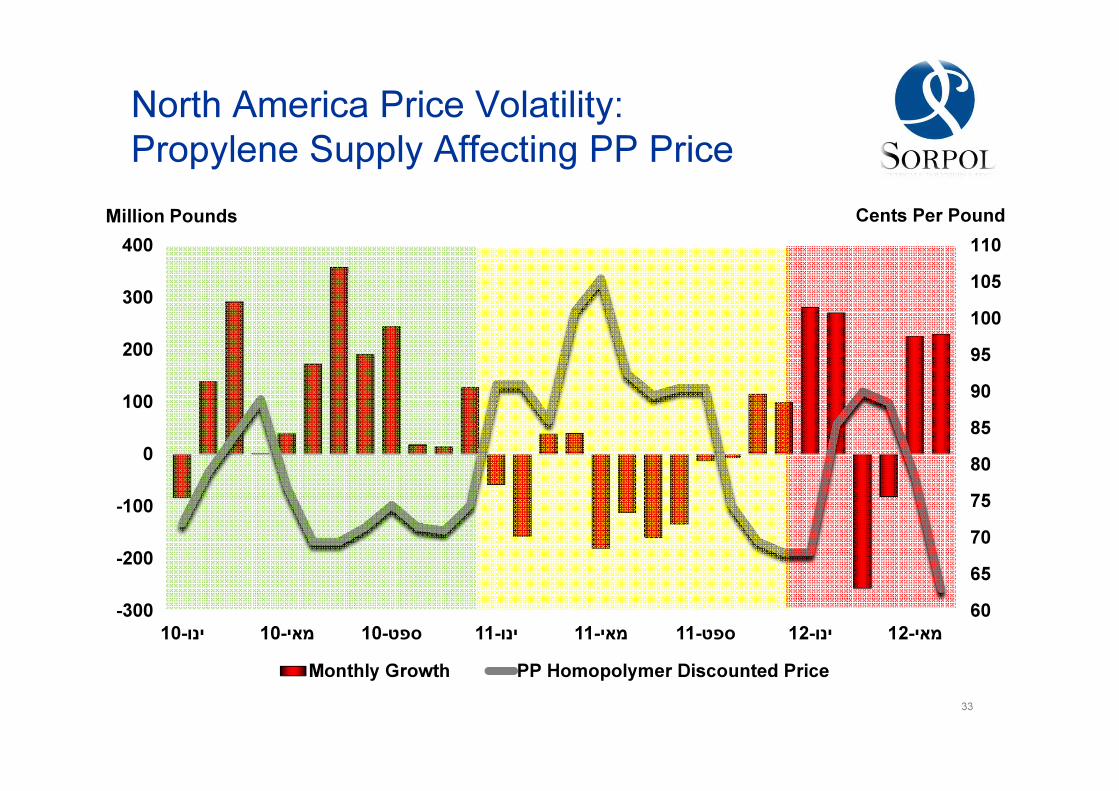
North America Price Volatility:
Propylene Supply Affecting PP Price
60
65
70
75
80
85
90
95
100
105
110
-300
-200
-100
0
100
200
300
400
10-ינו 10-מאי 10-ספט 11-ינו 11-מאי 11-ספט 12-ינו 12-מאי
Monthly Growth PP Homopolymer Discounted Price
Million Pounds Cents Per Pound
33
• Absolute level of PP domestic demand appears to be key in pushing
propylene prices higher and thus impacting volatility
• Demand apparently grew in first half of 2012, but most of the growth was
related to inventory replenishment
• Margins not improving; propylene plus formula pricing and refinery
integrated cost advantage affecting margin evolution
• No relief in propylene supply on the short term; rash of additional
propylene supply in second half of the decade will help and may even
result in additional capacity investments
• Arbitrage to be sustained for next few years (resin and finished goods)
Implications for Buyers: Polypropylene
34
Thank
you!


![GELCLAD 723425 D2...The global production capacity of bio-based polymers and bio-composites has demonstrated a dynamic growth [1–3]. With increasing oil prices, conventional polymers](https://img.pdfslide.us/doc/110x75/5f33e9629686c943b36a0c7e/gelclad-723425-d2-the-global-production-capacity-of-bio-based-polymers-and-bio-composites.jpg)