Embed Size (px)
Citation preview
Oil Peak, Facts and PoliciesSept. 25, 2012
Gary Flomenhoft, Fellow Gund Institutehttp://www.uvm.edu/giee
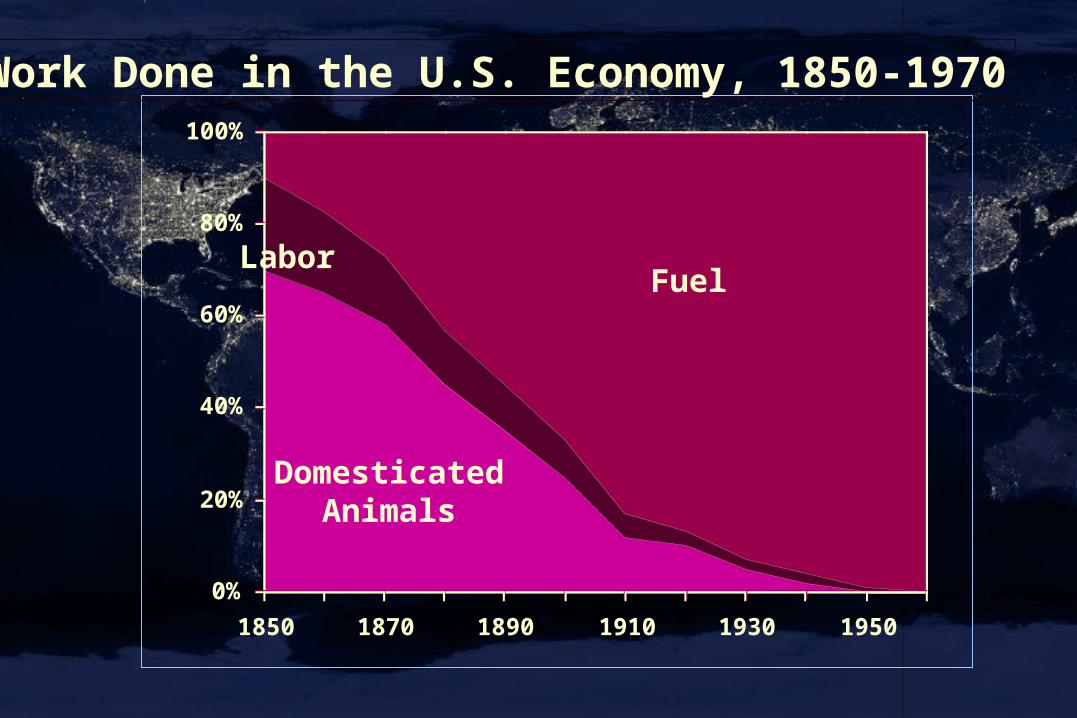
0%
20%
40%
60%
80%
100%
1850 1870 1890 1910 1930 1950
Fuel
DomesticatedAnimals
Labor
Work Done in the U.S. Economy, 1850-1970
0
25
50
75
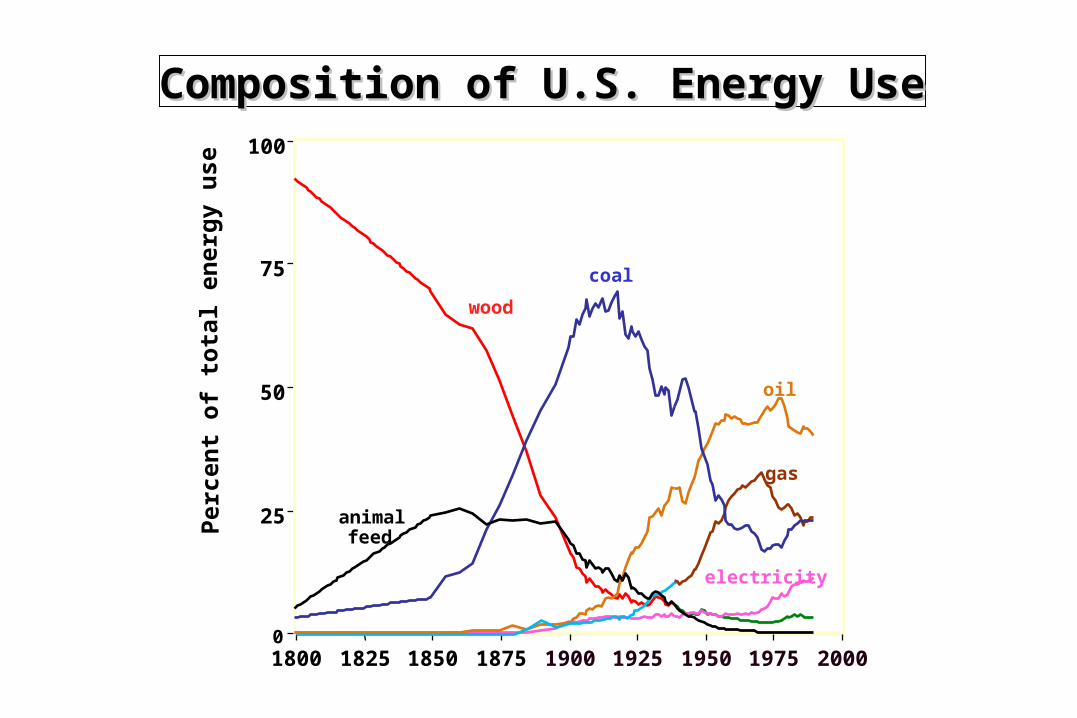
100
1800 1825 1850 1875 1900 1925 1950 1975 2000
Composition of U.S. Energy UseComposition of U.S. Energy Use
wood
animal feed
coal
oil
gas
electricity
Per
cen
t o
f to
tal
ener
gy
use
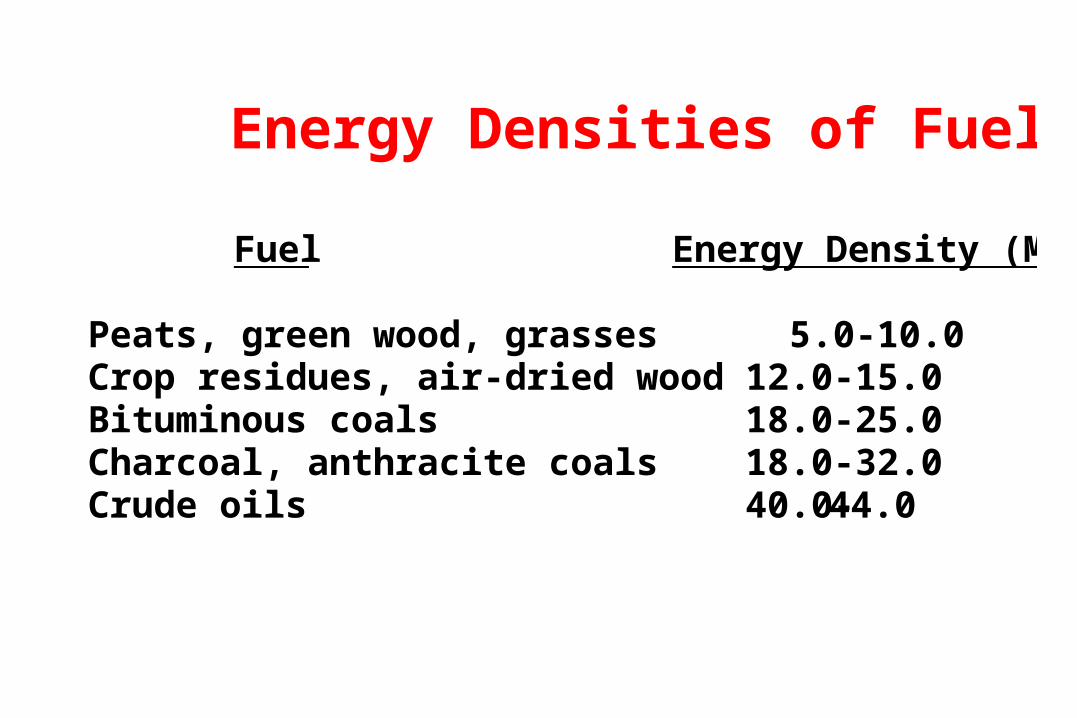
Energy Densities of Fuels
Fuel Energy Density (Mj/kg)
Peats, green wood, grasses 5.0-10.0Crop residues, air-dried wood 12.0-15.0Bituminous coals 18.0-25.0Charcoal, anthracite coals 18.0-32.0Crude oils 40.0-44.0
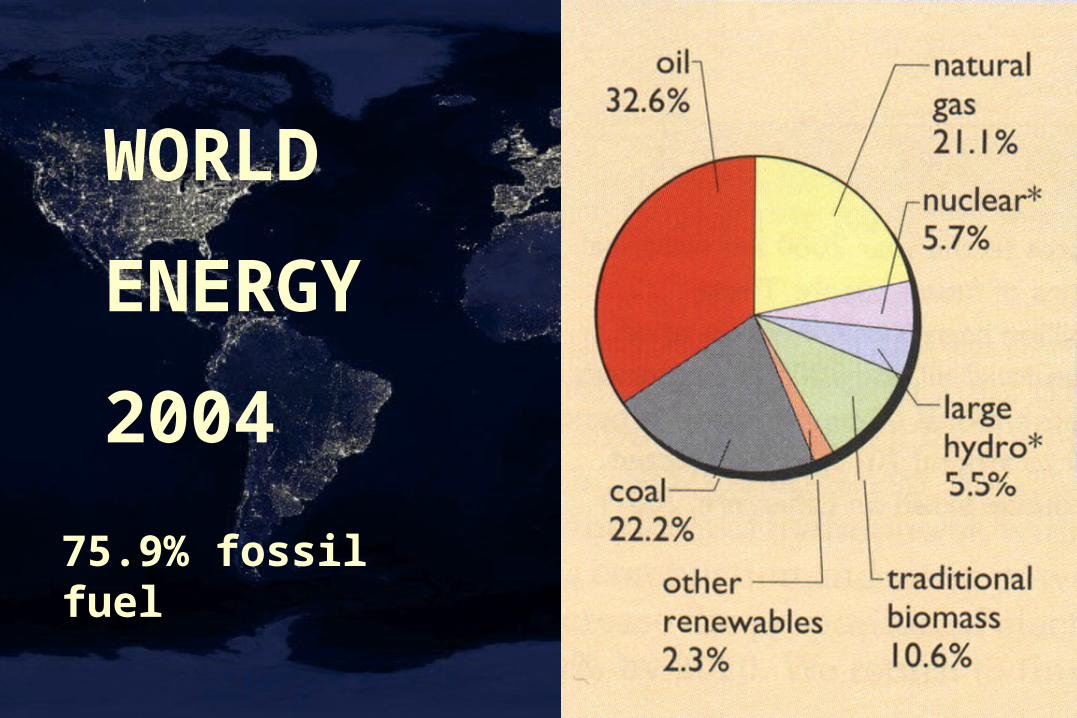
WORLD
ENERGY
2004
75.9% fossil fuel
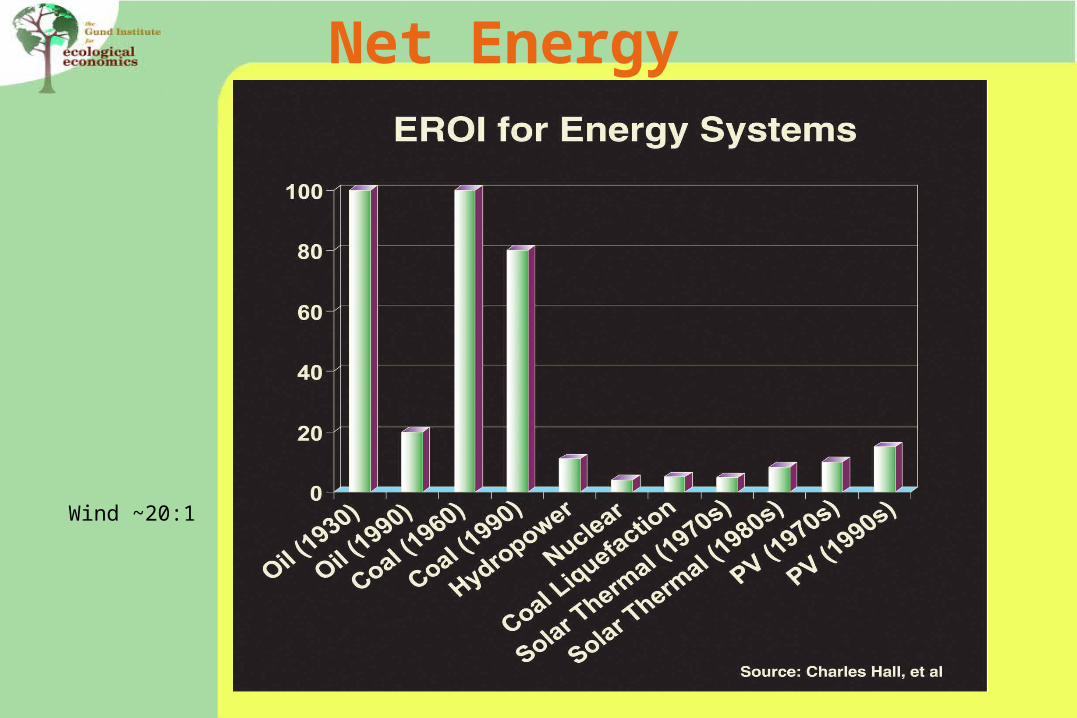
Net Energy
Wind ~20:1
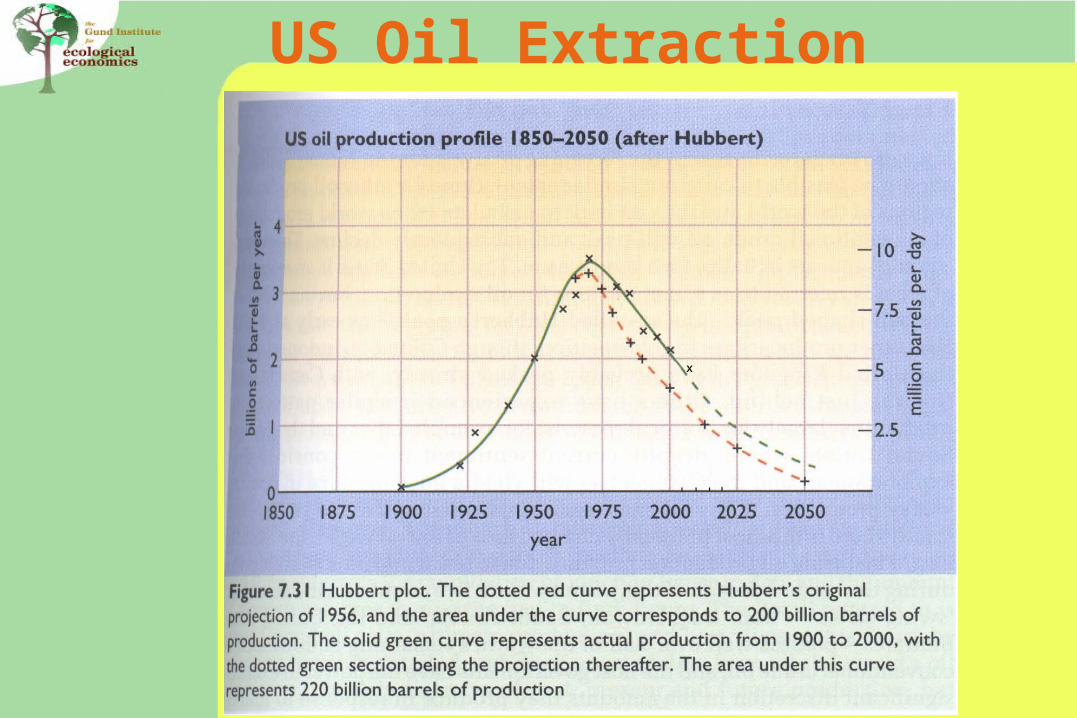
US Oil Extraction
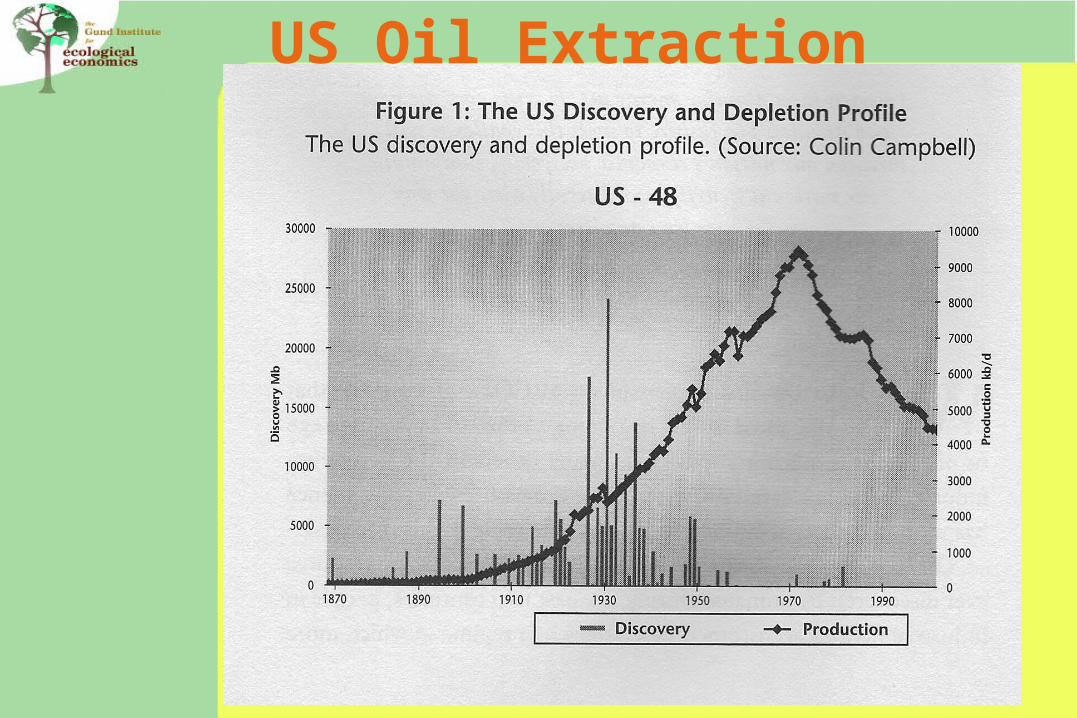
US Oil Extraction
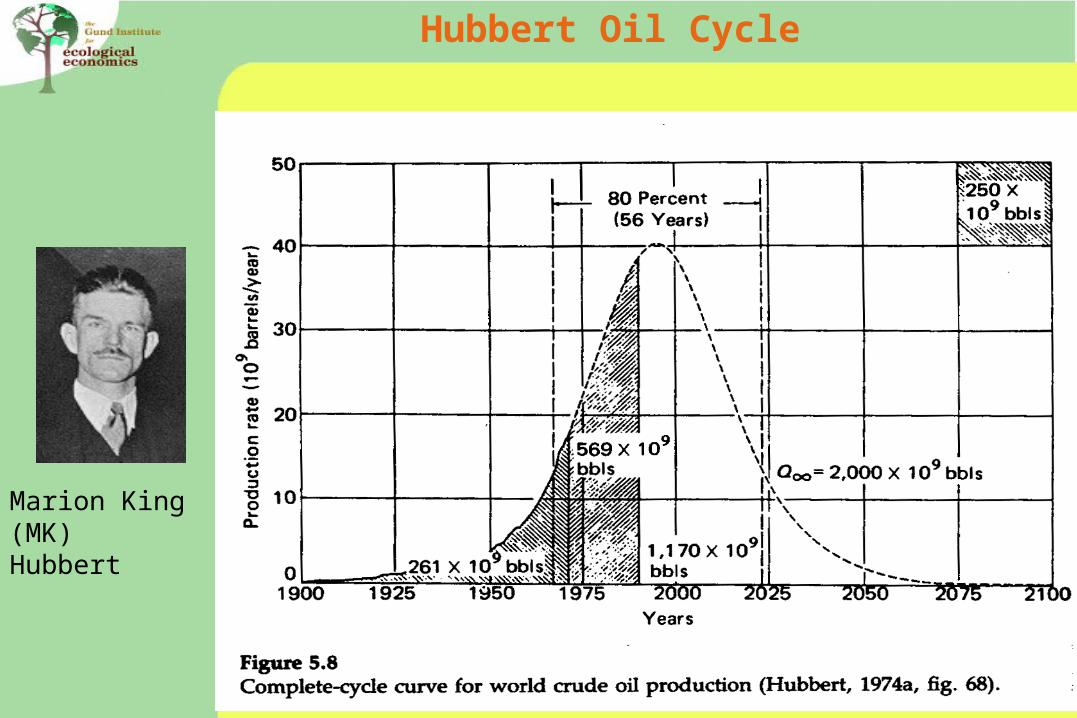
Hubbert Oil Cycle
Marion King (MK)Hubbert
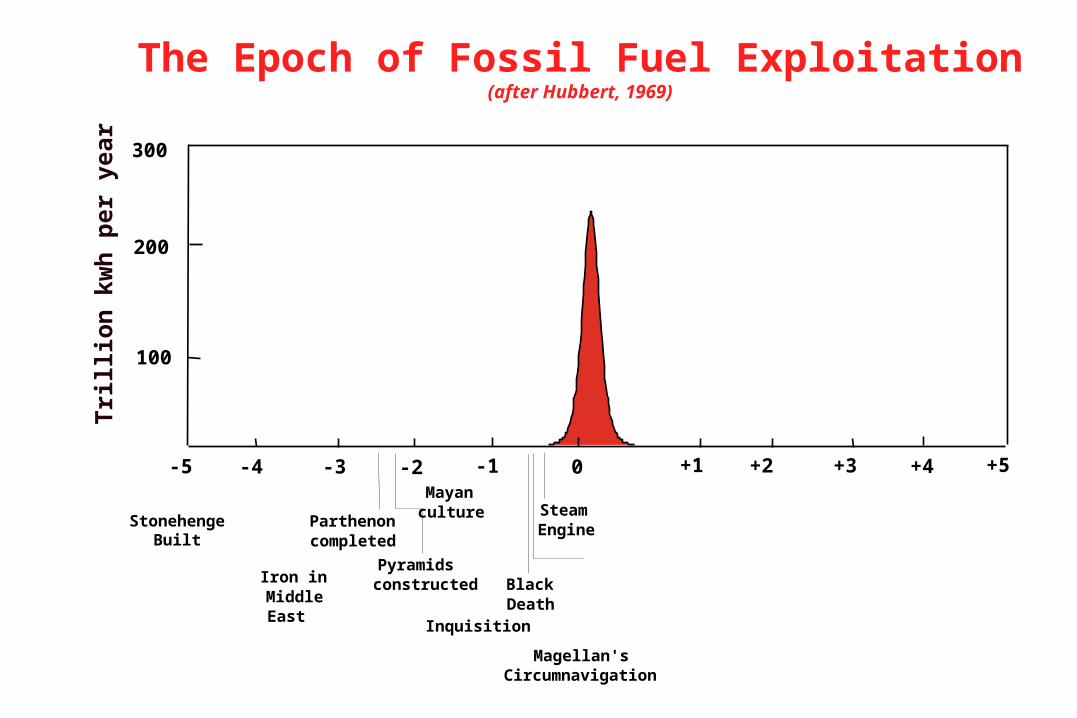
The Epoch of Fossil Fuel Exploitation(after Hubbert, 1969)
0-5 -4 -3 -2 -1 +1 +2 +3 +4 +5
Iron inMiddleEast
StonehengeBuilt
Parthenoncompleted
Pyramidsconstructed
Mayanculture
Inquisition
BlackDeath
Magellan'sCircumnavigation
Steam Engine
100
200
300
Tri
llio
n k
wh
per
yea
r
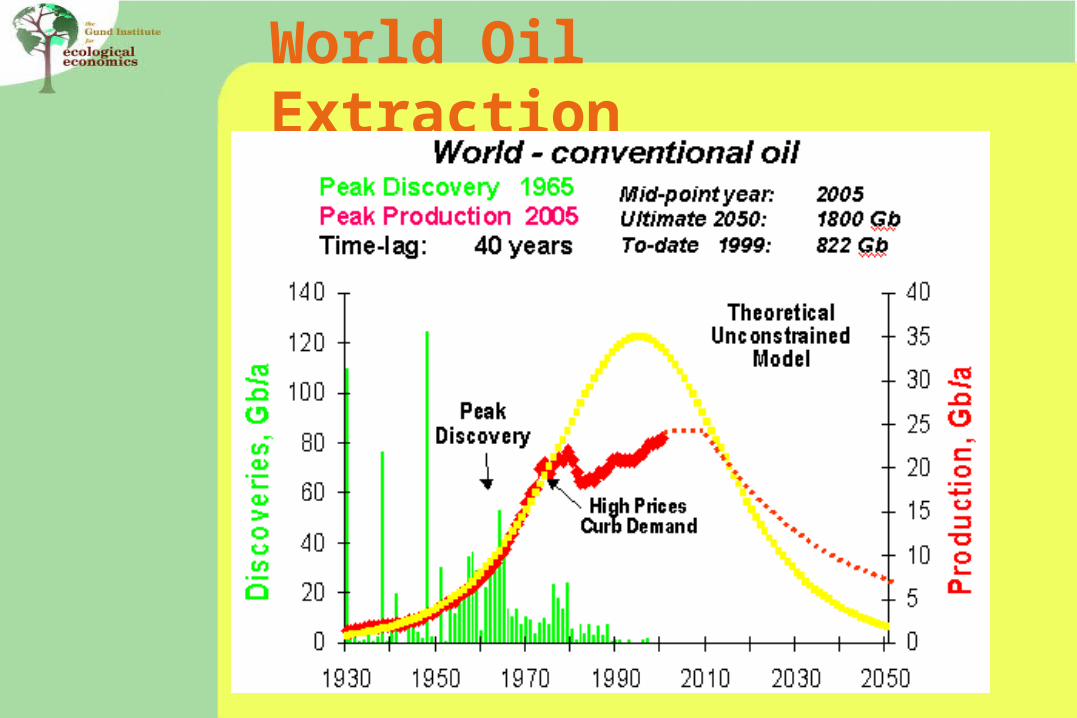
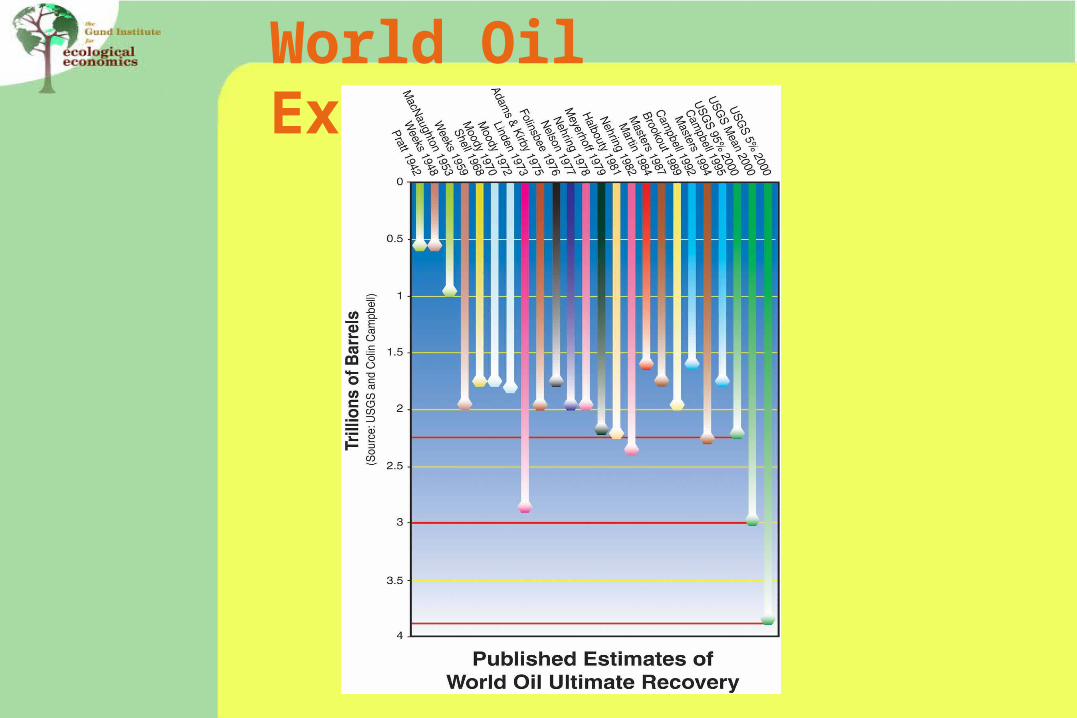
World Oil Extraction
World Oil Extraction
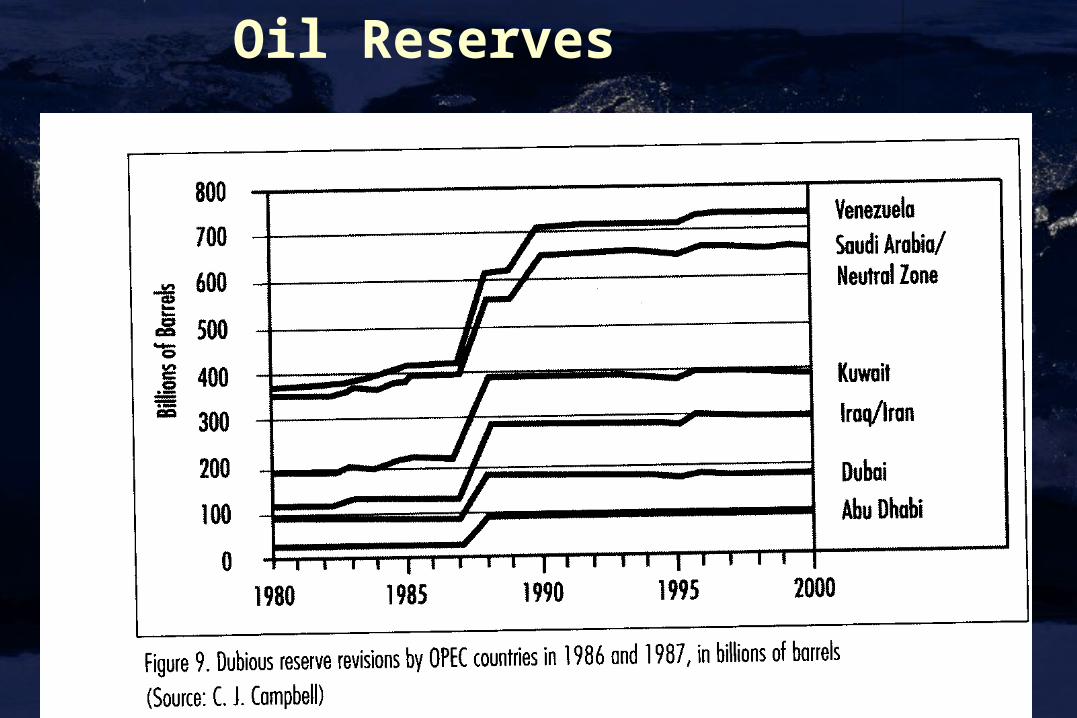
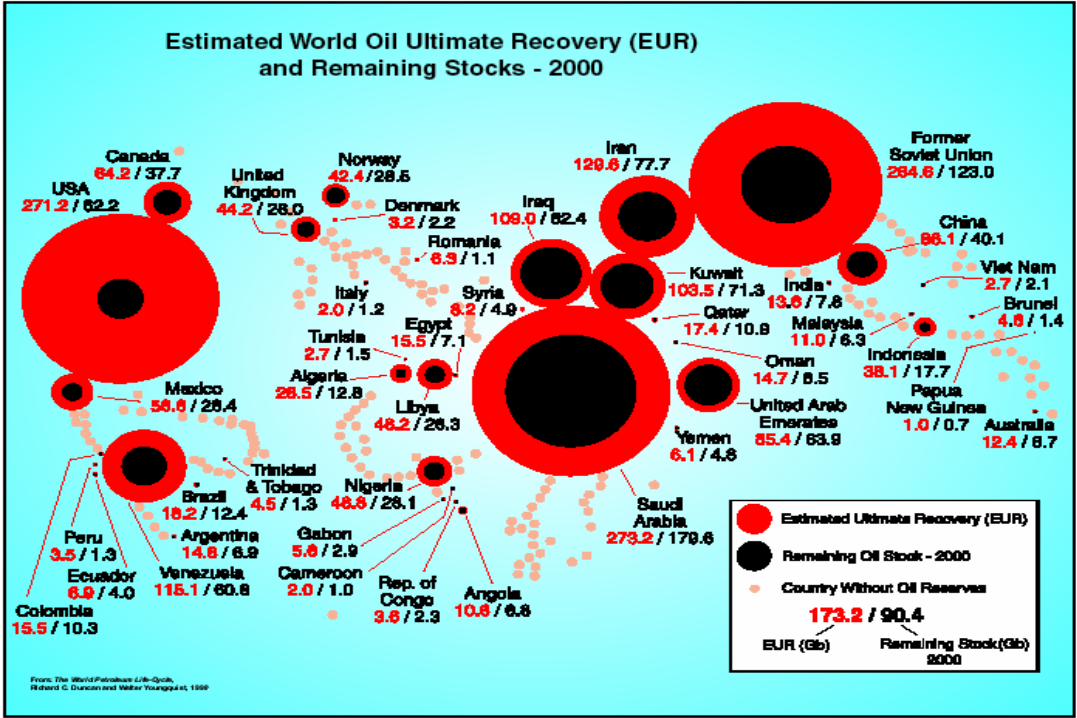
Oil Reserves
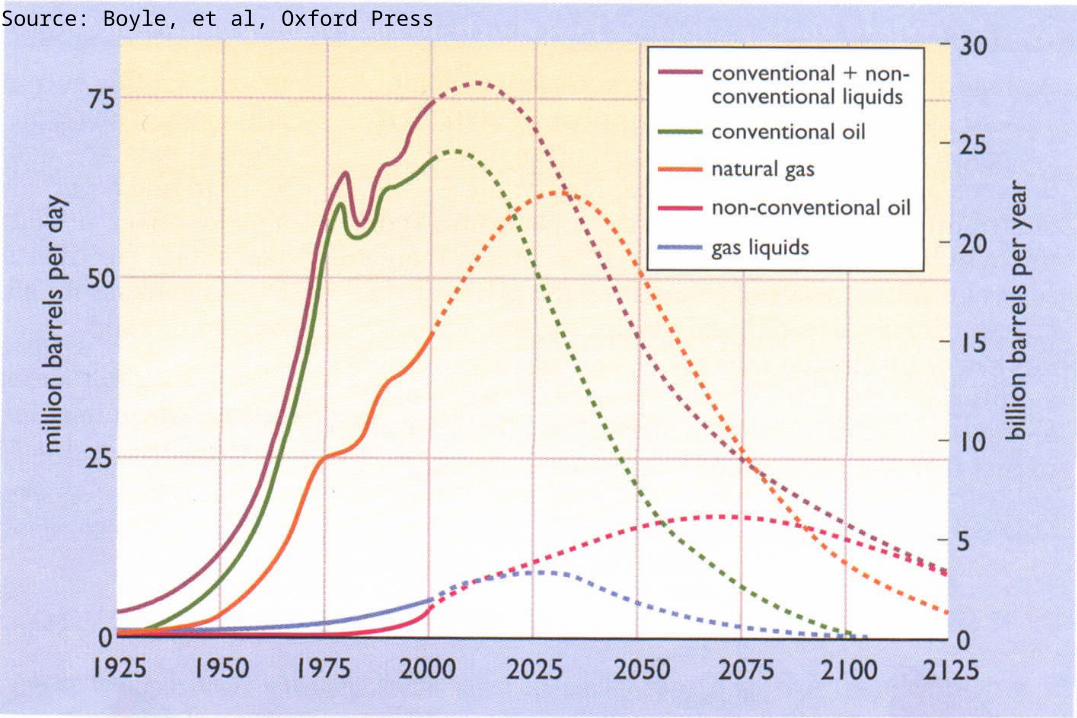
Source: Boyle, et al, Oxford Press
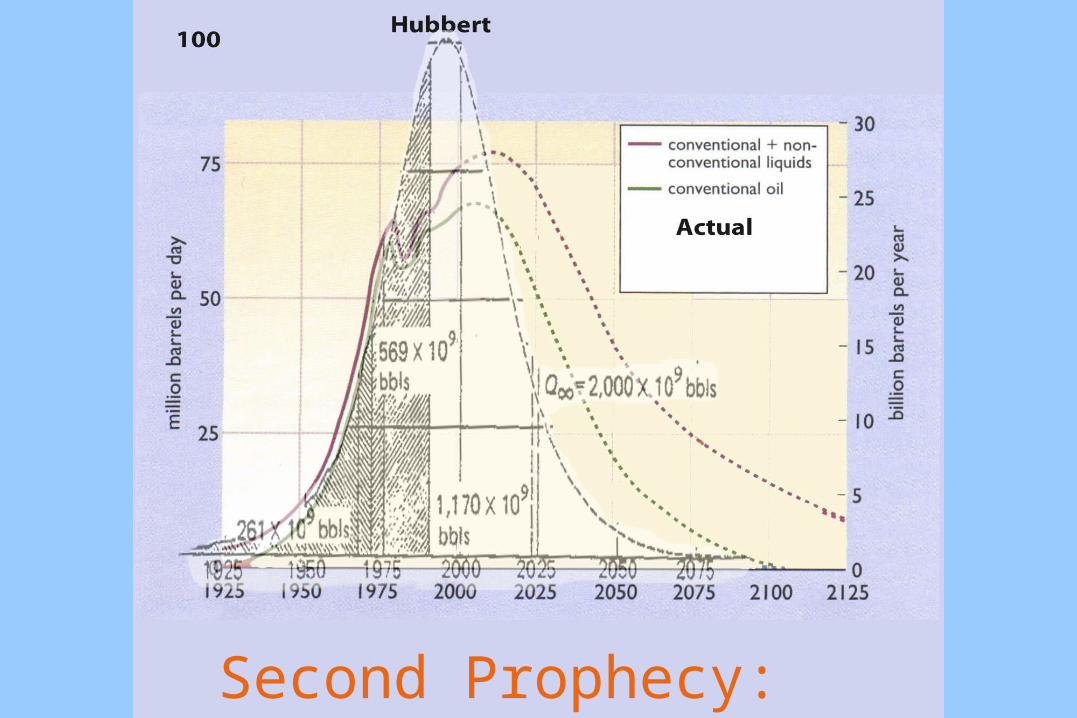
Second Prophecy: 1974
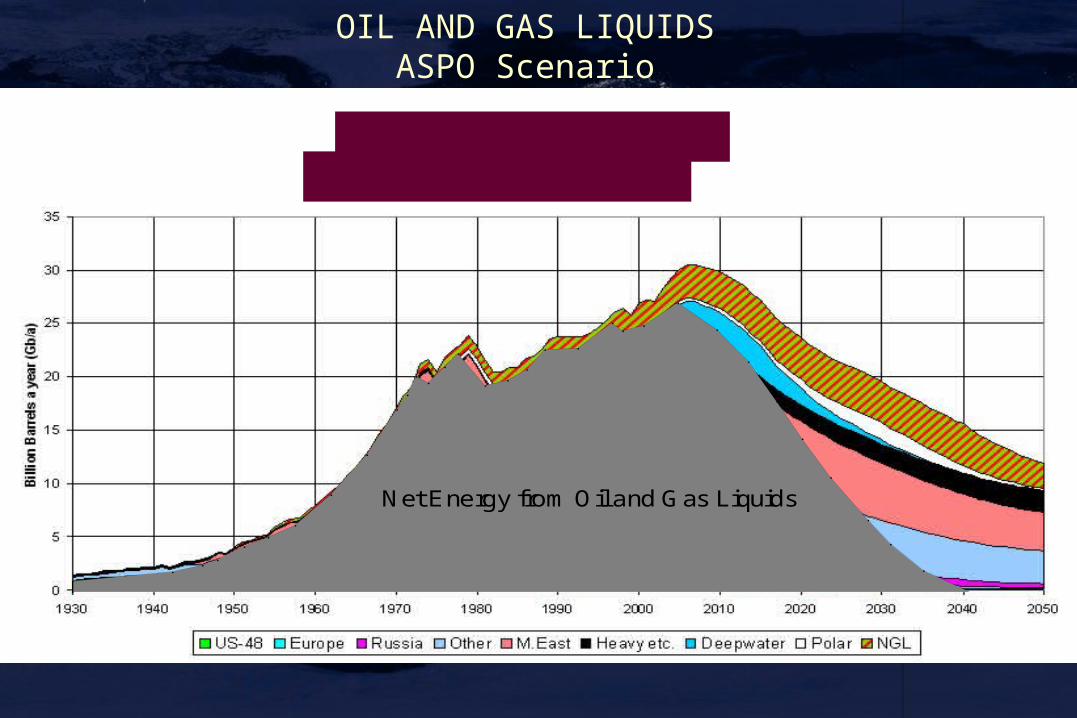
OIL AND GAS LIQUIDS ASPO Scenario
Net Energy from Oil and Gas Liquids
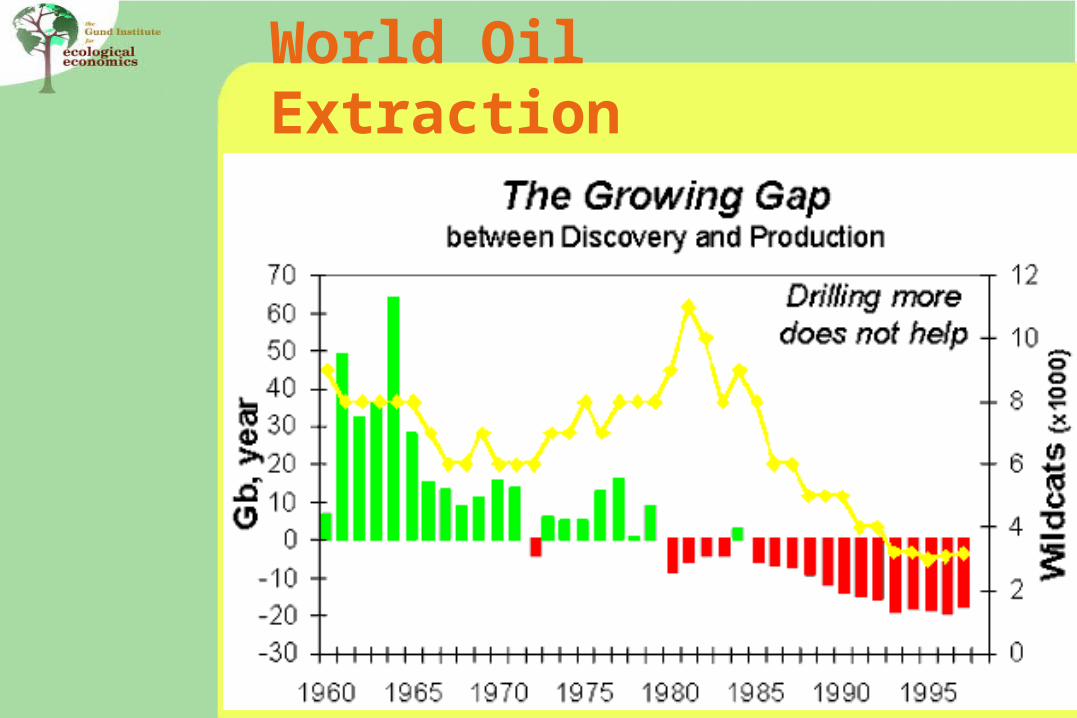
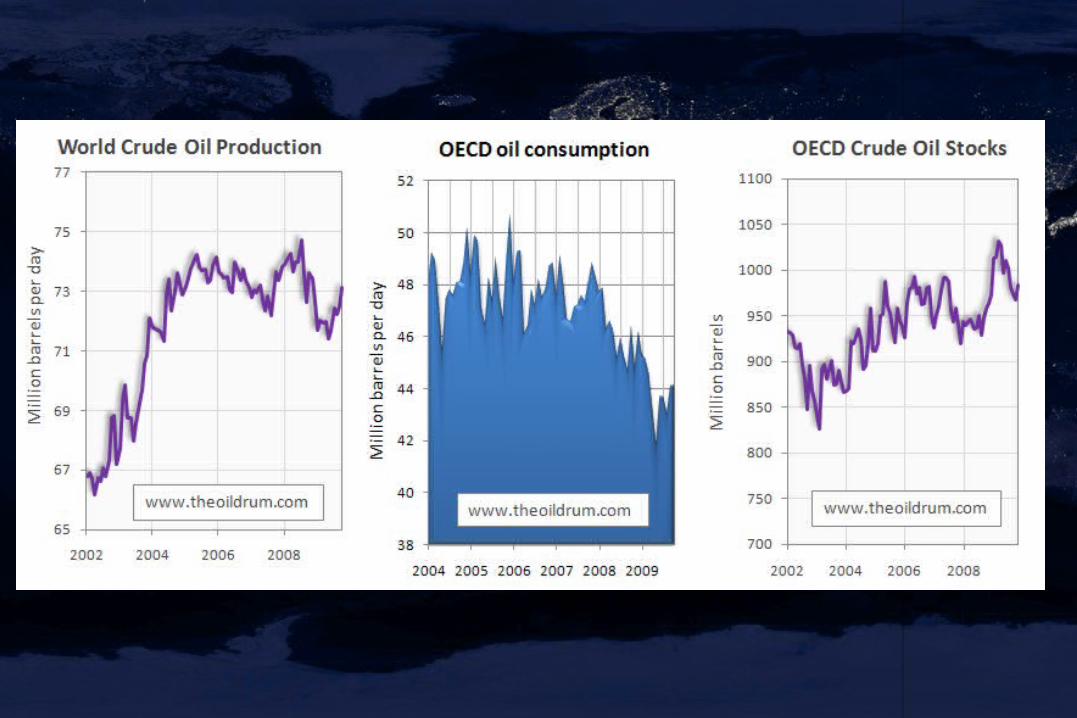
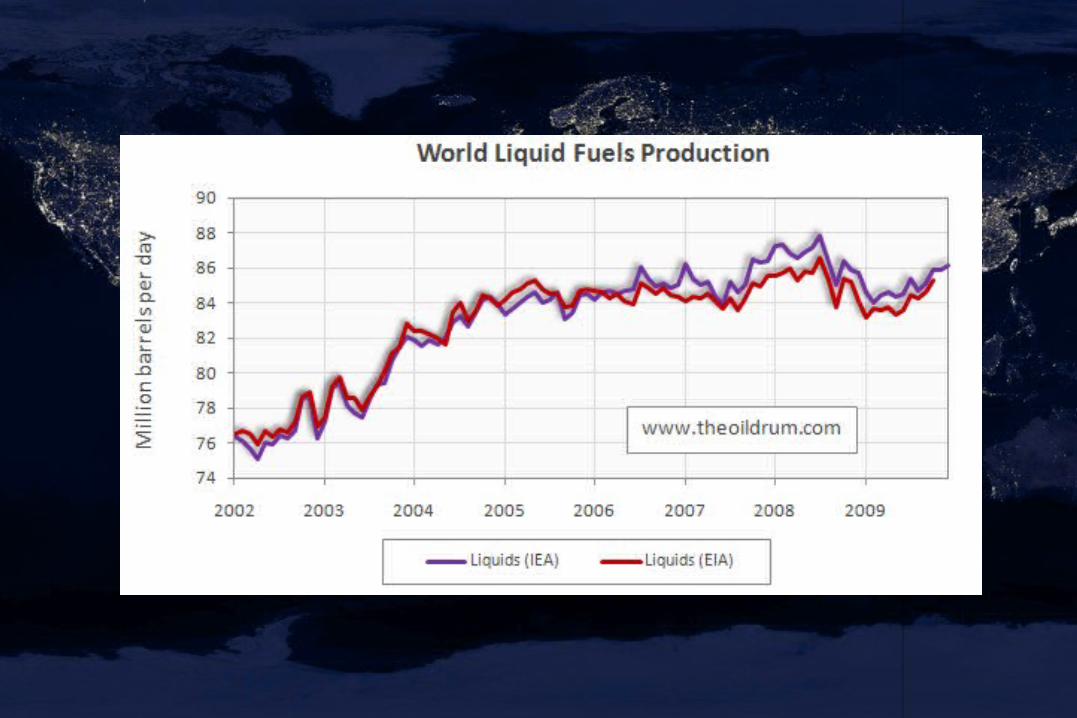
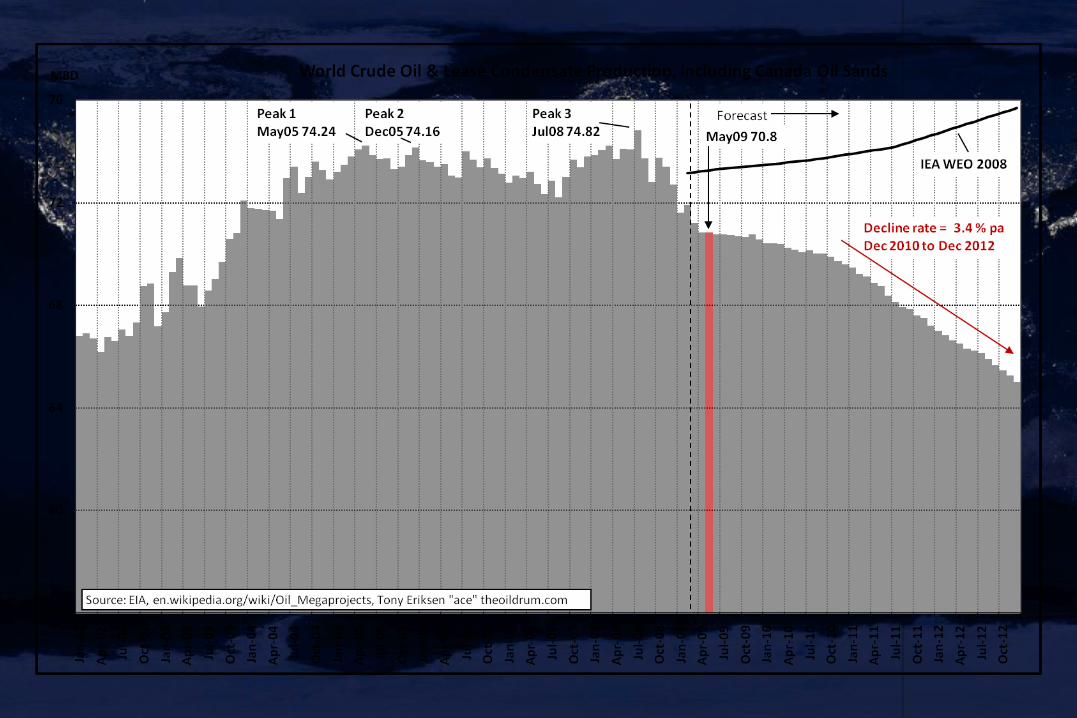
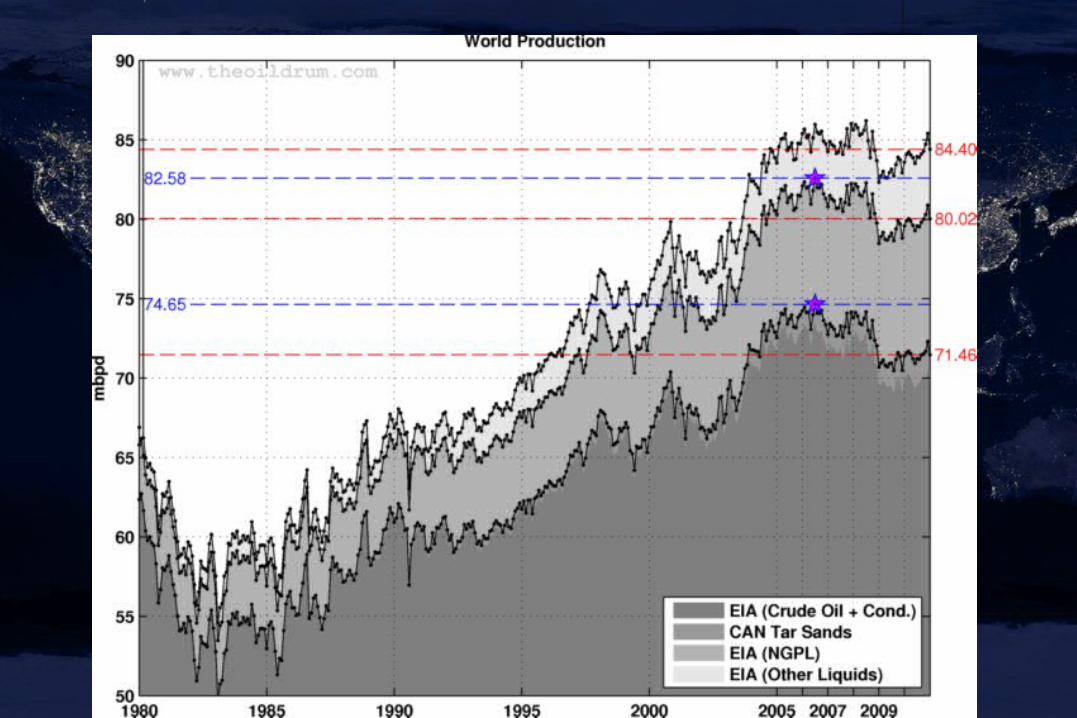
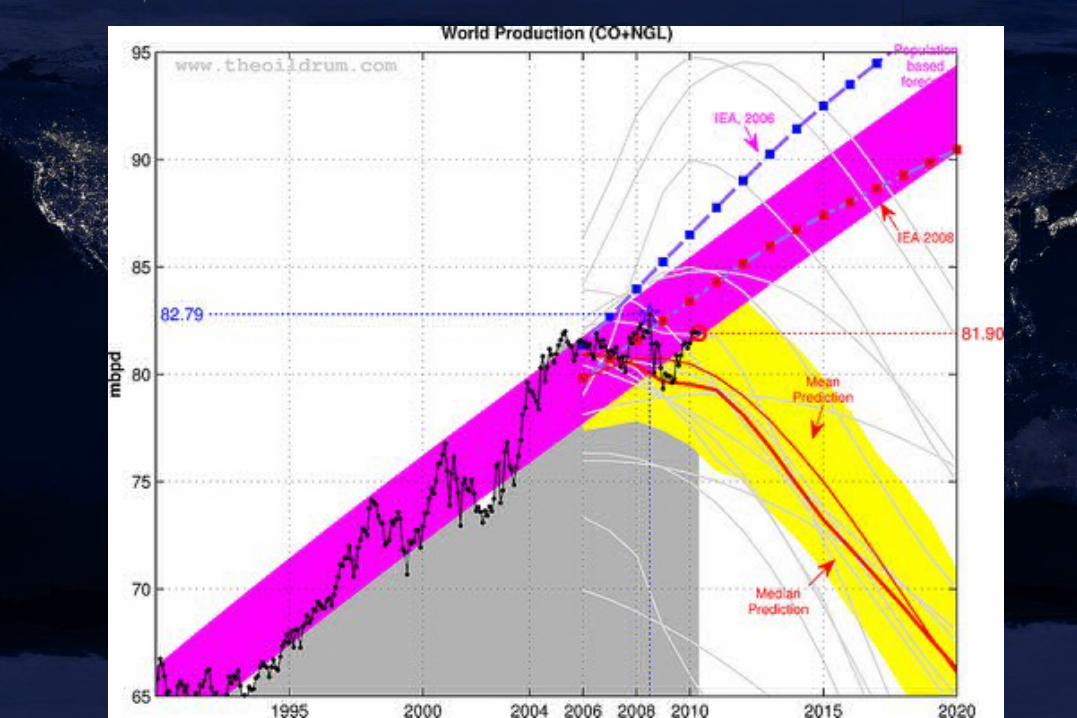
World Oil Extraction
World Oil Extraction
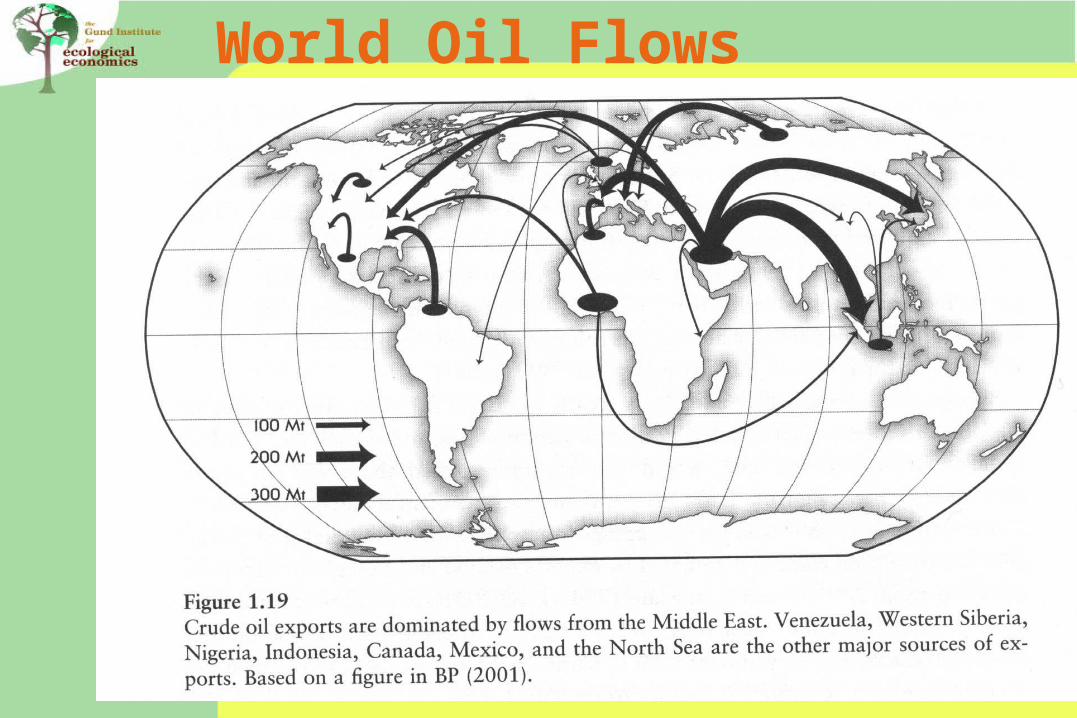
World Oil Flows
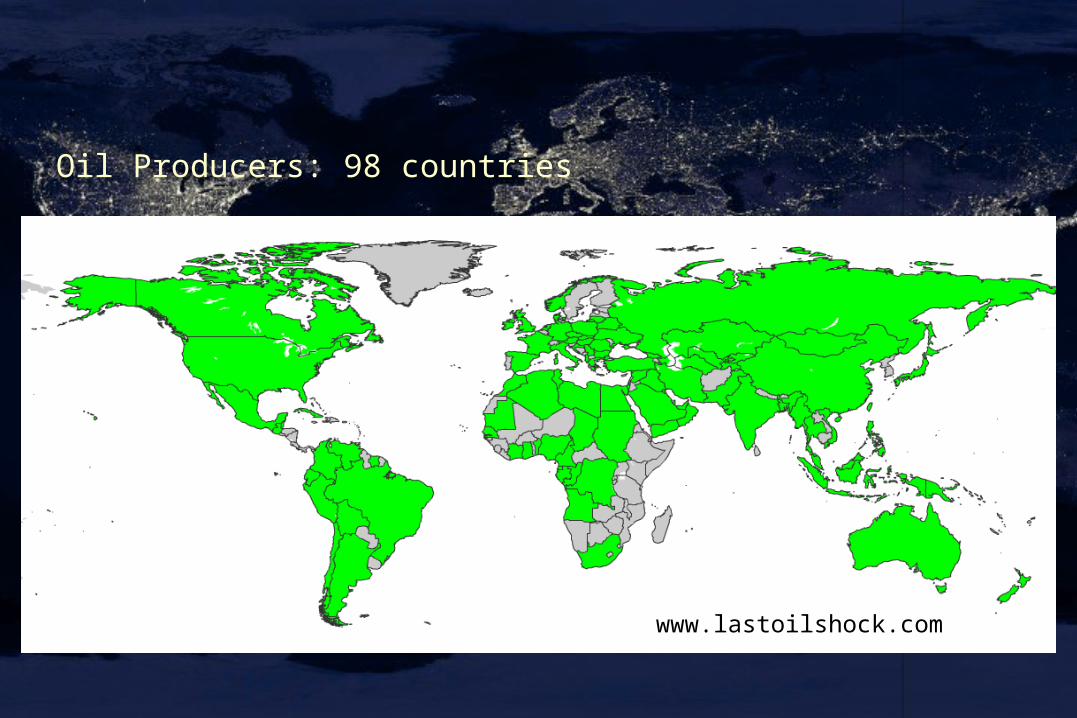
Oil Producers: 98 countries
www.lastoilshock.com
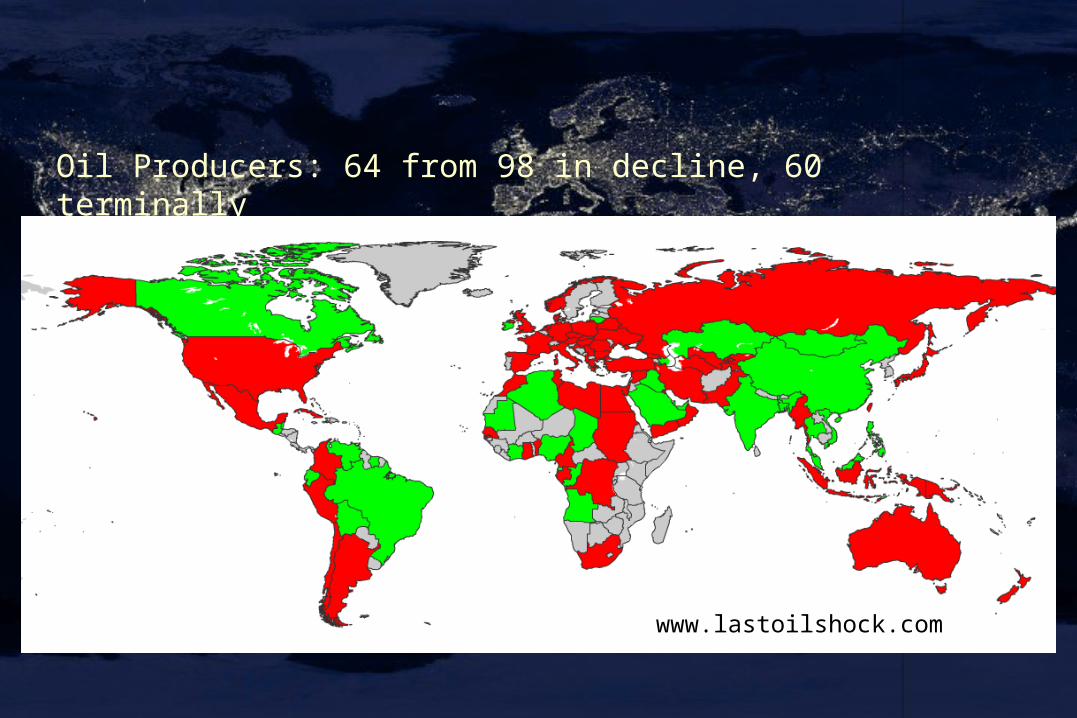
Oil Producers: 64 from 98 in decline, 60 terminally
www.lastoilshock.com
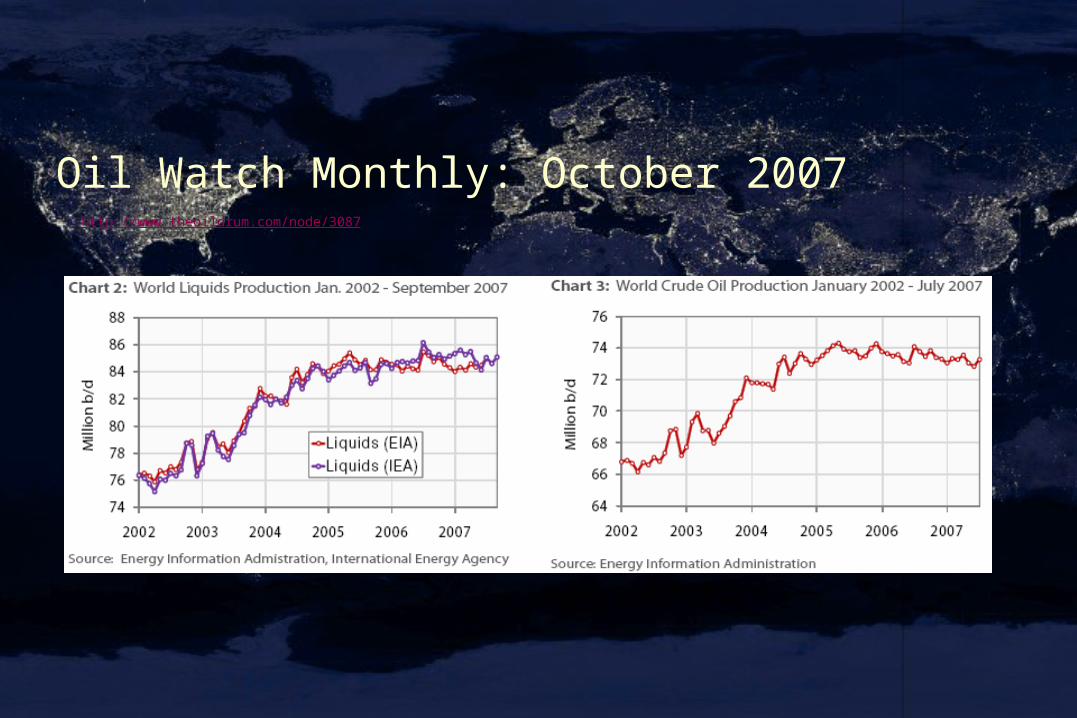
http://www.theoildrum.com/node/3087
Oil Watch Monthly: October 2007
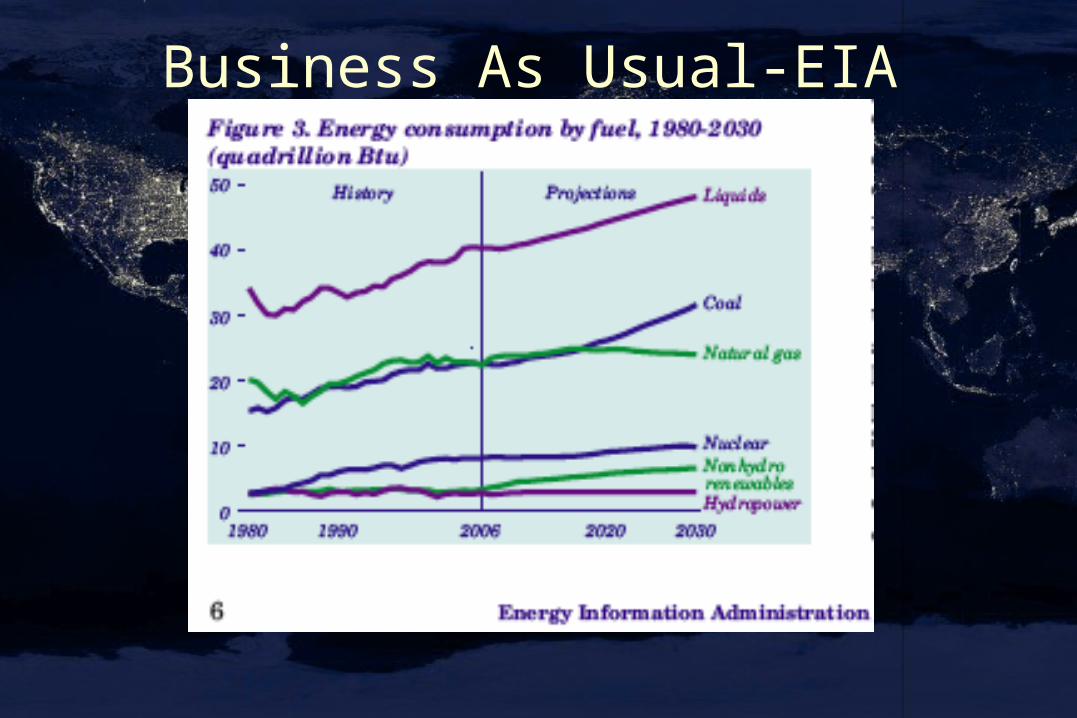
Business As Usual-EIA
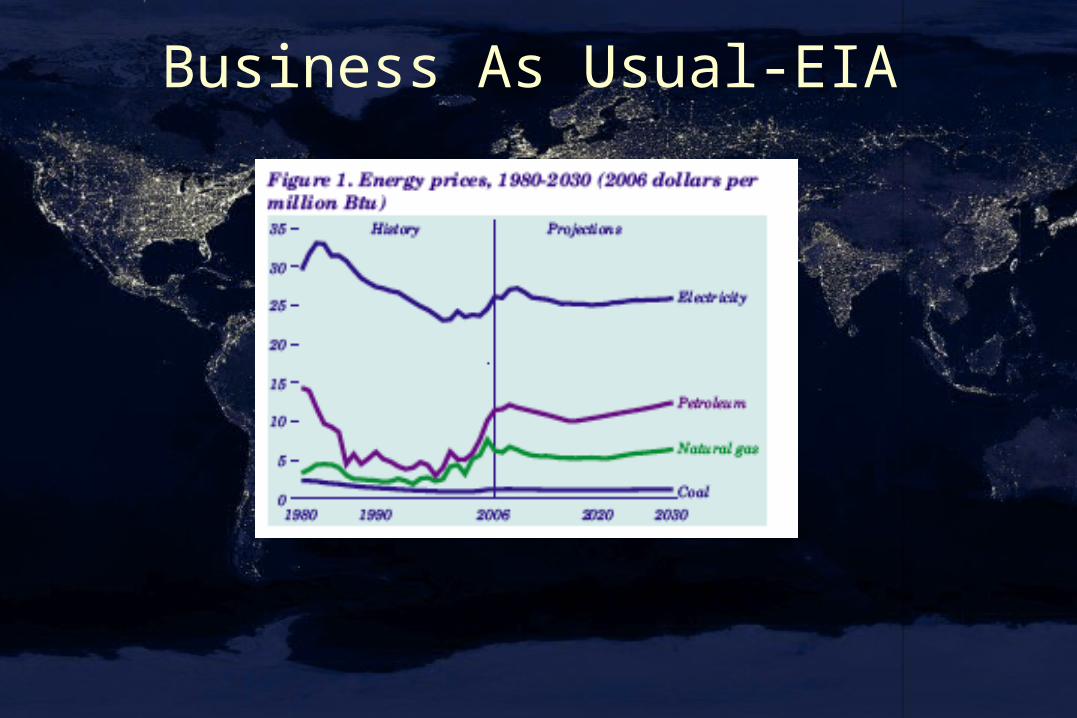
Business As Usual-EIA
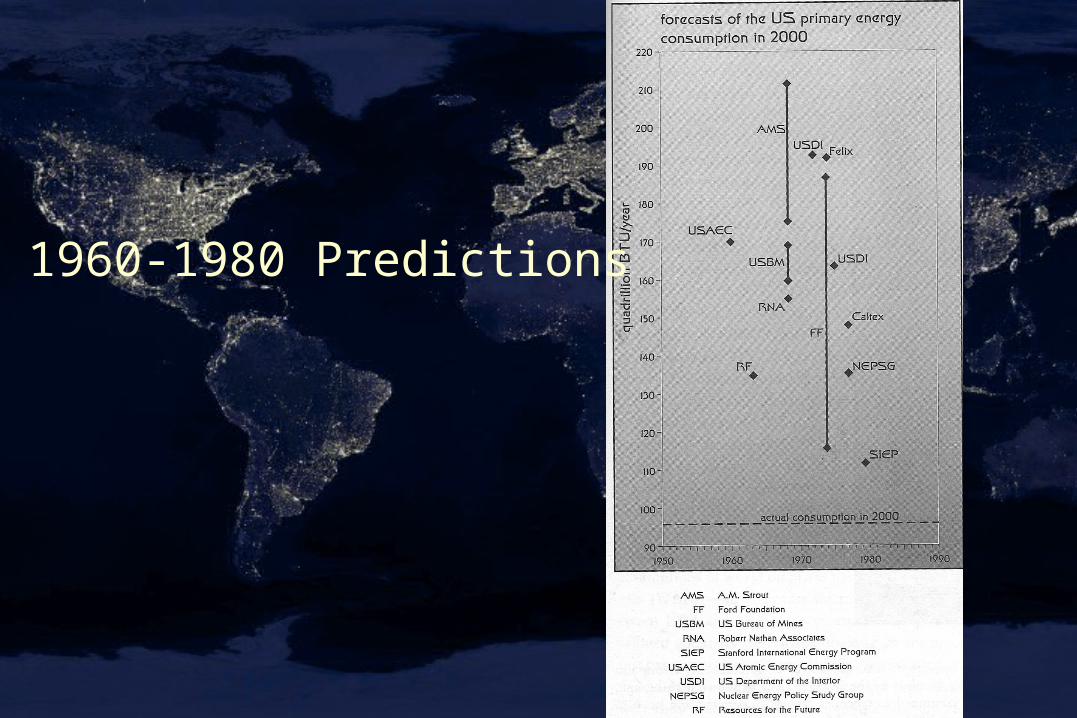
1960-1980 Predictions
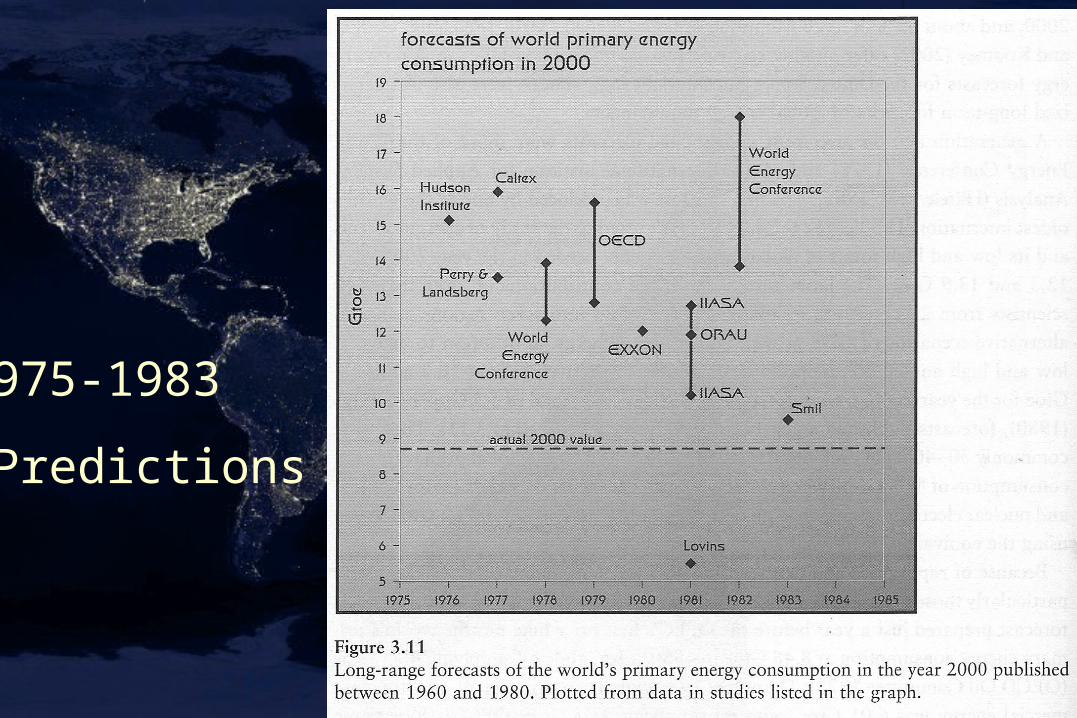
1975-1983
Predictions
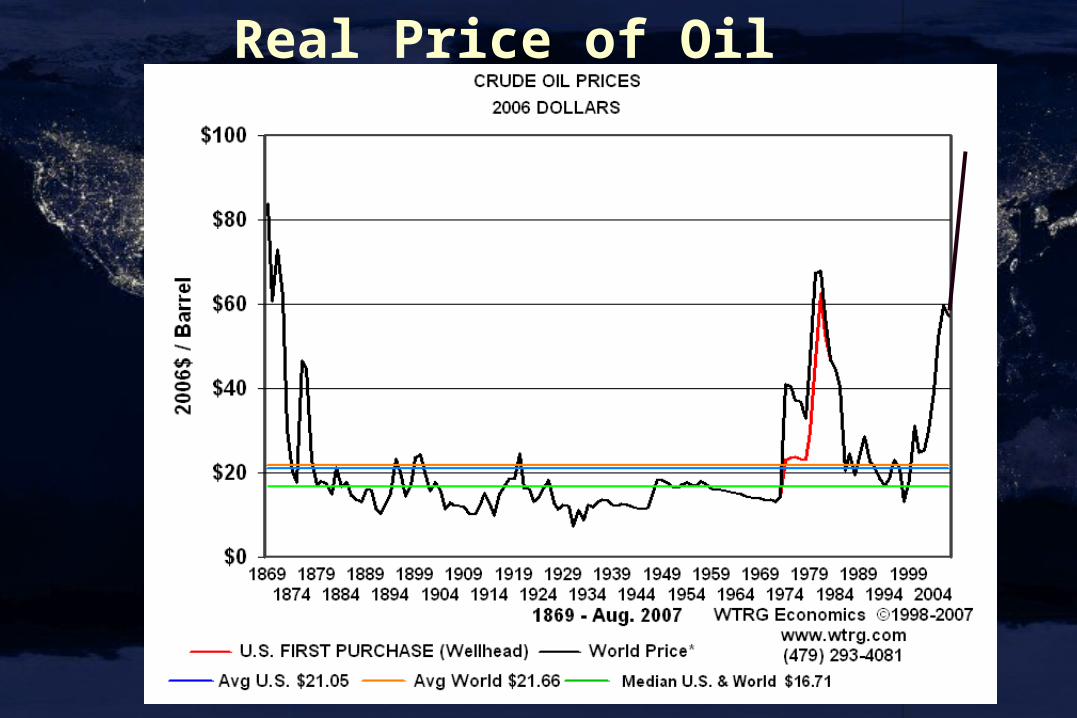
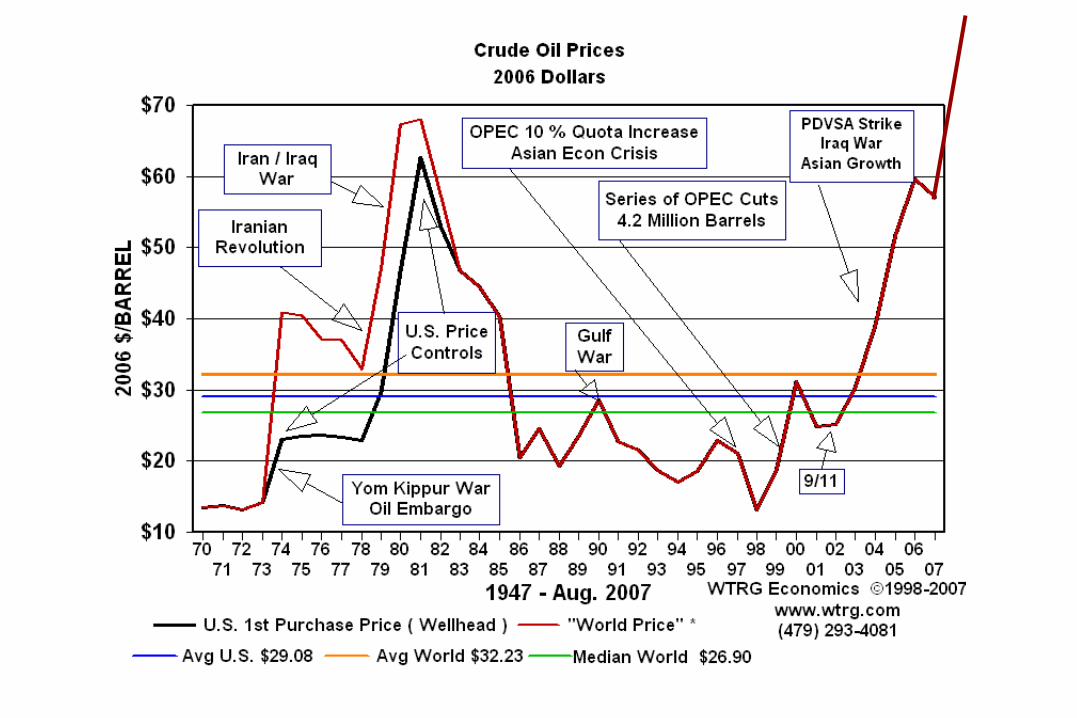
Real Price of Oil 1869-2007
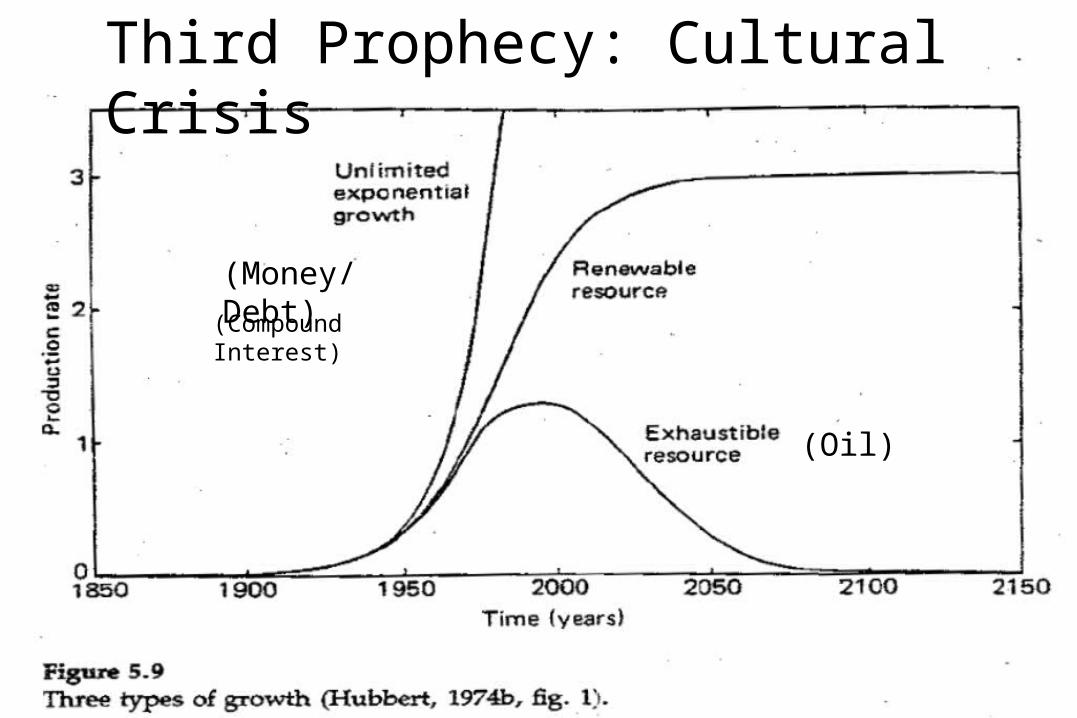
(Money/Debt)
(Oil)
Third Prophecy: Cultural Crisis
(Compound Interest)
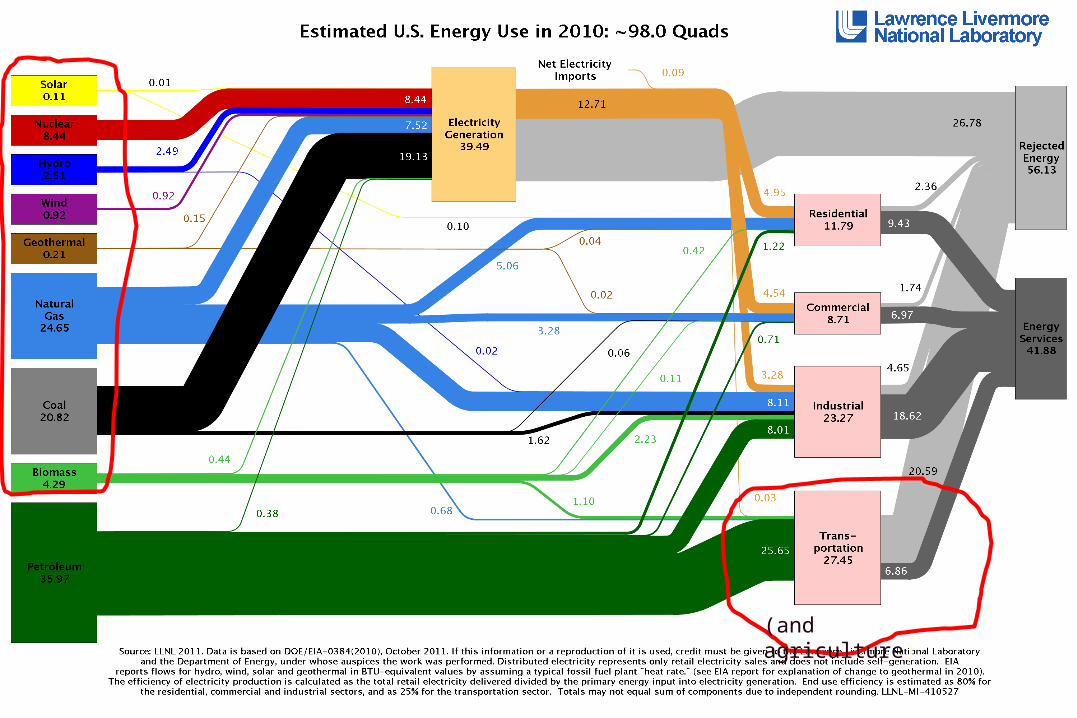
US Energy Use
(and agriculture)
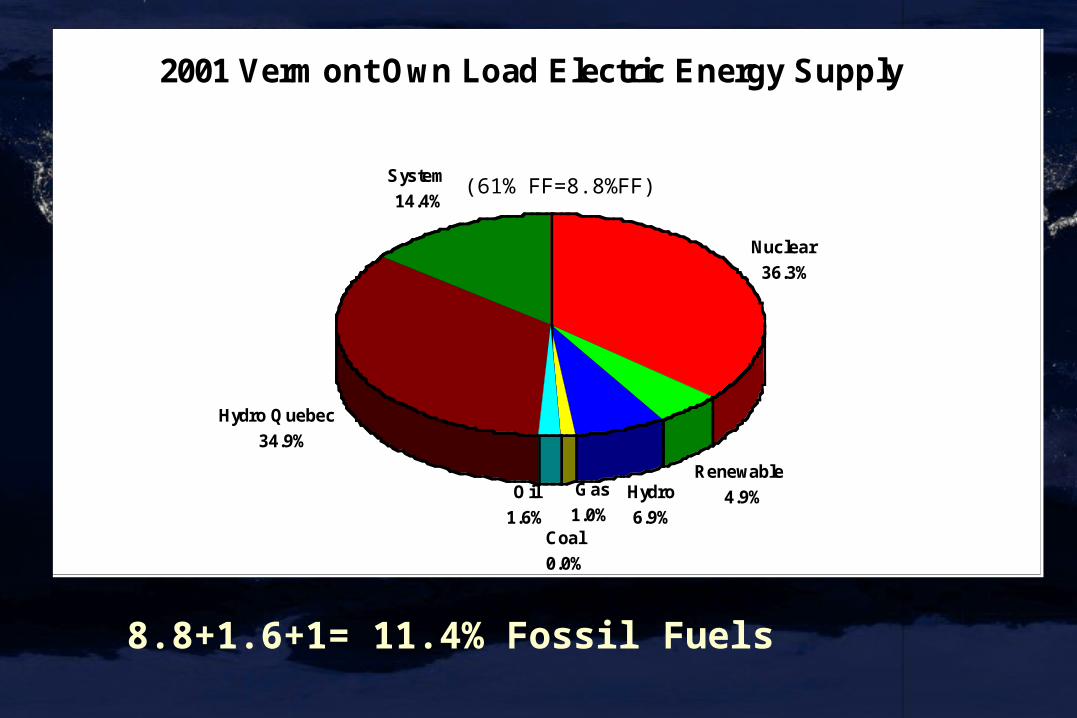
2001 Vermont Own Load Electric Energy Supply
Nuclear
36.3%
Renewable
4.9%Hydro
6.9%
Hydro Quebec
34.9%
System
14.4%
Oil
1.6%
Gas
1.0%Coal
0.0%
(61% FF=8.8%FF)
8.8+1.6+1= 11.4% Fossil Fuels
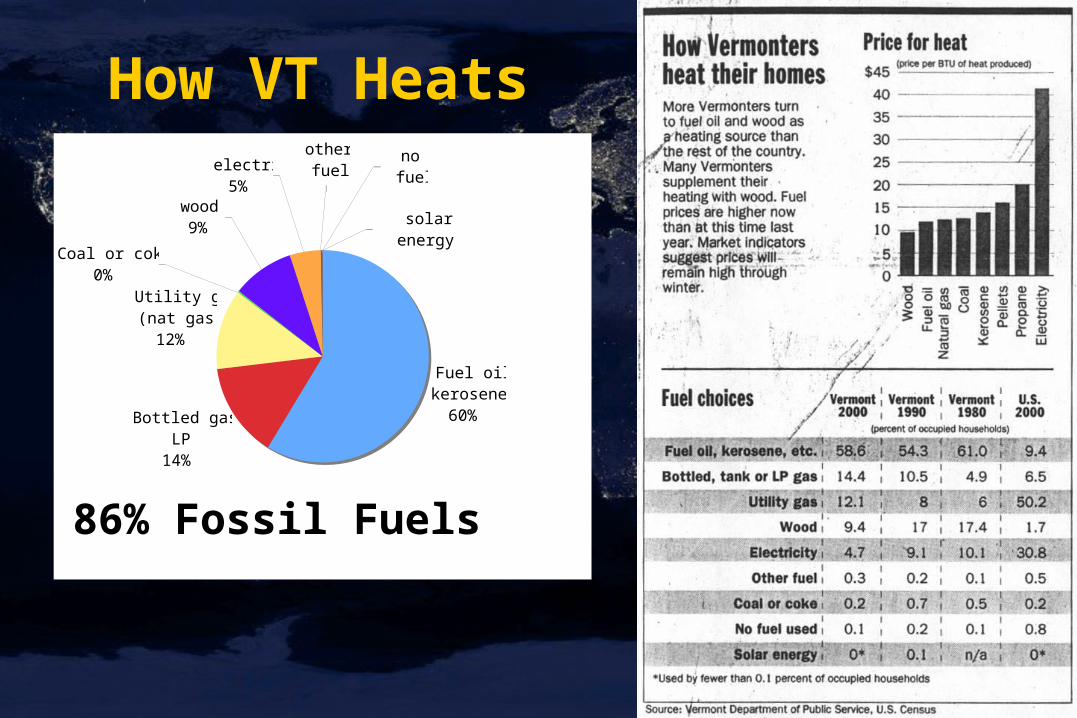
How VT Heats
86% Fossil Fuels
Fuel oil, kerosene
60%Bottled gas, LP
14%
Utility gas (nat gas)
12%
other fuel
wood9%
Coal or coke0%
electric5%
solar energy
no fuel
86% Fossil Fuels
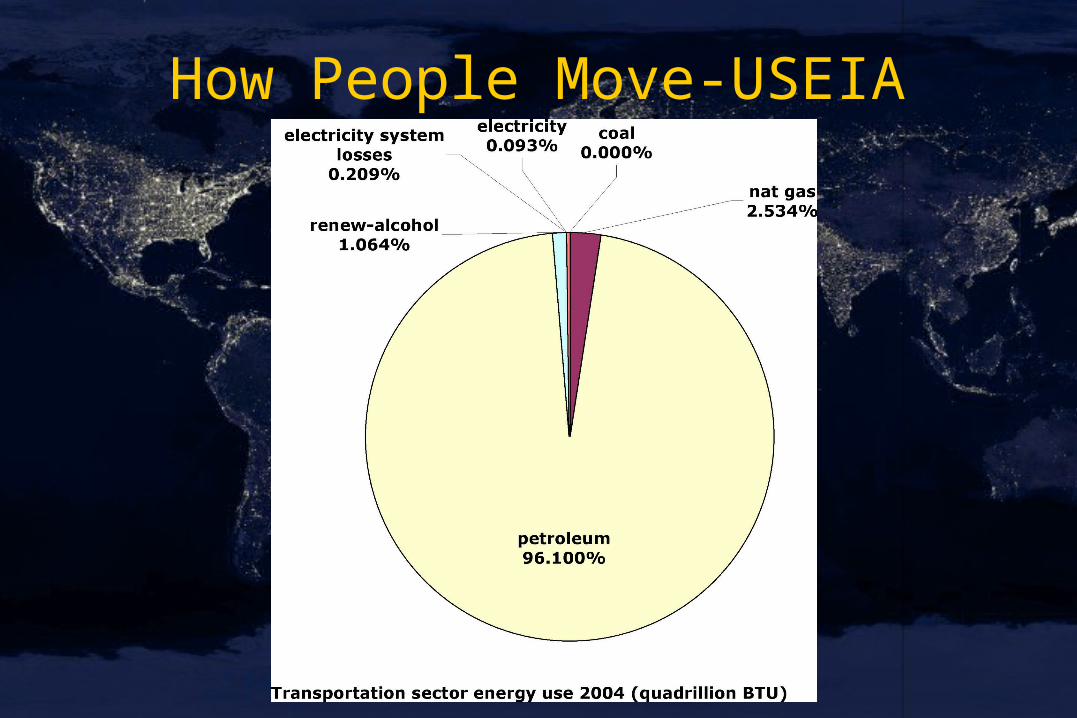
How People Move-USEIA
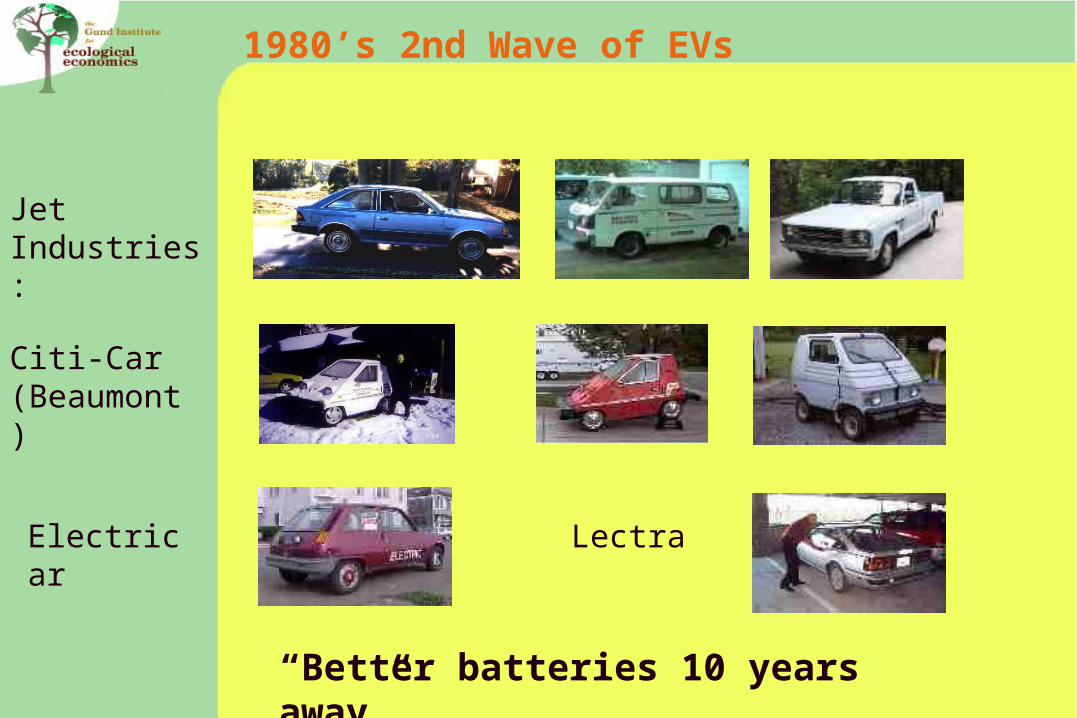
Jet Industries:
Citi-Car(Beaumont)
Electricar Lectra
1980’s 2nd Wave of EVs
“Better batteries 10 years away”
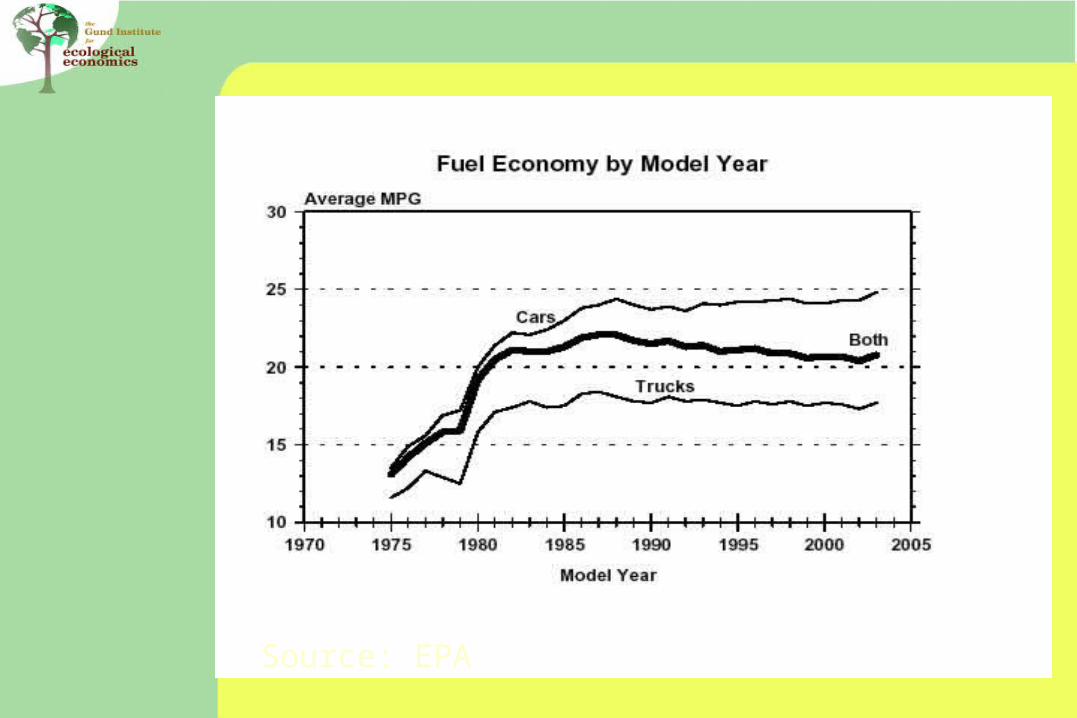
Source: EPA
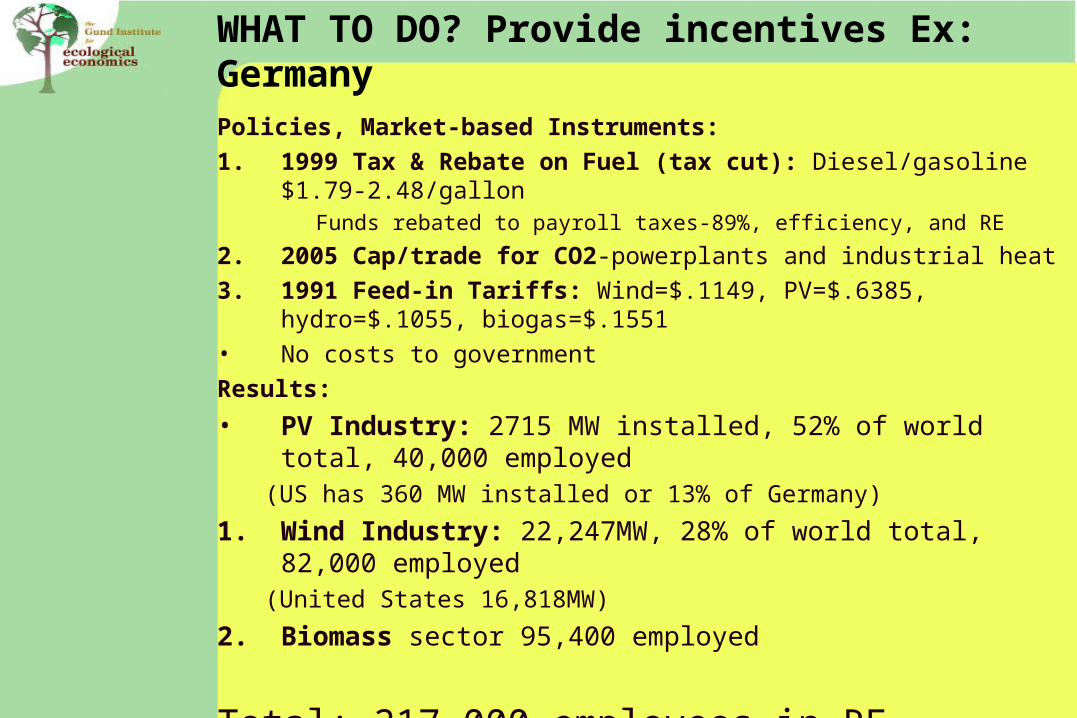
WHAT TO DO? Provide incentives Ex: Germany
Policies, Market-based Instruments:
1. 1999 Tax & Rebate on Fuel (tax cut): Diesel/gasoline $1.79-2.48/gallon Funds rebated to payroll taxes-89%, efficiency, and RE
2. 2005 Cap/trade for CO2-powerplants and industrial heat
3. 1991 Feed-in Tariffs: Wind=$.1149, PV=$.6385, hydro=$.1055, biogas=$.1551
• No costs to government
Results:
• PV Industry: 2715 MW installed, 52% of world total, 40,000 employed(US has 360 MW installed or 13% of Germany)
1. Wind Industry: 22,247MW, 28% of world total, 82,000 employed (United States 16,818MW)
2. Biomass sector 95,400 employed
Total: 217,000 employees in RE
~107,000 FF & nuclear

WHAT TO DO? Reactive or Pro-active?
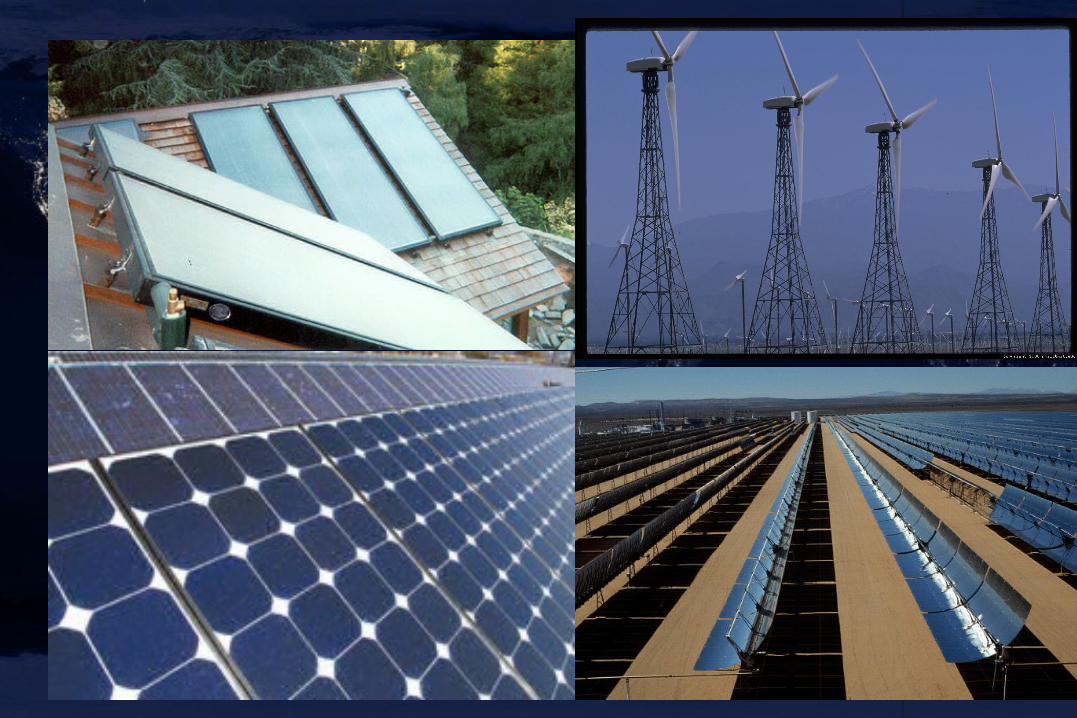
WHAT DO WE HAVE TO WORK WITH?•Trees•Farms•Cows•Land•Wind•Sun•Big and Small Hydro•Smart People•Indigenous Energy Industry•Entrepreneurs
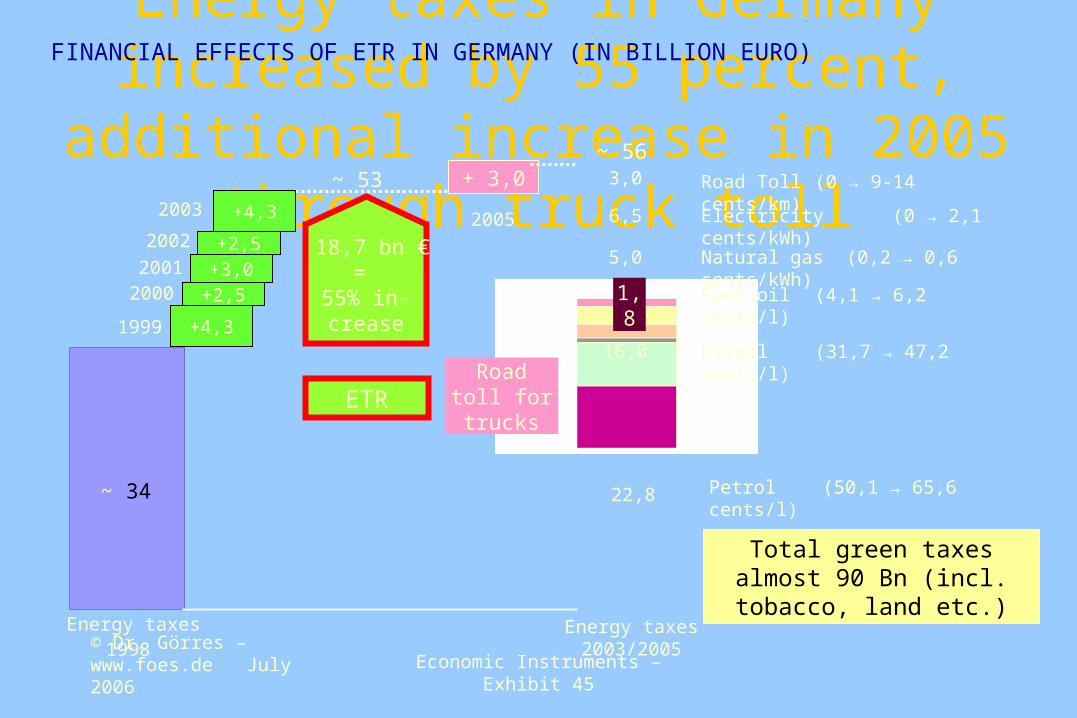
© Dr. Görres – www.foes.de July 2006 Economic Instruments – Exhibit 45
Energy taxes in Germany increased by 55 percent, additional increase in 2005
through truck toll
FINANCIAL EFFECTS OF ETR IN GERMANY (IN BILLION EURO)
Energy taxes 2003/2005
Energy taxes
18,7 bn €=
55% in-crease
Electricity (0 → 2,1 cents/kWh)
1998
6,5
5,0
1,8
16,0
22,8~ 34
2005
Road toll for trucks
+ 3,0
Fuel oil (4,1 → 6,2 cents/l)
Diesel (31,7 → 47,2 cents/l)
Petrol (50,1 → 65,6 cents/l)
Natural gas (0,2 → 0,6 cents/kWh)
ETR
~ 53 3,0 Road Toll (0 → 9-14 cents/km)
~ 56
Total green taxes almost 90 Bn (incl. tobacco, land etc.)
1999 +4,3
2000 +2,5
2001 +3,0
2002 +2,5
2003 +4,3
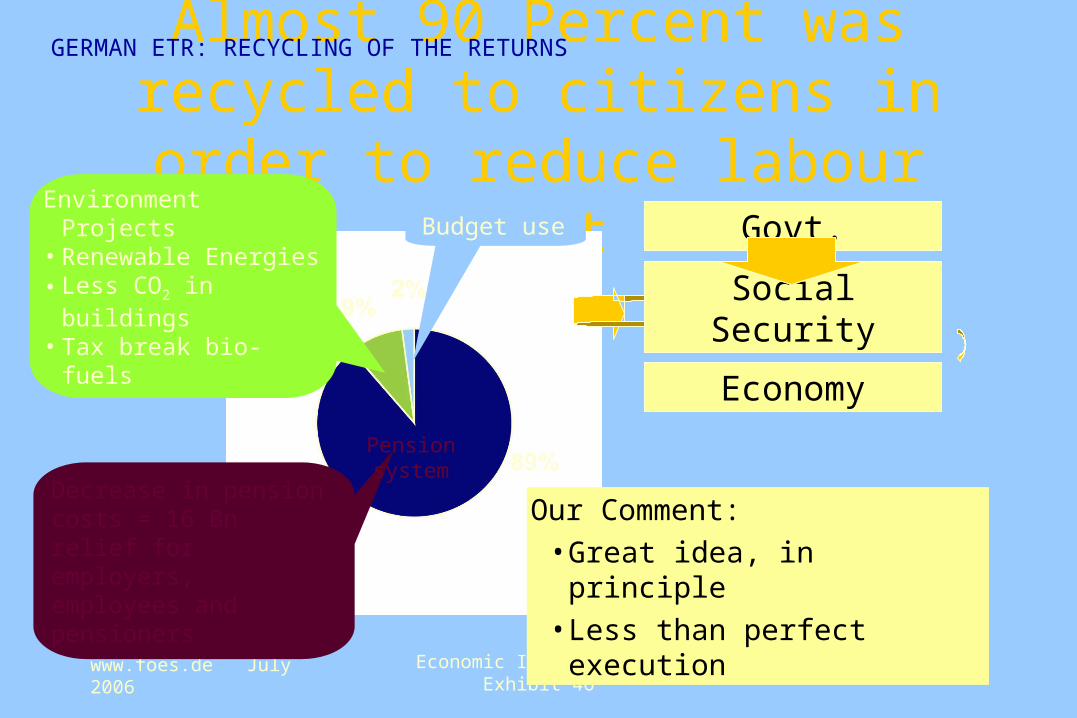
© Dr. Görres – www.foes.de July 2006 Economic Instruments – Exhibit 46
Almost 90 Percent was recycled to citizens in order to reduce labour cost
GERMAN ETR: RECYCLING OF THE RETURNS
Decrease in pension costs = 16 Bn relief for employers, employees and pensioners
Pension system
Environment Projects • Renewable Energies• Less CO2 in buildings• Tax break bio-fuels
Our Comment:
• Great idea, in principle
• Less than perfect execution
Economy
Govt.
Social Security
Budget use
© Dr. Görres – www.foes.de July 2006 Economic Instruments – Exhibit 47
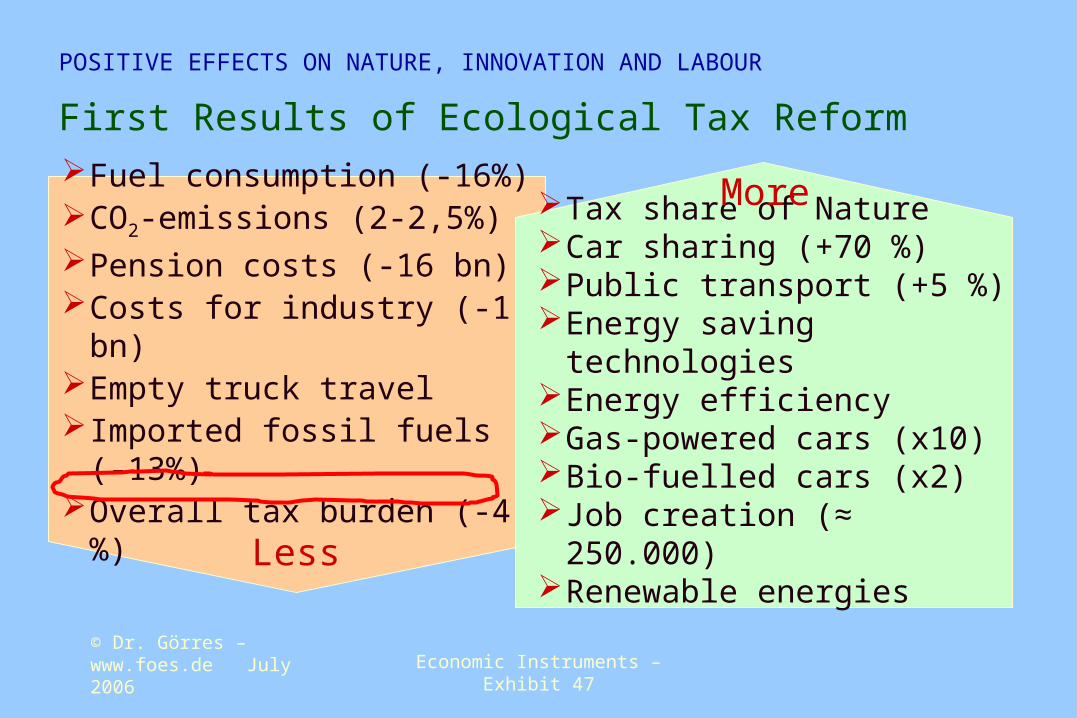
First Results of Ecological Tax Reform
POSITIVE EFFECTS ON NATURE, INNOVATION AND LABOUR
Fuel consumption (-16%)CO2-emissions (2-2,5%)Pension costs (-16 bn)Costs for industry (-1 bn)Empty truck travelImported fossil fuels (-13%)Overall tax burden (-4 %)
Tax share of NatureCar sharing (+70 %)Public transport (+5 %)Energy saving technologiesEnergy efficiencyGas-powered cars (x10)Bio-fuelled cars (x2)Job creation (≈ 250.000)Renewable energiesLess
More
© Dr. Görres – www.foes.de July 2006 Economic Instruments – Exhibit 48
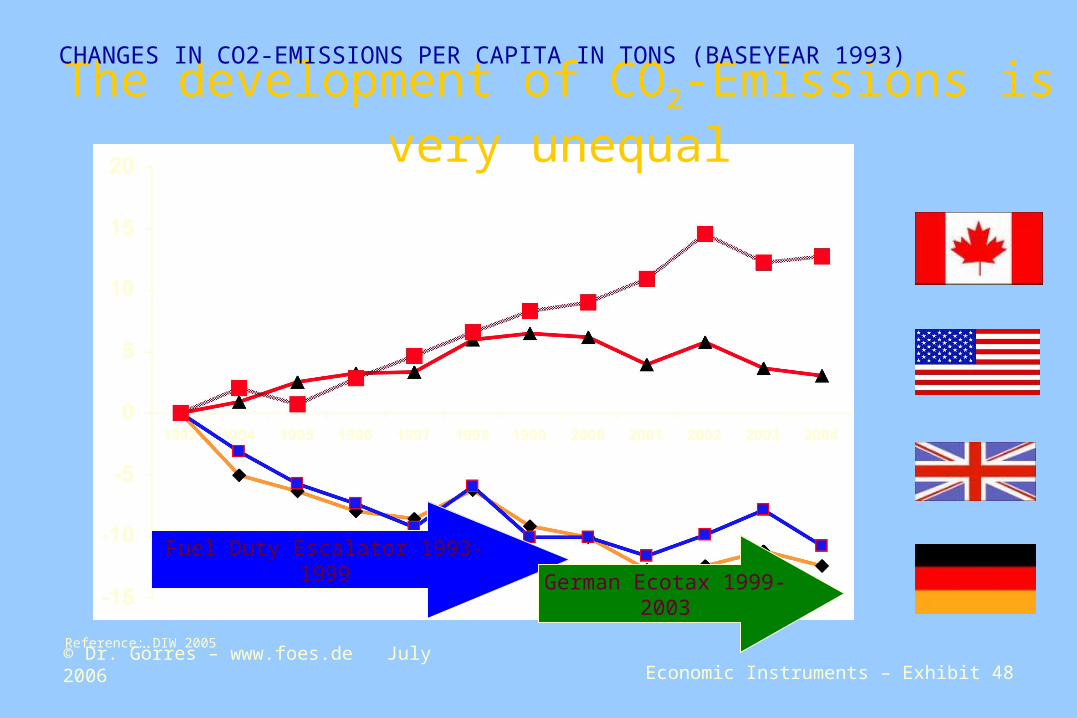
The development of CO2-Emissions is very unequalCHANGES IN CO2-EMISSIONS PER CAPITA IN TONS (BASEYEAR 1993)
Reference: DIW 2005
Fuel Duty Escalator 1993-1999German Ecotax 1999-
2003
© Dr. Görres – www.foes.de July 2006 Economic Instruments – Exhibit 49
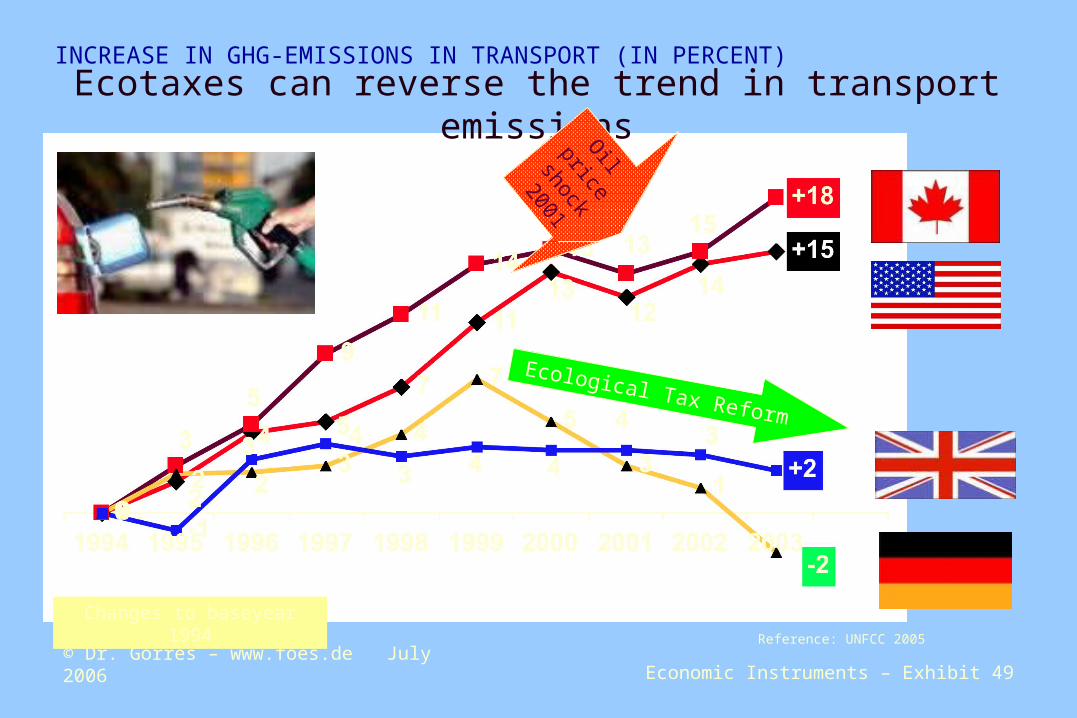
Ecotaxes can reverse the trend in transport emissions
INCREASE IN GHG-EMISSIONS IN TRANSPORT (IN PERCENT)
Changes to baseyear 1994Reference: UNFCC 2005
Ecological Tax Reform
Oil price
shock
2001
© Dr. Görres – www.foes.de July 2006 Economic Instruments – Exhibit 50
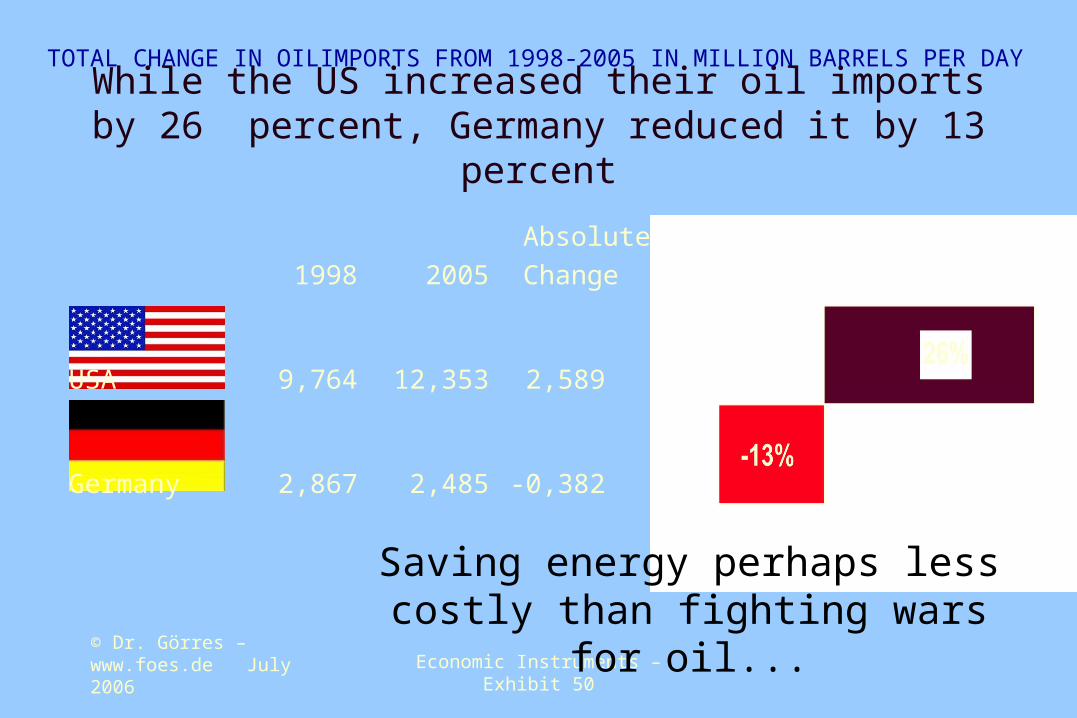
While the US increased their oil imports by 26 percent, Germany reduced it by 13 percent
TOTAL CHANGE IN OILIMPORTS FROM 1998-2005 IN MILLION BARRELS PER DAY
-0,3822,4852,867Germany
2,58912,3539,764USA
Absolute
Change Change in percent20051998
Saving energy perhaps less costly than fighting wars for oil...
© Dr. Görres – www.foes.de July 2006 Economic Instruments – Exhibit 51
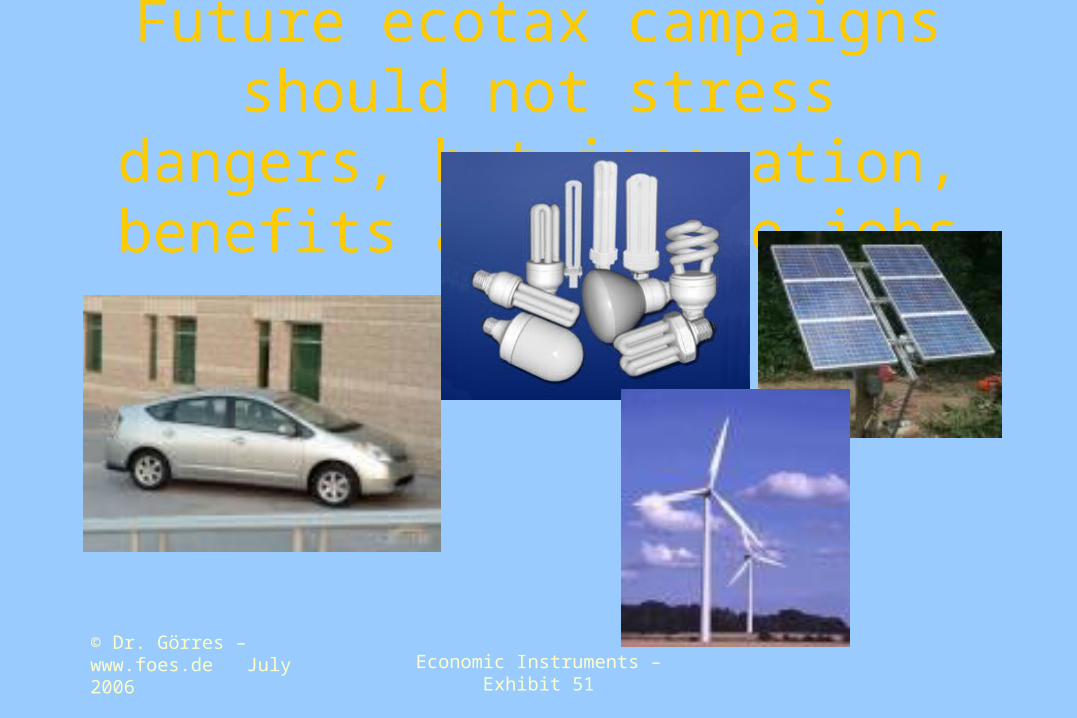
Future ecotax campaigns should not stress dangers, but innovation,
benefits and future jobs
© Dr. Görres – www.foes.de July 2006 Economic Instruments – Exhibit 52
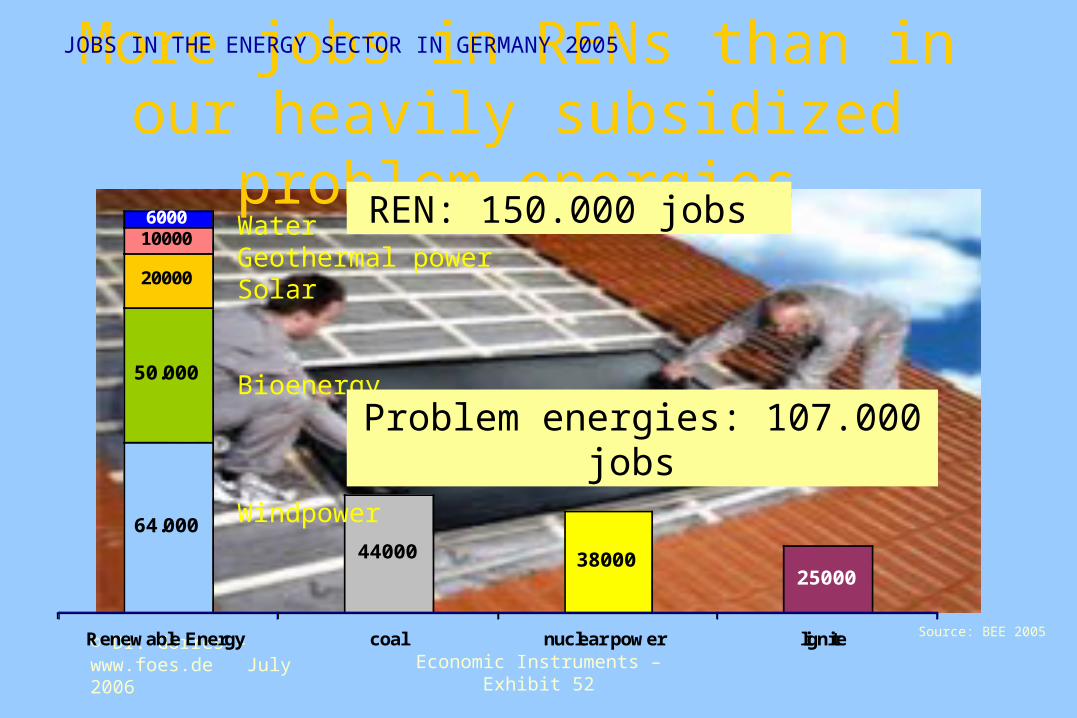
More jobs in RENs than in our heavily subsidized problem energies
25000
50.000
20000
10000
64.00044000 38000
6000
Renewable Energy coal nuclear power lignite Source: BEE 2005
WaterGeothermal powerSolar
Bioenergy
Windpower
REN: 150.000 jobs
JOBS IN THE ENERGY SECTOR IN GERMANY 2005
Problem energies: 107.000 jobs

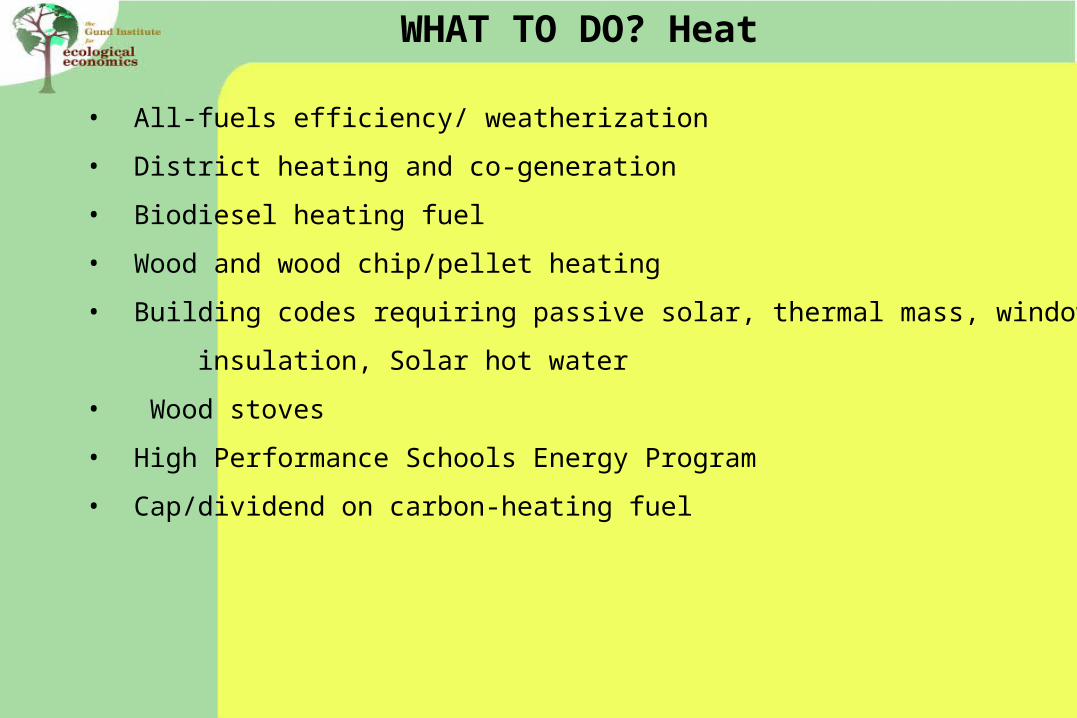
WHAT TO DO? Heat
• All-fuels efficiency/ weatherization
• District heating and co-generation
• Biodiesel heating fuel
• Wood and wood chip/pellet heating
• Building codes requiring passive solar, thermal mass, window
insulation, Solar hot water
• Wood stoves
• High Performance Schools Energy Program
• Cap/dividend on carbon-heating fuel
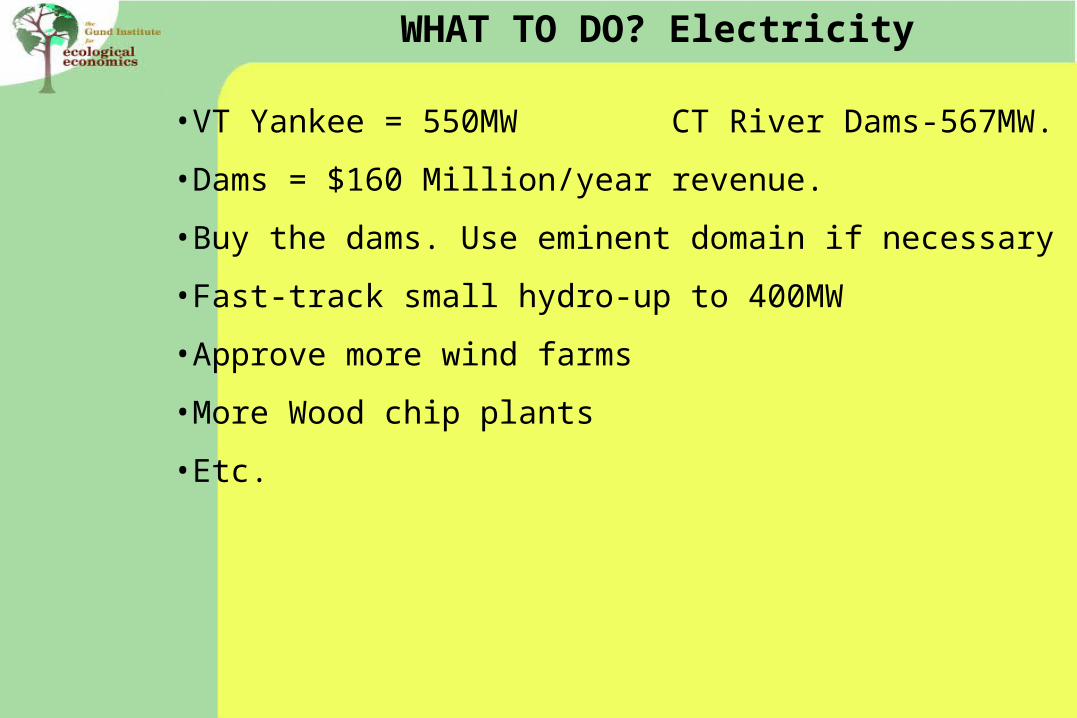
WHAT TO DO? Electricity
•VT Yankee = 550MW CT River Dams-567MW.
•Dams = $160 Million/year revenue.
•Buy the dams. Use eminent domain if necessary
•Fast-track small hydro-up to 400MW
•Approve more wind farms
•More Wood chip plants
•Etc.
WHAT TO DO? Heat
• All-fuels efficiency/ weatherization
• District heating and co-generation
• Biodiesel heating fuel
• Wood and wood chip/pellet heating
• Building codes requiring passive solar, thermal mass, window
insulation, Solar hot water
• Wood stoves
• High Performance Schools Energy Program
• Cap/dividend on carbon-heating fuel
WHAT TO DO? Transportation
•Hybrids
•Plug-in hybrids
•Electric vehicles
•Alternative fuels, ethanol, methanol (flex-fuel), biodiesel
•Trains
•Public transit-Jitneys
•Bike/pedestrian paths
•Tax/rebate on fuels
•Cap/dividend on carbon-vehicles
WHAT TO DO? Agriculture
•Don’t turn food into fuel
•Biodiesel: waste oil, algae, non-food crops
Methane digesters: “Cow-power”
Crisis or Opportunity
We will shift from Fossil Fuels.
Will we be Pro-active or reactive?
It’s up to you.