Embed Size (px)
Citation preview

11 October 2016
HIGHLIGHTS • Global oil supply rose by 0.6 mb/d in September, with non-OPEC up
nearly 0.5 mb/d on higher Russian and Kazakh flows and OPEC at an all-time high. World oil output of 97.2 mb/d was up 0.2 mb/d on a year ago due to strong OPEC growth. Non-OPEC supply is forecast to drop by 0.9 mb/d in 2016 before rebounding by 0.4 mb/d in 2017.
• OPEC crude output rose by 160 kb/d to a record 33.64 mb/d in September as Iraq pumped at the highest ever and Libya reopened ports. Supply from the group stood 0.9 mb/d above 2015 due to robust Middle East output. OPEC has agreed to cut supply to between 32.5 mb/d and 33 mb/d, with details to be set by end-November.
• Demand is forecast to expand by 1.2 mb/d this year, with a similar
gain expected in 2017. Growth continues to slow, dropping from a five-year high in 3Q15 to a four-year low in 3Q16 due to vanishing OECD growth and a marked deceleration in China. The potential for colder weather should see growth rebound somewhat in 4Q16.
• OECD commercial inventories fell for the first time since March, by 10 mb to 3 092 mb in August due to a larger than seasonal decline in crude stockpiles. Preliminary data for September show crude stocks falling in both Japan and the US.
• Weighed down by autumn maintenance, global refinery throughput in 4Q16 is expected to decline seasonally by 1.1 mb/d, up just 70 kb/d year-on-year. Global throughput in 2016 is expected to grow y-o-y by just 220 kb/d, the lowest annual growth rate in more than a decade, excluding the last economic recession.
• Benchmark crude prices rose in September as market rebalancing
continued and participants anticipated an OPEC supply cut. At the time of writing, front month ICE Brent was trading at $53.05/bbl with front month NYMEX WTI lower at $51.15/bbl.
OMR PUBLISHING SCHEDULE – 2017 Please find below the 2017 release dates for the Oil Market Report:
• Thursday 19 January
• Friday 10 February(1)
• Wednesday 15 March
• Thursday 13 April
• Tuesday 16 May
• Wednesday 14 June(2)
• Thursday 13 July
• Friday 11 August(3)
• Wednesday 13 September
• Thursday 12 October
• Tuesday 14 November
• Thursday 14 December
This information is also available at: www.iea.org/oilmarketreport/schedule/
The 2017 Edition of the Medium-Term Oil Market Report (MTOMR) will be released on Monday 6 March.
1. The 10 February OMR will comprise the usual data and projections through end-2017, but with abridged text.
2. Supply/demand forecasts will be ‘rolled out’ to 2018 in the report dated 14 June 2017.
3. The Annual Statistical Supplement 2016 Edition will be published in conjunction with the report dated 11 August 2016.
TABLE OF CONTENTS
HIGHLIGHTS ............................................................................................................................................................................................ 1
SETTING LIMITS ...................................................................................................................................................................................... 4
DEMAND ................................................................................................................................................................................................... 5 Summary ................................................................................................................................................................................................ 5 Global Overview ................................................................................................................................................................................. 5 Excessive debt levels pose risk to forecasts ........................................................................................................................................ 6 OECD ..................................................................................................................................................................................................... 7 Non-OECD ........................................................................................................................................................................................ 12 Temporary disconnect between China’s car sales boom and gasoline demand ......................................................................... 12
Other Non-OECD ...................................................................................................................................................................... 14
SUPPLY .................................................................................................................................................................................................... 17 Summary ............................................................................................................................................................................................. 17 OPEC crude oil supply .................................................................................................................................................................... 17 Non-OPEC overview ...................................................................................................................................................................... 22 OECD .................................................................................................................................................................................................. 23
North America ............................................................................................................................................................................. 23 North Sea ...................................................................................................................................................................................... 25
Non-OECD ........................................................................................................................................................................................ 26 Latin America ............................................................................................................................................................................... 26 Asia .................................................................................................................................................................................................. 27 Former Soviet Union .................................................................................................................................................................. 28
STOCKS .................................................................................................................................................................................................. 30 Summary ............................................................................................................................................................................................. 30 Global Overview .............................................................................................................................................................................. 30 OECD inventory position at end-August and revisions to preliminary data .................................................................... 30 Recent OECD industry stock changes ....................................................................................................................................... 31
OECD Americas .......................................................................................................................................................................... 31 OECD Europe .............................................................................................................................................................................. 32 OECD Asia Oceania ................................................................................................................................................................... 33
Recent developments in Singapore and China stocks ............................................................................................................ 33 LPG boom pushes product stocks to the brim ................................................................................................................................ 34
PRICES ...................................................................................................................................................................................................... 36 Summary ............................................................................................................................................................................................. 36 Market overview ............................................................................................................................................................................... 36 Futures markets ................................................................................................................................................................................ 36 Spot crude oil prices ........................................................................................................................................................................ 37 Spot product prices ......................................................................................................................................................................... 38 Freight ................................................................................................................................................................................................. 40
REFINING ............................................................................................................................................................................................... 42 Summary ............................................................................................................................................................................................. 42 Global refinery overview ................................................................................................................................................................ 42 Crouching refiners, hidden stockbuilds ............................................................................................................................................. 43
Margins ........................................................................................................................................................................................... 45 OECD refinery throughput ........................................................................................................................................................... 46 Non-OECD refinery throughput ................................................................................................................................................. 47
TABLES .................................................................................................................................................................................................... 49

MARKET OVERVIEW INTERNATIONAL ENERGY AGENCY - OIL MARKET REPORT
4 11 OCTOBER 2016
SETTING LIMITS
The waiting game is over. OPEC has effectively abandoned its free market policy set in train nearly two years ago. Global oil inventories are far too high - in the view of some producers – and they aren’t being worked off nearly fast enough. To speed up the process, OPEC agreed on 28 September to cut production. The price of oil has risen by 15% to more than $53/bbl since the deal, the first to cut supply since 2008. Now the real work starts. Apart from setting a supply target of between 32.5 mb/d and 33 mb/d, other critical details – like individual country allocations, production baseline and implementation date – need to be finalised when OPEC meets on 30 November. Iran, Libya and Nigeria – all aiming to raise output - are said to be exempt from cuts. A significant rebound in supply from Libya and Nigeria and further growth from Iran would suggest that bigger cuts would have to be made by others, such as Saudi Arabia, to meet the new output target. Our estimate for September shows crude supply from the group’s 14 members climbing to 33.6 mb/d – an all-time high. The extent of any cooperation from non-OPEC producers such as Russia is still to be determined.
40
45
50
55
60
M1 2 3 4 5 6 7 8 9 10 11 12
$/bblICE Brent
Forward Price Curve
08 Jul 16 09 Aug 1606 Sep 16 07 Oct 16
Source: ICE
28
29
30
31
32
33
34
1Q14 1Q15 1Q16 1Q17
mb/d Call on OPEC vs OPEC crude output
OPEC crude productionCall on OPEC crude + Stock Ch.
To be sure, the rapid rise of US light tight oil (LTO) and OPEC’s free-wheeling strategy triggered dramatic changes in the world of oil. The price of crude fallen from triple digit highs to below $50/bbl. Lower prices at the pump initially fuelled strong gains in demand, but growth has since slowed markedly after subsidy cuts in emerging markets, economic headwinds in some countries and demand saturation in the developed world. On the supply front, relentless growth from non-OPEC – particularly US LTO – has swung into contraction, as forecast in our previous reports. At the same time, production from OPEC – driven mainly by low-cost Middle East supply – has risen to all-time highs. The net result is a massive oil inventory overhang that is keeping the market under pressure.
The current price of oil has caused discomfort for all producers – even those with hefty financial reserves, such as Saudi Arabia. For high-cost non-OPEC producers the pain has been especially acute. The impact of steep investment cuts made in 2015 is being felt now: nearly 0.9 mb/d has been lost since a year ago. The lower price environment has also forced companies big and small to cut costs and do more with less. As a result, non-OPEC supply is expected to return to growth next year.
Even now, producers such as Russia are showing impressive resilience. So are Middle East OPEC countries whose record-smashing performance has raised the group’s oil output by 1.1 mb/d from a year ago. The converse is true for demand, with growth slowing from a five-year high in the third quarter of 2015 to a four-year low in the third quarter of this year.
Even with tentative signs that bulging inventories are starting to decline, our supply-demand outlook suggests that the market – if left to its own devices – may remain in oversupply through the first half of next year. If OPEC sticks to its new target, the market’s rebalancing could come faster.

INTERNATIONAL ENERGY AGENCY - OIL MARKET REPORT DEMAND
11 OCTOBER 2016 5
DEMAND Summary • World oil demand will grow by 1.2 mb/d this year, with a similar expansion expected in 2017. The
growth estimate for 2016 has been trimmed by 40 kb/d, while the absolute demand estimate was raised by 155 kb/d. Baseline adjustments, mainly to 2015 US data, lifted absolute demand but curbed expected growth in 2016.
• Global demand growth continues to slow, dropping from a five-year high of 2.5 mb/d in 3Q15 to a
four-year low of 0.8 mb/d in 3Q16 due to vanishing OECD growth and a marked deceleration in China. After unusually mild winter weather in much of the northern hemisphere in 4Q15, year on year (y-o-y) growth should rebound somewhat in 4Q16 (+1.4 mb/d).
• Much weaker-than-expected US oil demand data for July pulled down the estimate of overall
demand for the third quarter and for the whole of 2016. Growth estimates fell heavily (-415 kb/d in July, y-o-y), as upgrades to the baseline series further reduced year-on-year (y-o-y) comparisons.
• Chinese oil demand growth has all but vanished in 3Q16 compared to a year ago, pulled down by a
substantial slowdown in industrial oil usage. Some of the slowdown may be temporary due to forced factory closures ahead of September’s G20 meeting in Hangzhou, but the heady gains seen as recently as mid-2015 are unlikely to be repeated any time soon.
• Exceptionally weak estimates of Saudi Arabian ‘other product’ demand due to subdued seasonal
power sector demand pulled the overall metric down in y-o-y terms for a fourth consecutive month in July.
• Indian demand growth returned with a vengeance, according to preliminary August data
(+420 kb/d). Strong gains in road transport demand and residential LPG use lent support, more than offsetting declines in naphtha and kerosene.
• A surprising uptick in Russian demand gathered pace in August despite an ailing economy and
ongoing recessionary conditions. Russian demand broke through 4 mb/d for the first time ever, rising by just over 4% y-o-y in August, despite a recession that has lasted since mid-2014.
Global Oil Demand (2015-2017)
(million barrels per day) 1Q15 2Q15 3Q15 4Q15 2015 1Q16 2Q16 3Q16 4Q16 2016 1Q17 2Q17 3Q17 4Q17 2017
Africa 4.1 4.1 4.0 4.1 4.1 4.2 4.2 4.1 4.3 4.2 4.3 4.4 4.3 4.4 4.3Americas 31.1 31.2 31.8 31.3 31.4 31.0 31.1 31.6 31.4 31.3 31.0 31.2 31.7 31.5 31.3Asia/Pacif ic 32.3 31.6 31.6 32.6 32.0 33.3 32.6 32.2 33.4 32.9 34.0 33.3 33.2 34.2 33.7Europe 14.1 14.2 14.9 14.4 14.4 14.3 14.6 14.9 14.4 14.6 14.3 14.6 14.9 14.4 14.6FSU 4.7 4.9 5.1 5.0 4.9 4.9 4.9 5.3 5.2 5.1 5.0 5.1 5.3 5.2 5.2Middle East 7.8 8.5 8.7 8.3 8.3 7.8 8.3 8.7 8.3 8.3 8.0 8.4 8.8 8.4 8.4World 94.0 94.5 96.0 95.6 95.0 95.5 95.8 96.8 97.0 96.3 96.8 96.9 98.1 98.2 97.5Annual Chg (%) 1.6 2.1 2.7 1.4 1.9 1.6 1.4 0.8 1.5 1.3 1.3 1.2 1.4 1.2 1.3Annual Chg (mb/d) 1.5 1.9 2.5 1.3 1.8 1.5 1.3 0.8 1.4 1.2 1.3 1.2 1.3 1.2 1.2Changes from last OMR (mb/d) 0.2 0.2 0.2 0.1 0.2 0.1 0.2 0.2 0.2 0.2 0.2 0.2 0.2 0.2 0.2 Global Overview A number of major data revisions have significantly changed the composition and scale of the global oil demand profile. The baseline series for 2015 has been revised up by nearly 200 kb/d, since last month’s

DEMAND INTERNATIONAL ENERGY AGENCY - OIL MARKET REPORT
6 11 OCTOBER 2016
Report, to 95.04 mb/d. The raised historical estimates are mainly due to the latest US 2015 data being significantly above that first reported and, to some extent, upgrades of non-OECD Asian demand. The growth estimate for 2016 has, however, been modestly curtailed – by 40 kb/d to 1.24 mb/d – as higher baseline numbers were not fully replicated. A similarly paced expansion is projected for 2017, as a tentative acceleration in underlying economic activity collides with potentially higher oil prices. Revisions to the historical numbers for the US were critical, as government data raised the 2015 demand estimate by 135 kb/d to 19.5 mb/d. Additional LPG (including ethane) demand was the key. A number of non-OECD consumers were also upgraded. Our Indonesian estimate was raised following the publication of more comprehensive data by the Joint Organisations Data Initiative (JODI). China was the other main upside-revision, with about 40 kb/d added to the 2015 demand estimate of 11.5 mb/d due to upwardly revised gasoline numbers following in-depth analysis of the road transportation market (see Temporary disconnect between China’s car sales boom and gasoline demand). The 2016 demand profile has also been adjusted. Preliminary August numbers for Russia, India, Korea and many European countries have come out ahead of prior expectations – indicating a potentially higher 3Q16 global demand forecast. However, much weaker conditions in the US, Brazil, Saudi Arabia and Turkey had the opposite effect. The net result overall is a 3Q16 global demand estimate of 96.80 mb/d, 150 kb/d up on the estimate carried in last month’s Report due to the above mentioned base year adjustment. What remains clear is that y-o-y global oil demand growth has clearly slowed from a five-year high of 2.53 mb/d in 3Q15 to 0.77 mb/d. Although we anticipate a modest weather-related uptick in 4Q16 (see Colder winter may spur northern hemisphere demand in last month’s Report), growth of 1.24 mb/d is expected for the year as a whole. That is significantly below the recent peak of 1.81 mb/d in 2015. The acceleration that occurred in 2015 after a near-halving in crude oil prices was not matched in 2016. This logic further also keeps the forecast for 2017 demand growth in check.
Excessive debt levels pose risk to forecasts One clear risk stands out from reports published this month by the International Monetary Fund (IMF) – excessive debt levels and their impact on the world economy and oil demand.
At roughly 225% of global economic activity, gross debts in the non-financial sector cast a long shadow, according to the IMF’s Fiscal Monitor. Indeed, the prolongued slowdown in global economic growth “has prompted financial markets to expect an extended period of low inflation and low interest rates” (Global Financial Stability Report, October 2016), encouraging excessive debt levels on the promise of low repayment schedules to come. But a key oil-related contribution to this has recently changed. For one-and-a-half years the oil-price contribution to overall price pressures has been overwhelmingly deflationary, but that has now changed. If one believes futures prices, oil could continue to act as an inflationary pressure. Assuming the majority of other global price pressures remain deflationary, the current low inflation/low interest rate environment will most likely remain. If other costs start to reflect the potential oil-price upside, or at least lack of downside, then the status quo could rapidly change making incumbent debt levels a hugely restrictive expense.
-1%
0%
1%
2%
3%
-1
0
1
2
3
1Q2012 1Q2013 1Q2014 1Q2015 1Q2016
mb/d Global y-on-y Absolute GrowthTotal Products Growth Rate
LPG Naphtha GasolineJetKero Diesel RFOOther Total (RHS)
20
30
40
50
60
70
Jan Mar May Jul Sep Nov
ICE Brent
2015 2016 Forward curve
INTERNATIONAL ENERGY AGENCY - OIL MARKET REPORT DEMAND
11 OCTOBER 2016 7
Excessive debt levels pose risk to forecasts (continued)
At more than $150 trillion, non-financial debt levels – comprising the general government, household and non-financial companies – stand at an all-time high, while two-thirds of this consist of (potentially more risky) private sector liabilities. The IMF’s Financial Monitor warns that “there are concerns that the sheer size of the debt could set the stage for an unprecedented private deleveraging process that could thwart the financial economic recovery”. Hence, achieving the IMF’s central 3.4% 2017 global economic growth forecast – that underpin the demand forecasts carried in this Report – will not be clear sailing and October’s World Economic Outlook forecasts a 90% confidence interval of 2.2%-to-4.5% for 2017 global economic growth, with anything below 3% commonly deemed to be close to a global economic recession. October’s Global Financial Stability Report, from the IMF, further warns that the medium-term economic risks are building.
The IMF still claims that “the short term risks…have abated” (since their publication of April 2016). But many risks still loom outside of the forecasting horizon of this Report, i.e. 2016-17. For now we continue to foresee global oil demand growth of approximately 1.2 mb/d in 2017 but note that the exogenous variables that underpin our demand models – that of economic growth and prices – continue to ebb as the market evolves.
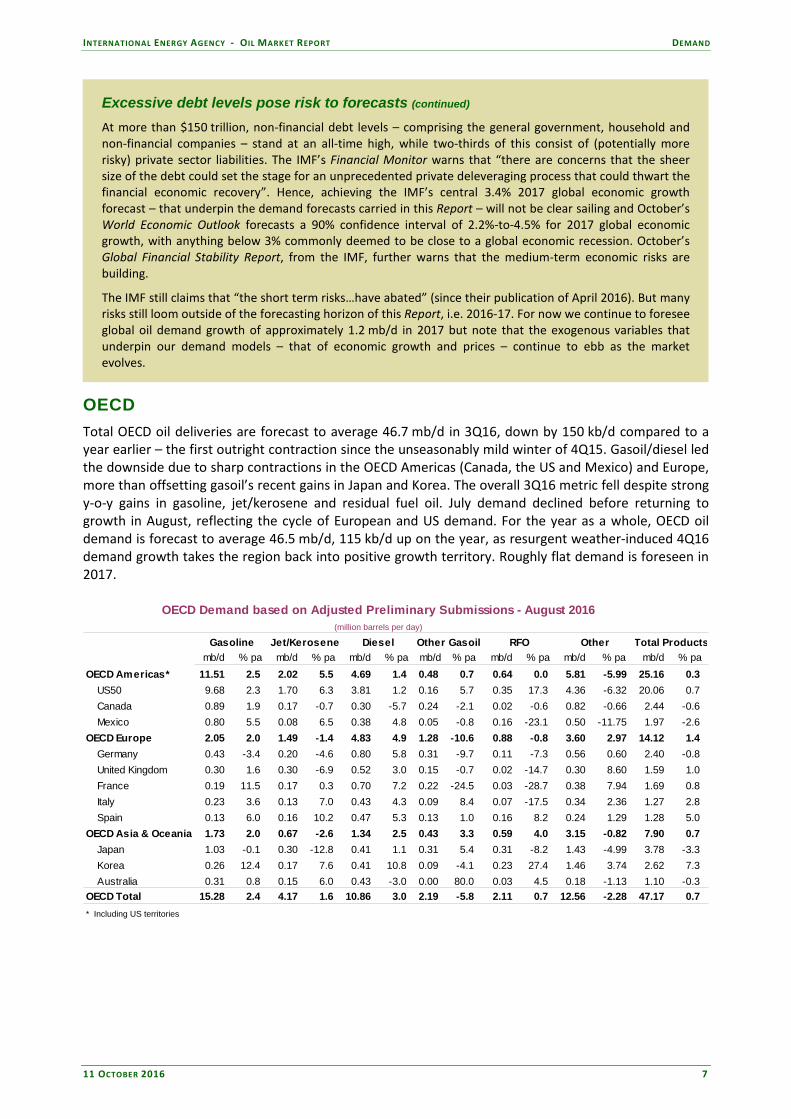
OECD Total OECD oil deliveries are forecast to average 46.7 mb/d in 3Q16, down by 150 kb/d compared to a year earlier – the first outright contraction since the unseasonably mild winter of 4Q15. Gasoil/diesel led the downside due to sharp contractions in the OECD Americas (Canada, the US and Mexico) and Europe, more than offsetting gasoil’s recent gains in Japan and Korea. The overall 3Q16 metric fell despite strong y-o-y gains in gasoline, jet/kerosene and residual fuel oil. July demand declined before returning to growth in August, reflecting the cycle of European and US demand. For the year as a whole, OECD oil demand is forecast to average 46.5 mb/d, 115 kb/d up on the year, as resurgent weather-induced 4Q16 demand growth takes the region back into positive growth territory. Roughly flat demand is foreseen in 2017.
OECD Demand based on Adjusted Preliminary Submissions - August 2016(million barrels per day)
mb/d % pa mb/d % pa mb/d % pa mb/d % pa mb/d % pa mb/d % pa mb/d % paOECD Americas* 11.51 2.5 2.02 5.5 4.69 1.4 0.48 0.7 0.64 0.0 5.81 -5.99 25.16 0.3
US50 9.68 2.3 1.70 6.3 3.81 1.2 0.16 5.7 0.35 17.3 4.36 -6.32 20.06 0.7 Canada 0.89 1.9 0.17 -0.7 0.30 -5.7 0.24 -2.1 0.02 -0.6 0.82 -0.66 2.44 -0.6 Mexico 0.80 5.5 0.08 6.5 0.38 4.8 0.05 -0.8 0.16 -23.1 0.50 -11.75 1.97 -2.6
OECD Europe 2.05 2.0 1.49 -1.4 4.83 4.9 1.28 -10.6 0.88 -0.8 3.60 2.97 14.12 1.4 Germany 0.43 -3.4 0.20 -4.6 0.80 5.8 0.31 -9.7 0.11 -7.3 0.56 0.60 2.40 -0.8 United Kingdom 0.30 1.6 0.30 -6.9 0.52 3.0 0.15 -0.7 0.02 -14.7 0.30 8.60 1.59 1.0 France 0.19 11.5 0.17 0.3 0.70 7.2 0.22 -24.5 0.03 -28.7 0.38 7.94 1.69 0.8 Italy 0.23 3.6 0.13 7.0 0.43 4.3 0.09 8.4 0.07 -17.5 0.34 2.36 1.27 2.8 Spain 0.13 6.0 0.16 10.2 0.47 5.3 0.13 1.0 0.16 8.2 0.24 1.29 1.28 5.0
OECD Asia & Oceania 1.73 2.0 0.67 -2.6 1.34 2.5 0.43 3.3 0.59 4.0 3.15 -0.82 7.90 0.7 Japan 1.03 -0.1 0.30 -12.8 0.41 1.1 0.31 5.4 0.31 -8.2 1.43 -4.99 3.78 -3.3 Korea 0.26 12.4 0.17 7.6 0.41 10.8 0.09 -4.1 0.23 27.4 1.46 3.74 2.62 7.3 Australia 0.31 0.8 0.15 6.0 0.43 -3.0 0.00 80.0 0.03 4.5 0.18 -1.13 1.10 -0.3
OECD Total 15.28 2.4 4.17 1.6 10.86 3.0 2.19 -5.8 2.11 0.7 12.56 -2.28 47.17 0.7 * Including US territories
Total ProductsGasoline Jet/Kerosene Diesel Other Gasoil RFO Other

DEMAND INTERNATIONAL ENERGY AGENCY - OIL MARKET REPORT
8 11 OCTOBER 2016
44
45
46
47
48
JAN APR JUL OCT JAN
mb/d OECD: Total Products Demand
Range 11-15 20152016 5-year avg
23.0
23.5
24.0
24.5
25.0
25.5
JAN APR JUL OCT JAN
mb/d OECD Americas: Total Products Demand
Range 11-15 20152016 5-year avg
Americas Falling by over 200 kb/d on a y-o-y basis in 3Q16, oil deliveries in the OECD Americas are envisaged to average 24.8 mb/d – the highest absolute level in a year but below the elevated low-price induced height of last year. Furthermore, the 0.8% y-o-y 3Q16 decline is the steepest OECD American drop since 3Q12. The changing US demand picture sits at the root of this change. US demand contracted by a surprisingly sharp 2.1% y-o-y in July, pulled down by a combination of upside baseline 2015 revisions and a much weaker official monthly estimate of July demand. Not only is the downwardly revised 19.7 mb/d July estimate significantly below (-255 kb/d) that previously assumed, it is also 415 kb/d below the upwardly revised level of year earlier deliveries – a scale of contraction not seen since late-2012.
17.5
18.0
18.5
19.0
19.5
20.0
20.5
JAN APR JUL OCT JAN
mb/d US50: Total Products Demand
Range 11-15 20152016 5-year avg
-15%
-10%
-5%
0%
5%
-3.0%
-2.0%
-1.0%
0.0%
1.0%
2.0%
Apr-15 Aug-15 Dec-15 Apr-16
US Gasoil Growth, y-o-y
Industrial production Gasoil
The key contributors for July’s sharp drop – a three-and-a-half-year high – are the big declines in US industrial oil use, chiefly gasoil/diesel (-320 kb/d y-o-y) and ‘other products’ (-365 kb/d). These falls more than offset the gains in US gasoline, residual fuel oil and jet/kerosene. The split clearly demonstrates the dichotomy that exists in the US economy: persistent declines in the US industrial sector and continued growth in the consumer sector. Industrial activity across the US economy as a whole eased by 0.6% compared to the year earlier in July, with a further decline of 1.1% y-o-y in August, according the US Federal Reserve. In contrast, the US Census Bureau cited total retail sales growth of approximately 2.4% y-o-y in July. Baseline data revisions have dropped relative y-o-y growth estimates through most of 2016. The latest official data from the US showed demand at 19.5 mb/d in 2015, 135 kb/d more than previously reported, resulting in an upwardly revised US growth estimate of 425 kb/d (or 2.2%) compared to the previous +290 kb/d (or +1.5%). Additional LPG (including ethane) was the main catalyst, with deliveries of LPG now estimated to be 2.5 mb/d in 2015, a gain of 60 kb/d on the year earlier.

INTERNATIONAL ENERGY AGENCY - OIL MARKET REPORT DEMAND
11 OCTOBER 2016 9
1.8
2.0
2.2
2.4
2.6
2.8
3.0
3.2
JAN APR JUL OCT JAN
mb/d US50: LPG Demand
Range 11-15 20152016 5-year avg
8.0
8.5
9.0
9.5
10.0
JAN APR JUL OCT JAN
mb/d US50: Motor Gasoline Demand
Range 11-15 20152016 5-year avg
Preliminary indicators of August US demand – based on adjusted weekly numbers from the US Energy Information Administration – still point towards growth. Likely rising by around 0.7% in August, total US oil deliveries are forecast to average 20.1 mb/d in August and 19.8 mb/d in 3Q16, a decline of 75 kb/d on the year earlier. Despite the recent weaknesses in US industrial oil demand, gasoline remains relatively robust due to high vehicle usage. The US Department of Transport’s Federal Highway Administration cites seasonally adjusted US vehicle miles travelled rising by 3.3% in July, compared to the previous year. For the year as a whole, US oil deliveries are forecast to average 19.6 mb/d, a modest 35 kb/d up on 2015.
2.2
2.3
2.4
2.5
2.6
2.7
JAN APR JUL OCT JAN
mb/d Canada: Total Products Demand
Range 11-15 20152016 5-year avg
700
750
800
850
900
950
JAN APR JUL OCT JAN
kb/d Canada: Motor Gasoline Demand
Range 11-15 20152016 5-year avg
Having fallen through most of 2015 and early 2016, the latest Canadian demand estimates show modest oil demand growth, March through July. Gains in naphtha and gasoline provide the key supports, more than offsetting continued contractions in Canadian gasoil/diesel and ‘other products’ demand. Relatively strong gasoline demand growth has been the dominant Canadian theme in 2016, as comparatively low retail prices have coincided with restored consumer confidence. Retail sales across the economy as a whole were up by 2.3% y-o-y in July, continuing the growth trend in consumer spending that has been in place since early 2015. Deliveries are forecast to average 2.4 mb/d in 2016, down 10 kb/d compared to the previous year. On par with the forecast in last month’s Report, Mexican oil deliveries averaged 2.0 mb/d in August. This 55 kb/d (or 2.6%) y-o-y contraction was caused by sharp drops in LPG, residual fuel oil and ‘other product’ demand that more than offset expansions in gasoline, gasoil and naphtha. Residual fuel oil demand fell sharply as power sector use contracted. The Mexican Secretaria de Energia reported that notoriously volatile power sector usage contracted by more than one-third compared to a year ago, reflecting accelerating natural gas use.

DEMAND INTERNATIONAL ENERGY AGENCY - OIL MARKET REPORT
10 11 OCTOBER 2016
1.8
1.9
2.0
2.1
2.2
2.3
JAN APR JUL OCT JAN
mb/d Mexico: Total Products Demand
Range 11-15 20152016 5-year avg
50
100
150
200
250
300
350
400
JAN APR JUL OCT JAN
kb/d Mexico: Residual Fuel Demand
Range 11-15 20152016 5-year avg
Europe Preliminary estimates of European oil deliveries in August at 14.1 mb/d rose sharply (+190 kb/d, y-o-y, or +1.4%), supported by additional working days in many countries – August 2016 versus August 2015 – and a strengthening macroeconomic picture. France, Italy, Spain and Poland all experienced particularly robust y-o-y gains in August due to sharp upticks in gasoil/diesel demand. Despite an upside revision of 105 kb/d to 3Q16 European oil demand (to 14.2 mb/d), compared to last month’s Report, growth essentially vanished in 3Q16, ending an unusual one-and-half year period of strong European oil demand growth. For the year as a whole, European oil product deliveries are forecast to average 13.9 mb/d, 135 kb/d up on 2015 – not quite of the scale (+215 kb/d) seen in 2015 but the second fastest pace of growth in 15 years.
12.5
13.0
13.5
14.0
14.5
15.0
JAN APR JUL OCT JAN
mb/d OECD Europe: Total Products Demand
Range 11-15 20152016 5-year avg
1.4
1.5
1.6
1.7
1.8
1.9
2.0
JAN APR JUL OCT JAN
mb/d France: Total Products Demand
Range 11-15 20152016 5-year avg
0.4
0.5
0.6
0.7
0.8
0.9
1.0
JAN APR JUL OCT JAN
mb/d Turkey: Total Products Demand
Range 11-15 20152016 5-year avg
150
200
250
300
350
400
450
500
JAN APR JUL OCT JAN
kb/d Turkey: Gasoil/Diesel Demand
Range 11-15 20152016 5-year avg
The latest European demand data has not been universally rising. The region’s largest economy, Germany, saw a y-o-y decline in August as contractions in gasoline, LPG, residual fuel oil and ‘other products’ offset gains in German naphtha and gasoil/diesel deliveries. Furthermore, the slowdown in

INTERNATIONAL ENERGY AGENCY - OIL MARKET REPORT DEMAND
11 OCTOBER 2016 11
Turkish oil demand growth in July, the latest month for which Turkish data is available, surprised by its scale – growth vanishing after a year-and-a-half of strong growth – if not its occurrence. The Turkish deceleration was due to declines in middle distillate demand as an attempted coup saw industrial activity plummet. Asia Oceania Rising for two consecutive quarters in 3Q16 in y-o-y terms, strong industrial-led gains in Korea more than offset persistent contractions in Japan. Oil demand in the OECD Asia Oceania region averaged 7.8 mb/d in 3Q16, a gain of 45 kb/d or 0.6% on the year earlier. This modest pace of mid-year growth is unlikely to prove sufficient to significantly change the forecast from 8.0 mb/d for the year as a whole.
7.0
7.5
8.0
8.5
9.0
9.5
10.0
JAN APR JUL OCT JAN
mb/d OECD Asia Oceania: Total Products Demand
Range 11-15 20152016 5-year avg
1.5
1.6
1.7
1.8
1.9
2.0
JAN APR JUL OCT JAN
mb/d OECD Asia Oceania: Gasoil/Diesel Demand
Range 11-15 20152016 5-year avg
The latest Japanese demand data came out roughly as forecast – down by 1.4% y-o-y in July and a further 3.3% in August due to continued declines in kerosene, naphtha and ‘other products’. With Japanese demand forecast to rise along normal seasonal patterns in 4Q16 – to 4.0 mb/d from 3.7 mb/d in 3Q16 – oil product deliveries should average about 4.0 mb/d over the course of the year, an average decline of 160 kb/d or -3.8%.
3.0
3.5
4.0
4.5
5.0
5.5
JAN APR JUL OCT JAN
mb/d Japan: Total Products Demand
Range 11-15 20152016 5-year avg
0.2
0.3
0.4
0.5
0.6
0.7
JAN APR JUL OCT JAN
mb/d Japan: Other Products Demand
Range 11-15 20152016 5-year avg
Korea provided most of the region’s recent demand growth, with a y-o-y gain of 180 kb/d (or 7.3%) in August due to sharp and persistent upticks in gasoline, gasoil/diesel, LPG and residual fuel oil. The latter three products surged on the back of a renewed acceleration in industrial activity, which rose 2.3% y-o-y according to Statistics Korea. The two former products thrived as a more confident Korean consumer drove more, while August’s heatwave increased in-vehicle air-conditioning, reducing vehicle efficiency. The Bank of Korea’s consumer confident index rose to a three-month high of 102 in August, whereby any reading above 100 signifies an improving outlook. The closure of a number of nuclear and gas facilities, following September’s earthquake, provides additional 2H16 demand support, raising the overall 2016 Korean demand forecast to 2.6 mb/d, 160 kb/d up on 2015 – note exactly the converse of the Japanese forecast – and 30 kb/d above the forecast carried in last month’s Report.
DEMAND INTERNATIONAL ENERGY AGENCY - OIL MARKET REPORT
12 11 OCTOBER 2016
2.0
2.2
2.4
2.6
2.8
JAN APR JUL OCT JAN
mb/d Korea: Total Products Demand
Range 11-15 20152016 5-year avg
300
350
400
450
500
550
JAN APR JUL OCT JAN
kb/d Korea: Gasoil/Diesel Demand
Range 11-15 20152016 5-year avg
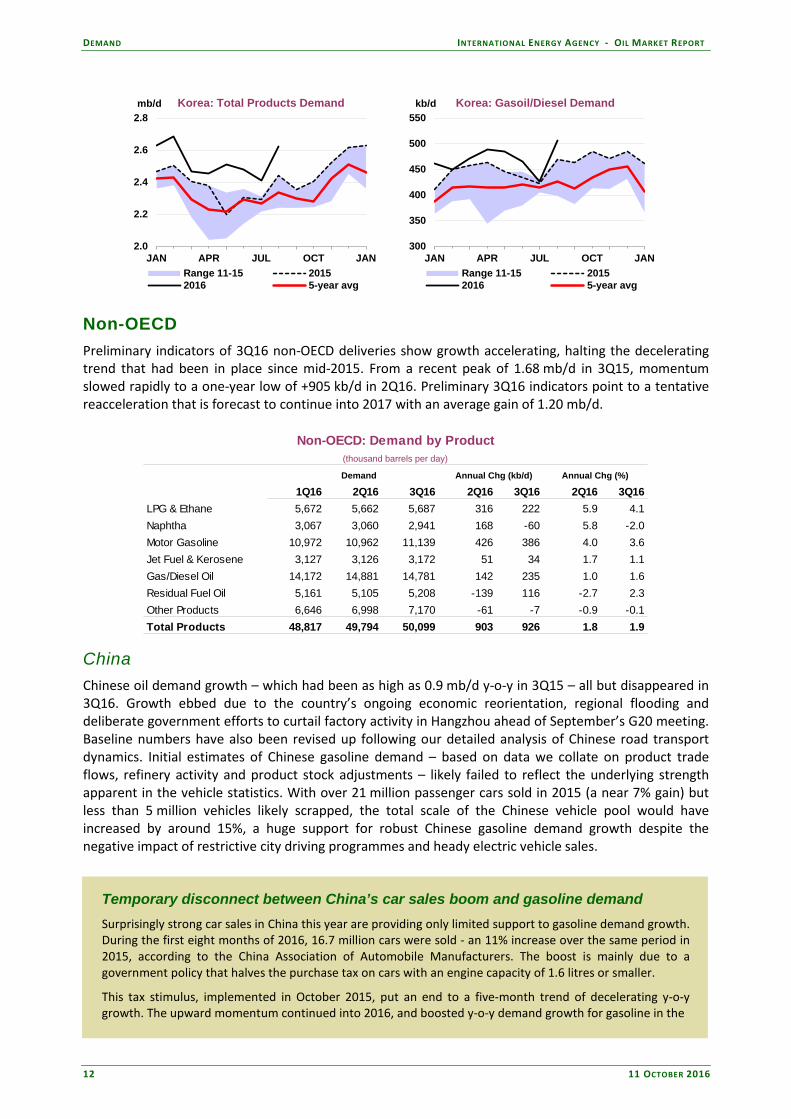
Non-OECD Preliminary indicators of 3Q16 non-OECD deliveries show growth accelerating, halting the decelerating trend that had been in place since mid-2015. From a recent peak of 1.68 mb/d in 3Q15, momentum slowed rapidly to a one-year low of +905 kb/d in 2Q16. Preliminary 3Q16 indicators point to a tentative reacceleration that is forecast to continue into 2017 with an average gain of 1.20 mb/d.
Non-OECD: Demand by Product(thousand barrels per day)
Annual Chg (kb/d) Annual Chg (%)
1Q16 2Q16 3Q16 2Q16 3Q16 2Q16 3Q16LPG & Ethane 5,672 5,662 5,687 316 222 5.9 4.1Naphtha 3,067 3,060 2,941 168 -60 5.8 -2.0Motor Gasoline 10,972 10,962 11,139 426 386 4.0 3.6Jet Fuel & Kerosene 3,127 3,126 3,172 51 34 1.7 1.1Gas/Diesel Oil 14,172 14,881 14,781 142 235 1.0 1.6Residual Fuel Oil 5,161 5,105 5,208 -139 116 -2.7 2.3Other Products 6,646 6,998 7,170 -61 -7 -0.9 -0.1Total Products 48,817 49,794 50,099 903 926 1.8 1.9
Demand
China Chinese oil demand growth – which had been as high as 0.9 mb/d y-o-y in 3Q15 – all but disappeared in 3Q16. Growth ebbed due to the country’s ongoing economic reorientation, regional flooding and deliberate government efforts to curtail factory activity in Hangzhou ahead of September’s G20 meeting. Baseline numbers have also been revised up following our detailed analysis of Chinese road transport dynamics. Initial estimates of Chinese gasoline demand – based on data we collate on product trade flows, refinery activity and product stock adjustments – likely failed to reflect the underlying strength apparent in the vehicle statistics. With over 21 million passenger cars sold in 2015 (a near 7% gain) but less than 5 million vehicles likely scrapped, the total scale of the Chinese vehicle pool would have increased by around 15%, a huge support for robust Chinese gasoline demand growth despite the negative impact of restrictive city driving programmes and heady electric vehicle sales.
Temporary disconnect between China’s car sales boom and gasoline demand Surprisingly strong car sales in China this year are providing only limited support to gasoline demand growth. During the first eight months of 2016, 16.7 million cars were sold - an 11% increase over the same period in 2015, according to the China Association of Automobile Manufacturers. The boost is mainly due to a government policy that halves the purchase tax on cars with an engine capacity of 1.6 litres or smaller.
This tax stimulus, implemented in October 2015, put an end to a five-month trend of decelerating y-o-y growth. The upward momentum continued into 2016, and boosted y-o-y demand growth for gasoline in the
INTERNATIONAL ENERGY AGENCY - OIL MARKET REPORT DEMAND
11 OCTOBER 2016 13
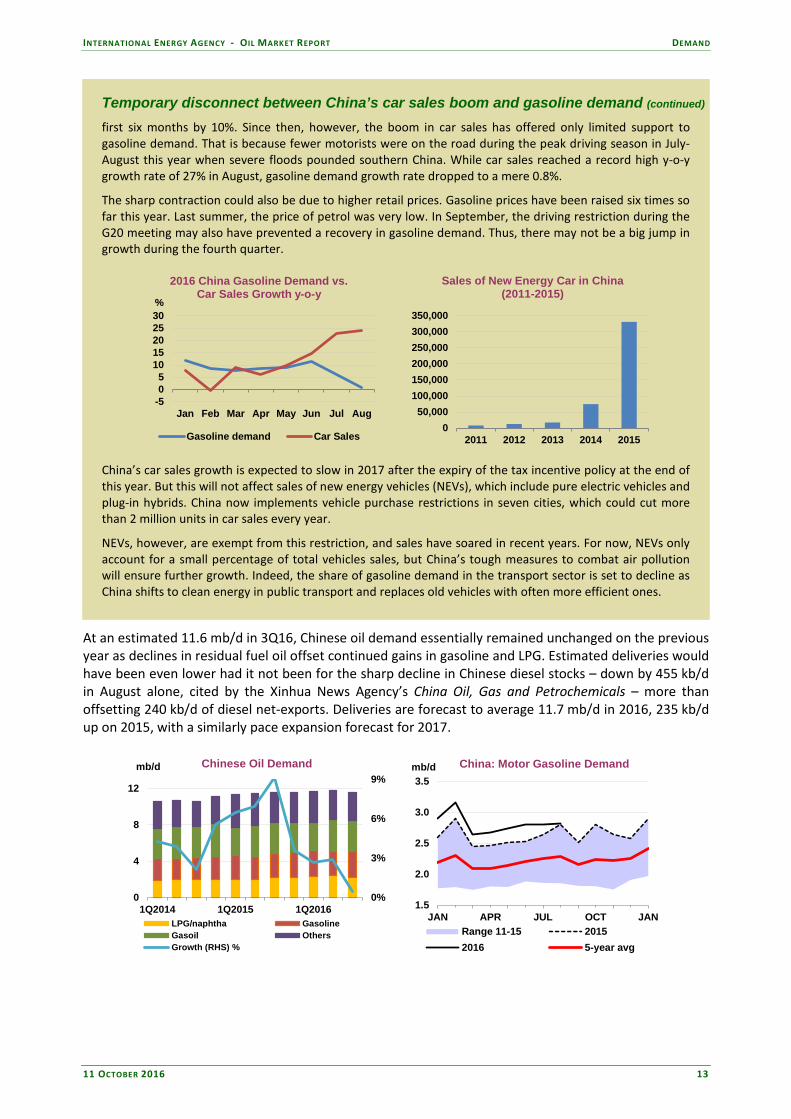
Temporary disconnect between China’s car sales boom and gasoline demand (continued)
first six months by 10%. Since then, however, the boom in car sales has offered only limited support to gasoline demand. That is because fewer motorists were on the road during the peak driving season in July-August this year when severe floods pounded southern China. While car sales reached a record high y-o-y growth rate of 27% in August, gasoline demand growth rate dropped to a mere 0.8%.
The sharp contraction could also be due to higher retail prices. Gasoline prices have been raised six times so far this year. Last summer, the price of petrol was very low. In September, the driving restriction during the G20 meeting may also have prevented a recovery in gasoline demand. Thus, there may not be a big jump in growth during the fourth quarter.
-505
1015202530
Jan Feb Mar Apr May Jun Jul Aug
%
2016 China Gasoline Demand vs. Car Sales Growth y-o-y
Gasoline demand Car Sales
050,000
100,000150,000200,000250,000300,000350,000
2011 2012 2013 2014 2015
Sales of New Energy Car in China (2011-2015)
China’s car sales growth is expected to slow in 2017 after the expiry of the tax incentive policy at the end of this year. But this will not affect sales of new energy vehicles (NEVs), which include pure electric vehicles and plug-in hybrids. China now implements vehicle purchase restrictions in seven cities, which could cut more than 2 million units in car sales every year.
NEVs, however, are exempt from this restriction, and sales have soared in recent years. For now, NEVs only account for a small percentage of total vehicles sales, but China’s tough measures to combat air pollution will ensure further growth. Indeed, the share of gasoline demand in the transport sector is set to decline as China shifts to clean energy in public transport and replaces old vehicles with often more efficient ones.
At an estimated 11.6 mb/d in 3Q16, Chinese oil demand essentially remained unchanged on the previous year as declines in residual fuel oil offset continued gains in gasoline and LPG. Estimated deliveries would have been even lower had it not been for the sharp decline in Chinese diesel stocks – down by 455 kb/d in August alone, cited by the Xinhua News Agency’s China Oil, Gas and Petrochemicals – more than offsetting 240 kb/d of diesel net-exports. Deliveries are forecast to average 11.7 mb/d in 2016, 235 kb/d up on 2015, with a similarly pace expansion forecast for 2017.
0%
3%
6%
9%
0
4
8
12
1Q2014 1Q2015 1Q2016
mb/d Chinese Oil Demand
LPG/naphtha GasolineGasoil OthersGrowth (RHS) %
1.5
2.0
2.5
3.0
3.5
JAN APR JUL OCT JAN
mb/d China: Motor Gasoline Demand
Range 11-15 20152016 5-year avg

DEMAND INTERNATIONAL ENERGY AGENCY - OIL MARKET REPORT
14 11 OCTOBER 2016
China: Demand by Product (thousand barrels per day)
Annual Chg (kb/d) Annual Chg (%)
2015 2016 2017 2016 2017 2016 2017LPG & Ethane 1,112 1,275 1,383 164 107 14.7 8.4Naphtha 997 1,051 1,071 54 21 5.4 2.0Motor Gasoline 2,618 2,812 2,997 194 185 7.4 6.6Jet Fuel & Kerosene 604 642 676 39 34 6.4 5.3Gas/Diesel Oil 3,335 3,365 3,346 30 -18 0.9 -0.5Residual Fuel Oil 296 214 149 -82 -65 -27.8 -30.5Other Products 2,513 2,348 2,332 -165 -16 -6.6 -0.7Total Products 11,474 11,707 11,955 233 248 2.0 2.1
Demand
Other Non-OECD Despite reports that Indian oil demand growth rose sharply in August, it is important to emphasise that the number is a preliminary estimate and that the data previously had shown a decelerating trend. Indeed, the latest official Indian demand estimate from the Ministry of Petroleum & Natural Gas showed growth of just 165 kb/d y-o-y in July, an eight-month low. Notable slowdowns in gasoil/diesel, residual fuel oil and ‘other products’ led the overall deceleration, a climb-down chiefly attributable to the relatively plentiful monsoon rains (which weakened the agricultural-oil requirement) and softening industrial activity across the economy as a whole. Although preliminary August oil demand data from India’s Petroleum Planning & Analysis Cell (PPAC) show a sharp acceleration in growth, +11.3% y-o-y, the data prior to August showed a clearly ebbing trend. However, two key demand-supports raise the 2016 Indian demand forecast by 25 kb/d compared to last month’s Report: the dramatic acceleration in Indian vehicle sales and rapidly expanding residential LPG sales. At an upwardly revised forecast average of 4.3 mb/d in 2016, the overall Indian demand estimate is expected to expand by 305 kb/d compared to a year earlier. A further gain of 290 kb/d forecast for 2017.
0
100
200
300
400
500
600
Jan-14 Jul-14 Jan-15 Jul-15 Jan-16 Jul-16
kb/d Indian Demand Growth, y-o-y
Gasoline/Jet/Kerosene GasoilFO/naphtha/other LPGTotal
450
500
550
600
650
700
750
JAN APR JUL OCT JAN
kb/d India: LPG Demand
Range 11-15 20152016 5-year avg
Particularly strong gains were seen in Indian LPG, which according to preliminary PPAC August surged by a staggering 115 kb/d compared to the year earlier supported by deliberate government efforts to support cleaner cooking fuels. As part of the government initiative, over 15 million additional homes will be connected to LPG in the fiscal year 2016-17 (April 2016-March 2017), while price subsidies remain for lower-income households and LPG’s use as an alternative road transport fuel continues to expand.

INTERNATIONAL ENERGY AGENCY - OIL MARKET REPORT DEMAND
11 OCTOBER 2016 15
0.3
0.4
0.5
0.6
0.7
JAN APR JUL OCT JAN
mb/d India: Motor Gasoline Demand
Range 11-15 20152016 5-year avg
1.0
1.2
1.4
1.6
1.8
JAN APR JUL OCT JAN
mb/d India: Gasoil/Diesel Demand
Range 11-15 20152016 5-year avg
India’s rapidly expanding vehicle fleet provides further overall demand support, with the Society of Indian Automobile Manufacturers citing for August 16.7% y-o-y growth in wholesale passenger vehicle sales. Gasoline demand growth, at an estimated 25% y-o-y in August, proved particularly buoyant, roughly outpacing diesel 2:1 in percentage terms. The more rapid pace of gasoline demand growth due to sales of two-wheeled vehicles – which are almost always reliant on gasoline (or occasionally LPG) as opposed to diesel – rose by an even larger 26.3% y-o-y, while commercial vehicle sales – which tend to be diesel-powered – inched up by a mere 1.5%. Russian oil product demand surged 170 kb/d y-o-y in August, to 4.1 mb/d, as strong gains in gasoil/diesel, jet/kerosene and ‘other products’ more than offset the continued decline in residual fuel oil deliveries. Growth rose to a fresh five-month high as industrial production inched higher (+0.7% y-o-y) in August, according to data from the Federal State Statistics Service. With Russian oil demand predicted to remain in growth territory in 4Q16, deliveries for the year as a whole should average 3.8 mb/d, 95 kb/d (2.6%) up on the year earlier – this despite an economy hamstrung by outright recession.
3.0
3.2
3.4
3.6
3.8
4.0
4.2
JAN APR JUL OCT JAN
mb/d Russia: Total Products Demand
Range 11-15 20152016 5-year avg
0.4
0.5
0.6
0.7
0.8
JAN APR JUL OCT JAN
mb/d Russia: Gasoil/Diesel Demand
Range 11-15 20152016 5-year avg
Non-OECD: Demand by Region(thousand barrels per day)
1Q16 2Q16 3Q16 2Q16 3Q16 2Q16 3Q16Africa 4,162 4,217 4,127 164 162 4.0 4.1Asia 24,713 24,930 24,473 909 632 3.8 2.7FSU 4,939 4,926 5,320 14 245 0.3 4.8Latin America 6,492 6,675 6,797 -95 -62 -1.4 -0.9Middle East 7,835 8,340 8,678 -122 -66 -1.4 -0.8Non-OECD Europe 676 707 705 33 15 5.0 2.2Total Products 48,817 49,794 50,099 903 926 1.8 1.9
Demand Annual Chg (kb/d) Annual Chg (%)
DEMAND INTERNATIONAL ENERGY AGENCY - OIL MARKET REPORT
16 11 OCTOBER 2016
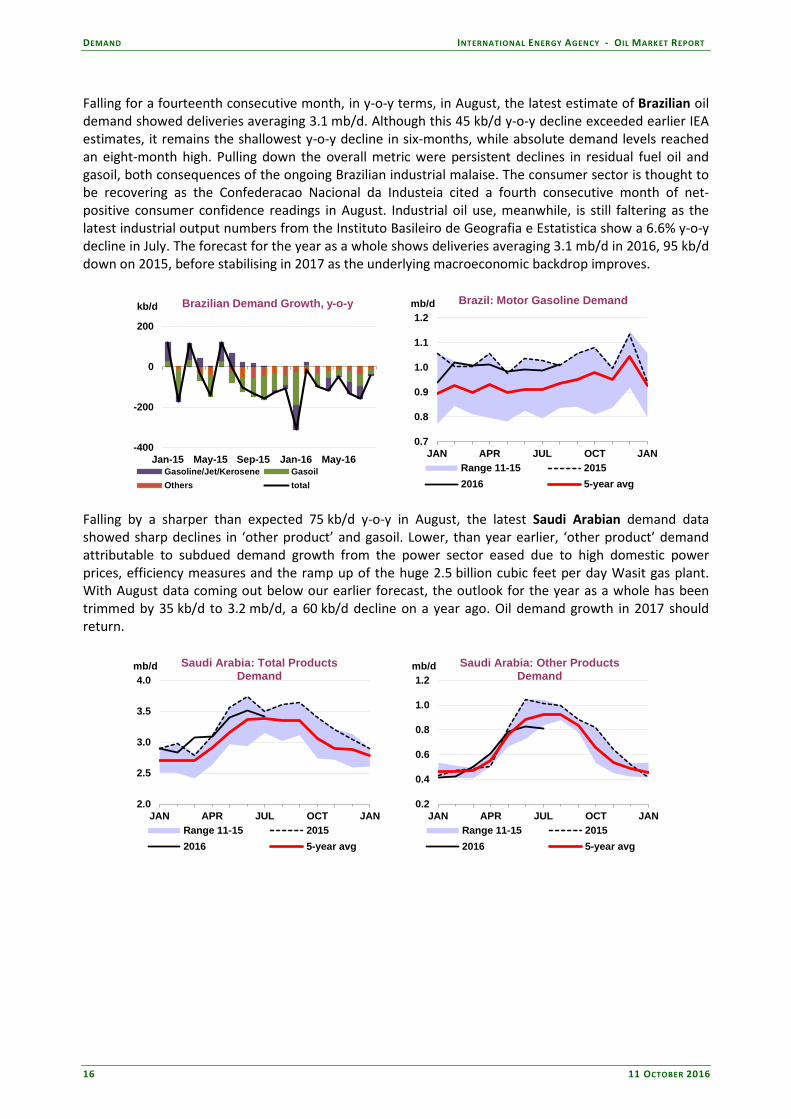
Falling for a fourteenth consecutive month, in y-o-y terms, in August, the latest estimate of Brazilian oil demand showed deliveries averaging 3.1 mb/d. Although this 45 kb/d y-o-y decline exceeded earlier IEA estimates, it remains the shallowest y-o-y decline in six-months, while absolute demand levels reached an eight-month high. Pulling down the overall metric were persistent declines in residual fuel oil and gasoil, both consequences of the ongoing Brazilian industrial malaise. The consumer sector is thought to be recovering as the Confederacao Nacional da Industeia cited a fourth consecutive month of net-positive consumer confidence readings in August. Industrial oil use, meanwhile, is still faltering as the latest industrial output numbers from the Instituto Basileiro de Geografia e Estatistica show a 6.6% y-o-y decline in July. The forecast for the year as a whole shows deliveries averaging 3.1 mb/d in 2016, 95 kb/d down on 2015, before stabilising in 2017 as the underlying macroeconomic backdrop improves.
-400
-200
0
200
Jan-15 May-15 Sep-15 Jan-16 May-16
kb/d Brazilian Demand Growth, y-o-y
Gasoline/Jet/Kerosene GasoilOthers total
0.7
0.8
0.9
1.0
1.1
1.2
JAN APR JUL OCT JAN
mb/d Brazil: Motor Gasoline Demand
Range 11-15 20152016 5-year avg
Falling by a sharper than expected 75 kb/d y-o-y in August, the latest Saudi Arabian demand data showed sharp declines in ‘other product’ and gasoil. Lower, than year earlier, ‘other product’ demand attributable to subdued demand growth from the power sector eased due to high domestic power prices, efficiency measures and the ramp up of the huge 2.5 billion cubic feet per day Wasit gas plant. With August data coming out below our earlier forecast, the outlook for the year as a whole has been trimmed by 35 kb/d to 3.2 mb/d, a 60 kb/d decline on a year ago. Oil demand growth in 2017 should return.
2.0
2.5
3.0
3.5
4.0
JAN APR JUL OCT JAN
mb/d Saudi Arabia: Total Products Demand
Range 11-15 20152016 5-year avg
0.2
0.4
0.6
0.8
1.0
1.2
JAN APR JUL OCT JAN
mb/d Saudi Arabia: Other Products Demand
Range 11-15 20152016 5-year avg

INTERNATIONAL ENERGY AGENCY - OIL MARKET REPORT SUPPLY
11 OCTOBER 2016 17
SUPPLY Summary • Global oil supplies rose by 0.6 mb/d in September to 97.2 mb/d. Non-OPEC production was up by
nearly 0.5 mb/d on higher Russian and Kazakh flows, while OPEC crude output rose to a record high. After hefty declines in August, global oil supply in September was 0.2 mb/d higher than a year ago.
• OPEC crude output rose by 160 kb/d to an all-time high of 33.64 mb/d in September as Iraq pumped at record rates and Libya reopened export terminals. Saudi Arabia, Kuwait and the UAE held supply at or near historic highs, while Iran sustained pre-sanctions levels of close to 3.7 mb/d. Output from the group’s 14 members stood 0.9 mb/d above a year ago due to the strong Middle East performance.
• OPEC has agreed to cut output to between 32.5 mb/d and 33 mb/d – the group’s first deal to reduce supply in eight years – in a bid to speed the market’s rebalancing. Details, including individual country targets, are expected to be finalised when ministers gather at a scheduled meeting on 30 November. Libya, Nigeria and Iran are said to be exempt from supply cuts.
• Production from non-OPEC surged by nearly 0.5 mb/d in September to 56.6 mb/d as Russian crude
output soared to a post-Soviet high and Kazakh volumes recovered from maintenance. September production was nevertheless 0.9 mb/d below a year ago due to sharp declines in the US and China.
• Non-OPEC supply is forecast to decline by 0.9 mb/d in 2016 before rebounding by 0.4 mb/d in 2017,
largely unchanged from last month’s Report.
-2.0-1.5-1.0-0.50.00.51.01.52.02.53.03.54.04.5
Jan 14 Jul 14 Jan 15 Jul 15 Jan 16 Jul 16
mb/dOPEC and Non-OPEC Oil Supply
Year-on-Year Change
OPEC Crude Non-OPECOPEC NGLs Total Supply
-2.0-1.5-1.0-0.50.00.51.01.52.0
Jan 14Jun 14Nov 14Apr 15Sep 15Feb 16 Jul 16
mb/d OPEC Growth y-o-y
Other OPEC Iraq Saudi ArabiaIran OPEC
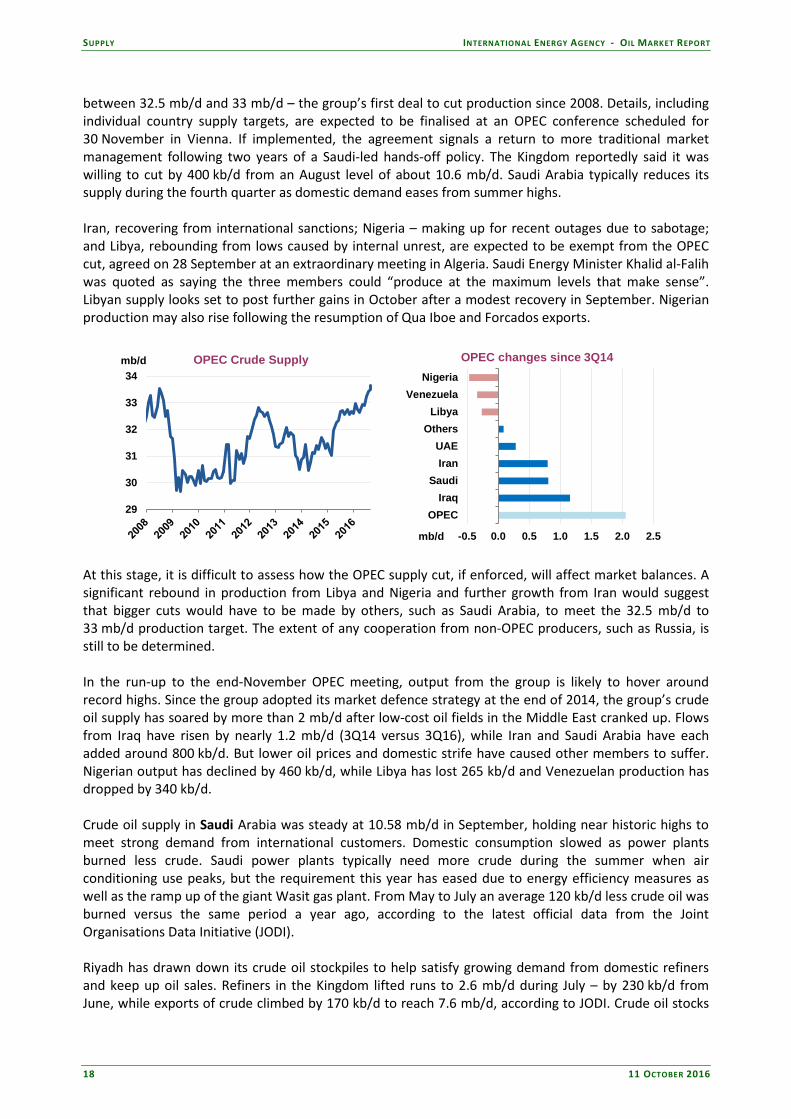
All world oil supply data for September discussed in this report are IEA estimates. Estimates for OPEC countries, Alaska, Mexico and Russia are supported by preliminary September supply data. OPEC crude oil supply OPEC crude oil output climbed to its highest ever in September – by 160 kbd/ to 33.64 mb/d - after Iraqi production rose to record levels and Libyan flows began to recover. Supply from Iraq – including the Kurdistan Regional Government (KRG) - rose by 90 kb/d to 4.46 mb/d after Baghdad and the KRG resumed joint exports from the northern Kirkuk oil field and southern fields ramped up. Libyan flows increased to 350 kb/d after previously blockaded export terminals reopened. Saudi Arabia, the UAE and Kuwait continued to pump at or near all-time highs. Supply from Iran edged up to 3.67 mb/d – slightly above its average 2011 pre-sanctions level. With the Middle East keeping up a brisk production pace, output from the group’s 14 members stood 910 kb/d above a year ago. In a bid to hasten the market’s return to balance, OPEC ministers have agreed to lower output to
SUPPLY INTERNATIONAL ENERGY AGENCY - OIL MARKET REPORT
18 11 OCTOBER 2016
between 32.5 mb/d and 33 mb/d – the group’s first deal to cut production since 2008. Details, including individual country supply targets, are expected to be finalised at an OPEC conference scheduled for 30 November in Vienna. If implemented, the agreement signals a return to more traditional market management following two years of a Saudi-led hands-off policy. The Kingdom reportedly said it was willing to cut by 400 kb/d from an August level of about 10.6 mb/d. Saudi Arabia typically reduces its supply during the fourth quarter as domestic demand eases from summer highs. Iran, recovering from international sanctions; Nigeria – making up for recent outages due to sabotage; and Libya, rebounding from lows caused by internal unrest, are expected to be exempt from the OPEC cut, agreed on 28 September at an extraordinary meeting in Algeria. Saudi Energy Minister Khalid al-Falih was quoted as saying the three members could “produce at the maximum levels that make sense”. Libyan supply looks set to post further gains in October after a modest recovery in September. Nigerian production may also rise following the resumption of Qua Iboe and Forcados exports.
29
30
31
32
33
34mb/d OPEC Crude Supply
-0.5 0.0 0.5 1.0 1.5 2.0 2.5
OPECIraq
SaudiIranUAE
OthersLibya
VenezuelaNigeria
mb/d
OPEC changes since 3Q14
At this stage, it is difficult to assess how the OPEC supply cut, if enforced, will affect market balances. A significant rebound in production from Libya and Nigeria and further growth from Iran would suggest that bigger cuts would have to be made by others, such as Saudi Arabia, to meet the 32.5 mb/d to 33 mb/d production target. The extent of any cooperation from non-OPEC producers, such as Russia, is still to be determined. In the run-up to the end-November OPEC meeting, output from the group is likely to hover around record highs. Since the group adopted its market defence strategy at the end of 2014, the group’s crude oil supply has soared by more than 2 mb/d after low-cost oil fields in the Middle East cranked up. Flows from Iraq have risen by nearly 1.2 mb/d (3Q14 versus 3Q16), while Iran and Saudi Arabia have each added around 800 kb/d. But lower oil prices and domestic strife have caused other members to suffer. Nigerian output has declined by 460 kb/d, while Libya has lost 265 kb/d and Venezuelan production has dropped by 340 kb/d. Crude oil supply in Saudi Arabia was steady at 10.58 mb/d in September, holding near historic highs to meet strong demand from international customers. Domestic consumption slowed as power plants burned less crude. Saudi power plants typically need more crude during the summer when air conditioning use peaks, but the requirement this year has eased due to energy efficiency measures as well as the ramp up of the giant Wasit gas plant. From May to July an average 120 kb/d less crude oil was burned versus the same period a year ago, according to the latest official data from the Joint Organisations Data Initiative (JODI). Riyadh has drawn down its crude oil stockpiles to help satisfy growing demand from domestic refiners and keep up oil sales. Refiners in the Kingdom lifted runs to 2.6 mb/d during July – by 230 kb/d from June, while exports of crude climbed by 170 kb/d to reach 7.6 mb/d, according to JODI. Crude oil stocks

INTERNATIONAL ENERGY AGENCY - OIL MARKET REPORT SUPPLY
11 OCTOBER 2016 19
fell to 282 million barrels in July from 289 million barrels the previous month. Outside of the Kingdom, Saudi Aramco is considering potential sites for crude oil storage in China in a bid to increase flexibility of supply to its customers in Asia. Aramco was China’s second biggest crude supplier in August, with sales of roughly 1 mb/d.
9.00
9.25
9.50
9.75
10.00
10.25
10.50
10.75
Jan Mar May Jul Sep Nov Jan
mb/d Saudi Arabia Crude Supply
2013 2014 2015 2016
-40%-30%-20%-10%0%10%20%30%40%50%60%
0100200300400500600700800900
Jun-14 Dec-14 Jun-15 Dec-15 Jun-16
kb/d Saudi Implied Crude Oil Direct Burn
Implied crude burn % Chg vs year ago Despite its robust exports and financial reserves, Saudi Arabia is also feeling the strain of lower oil prices. It announced a 20% cut in ministers’ salaries on 26 September and reduced benefits for workers in the public sector.
Jul 2016 Aug 2016 Sep 2016 YTD AverageSupply Supply Supply Supply
Algeria 1.11 1.11 1.12 1.12 0.00 1.10
Angola 1.76 1.76 1.74 1.78 0.04 1.75
Ecuador 0.55 0.55 0.55 0.55 0.00 0.55
Gabon 0.22 0.21 0.21 0.21 0.00 0.22
Indonesia 0.74 0.74 0.74 0.74 0.00 0.73
Iran 3.63 3.64 3.67 3.70 0.03 3.46
Iraq 4.32 4.37 4.46 4.50 0.04 4.32
Kuwait2 2.87 2.91 2.90 2.91 0.01 2.85
Libya 0.30 0.28 0.35 0.40 0.05 0.33
Nigeria 1.39 1.43 1.45 1.70 0.25 1.55
Qatar 0.66 0.65 0.64 0.67 0.03 0.66
Saudi Arabia2 10.65 10.60 10.58 12.20 1.62 10.38
UAE 3.08 3.09 3.10 3.10 0.00 2.97
Venezuela 2.15 2.14 2.13 2.20 0.07 2.24
Total OPEC 33.43 33.48 33.64 35.78 2.14 33.11
(excluding Iraq, Nigeria, Libya) 1.80
1 Capacity levels can be reached within 90 days and sustained for an extended period.
2 Includes half of Neutral Zone production.
Sustainable Production Capacity1
Spare Capacity vs Sep 2016 Supply
OPEC Crude Production(million barrels per day)
Neighbouring Gulf countries Kuwait and the UAE continued to pump at record rates during September. Kuwaiti production held at 2.90 mb/d and supply from the UAE was steady at 3.10 mb/d. In a bid to cut costs and raise upstream profits, Abu Dhabi National Oil Co (Adnoc) has announced plans to merge its two offshore operating companies into a single unit. The move, due to take place by early 2018, will not affect the international partners in the concessions. The operations of Abu Dhabi Marine Operating Co (Adma-Opco), in which BP, Total and Jodco have stakes, are to be combined with Zakum Development Co (Zadco), a joint venture with ExxonMobil and Jodco. Zadco is expanding Upper Zakum, one of the world’s largest offshore oil fields, to 750 kb/d by 2018 from just under 700 kb/d. Adma-Opco is tapping

SUPPLY INTERNATIONAL ENERGY AGENCY - OIL MARKET REPORT
20 11 OCTOBER 2016
Lower Zakum, which was expected to reach 425 kb/d this year. In Qatar, output inched down to 640 kb/d due to scheduled maintenance at al-Shaheen, the country’s largest offshore oil field. Output from Iran, OPEC’s fastest source of 2016 supply growth, rose to 3.67 mb/d in September – up 760 kb/d since the start of the year when sanctions were eased. Shipments of crude oil rose above 2.3 mb/d, according to preliminary figures, the rate at which Iran was exporting before sanctions were tightened in mid-2012. Since May, the National Iranian Oil Co (NIOC) has been shipping more than 2 mb/d of crude – double the volume under sanctions. Exports to Europe rose to about 620 kb/d during August to reach pre-sanctions levels. Crude oil sales appear to have slipped to around 500 kb/d in September, although tanker tracking data are subject to revision.
2.4
2.6
2.8
3.0
3.2
3.4
3.6
3.8
Jan Mar May Jul Sep Nov Jan
mb/d Iran Crude Supply
2013 2014 2015 2016
0.0
0.5
1.0
1.5
2.0
2.5
Jan 14 Jul 14 Jan 15 Jul 15 Jan 16 Jul 16
mb/d Iran crude oil loadings
China India Korea Japan Europe Other
Source: Lloyd's List IntelligenceSource: Lloyd's List Intelligence
As for Asia, purchases from China, Iran’s biggest customer, rose to 690 kb/d in September from 570 kb/d the previous month. Loadings to India and Japan held steady at around 620 kb/d and 215 kb/d, respectively. Exports to South Korea climbed to just shy of 200 kb/d from 96 kb/d in August. Shipments of ultra-light oil from Iran’s South Pars gas project rose to 260 kb/d from 210 kb/d kb/d during August. Volumes of condensate stored at sea declined by 2 million barrels in September to 40 million barrels. In a bid to lure back foreign investors and boost production, Iran has signed the first oil deal under its new Iran Petroleum Contract (IPC) with a local company. The deal with Persia Oil and Gas Industry Development Co (POGIDC) to boost production at the Yaran, Koupal and Maroon oil fields to at least 260 kb/d is worth an estimated $2.2 billion. Iraqi crude production rose by 90 kb/d to a record 4.46 mb/d during September after Baghdad and the KRG resumed joint exports from Kirkuk in the north and southern oil fields cranked up to satisfy increased requirements at home and abroad. Overall exports, including from the KRG rose to 3.85 mb/d – up 125 kb/d on August – with northern shipments surging by 110 kb/d to 600 kb/d. Iraq’s North Oil Co (NOC) resumed pumping crude from fields it operates in Kirkuk in mid-August following a five-month halt. Baghdad and the autonomous northern region have agreed to split the proceeds from federally controlled Kirkuk oil. Shipments from NOC during September reached around 100 kb/d. It had been routing around 150
0.00.51.01.52.02.53.03.54.04.5
Jun-14 Dec-14 Jun-15 Dec-15 Jun-16
mb/d Iraq Production and Exports
Basra exports Northern exportsProduction

INTERNATIONAL ENERGY AGENCY - OIL MARKET REPORT SUPPLY
11 OCTOBER 2016 21
kb/d of Kirkuk through the KRG’s pipeline to Turkey since mid-2014, when militants from the Islamic State of Iraq and the Levant (ISIL) sabotaged the federal export pipeline to Turkey. The KRG took control of the 170 kb/d Bai Hassan field and Kirkuk’s Avana dome in June 2014 after the ISIL advanced through northern Iraq. NOC remains in control of Kirkuk’s Baba dome and the adjacent Jambour field. Baghdad has meanwhile issued a 2017 budget forecast that assumes higher exports and prices. Iraq expects to ship 3.75 mb/d of crude at a price of $42/bbl. The federal government exported 3.28 mb/d in September, selling at an average price of $38.89/bbl. Output in Libya rose by 70 kb/d to 350 kb/d in September after the ports of Es Sider, Ras Lanuf and Zueitina reopened and allowed for higher production. Flows had risen above 500 kb/d by early October, which suggests a further recovery this month. Libya’s Arabian Gulf Oil Co (Agoco), a unit of the National Oil Corp (NOC) operates the eastern fields that feed the strategic ports. Agoco output had climbed above 300 kb/d by early October. Ras Lanuf and Es Sider - shut since December 2014 and damaged by repeated attacks by Islamist militants - can ship nearly 600 kb/d between them. Zueitina can handle about 150 kb/d. Two years of conflict and oil sector attacks have led to the repeated shutdown and restart of terminals and oil fields. As a result, Libya is now pumping only a fraction of the 1.6 mb/d produced before the fall of the Gaddafi regime. NOC, which is aiming for output of 900 kb/d by the end of the year, is also negotiating with local groups to restart the major oil fields of El Sharara and El Feel, which before the shutdowns had the capacity to produce 450 kb/d between them.
0.0
0.5
1.0
1.5
2.0
2011 2012 2013 2014 2015 2016
mb/d Libya Crude Supply
1.2
1.4
1.6
1.8
2.0
2.2
2.4
2011 2012 2013 2014 2015 2016
mb/d Nigeria Crude Supply
Output in Nigeria inched up to 1.45 mb/d in September after force majeure was lifted on Bonny Light exports. Output could rebound in October after the resumption of exports from Qua Iboe and Forcados. A fragile ceasefire is in place between the government and rebel militants who are attacking oil pipelines and facilities in the Niger Delta. Repeated sabotage of Nigeria’s oil sector since February has cut output to near 30-year lows. The Exxon-operated 330 kb/d Qua Iboe system, Nigeria’s biggest stream, was hit in July and the Shell-operated Forcados export pipeline was bombed in mid-February, closing in more than 200 kb/d. Repair of the subsea Forcados pipeline was completed by the end of September. Angolan production dipped to 1.74 mb/d after the offshore Plutonio oil field was shut for maintenance for part of September. Further declines are expected in October due to a scheduled overhaul on the Dalia field. Exports of Dalia, which typically run at around 200 kb/d, are expected to stop during the full field maintenance. Output in Gabon held steady at around 210 kb/d. Output was similarly stable in Indonesia and Ecuador at 740 kb/d and 550 kb/d, respectively. In

SUPPLY INTERNATIONAL ENERGY AGENCY - OIL MARKET REPORT
22 11 OCTOBER 2016
Indonesia, the government may allow ExxonMobil to pump more from its Banyu Urip oil field in 2017 in order to meet a higher national oil output target. The plan to raise crude and condensate output to 815 kb/d would allow for Exxon to produce 200 kb/d from Banyu Urip. Output from the field is now around 165 kb/d. Venezuelan production inched down to 2.13 mb/d – continuing its steady decline due to the country’s acute economic crisis. In a bid to arrest the decline, Petroleos de Venezuela (PDVSA) plans to drill 480 wells in the extra heavy Orinoco Belt in the next 30 months. Schlumberger and other international oil companies are reportedly expected to take part in the $3.2 billion effort to raise output by 250 kb/d. Caracas has hoped to boost production from the vast Orinoco Belt, which accounts for about half the country’s output, in order to counter losses from mature oil fields. Non-OPEC overview Non-OPEC oil supply bounced nearly 0.5 mb/d higher in September to 56.6 mb/d, albeit from a downwardly revised August estimate. Following maintenance in August, Russian crude and condensate production surged by 0.4 mb/d to a post-Soviet high above 11.1 mb/d. Kazakh output also recovered from a steeper-than-expected cut during maintenance. Overall non-OPEC output in 2016 is forecast to decline by 0.9 mb/d to 56.6 mb/d, before rising by 0.4 mb/d in 2017.
-1.5-1.0-0.50.00.51.01.52.02.53.0
1Q13 1Q14 1Q15 1Q16 1Q17
mb/d
Other North America Total
Total Non-OPEC Supply, y-o-y Change
54
55
56
57
58
59
Jan Mar May Jul Sep Nov Jan
mb/d Non-OPEC Total Oil Supply
2014 20152016 2016 forecast2017 forecast
During September, however, total non-OPEC output stood 0.9 mb/d below a year ago. Chinese crude oil production continued to fall, to reach a six-year low of just under 3.9 mb/d in August. Year-on-year declines have now ratcheted up to around 400 kb/d, or roughly -9%, as major oil companies cut spending and shut in un-economic wells. While output appears to be in freefall, we believe the pace of decline will slow during the remainder of the year. Indeed, updated production targets suggest 2H16 output roughly 170 kb/d below the first six months of the year, in line with our current estimate. Colombian crude output has also continued on its downward path, with the latest ministry data pegging output at 830 kb/d in August, 140 kb/d lower than the same month in 2015. Declines also took place in the North Sea, where production came off a July peak. Seasonal maintenance and unscheduled outages took around 360 kb/d off line in August and loading schedules suggest the reduced levels will continue through October. In the US, while output held up better than expected in July – the latest month for which official data are available – crude oil production dropped below 8.7 mb/d, its lowest since May 2014 and more than 0.7 mb/d below 2015. Independent producers are reportedly benefitting from oil’s recent rally and are hedging output for 2017. Nevertheless, the pace of new rig additions slowed over September, but may pick up as operators take a more constructive view of the market. US independent producers will be watching the progress of discussions in the run up to the 30 November OPEC meeting. The possibility of

INTERNATIONAL ENERGY AGENCY - OIL MARKET REPORT SUPPLY
11 OCTOBER 2016 23
a coordinated production cut and a price increase may influence their investment decisions for 2017. Canadian output was also slightly higher than expected in July, with Albertan oil supply recovering fast from outages in May. Total output rose by 500 kb/d to 4.35 mb/d, only 150 kb/d less than a year ago.
2015 1Q16 2Q16 3Q16 4Q16 2016 1Q17 2Q17 3Q17 4Q17 2017
Americas 20.0 19.9 19.0 19.1 19.3 19.3 19.4 19.4 19.5 19.5 19.4Europe 3.5 3.6 3.4 3.4 3.5 3.5 3.5 3.4 3.3 3.4 3.4Asia Oceania 0.5 0.4 0.4 0.4 0.4 0.4 0.4 0.4 0.4 0.5 0.4Total OECD 23.9 24.0 22.8 23.0 23.2 23.2 23.3 23.2 23.2 23.3 23.3Former USSR 14.0 14.2 14.0 14.0 14.2 14.1 14.3 14.3 14.2 14.4 14.3Europe 0.1 0.1 0.1 0.1 0.1 0.1 0.1 0.1 0.1 0.1 0.1China 4.3 4.2 4.1 3.9 3.9 4.0 4.0 3.9 3.9 3.9 3.9Other Asia 2.8 2.8 2.7 2.7 2.7 2.7 2.6 2.6 2.7 2.6 2.6Latin America 4.6 4.4 4.4 4.5 4.6 4.5 4.6 4.7 4.7 4.8 4.7Middle East 1.3 1.3 1.3 1.3 1.3 1.3 1.3 1.3 1.3 1.2 1.3Africa 2.1 2.0 1.9 2.0 2.1 2.0 2.1 2.1 2.1 2.1 2.1Total Non-OECD 29.1 28.9 28.5 28.6 28.9 28.8 29.0 29.0 29.0 29.1 29.1Processing Gains 2.2 2.3 2.3 2.3 2.3 2.3 2.3 2.3 2.3 2.3 2.3Global Biofuels 2.3 1.9 2.4 2.8 2.4 2.4 2.0 2.5 2.9 2.5 2.5Total Non-OPEC 57.6 57.0 56.1 56.6 56.8 56.6 56.6 57.0 57.4 57.2 57.1Annual Chg (mb/d) 1.4 -0.2 -1.3 -1.1 -1.2 -0.9 -0.5 1.0 0.8 0.4 0.4Changes from last OMR (mb/d) 0.1 0.0 0.0 0.0 -0.2 0.0 0.0 0.0 0.1 -0.1 0.0
Non-OPEC Supply(million barrels per day)
OECD North America US – July actual, Alaska – September preliminary: US crude oil production held up better than expected in July, dipping only 20 kb/d from a month earlier to just below 8.7 mb/d. Preliminary weekly data had suggested output slipped by 150 kb/d in July and the EIA’s Drilling Productivity Report also showed larger output declines in major shale plays. LTO output is showing resilience, however, with only minor declines recorded in Texas and Oklahoma and production inching up in North Dakota and Colorado. The biggest month-on-month decline came from Alaska, which was 30 kb/d lower.
10.5
11.0
11.5
12.0
12.5
13.0
13.5
Jan Mar May Jul Sep Nov Jan
mb/d United States Total Oil Supply
2014 20152016 2016 forecast2017 forecast
-1.5-1.0-0.50.00.51.01.52.0
1Q13 1Q14 1Q15 1Q16 1Q17
mb/d US Total Oil Supply - Yearly Change
Alaska California TexasGulf of Mexico NGLs North DakotaOther Total
Gulf of Mexico crude production also inched up by around 15 kb/d in July to 1.56 mb/d – roughly on par with a year ago. Following ExxonMobil’s Julia development start-up in April, the Noble Energy-operated Gunflint came on line in July. In September, Shell reported the Turitella FPSO had achieved first oil at its Stones project. It is only the second FPSO-based development in the US Gulf and the world’s deepest-water production facility, at about 9 500 feet. The project is expected to ramp up towards its 50 kb/d estimated peak production capacity towards the end of next year.
SUPPLY INTERNATIONAL ENERGY AGENCY - OIL MARKET REPORT
24 11 OCTOBER 2016
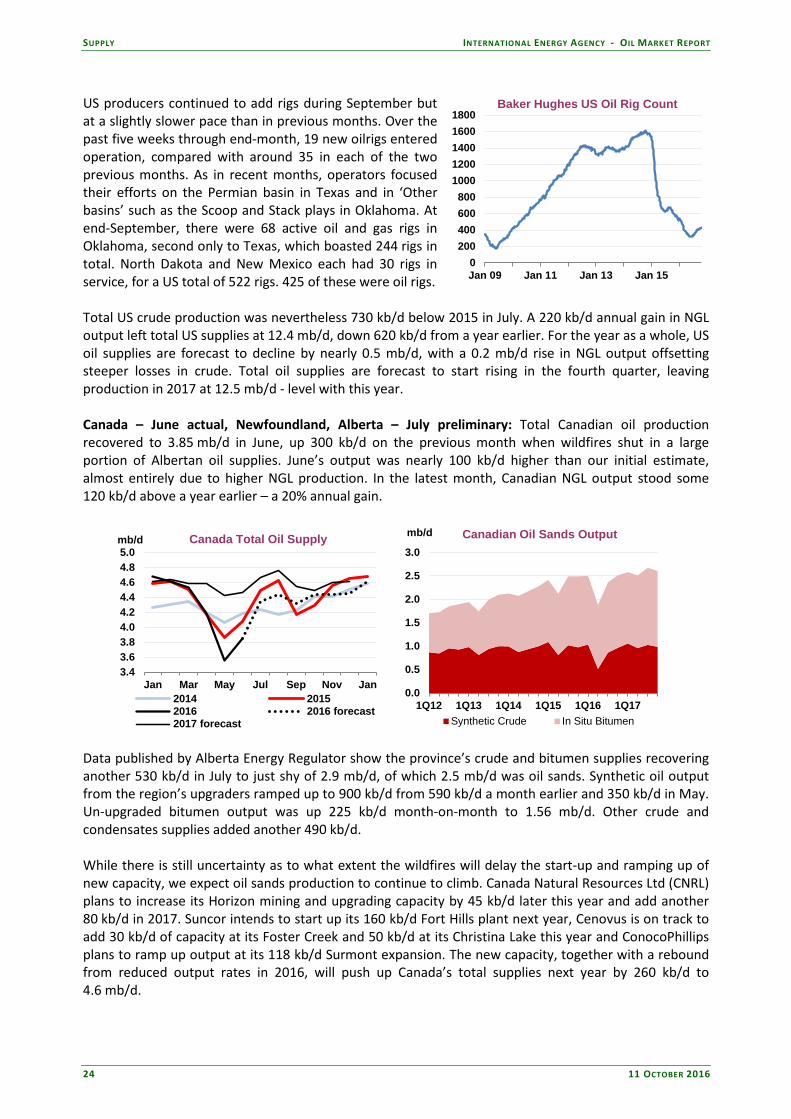
US producers continued to add rigs during September but at a slightly slower pace than in previous months. Over the past five weeks through end-month, 19 new oilrigs entered operation, compared with around 35 in each of the two previous months. As in recent months, operators focused their efforts on the Permian basin in Texas and in ‘Other basins’ such as the Scoop and Stack plays in Oklahoma. At end-September, there were 68 active oil and gas rigs in Oklahoma, second only to Texas, which boasted 244 rigs in total. North Dakota and New Mexico each had 30 rigs in service, for a US total of 522 rigs. 425 of these were oil rigs. Total US crude production was nevertheless 730 kb/d below 2015 in July. A 220 kb/d annual gain in NGL output left total US supplies at 12.4 mb/d, down 620 kb/d from a year earlier. For the year as a whole, US oil supplies are forecast to decline by nearly 0.5 mb/d, with a 0.2 mb/d rise in NGL output offsetting steeper losses in crude. Total oil supplies are forecast to start rising in the fourth quarter, leaving production in 2017 at 12.5 mb/d - level with this year. Canada – June actual, Newfoundland, Alberta – July preliminary: Total Canadian oil production recovered to 3.85 mb/d in June, up 300 kb/d on the previous month when wildfires shut in a large portion of Albertan oil supplies. June’s output was nearly 100 kb/d higher than our initial estimate, almost entirely due to higher NGL production. In the latest month, Canadian NGL output stood some 120 kb/d above a year earlier – a 20% annual gain.
3.43.63.84.04.24.44.64.85.0
Jan Mar May Jul Sep Nov Jan
mb/d Canada Total Oil Supply
2014 20152016 2016 forecast2017 forecast
0.0
0.5
1.0
1.5
2.0
2.5
3.0
1Q12 1Q13 1Q14 1Q15 1Q16 1Q17
mb/d Canadian Oil Sands Output
Synthetic Crude In Situ Bitumen Data published by Alberta Energy Regulator show the province’s crude and bitumen supplies recovering another 530 kb/d in July to just shy of 2.9 mb/d, of which 2.5 mb/d was oil sands. Synthetic oil output from the region’s upgraders ramped up to 900 kb/d from 590 kb/d a month earlier and 350 kb/d in May. Un-upgraded bitumen output was up 225 kb/d month-on-month to 1.56 mb/d. Other crude and condensates supplies added another 490 kb/d. While there is still uncertainty as to what extent the wildfires will delay the start-up and ramping up of new capacity, we expect oil sands production to continue to climb. Canada Natural Resources Ltd (CNRL) plans to increase its Horizon mining and upgrading capacity by 45 kb/d later this year and add another 80 kb/d in 2017. Suncor intends to start up its 160 kb/d Fort Hills plant next year, Cenovus is on track to add 30 kb/d of capacity at its Foster Creek and 50 kb/d at its Christina Lake this year and ConocoPhillips plans to ramp up output at its 118 kb/d Surmont expansion. The new capacity, together with a rebound from reduced output rates in 2016, will push up Canada’s total supplies next year by 260 kb/d to 4.6 mb/d.
0200400600800
10001200140016001800
Jan 09 Jan 11 Jan 13 Jan 15
Baker Hughes US Oil Rig Count
INTERNATIONAL ENERGY AGENCY - OIL MARKET REPORT SUPPLY
11 OCTOBER 2016 25
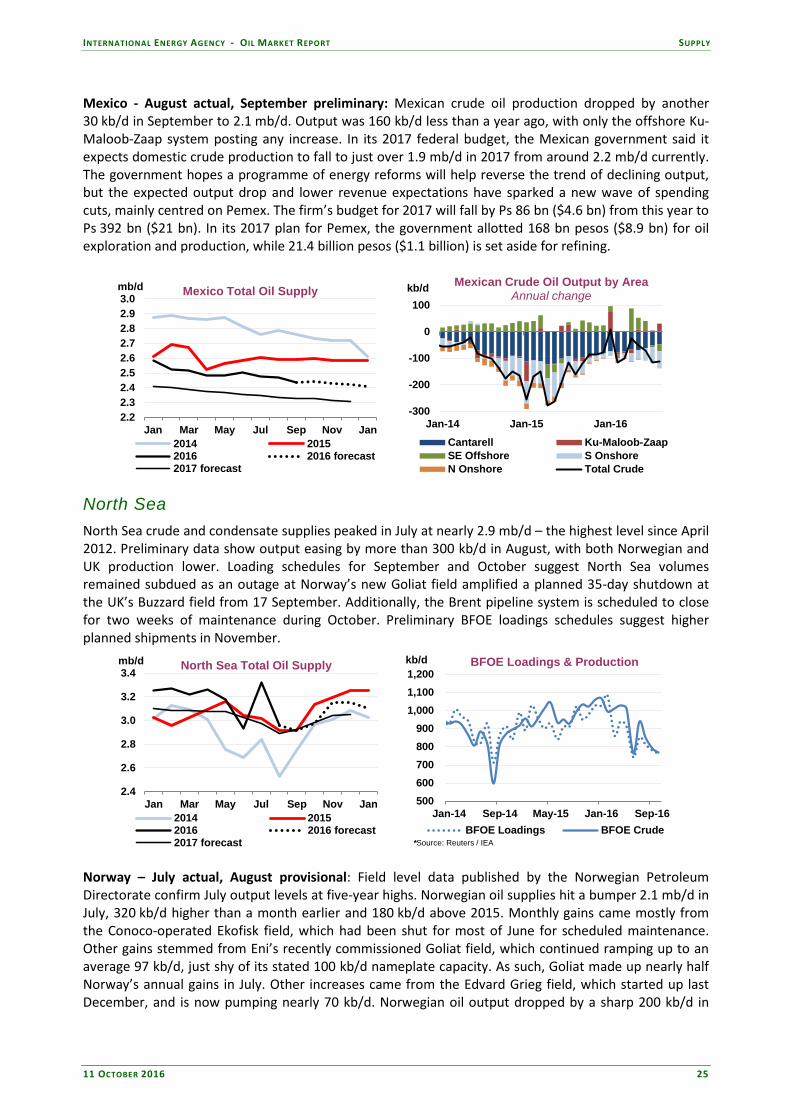
Mexico - August actual, September preliminary: Mexican crude oil production dropped by another 30 kb/d in September to 2.1 mb/d. Output was 160 kb/d less than a year ago, with only the offshore Ku-Maloob-Zaap system posting any increase. In its 2017 federal budget, the Mexican government said it expects domestic crude production to fall to just over 1.9 mb/d in 2017 from around 2.2 mb/d currently. The government hopes a programme of energy reforms will help reverse the trend of declining output, but the expected output drop and lower revenue expectations have sparked a new wave of spending cuts, mainly centred on Pemex. The firm’s budget for 2017 will fall by Ps 86 bn ($4.6 bn) from this year to Ps 392 bn ($21 bn). In its 2017 plan for Pemex, the government allotted 168 bn pesos ($8.9 bn) for oil exploration and production, while 21.4 billion pesos ($1.1 billion) is set aside for refining.
2.22.32.42.52.62.72.82.93.0
Jan Mar May Jul Sep Nov Jan
mb/d Mexico Total Oil Supply
2014 20152016 2016 forecast2017 forecast
-300
-200
-100
0
100
Jan-14 Jan-15 Jan-16
kb/d Mexican Crude Oil Output by AreaAnnual change
Cantarell Ku-Maloob-ZaapSE Offshore S OnshoreN Onshore Total Crude
North Sea North Sea crude and condensate supplies peaked in July at nearly 2.9 mb/d – the highest level since April 2012. Preliminary data show output easing by more than 300 kb/d in August, with both Norwegian and UK production lower. Loading schedules for September and October suggest North Sea volumes remained subdued as an outage at Norway’s new Goliat field amplified a planned 35-day shutdown at the UK’s Buzzard field from 17 September. Additionally, the Brent pipeline system is scheduled to close for two weeks of maintenance during October. Preliminary BFOE loadings schedules suggest higher planned shipments in November.
2.4
2.6
2.8
3.0
3.2
3.4
Jan Mar May Jul Sep Nov Jan
mb/d North Sea Total Oil Supply
2014 20152016 2016 forecast2017 forecast
500600700800900
1,0001,1001,200
Jan-14 Sep-14 May-15 Jan-16 Sep-16
BFOE Loadings & Production
BFOE Loadings BFOE Crude*Source: Reuters / IEA
kb/d
Norway – July actual, August provisional: Field level data published by the Norwegian Petroleum Directorate confirm July output levels at five-year highs. Norwegian oil supplies hit a bumper 2.1 mb/d in July, 320 kb/d higher than a month earlier and 180 kb/d above 2015. Monthly gains came mostly from the Conoco-operated Ekofisk field, which had been shut for most of June for scheduled maintenance. Other gains stemmed from Eni’s recently commissioned Goliat field, which continued ramping up to an average 97 kb/d, just shy of its stated 100 kb/d nameplate capacity. As such, Goliat made up nearly half Norway’s annual gains in July. Other increases came from the Edvard Grieg field, which started up last December, and is now pumping nearly 70 kb/d. Norwegian oil output dropped by a sharp 200 kb/d in

SUPPLY INTERNATIONAL ENERGY AGENCY - OIL MARKET REPORT
26 11 OCTOBER 2016
August, however, even before the Goliat field had to be shut due to a power outage and subsequent security issues. The field, which was closed for about one month, finally restarted on 27 September.
1.6
1.7
1.8
1.9
2.0
2.1
2.2
Jan Mar May Jul Sep Nov Jan
mb/d Norway Total Oil Supply
2014 20152016 2016 forecast2017 forecast
400500600700800900
100011001200
Jan Mar May Jul Sep Nov Jan
kb/d United Kingdom Total Oil Supply
2014 20152016 2016 forecast2017 forecast
UK – July actual, August preliminary: UK crude and condensate output dropped by 150 kb/d in August to 820 kb/d, according to preliminary data published through the Joint Oil Data Initiative (JODI). Total oil output was 900 kb/d, largely in line with our forecast in last month’s Report, and roughly 45 kb/d higher than in 2015. By contrast, total oil production for July was revised 50 kb/d higher to 1 074 kb/d – up some 150 kb/d from a year ago. Production is forecast to have fallen further in September, when the country’s largest field, the Nexen-operated Buzzard field, shut for a month-long maintenance. Buzzard produced 170 kb/d on average during 1H16. The shutdown cut Forties loadings to 280 kb/d in September and 339 kb/d in October compared with 368 kb/d in August. Non-OECD Latin America Brazil – August actual: Brazilian crude oil production continued to climb in August, reaching a high of 2.609 mb/d – some 28 kb/d more than the previous record in July and in line with our forecast. Production at Lula, the country’s largest oil field, ramped up to 580 kb/d - nearly double the levels seen just over a year ago. Output is expected to rise further this year as Petrobras ramps up production from new units and commissions an 80 kb/d Floating Production, Storage and Offloading unit (FPSO) at its Lapa field.
2.0
2.2
2.4
2.6
2.8
3.0
3.2
Jan Mar May Jul Sep Nov Jan
mb/d Brazil Total Oil Supply
2014 20152016 2016 forecast2017 forecast
0.0
0.5
1.0
1.5
2.0
2.5
3.0
Jan-08 Jan-10 Jan-12 Jan-14 Jan-16
mb/d Brazilian Oil Production by Area
Campos Basin Santos BasinOther Offshore Onshore
In an effort to curb its massive debt and revive investor confidence, Petrobras cut its planned investment for the next five years by 25% to the lowest level in a decade. With $124 bn of gross debt at the end of June, Petrobras now ranks as the world’s most heavily-indebted oil company. In an updated five-year plan released in September, Petrobras said it would cut its capital expenditure to $74.1 bn for the 2017-2021 period compared with the previous 2015-19 plan of $98.4 bn.

INTERNATIONAL ENERGY AGENCY - OIL MARKET REPORT SUPPLY
11 OCTOBER 2016 27
The company says the latest capex reduction does not materially impact its production curve, as most of the investments underpinning growth to 2021 have already been made. Petrobras is aiming to lift output to 2.77 mb/d in 2021, bringing on as many as 19 production systems in the Santos and Campos basins over the next five years. The company did warn, however, that output could drop in the near term, due to high natural declines in mature fields in the Campos basin and from the potential divestment of some producing assets. Petrobras reaffirmed its earlier plan to complete the sale of $15.1 billion worth of assets for 2015-2016. It also plans to sell an additional $19.5 billion in assets over 2017-2018. In the meantime, Petrobras is making progress at reducing costs and improving efficiency, especially in managing offshore well construction and completion. The company said in its latest investor update that over the past six years, it has reduced the average time of drilling new wells from 310 days to 89 days, while improving pre-salt productivity per well from 20 kb/d to 26 kb/d. At the same time, lifting costs in the pre-salt have fallen from $14.6 per barrels of oil equivalent (boe) in 2014 to $11/boe this year. Petrobras expects lifting costs to reach $9.6/boe on average during 2017-2021. While Petrobras is funneling most of its capital into the pre-salt area, it recognises the need for increased efforts in the Campos basin. Capital spending for existing Campos basin wells has taken a bigger hit from the downturn, but the 2017-2021 business plan lowered the decline rate estimate to 9% a year from 12%-15%. Petrobras is aiming to secure partnerships in the Campos basin, especially to revive output in the Marlim field, and recently signed a deal with Statoil to collaborate on existing fields. The company is also negotiating with Karoon Gas Australia the sale of its participation in the Baúna (100%) and Tartaruga (50%) fields, in the Santos and Campos Basins, respectively. In early October, Brazil's lower chamber of Congress approved the main points of a bill removing a requirement that Petrobras be the sole operator of subsalt projects with a minimum 30% stake in their development. The bill, which has already been approved by the Senate, is aimed at boosting private investment in Brazil's oil industry. Petrobras currently accounts for around 84% of Brazil’s total production. In the near term, we expect total Brazilian production to increase by 75 kb/d in 2016 and rise by 290 kb/d to 2.9 mb/d next year. Colombia – August actual: Colombia produced an average of 830 kb/d of crude oil in August, according to the latest government figures. Crude supplies were down a hefty 140 kb/d - or 15% - from a year ago when output stood at 970 kb/d. While sharp capex cuts are clearly taking a toll, Ecopetrol - which produces more than half the country’s oil - stated it is planning to intensify drilling in the second half of the year to stem declines. We have nevertheless cut our projections for the remainder of the year and for 2017 by a further 30 kb/d since last month’s Report. Under our forecast, Colombian oil output declines by 120 kb/d this year and falls a further 60 kb/d to 830 kb/d in 2017. Asia China – August actual: Chinese oil production continued its recent downward slide into August, dropping another 60 kb/d to a six-year low of just under 3.9 mb/d. The country’s state-run oil companies have shut in output from ageing high-cost fields in an effort to stem financial losses. According to data from the National Bureau of Statistics, output stood nearly 10% below year-earlier levels in the latest month. While the outlook for Chinese oil output has worsened over the year, the pace of decline is expected to slow.
3.73.83.94.04.14.24.34.44.5
Jan Mar May Jul Sep Nov Jan
mb/d China Crude Oil Production
2014 20152016 2016 forecast2017 forecast
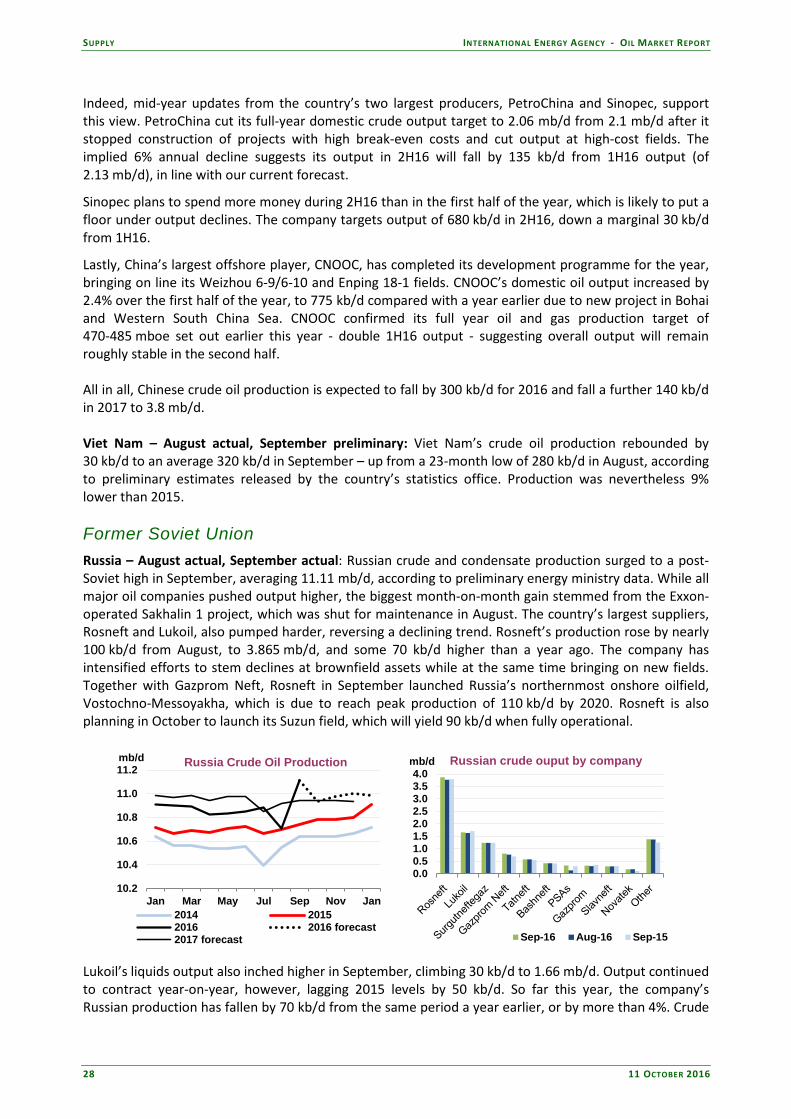
SUPPLY INTERNATIONAL ENERGY AGENCY - OIL MARKET REPORT
28 11 OCTOBER 2016
Indeed, mid-year updates from the country’s two largest producers, PetroChina and Sinopec, support this view. PetroChina cut its full-year domestic crude output target to 2.06 mb/d from 2.1 mb/d after it stopped construction of projects with high break-even costs and cut output at high-cost fields. The implied 6% annual decline suggests its output in 2H16 will fall by 135 kb/d from 1H16 output (of 2.13 mb/d), in line with our current forecast.
Sinopec plans to spend more money during 2H16 than in the first half of the year, which is likely to put a floor under output declines. The company targets output of 680 kb/d in 2H16, down a marginal 30 kb/d from 1H16.
Lastly, China’s largest offshore player, CNOOC, has completed its development programme for the year, bringing on line its Weizhou 6-9/6-10 and Enping 18-1 fields. CNOOC’s domestic oil output increased by 2.4% over the first half of the year, to 775 kb/d compared with a year earlier due to new project in Bohai and Western South China Sea. CNOOC confirmed its full year oil and gas production target of 470-485 mboe set out earlier this year - double 1H16 output - suggesting overall output will remain roughly stable in the second half. All in all, Chinese crude oil production is expected to fall by 300 kb/d for 2016 and fall a further 140 kb/d in 2017 to 3.8 mb/d. Viet Nam – August actual, September preliminary: Viet Nam’s crude oil production rebounded by 30 kb/d to an average 320 kb/d in September – up from a 23-month low of 280 kb/d in August, according to preliminary estimates released by the country’s statistics office. Production was nevertheless 9% lower than 2015. Former Soviet Union Russia – August actual, September actual: Russian crude and condensate production surged to a post-Soviet high in September, averaging 11.11 mb/d, according to preliminary energy ministry data. While all major oil companies pushed output higher, the biggest month-on-month gain stemmed from the Exxon-operated Sakhalin 1 project, which was shut for maintenance in August. The country’s largest suppliers, Rosneft and Lukoil, also pumped harder, reversing a declining trend. Rosneft’s production rose by nearly 100 kb/d from August, to 3.865 mb/d, and some 70 kb/d higher than a year ago. The company has intensified efforts to stem declines at brownfield assets while at the same time bringing on new fields. Together with Gazprom Neft, Rosneft in September launched Russia’s northernmost onshore oilfield, Vostochno-Messoyakha, which is due to reach peak production of 110 kb/d by 2020. Rosneft is also planning in October to launch its Suzun field, which will yield 90 kb/d when fully operational.
10.2
10.4
10.6
10.8
11.0
11.2
Jan Mar May Jul Sep Nov Jan
mb/d Russia Crude Oil Production
2014 20152016 2016 forecast2017 forecast
0.00.51.01.52.02.53.03.54.0
mb/d Russian crude ouput by company
Sep-16 Aug-16 Sep-15
Lukoil’s liquids output also inched higher in September, climbing 30 kb/d to 1.66 mb/d. Output continued to contract year-on-year, however, lagging 2015 levels by 50 kb/d. So far this year, the company’s Russian production has fallen by 70 kb/d from the same period a year earlier, or by more than 4%. Crude

INTERNATIONAL ENERGY AGENCY - OIL MARKET REPORT SUPPLY
11 OCTOBER 2016 29
oil production in Western Siberia continued to decline due to natural depletion of reserves, increase in water cut and a reallocation of capital to higher return projects in other regions of Russia. Field depletions were only partly offset by increases from the Yaregskoye and Imilorskoye fields, which are ramping up. Lukoil production is expected to get a boost towards year-end as it starts up its Filanovskoe filed in the Caspian Sea. Kazakhstan – August actual: Kazakhstan’s oil production rebounded sharply in September, after heavy maintenance saw output drop to a 10-year low a month earlier. Supplies from the TengizChevroil field was cut by 284 kb/d in August from 560 kb/d the previous month due to extensive planned maintenance work. At 1.26 mb/d, total Kazakh crude oil output was 300 kb/d lower than the previous month in August and 250 kb/d below a year ago. The consortium developing the giant Kashagan oil field reported on 29 September it had begun test-pumping in preparation for commercial production. Initial flows are set to begin at 75 kb/d, rising towards year and through 2017. Operator North Caspian Operating Company (NCOC) said previously that it planned to restart Kashagan at an initial rate of 180 kb/d, increasing to 370 kb/d by the end of 2017 after gas reinjection is optimised.
1.31.41.51.61.71.81.92.0
Jan Mar May Jul Sep Nov Jan
mb/d Kazakhstan Total Oil Supply
2014 20152016 2016 forecast2017 forecast
650700750800850900950
1000
Jan Mar May Jul Sep Nov Jan
kb/d Azerbaijan Total Oil Supply
2014 20152016 2016 forecast2017 forecast
Azerbaijan – August actual: Azeri oil output dropped by 35 kb/d from July, to 830 kb/d. Output is estimated to have fallen further in September when BP shut its Guneshli Deep platform at the ACG complex for planned maintenance. BP reported on 12 September the platform had resumed operations.
Jul 16 Aug 15CrudeBlack Sea 1.62 1.64 1.56 1.59 1.60 1.82 1.60 1.67 1.67 1.25 1.63 -0.42 -0.21 Baltic 1.33 1.45 1.45 1.38 1.51 1.54 1.65 1.56 1.55 1.60 1.70 0.04 0.29 Arctic/FarEast 1.14 1.42 1.41 1.42 1.48 1.66 1.83 1.90 1.82 1.48 1.70 -0.34 0.11 BTC 0.60 0.62 0.61 0.61 0.61 0.70 0.70 0.73 0.74 0.65 0.65 -0.09 0.10 Crude Seaborne 4.69 5.13 5.03 4.99 5.21 5.71 5.79 5.87 5.79 4.99 5.68 -0.80 0.30 Druzhba Pipeline 1.01 1.07 1.08 1.06 1.08 1.04 1.05 1.02 1.09 1.09 1.09 0.00 0.05 Other Routes 0.40 0.24 0.24 0.23 0.21 0.21 0.18 0.18 0.19 0.17 0.17 -0.02 -0.03 Total Crude Exports 6.14 6.43 6.35 6.28 6.50 6.96 7.02 6.81 6.81 6.02 6.63 -0.79 0.09
of which: Transneft 1 3.88 4.19 4.16 4.08 4.23 4.32 4.44 4.26 4.30 4.20 4.50 -0.10 0.24 of which: Russian crude 4.02 4.42 4.44 4.30 4.47 4.57 5.06 5.09 4.97 4.40 4.94 -0.57 0.19
ProductsFuel oil2 1.72 1.49 1.51 1.31 1.48 1.35 1.33 1.46 1.34 1.42 0.07 0.15
of which: VGO 0.27 0.25 0.24 0.25 0.28 0.22 0.27 0.27 0.34 0.37 0.03 0.16 Gasoil 0.95 0.98 1.03 0.82 0.84 1.17 0.96 0.99 0.87 0.92 0.05 0.11 Other Products 0.57 0.66 0.69 0.58 0.66 0.71 0.71 0.68 0.65 0.78 0.13 0.24 Total Product 3.25 3.13 3.23 2.71 2.97 3.22 3.00 3.13 2.86 3.12 0.25 0.49 Total Exports 9.38 9.56 9.58 8.98 9.46 10.10 9.82 9.94 9.68 9.14 -0.54 0.58 Imports 0.08 0.07 0.06 0.07 0.08 0.05 0.06 0.06 0.06 0.06 -0.01 -0.01 Net Exports 9.30 9.50 9.53 8.91 9.38 10.05 9.77 9.88 9.61 9.08 -0.53 0.59
Sources: Argus Media Ltd, IEA estimates, Bloomberg, Lloyd's List Intelligence1Transneft data exclude Russian CPC volumes.2Includes Vacuum Gas Oil3Preliminary tanker data and IEA calculations
Sep 163 Jul 16 vsAug 16
FSU Net Exports of Crude & Petroleum Products
1Q20162014 2015 2Q2015 3Q2015 4Q2015
(million barrels per day)
2Q2016 Jun 16 Jul 16

STOCKS INTERNATIONAL ENERGY AGENCY - OIL MARKET REPORT
30 11 OCTOBER 2016
STOCKS Summary • OECD commercial inventories fell for the first time since March, by 10 mb to 3 092 mb, in August due
to a larger than seasonal decline in crude stockpiles. • Asia Oceania saw the largest monthly draw in crude stocks. The decline was split between Japan and
South Korea, which saw higher refinery runs. • Oil product inventories built by 18.7 mb to reach a historical high in August as OECD refinery
throughput rose and seasonal restocking of US propane continued. • Preliminary data for September show crude stocks falling in both Japan and the US due to lower
imports and despite a heavier refinery maintenance schedule.
900950
1,0001,0501,1001,1501,2001,250
Jan Mar May Jul Sep Nov Jan
mb OECD Crude Oil Stocks
Range 2011-2015 Avg 2011-20152015 2016
1,2501,3001,3501,4001,4501,5001,5501,6001,650
Jan Mar May Jul Sep Nov Jan
mb OECD Total Products Stocks
Range 2011-2015 Avg 2011-20152015 2016
Global Overview After a long uptrend, the pace of global stock builds has slowed recently, even tentatively started to reverse. In August, for example, total OECD commercial inventories fell for the first time since March, pulled down by a 22 mb drop in crude stocks in the US, Japan and South Korea. Inventories stood 145 mb above a year ago, so the ample supply cushion built over the last few years remains. Oil product stocks continued to march upwards, with builds seen in middle distillates and propane, and limited draws in other products. Preliminary figures released for the US and Japan suggest that the trend extended well into September with further falls in crude stocks despite heavier refinery maintenance than in August. OECD inventory position at end-August and revisions to preliminary data OECD commercial inventories fell counter-seasonally by 10 mb to stand at 3 092 mb by end-month, marking the first monthly fall since March. This meant inventories’ surplus to average levels fell on the month, even if they stood a comfortable 348 mb above the five-year range and 145 mb above a year ago. The fall in stockpiles was largely driven by crude, which fell in all OECD regions and especially sharply in Asia Oceania. This brought crude stocks back to early February levels. Refined product stocks across the OECD hit yet another historic high as refineries increased runs in August. Middle distillates inventories (+8.2 mb month-on-month) extended recent gains supported by higher refinery runs in North America and Asia Oceania to meet the seasonal increase in gasoline demand. Holdings of the product were boosted over the summer after a relative stabilization in 1H16. As in recent months, the largest portion of the increase in product inventories came from the seasonal restocking of ‘other products’ in North America. This category includes propane that has risen with natural gas liquids

INTERNATIONAL ENERGY AGENCY - OIL MARKET REPORT STOCKS
11 OCTOBER 2016 31
production. By end-August, OECD refined product inventories covered 34.4 days of forward demand, a rise of 0.6 days on end-July and 2 days higher than one year earlier.
Am Europe As. Ocean Total Am Europe As. Ocean Total Am Europe As. Ocean TotalCrude Oil -11.4 -2.6 -13.0 -26.9 -0.37 -0.08 -0.42 -0.87 -0.09 0.08 0.07 0.05 Gasoline -8.4 -2.3 0.4 -10.3 -0.27 -0.07 0.01 -0.33 0.01 -0.04 0.00 -0.03 Middle Distillates 4.7 -0.7 4.2 8.2 0.15 -0.02 0.13 0.27 -0.23 0.04 0.09 -0.10 Residual Fuel Oil 1.1 0.2 0.3 1.7 0.04 0.01 0.01 0.05 -0.04 -0.07 -0.01 -0.12 Other Products 15.4 0.3 3.4 19.1 0.50 0.01 0.11 0.62 0.44 0.02 0.02 0.47 Total Products 12.8 -2.4 8.3 18.7 0.41 -0.08 0.27 0.60 0.17 -0.05 0.10 0.22 Other Oils1 -3.2 0.2 1.2 -1.8 -0.10 0.01 0.04 -0.06 0.14 -0.01 0.02 0.14 Total Oil -1.8 -4.7 -3.4 -10.0 -0.06 -0.15 -0.11 -0.32 0.21 0.02 0.18 0.41 1 Other oils includes NGLs, feedstocks and other hydrocarbons.
(million barrels) (million barrels per day) (million barrels per day)
Preliminary Industry Stock Change in August 2016 and Second Quarter 2016August 2016 (preliminary) Second Quarter 2016
Upon the receipt of more complete information and following a data revision by the US Energy Information Administration, OECD stocks were lowered by 26.6 mb in June and 9 mb in July. Holdings in OECD Americas saw the largest changes with revisions to crude inventories (-29.7 mb), refined products (+2.6 mb) and NGLs, feedstocks and hydrocarbons (+10 mb) in July. The EIA removed from its historical commercial crude data ‘lease stocks’, representing volumes of crude produced and not yet transferred to pipelines or tank farms for storage. For OECD Europe, crude stocks were revised down 0.3 mb in July, products up 6.4 mb, while stocks of NGLs, feedstocks and hydrocarbons were raised by 1.4 mb. Asia Oceania saw fewer changes overall with a +0.7 mb data revision mainly focused on crude oil for July.
(million barrels)
Americas Europe Asia Oceania OECD
Jun-16 Jul-16 Jun-16 Jul-16 Jun-16 Jul-16 Jun-16 Jul-16Crude Oil -27.2 -29.7 0.3 -0.3 0.0 0.6 -26.9 -29.4 Gasoline -0.1 1.0 -0.2 0.8 0.0 0.0 -0.3 1.8 Middle Distillates 0.2 5.2 0.0 4.5 0.0 -0.7 0.1 9.0 Residual Fuel Oil -0.2 -0.8 0.5 -0.5 0.0 0.0 0.3 -1.4 Other Products 0.0 -2.9 0.2 1.6 0.0 0.6 0.3 -0.7 Total Products -0.1 2.6 0.4 6.4 0.0 -0.2 0.3 8.8 Other Oils1 -0.1 10.0 0.1 1.4 0.0 0.2 0.0 11.6 Total Oil -27.4 -17.2 0.8 7.5 0.0 0.7 -26.6 -9.0 1 Other oils includes NGLs, feedstocks and other hydrocarbons.
Revisions versus 13 September 2016 Oil Market Report
Recent OECD industry stock changes OECD Americas Industry inventories in the OECD Americas drew counter-seasonally in August by 1.8 mb to 1 634 mb. This was largely driven by crude stocks, which fell for a fourth month in a row and, at 635 mb, now sit just above levels at the start of the year. Another key contributor was gasoline, which fell 8.5 mb on the month to 264 mb, driven by a seasonal increase in demand. Even if this was insufficient to offset the crude and gasoline draws, stocks of ‘other products’ in the OECD Americas (largely US propane) continued to build by 15.3 mb, or almost twice the normal rate for this time of year, to sit at a record 263 mb by end month. Remarkably, they were almost on a par with gasoline stocks at the end of August and could well overtake them in September. At the start of 2010, before the US Light Tight Oil boom, propane stocks represented barely half the gasoline volume. Middle distillates rose seasonally by 4.7 mb, while fuel oil built counter-seasonally by 1.1 mb. All told, refined products added 12.7 mb in August, more than the average build for the month to cover 32.9 days of forward demand and marking yet another increase on the month and the year.

STOCKS INTERNATIONAL ENERGY AGENCY - OIL MARKET REPORT
32 11 OCTOBER 2016
Preliminary weekly data from the US Energy Information Administration (EIA) suggest that US commercial crude stockpiles drew by a further 22 mb in September. Previous delays in discharging crude cargoes in the Gulf in early September were not offset by enough imports later in the month and a narrowing Brent-WTI spread made the US less attractive for oil exporters. The fall in crude stocks was also helped by a series of ultra light crude exports from the US Gulf Coast to Europe and came despite a 0.8 mb/d fall in refinery throughput. The largest draws were in the US Gulf Coast – traditionally the largest crude importing region – followed by the East Coast and the Midwest.
410
460
510
560
610
660
710
Jan Mar May Jul Sep Nov Jan
mb OECD Americas Crude Oil Stocks
Range 2011-2015 Avg 2011-20152015 2016
130150170190210230250270
Jan Mar May Jul Sep Nov Jan
mb OECD Americas Other Products Stocks
Range 2011-2015 Avg 2011-20152015 2016
US refined product stocks were little changed overall in September, with further builds in middle distillates and a draw in gasoline. The Colonial Pipeline System was partially shut between 9-21 September, with implications for product stocks in PADD 1 (US Northeast) and PADD 3 (US Gulf Coast). During the outage, gasoline stocks built in the Gulf. A string of gasoline exports from Europe to the US Northeast helped cushion the impact for stocks in PADD 1. By the end of September, they stood at 60 mb, down 7 mb on the month. As for middle distillate stocks, they stood at 43 mb in the US Gulf Coast at the end of September, down 0.9 mb, while in the US Northeast they were up 1 mb to 64 mb. OECD Europe European commercial holdings drew overall in August against seasonal trends prompted by falls in crude oil and gasoline, with minor changes seen in other product categories. Crude stockpiles fell in France and the Netherlands in particular as refineries increased production to meet the seasonal increase in diesel demand, while in Germany, the UK and Italy, stocks gained. Overall, European commercial crude stocks stood at 361 mb by end-August, down 2.6 mb from July.
290300310320330340350360370
Jan Mar May Jul Sep Nov Jan
mb OECD Europe Crude Oil Stocks
Range 2011-2015 Avg 2011-20152015 2016
80
85
90
95
100
105
110
Jan Mar May Jul Sep Nov Jan
mb OECD Europe Gasoline Stocks
Range 2011-2015 Avg 2011-20152015 2016
On the product side, gasoline stocks drew in line with higher exports to the US and West Africa, bringing industry stockpiles to 95 mb by end-August, their lowest level since December 2015. Stocks of middle distillates were almost unchanged on the month, as they drew by 0.7 mb to 321 mb. At the end of
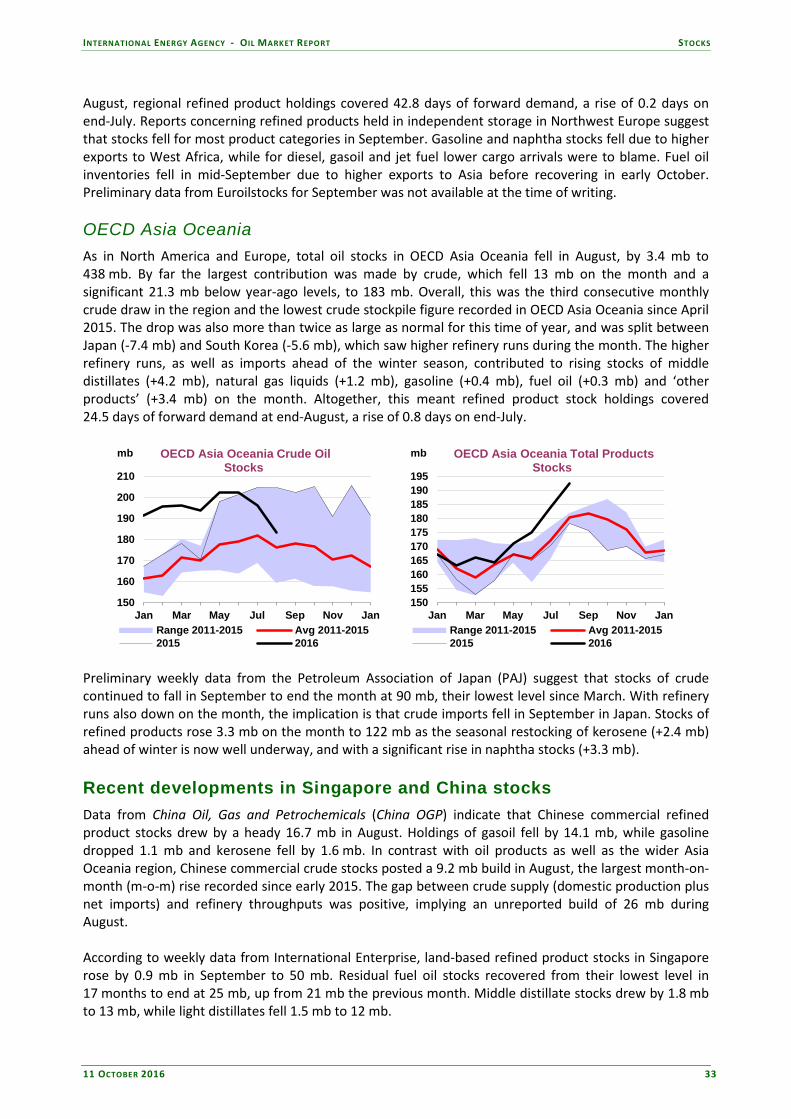
INTERNATIONAL ENERGY AGENCY - OIL MARKET REPORT STOCKS
11 OCTOBER 2016 33
August, regional refined product holdings covered 42.8 days of forward demand, a rise of 0.2 days on end-July. Reports concerning refined products held in independent storage in Northwest Europe suggest that stocks fell for most product categories in September. Gasoline and naphtha stocks fell due to higher exports to West Africa, while for diesel, gasoil and jet fuel lower cargo arrivals were to blame. Fuel oil inventories fell in mid-September due to higher exports to Asia before recovering in early October. Preliminary data from Euroilstocks for September was not available at the time of writing. OECD Asia Oceania As in North America and Europe, total oil stocks in OECD Asia Oceania fell in August, by 3.4 mb to 438 mb. By far the largest contribution was made by crude, which fell 13 mb on the month and a significant 21.3 mb below year-ago levels, to 183 mb. Overall, this was the third consecutive monthly crude draw in the region and the lowest crude stockpile figure recorded in OECD Asia Oceania since April 2015. The drop was also more than twice as large as normal for this time of year, and was split between Japan (-7.4 mb) and South Korea (-5.6 mb), which saw higher refinery runs during the month. The higher refinery runs, as well as imports ahead of the winter season, contributed to rising stocks of middle distillates (+4.2 mb), natural gas liquids (+1.2 mb), gasoline (+0.4 mb), fuel oil (+0.3 mb) and ‘other products’ (+3.4 mb) on the month. Altogether, this meant refined product stock holdings covered 24.5 days of forward demand at end-August, a rise of 0.8 days on end-July.
150
160
170
180
190
200
210
Jan Mar May Jul Sep Nov Jan
mb OECD Asia Oceania Crude Oil Stocks
Range 2011-2015 Avg 2011-20152015 2016
150155160165170175180185190195
Jan Mar May Jul Sep Nov Jan
mb OECD Asia Oceania Total Products Stocks
Range 2011-2015 Avg 2011-20152015 2016
Preliminary weekly data from the Petroleum Association of Japan (PAJ) suggest that stocks of crude continued to fall in September to end the month at 90 mb, their lowest level since March. With refinery runs also down on the month, the implication is that crude imports fell in September in Japan. Stocks of refined products rose 3.3 mb on the month to 122 mb as the seasonal restocking of kerosene (+2.4 mb) ahead of winter is now well underway, and with a significant rise in naphtha stocks (+3.3 mb).
Recent developments in Singapore and China stocks Data from China Oil, Gas and Petrochemicals (China OGP) indicate that Chinese commercial refined product stocks drew by a heady 16.7 mb in August. Holdings of gasoil fell by 14.1 mb, while gasoline dropped 1.1 mb and kerosene fell by 1.6 mb. In contrast with oil products as well as the wider Asia Oceania region, Chinese commercial crude stocks posted a 9.2 mb build in August, the largest month-on-month (m-o-m) rise recorded since early 2015. The gap between crude supply (domestic production plus net imports) and refinery throughputs was positive, implying an unreported build of 26 mb during August. According to weekly data from International Enterprise, land-based refined product stocks in Singapore rose by 0.9 mb in September to 50 mb. Residual fuel oil stocks recovered from their lowest level in 17 months to end at 25 mb, up from 21 mb the previous month. Middle distillate stocks drew by 1.8 mb to 13 mb, while light distillates fell 1.5 mb to 12 mb.
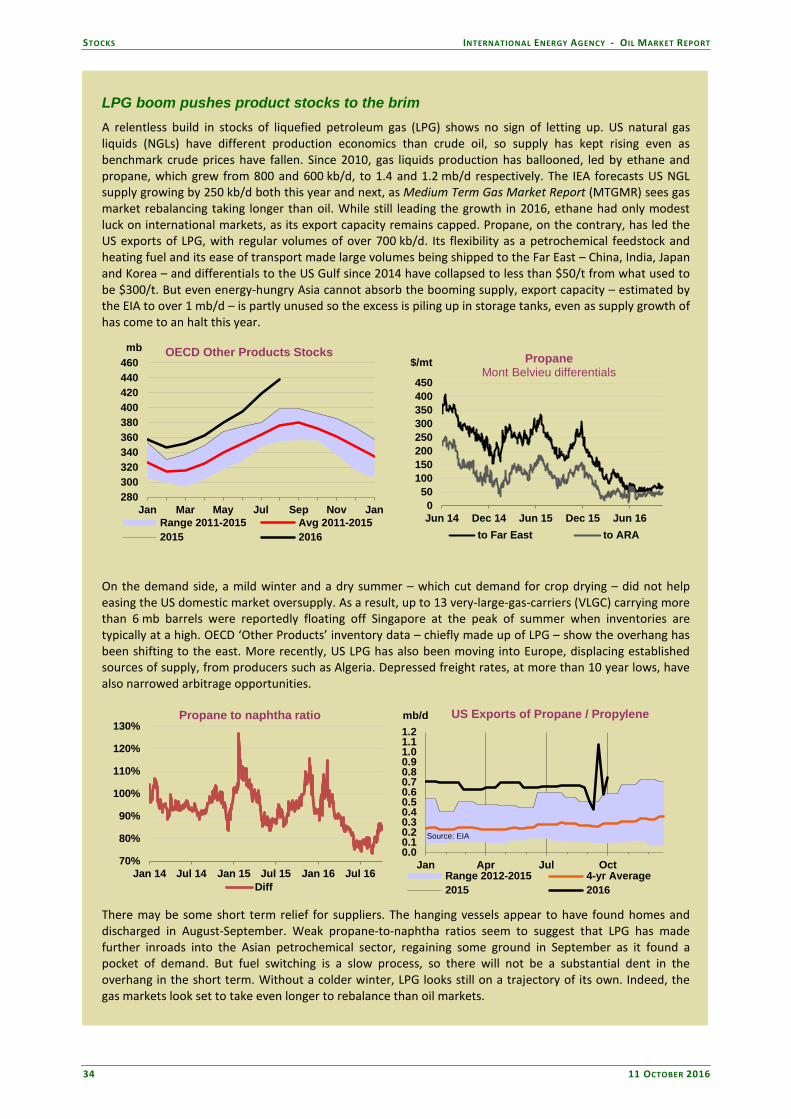
STOCKS INTERNATIONAL ENERGY AGENCY - OIL MARKET REPORT
34 11 OCTOBER 2016
LPG boom pushes product stocks to the brim A relentless build in stocks of liquefied petroleum gas (LPG) shows no sign of letting up. US natural gas liquids (NGLs) have different production economics than crude oil, so supply has kept rising even as benchmark crude prices have fallen. Since 2010, gas liquids production has ballooned, led by ethane and propane, which grew from 800 and 600 kb/d, to 1.4 and 1.2 mb/d respectively. The IEA forecasts US NGL supply growing by 250 kb/d both this year and next, as Medium Term Gas Market Report (MTGMR) sees gas market rebalancing taking longer than oil. While still leading the growth in 2016, ethane had only modest luck on international markets, as its export capacity remains capped. Propane, on the contrary, has led the US exports of LPG, with regular volumes of over 700 kb/d. Its flexibility as a petrochemical feedstock and heating fuel and its ease of transport made large volumes being shipped to the Far East – China, India, Japan and Korea – and differentials to the US Gulf since 2014 have collapsed to less than $50/t from what used to be $300/t. But even energy-hungry Asia cannot absorb the booming supply, export capacity – estimated by the EIA to over 1 mb/d – is partly unused so the excess is piling up in storage tanks, even as supply growth of has come to an halt this year.
280300320340360380400420440460
Jan Mar May Jul Sep Nov Jan
mb OECD Other Products Stocks
Range 2011-2015 Avg 2011-20152015 2016
050
100150200250300350400450
Jun 14 Dec 14 Jun 15 Dec 15 Jun 16
$/mt PropaneMont Belvieu differentials
to Far East to ARA
On the demand side, a mild winter and a dry summer – which cut demand for crop drying – did not help easing the US domestic market oversupply. As a result, up to 13 very-large-gas-carriers (VLGC) carrying more than 6 mb barrels were reportedly floating off Singapore at the peak of summer when inventories are typically at a high. OECD ‘Other Products’ inventory data – chiefly made up of LPG – show the overhang has been shifting to the east. More recently, US LPG has also been moving into Europe, displacing established sources of supply, from producers such as Algeria. Depressed freight rates, at more than 10 year lows, have also narrowed arbitrage opportunities.
70%
80%
90%
100%
110%
120%
130%
Jan 14 Jul 14 Jan 15 Jul 15 Jan 16 Jul 16
Propane to naphtha ratio
Diff
0.00.10.20.30.40.50.60.70.80.91.01.11.2
Jan Apr Jul Oct
mb/d US Exports of Propane / Propylene
Range 2012-2015 4-yr Average2015 2016
Source: EIA
There may be some short term relief for suppliers. The hanging vessels appear to have found homes and discharged in August-September. Weak propane-to-naphtha ratios seem to suggest that LPG has made further inroads into the Asian petrochemical sector, regaining some ground in September as it found a pocket of demand. But fuel switching is a slow process, so there will not be a substantial dent in the overhang in the short term. Without a colder winter, LPG looks still on a trajectory of its own. Indeed, the gas markets look set to take even longer to rebalance than oil markets.

INTERNATIONAL ENERGY AGENCY - OIL MARKET REPORT STOCKS
11 OCTOBER 2016 35
1 Days of forw ard demand are based on average demand over the next three months
Days1 Million Barrels
Regional OECD End-of-Month Industry Stocks(in days of forward demand and million barrels of total oil)
56
58
60
62
64
66
68
Jan Mar May Jul Sep Nov Jan
Days OECD Total Oil
Range 2011-2015 Avg 2011-2015
2015 2016
525456586062646668
Jan Mar May Jul Sep Nov Jan
Days Americas
Range 2011-2015 Avg 2011-2015
2015 2016
6264666870727476
Jan Mar May Jul Sep Nov Jan
Days Europe
Range 2011-2015 Avg 2011-2015
2015 2016
424446485052545658
Jan Mar May Jul Sep Nov Jan
Days Asia Oceania
Range 2011-2015 Avg 2011-2015
2015 2016
1,250
1,350
1,450
1,550
1,650
1,750
Jan Mar May Jul Sep Nov Jan
mb Americas
Range 2011-2015 Avg 2011-2015
2015 2016
850
900
950
1,000
1,050
Jan Mar May Jul Sep Nov Jan
mb Europe
Range 2011-2015 Avg 2011-20152015 2016
380
400
420
440
460
Jan Mar May Jul Sep Nov Jan
mb Asia Oceania
Range 2011-2015 Avg 2011-20152015 2016
2,500 2,600 2,700 2,800 2,900 3,000 3,100 3,200
Jan Mar May Jul Sep Nov Jan
mb OECD Total Oil
Range 2011-2015 Avg 2011-20152015 2016

PRICES INTERNATIONAL ENERGY AGENCY - OIL MARKET REPORT
36 11 OCTOBER 2016
PRICES Summary • Benchmark crude prices rose in September as market rebalancing continued and participants
anticipated an OPEC supply cut. At the time of writing, front month ICE Brent was trading at $53.05 /bbl with front month NYMEX WTI lower at $51.15/bbl.
• Major crude benchmarks remained locked in contango during September, reflecting continuing
oversupply in physical markets. • Gasoline, naphtha and fuel oil prices all strengthened on open arbitrage to the US East Coast and
Singapore, while middle distillates were more stable. • Crude freight rates recovered from the lowest level since 2009 on stronger activity in the North Sea
and West Africa. Clean product freight rates were largely stable, with the exception of Atlantic Basin clean routes, which responded to an outage on the Colonial pipeline.
20
30
40
50
60
Sep 15 Jan 16 May 16 Sep 16
$/bbl Benchmark Crude Prices
WTI Cushing N. Sea Dated Dubai
Copyright © 2016 Argus Media
40
45
50
55
60
M1 2 3 4 5 6 7 8 9 10 11 12
$/bblICE Brent
Forward Price Curve
08 Jul 16 09 Aug 1606 Sep 16 07 Oct 16
Source: ICE
Market overview After an early period of volatility, benchmark crude prices stabilised mid-month and then rallied after ministers from OPEC showed a willingness to cut production and with several data releases showing falling US crude stocks. A meeting of ministers in Algeria on 28 September led to an agreement to curb OPEC production to between 32.5-33 mb/d, with the details to be ironed out at OPEC’s next meeting on 30 November in Vienna. Despite uncertainty about some of the deal’s key parameters, the price of front-month ICE Brent rose from $45.97/bbl the day before the meeting to $48.24/bbl at the end of that week. At the time of writing, prices were trading above $53/bbl. Futures markets The contango in ICE Brent crude futures – defined as when the prompt month contract is lower than later ones – widened in September despite falling production linked to field maintenance in the North Sea and a raft of exports to Asia. This was largely driven by refinery maintenance in Northwest Europe, which reduced demand for crude. The Month 1-Month 2 futures spread was trading at -$0.57/ bbl in early October, from -$0.38/bbl at the start of September. The contango on the NYMEX WTI curve remained in a tight range throughout the month, while the spread between front month WTI and Brent futures narrowed in September with higher exports of crude scheduled from the US Gulf. The Month 1-Month 2 Dubai spread fell further into contango from -$0.50/bbl at the start of September to -$0.80/ bbl by end-month, reflecting ample supplies and lower demand for Middle Eastern crudes. By early October, as the front month contract rolled to December, Dubai was in backwardation.

INTERNATIONAL ENERGY AGENCY - OIL MARKET REPORT PRICES
11 OCTOBER 2016 37
The partial closure of the Colonial pipeline resulted in a steep backwardation of the NYMEX Reformulated Blend-stock for Oxygen Blending (RBOB) gasoline Month 1-Month 2 futures curve, which hit a high of 7.77 cents/gallon on September 16, before falling back to 2.43 cents/gallon by month-end as the pipeline reopened. A similar phenomenon was observed for NYMEX ultra low sulphur diesel futures, with a twist. The M1-M2 price structure continued to steepen in the days following the reopening of Colonial, reflecting falling inventories in the US Northeast and firm demand. The premium of NYMEX diesel over gasoline futures widened to 8.27 cents/gallon as a result in early October, reflecting seasonal patterns but also suggesting that on balance, market players see a tight diesel supply picture and more relaxed gasoline supplies in the US Northeast over the next few weeks.
Jul Aug Sep Sep-Aug % Week Commencing:Avg Chg Chg 05 Sep 12 Sep 19 Sep 26 Sep 03 Oct
NYMEXLight Sw eet Crude Oil 44.80 44.80 45.23 0.43 1.0 45.96 44.34 44.58 46.74 49.52RBOB 57.98 59.48 58.45 -1.03 -1.7 57.12 58.97 58.49 60.72 62.52No.2 Heating Oil 58.17 59.42 60.17 0.75 1.3 60.35 59.37 59.56 62.06 66.07No.2 Heating Oil ($/mmbtu) 10.26 10.48 10.61 0.13 1.3 10.64 10.47 10.50 10.95 11.65Henry Hub Natural Gas ($/mmbtu) 2.76 2.72 2.90 0.18 6.6 2.75 2.92 3.00 2.96 3.03
ICEBrent 46.53 47.16 47.24 0.08 0.2 48.17 46.73 46.44 48.06 51.61Gasoil 54.36 54.74 56.19 1.45 2.7 55.84 55.62 56.45 57.54 61.90
Prompt Month DifferentialsNYMEX WTI - ICE Brent -1.73 -2.36 -2.01 0.35 -2.21 -2.39 -1.86 -1.32 -2.09NYMEX No.2 Heating Oil - WTI 13.37 14.62 14.94 0.32 14.39 15.03 14.98 15.32 16.55NYMEX RBOB - WTI 13.18 14.68 13.22 -1.46 11.16 14.63 13.91 13.98 13.00NYMEX 3-2-1 Crack (RBOB) 13.24 14.66 13.79 -0.87 12.24 14.76 14.27 14.42 14.18NYMEX No.2 - Natural Gas ($/mmbtu) 7.50 7.76 7.71 -0.05 7.89 7.55 7.51 7.98 8.62ICE Gasoil - ICE Brent 7.83 7.58 8.95 1.37 7.67 8.89 10.01 9.48 10.29
Source: ICE, NYMEX.
Prompt Month Oil Futures Prices(monthly and weekly averages, $/bbl)
Spot crude oil prices The North Sea physical crude market showed the strongest gains out of all the major price benchmarks in September as Brent, Forties, Oseberg and Ekofisk (BFOE) loadings fell to 22.2 mb (740 kb/d) for the month due to field maintenance and scheduled shipments to Asia. North Sea Dated averaged $46.69 /bbl, up $1.01/bbl from August. Brent traded at wider differentials to other major crudes through the month, including sour benchmark Dubai and sweet marker WTI, even if it came under pressure in early October in relative terms.
-10-8-6-4-2024
May 15 Sep 15 Jan 16 May 16 Sep 16
$/bblBenchmark Crude Prices
Differentials to North Sea Dated
WTI-North Sea Dubai-North SeaUrals NWE-North Sea
Copyright © 2016 Argus Media Ltd
-4-3-2-10123
May 15 Sep 15 Jan 16 May 16 Sep 16
$/bbl Benchmark Crude PricesDifferentials to North Sea Dated
Bonny Light-North Sea EkofiskUrals Med-North Sea
Copyright © 2016 Argus Media Ltd

PRICES INTERNATIONAL ENERGY AGENCY - OIL MARKET REPORT
38 11 OCTOBER 2016
West African crudes including Nigeria’s Qua Iboe and Bonny Light were not as supported, falling against Azeri Light and Saharan Blend despite higher refining margins. Higher anticipated production from Nigeria appeared to dampen prices, with the first cargo of Qua Iboe since July’s shutdown loading in early October. Qua Iboe changed hands at a $1.18/bbl premium to North Sea Dated on average in September, down from $1.97/bbl in August. Angolan crudes Girassol and Cabinda fell against Dated Brent with lacklustre demand from major buyer China and the widening of the Brent-Dubai spread, but were more supported compared with other West African crudes. A shortage of sour benchmark Urals crude in the Mediterranean sent its value soaring against lighter crudes such as Azeri Light and forced open an arbitrage for crude from Northwest Europe. Urals values in Northwest Europe came under pressure in September versus North Sea crudes with record exports scheduled from Russia’s Primorsk port in October. Middle Eastern sour benchmark Dubai fell against Brent-related crudes in September on lower demand from Asia, though the trend appeared to reverse partly in early October. US crude prices rose in September in line with other global oil benchmarks and with falling stocks, as reported by the Energy Information Administration (see Stocks section). Medium sour benchmark Mars gained relative to lighter US crudes such as WTI or Light Louisiana Sweet (LLS).
Spot product prices Spot refined product prices were up across the board in September, reflecting continued demand growth and tight supplies in many parts of the world. The major exception was the US Gulf Coast, where the partial closure of the Colonial Pipeline system led to rising stockpiles and falling prices. Gasoline, naphtha and fuel oil were notable strong performers in Europe and Asia. Atlantic Basin gasoline prices saw mixed fortunes in September following the partial closure of the Colonial Pipeline system between 9-21 September, which trapped gasoline volumes in the US Gulf Coast and prevented flows from reaching the traditionally import-dependent US Northeast. As a result, European and Singapore gasoline physical premiums all rose in September to reflect a wide open arbitrage for cargoes headed to New York Harbour. Market sources said up to 11.7 mb of gasoline left Europe for the US East Coast over the month, with some shipments going as far as Los Angeles via the Panama Canal even before the disruption was reported. The price rise was even more noticeable as European and North American differentials traditionally fall in September with the move to higher Reid Vapour Pressure (RVP) specification ahead of the winter season.
Spot crude oil prices and differentials
Table Unavailable Available in the subscription version.
To subscribe, visit: www.iea.org/oilmarketreport/subscription
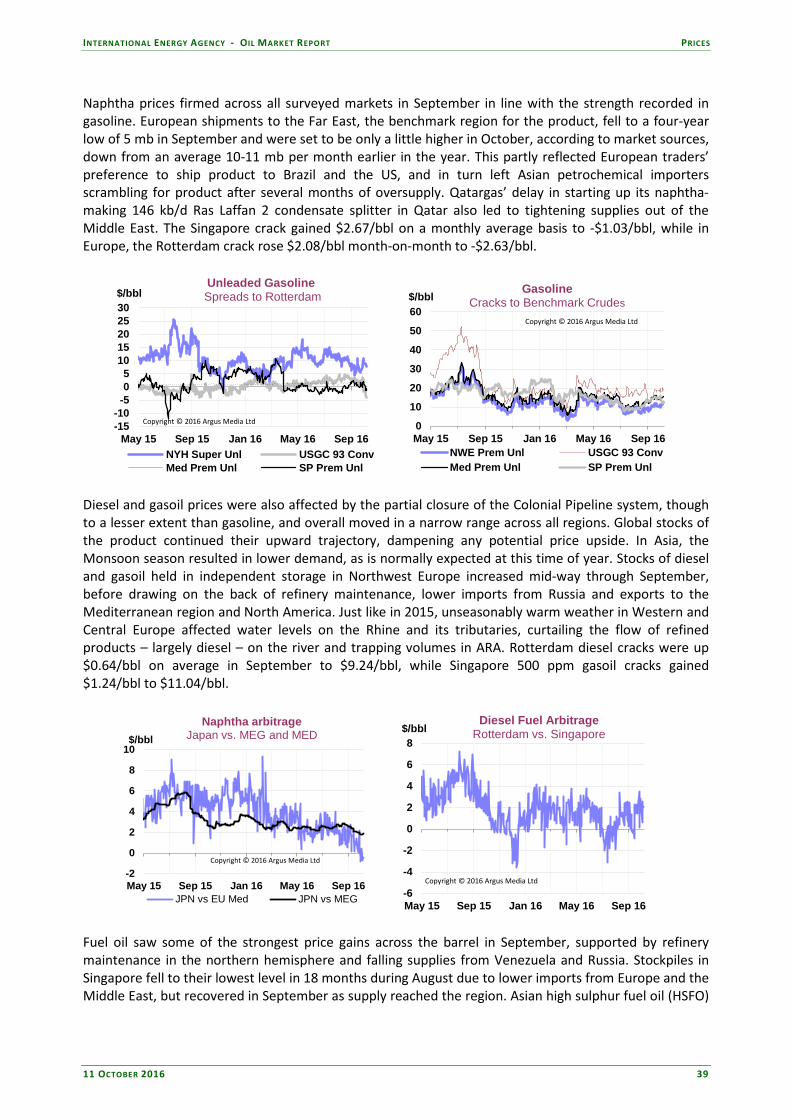
INTERNATIONAL ENERGY AGENCY - OIL MARKET REPORT PRICES
11 OCTOBER 2016 39
Naphtha prices firmed across all surveyed markets in September in line with the strength recorded in gasoline. European shipments to the Far East, the benchmark region for the product, fell to a four-year low of 5 mb in September and were set to be only a little higher in October, according to market sources, down from an average 10-11 mb per month earlier in the year. This partly reflected European traders’ preference to ship product to Brazil and the US, and in turn left Asian petrochemical importers scrambling for product after several months of oversupply. Qatargas’ delay in starting up its naphtha-making 146 kb/d Ras Laffan 2 condensate splitter in Qatar also led to tightening supplies out of the Middle East. The Singapore crack gained $2.67/bbl on a monthly average basis to -$1.03/bbl, while in Europe, the Rotterdam crack rose $2.08/bbl month-on-month to -$2.63/bbl.
-15-10-505
1015202530
May 15 Sep 15 Jan 16 May 16 Sep 16
$/bblUnleaded GasolineSpreads to Rotterdam
NYH Super Unl USGC 93 ConvMed Prem Unl SP Prem Unl
Copyright © 2016 Argus Media Ltd
0
10
20
30
40
50
60
May 15 Sep 15 Jan 16 May 16 Sep 16
$/bblGasoline
Cracks to Benchmark Crudes
NWE Prem Unl USGC 93 ConvMed Prem Unl SP Prem Unl
Copyright © 2016 Argus Media Ltd
Diesel and gasoil prices were also affected by the partial closure of the Colonial Pipeline system, though to a lesser extent than gasoline, and overall moved in a narrow range across all regions. Global stocks of the product continued their upward trajectory, dampening any potential price upside. In Asia, the Monsoon season resulted in lower demand, as is normally expected at this time of year. Stocks of diesel and gasoil held in independent storage in Northwest Europe increased mid-way through September, before drawing on the back of refinery maintenance, lower imports from Russia and exports to the Mediterranean region and North America. Just like in 2015, unseasonably warm weather in Western and Central Europe affected water levels on the Rhine and its tributaries, curtailing the flow of refined products – largely diesel – on the river and trapping volumes in ARA. Rotterdam diesel cracks were up $0.64/bbl on average in September to $9.24/bbl, while Singapore 500 ppm gasoil cracks gained $1.24/bbl to $11.04/bbl.
-2
0
2
4
6
8
10
May 15 Sep 15 Jan 16 May 16 Sep 16
$/bblNaphtha arbitrage
Japan vs. MEG and MED
JPN vs EU Med JPN vs MEG
Copyright © 2016 Argus Media Ltd
-6
-4
-2
0
2
4
6
8
May 15 Sep 15 Jan 16 May 16 Sep 16
$/bblDiesel Fuel Arbitrage
Rotterdam vs. Singapore
Copyright © 2016 Argus Media Ltd
Fuel oil saw some of the strongest price gains across the barrel in September, supported by refinery maintenance in the northern hemisphere and falling supplies from Venezuela and Russia. Stockpiles in Singapore fell to their lowest level in 18 months during August due to lower imports from Europe and the Middle East, but recovered in September as supply reached the region. Asian high sulphur fuel oil (HSFO)
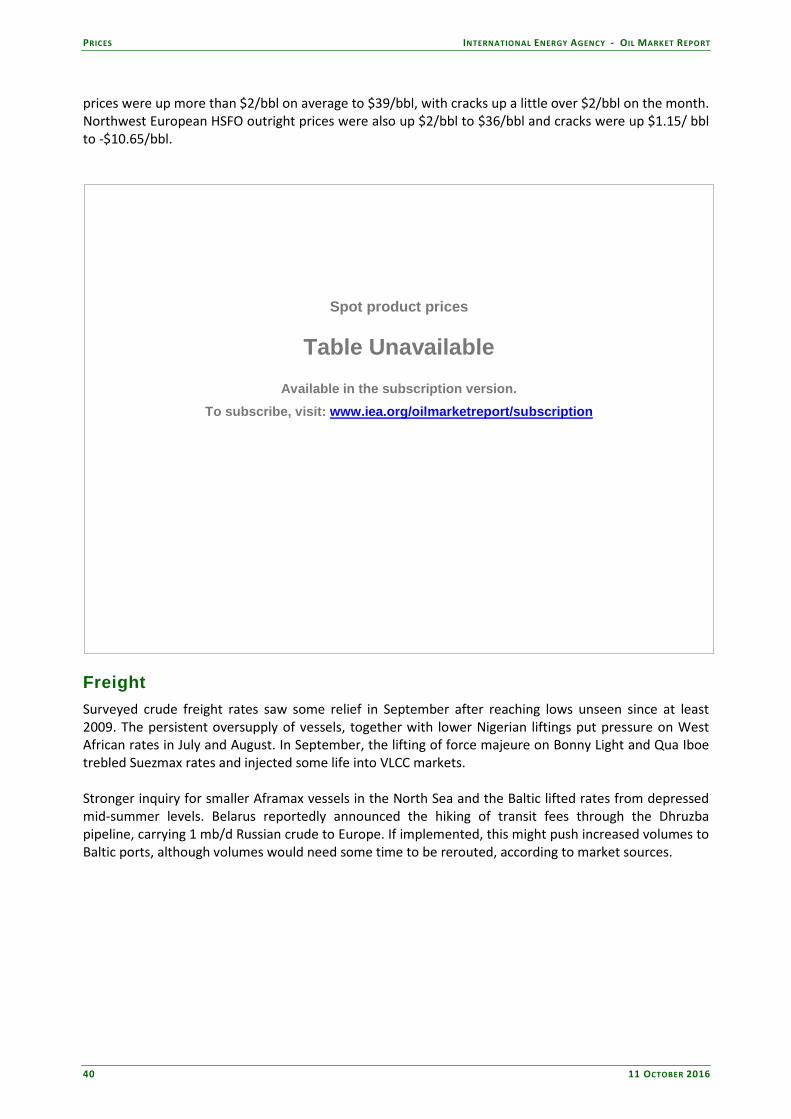
PRICES INTERNATIONAL ENERGY AGENCY - OIL MARKET REPORT
40 11 OCTOBER 2016
prices were up more than $2/bbl on average to $39/bbl, with cracks up a little over $2/bbl on the month. Northwest European HSFO outright prices were also up $2/bbl to $36/bbl and cracks were up $1.15/ bbl to -$10.65/bbl.
Freight Surveyed crude freight rates saw some relief in September after reaching lows unseen since at least 2009. The persistent oversupply of vessels, together with lower Nigerian liftings put pressure on West African rates in July and August. In September, the lifting of force majeure on Bonny Light and Qua Iboe trebled Suezmax rates and injected some life into VLCC markets. Stronger inquiry for smaller Aframax vessels in the North Sea and the Baltic lifted rates from depressed mid-summer levels. Belarus reportedly announced the hiking of transit fees through the Dhruzba pipeline, carrying 1 mb/d Russian crude to Europe. If implemented, this might push increased volumes to Baltic ports, although volumes would need some time to be rerouted, according to market sources.
Spot product prices
Table Unavailable Available in the subscription version.
To subscribe, visit: www.iea.org/oilmarketreport/subscription
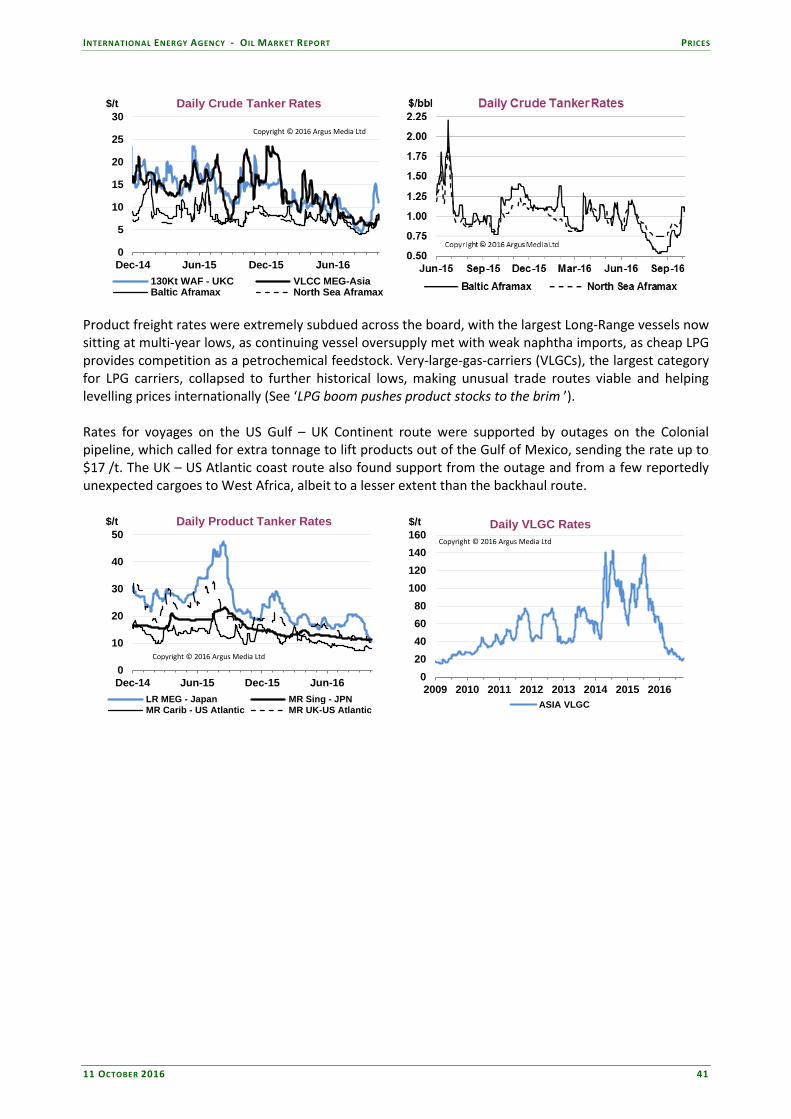
INTERNATIONAL ENERGY AGENCY - OIL MARKET REPORT PRICES
11 OCTOBER 2016 41
0
5
10
15
20
25
30
Dec-14 Jun-15 Dec-15 Jun-16
$/t Daily Crude Tanker Rates
130Kt WAF - UKC VLCC MEG-AsiaBaltic Aframax North Sea Aframax
Copyright © 2016 Argus Media Ltd
Product freight rates were extremely subdued across the board, with the largest Long-Range vessels now sitting at multi-year lows, as continuing vessel oversupply met with weak naphtha imports, as cheap LPG provides competition as a petrochemical feedstock. Very-large-gas-carriers (VLGCs), the largest category for LPG carriers, collapsed to further historical lows, making unusual trade routes viable and helping levelling prices internationally (See ‘LPG boom pushes product stocks to the brim ’). Rates for voyages on the US Gulf – UK Continent route were supported by outages on the Colonial pipeline, which called for extra tonnage to lift products out of the Gulf of Mexico, sending the rate up to $17 /t. The UK – US Atlantic coast route also found support from the outage and from a few reportedly unexpected cargoes to West Africa, albeit to a lesser extent than the backhaul route.
0
10
20
30
40
50
Dec-14 Jun-15 Dec-15 Jun-16
$/t Daily Product Tanker Rates
LR MEG - Japan MR Sing - JPNMR Carib - US Atlantic MR UK-US Atlantic
Copyright © 2016 Argus Media Ltd
020406080
100120140160
2009 2010 2011 2012 2013 2014 2015 2016
$/t Daily VLGC Rates
ASIA VLGC
Copyright © 2016 Argus Media Ltd

REFINING INTERNATIONAL ENERGY AGENCY - OIL MARKET REPORT
42 11 OCTOBER 2016
REFINING Summary • Weighed down by autumn maintenance, global refinery throughput in 4Q16 is expected to decline
seasonally by 1.1 mb/d to 78.9 mb/d, up only 70 kb/d year-on-year (y-o-y). The estimate for 3Q16 – though still at a record 80 mb/d - has been revised down by 420 kb/d, modestly above peak levels in 3Q15.
• Global throughput in 2016 is expected to grow y-o-y by just 220 kb/d, the lowest in more than a
decade, excluding the last economic recession (See Crouching refiners, hidden stockbuilds). Our first forecast for 2017 offers a more optimistic outlook, with January runs expected to increase to almost 81 mb/d – a rise of 600 kb/d from December and up 1.2 mb/d y-o-y.
Global refinery overview Global refinery runs continued surprising to the downside. Our latest estimate for 3Q16 runs points to a smaller ramp-up from 2Q16 and lower y-o-y growth than our previous forecasts. Runs are up 1.65 mb/d from the low levels of 2Q16, and are only 110 kb/d higher than the previous year. Usually, third quarter runs represent the annual peak, as refineries ramp up between spring and autumn turnaround seasons to provide for higher summer driving demand and, in some parts of the world, winter heating fuel restocking. At 80 mb/d, 3Q16 throughput is nonetheless a historical record, however small the margin compared to the previous peak in 3Q15. For the moment, data for 90% of July global throughput and 70% of August throughput are finalised while preliminary Russian statistics and US, Canadian and Japanese weeklies underpin the September forecast.
70727476788082
Jan Mar May Jul Sep Nov Jan
mb/d Global RefiningCrude Throughput
Range 10-14 Average 10-142015 20162016 est 2017 est
- 2.0
- 1.0
0.0
1.0
2.0
2006 2008 2010 2012 2014 2016
mb/d Global Throughput Seasonality q-o-q changes
2Q—>3Q 3Q—>4Q Global refinery intake is expected to slow from now on due to heavy October maintenance in US and Europe and November outages in the Middle East and Asia. This seasonal impact is well observed in previous years with very few exceptions. In 2014, global refinery intake defied the seasonal trend as margins were benefitting from falling crude prices. This year, fourth quarter throughput is forecast to decline by 1.1 mb/d from 3Q16, and register only a marginal 70 kb/d y-o-y growth. Overall, 2016 refinery runs are expected to grow at a paltry 220 kb/d y-o-y, despite rather solid demand growth of 1.2 mb/d. This should facilitate product stocks draws in 2016, so that, in 2017 refiners will return to a more normal annual growth pattern. This is why our first forecast for January 2017, at close to 81 mb/d, is defying the usual pattern of declines from December, climbing 600 kb/d instead.
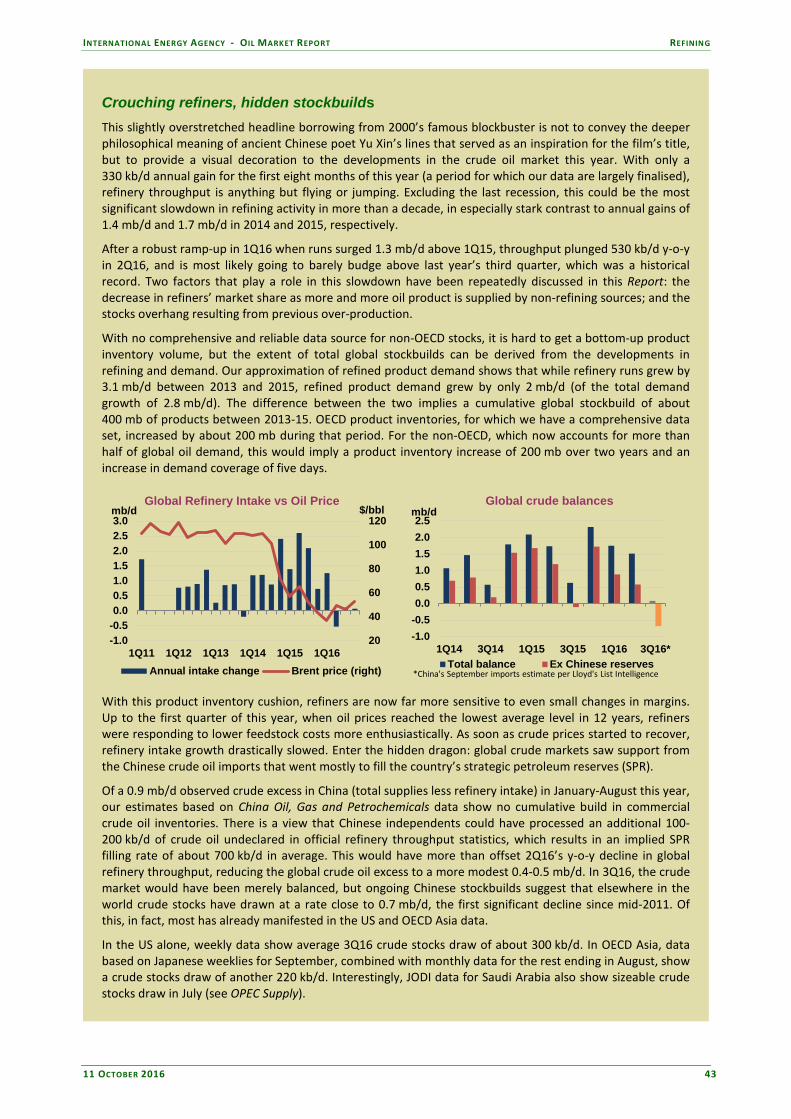
INTERNATIONAL ENERGY AGENCY - OIL MARKET REPORT REFINING
11 OCTOBER 2016 43
Crouching refiners, hidden stockbuilds This slightly overstretched headline borrowing from 2000’s famous blockbuster is not to convey the deeper philosophical meaning of ancient Chinese poet Yu Xin’s lines that served as an inspiration for the film’s title, but to provide a visual decoration to the developments in the crude oil market this year. With only a 330 kb/d annual gain for the first eight months of this year (a period for which our data are largely finalised), refinery throughput is anything but flying or jumping. Excluding the last recession, this could be the most significant slowdown in refining activity in more than a decade, in especially stark contrast to annual gains of 1.4 mb/d and 1.7 mb/d in 2014 and 2015, respectively.
After a robust ramp-up in 1Q16 when runs surged 1.3 mb/d above 1Q15, throughput plunged 530 kb/d y-o-y in 2Q16, and is most likely going to barely budge above last year’s third quarter, which was a historical record. Two factors that play a role in this slowdown have been repeatedly discussed in this Report: the decrease in refiners’ market share as more and more oil product is supplied by non-refining sources; and the stocks overhang resulting from previous over-production.
With no comprehensive and reliable data source for non-OECD stocks, it is hard to get a bottom-up product inventory volume, but the extent of total global stockbuilds can be derived from the developments in refining and demand. Our approximation of refined product demand shows that while refinery runs grew by 3.1 mb/d between 2013 and 2015, refined product demand grew by only 2 mb/d (of the total demand growth of 2.8 mb/d). The difference between the two implies a cumulative global stockbuild of about 400 mb of products between 2013-15. OECD product inventories, for which we have a comprehensive data set, increased by about 200 mb during that period. For the non-OECD, which now accounts for more than half of global oil demand, this would imply a product inventory increase of 200 mb over two years and an increase in demand coverage of five days.
20
40
60
80
100
120
-1.0-0.50.00.51.01.52.02.53.0
1Q11 1Q12 1Q13 1Q14 1Q15 1Q16
$/bblmb/dGlobal Refinery Intake vs Oil Price
Annual intake change Brent price (right)
-1.0-0.50.00.51.01.52.02.5
1Q14 3Q14 1Q15 3Q15 1Q16 3Q16*
mb/dGlobal crude balances
Total balance Ex Chinese reserves*China's September imports estimate per Lloyd's List Intelligence
With this product inventory cushion, refiners are now far more sensitive to even small changes in margins. Up to the first quarter of this year, when oil prices reached the lowest average level in 12 years, refiners were responding to lower feedstock costs more enthusiastically. As soon as crude prices started to recover, refinery intake growth drastically slowed. Enter the hidden dragon: global crude markets saw support from the Chinese crude oil imports that went mostly to fill the country’s strategic petroleum reserves (SPR).
Of a 0.9 mb/d observed crude excess in China (total supplies less refinery intake) in January-August this year, our estimates based on China Oil, Gas and Petrochemicals data show no cumulative build in commercial crude oil inventories. There is a view that Chinese independents could have processed an additional 100-200 kb/d of crude oil undeclared in official refinery throughput statistics, which results in an implied SPR filling rate of about 700 kb/d in average. This would have more than offset 2Q16’s y-o-y decline in global refinery throughput, reducing the global crude oil excess to a more modest 0.4-0.5 mb/d. In 3Q16, the crude market would have been merely balanced, but ongoing Chinese stockbuilds suggest that elsewhere in the world crude stocks have drawn at a rate close to 0.7 mb/d, the first significant decline since mid-2011. Of this, in fact, most has already manifested in the US and OECD Asia data.
In the US alone, weekly data show average 3Q16 crude stocks draw of about 300 kb/d. In OECD Asia, data based on Japanese weeklies for September, combined with monthly data for the rest ending in August, show a crude stocks draw of another 220 kb/d. Interestingly, JODI data for Saudi Arabia also show sizeable crude stocks draw in July (see OPEC Supply).

REFINING INTERNATIONAL ENERGY AGENCY - OIL MARKET REPORT
44 11 OCTOBER 2016
Crouching refiners, hidden stockbuilds (continued)
US refiners have seen their reliance on imported crude increasing this year due to declining LTO output as well as the Canadian wildfires cutting the supply of cheaper and, effectively, captive Canadian crudes in 2Q16. However, the significant eastward flow of crude oil seen in recent years to feed growing refinery runs East of Suez, as well as Chinese SPR filling means more competition for the US crude oil buyers.
Huge commercial stocks in the US, on the other hand, act as a swing supplier, as tightening WTI spreads due to lower local supply and less abundant imports prompt crude stock draws. Indeed, for the last two years, this spread has followed the same seasonal trend, tightening in 3Q, at the yearly peak of global crude demand. Brent spreads, at the same time, seem to be more random, as this benchmark is in effect pricing on the basis of more complex global fundamentals relative to WTI’s rather US-centric triggers.
-2.5
-2.0
-1.5
-1.0
-0.5
0.0
Jan Apr Jul Oct
$/bbl WTI front spread
2015 2016
-2.0
-1.5
-1.0
-0.5
0.0
0.5
Jan Apr Jul Oct
$/bbl ICE Brent front spread
2015 2016
In the last two years, the fourth quarter has seen the yearly peak in implied crude stockbuilds, both with and without taking into account Chinese stocks. This year 4Q refinery intake is expected to seasonally decline by about 1.1 mb/d, while crude burn will see another 300-400 kb/d decline. Thus, the global crude oil demand is expected to fall by 1.5 mb/d from 3Q16 levels. Will this mean crude stock builds returning in this quarter? OPEC’s recent announcement of an agreement to cut crude oil output, to be finalised at the end of November, seems to be more relevant for 2017 balances. In the meantime, the extent and duration of Chinese reserves filling may prove to be the biggest uncertainty. While still an inventory build, these barrels are effectively neutralised from the market, for an emergency situation, hence can be effectively added on the demand side.
Global Refinery Crude Throughput1
(million barrels per day)2Q2016 Jul 16 Aug 16 Sep 16 3Q2016 Oct 16 Nov 16 Dec 16 4Q2016 2016 Jan 17
Americas 18.9 19.4 19.6 19.1 19.4 18.0 19.2 19.5 18.9 19.0 19.0 Europe 11.4 12.3 12.5 11.6 12.1 11.7 11.8 12.1 11.9 11.8 11.9 Asia Oceania 6.7 6.8 6.9 6.6 6.8 6.4 6.8 7.1 6.8 6.8 7.2 Total OECD 37.1 38.5 39.0 37.3 38.3 36.0 37.8 38.7 37.5 37.7 38.1
FSU 6.7 7.1 7.1 6.8 7.0 6.5 6.9 6.9 6.8 6.8 7.0 Non-OECD Europe 0.5 0.5 0.4 0.4 0.5 0.5 0.5 0.5 0.5 0.5 0.5 China 10.8 10.7 10.4 10.6 10.6 10.8 10.9 10.9 10.8 10.7 11.0 Other Asia 10.4 10.8 10.4 10.2 10.4 10.2 10.4 10.6 10.4 10.4 10.8 Latin America 4.2 4.3 4.3 4.3 4.3 4.3 4.4 4.5 4.4 4.3 4.6 Middle East 6.6 6.9 6.8 6.9 6.8 6.7 6.4 6.2 6.5 6.7 6.8 Africa 2.1 2.1 2.1 2.1 2.1 2.0 2.1 2.1 2.1 2.1 2.2 Total Non-OECD 41.3 42.3 41.5 41.3 41.7 41.0 41.6 41.7 41.4 41.5 42.8
Total 78.3 80.8 80.5 78.6 80.0 77.0 79.4 80.4 78.9 79.1 80.9 1 Preliminary and estimated runs based on capacity, know n outages, economic runcuts and global demand forecast
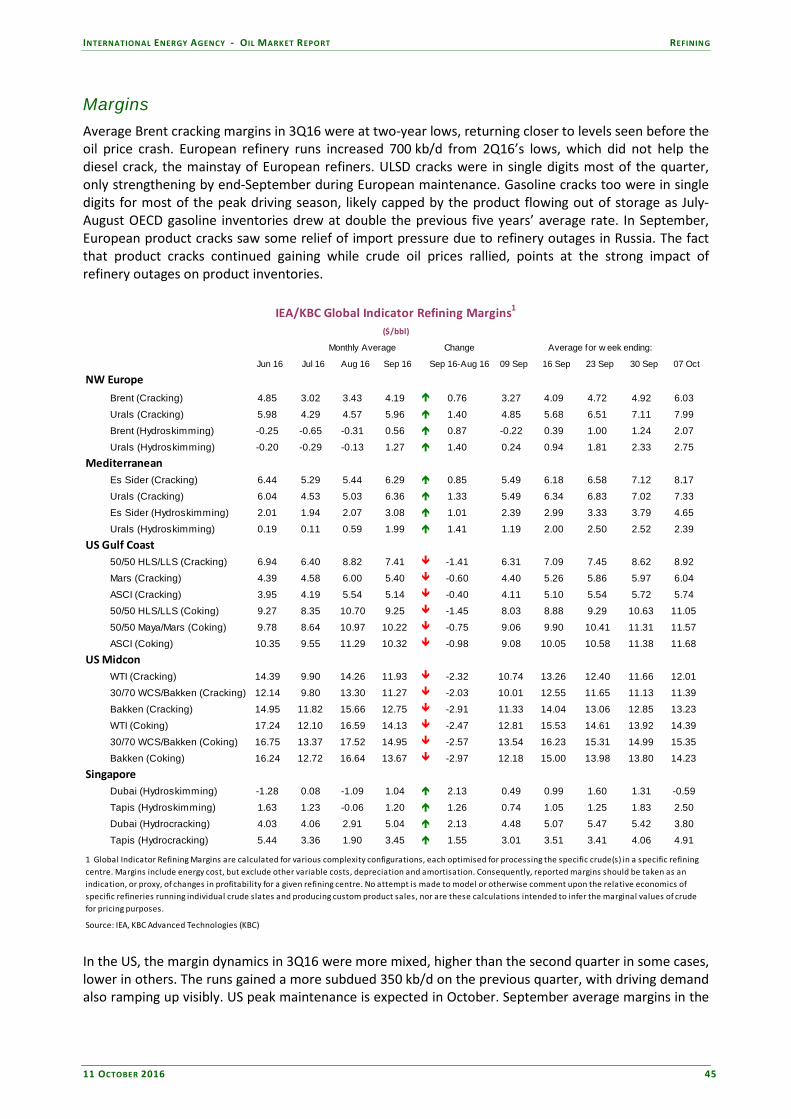
INTERNATIONAL ENERGY AGENCY - OIL MARKET REPORT REFINING
11 OCTOBER 2016 45
Margins Average Brent cracking margins in 3Q16 were at two-year lows, returning closer to levels seen before the oil price crash. European refinery runs increased 700 kb/d from 2Q16’s lows, which did not help the diesel crack, the mainstay of European refiners. ULSD cracks were in single digits most of the quarter, only strengthening by end-September during European maintenance. Gasoline cracks too were in single digits for most of the peak driving season, likely capped by the product flowing out of storage as July-August OECD gasoline inventories drew at double the previous five years’ average rate. In September, European product cracks saw some relief of import pressure due to refinery outages in Russia. The fact that product cracks continued gaining while crude oil prices rallied, points at the strong impact of refinery outages on product inventories.
IEA/KBC Global Indicator Refining Margins1
($/bbl)
Monthly Average Change Average for w eek ending:
Jun 16 Jul 16 Aug 16 Sep 16 Sep 16-Aug 16 09 Sep 16 Sep 23 Sep 30 Sep 07 Oct
NW Europe
Brent (Cracking) 4.85 3.02 3.43 4.19 0.76 3.27 4.09 4.72 4.92 6.03
Urals (Cracking) 5.98 4.29 4.57 5.96 1.40 4.85 5.68 6.51 7.11 7.99
Brent (Hydroskimming) -0.25 -0.65 -0.31 0.56 0.87 -0.22 0.39 1.00 1.24 2.07
Urals (Hydroskimming) -0.20 -0.29 -0.13 1.27 1.40 0.24 0.94 1.81 2.33 2.75
MediterraneanEs Sider (Cracking) 6.44 5.29 5.44 6.29 0.85 5.49 6.18 6.58 7.12 8.17
Urals (Cracking) 6.04 4.53 5.03 6.36 1.33 5.49 6.34 6.83 7.02 7.33
Es Sider (Hydroskimming) 2.01 1.94 2.07 3.08 1.01 2.39 2.99 3.33 3.79 4.65
Urals (Hydroskimming) 0.19 0.11 0.59 1.99 1.41 1.19 2.00 2.50 2.52 2.39
US Gulf Coast50/50 HLS/LLS (Cracking) 6.94 6.40 8.82 7.41 -1.41 6.31 7.09 7.45 8.62 8.92
Mars (Cracking) 4.39 4.58 6.00 5.40 -0.60 4.40 5.26 5.86 5.97 6.04
ASCI (Cracking) 3.95 4.19 5.54 5.14 -0.40 4.11 5.10 5.54 5.72 5.74
50/50 HLS/LLS (Coking) 9.27 8.35 10.70 9.25 -1.45 8.03 8.88 9.29 10.63 11.05
50/50 Maya/Mars (Coking) 9.78 8.64 10.97 10.22 -0.75 9.06 9.90 10.41 11.31 11.57
ASCI (Coking) 10.35 9.55 11.29 10.32 -0.98 9.08 10.05 10.58 11.38 11.68
US MidconWTI (Cracking) 14.39 9.90 14.26 11.93 -2.32 10.74 13.26 12.40 11.66 12.01
30/70 WCS/Bakken (Cracking) 12.14 9.80 13.30 11.27 -2.03 10.01 12.55 11.65 11.13 11.39
Bakken (Cracking) 14.95 11.82 15.66 12.75 -2.91 11.33 14.04 13.06 12.85 13.23
WTI (Coking) 17.24 12.10 16.59 14.13 -2.47 12.81 15.53 14.61 13.92 14.39
30/70 WCS/Bakken (Coking) 16.75 13.37 17.52 14.95 -2.57 13.54 16.23 15.31 14.99 15.35
Bakken (Coking) 16.24 12.72 16.64 13.67 -2.97 12.18 15.00 13.98 13.80 14.23
SingaporeDubai (Hydroskimming) -1.28 0.08 -1.09 1.04 2.13 0.49 0.99 1.60 1.31 -0.59
Tapis (Hydroskimming) 1.63 1.23 -0.06 1.20 1.26 0.74 1.05 1.25 1.83 2.50
Dubai (Hydrocracking) 4.03 4.06 2.91 5.04 2.13 4.48 5.07 5.47 5.42 3.80
Tapis (Hydrocracking) 5.44 3.36 1.90 3.45 1.55 3.01 3.51 3.41 4.06 4.91
1 Global Indicator Refining Margins are calculated for various complexity configurations, each optimised for processing the specific crude(s) in a specific refining centre. Margins include energy cost, but exclude other variable costs, depreciation and amortisation. Consequently, reported margins should be taken as an indication, or proxy, of changes in profitability for a given refining centre. No attempt is made to model or otherwise comment upon the relative economics of specific refineries running individual crude slates and producing custom product sales, nor are these calculations intended to infer the marginal values of crude for pricing purposes.
Source: IEA, KBC Advanced Technologies (KBC) In the US, the margin dynamics in 3Q16 were more mixed, higher than the second quarter in some cases, lower in others. The runs gained a more subdued 350 kb/d on the previous quarter, with driving demand also ramping up visibly. US peak maintenance is expected in October. September average margins in the

REFINING INTERNATIONAL ENERGY AGENCY - OIL MARKET REPORT
46 11 OCTOBER 2016
Gulf Coast were affected by the shutdown of the Colonial pipeline that moves excess US Gulf Coast gasoline and diesel to the product-deficient North-East. Dubai average cracking margins in Singapore improved in September, supported by the whole oil product complex, with simple distillation products such as naphtha and fuel oil especially stronger on the month.
OECD refinery throughput OECD July data were finalised with notable downgrades for the US and Japan, of about 130 kb/d each, contributing to OECD’s total 300 kb/d downward revision. Preliminary August data, on the contrary, came in at 415 kb/d higher than our forecast for the month, mostly on stronger European runs, which, if confirmed by the finalised data, will indicate the first y-o-y growth in Europe since January this year. The US too, according to preliminary data, is back again to y-o-y growth, after four consecutive months of declines. In Asia Pacific, after strong annual growth rates of 2Q16, July marked only a nominal 30 kb/d above year earlier, while August is showing a similar-sized decline.
Refinery Crude Throughput and Utilisation in OECD Countries(million barrels per day)
Change from Utilisation rate1
Mar 16 Apr 16 May 16 Jun 16 Jul 16 Aug 16 Jul 16 Aug 15 Aug 16 Aug 15
US2 16.11 15.94 16.28 16.43 16.56 16.75 0.19 0.08 0.91 0.93 Canada 1.74 1.66 1.31 1.57 1.77 1.82 0.05 -0.01 0.92 0.92 Chile 0.17 0.15 0.16 0.18 0.15 0.16 0.01 0.02 0.70 0.62 Mexico 1.09 1.05 1.01 1.03 0.93 0.85 -0.09 -0.22 0.51 0.64
OECD Americas3 19.10 18.80 18.76 19.21 19.41 19.57 0.16 -0.13 0.88 0.90
France 1.12 1.20 0.89 0.76 1.21 1.22 0.01 0.13 0.87 0.78 Germany 1.91 1.77 1.83 1.93 1.98 2.00 0.02 0.07 0.99 0.95 Italy 1.20 1.35 1.26 1.25 1.34 1.41 0.07 -0.01 0.80 0.81 Netherlands 1.04 1.07 1.06 1.07 1.04 1.08 0.03 0.03 0.83 0.81 Spain 1.27 1.25 1.11 1.21 1.35 1.33 -0.02 -0.08 0.88 0.93 United Kingdom 0.94 1.06 1.13 1.11 1.09 1.12 0.03 -0.10 0.81 0.88 Other OECD Europe 4.01 3.71 3.99 4.16 4.32 4.34 0.02 0.04 0.90 0.89
OECD Europe 11.50 11.42 11.27 11.50 12.32 12.48 0.16 0.08 0.88 0.87
Japan 3.31 3.32 3.00 2.85 3.03 3.36 0.32 0.03 0.95 0.86 South Korea 2.89 2.85 2.97 2.89 2.98 2.89 -0.10 0.01 0.88 0.87 Other Asia Oceania 0.78 0.78 0.79 0.79 0.76 0.70 -0.07 -0.08 0.70 0.78
OECD Asia Oceania 6.98 6.95 6.76 6.53 6.78 6.94 0.16 -0.04 0.89 0.86 OECD Total 37.57 37.16 36.78 37.24 38.51 38.99 0.49 -0.09 0.88 0.89
1 Expressed as a percentage, based on crude throughput and current operable refining capacity2 US503 OECD Americas includes Chile and OECD Asia Oceania includes Israel. OECD Europe includes Slovenia and Estonia, though neither country has a refinery Our latest estimate for third quarter OECD runs at 38.3 mb/d is a 1.2 mb/d increase on 2Q16, with most gains coming from Europe, the US and Canada, which recovered from the wildfire-related outages in 2Q16. OECD Asia Pacific ran flat quarter-on-quarter. Nevertheless, in terms of annual dynamics, OECD throughput continued to decline, sinking 350 kb/d below last year’s 3Q. Of special note is Mexico’s
0
3
6
9
12
15
18
Jan 15 Jul 15 Jan 16 Jul 16
$/bbl Regional Refining Margins
USGC coking Brent CrackingDubai Cracking
Data Source: IEA/KBC

INTERNATIONAL ENERGY AGENCY - OIL MARKET REPORT REFINING
11 OCTOBER 2016 47
precipitous declines, with runs dropping below 1 mb/d in July and declining further to 850 kb/d in August, implying a capacity utilisation rate of just 52%. Even with outages reported at a couple of the country’s refineries, this sort of decline in throughput was not expected. Mexico’s refining sector will need more investment to be able to bring refineries back into more normal utilisation rates. Even though we see runs rebounding from August lows, they will still stay in critical territory.
-0.5
-0.2
0.1
0.4
0.7
1.0
Jan 15 Jul 15 Jan 16 Jul 16
mb/d US refinery runsAnnual Change
0.80.91.01.11.21.31.4
Jan Mar May Jul Sep Nov Jan
mb/d Mexico
Range 10-14 Average 10-142015 20162016 est 2017 est
The outlook for 4Q16 is only positive for OECD Asia, both in terms of annual growth (at 100 kb/d) and quarter on quarter (q-o-q) changes (staying almost flat). In this region, there is a strong Q4-Q1 peak in demand, which is the combination of Northern Hemisphere heating demand in Japan and Korea, still largely oil-based, and Southern Hemisphere summer peak in Australia/New Zealand. European runs are expected to decline seasonally by 300 kb/d from the third quarter, marking a 400 kb/d decline y-o-y. North America’s seasonal decline is a bit heavier at 500 kb/d, with runs continuing to move lower from year earlier levels, losing some 200 kb/d.
34353637383940
Jan Mar May Jul Sep Nov Jan
mb/d OECD TotalCrude Throughput
Range 10-14 Average 10-142015 20162016 est 2017 est
10.010.511.011.512.012.513.013.5
Jan Mar May Jul Sep Nov Jan
mb/d OECD Europe Crude Throughput
Range 10-14 Average 10-142015 20162016 est 2017 est
In January 2017, we expect a more stable outlook in the OECD, with runs declining from December by a slightly more modest 600 kb/d than the seasonal average, and very small annual losses in the US and Europe (under 100 kb/d each) partly offset by a stronger Asia Pacific throughput (+100 kb/d). Non-OECD refinery throughput Finalised July numbers brought the non-OECD throughput estimate for that month down by 170 kb/d, on lower runs primarily in the Middle East and Latin America. The 3Q16 forecast, lowered by 490 kb/d, still points at an all-time peak rate of 41.7 mb/d, for a strong annual gain of 460 kb/d, after running flat y-o-y the previous quarter. Runs in the fourth quarter are forecast to decline seasonally by 300 kb/d, but still grow 560 mb/d y-o-y. The first forecast for 2017 sees January runs increasing by 1.15 mb/d from December, and up 1.26 mb/d from January 2016.
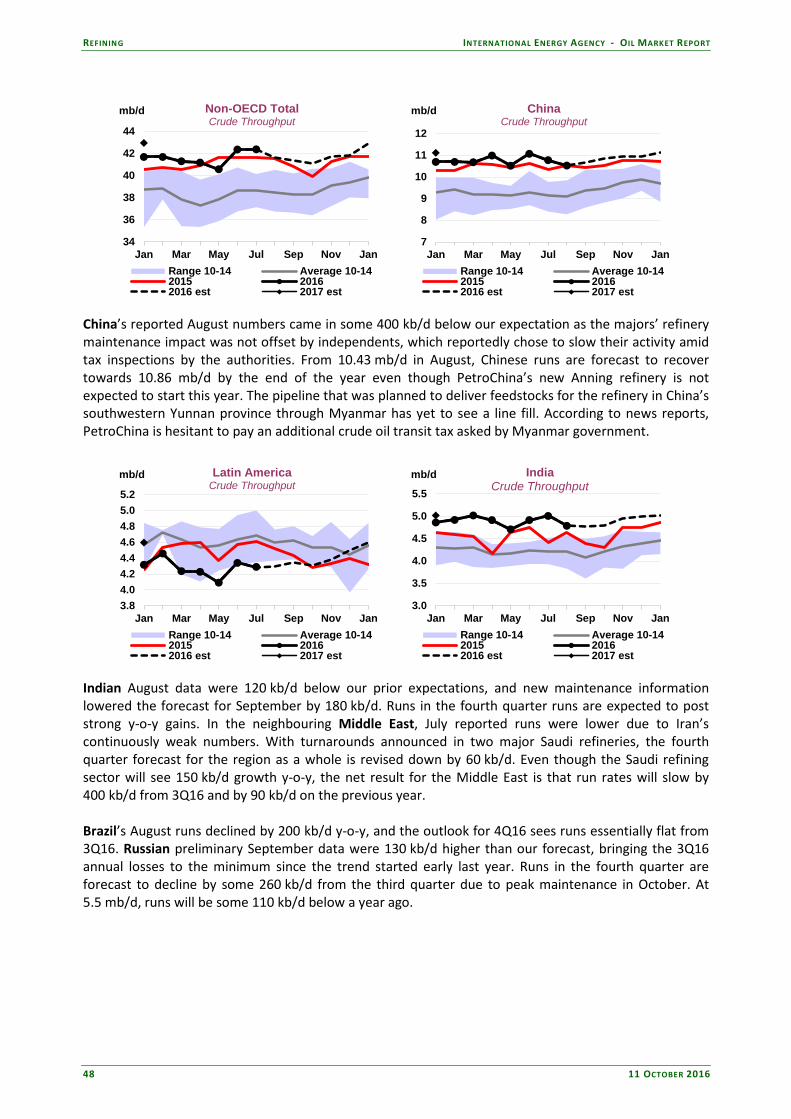
REFINING INTERNATIONAL ENERGY AGENCY - OIL MARKET REPORT
48 11 OCTOBER 2016
34
36
38
40
42
44
Jan Mar May Jul Sep Nov Jan
mb/d Non-OECD Total Crude Throughput
Range 10-14 Average 10-142015 20162016 est 2017 est
7
8
9
10
11
12
Jan Mar May Jul Sep Nov Jan
mb/d ChinaCrude Throughput
Range 10-14 Average 10-142015 20162016 est 2017 est
China’s reported August numbers came in some 400 kb/d below our expectation as the majors’ refinery maintenance impact was not offset by independents, which reportedly chose to slow their activity amid tax inspections by the authorities. From 10.43 mb/d in August, Chinese runs are forecast to recover towards 10.86 mb/d by the end of the year even though PetroChina’s new Anning refinery is not expected to start this year. The pipeline that was planned to deliver feedstocks for the refinery in China’s southwestern Yunnan province through Myanmar has yet to see a line fill. According to news reports, PetroChina is hesitant to pay an additional crude oil transit tax asked by Myanmar government.
3.84.04.24.44.64.85.05.2
Jan Mar May Jul Sep Nov Jan
mb/d Latin AmericaCrude Throughput
Range 10-14 Average 10-142015 20162016 est 2017 est
3.0
3.5
4.0
4.5
5.0
5.5
Jan Mar May Jul Sep Nov Jan
mb/d IndiaCrude Throughput
Range 10-14 Average 10-142015 20162016 est 2017 est
Indian August data were 120 kb/d below our prior expectations, and new maintenance information lowered the forecast for September by 180 kb/d. Runs in the fourth quarter runs are expected to post strong y-o-y gains. In the neighbouring Middle East, July reported runs were lower due to Iran’s continuously weak numbers. With turnarounds announced in two major Saudi refineries, the fourth quarter forecast for the region as a whole is revised down by 60 kb/d. Even though the Saudi refining sector will see 150 kb/d growth y-o-y, the net result for the Middle East is that run rates will slow by 400 kb/d from 3Q16 and by 90 kb/d on the previous year. Brazil’s August runs declined by 200 kb/d y-o-y, and the outlook for 4Q16 sees runs essentially flat from 3Q16. Russian preliminary September data were 130 kb/d higher than our forecast, bringing the 3Q16 annual losses to the minimum since the trend started early last year. Runs in the fourth quarter are forecast to decline by some 260 kb/d from the third quarter due to peak maintenance in October. At 5.5 mb/d, runs will be some 110 kb/d below a year ago.

INTERNATIONAL ENERGY AGENCY - OIL MARKET REPORT TABLES
11 OCTOBER 2016 49
TABLES Table 1: World Oil Supply And Demand 2013 2014 1Q15 2Q15 3Q15 4Q15 2015 1Q16 2Q16 3Q16 4Q16 2016 1Q17 2Q17 3Q17 4Q17 2017
OECD DEMANDAmericas 24.2 24.2 24.5 24.4 25.0 24.5 24.6 24.5 24.4 24.8 24.7 24.6 24.5 24.5 24.9 24.6 24.6Europe 13.6 13.5 13.5 13.6 14.2 13.7 13.7 13.6 13.9 14.2 13.7 13.9 13.6 13.9 14.2 13.7 13.8Asia Oceania 8.3 8.1 8.7 7.6 7.7 8.2 8.0 8.5 7.6 7.8 8.2 8.0 8.6 7.6 7.7 8.2 8.0
Total OECD 46.1 45.8 46.6 45.6 46.9 46.4 46.4 46.7 46.0 46.7 46.5 46.5 46.7 46.0 46.8 46.5 46.5
NON-OECD DEMANDFSU 4.8 4.9 4.7 4.9 5.1 5.0 4.9 4.9 4.9 5.3 5.2 5.1 5.0 5.1 5.3 5.2 5.2Europe 0.7 0.6 0.7 0.7 0.7 0.7 0.7 0.7 0.7 0.7 0.7 0.7 0.7 0.7 0.7 0.7 0.7China 10.4 10.8 11.3 11.5 11.5 11.6 11.5 11.6 11.8 11.6 11.8 11.7 11.8 11.9 12.0 12.1 12.0Other Asia 11.7 12.0 12.3 12.6 12.3 12.8 12.5 13.1 13.1 12.9 13.4 13.1 13.7 13.7 13.5 13.9 13.7Americas 6.6 6.8 6.6 6.8 6.9 6.8 6.8 6.5 6.7 6.8 6.8 6.7 6.5 6.7 6.8 6.8 6.7Middle East 8.0 8.4 7.8 8.5 8.7 8.3 8.3 7.8 8.3 8.7 8.3 8.3 8.0 8.4 8.8 8.4 8.4Africa 3.8 3.8 4.1 4.1 4.0 4.1 4.1 4.2 4.2 4.1 4.3 4.2 4.3 4.4 4.3 4.4 4.3
Total Non-OECD 45.9 47.4 47.4 48.9 49.2 49.2 48.7 48.8 49.8 50.1 50.5 49.8 50.0 50.9 51.3 51.7 51.0
Total Demand1 92.0 93.2 94.0 94.5 96.0 95.6 95.0 95.5 95.8 96.8 97.0 96.3 96.8 96.9 98.1 98.2 97.5
OECD SUPPLYAmericas4 17.2 19.1 20.1 19.7 20.1 20.1 20.0 19.9 19.0 19.1 19.3 19.3 19.4 19.4 19.5 19.5 19.4Europe 3.3 3.3 3.4 3.5 3.4 3.6 3.5 3.6 3.4 3.4 3.5 3.5 3.5 3.4 3.3 3.4 3.4Asia Oceania 0.5 0.5 0.4 0.4 0.5 0.5 0.5 0.4 0.4 0.4 0.4 0.4 0.4 0.4 0.4 0.5 0.4
Total OECD 21.0 22.9 23.9 23.6 24.0 24.2 23.9 24.0 22.8 23.0 23.2 23.2 23.3 23.2 23.2 23.3 23.3
NON-OECD SUPPLYFSU 13.8 13.9 14.0 14.0 13.9 14.1 14.0 14.2 14.0 14.0 14.2 14.1 14.3 14.3 14.2 14.4 14.3Europe 0.1 0.1 0.1 0.1 0.1 0.1 0.1 0.1 0.1 0.1 0.1 0.1 0.1 0.1 0.1 0.1 0.1China 4.2 4.2 4.3 4.4 4.3 4.3 4.3 4.2 4.1 3.9 3.9 4.0 4.0 3.9 3.9 3.9 3.9Other Asia2 2.7 2.7 2.8 2.8 2.7 2.8 2.8 2.8 2.7 2.7 2.7 2.7 2.6 2.6 2.7 2.6 2.6Americas2,4 4.2 4.4 4.6 4.6 4.6 4.6 4.6 4.4 4.4 4.5 4.6 4.5 4.6 4.7 4.7 4.8 4.7Middle East 1.4 1.3 1.3 1.3 1.2 1.2 1.3 1.3 1.3 1.3 1.3 1.3 1.3 1.3 1.3 1.2 1.3Africa2 2.0 2.1 2.1 2.1 2.0 2.0 2.1 2.0 1.9 2.0 2.1 2.0 2.1 2.1 2.1 2.1 2.1
Total Non-OECD 28.4 28.8 29.3 29.2 29.0 29.2 29.1 28.9 28.5 28.6 28.9 28.8 29.0 29.0 29.0 29.1 29.1
Processing gains3 2.2 2.2 2.2 2.2 2.2 2.2 2.2 2.3 2.3 2.3 2.3 2.3 2.3 2.3 2.3 2.3 2.3
Global Biofuels 2.0 2.2 1.8 2.4 2.6 2.3 2.3 1.9 2.4 2.8 2.4 2.4 2.0 2.5 2.9 2.5 2.5
Total Non-OPEC Supply2 53.6 56.1 57.2 57.4 57.7 57.9 57.6 57.0 56.1 56.6 56.8 56.6 56.6 57.0 57.4 57.2 57.0
OPECCrude 31.4 31.2 31.4 32.4 32.7 32.6 32.3 32.8 33.0 33.5NGLs 6.3 6.5 6.7 6.7 6.8 6.8 6.8 6.8 6.9 6.9 7.0 6.9 7.0 7.0 7.1 7.1 7.0
Total OPEC2 37.7 37.7 38.1 39.2 39.5 39.5 39.0 39.6 39.9 40.5
Total Supply4 91.4 93.8 95.3 96.5 97.2 97.4 96.6 96.6 95.9 97.1
STOCK CHANGES AND MISCELLANEOUSReported OECDIndustry -0.2 0.4 0.9 1.0 0.8 0.3 0.8 0.3 0.4Government 0.0 0.0 0.0 0.0 -0.1 0.1 0.0 0.1 0.0
Total -0.2 0.4 0.9 1.0 0.8 0.4 0.8 0.4 0.4Floating storage/Oil in transit 0.1 0.0 0.4 0.4 -0.2 0.5 0.3 0.2 0.3Miscellaneous to balance5 -0.6 0.2 0.0 0.6 0.6 0.9 0.5 0.6 -0.6
Total Stock Ch. & Misc -0.7 0.6 1.3 2.1 1.2 1.8 1.6 1.2 0.2 0.3
Memo items:Call on OPEC crude + Stock ch.6 32.1 30.6 30.1 30.4 31.5 30.9 30.7 31.6 32.9 33.3 33.2 32.7 33.2 32.9 33.7 33.9 33.41 Measured as deliveries from refineries and primary stocks, comprises inland deliveries, international marine bunkers, refinery fuel, crude for direct burning, oil from non-conventional sources and other sources of supply.2 Other Asia excludes Indonesia throughout. Latin America excludes Ecuador throughout. Africa excludes Angola and Gabon throughout. Total Non-OPEC excludes all countries that were members of OPEC at 1 July 2016. Total OPEC comprises all countries which were OPEC members at 1 July 2016.3 Net volumetric gains and losses in the refining process and marine transportation losses.4 Comprises crude oil, condensates, NGLs, oil from non-conventional sources and other sources of supply.5 Includes changes in non-reported stocks in OECD and non-OECD areas.6 Equals the arithmetic difference between total demand minus total non-OPEC supply minus OPEC NGLs.
Table 1WORLD OIL SUPPLY AND DEMAND
(million barrels per day)

TABLES INTERNATIONAL ENERGY AGENCY - OIL MARKET REPORT
50 11 OCTOBER 2016
Table 1a: World Oil Supply And Demand: Changes From Last Month’s Table 1
2013 2014 1Q15 2Q15 3Q15 4Q15 2015 1Q16 2Q16 3Q16 4Q16 2016 1Q17 2Q17 3Q17 4Q17 2017
OECD DEMANDAmericas - - 0.1 0.2 0.2 0.1 0.1 - - -0.1 - - - - - - -Europe - - - - - - - - - 0.1 0.1 - - - 0.1 - -Asia Oceania - - - - - - - - - - 0.1 - - - - - -
Total OECD - - 0.1 0.2 0.2 0.1 0.1 - - - 0.2 0.1 0.1 - - 0.1 0.1
NON-OECD DEMANDFSU - - - - - - - - - 0.1 0.1 0.1 0.1 0.1 0.1 0.1 0.1Europe - - - - - - - - - - - - - - - - -China - - 0.1 - - - - 0.1 0.2 0.1 - 0.1 0.1 0.1 0.1 0.1 0.1Other Asia - - - - - - - - 0.1 0.1 0.1 0.1 - - 0.1 0.1 0.1Americas - - - - - - - - - - - - - - - - -Middle East - - - - - - - - - -0.1 - - - -0.1 -0.1 -0.1 -0.1Africa - - - - - - - - - - - - - - - - -
Total Non-OECD - - 0.1 - 0.1 0.1 0.1 0.1 0.2 0.1 - 0.1 0.2 0.1 0.1 0.1 0.1Total Demand - - 0.2 0.2 0.2 0.1 0.2 0.1 0.2 0.2 0.2 0.2 0.2 0.2 0.2 0.2 0.2
OECD SUPPLYAmericas - - 0.1 0.1 0.1 0.1 0.1 - - - -0.1 - - - 0.1 - -Europe - - - - - - - - - - -0.1 - - - - - -Asia Oceania - - - - - - - - - - - - - - - - -
Total OECD - - 0.1 0.1 0.1 0.1 0.1 - - 0.1 -0.1 - - - 0.1 - -
NON-OECD SUPPLYFSU - - - - - - - - - - 0.1 - 0.1 0.1 - - 0.1Europe - - - - - - - - - - - - - - - - -China - - - - - - - - - -0.1 -0.1 - -0.1 -0.1 -0.1 -0.1 -0.1Other Asia - - - - - - - - - - - - - - - - -Americas - - - - - - - - - - -0.1 - - - - - -Middle East - - - - - - - - - - - - - - - - -Africa - - - - - - - - - - - - - - - - -
Total Non-OECD - - - - - - - - - -0.1 - - - - - - -Processing gains - - - - - - - - - - - - - - - - -
Global Biofuels - - - - - - - - - - - - - - - - -
Total Non-OPEC Supply - - 0.1 0.1 0.1 0.1 0.1 - - - -0.2 - - - 0.1 -0.1 -
OPECCrude - - - - - - - - - 0.1NGLs - - - - - - - - - - -0.1 - - - - - -Total OPEC - - - - - - - - - 0.1Total Supply - - 0.1 0.1 0.1 0.1 0.1 - 0.1 -
STOCK CHANGES AND MISCELLANEOUSREPORTED OECDIndustry - - 0.1 -0.1 - - - - -Government - - - - - - - - -
Total - - 0.1 -0.1 - - - - -Floating storage/Oil in transit - - - - - - - - 0.3Miscellaneous to balance - - -0.2 -0.1 -0.1 - -0.1 -0.1 -0.5
Total Stock Ch. & Misc - - -0.2 -0.2 -0.1 -0.1 -0.1 -0.1 -0.1 -0.1
Memo items:Call on OPEC crude + Stock ch. - - 0.2 0.2 0.1 0.1 0.1 0.1 0.2 0.2 0.5 0.2 0.3 0.2 0.1 0.3 0.2When submitting their monthly oil statistics, OECD Member countries periodically update data for prior periods. Similar updates to non-OECD data can occur.
Table 1aWORLD OIL SUPPLY AND DEMAND: CHANGES FROM LAST MONTH'S TABLE 1
(million barrels per day)

INTERNATIONAL ENERGY AGENCY - OIL MARKET REPORT TABLES
11 OCTOBER 2016 51
Table 2: Summary of Global Oil Demand 2014 1Q15 2Q15 3Q15 4Q15 2015 1Q16 2Q16 3Q16 4Q16 2016 1Q17 2Q17 3Q17 4Q17 2017
Demand (mb/d)Americas 24.20 24.46 24.42 24.99 24.53 24.60 24.48 24.40 24.78 24.65 24.58 24.52 24.48 24.90 24.65 24.64Europe 13.51 13.46 13.57 14.16 13.71 13.73 13.64 13.94 14.17 13.70 13.86 13.64 13.89 14.15 13.69 13.85Asia Oceania 8.11 8.68 7.58 7.71 8.18 8.03 8.54 7.64 7.76 8.19 8.03 8.58 7.62 7.73 8.17 8.02Total OECD 45.82 46.59 45.56 46.86 46.41 46.36 46.66 45.97 46.71 46.54 46.47 46.74 46.00 46.79 46.51 46.51Asia 22.80 23.62 24.02 23.84 24.39 23.97 24.71 24.93 24.47 25.22 24.83 25.46 25.64 25.46 26.08 25.66Middle East 8.37 7.76 8.46 8.74 8.26 8.31 7.83 8.34 8.68 8.33 8.30 8.04 8.40 8.78 8.42 8.41Americas 6.83 6.62 6.77 6.86 6.79 6.76 6.49 6.68 6.80 6.78 6.69 6.51 6.69 6.83 6.81 6.71FSU 4.94 4.66 4.91 5.07 4.98 4.91 4.94 4.93 5.32 5.20 5.10 5.01 5.13 5.31 5.24 5.17Africa 3.83 4.08 4.05 3.97 4.12 4.05 4.16 4.22 4.13 4.27 4.19 4.31 4.36 4.25 4.40 4.33Europe 0.65 0.65 0.67 0.69 0.69 0.68 0.68 0.71 0.70 0.71 0.70 0.69 0.72 0.71 0.72 0.71Total Non-OECD 47.41 47.40 48.89 49.17 49.23 48.68 48.82 49.79 50.10 50.50 49.80 50.02 50.94 51.35 51.68 51.00World 93.22 93.99 94.45 96.03 95.64 95.04 95.48 95.77 96.80 97.04 96.28 96.76 96.93 98.13 98.19 97.51
of which: US50 19.11 19.41 19.47 19.83 19.42 19.53 19.45 19.43 19.75 19.63 19.57 19.50 19.55 19.87 19.65 19.64Europe 5* 8.05 8.03 7.99 8.34 8.09 8.12 8.14 8.20 8.31 8.08 8.18 8.12 8.11 8.25 8.06 8.13
China 10.77 11.32 11.45 11.54 11.57 11.47 11.63 11.79 11.60 11.82 11.71 11.80 11.91 11.98 12.13 11.95Japan 4.27 4.70 3.80 3.85 4.14 4.12 4.43 3.66 3.73 4.03 3.96 4.34 3.52 3.63 3.99 3.87India 3.84 3.97 4.04 3.85 4.10 3.99 4.36 4.32 4.13 4.36 4.29 4.60 4.63 4.46 4.63 4.58
Russia 3.79 3.54 3.73 3.87 3.71 3.71 3.75 3.65 4.01 3.82 3.81 3.80 3.82 3.98 3.89 3.87Brazil 3.24 3.17 3.17 3.22 3.20 3.19 3.02 3.07 3.13 3.16 3.10 3.01 3.05 3.14 3.18 3.10
Saudi Arabia 3.19 2.88 3.47 3.58 3.22 3.29 2.94 3.34 3.48 3.16 3.23 2.98 3.30 3.51 3.17 3.24Canada 2.41 2.43 2.33 2.45 2.40 2.41 2.39 2.37 2.44 2.38 2.40 2.39 2.32 2.44 2.35 2.38
Korea 2.35 2.46 2.29 2.36 2.52 2.41 2.59 2.48 2.54 2.65 2.57 2.72 2.60 2.60 2.68 2.65Mexico 2.04 1.94 1.97 2.07 2.05 2.01 1.98 1.94 1.94 1.98 1.96 1.95 1.96 1.94 1.98 1.96
Iran 2.04 1.87 1.89 1.84 1.94 1.89 1.85 1.85 1.87 1.97 1.88 1.92 1.90 1.93 2.01 1.94Total 65.09 65.72 65.62 66.80 66.37 66.13 66.54 66.10 66.92 67.05 66.65 67.15 66.67 67.72 67.72 67.32
% of World 69.8% 69.9% 69.5% 69.6% 69.4% 69.6% 69.7% 69.0% 69.1% 69.1% 69.2% 69.4% 68.8% 69.0% 69.0% 69.0%
Annual Change (% per annum)Americas 0.2 2.2 2.7 2.3 -0.4 1.7 0.1 -0.1 -0.8 0.5 -0.1 0.2 0.4 0.5 0.0 0.3Europe -0.7 2.8 0.7 1.6 1.3 1.6 1.3 2.7 0.1 0.0 1.0 0.0 -0.3 -0.1 0.0 -0.1Asia Oceania -2.8 -2.2 -0.8 0.8 -1.4 -0.9 -1.5 0.9 0.6 0.2 0.0 0.4 -0.3 -0.3 -0.2 -0.1Total OECD -0.6 1.5 1.5 1.8 -0.1 1.2 0.1 0.9 -0.3 0.3 0.2 0.2 0.0 0.2 -0.1 0.1Asia 3.6 4.1 4.8 6.9 4.8 5.1 4.6 3.8 2.7 3.4 3.6 3.0 2.8 4.0 3.4 3.3Middle East 4.4 -4.1 -0.7 0.5 1.1 -0.7 0.9 -1.4 -0.8 0.8 -0.2 2.6 0.8 1.1 1.1 1.4Americas 2.7 0.2 -0.4 -1.5 -1.9 -0.9 -2.0 -1.4 -0.9 -0.3 -1.1 0.2 0.2 0.5 0.5 0.4FSU 3.9 0.2 0.5 -1.5 -1.3 -0.6 5.9 0.3 4.8 4.4 3.8 1.5 4.1 -0.2 0.9 1.5Africa 0.0 3.5 4.7 6.6 8.7 5.9 2.1 4.0 4.1 3.7 3.5 3.6 3.5 3.1 3.1 3.3Europe -1.5 5.2 4.6 3.7 5.3 4.7 3.3 5.0 2.2 2.3 3.1 2.7 1.5 0.8 2.5 1.9Total Non-OECD 3.3 1.7 2.6 3.5 2.9 2.7 3.0 1.8 1.9 2.6 2.3 2.5 2.3 2.5 2.3 2.4World 1.3 1.6 2.1 2.7 1.4 1.9 1.6 1.4 0.8 1.5 1.3 1.3 1.2 1.4 1.2 1.3Annual Change (mb/d)Americas 0.04 0.52 0.64 0.56 -0.09 0.40 0.02 -0.02 -0.21 0.12 -0.02 0.04 0.09 0.12 0.00 0.06Europe -0.10 0.36 0.09 0.23 0.18 0.21 0.18 0.36 0.01 -0.01 0.14 0.00 -0.04 -0.02 0.00 -0.02Asia Oceania -0.23 -0.19 -0.06 0.06 -0.11 -0.08 -0.13 0.07 0.05 0.01 0.00 0.04 -0.02 -0.02 -0.02 -0.01Total OECD -0.29 0.69 0.66 0.85 -0.03 0.54 0.07 0.41 -0.15 0.13 0.11 0.07 0.02 0.08 -0.03 0.04Asia 0.79 0.93 1.09 1.54 1.11 1.17 1.09 0.91 0.63 0.84 0.87 0.74 0.71 0.99 0.85 0.83Middle East 0.35 -0.33 -0.06 0.05 0.09 -0.06 0.07 -0.12 -0.07 0.06 -0.01 0.21 0.06 0.10 0.09 0.12Americas 0.18 0.01 -0.03 -0.10 -0.13 -0.06 -0.13 -0.10 -0.06 -0.02 -0.08 0.01 0.01 0.03 0.04 0.02FSU 0.18 0.01 0.02 -0.08 -0.07 -0.03 0.28 0.01 0.24 0.22 0.19 0.07 0.20 -0.01 0.05 0.08Africa 0.00 0.14 0.18 0.25 0.33 0.22 0.09 0.16 0.16 0.15 0.14 0.15 0.15 0.13 0.13 0.14Europe -0.01 0.03 0.03 0.02 0.04 0.03 0.02 0.03 0.02 0.02 0.02 0.02 0.01 0.01 0.02 0.01Total Non-OECD 1.49 0.79 1.24 1.68 1.37 1.27 1.42 0.90 0.93 1.27 1.13 1.21 1.14 1.25 1.18 1.20World 1.21 1.48 1.90 2.53 1.34 1.81 1.49 1.31 0.77 1.40 1.24 1.28 1.16 1.33 1.15 1.23Revisions to Oil Demand from Last Month's Report (mb/d)Americas 0.00 0.12 0.23 0.16 0.06 0.14 0.00 0.01 -0.13 0.03 -0.02 0.00 -0.03 -0.04 -0.02 -0.02Europe 0.00 0.00 0.00 0.00 0.00 0.00 0.00 0.02 0.10 0.05 0.04 0.05 0.05 0.05 0.04 0.05Asia Oceania 0.00 0.00 0.00 0.00 0.00 0.00 0.00 0.00 0.05 0.07 0.03 0.03 0.03 0.03 0.03 0.03Total OECD 0.00 0.12 0.23 0.16 0.06 0.14 0.00 0.03 0.02 0.15 0.05 0.08 0.05 0.04 0.05 0.06Asia 0.00 0.13 0.05 0.08 0.05 0.08 0.16 0.23 0.17 0.03 0.15 0.15 0.14 0.16 0.17 0.15Middle East 0.00 -0.02 -0.02 -0.01 0.02 -0.01 -0.01 -0.01 -0.08 -0.03 -0.03 -0.03 -0.07 -0.10 -0.08 -0.07Americas 0.00 0.02 0.02 0.02 0.02 0.02 -0.02 -0.02 -0.03 -0.02 -0.02 0.02 0.02 0.01 0.02 0.02FSU 0.01 -0.01 -0.01 -0.01 0.00 -0.01 0.00 0.00 0.11 0.09 0.05 0.06 0.06 0.07 0.06 0.06Africa 0.00 -0.02 -0.03 -0.03 -0.03 -0.03 -0.05 -0.04 -0.03 -0.04 -0.04 -0.03 -0.03 -0.03 -0.03 -0.03Europe 0.00 0.00 0.00 0.00 0.00 0.00 0.00 0.00 0.00 0.00 0.00 0.01 0.00 0.00 0.00 0.00Total Non-OECD 0.02 0.10 0.02 0.06 0.06 0.06 0.10 0.16 0.13 0.03 0.11 0.17 0.12 0.11 0.14 0.14World 0.02 0.22 0.24 0.21 0.12 0.20 0.10 0.19 0.15 0.18 0.16 0.25 0.17 0.16 0.19 0.19Revisions to Oil Demand Growth from Last Month's Report (mb/d)World 0.02 0.21 0.23 0.20 0.09 0.18 -0.11 -0.05 -0.06 0.06 -0.04 0.15 -0.02 0.01 0.01 0.04* France, Germany, Italy, Spain and UK
Table 2SUMMARY OF GLOBAL OIL DEMAND
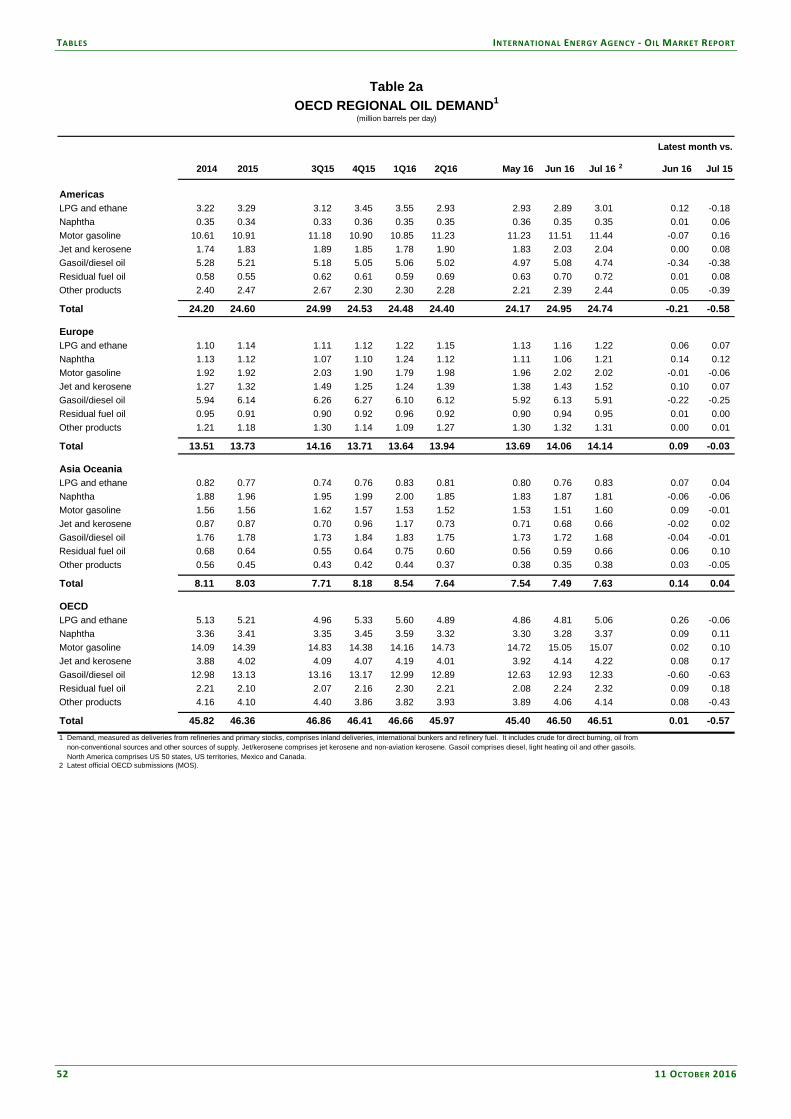
TABLES INTERNATIONAL ENERGY AGENCY - OIL MARKET REPORT
52 11 OCTOBER 2016
Table 2a: OECD Regional Oil Demand
2014 2015 3Q15 4Q15 1Q16 2Q16 May 16 Jun 16 Jul 16 2 Jun 16 Jul 15
AmericasLPG and ethane 3.22 3.29 3.12 3.45 3.55 2.93 2.93 2.89 3.01 0.12 -0.18 Naphtha 0.35 0.34 0.33 0.36 0.35 0.35 0.36 0.35 0.35 0.01 0.06 Motor gasoline 10.61 10.91 11.18 10.90 10.85 11.23 11.23 11.51 11.44 -0.07 0.16 Jet and kerosene 1.74 1.83 1.89 1.85 1.78 1.90 1.83 2.03 2.04 0.00 0.08 Gasoil/diesel oil 5.28 5.21 5.18 5.05 5.06 5.02 4.97 5.08 4.74 -0.34 -0.38 Residual fuel oil 0.58 0.55 0.62 0.61 0.59 0.69 0.63 0.70 0.72 0.01 0.08 Other products 2.40 2.47 2.67 2.30 2.30 2.28 2.21 2.39 2.44 0.05 -0.39
Total 24.20 24.60 24.99 24.53 24.48 24.40 24.17 24.95 24.74 -0.21 -0.58
EuropeLPG and ethane 1.10 1.14 1.11 1.12 1.22 1.15 1.13 1.16 1.22 0.06 0.07 Naphtha 1.13 1.12 1.07 1.10 1.24 1.12 1.11 1.06 1.21 0.14 0.12 Motor gasoline 1.92 1.92 2.03 1.90 1.79 1.98 1.96 2.02 2.02 -0.01 -0.06 Jet and kerosene 1.27 1.32 1.49 1.25 1.24 1.39 1.38 1.43 1.52 0.10 0.07 Gasoil/diesel oil 5.94 6.14 6.26 6.27 6.10 6.12 5.92 6.13 5.91 -0.22 -0.25 Residual fuel oil 0.95 0.91 0.90 0.92 0.96 0.92 0.90 0.94 0.95 0.01 0.00 Other products 1.21 1.18 1.30 1.14 1.09 1.27 1.30 1.32 1.31 0.00 0.01
Total 13.51 13.73 14.16 13.71 13.64 13.94 13.69 14.06 14.14 0.09 -0.03
Asia OceaniaLPG and ethane 0.82 0.77 0.74 0.76 0.83 0.81 0.80 0.76 0.83 0.07 0.04 Naphtha 1.88 1.96 1.95 1.99 2.00 1.85 1.83 1.87 1.81 -0.06 -0.06 Motor gasoline 1.56 1.56 1.62 1.57 1.53 1.52 1.53 1.51 1.60 0.09 -0.01 Jet and kerosene 0.87 0.87 0.70 0.96 1.17 0.73 0.71 0.68 0.66 -0.02 0.02 Gasoil/diesel oil 1.76 1.78 1.73 1.84 1.83 1.75 1.73 1.72 1.68 -0.04 -0.01 Residual fuel oil 0.68 0.64 0.55 0.64 0.75 0.60 0.56 0.59 0.66 0.06 0.10 Other products 0.56 0.45 0.43 0.42 0.44 0.37 0.38 0.35 0.38 0.03 -0.05
Total 8.11 8.03 7.71 8.18 8.54 7.64 7.54 7.49 7.63 0.14 0.04
OECDLPG and ethane 5.13 5.21 4.96 5.33 5.60 4.89 4.86 4.81 5.06 0.26 -0.06 Naphtha 3.36 3.41 3.35 3.45 3.59 3.32 3.30 3.28 3.37 0.09 0.11 Motor gasoline 14.09 14.39 14.83 14.38 14.16 14.73 14.72 15.05 15.07 0.02 0.10 Jet and kerosene 3.88 4.02 4.09 4.07 4.19 4.01 3.92 4.14 4.22 0.08 0.17 Gasoil/diesel oil 12.98 13.13 13.16 13.17 12.99 12.89 12.63 12.93 12.33 -0.60 -0.63 Residual fuel oil 2.21 2.10 2.07 2.16 2.30 2.21 2.08 2.24 2.32 0.09 0.18 Other products 4.16 4.10 4.40 3.86 3.82 3.93 3.89 4.06 4.14 0.08 -0.43
Total 45.82 46.36 46.86 46.41 46.66 45.97 45.40 46.50 46.51 0.01 -0.57 1 Demand, measured as deliveries from refineries and primary stocks, comprises inland deliveries, international bunkers and refinery fuel. It includes crude for direct burning, oil from non-conventional sources and other sources of supply. Jet/kerosene comprises jet kerosene and non-aviation kerosene. Gasoil comprises diesel, light heating oil and other gasoils. North America comprises US 50 states, US territories, Mexico and Canada. 2 Latest official OECD submissions (MOS).
Latest month vs.
Table 2aOECD REGIONAL OIL DEMAND1
(million barrels per day)

INTERNATIONAL ENERGY AGENCY - OIL MARKET REPORT TABLES
11 OCTOBER 2016 53
Table 2b: Oil Demand in Selected OECD Countries
2014 2015 3Q15 4Q15 1Q16 2Q16 May 16 Jun 16 Jul 16 2 Jun 16 Jul 15
United States3
LPG and ethane 2.40 2.45 2.29 2.57 2.69 2.21 2.23 2.14 2.30 0.16 -0.08 Naphtha 0.23 0.22 0.22 0.24 0.22 0.22 0.23 0.22 0.22 0.01 0.03 Motor gasoline 8.92 9.18 9.41 9.17 9.09 9.44 9.44 9.66 9.60 -0.07 0.13 Jet and kerosene 1.48 1.55 1.60 1.58 1.51 1.62 1.57 1.72 1.72 0.00 0.07 Gasoil/diesel oil 4.04 4.00 3.96 3.86 3.90 3.81 3.74 3.86 3.58 -0.28 -0.32 Residual fuel oil 0.26 0.26 0.30 0.28 0.31 0.41 0.33 0.41 0.45 0.05 0.13 Other products 1.78 1.87 2.06 1.70 1.72 1.73 1.66 1.82 1.84 0.01 -0.37
Total 19.11 19.53 19.83 19.42 19.45 19.43 19.20 19.83 19.71 -0.12 -0.41 JapanLPG and ethane 0.49 0.43 0.39 0.40 0.47 0.42 0.41 0.36 0.44 0.08 0.03 Naphtha 0.74 0.78 0.78 0.80 0.79 0.72 0.66 0.70 0.68 -0.01 -0.07 Motor gasoline 0.92 0.91 0.97 0.92 0.87 0.88 0.88 0.87 0.95 0.08 -0.02 Jet and kerosene 0.52 0.50 0.35 0.57 0.74 0.37 0.36 0.33 0.31 -0.02 0.00 Diesel 0.41 0.41 0.41 0.42 0.41 0.38 0.37 0.39 0.40 0.01 0.00 Other gasoil 0.36 0.35 0.30 0.36 0.40 0.32 0.31 0.31 0.31 0.00 0.01 Residual fuel oil 0.42 0.36 0.31 0.32 0.38 0.30 0.27 0.30 0.34 0.04 0.02 Other products 0.41 0.37 0.35 0.35 0.37 0.27 0.29 0.26 0.31 0.05 -0.03
Total 4.27 4.12 3.85 4.14 4.43 3.66 3.54 3.52 3.74 0.22 -0.05 GermanyLPG and ethane 0.09 0.10 0.10 0.08 0.10 0.11 0.11 0.11 0.10 0.00 0.00 Naphtha 0.41 0.40 0.37 0.40 0.42 0.36 0.36 0.36 0.45 0.09 0.09 Motor gasoline 0.43 0.42 0.44 0.42 0.39 0.43 0.43 0.43 0.44 0.00 -0.01 Jet and kerosene 0.18 0.18 0.20 0.18 0.17 0.20 0.19 0.20 0.23 0.02 0.02 Diesel 0.71 0.75 0.79 0.77 0.72 0.80 0.75 0.82 0.82 0.00 -0.01 Other gasoil 0.37 0.35 0.34 0.37 0.46 0.28 0.26 0.23 0.20 -0.03 -0.07 Residual fuel oil 0.12 0.12 0.12 0.11 0.14 0.13 0.13 0.12 0.11 -0.01 -0.01 Other products 0.06 0.05 0.08 0.05 0.01 0.07 0.07 0.06 0.05 -0.01 0.00
Total 2.37 2.37 2.44 2.39 2.42 2.37 2.29 2.34 2.40 0.06 0.02 ItalyLPG and ethane 0.10 0.11 0.10 0.12 0.12 0.10 0.10 0.10 0.10 0.00 -0.01 Naphtha 0.07 0.09 0.09 0.09 0.11 0.12 0.11 0.12 0.10 -0.02 0.03 Motor gasoline 0.20 0.21 0.23 0.21 0.20 0.21 0.21 0.20 0.22 0.01 -0.02 Jet and kerosene 0.09 0.10 0.12 0.08 0.09 0.11 0.11 0.12 0.13 0.01 0.01 Diesel 0.48 0.44 0.45 0.45 0.42 0.45 0.44 0.46 0.46 0.00 -0.04 Other gasoil 0.09 0.09 0.09 0.10 0.08 0.08 0.07 0.09 0.09 0.00 0.00 Residual fuel oil 0.07 0.08 0.08 0.08 0.07 0.07 0.06 0.07 0.07 0.00 -0.02 Other products 0.15 0.15 0.15 0.15 0.12 0.15 0.15 0.15 0.15 0.00 -0.02
Total 1.27 1.27 1.32 1.28 1.21 1.29 1.26 1.32 1.32 0.00 -0.07 FranceLPG and ethane 0.13 0.13 0.11 0.13 0.17 0.14 0.14 0.14 0.13 0.00 0.02 Naphtha 0.13 0.13 0.13 0.09 0.14 0.12 0.13 0.10 0.13 0.03 -0.01 Motor gasoline 0.16 0.16 0.18 0.16 0.15 0.18 0.18 0.17 0.19 0.01 -0.01 Jet and kerosene 0.15 0.15 0.17 0.15 0.14 0.15 0.15 0.15 0.17 0.03 0.00 Diesel 0.70 0.71 0.72 0.72 0.67 0.72 0.75 0.69 0.71 0.02 -0.07 Other gasoil 0.25 0.25 0.28 0.23 0.26 0.20 0.20 0.17 0.20 0.04 -0.02 Residual fuel oil 0.05 0.04 0.04 0.04 0.04 0.03 0.03 0.02 0.04 0.01 -0.01 Other products 0.12 0.12 0.12 0.10 0.12 0.13 0.12 0.14 0.14 0.00 0.00
Total 1.69 1.69 1.76 1.63 1.69 1.66 1.71 1.58 1.72 0.14 -0.09 United KingdomLPG and ethane 0.12 0.14 0.12 0.14 0.18 0.16 0.14 0.17 0.17 0.00 0.05 Naphtha 0.02 0.03 0.03 0.04 0.04 0.03 0.04 0.03 0.03 -0.01 0.00 Motor gasoline 0.30 0.29 0.30 0.29 0.28 0.30 0.29 0.31 0.28 -0.03 -0.01 Jet and kerosene 0.31 0.31 0.32 0.30 0.33 0.31 0.31 0.29 0.29 0.01 0.02 Diesel 0.48 0.50 0.50 0.51 0.49 0.52 0.49 0.54 0.51 -0.03 0.02 Other gasoil 0.13 0.13 0.14 0.13 0.12 0.14 0.12 0.17 0.14 -0.04 0.00 Residual fuel oil 0.03 0.03 0.03 0.03 0.02 0.03 0.03 0.03 0.03 0.00 0.00 Other products 0.12 0.12 0.13 0.12 0.11 0.12 0.13 0.13 0.13 0.00 0.00
Total 1.52 1.55 1.57 1.56 1.57 1.62 1.55 1.67 1.58 -0.09 0.08 CanadaLPG and ethane 0.36 0.38 0.38 0.41 0.43 0.36 0.36 0.38 0.35 -0.03 0.00 Naphtha 0.09 0.09 0.09 0.10 0.11 0.10 0.10 0.11 0.10 0.00 0.02 Motor gasoline 0.81 0.82 0.86 0.81 0.83 0.86 0.86 0.90 0.91 0.01 0.04 Jet and kerosene 0.14 0.14 0.16 0.14 0.13 0.14 0.13 0.17 0.17 -0.01 0.00 Diesel 0.29 0.31 0.32 0.29 0.30 0.31 0.30 0.32 0.30 -0.02 -0.02 Other gasoil 0.30 0.26 0.26 0.26 0.22 0.25 0.28 0.23 0.22 -0.01 -0.01 Residual fuel oil 0.05 0.04 0.02 0.03 0.05 0.03 0.03 0.02 0.02 0.00 0.00 Other products 0.36 0.35 0.37 0.36 0.32 0.31 0.30 0.31 0.38 0.06 -0.01
Total 2.41 2.41 2.45 2.40 2.39 2.37 2.36 2.45 2.45 0.00 0.01 1 Demand, measured as deliveries from refineries and primary stocks, comprises inland deliveries, international bunkers and refinery fuel. It includes crude for direct burning, oil from non-conventional sources and other sources of supply. Jet/kerosene comprises jet kerosene and non-aviation kerosene. Gasoil comprises diesel, light heating oil and other gasoils. 2 Latest official OECD submissions (MOS).3 US figures exclude US territories.
Latest month vs.
Table 2bOIL DEMAND IN SELECTED OECD COUNTRIES1
(million barrels per day)

TABLES INTERNATIONAL ENERGY AGENCY - OIL MARKET REPORT
54 11 OCTOBER 2016
Table 3: World Oil Production 2015 2016 2017 2Q16 3Q16 4Q16 1Q17 2Q17 Jul 16 Aug 16 Sep 16
OPECCrude Oil Saudi Arabia 10.13 10.32 10.61 10.65 10.60 10.58 Iran 2.86 3.59 3.65 3.63 3.64 3.67 Iraq 3.99 4.30 4.38 4.32 4.37 4.46 UAE 2.88 2.97 3.09 3.08 3.09 3.10 Kuwait 2.75 2.82 2.89 2.87 2.91 2.90 Neutral Zone 0.07 0.00 0.00 0.00 0.00 0.00 Qatar 0.66 0.66 0.65 0.66 0.65 0.64 Angola 1.76 1.74 1.75 1.76 1.76 1.74 Nigeria 1.80 1.50 1.42 1.39 1.43 1.45 Libya 0.40 0.32 0.31 0.30 0.28 0.35 Algeria 1.11 1.09 1.11 1.11 1.11 1.12 Ecuador 0.54 0.55 0.55 0.55 0.55 0.55 Venezuela 2.40 2.22 2.14 2.15 2.14 2.13 Indonesia 0.69 0.74 0.74 0.74 0.74 0.74 Gabon 0.23 0.22 0.21 0.22 0.21 0.21
Total Crude Oil 32.29 33.03 33.52 33.43 33.48 33.64 Total NGLs1 6.76 6.91 7.04 6.86 6.95 7.00 7.01 7.02 6.95 6.95 6.95
Total OPEC2 39.05 39.89 40.47 40.37 40.43 40.59 NON-OPEC2,3
OECDAmericas 19.99 19.31 19.41 18.96 19.13 19.28 19.37 19.36 19.26 19.18 18.94 United States 12.99 12.51 12.47 12.61 12.29 12.40 12.36 12.50 12.42 12.26 12.18 Mexico 2.60 2.48 2.35 2.49 2.46 2.43 2.40 2.37 2.48 2.47 2.44 Canada 4.39 4.32 4.58 3.86 4.37 4.44 4.62 4.49 4.35 4.44 4.32 Chile 0.01 0.01 0.00 0.00 0.01 0.00 0.00 0.00 0.01 0.01 0.01 Europe 3.48 3.48 3.39 3.44 3.40 3.46 3.47 3.43 3.64 3.29 3.26 UK 0.97 1.01 0.96 1.05 0.94 0.94 0.99 0.98 1.07 0.90 0.84 Norway 1.95 2.00 1.94 1.94 2.00 2.03 1.97 1.95 2.13 1.93 1.95 Others 0.56 0.48 0.50 0.45 0.45 0.49 0.50 0.50 0.44 0.45 0.47 Asia Oceania 0.46 0.43 0.44 0.41 0.44 0.43 0.43 0.43 0.46 0.43 0.42 Australia 0.38 0.35 0.36 0.34 0.36 0.35 0.35 0.35 0.37 0.35 0.34 Others 0.08 0.08 0.08 0.08 0.08 0.08 0.08 0.08 0.09 0.08 0.08
Total OECD 23.92 23.23 23.25 22.82 22.96 23.18 23.27 23.22 23.36 22.89 22.62 NON-OECDFormer USSR 14.00 14.10 14.31 14.01 13.97 14.20 14.33 14.30 14.11 13.60 14.22 Russia 11.06 11.24 11.28 11.18 11.24 11.31 11.32 11.30 11.22 11.05 11.45 Others 2.94 2.86 3.03 2.83 2.73 2.90 3.02 3.00 2.88 2.56 2.77 Asia2 7.09 6.76 6.56 6.77 6.64 6.67 6.60 6.57 6.69 6.59 6.65 China 4.34 4.04 3.91 4.06 3.95 3.95 3.96 3.93 3.99 3.92 3.93 Malaysia 0.71 0.72 0.71 0.71 0.71 0.71 0.69 0.71 0.72 0.69 0.72 India 0.87 0.85 0.84 0.85 0.85 0.86 0.85 0.84 0.86 0.85 0.85 Others 1.18 1.15 1.09 1.15 1.13 1.15 1.10 1.10 1.13 1.12 1.15 Europe 0.14 0.14 0.13 0.14 0.13 0.13 0.13 0.13 0.14 0.14 0.13 Americas2 4.59 4.49 4.71 4.45 4.54 4.61 4.64 4.69 4.51 4.55 4.57 Brazil 2.53 2.61 2.90 2.55 2.71 2.77 2.82 2.87 2.68 2.72 2.73 Argentina 0.63 0.62 0.62 0.61 0.62 0.63 0.62 0.62 0.60 0.62 0.62 Colombia 1.01 0.89 0.83 0.91 0.84 0.84 0.84 0.83 0.85 0.83 0.85 Others 0.42 0.38 0.36 0.39 0.37 0.37 0.37 0.36 0.38 0.38 0.37 Middle East2,4 1.27 1.26 1.26 1.25 1.28 1.28 1.27 1.26 1.27 1.28 1.28 Oman 0.99 1.01 0.99 1.01 1.02 1.02 1.01 1.00 1.03 1.02 1.02 Syria 0.03 0.03 0.02 0.03 0.03 0.02 0.02 0.02 0.03 0.03 0.03 Yemen 0.04 0.02 0.03 0.01 0.02 0.03 0.03 0.03 0.02 0.02 0.03 Others 0.21 0.21 0.21 0.21 0.21 0.21 0.21 0.21 0.21 0.21 0.21 Africa 2.05 2.01 2.09 1.93 2.03 2.06 2.07 2.08 2.02 2.03 2.05 Egypt 0.72 0.70 0.67 0.70 0.69 0.69 0.68 0.67 0.69 0.69 0.69 Others 1.33 1.31 1.42 1.23 1.34 1.37 1.39 1.40 1.32 1.33 1.36
Total Non-OECD 29.15 28.76 29.05 28.55 28.60 28.95 29.05 29.02 28.73 28.18 28.90 Processing gains5 2.24 2.27 2.29 2.27 2.27 2.27 2.29 2.29 2.27 2.27 2.27 Global Biofuels 2.26 2.37 2.45 2.42 2.77 2.40 1.97 2.47 2.72 2.79 2.81 TOTAL NON-OPEC 57.57 56.62 57.05 56.05 56.60 56.80 56.59 57.01 57.08 56.13 56.59 TOTAL SUPPLY 96.62 95.94 97.07 97.45 96.57 97.18 1 Includes condensates reported by OPEC countries, oil from non-conventional sources, e.g. Venezuelan Orimulsion (but not Orinoco extra-heavy oil), and non-oil inputs to Saudi Arabian MTBE.2 Other Asia excludes Indonesia throughout. Latin America excludes Ecuador throughout. Africa excludes Angola and Gabon throughout. Total Non-OPEC excludes all countries that were members of OPEC at 1 July 2016. Total OPEC comprises all countries which were OPEC members at 1 July 2016.3 Comprises crude oil, condensates, NGLs and oil from non-conventional sources4 Includes small amounts of production from Jordan and Bahrain.5 Net volumetric gains and losses in refining and marine transportation losses.
Table 3WORLD OIL PRODUCTION
(million barrels per day)
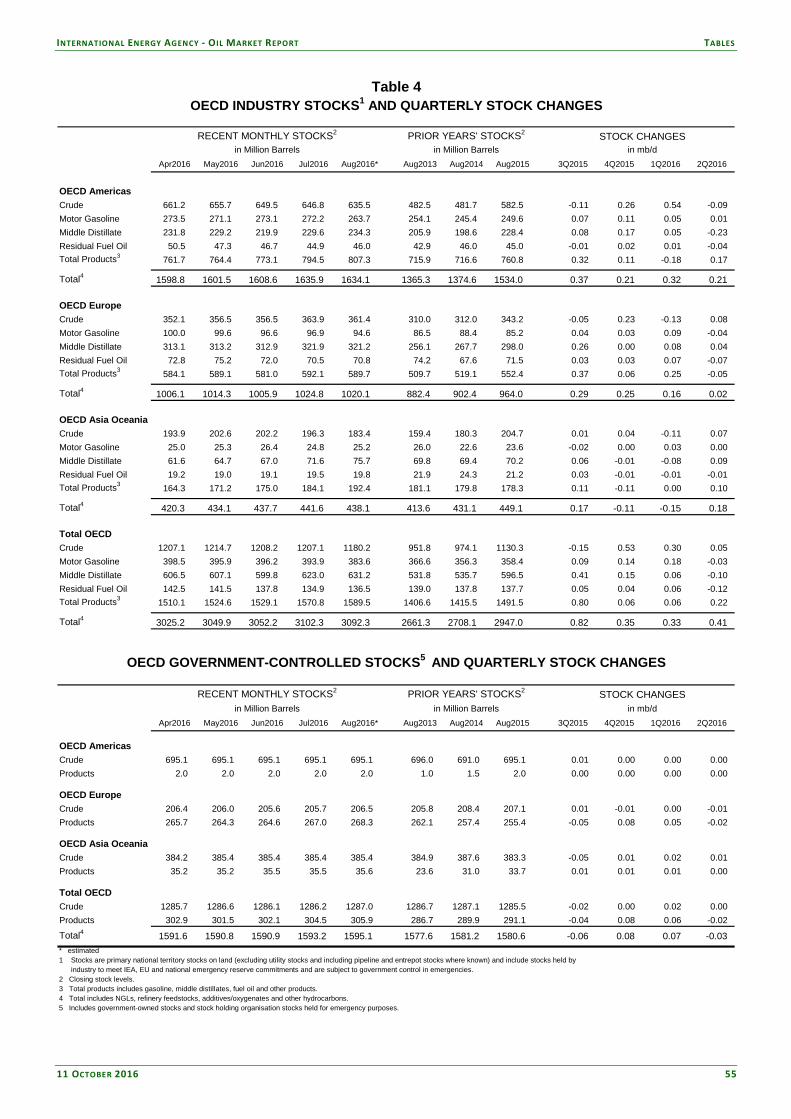
INTERNATIONAL ENERGY AGENCY - OIL MARKET REPORT TABLES
11 OCTOBER 2016 55
Table 4: OECD Industry Stocks and Quarterly Stock Changes
RECENT MONTHLY STOCKS2 PRIOR YEARS' STOCKS2 STOCK CHANGESin Million Barrels in Million Barrels in mb/d
Apr2016 May2016 Jun2016 Jul2016 Aug2016* Aug2013 Aug2014 Aug2015 3Q2015 4Q2015 1Q2016 2Q2016
OECD AmericasCrude 661.2 655.7 649.5 646.8 635.5 482.5 481.7 582.5 -0.11 0.26 0.54 -0.09 Motor Gasoline 273.5 271.1 273.1 272.2 263.7 254.1 245.4 249.6 0.07 0.11 0.05 0.01 Middle Distillate 231.8 229.2 219.9 229.6 234.3 205.9 198.6 228.4 0.08 0.17 0.05 -0.23 Residual Fuel Oil 50.5 47.3 46.7 44.9 46.0 42.9 46.0 45.0 -0.01 0.02 0.01 -0.04 Total Products3 761.7 764.4 773.1 794.5 807.3 715.9 716.6 760.8 0.32 0.11 -0.18 0.17
Total4 1598.8 1601.5 1608.6 1635.9 1634.1 1365.3 1374.6 1534.0 0.37 0.21 0.32 0.21
OECD EuropeCrude 352.1 356.5 356.5 363.9 361.4 310.0 312.0 343.2 -0.05 0.23 -0.13 0.08 Motor Gasoline 100.0 99.6 96.6 96.9 94.6 86.5 88.4 85.2 0.04 0.03 0.09 -0.04 Middle Distillate 313.1 313.2 312.9 321.9 321.2 256.1 267.7 298.0 0.26 0.00 0.08 0.04 Residual Fuel Oil 72.8 75.2 72.0 70.5 70.8 74.2 67.6 71.5 0.03 0.03 0.07 -0.07 Total Products3 584.1 589.1 581.0 592.1 589.7 509.7 519.1 552.4 0.37 0.06 0.25 -0.05
Total4 1006.1 1014.3 1005.9 1024.8 1020.1 882.4 902.4 964.0 0.29 0.25 0.16 0.02
OECD Asia OceaniaCrude 193.9 202.6 202.2 196.3 183.4 159.4 180.3 204.7 0.01 0.04 -0.11 0.07 Motor Gasoline 25.0 25.3 26.4 24.8 25.2 26.0 22.6 23.6 -0.02 0.00 0.03 0.00 Middle Distillate 61.6 64.7 67.0 71.6 75.7 69.8 69.4 70.2 0.06 -0.01 -0.08 0.09 Residual Fuel Oil 19.2 19.0 19.1 19.5 19.8 21.9 24.3 21.2 0.03 -0.01 -0.01 -0.01 Total Products3 164.3 171.2 175.0 184.1 192.4 181.1 179.8 178.3 0.11 -0.11 0.00 0.10
Total4 420.3 434.1 437.7 441.6 438.1 413.6 431.1 449.1 0.17 -0.11 -0.15 0.18
Total OECDCrude 1207.1 1214.7 1208.2 1207.1 1180.2 951.8 974.1 1130.3 -0.15 0.53 0.30 0.05 Motor Gasoline 398.5 395.9 396.2 393.9 383.6 366.6 356.3 358.4 0.09 0.14 0.18 -0.03 Middle Distillate 606.5 607.1 599.8 623.0 631.2 531.8 535.7 596.5 0.41 0.15 0.06 -0.10 Residual Fuel Oil 142.5 141.5 137.8 134.9 136.5 139.0 137.8 137.7 0.05 0.04 0.06 -0.12 Total Products3 1510.1 1524.6 1529.1 1570.8 1589.5 1406.6 1415.5 1491.5 0.80 0.06 0.06 0.22
Total4 3025.2 3049.9 3052.2 3102.3 3092.3 2661.3 2708.1 2947.0 0.82 0.35 0.33 0.41
RECENT MONTHLY STOCKS2 PRIOR YEARS' STOCKS2 STOCK CHANGESin Million Barrels in Million Barrels in mb/d
Apr2016 May2016 Jun2016 Jul2016 Aug2016* Aug2013 Aug2014 Aug2015 3Q2015 4Q2015 1Q2016 2Q2016
OECD AmericasCrude 695.1 695.1 695.1 695.1 695.1 696.0 691.0 695.1 0.01 0.00 0.00 0.00 Products 2.0 2.0 2.0 2.0 2.0 1.0 1.5 2.0 0.00 0.00 0.00 0.00
OECD EuropeCrude 206.4 206.0 205.6 205.7 206.5 205.8 208.4 207.1 0.01 -0.01 0.00 -0.01 Products 265.7 264.3 264.6 267.0 268.3 262.1 257.4 255.4 -0.05 0.08 0.05 -0.02
OECD Asia OceaniaCrude 384.2 385.4 385.4 385.4 385.4 384.9 387.6 383.3 -0.05 0.01 0.02 0.01 Products 35.2 35.2 35.5 35.5 35.6 23.6 31.0 33.7 0.01 0.01 0.01 0.00
Total OECDCrude 1285.7 1286.6 1286.1 1286.2 1287.0 1286.7 1287.1 1285.5 -0.02 0.00 0.02 0.00 Products 302.9 301.5 302.1 304.5 305.9 286.7 289.9 291.1 -0.04 0.08 0.06 -0.02
Total4 1591.6 1590.8 1590.9 1593.2 1595.1 1577.6 1581.2 1580.6 -0.06 0.08 0.07 -0.03 * estimated1 Stocks are primary national territory stocks on land (excluding utility stocks and including pipeline and entrepot stocks where known) and include stocks held by industry to meet IEA, EU and national emergency reserve commitments and are subject to government control in emergencies. 2 Closing stock levels.3 Total products includes gasoline, middle distillates, fuel oil and other products. 4 Total includes NGLs, refinery feedstocks, additives/oxygenates and other hydrocarbons. 5 Includes government-owned stocks and stock holding organisation stocks held for emergency purposes.
Table 4OECD INDUSTRY STOCKS1 AND QUARTERLY STOCK CHANGES
OECD GOVERNMENT-CONTROLLED STOCKS5 AND QUARTERLY STOCK CHANGES

TABLES INTERNATIONAL ENERGY AGENCY - OIL MARKET REPORT
56 11 OCTOBER 2016
Table 5: Total Stocks on Land in OECD Countries
('millions of barrels' and 'days')
3
Stock Days Fwd2 Stock Days Fwd Stock Days Fwd Stock Days Fwd Stock Days FwdLevel Demand Level Demand Level Demand Level Demand Level Demand
OECD AmericasCanada 175.6 72 182.5 76 188.4 79 183.6 77 175.2 -Chile 11.8 35 11.0 32 10.6 32 11.2 31 10.7 -Mexico 50.4 24 49.5 24 49.7 25 45.9 24 48.8 -United States4 1943.3 98 1973.4 102 1986.6 102 2023.5 104 2048.9 -Total4 2203.3 88 2238.4 91 2257.3 92 2286.2 94 2305.7 93OECD Asia OceaniaAustralia 35.9 32 35.5 31 33.5 30 37.0 33 38.2 -Israel - - - - - - - - - -Japan 578.3 150 589.6 143 582.0 131 559.8 153 573.5 -Korea 224.6 95 226.0 90 227.9 88 235.7 95 238.0 -New Zealand 9.0 59 8.7 52 7.7 45 8.2 51 8.9 -Total 847.9 110 859.7 105 851.1 100 840.7 110 858.6 111OECD Europe5
Austria 23.2 82 23.7 90 24.1 94 25.4 93 22.5 -Belgium 47.7 74 51.3 81 50.4 73 52.7 84 52.6 -Czech Republic 21.6 106 21.8 127 22.1 148 22.8 130 22.8 -Denmark 28.4 178 28.6 186 31.8 211 32.4 204 30.7 -Estonia 1.5 50 1.5 53 1.8 66 2.2 89 2.6 -Finland 45.0 219 39.9 205 44.9 237 46.0 241 45.4 -France 169.8 97 166.8 103 167.6 99 165.8 100 167.5 -Germany 285.6 117 281.4 118 285.3 118 288.7 122 287.9 -Greece 27.8 91 29.2 94 32.4 115 33.4 116 32.6 -Hungary 20.5 127 20.6 126 22.0 157 20.9 140 22.5 -Ireland 11.1 74 11.3 75 11.6 75 12.2 82 12.3 -Italy 117.1 89 117.2 92 117.3 97 119.9 93 120.9 -Luxembourg 0.6 12 0.6 10 0.7 13 0.7 12 0.8 -Netherlands 140.2 146 153.1 160 158.8 165 157.7 160 159.6 -Norway 25.9 126 25.1 105 26.7 127 24.9 117 26.5 -Poland 62.6 111 63.9 119 69.4 131 67.4 119 65.4 -Portugal 21.8 85 23.0 97 23.9 108 24.5 100 24.9 -Slovak Republic 11.4 137 11.0 134 11.6 150 11.9 135 12.4 -Slovenia 4.7 88 4.6 96 4.5 90 4.6 90 4.7 -Spain 133.4 106 139.4 113 130.9 104 140.3 112 134.2 -Sweden 31.0 103 33.3 120 35.2 122 34.9 116 33.3 -Switzerland 37.2 165 36.3 149 34.4 171 36.1 165 35.8 -Turkey 65.7 70 71.2 82 74.6 88 75.9 80 78.0 -United Kingdom 77.2 49 79.0 51 80.9 52 79.7 49 82.9 -Total 1411.0 100 1433.9 105 1463.0 107 1481.0 106 1478.8 106Total OECD 4462.1 95 4532.1 98 4571.4 98 4607.9 100 4643.1 100DAYS OF IEA Net Imports6 - 192 - 195 - 196 - 199 - 2031 Total Stocks are industry and government-controlled stocks (see breakdown in table below). Stocks are primary national territory stocks on land (excluding utility stocks and including pipeline and entrepot stocks where known) they include stocks held by industry to meet IEA, EU and national emergency reserves commitments and are subject to government control in emergencies.2 Note that days of forward demand represent the stock level divided by the forward quarter average daily demand and is very different from the days of net imports used for the calculation of IEA Emergency Reserves.3 End June 2016 forward demand figures are IEA Secretariat forecasts. 4 US figures exclude US territories. Total includes US territories.5 Data not available for Iceland.6 Reflects stock levels and prior calendar year's net imports adjusted according to IEA emergency reserve definitions (see www.iea.org/netimports.asp). Net exporting IEA countries are excluded.
TOTAL OECD STOCKS
CLOSING STOCKS Total Industry Total Industry
2Q2013 4224 1576 2648 91 34 573Q2013 4267 1582 2686 92 34 584Q2013 4144 1584 2559 90 35 561Q2014 4164 1585 2579 93 35 572Q2014 4229 1580 2649 92 34 583Q2014 4297 1578 2718 93 34 594Q2014 4285 1580 2705 92 34 581Q2015 4371 1583 2789 96 35 612Q2015 4462 1585 2877 95 34 613Q2015 4532 1579 2953 98 34 644Q2015 4571 1587 2985 98 34 641Q2016 4608 1593 3015 100 35 662Q2016 4643 1591 3052 100 34 661 Includes government-owned stocks and stock holding organisation stocks held for emergency purposes.2 Days of forward demand calculated using actual demand except in 2Q2016 (when latest forecasts are used).
Table 5TOTAL STOCKS ON LAND IN OECD COUNTRIES1
controlledDays of Fwd. Demand 2
End June 2016End September 2015 End June 2015 End December 2015 End March 2016
Millions of Barrels
Government1
controlledGovernment1

INTERNATIONAL ENERGY AGENCY - OIL MARKET REPORT TABLES
11 OCTOBER 2016 57
Table 6: IEA Member Country Destinations of Selected Crude Streams
2013 2014 2015 3Q15 4Q15 1Q16 2Q16 May 16 Jun 16 Jul 16 Jul 15 change
Saudi Light & Extra LightAmericas 0.74 0.65 0.63 0.57 0.72 0.74 0.72 0.79 0.59 0.88 0.56 0.32Europe 0.79 0.84 0.78 0.77 0.69 0.76 0.69 0.67 0.68 0.62 0.76 -0.14Asia Oceania 1.21 1.17 1.25 1.16 1.21 1.40 1.44 1.42 1.39 1.18 1.14 0.04
Saudi MediumAmericas 0.45 0.36 0.37 0.44 0.43 0.39 0.44 0.46 0.45 0.41 0.39 0.02Europe 0.01 0.03 0.03 0.02 0.04 - 0.01 - 0.02 0.02 0.02 0.00Asia Oceania 0.43 0.45 0.44 0.48 0.41 0.46 0.43 0.43 0.38 0.42 0.50 -0.08
Iraqi Basrah Light2
Americas 0.38 0.35 0.17 0.09 0.29 0.21 0.44 0.46 0.44 0.43 0.16 0.27Europe 0.25 0.50 0.72 0.95 0.94 0.90 0.71 0.71 0.60 0.75 0.85 -0.09Asia Oceania 0.31 0.24 0.41 0.42 0.49 0.47 0.51 0.36 0.53 0.41 0.49 -0.08
Kuwait BlendAmericas 0.28 0.27 0.13 0.11 0.07 0.13 0.12 - 0.21 0.26 - -Europe 0.10 0.09 0.13 0.16 0.18 0.20 0.08 0.05 0.04 0.10 0.21 -0.12Asia Oceania 0.64 0.62 0.65 0.62 0.69 0.71 0.65 0.75 0.59 0.71 0.66 0.05
Iranian LightAmericas - - - - - - - - - - - -Europe 0.08 0.10 0.09 0.07 0.10 0.09 0.18 0.19 0.24 0.40 0.09 0.31Asia Oceania 0.00 0.01 0.01 0.02 - 0.02 0.01 0.01 0.02 - 0.02 -
Iranian Heavy3
Americas - - - - - - - - - - - -Europe 0.03 0.01 0.02 0.03 0.01 0.04 0.16 0.16 0.12 0.20 0.02 0.18Asia Oceania 0.30 0.28 0.27 0.25 0.26 0.44 0.47 0.61 0.54 0.55 0.21 0.34
Venezuelan 22 API and heavierAmericas 0.61 0.64 0.67 0.67 0.67 0.61 0.61 0.64 0.57 0.75 0.67 0.08Europe 0.07 0.08 0.09 0.07 0.10 0.06 0.05 0.03 0.02 0.04 0.07 -0.02Asia Oceania - - - - - - - - - - - -
Mexican MayaAmericas 0.70 0.66 0.50 0.45 0.54 0.52 0.54 0.38 0.58 0.56 0.46 0.11Europe 0.14 0.14 0.15 0.19 0.11 0.15 0.16 0.16 0.13 0.18 0.16 0.02Asia Oceania - - 0.01 0.02 0.02 0.02 0.04 0.03 0.04 0.10 0.03 0.06
Canada HeavyAmericas 1.49 1.71 1.90 2.02 1.94 2.12 1.85 1.78 1.88 2.07 1.91 0.16Europe - 0.00 0.01 0.01 0.01 0.01 0.01 - - - - -Asia Oceania - 0.00 - - - - - - - - - -
BFOEAmericas 0.03 0.01 0.01 0.01 0.02 0.02 0.02 0.02 0.02 0.02 - -Europe 0.47 0.56 0.49 0.52 0.49 0.47 0.36 0.44 0.19 0.39 0.53 -0.15Asia Oceania 0.06 0.07 0.06 0.02 0.09 0.09 0.03 - - - - -
Russian UralsAmericas 0.00 - - - - - - - - - - -Europe 1.79 1.58 1.61 1.64 1.74 1.58 1.76 1.68 1.64 1.68 1.60 0.09Asia Oceania - - - - - - - - - - - -
KazakhstanAmericas 0.06 0.01 0.00 - - - - - - - - -Europe 0.59 0.64 0.64 0.59 0.65 0.76 0.67 0.62 0.52 0.79 0.65 0.14Asia Oceania 0.00 0.02 0.06 0.12 0.06 0.05 0.00 0.01 - - 0.16 -
Libya Light and MediumAmericas 0.00 - - - - - - - - - - -Europe 0.57 0.31 0.22 0.22 0.25 0.16 0.14 0.13 0.12 0.09 0.30 -0.21Asia Oceania 0.03 0.02 0.01 - - 0.02 0.01 0.02 0.02 - - -
Nigerian Light4
Americas 0.07 0.00 0.02 0.03 0.02 0.07 0.06 0.03 0.06 0.06 0.05 0.01Europe 0.53 0.55 0.57 0.55 0.58 0.44 0.46 0.44 0.50 0.44 0.56 -0.12Asia Oceania 0.03 0.02 - - - - 0.01 0.03 - - - -1 Data based on monthly submissions from IEA countries to the crude oil import register (in '000 bbl), subject to availability. May differ from Table 8 of the Report. IEA Americas includes United States and Canada. IEA Europe includes all countries in OECD Europe except Estonia, Hungary and Slovenia. IEA Asia Oceania includes Australia, New Zealand, Korea and Japan.2 Iraqi Total minus Kirkuk.3 Iranian Total minus Iranian Light.4 33° API and lighter (e.g., Bonny Light, Escravos, Qua Iboe and Oso Condensate).
Table 6IEA MEMBER COUNTRY DESTINATIONS OF SELECTED CRUDE STREAMS1
(million barrels per day)
Year Earlier

TABLES INTERNATIONAL ENERGY AGENCY - OIL MARKET REPORT
58 11 OCTOBER 2016
Table 7: Regional OECD Imports
2013 2014 2015 3Q15 4Q15 1Q16 2Q16 May 16 Jun 16 Jul 16 Jul 15 % change
Crude Oil Americas 5130 4201 4022 4075 4056 4350 4663 4959 4565 5062 4196 21%Europe 8926 8679 9503 9605 9741 8963 8826 8660 8907 10085 9449 7%Asia Oceania 6537 6371 6572 6482 6522 6802 6647 6764 6400 6448 6659 -3%
Total OECD 20592 19251 20097 20161 20319 20115 20135 20383 19873 21596 20304 6%
LPGAmericas 17 12 10 5 12 29 10 13 6 31 1 2669%Europe 382 427 412 408 404 404 405 356 418 512 391 31%Asia Oceania 547 532 518 491 506 590 576 500 624 610 467 31%
Total OECD 946 971 940 904 921 1024 992 869 1047 1152 859 34%
NaphthaAmericas 17 20 15 12 12 11 7 4 16 6 8 -23%Europe 332 356 348 413 283 360 292 210 314 360 356 1%Asia Oceania 920 953 951 948 977 948 834 900 741 960 947 1%
Total OECD 1269 1328 1313 1372 1271 1319 1134 1115 1071 1326 1312 1%
Gasoline3
Americas 659 665 670 813 549 460 873 843 1016 953 816 17%Europe 106 131 107 72 117 93 56 82 22 -25 1 naAsia Oceania 75 76 93 61 98 73 84 74 78 76 55 37%
Total OECD 841 871 870 946 765 626 1012 1000 1116 1005 872 15%
Jet & KeroseneAmericas 81 100 141 132 133 152 154 172 174 202 158 28%Europe 445 454 442 586 392 462 517 465 616 557 590 -6%Asia Oceania 73 60 64 49 74 79 76 72 58 52 45 15%
Total OECD 600 614 648 768 599 693 747 709 848 812 794 2%
Gasoil/DieselAmericas 58 95 76 46 63 57 40 11 45 55 24 133%Europe 1121 1097 1216 1261 1178 1407 1453 1408 1495 1283 1116 15%Asia Oceania 141 159 164 147 200 180 225 196 211 156 156 0%
Total OECD 1319 1352 1457 1455 1441 1644 1718 1615 1751 1494 1296 15%
Heavy Fuel OilAmericas 165 132 116 139 91 163 126 62 195 180 109 66%Europe 552 617 564 518 575 529 514 654 425 509 644 -21%Asia Oceania 232 203 176 176 204 188 150 118 160 185 149 24%
Total OECD 949 953 856 833 870 880 791 834 780 874 902 -3%
Other ProductsAmericas 812 671 675 759 553 627 713 718 737 721 837 -14%Europe 791 704 702 737 724 761 794 830 736 673 585 15%Asia Oceania 426 408 352 373 351 384 347 386 348 386 337 15%
Total OECD 2029 1784 1729 1870 1627 1772 1854 1933 1822 1780 1760 1%
Total ProductsAmericas 1810 1695 1703 1906 1414 1499 1924 1822 2190 2149 1953 10%Europe 3729 3786 3793 3996 3672 4015 4032 4005 4025 3869 3684 5%Asia Oceania 2414 2391 2318 2246 2411 2444 2292 2247 2220 2425 2158 12%
Total OECD 7953 7872 7813 8148 7496 7958 8248 8075 8435 8443 7794 8%
Total OilAmericas 6940 5896 5725 5980 5470 5850 6587 6782 6755 7211 6149 17%Europe 12655 12465 13296 13601 13413 12978 12857 12665 12932 13955 13133 6%Asia Oceania 8951 8762 8890 8728 8932 9246 8939 9011 8620 8874 8817 1%
Total OECD 28545 27123 27910 28309 27815 28074 28383 28458 28307 30039 28098 7%1 Based on Monthly Oil Questionnaire data submitted by OECD countries in tonnes and converted to barrels. 2 Excludes intra-regional trade.3 Includes additives.
Year Earlier
Table 7REGIONAL OECD IMPORTS1,2
(thousand barrels per day)

©© OOEECCDD//IIEEAA 22001166.. AAllll RRiigghhttss RReesseerrvveedd
Without prejudice to the terms and conditions on the IEA website at www.iea.org/t&c/termsandconditions/ (the Terms), which also apply to this Oil Market Report (OMR) and its related publications, the Executive Director and the Secretariat of the IEA are responsible for the publication of the OMR. Although some of the data are supplied by IEA Member-country governments, largely on the basis of information they in turn receive from oil companies, neither these governments nor these oil companies necessarily share the Secretariat’s views or conclusions as expressed in the OMR. The OMR is prepared for general circulation and is distributed for general information only. Neither the information nor any opinion expressed in the OMR constitutes an offer, or an invitation to make an offer, to buy or sell any securities or any options, futures or other derivatives related to such securities.
As set out in the Terms, the OECD/IEA owns the copyright in this OMR. However, in relation to the edition of OMR made available to Subscribers (as defined in the Terms), all Argus information is sourced as Copyright © 2016 Argus Media Limited and is published here with the permission of Argus. The spot crude and product price assessments are based on daily Argus prices, converted when appropriate to USD per barrel according to the Argus specification of products. Argus Media Limited reserves all rights in relation to all Argus information. Any reproduction of Argus information requires the express prior written permission of Argus. Argus shall not be liable to any party for any inaccuracy, error or omission contained or provided in Argus information contained in this OMR or for any loss, or damage, whether or not due to reliance placed by that party on information in this OMR.

Editor
Neil Atkinson +33 (0)1 40 57 65 90
[email protected] Demand Matt Parry
+33 (0)1 40 57 66 23 [email protected]
Non-OPEC Supply Toril Bosoni
+33 (0)1 40 57 67 18 [email protected]
OPEC Supply Peg Mackey
+33 (0)1 40 57 65 81 [email protected]
Refining Kristine Petrosyan
+33 (0)1 40 57 66 05 [email protected]
Freight
Valerio Pilia +33 (0)1 40 57 66 81 [email protected]
Stocks and Prices Olivier Lejeune
+33 (0)1 40 57 67 58 [email protected]
Analyst Emma Xiwei Zhou
+33 (0)1 40 57 67 54 [email protected]
Statistics Nestor Abraham
+33 (0)1 40 57 65 48 [email protected]
Editorial Assistant Deven Mooneesawmy +33 (0)1 40 57 65 03
[email protected] Media Enquiries IEA Press Office
+33 (0)1 40 57 65 54 [email protected]
Subscription and Delivery Enquiries Oil Market Report Subscriptions International Energy Agency BP 586-75726 PARIS Cedex 15, France +33 (0)1 40 57 67 72 [email protected] www.iea.org/publications/oilmarketreport/ +33 (0)1 40 57 66 90
User’s Guide and Glossary to the IEA Oil Market Report For information on the data sources, definitions, technical terms and general approach used in preparing the Oil Market Report (OMR), Medium-Term Oil Market Report (MTOMR) and Annual Statistical Supplement (current issue of the Statistical Supplement dated 11 August 2016), readers are referred to the Users’ Guide at www.oilmarketreport.org/glossary.asp. It should be noted that the spot crude and product price assessments are based on daily Argus prices, converted when appropriate to US$ per barrel according to the Argus specification of products (Copyright © 2016 Argus Media Limited - all rights reserved).
Next Issue: 10 November 2016