Embed Size (px)
Citation preview
DNV GL © 2014 SAFER, SMARTER, GREENER DNV GL © 2014
Mike Johnson
OIL & GAS
Vapour Cloud Explosion Mechanisms (Buncefield and Others)
1
DNV GL © 2014
Industry consolidation
2
DNV GL © 2014
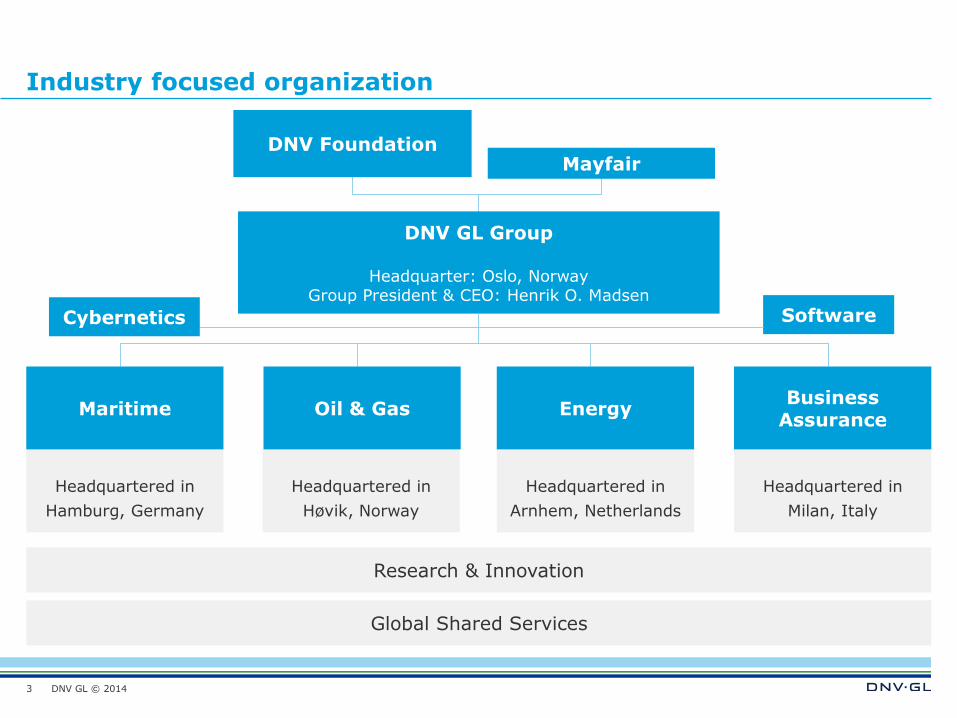
Industry focused organization
3
DNV Foundation Mayfair
Headquartered in
Hamburg, Germany
Headquartered in
Høvik, Norway
Headquartered in
Arnhem, Netherlands
Headquartered in
Milan, Italy
Maritime Oil & Gas Energy Business
Assurance
Research & Innovation
DNV GL Group
Headquarter: Oslo, Norway Group President & CEO: Henrik O. Madsen
Software Cybernetics
Global Shared Services
DNV GL © 2014
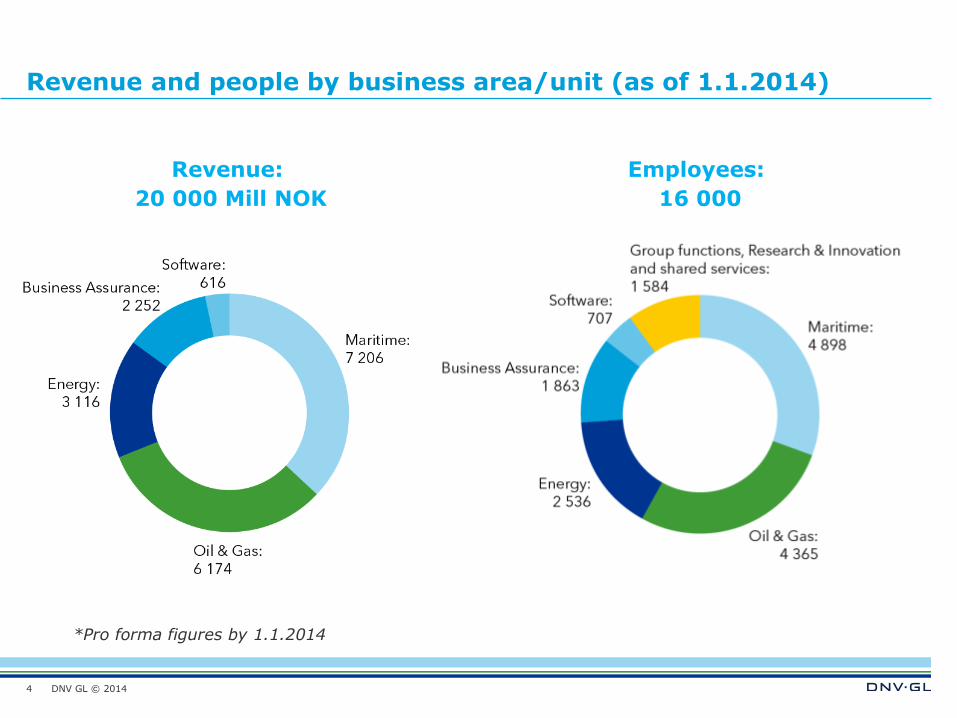
Revenue and people by business area/unit (as of 1.1.2014)
4
*Pro forma figures by 1.1.2014
Revenue:
20 000 Mill NOK
Employees:
16 000
DNV GL © 2014
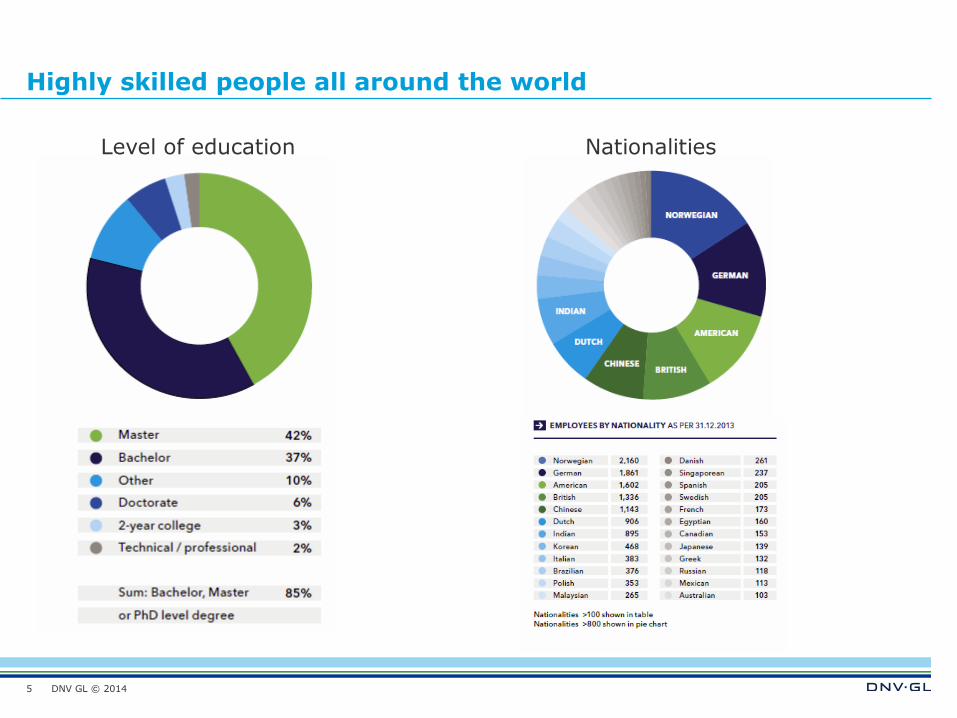
Highly skilled people all around the world
5
Level of education Nationalities
DNV GL © 2014
Overview
Brief reminder of Buncefield
Look at other comparable incidents
Review of evidence
Explaining the effects
Implications
Illustrated with video material
6 November, 2014
6
DNV GL © 2014
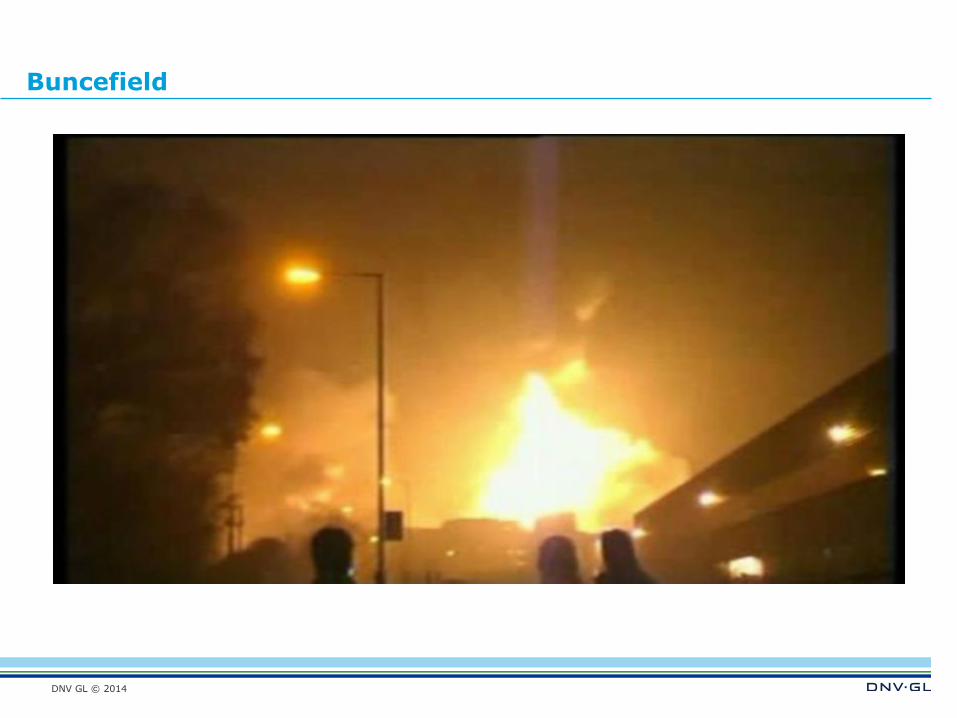
Buncefield
DNV GL © 2014
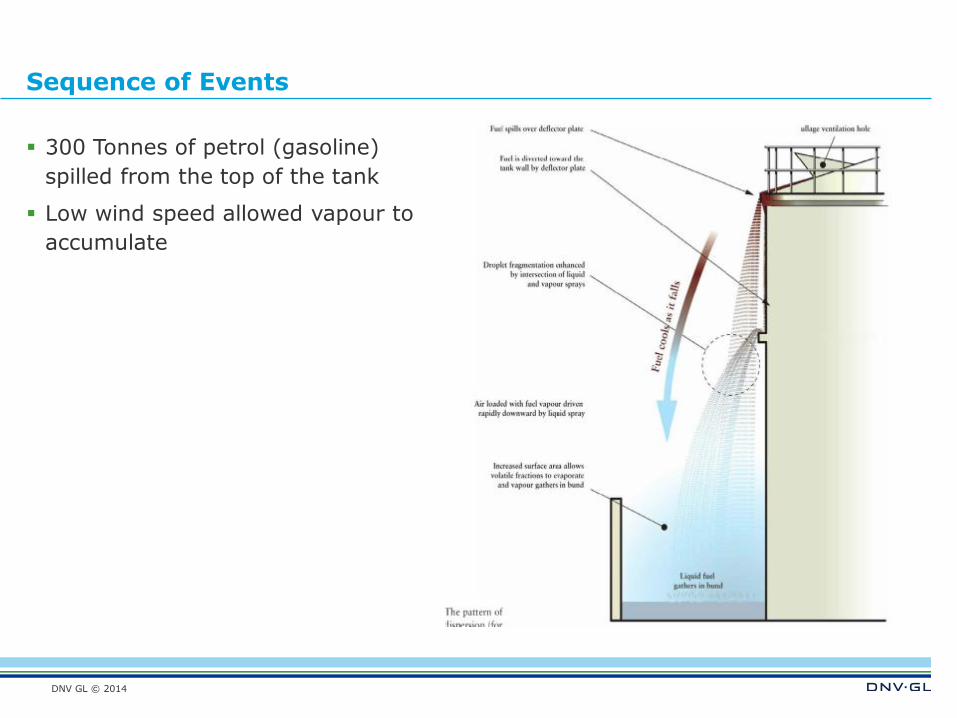
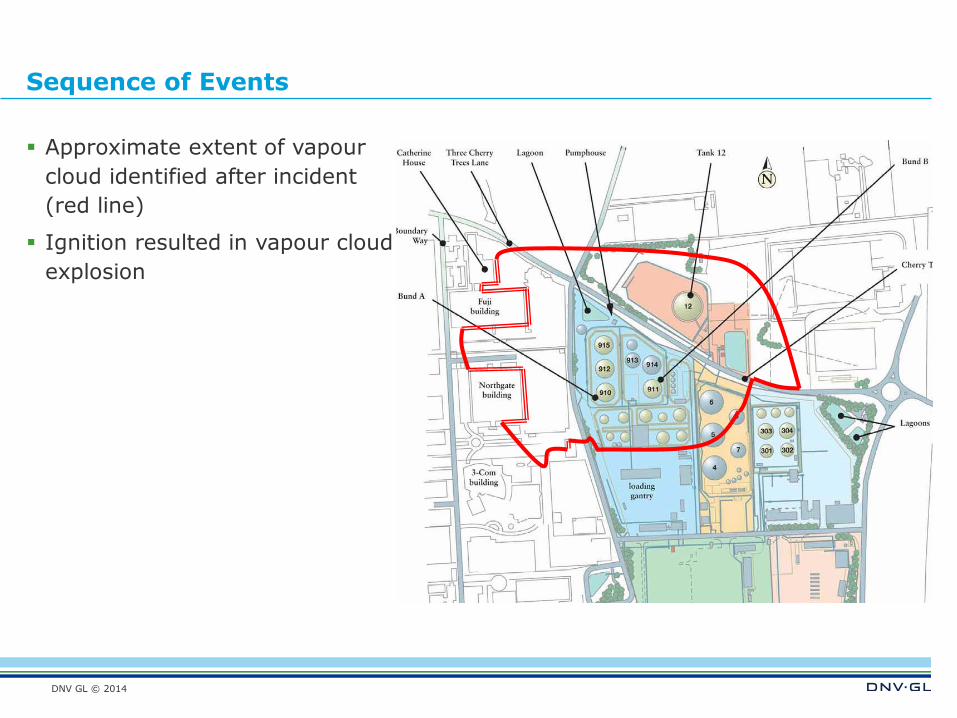
Sequence of Events
300 Tonnes of petrol (gasoline)
spilled from the top of the tank
Low wind speed allowed vapour to
accumulate
DNV GL © 2014
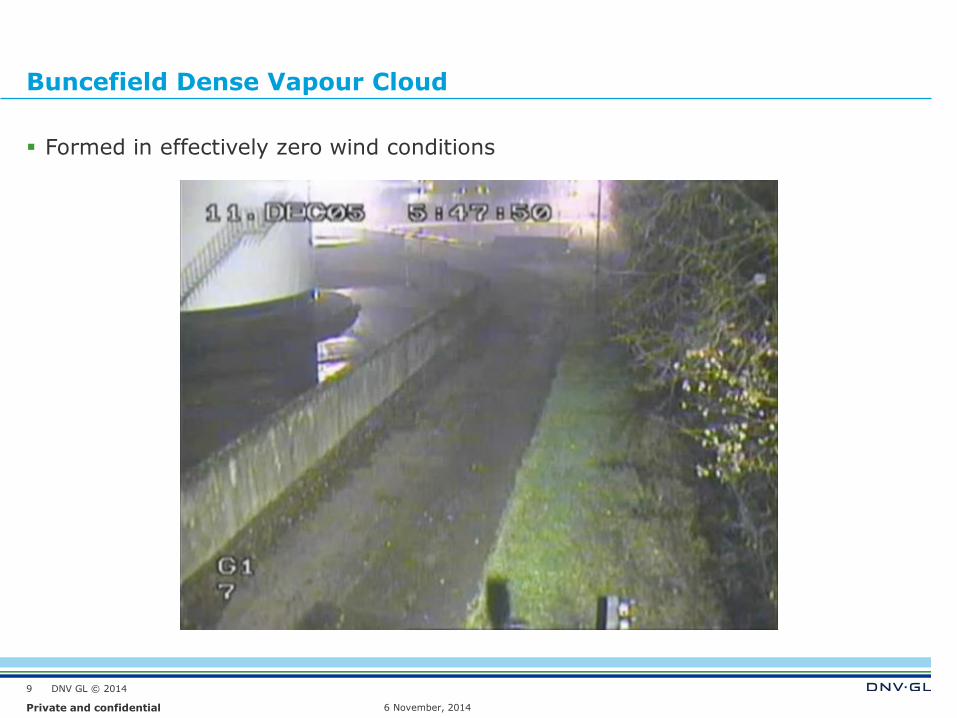
Buncefield Dense Vapour Cloud
Formed in effectively zero wind conditions
6 November, 2014 Private and confidential
9
DNV GL © 2014
Sequence of Events
Approximate extent of vapour
cloud identified after incident
(red line)
Ignition resulted in vapour cloud
explosion
DNV GL © 2014
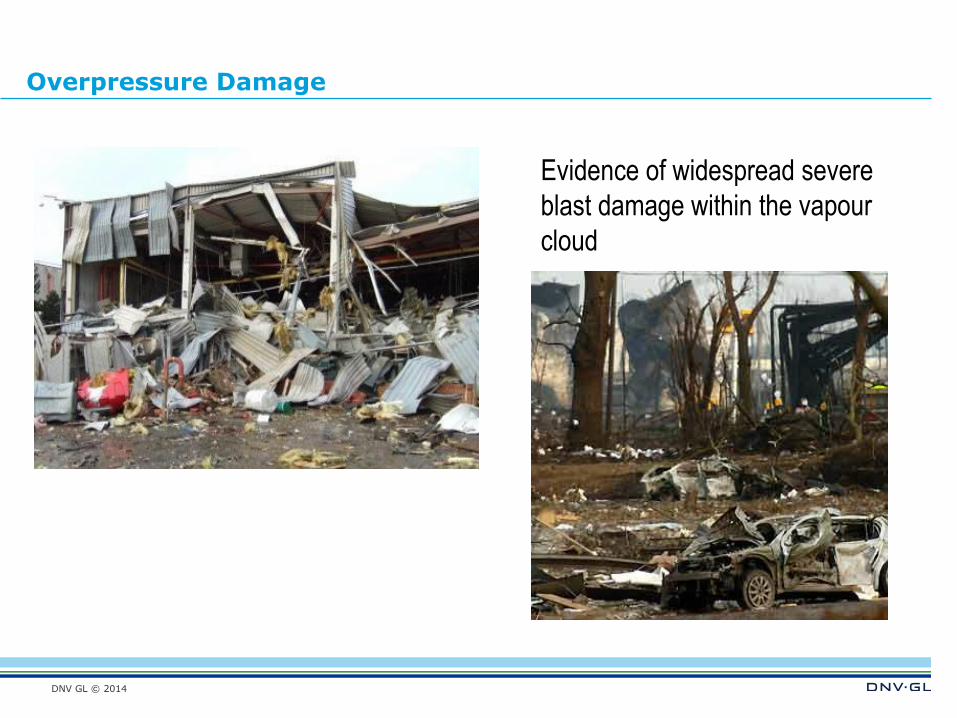
Overpressure Damage
Evidence of widespread severe
blast damage within the vapour
cloud
DNV GL © 2014
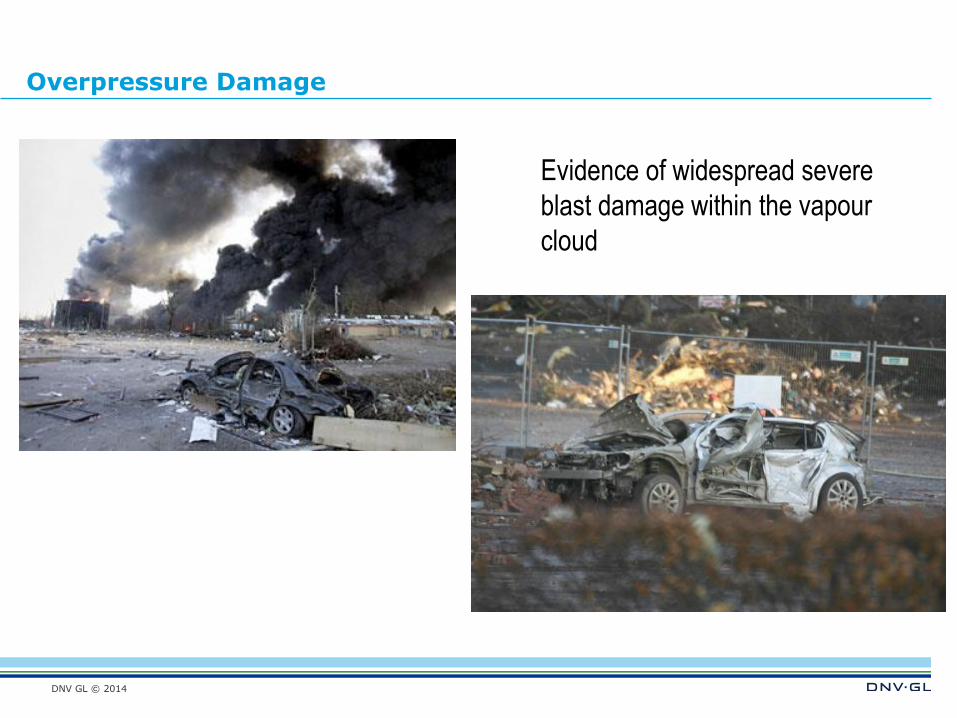
Overpressure Damage
Evidence of widespread severe
blast damage within the vapour
cloud
DNV GL © 2014
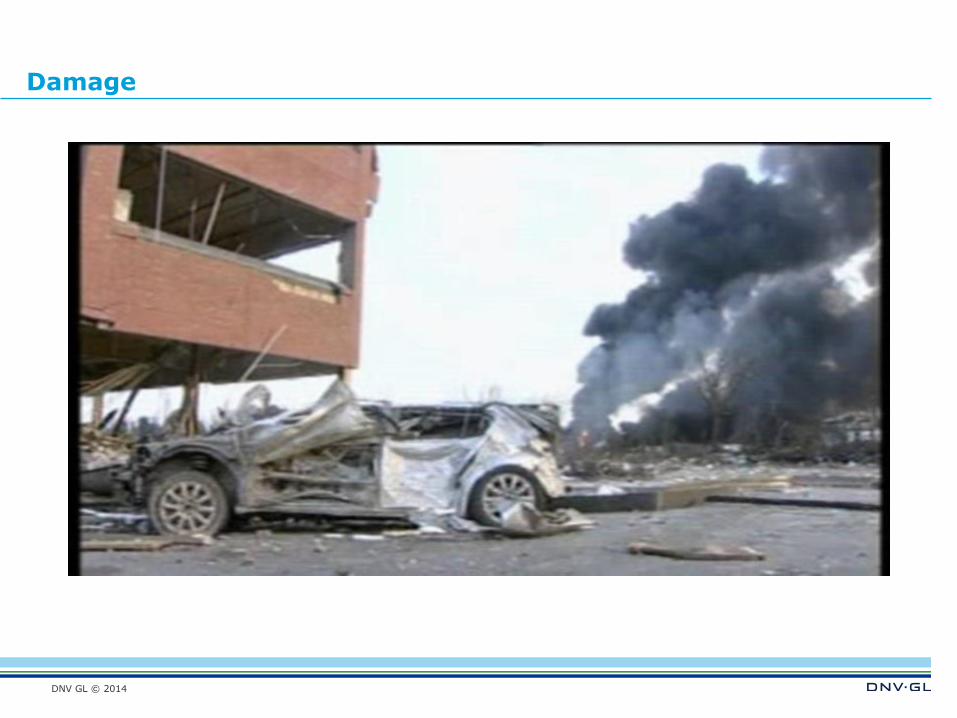
Damage
DNV GL © 2014
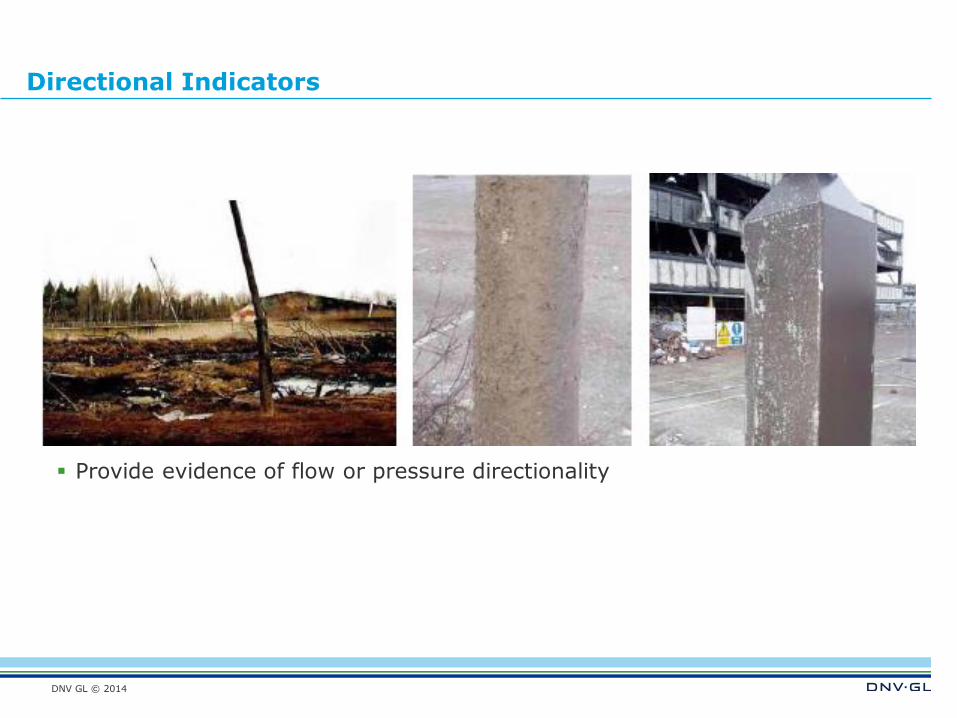
Directional Indicators
Provide evidence of flow or pressure directionality
DNV GL © 2014
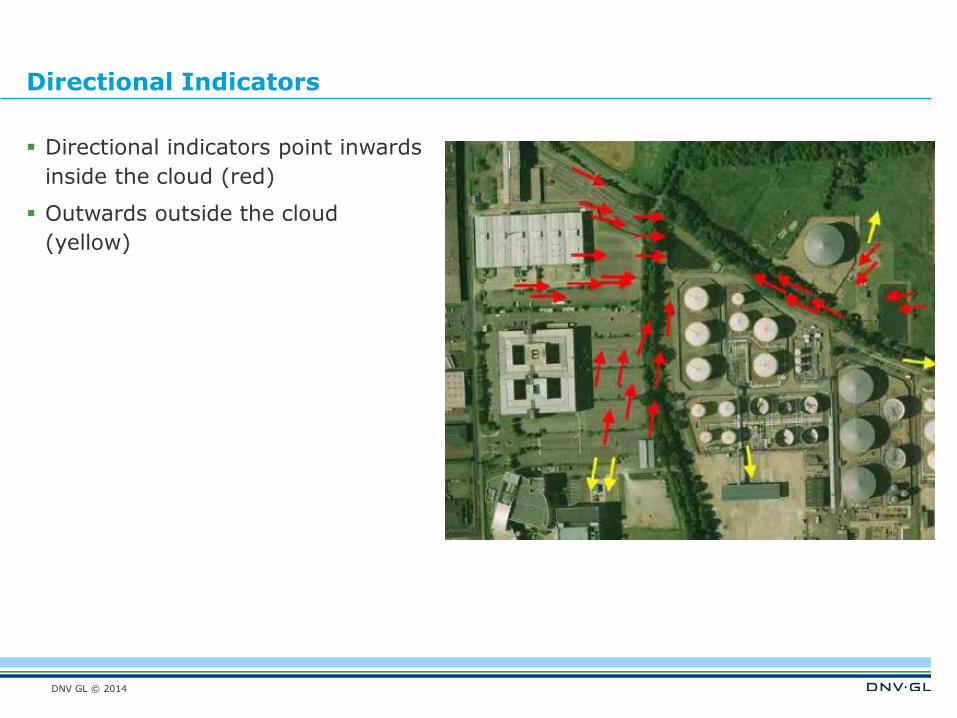
Directional Indicators
Directional indicators point inwards
inside the cloud (red)
Outwards outside the cloud
(yellow)
DNV GL © 2014
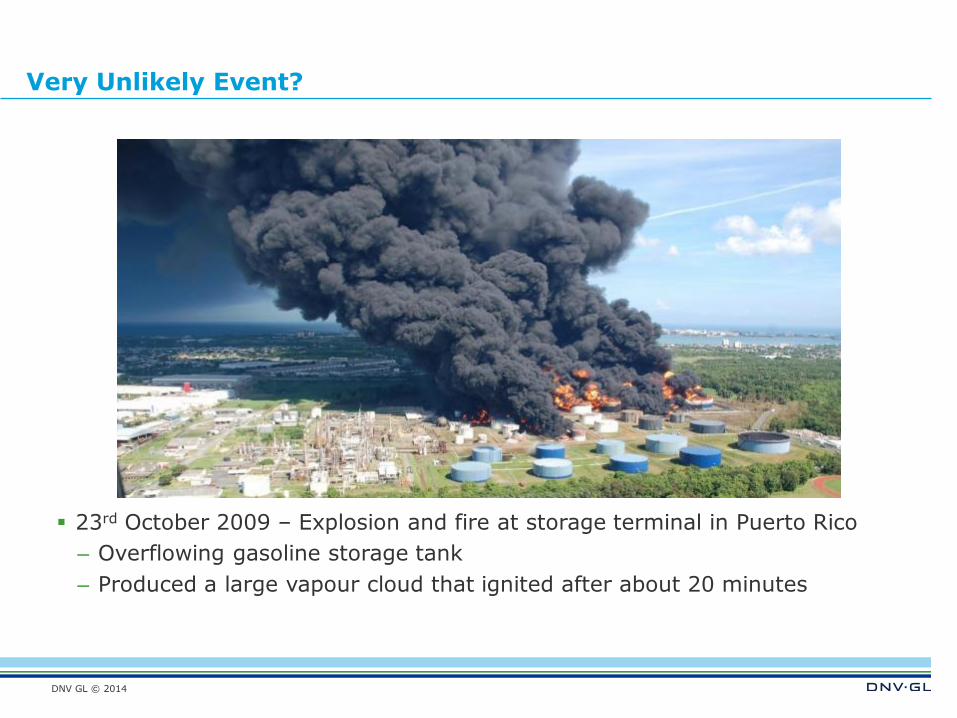
Very Unlikely Event?
23rd October 2009 – Explosion and fire at storage terminal in Puerto Rico
– Overflowing gasoline storage tank
– Produced a large vapour cloud that ignited after about 20 minutes
DNV GL © 2014
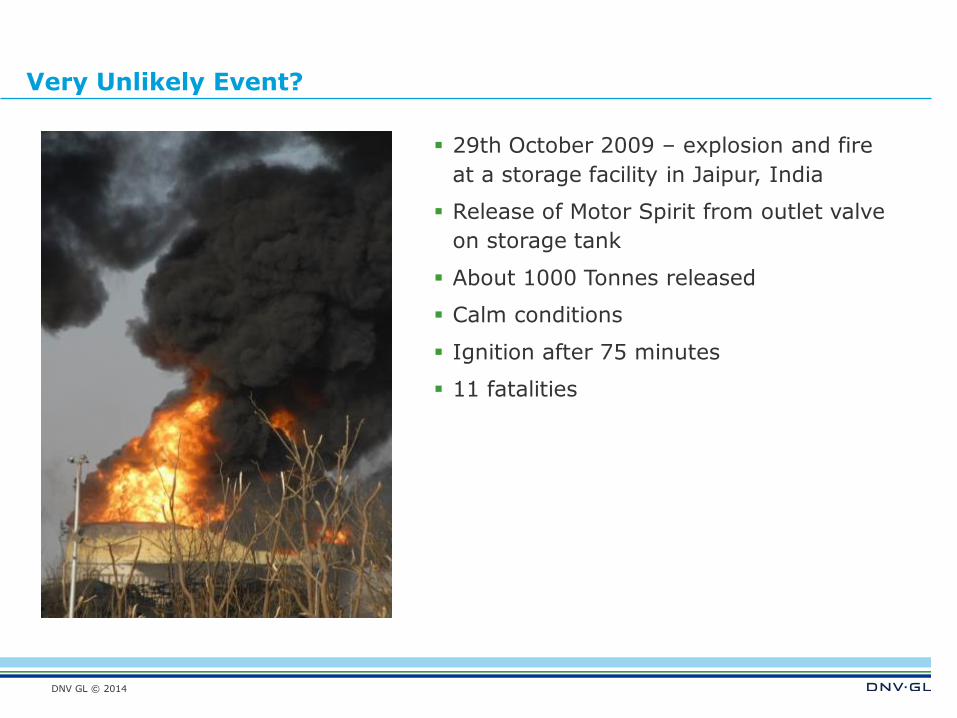
Very Unlikely Event?
29th October 2009 – explosion and fire
at a storage facility in Jaipur, India
Release of Motor Spirit from outlet valve
on storage tank
About 1000 Tonnes released
Calm conditions
Ignition after 75 minutes
11 fatalities
DNV GL © 2014
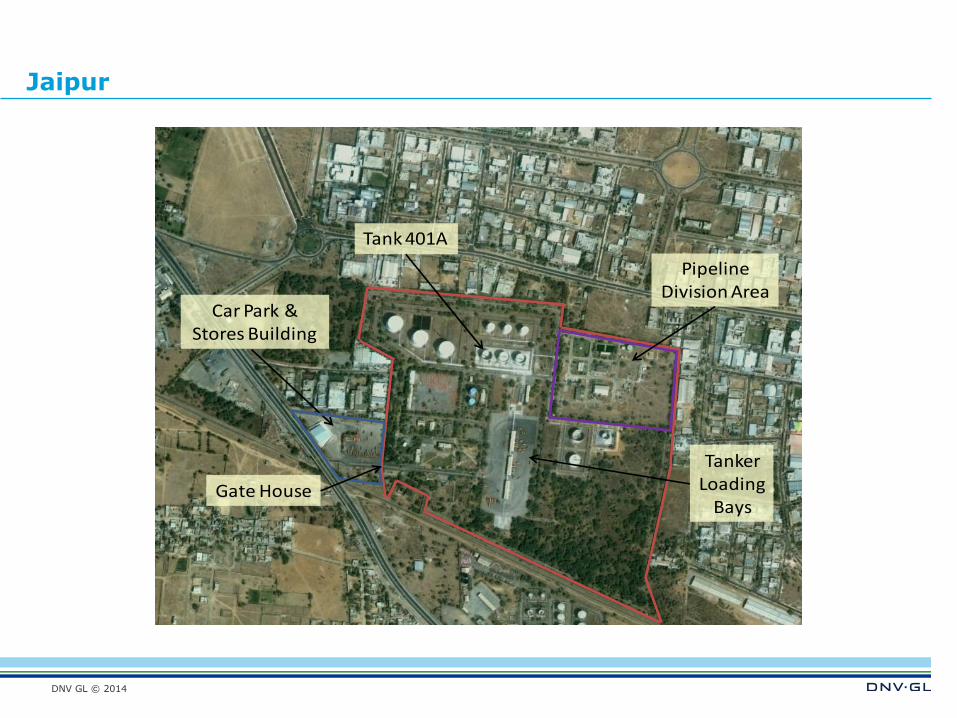
Jaipur
Tank 401A
Tanker Loading
BaysGate House
Car Park & Stores Building
Pipeline Division Area
DNV GL © 2014
Incident Overview
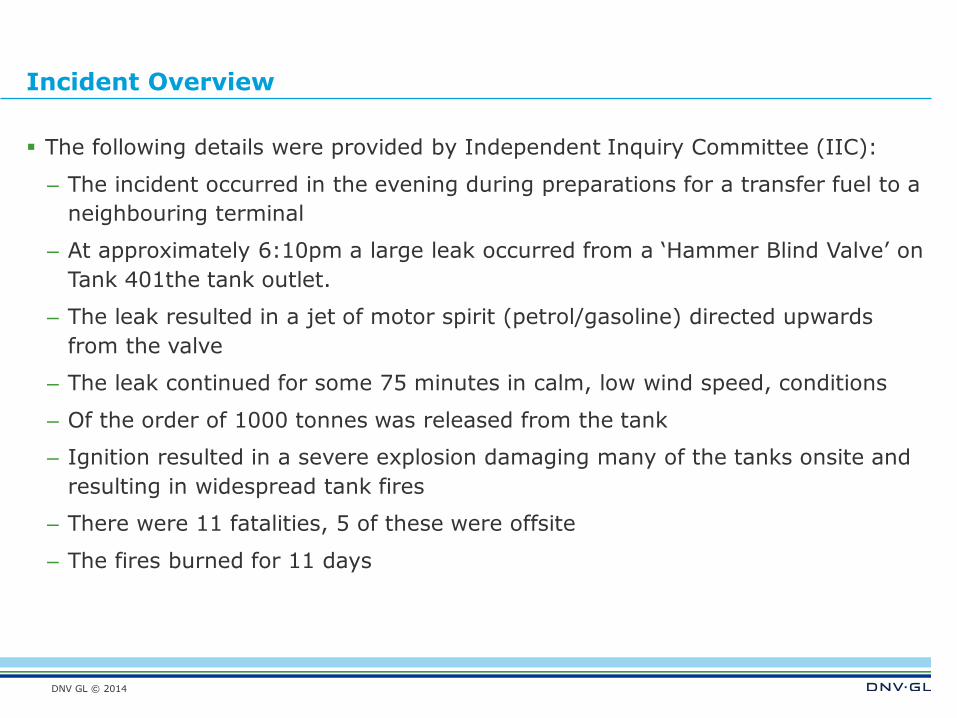
The following details were provided by Independent Inquiry Committee (IIC):
– The incident occurred in the evening during preparations for a transfer fuel to a
neighbouring terminal
– At approximately 6:10pm a large leak occurred from a ‘Hammer Blind Valve’ on
Tank 401the tank outlet.
– The leak resulted in a jet of motor spirit (petrol/gasoline) directed upwards
from the valve
– The leak continued for some 75 minutes in calm, low wind speed, conditions
– Of the order of 1000 tonnes was released from the tank
– Ignition resulted in a severe explosion damaging many of the tanks onsite and
resulting in widespread tank fires
– There were 11 fatalities, 5 of these were offsite
– The fires burned for 11 days
DNV GL © 2014
DNV GL © 2014
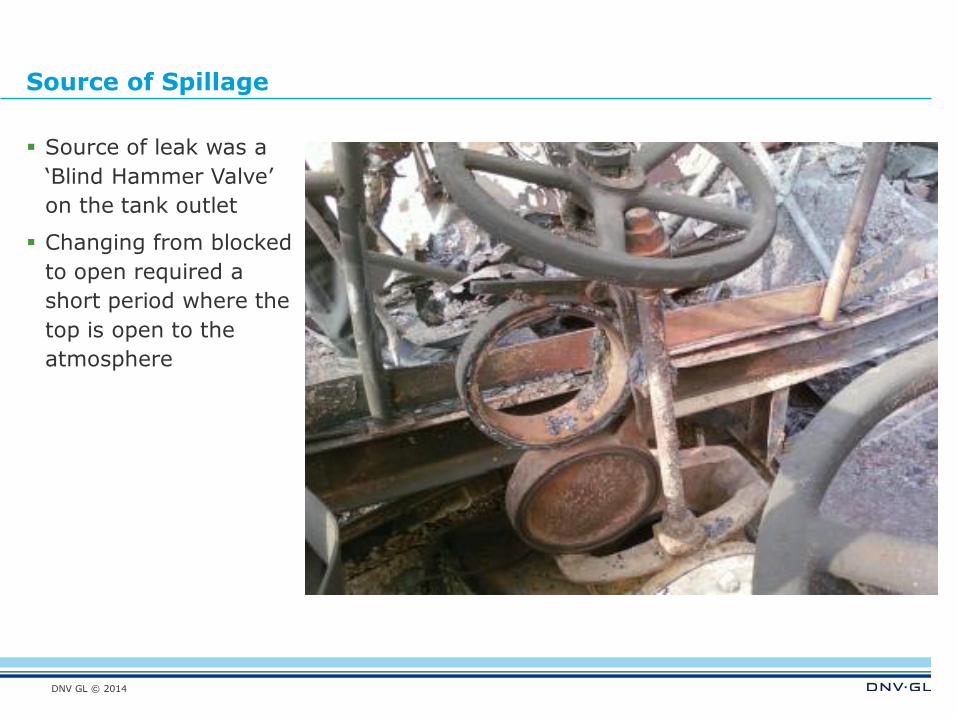
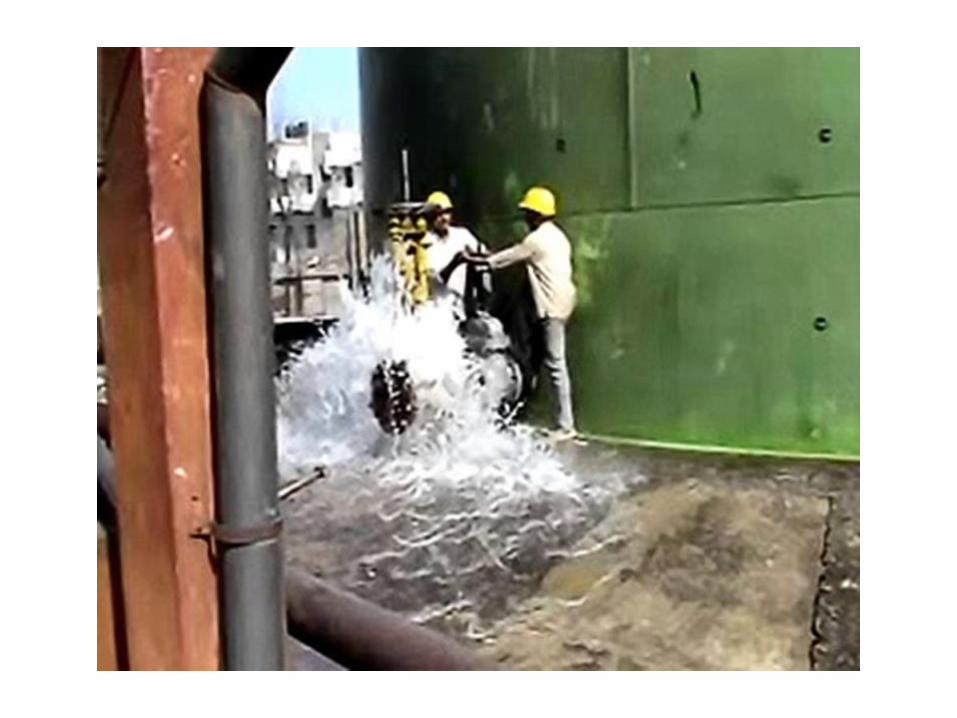
Source of Spillage
Source of leak was a
‘Blind Hammer Valve’
on the tank outlet
Changing from blocked
to open required a
short period where the
top is open to the
atmosphere
DNV GL © 2014
DNV GL © 2014
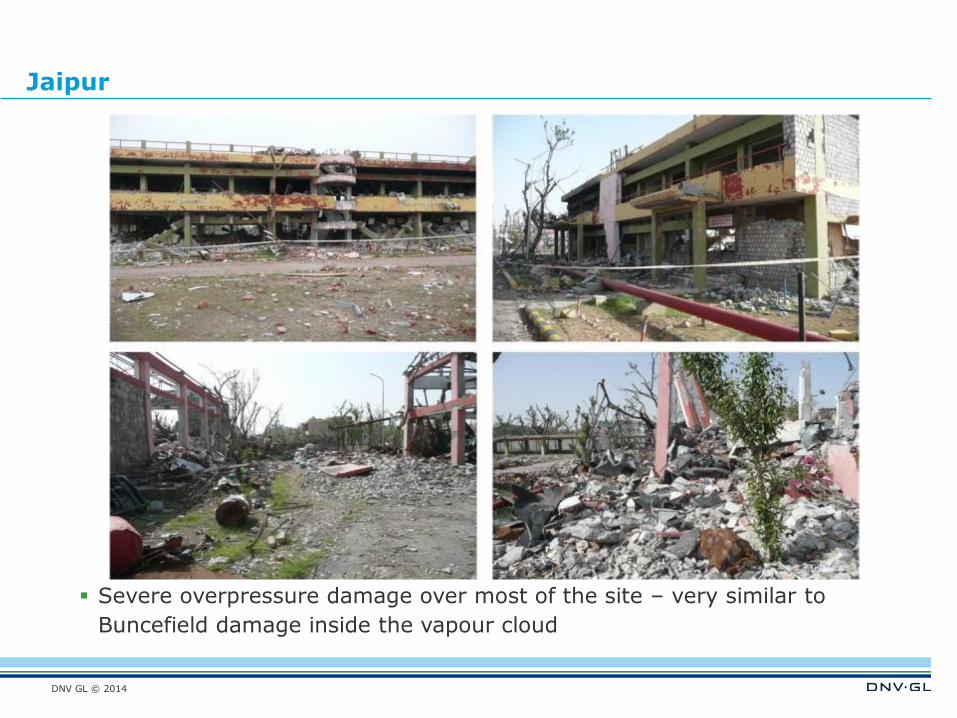
Jaipur
Severe overpressure damage over most of the site – very similar to
Buncefield damage inside the vapour cloud
DNV GL © 2014
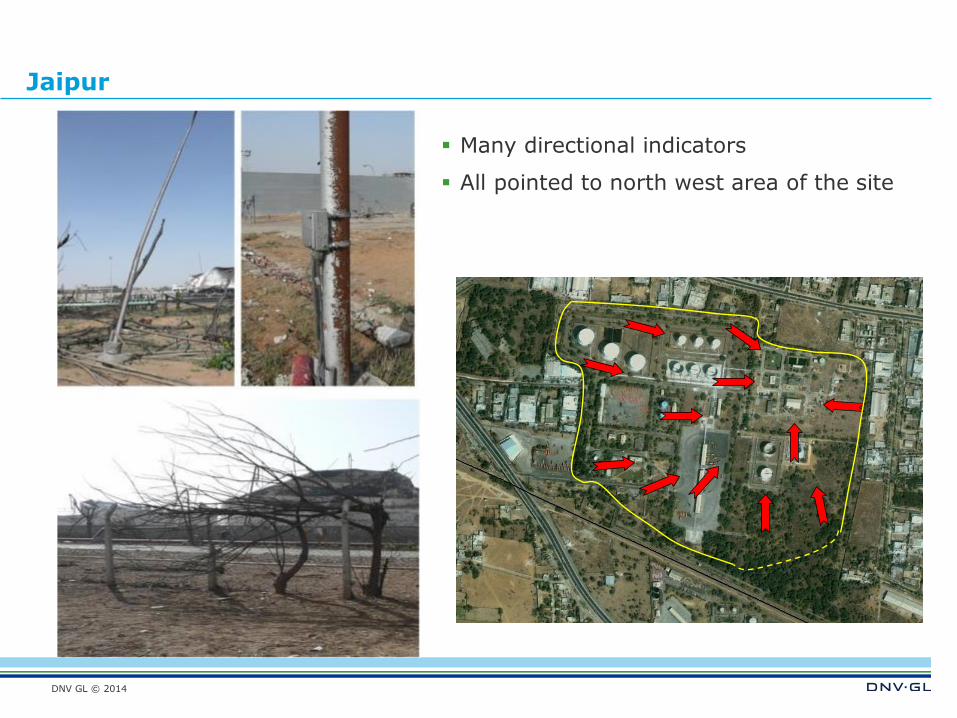
Jaipur
Many directional indicators
All pointed to north west area of the site
DNV GL © 2014
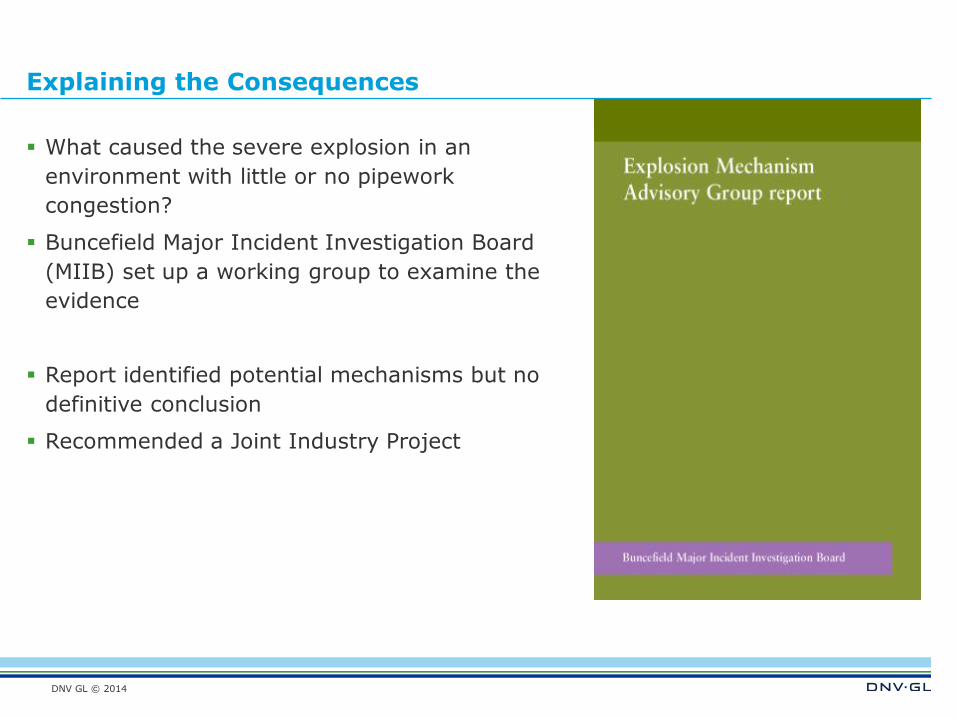
Explaining the Consequences
What caused the severe explosion in an
environment with little or no pipework
congestion?
Buncefield Major Incident Investigation Board
(MIIB) set up a working group to examine the
evidence
Report identified potential mechanisms but no
definitive conclusion
Recommended a Joint Industry Project
DNV GL © 2014
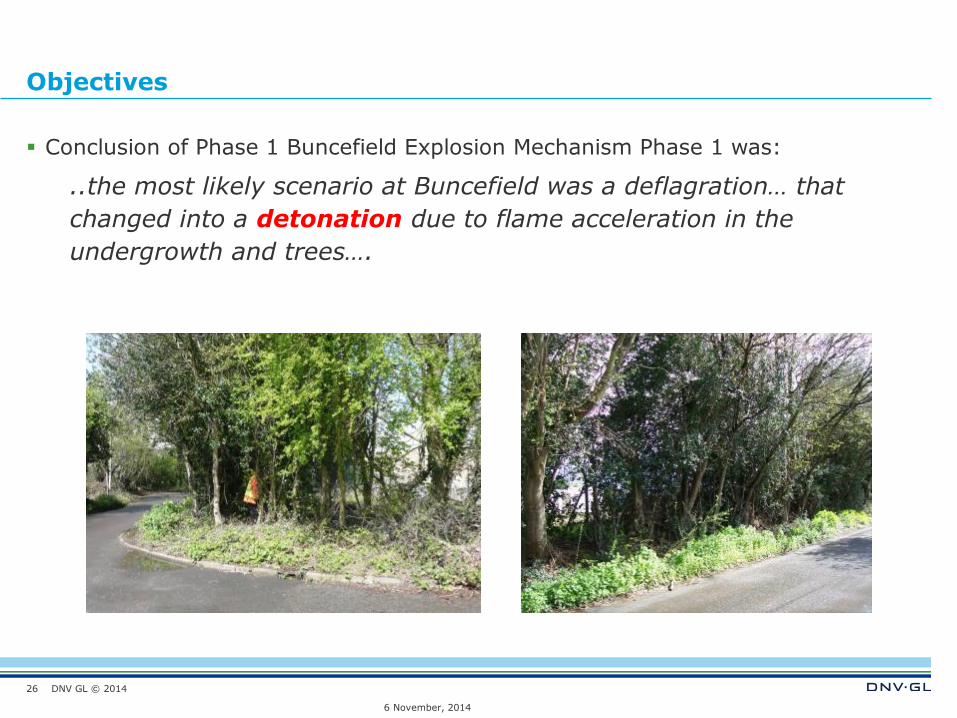
Objectives
Conclusion of Phase 1 Buncefield Explosion Mechanism Phase 1 was:
..the most likely scenario at Buncefield was a deflagration… that
changed into a detonation due to flame acceleration in the
undergrowth and trees….
6 November, 2014
26
DNV GL © 2014
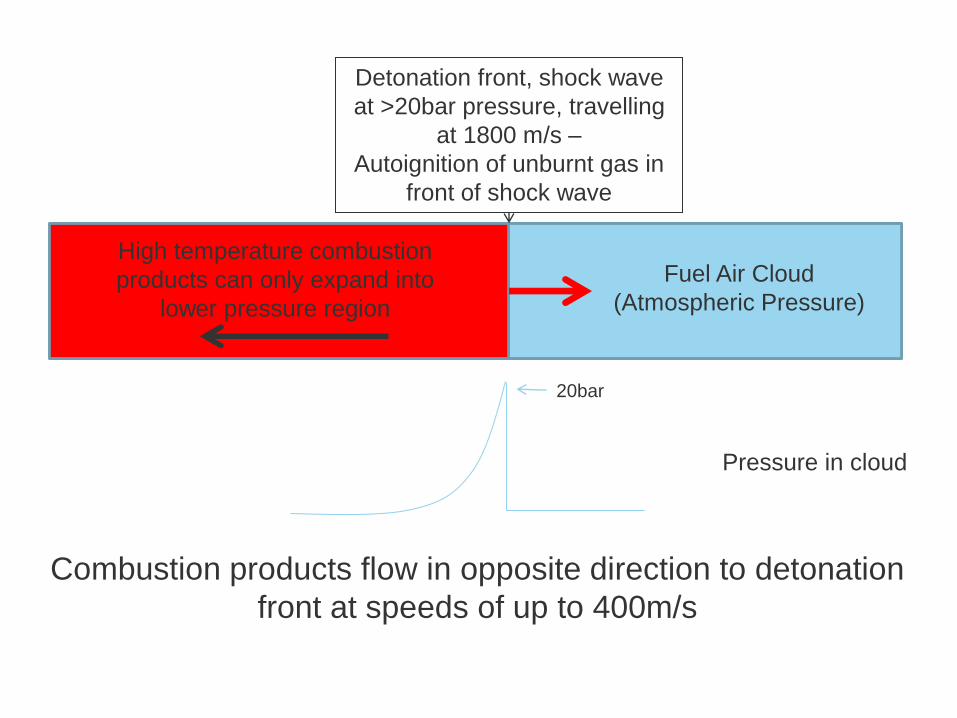
Detonation front, shock wave
at >20bar pressure, travelling
at 1800 m/s –
Autoignition of unburnt gas in
front of shock wave
High temperature combustion
products can only expand into
lower pressure region
Fuel Air Cloud
(Atmospheric Pressure)
Pressure in cloud
20bar
Combustion products flow in opposite direction to detonation
front at speeds of up to 400m/s
DNV GL © 2014
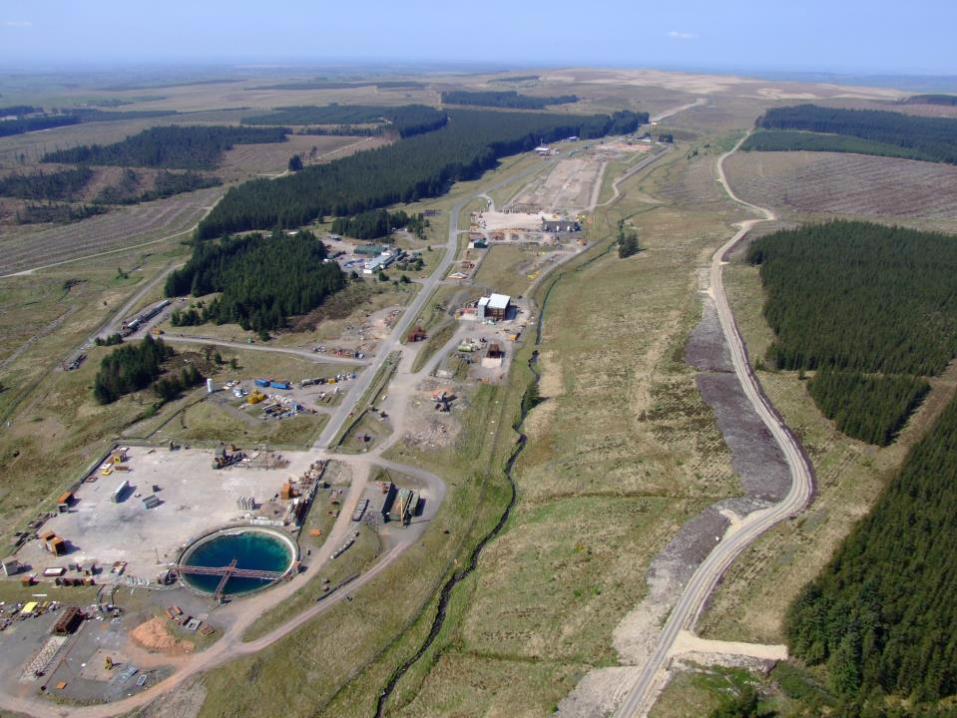
Joint Industry Project – Phase 2
Phase 2 had the objectives of:
– Providing evidence to support the conclusions of Phase 1
– Providing more general guidance on vapour cloud explosions
Programme of work comprised:
– Fuel spill and dispersion experiments
– Explosion experiments at medium and large scale
– Modelling of explosion and structural response
Will concentrate on the large scale experiments
– Potential for deflagration to detonation transition in trees and bushes
– Effects of overpressure on items typical of those observed at Buncefield and
Jaipur
28
DNV GL © 2014
DNV GL © 2014
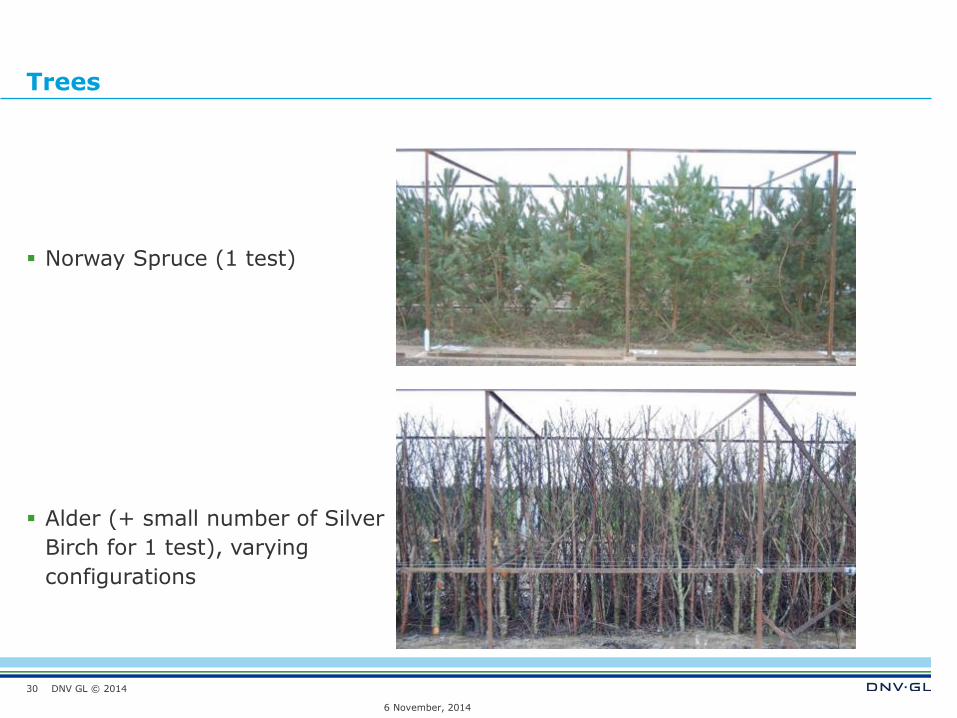
Trees
Norway Spruce (1 test)
Alder (+ small number of Silver
Birch for 1 test), varying
configurations
6 November, 2014
30
DNV GL © 2014
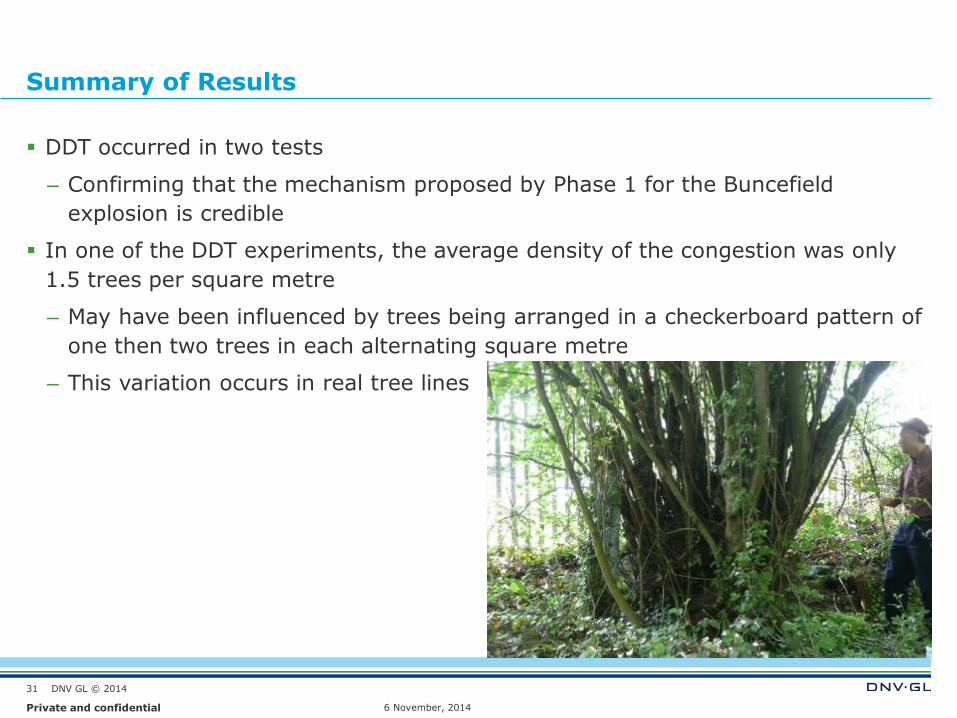
Summary of Results
DDT occurred in two tests
– Confirming that the mechanism proposed by Phase 1 for the Buncefield
explosion is credible
In one of the DDT experiments, the average density of the congestion was only
1.5 trees per square metre
– May have been influenced by trees being arranged in a checkerboard pattern of
one then two trees in each alternating square metre
– This variation occurs in real tree lines
6 November, 2014 Private and confidential
31
DNV GL © 2014
Summary of Results
Flame acceleration from a spark up to detonation is rapid, with the transition
occurring within 15-20m of flame propagation
– Only requires relatively small area of dense congestion containing near
stoichiomentric gas cloud
– If a flame entered such region already travelling at some speed, then the
distance to detonation will be even less
No transition to detonation was observed in any experiment where the congestion
width was less than 4.5m
– It is not possible to state that this could not occur in tree lines 3m in width
Transition to detonation in a 2m wide tree line appears unlikely to cause transition
to detonation
– Insufficient experiments to test impact of parameter changes
6 November, 2014 Private and confidential
32
DNV GL © 2014
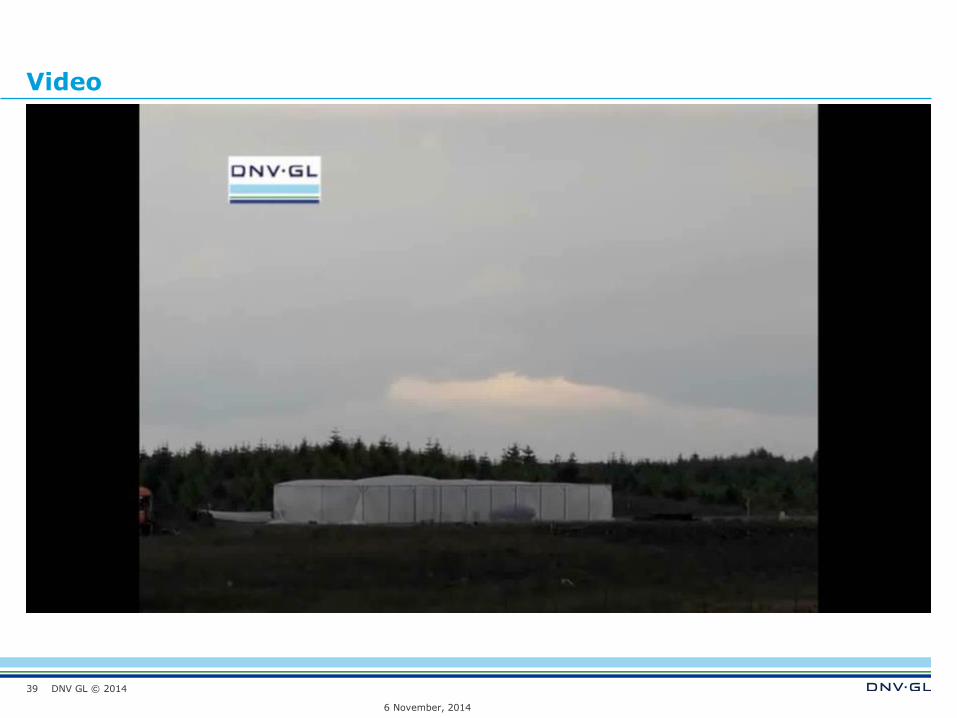
Video
6 November, 2014
33
DNV GL © 2014
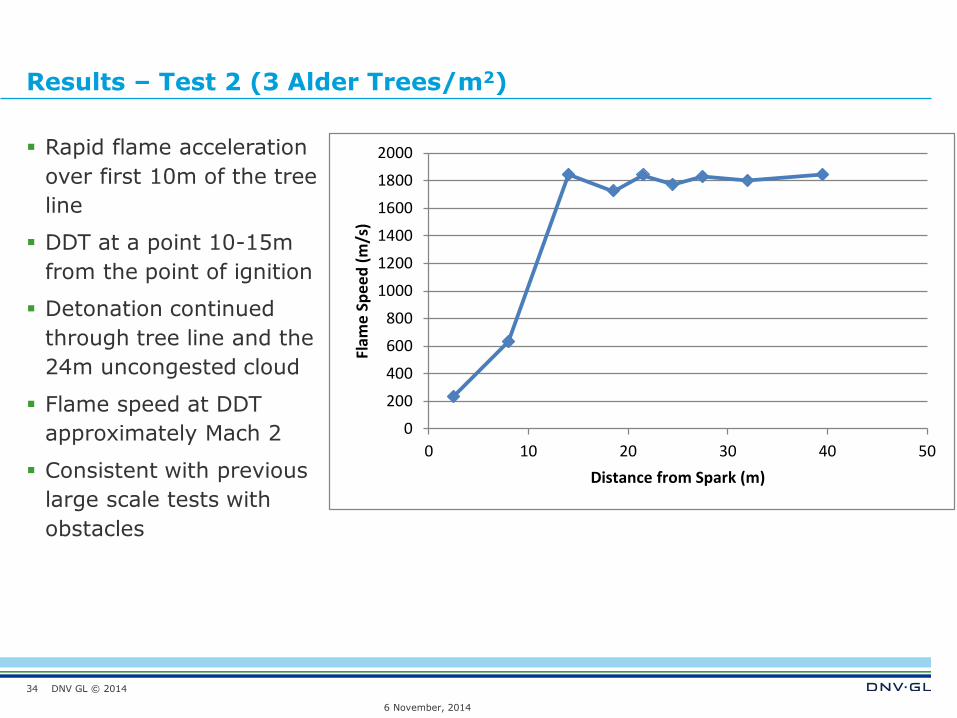
Results – Test 2 (3 Alder Trees/m2)
Rapid flame acceleration
over first 10m of the tree
line
DDT at a point 10-15m
from the point of ignition
Detonation continued
through tree line and the
24m uncongested cloud
Flame speed at DDT
approximately Mach 2
Consistent with previous
large scale tests with
obstacles
6 November, 2014
34
0
200
400
600
800
1000
1200
1400
1600
1800
2000
0 10 20 30 40 50
Flam
e S
pe
ed
(m
/s)
Distance from Spark (m)
DNV GL © 2014
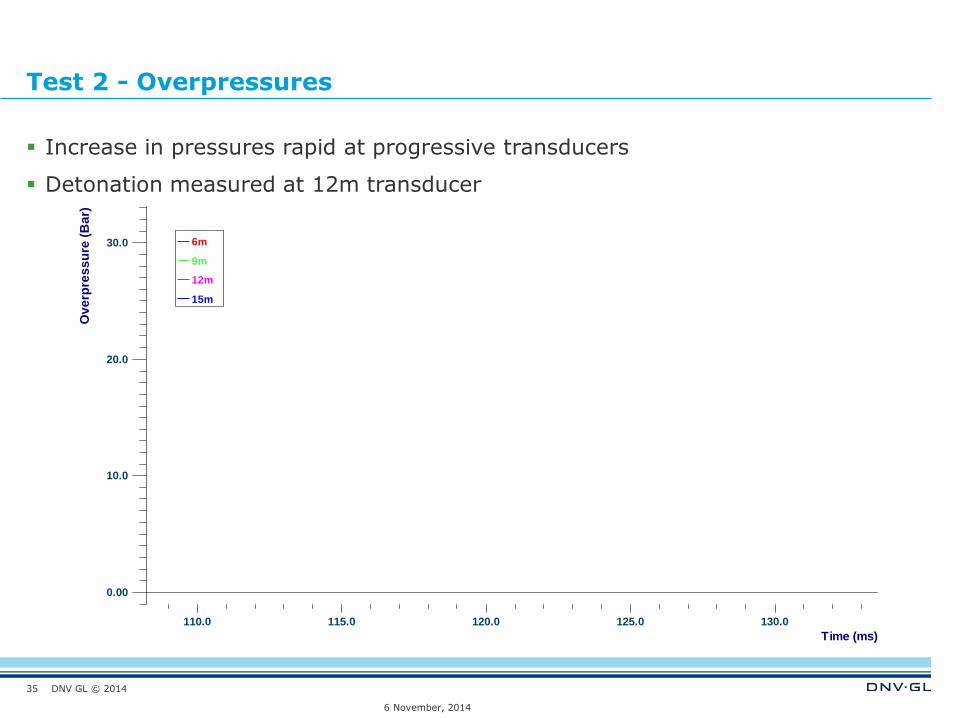
Test 2 - Overpressures
Increase in pressures rapid at progressive transducers
Detonation measured at 12m transducer
6 November, 2014
35
0.00
10.0
20.0
30.0
110.0 115.0 120.0 125.0 130.0
Time (ms)
Ov
erp
res
su
re (
Ba
r)
6m
9m
12m
15m
DNV GL © 2014
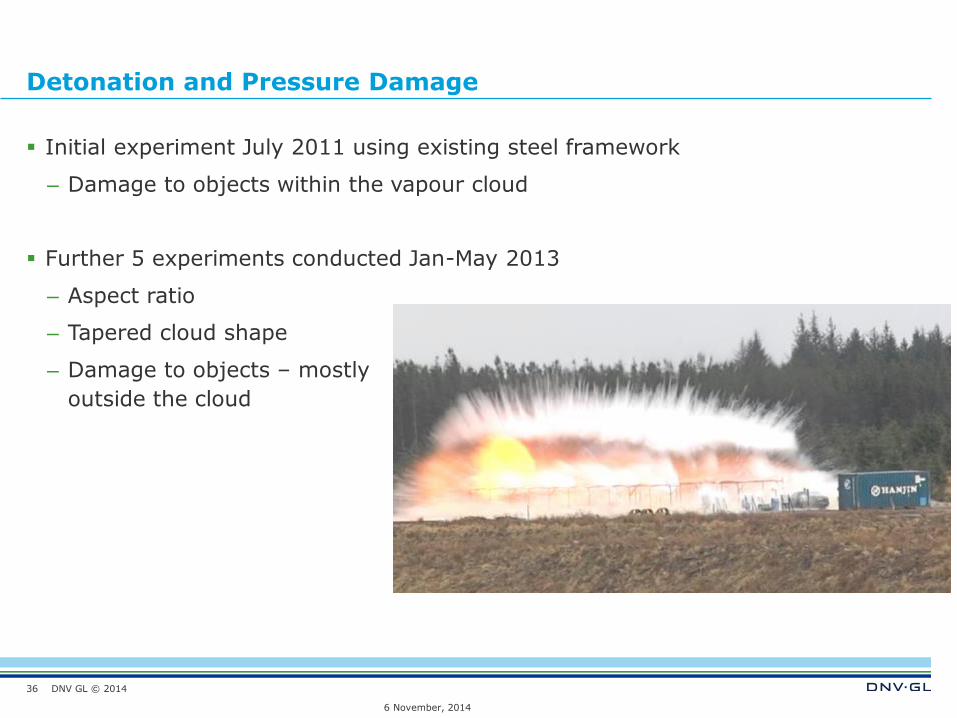
Detonation and Pressure Damage
Initial experiment July 2011 using existing steel framework
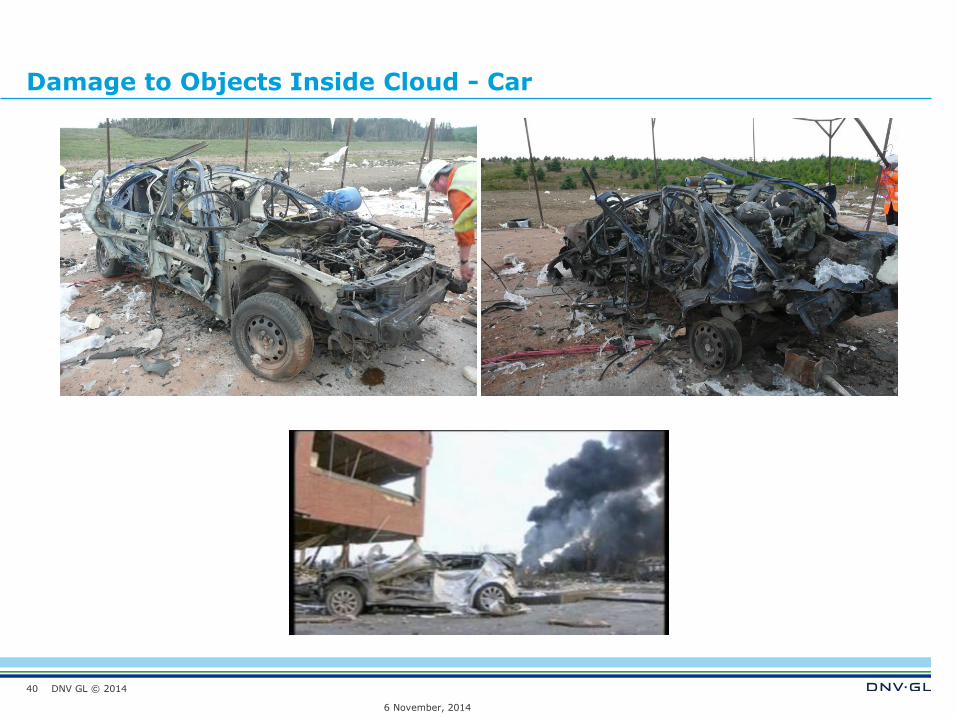
– Damage to objects within the vapour cloud
Further 5 experiments conducted Jan-May 2013
– Aspect ratio
– Tapered cloud shape
– Damage to objects – mostly
outside the cloud
6 November, 2014
36
DNV GL © 2014
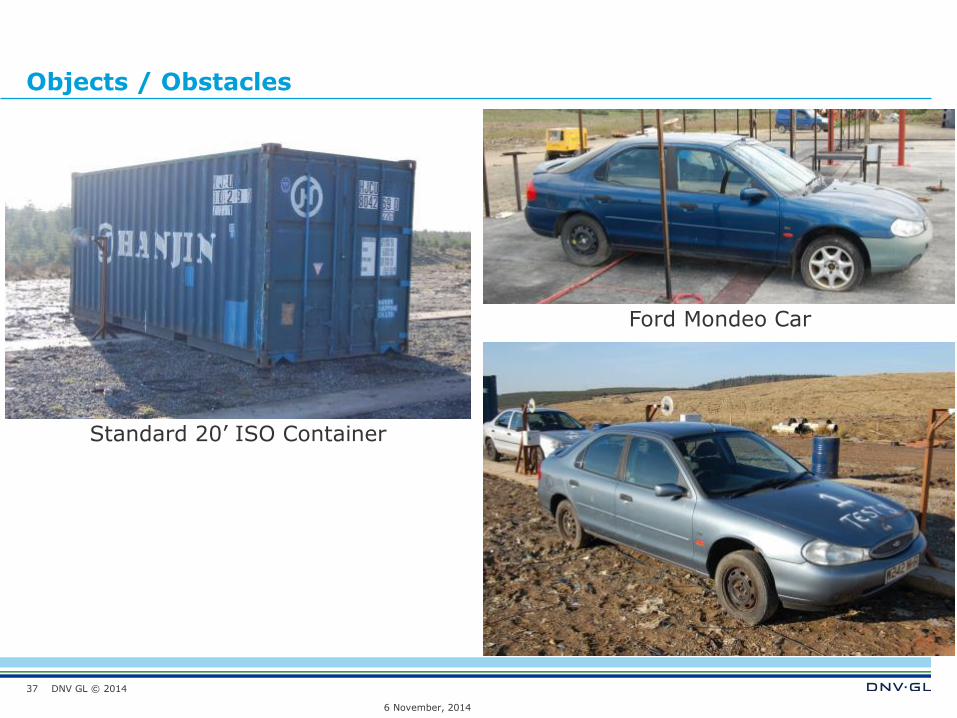
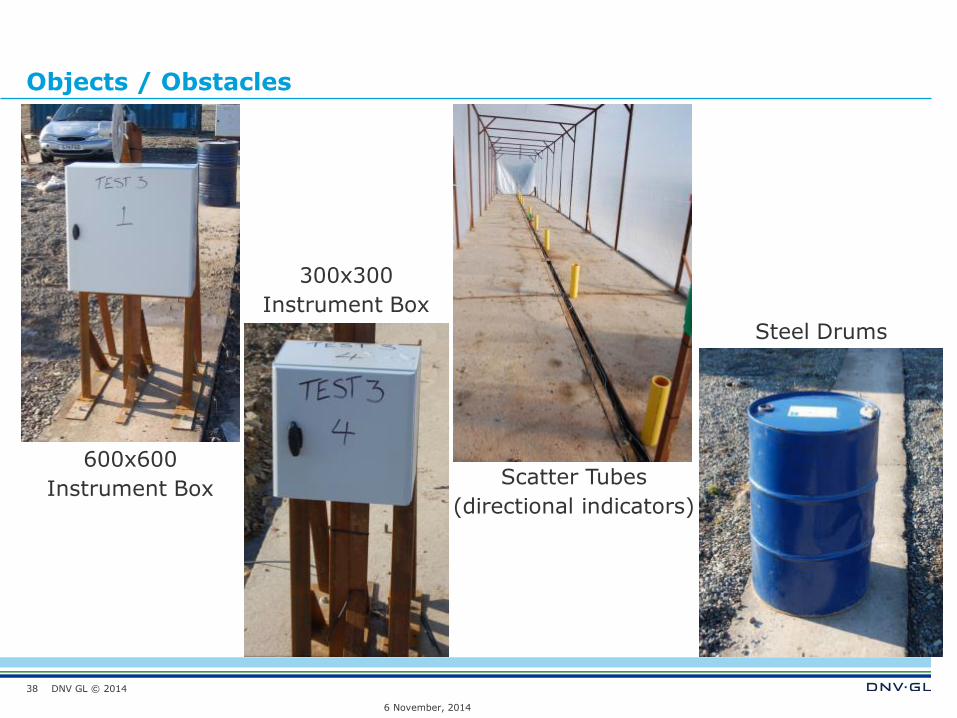
Objects / Obstacles
Standard 20’ ISO Container
6 November, 2014
37
Ford Mondeo Car
DNV GL © 2014
Objects / Obstacles
600x600
Instrument Box
6 November, 2014
38
300x300
Instrument Box
Scatter Tubes
(directional indicators)
Steel Drums
DNV GL © 2014
Video
6 November, 2014
39
DNV GL © 2014
Damage to Objects Inside Cloud - Car
6 November, 2014
40
DNV GL © 2014
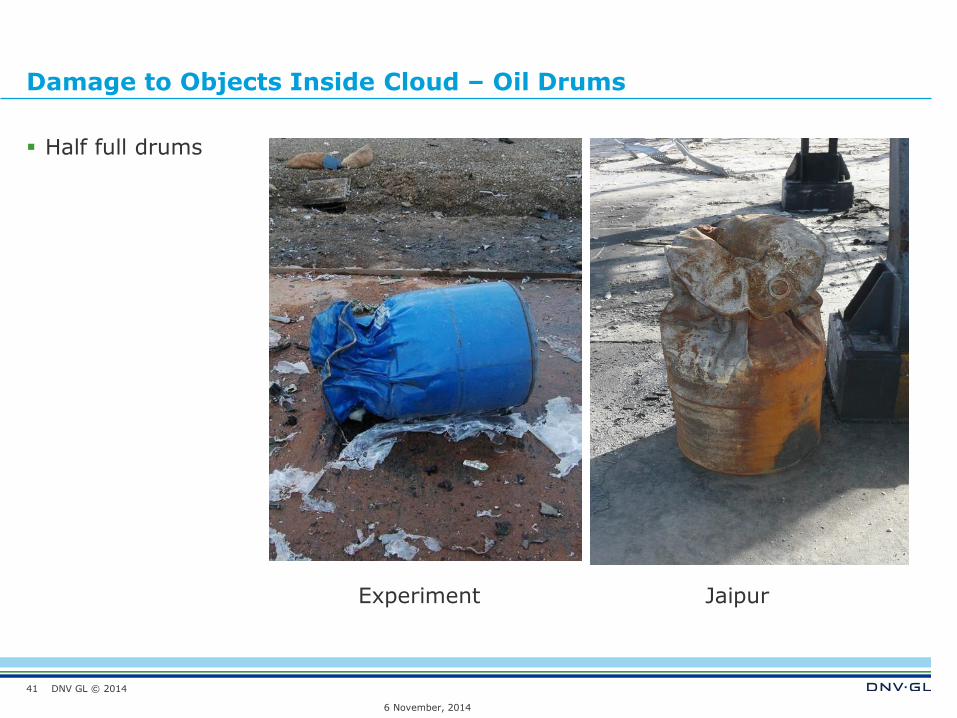
Damage to Objects Inside Cloud – Oil Drums
Half full drums
6 November, 2014
41
Experiment Jaipur
DNV GL © 2014
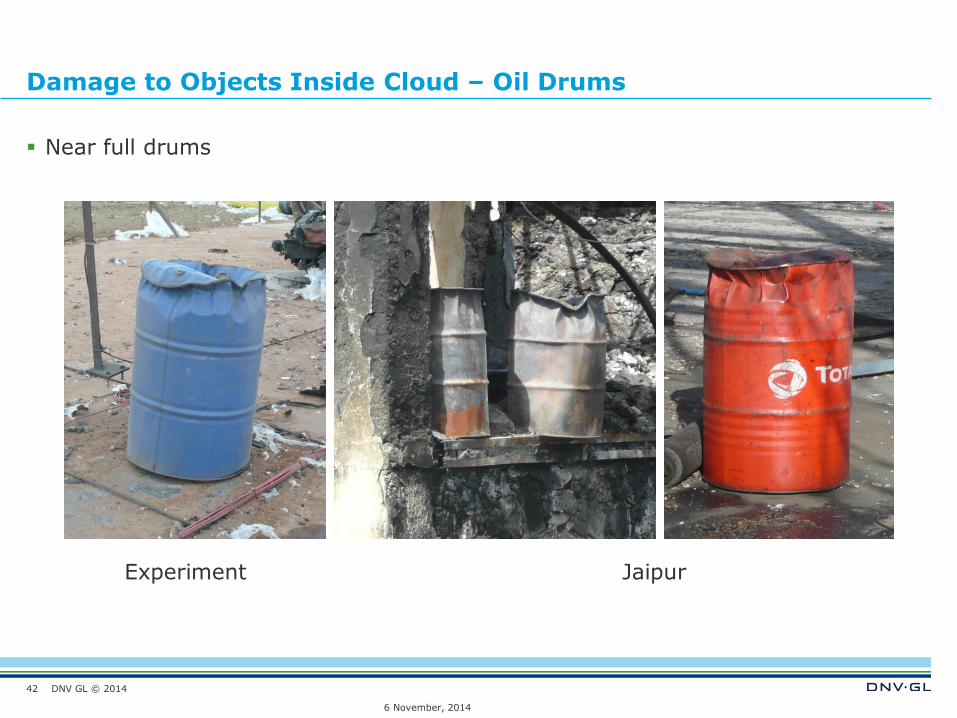
Damage to Objects Inside Cloud – Oil Drums
Near full drums
6 November, 2014
42
Experiment Jaipur
DNV GL © 2014
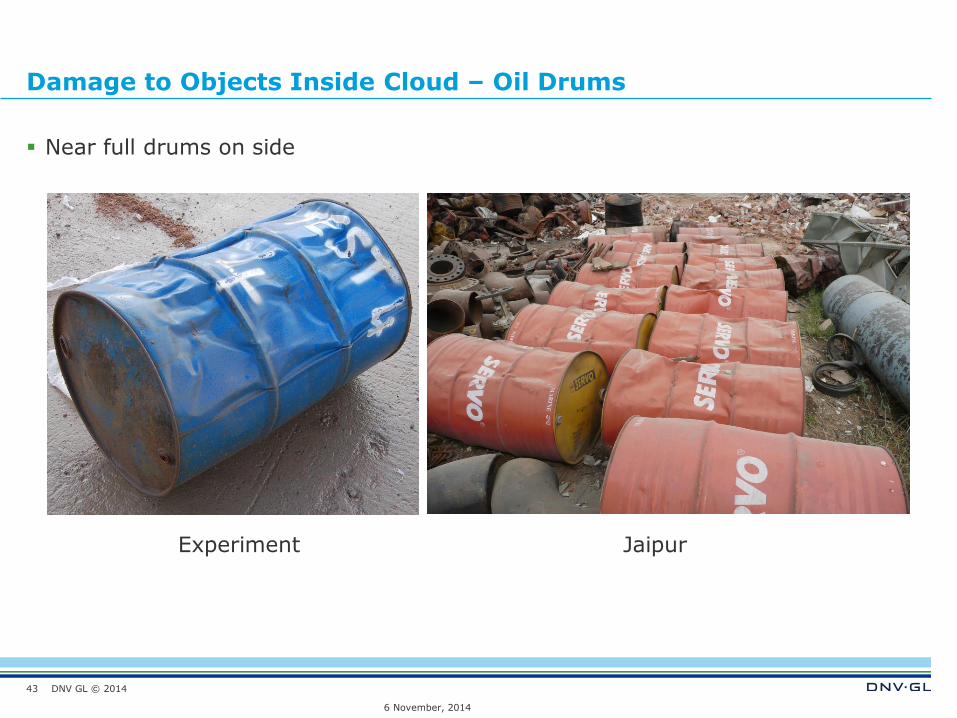
Damage to Objects Inside Cloud – Oil Drums
Near full drums on side
6 November, 2014
43
Experiment Jaipur
DNV GL © 2014
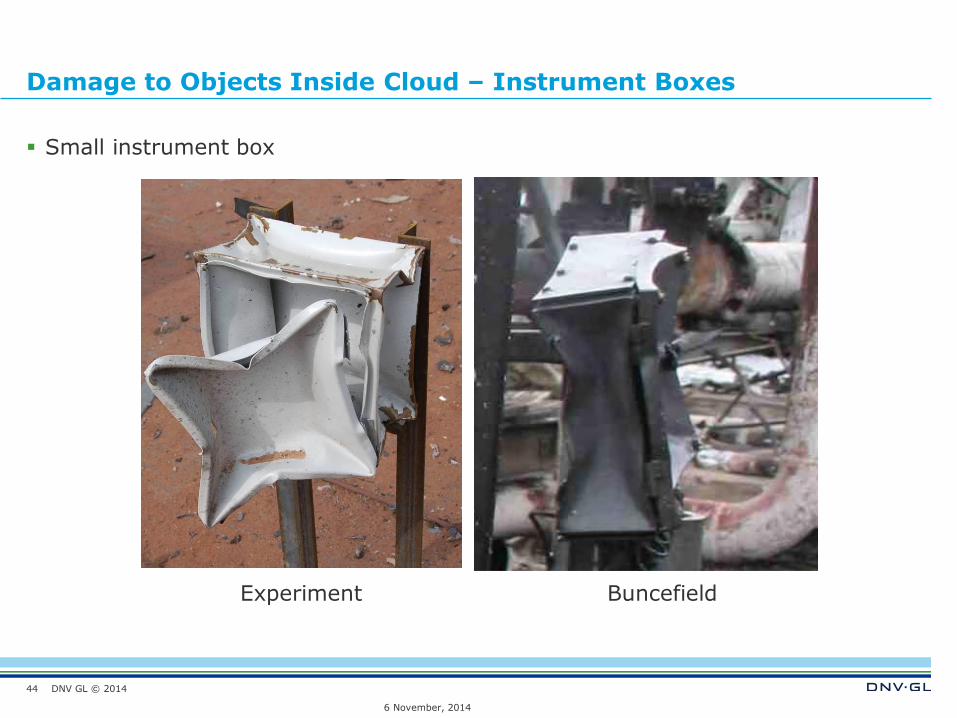
Damage to Objects Inside Cloud – Instrument Boxes
Small instrument box
6 November, 2014
44
Experiment Buncefield
(a) (b)
(c)(d)
(a) (b)
(c)(d)
DNV GL © 2014
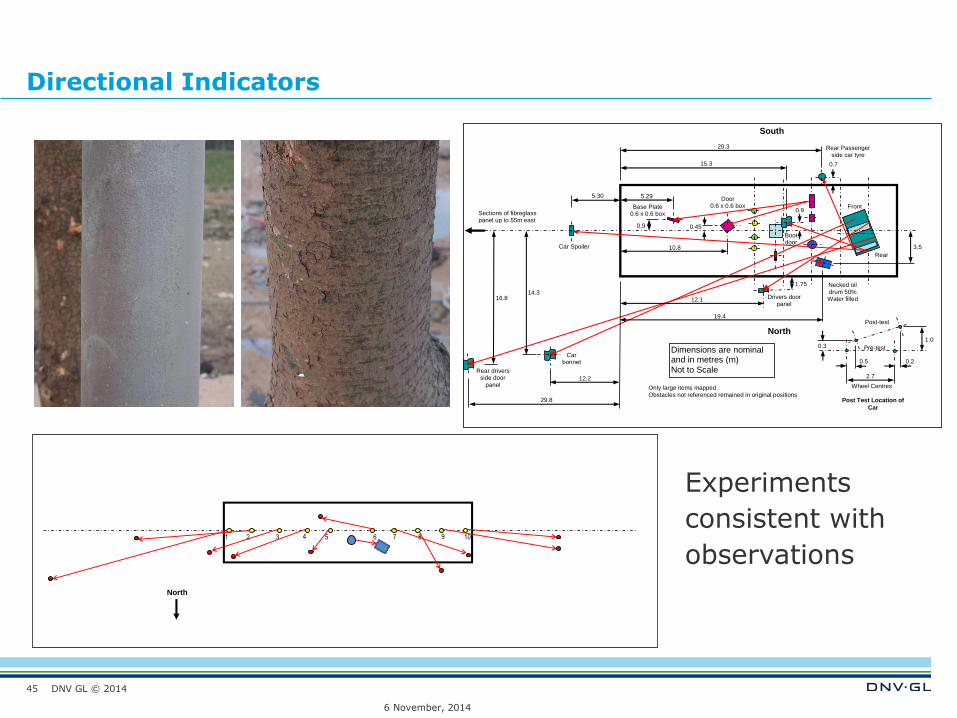
Directional Indicators
6 November, 2014
45
North
1 2 3 4 5 6 7 8 9 10
Experiments
consistent with
observations
Front
Rear
10.8
5.29 5.30
0.9 0.45
Car Spoiler
Base Plate 0.6 x 0.6 box
Door 0.6 x 0.6 box
0.9
15.3
20.3
0.7
Rear Passenger side car tyre
Boot door
19.4
12.1
1.75
3.5
Drivers door panel
Necked oil drum 50% Water filled
12.2
29.8
14.3 16.8
Car bonnet
Rear drivers side door
panel
Sections of fibreglass panel up to 55m east
South
North
Dimensions are nominal and in metres (m) Not to Scale
Only large items mapped. Obstacles not referenced remained in original positions
2.74
0.59
0.24
1.08 0.3
6
Wheel Centres
Pre-test
Post-test
Post Test Location of
Car
DNV GL © 2014
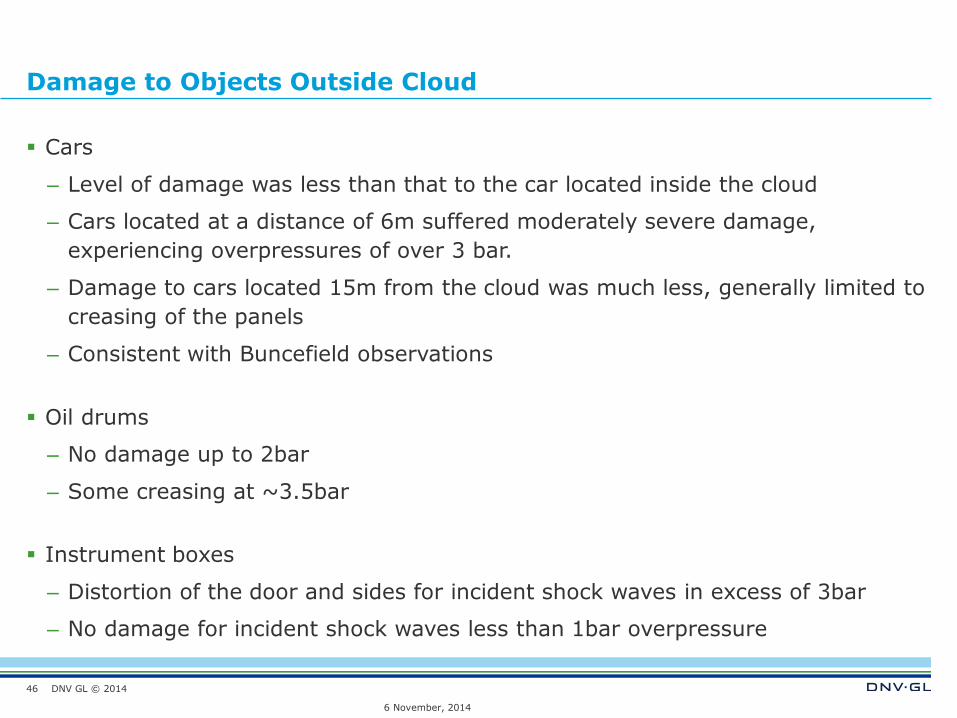
Damage to Objects Outside Cloud
Cars
– Level of damage was less than that to the car located inside the cloud
– Cars located at a distance of 6m suffered moderately severe damage,
experiencing overpressures of over 3 bar.
– Damage to cars located 15m from the cloud was much less, generally limited to
creasing of the panels
– Consistent with Buncefield observations
Oil drums
– No damage up to 2bar
– Some creasing at ~3.5bar
Instrument boxes
– Distortion of the door and sides for incident shock waves in excess of 3bar
– No damage for incident shock waves less than 1bar overpressure
6 November, 2014
46

DNV GL © 2014
Damage to Cars Outside Cloud
47
Test 4 Distance: 6mOverpressure (B09): 3428 mbar
Test 3 Car 2 Distance: 15mOverpressure (B11): 1074 (693) mbar
Test 3 Car 1Distance: 6mOverpressure (B09): 5209mbar
Test 2, Car 1, Distance: 6mOverpressure (B09): 11050 (5191) mbar
Test 2, Car 2, Distance: 15mOverpressure (B11): 1211 (1126) mbar
DNV GL © 2014
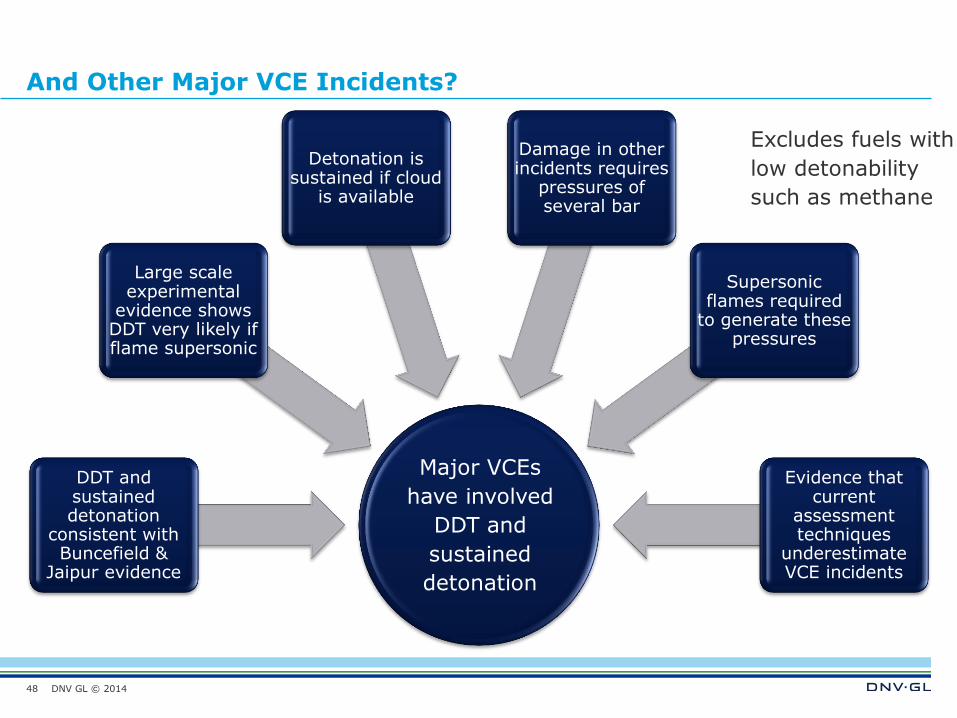
And Other Major VCE Incidents?
48
DDT and sustained detonation
consistent with Buncefield &
Jaipur evidence
Large scale experimental
evidence shows DDT very likely if flame supersonic
Detonation is sustained if cloud
is available
Damage in other incidents requires
pressures of several bar
Supersonic flames required
to generate these pressures
Evidence that current
assessment techniques
underestimate VCE incidents
Major VCEs
have involved
DDT and
sustained
detonation
Excludes fuels with
low detonability
such as methane
DNV GL © 2014
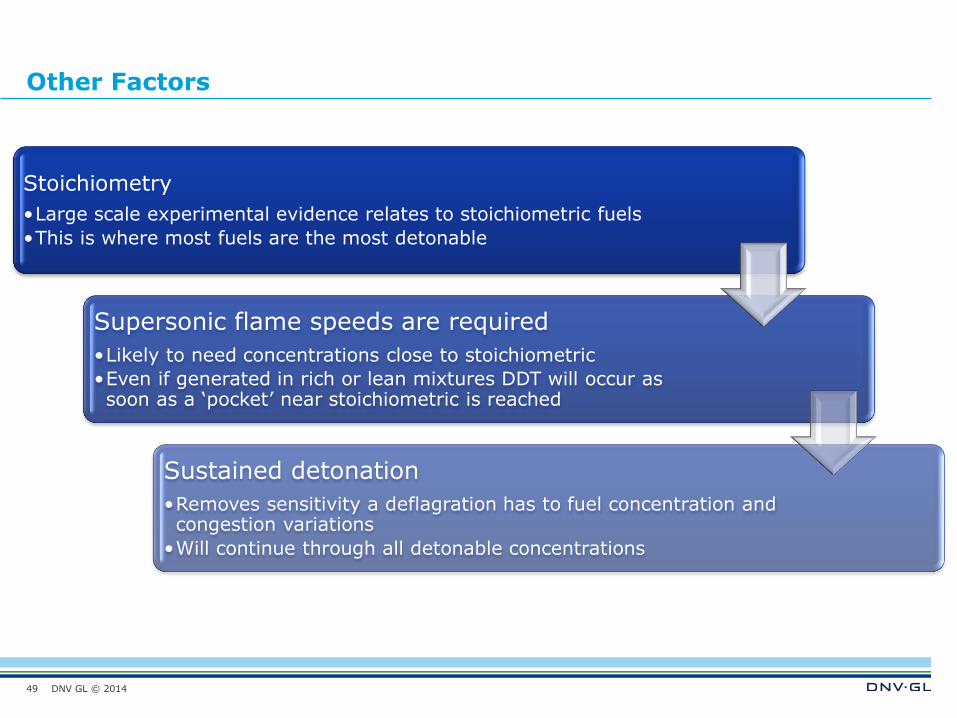
Other Factors
49
Stoichiometry
•Large scale experimental evidence relates to stoichiometric fuels
•This is where most fuels are the most detonable
Supersonic flame speeds are required
•Likely to need concentrations close to stoichiometric
•Even if generated in rich or lean mixtures DDT will occur as soon as a ‘pocket’ near stoichiometric is reached
Sustained detonation
•Removes sensitivity a deflagration has to fuel concentration and congestion variations
•Will continue through all detonable concentrations
DNV GL © 2014
So Why the Resistance?
Exclusion of detonations has been based on the general belief that DDT is not
possible in realistic conditions for fuels with a detonability similar to that of
propane.
This is despite experimental and incident evidence dating back more than thirty
years to the contrary, so why?
The assessment process becomes more complicated:
– Not just the congested region, now depends on the dispersion
– Consequence based approach is more difficult
Until now, we have been unable to properly interpret the forensic evidence
present following a vapour cloud explosion
50
DNV GL © 2014
Why Does it Matter
Current methodologies are based around congested regions
– Not unreasonable conclusion given outcome of original research into flame
acceleration
However, it will not necessarily protect against the major VCE incidents
We cannot continue to use an approach that does not represent the reality of the
position
– Including detonation can make a difference to facility design
51
DNV GL © 2014
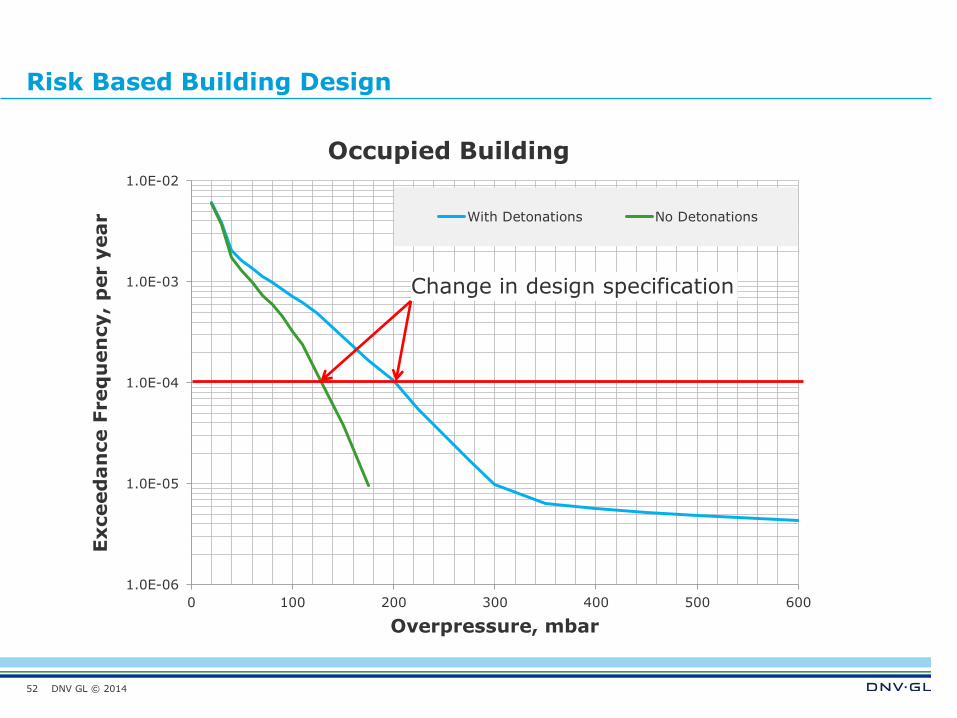
Risk Based Building Design
52
1.0E-06
1.0E-05
1.0E-04
1.0E-03
1.0E-02
0 100 200 300 400 500 600
Exceed
an
ce F
req
uen
cy,
per y
ear
Overpressure, mbar
Occupied Building
With Detonations No Detonations
Change in design specification
DNV GL © 2014
So, Does Something Need to Change?
The worst vapour cloud explosion in the UK occurred at Buncefield on a site that
had been assessed to have no significant explosion hazard
Strongly suggests that something needs to change
Guidance should be updated to highlight the potential for DDT:
– The types of fuels where DDT is possible
– The conditions required to produce DDT
– The types of conditions where DDT may make more difference to design
decisions
53
DNV GL © 2014
Conclusions
DDT provides a relatively simple means of explaining the extensive and wide
ranging damage observed following major vapour cloud incidents
Removes the sensitivities deflagrations have to concentration and congestion
fluctuations
Based on experimental evidence, it is difficult to understand why many major
vapour cloud explosions could not have involved DDT to give a self-sustaining C-J
detonation through the remaining parts of the detonable vapour cloud
Guidance and assessment methods need to be improved to assist industry
Guidance also needs to be provided on the interpretation of evidence from
incidents
54
DNV GL © 2014
SAFER, SMARTER, GREENER
www.dnvgl.com
Thank you for your attention
55


![1[1] Lesson of Buncefield](https://img.pdfslide.us/doc/110x75/577d1d861a28ab4e1e8c7343/11-lesson-of-buncefield.jpg)