Embed Size (px)
Citation preview
OIL EXPLORATION AND DEVELOPMENT IN THE NORTH DAKOTA WILLISTON BASIN:
1988-1989 UPDATE
by
Thomas J. Heck
MISCELLANEOUS SERIES NO. 74 NORTH DAKOTA GEOLOGICAL SURVEY
--
-----
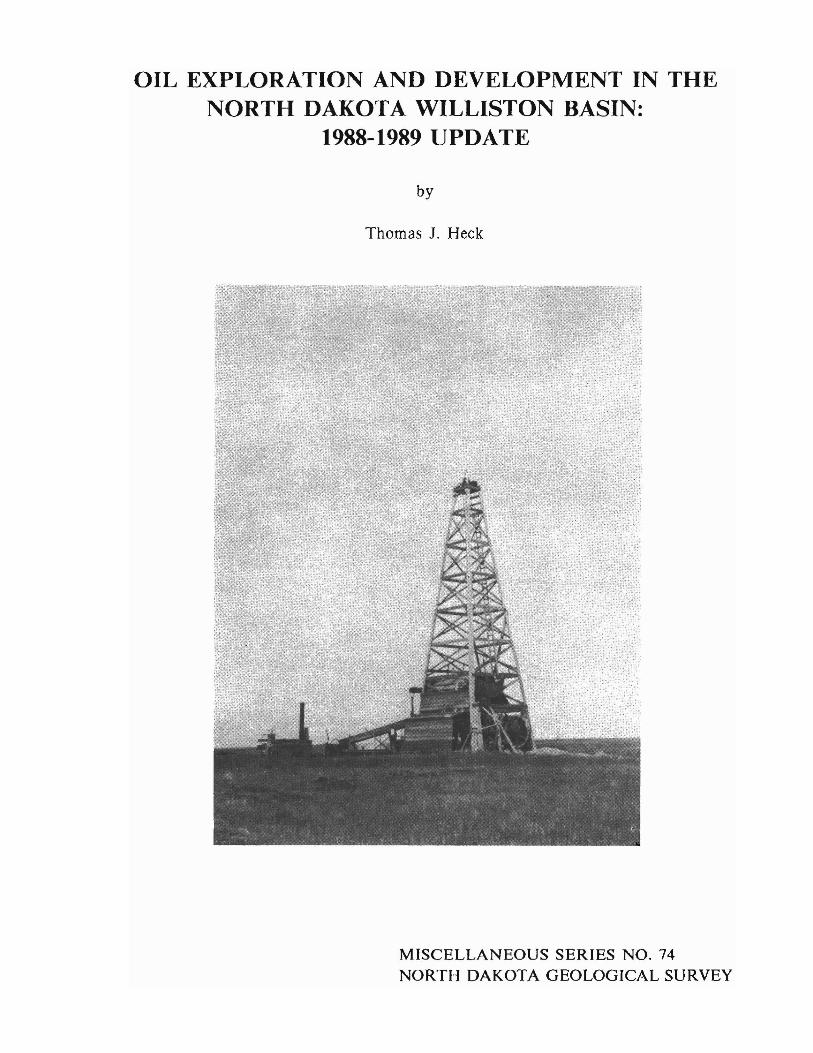
NORTH DAKOTA
STRATIGRAPHIC COLUMN
SEOlJENCES GROLPS ROCK UNITSSYS1EMS "
QUhTERNAAY GloOIOI~'>
~-'Wh I Ie River Golden '101 lev
Sen II ne I BUll e
Fort Union BullIon Group CreekTERTIARY
Slope
Connonbo I'
l udl ow --1----
Hell
Creek
fo~ Ht I It
Montana P Ierr aGroup
Z Judith RiverCRETACEOUS=:) N
Eoole i7 f---._-'
Nlob,oro
Cor til e
Colorado Group Greenhorn
Bell e Fourohe Wow,y .....Ult I. I •.
Sku I t CreekDakota Group
tnyon Ko,o
S.lft
f---.---- JURASSIC Rlerdon
Piper-~--_ ..
TRIASSIC Spear' I 'h •
« Y:' "Innekahlo
PERMIAN OpeoheD::' «
Broon CreekIf) Minnelusa m Group ""'aden « 1--------._--PE~SYLVANIAN Tyle, •
Big 0, .erSnowyGroup
Kibbey --•
Poplar (/) Interval ....J < > ROlollffea:: Inlervol •W ~ FrobisherZ Alida • - Interval
MISSISSIPPIAN Mod t son .-J I' 'tton •ntervol<Group
« ~ a::: 0 Batt Ineou - I..L
Intervol.~ Z If)
-«
~ If)
Bakken« • ~ Three Forks.
BI,dbeo, •Jefferson Oupero.Group • ~ourl.Mon I toba IVorDEVONIAN •
Dowson Boy.GrOUD Pral r Ie
Elk Point ._--Wlnntpe\loll' •
Group Ashern
Interloke.SILURIAN W 0
Slonewoll •Z -« Big Sto.y Wtn.U HornW Group0... ~ ..d •lverORDOVICIAN0... ¢-I
~lnnlP"Q ¢,oup
~- :¢Deadwood • ,<>,;F CAMBRIAN
PRECAMBRIAN
• OIL PRODUCTION
:¢- GAS PRODUCT! ON
0
ISSN:0078-1576
OIL EXPLORATION AND DEVELOPMENT IN THE NORTH DAKOTA
WILLISTON BASIN: 1988-1989 UPDATE
by
Thomas J. Heck
MISCELLANEOUS SERIES NO. 74
NORTH DAKOTA GEOLOGICAL SURVEY
John P. Bluemle, Aeti ng State Geologist
1990
The cover shows "a standard cable-tool rig drilling for natural gas on the Parker farm south of Westhope, Bottineau County, on June 15, 1910. The operator was North Dakota Gas Co. The boiler was fired with gas from nearby wells (T161N, R80W)." Folsom ( 1980, p. 10).
CONTENTS Page
iv ILLUSTRATIONS
1 INTRODUCTION .
5 .1988 ..... 5
STATISTICS 5 DRILLING ACTIVITY.
10 1989 . 10
STATISTICS . 10 DRILLING ACTIVITY.
16 SUMMARY
22 REFERENCES
iii
ILLUSTRATIONS
Figure Page
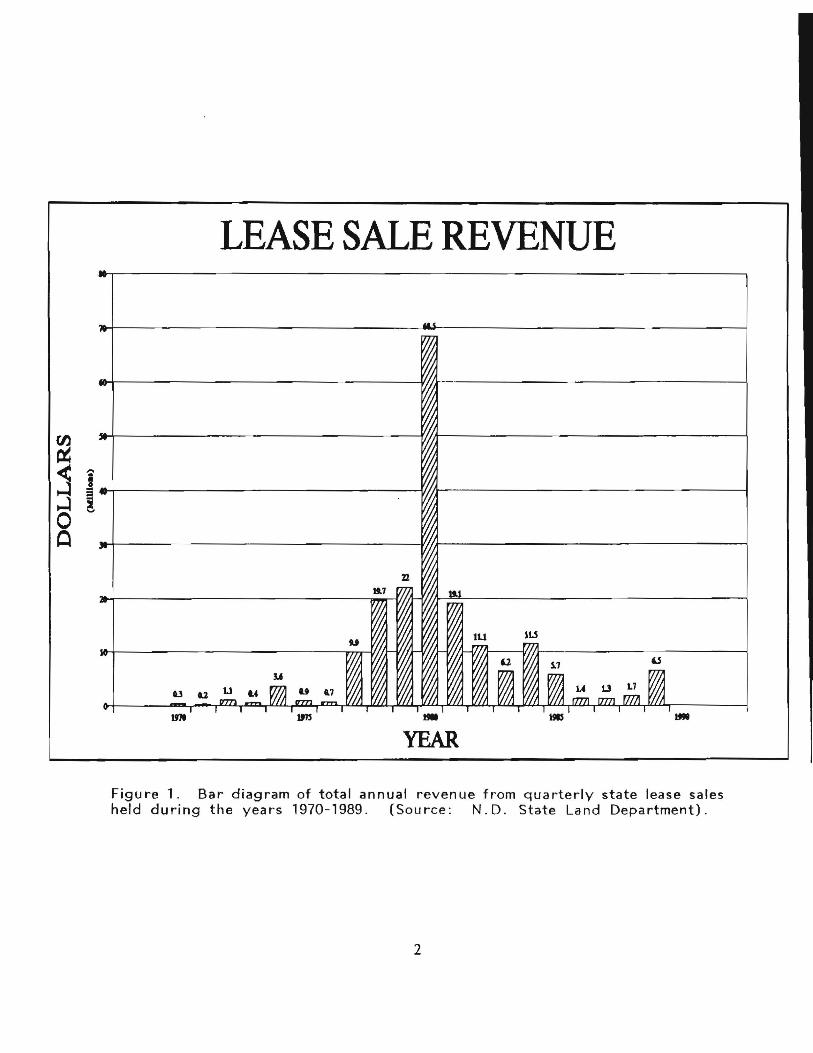
1. Bar diagram of total annual revenue from quarterly state lease sales held during the years 1970-1989. (Source: N.D. State Llmd Department. 2
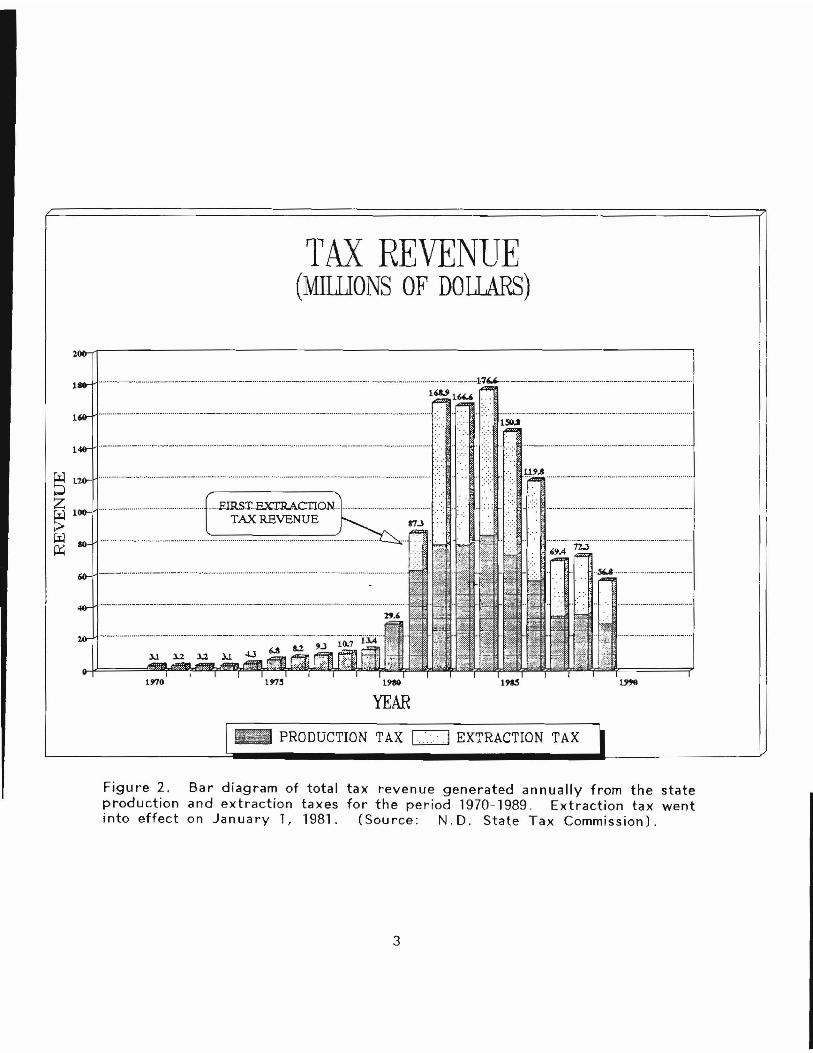
2. Bar diagram of total tax revenue generated annually from the state production and extraction taxes for the period 1970-1989. Extraction tax went into effect on January 1, 1981. (Source: N.D. State Tax Conunission). . . .. . 3
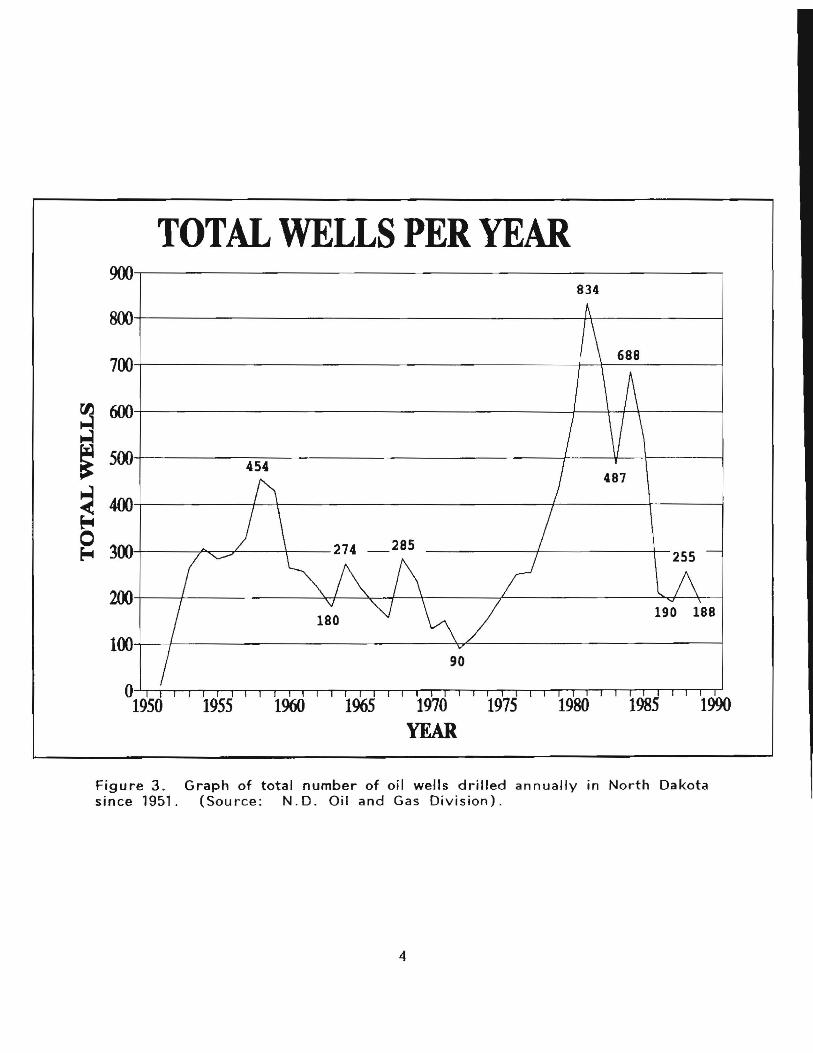
3. Graph of total number of oil wells drilled annually in North Dakota since 1951. (Source: N. D. Oil and Gas Division) . . . . . 4
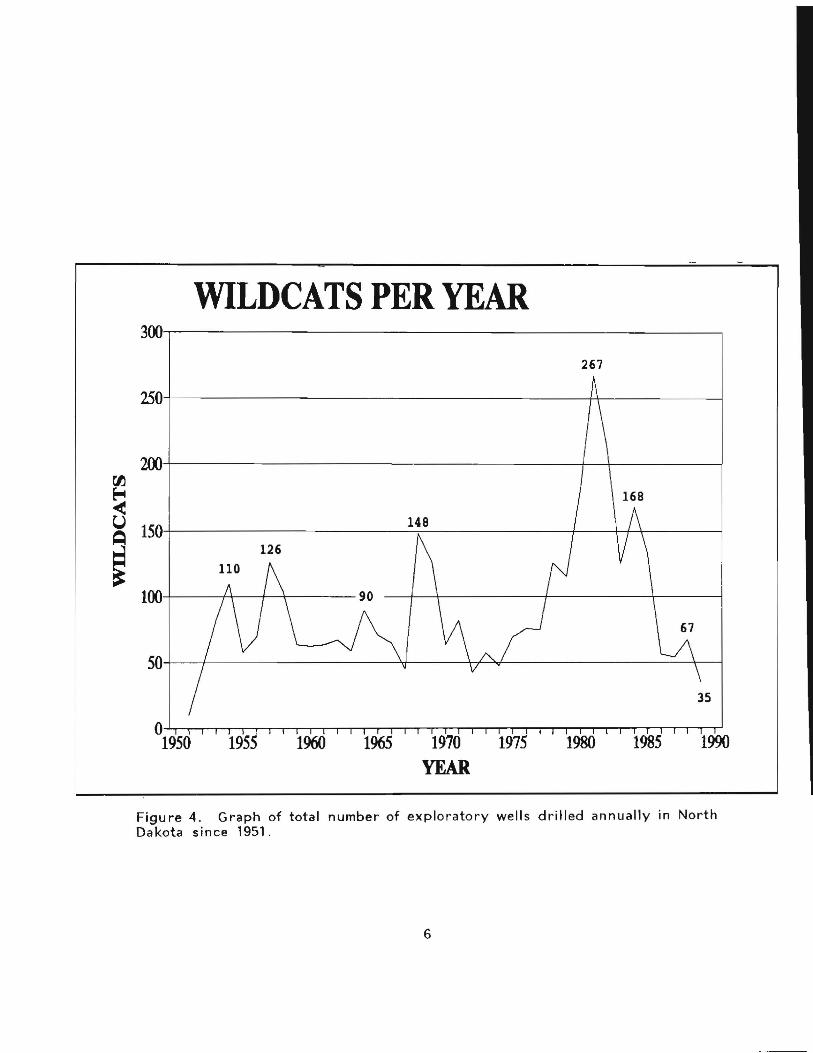
4. Graph of total number of exploratory wells drilled annually in North Dakota since 1951 . . . . . . . 6
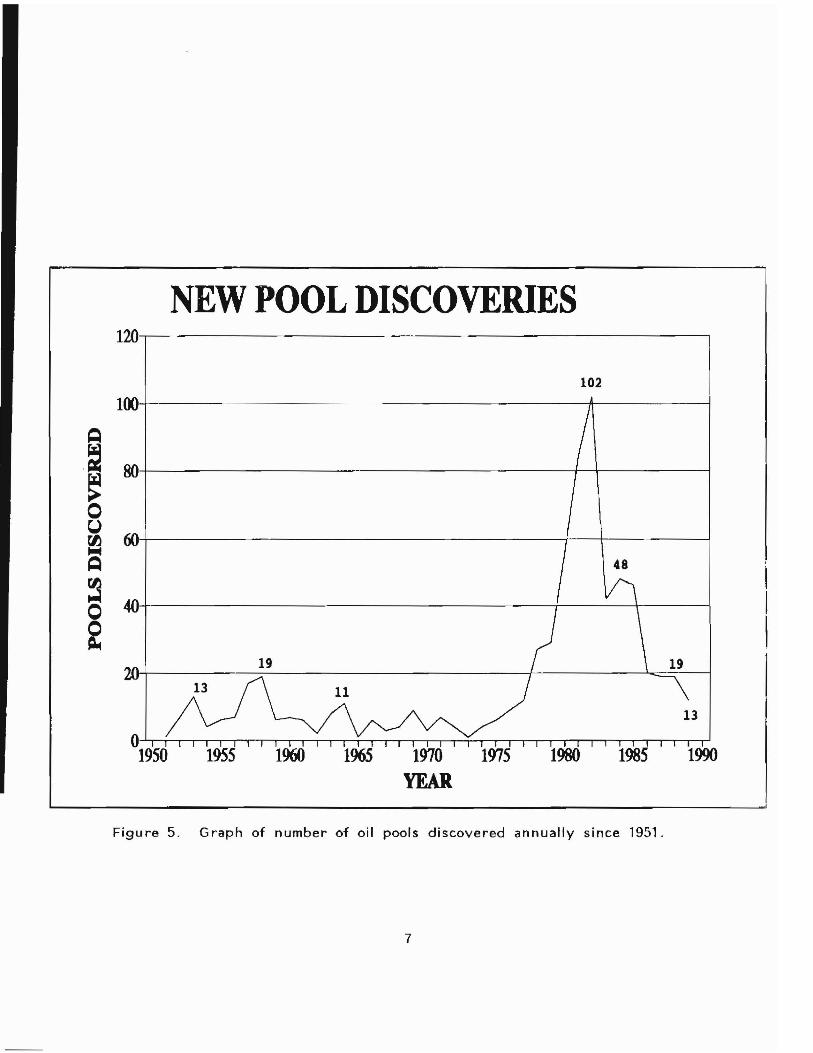
5. Graph of number of oil pools discovered annually since 1951. .... . .... 7
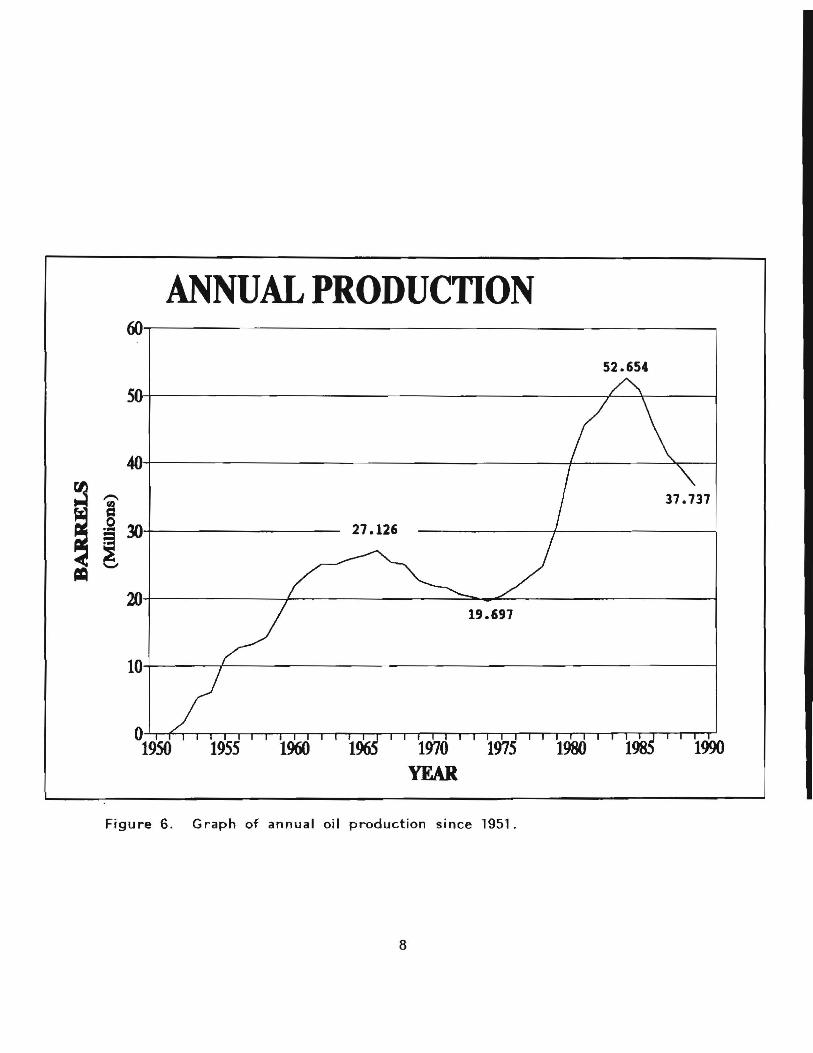
6. Graph of annual oil production since 1951 8
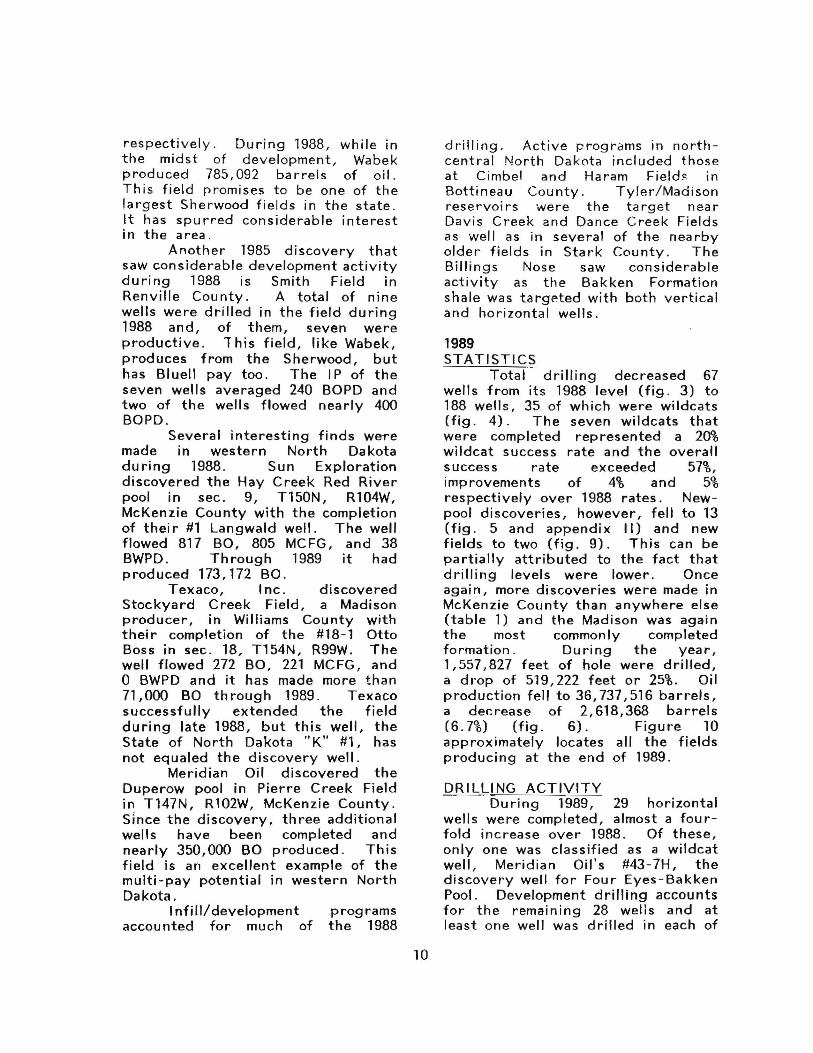
7. Bar diagram of state tax revenue sources 11
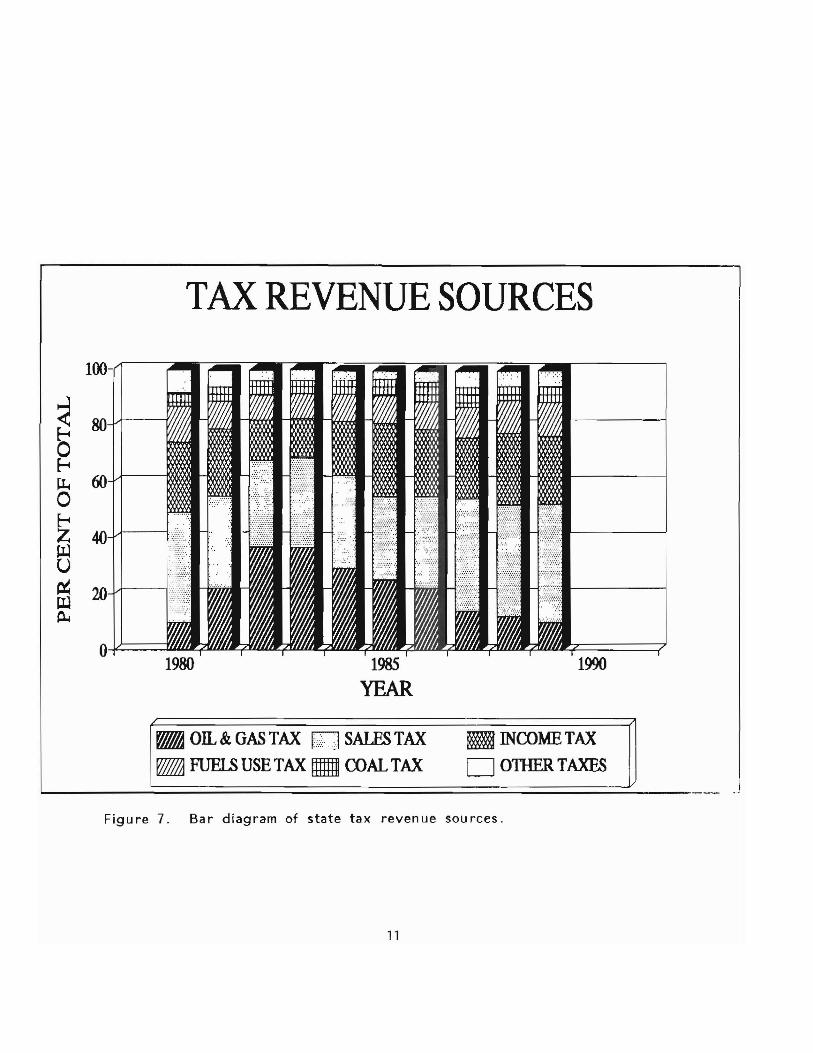
8. Map of western North Dakota with 1988 new field discoveries shown. . . . .. ..... . . . . _ . . . . 12
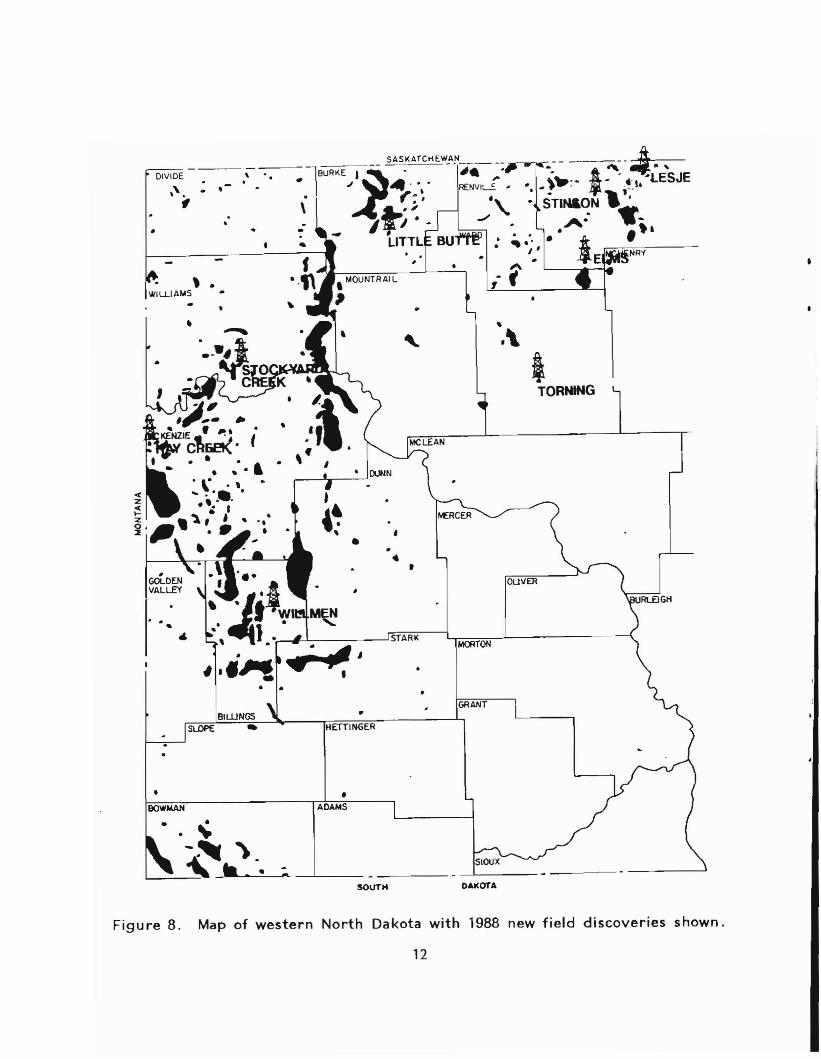
9. Map of western North Dakota with 1989 new field discoveries shown. . . . . . . . . . . . . . . 13
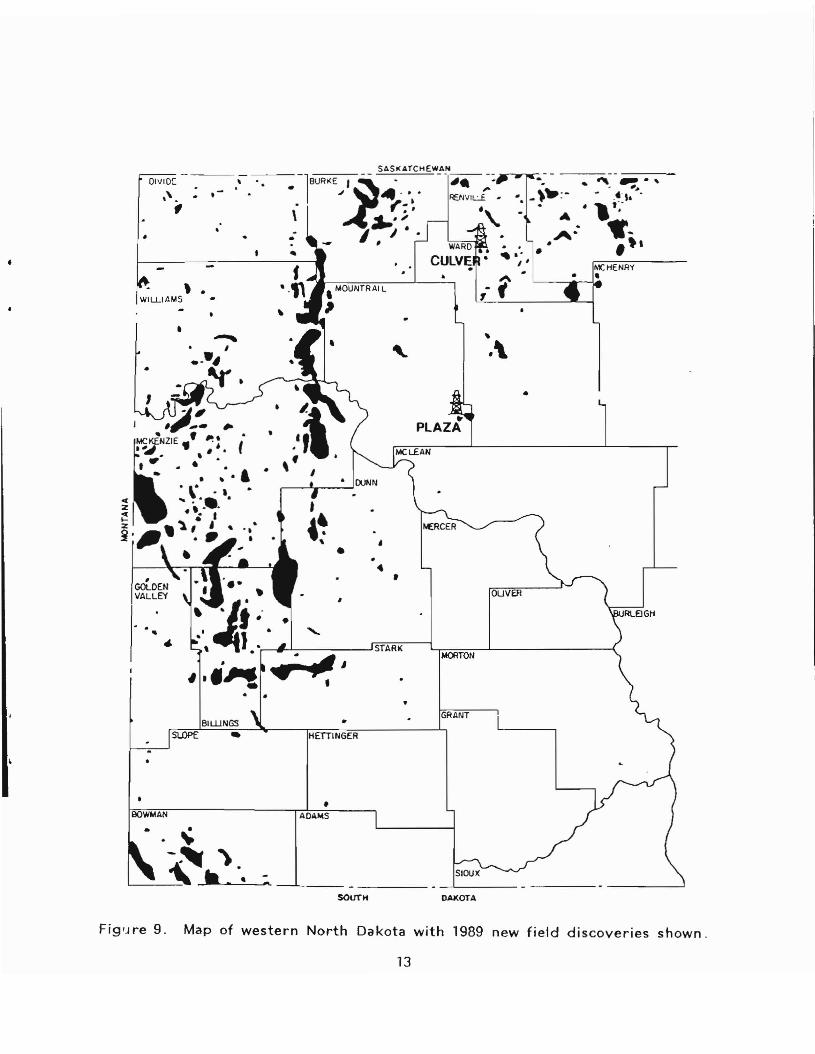
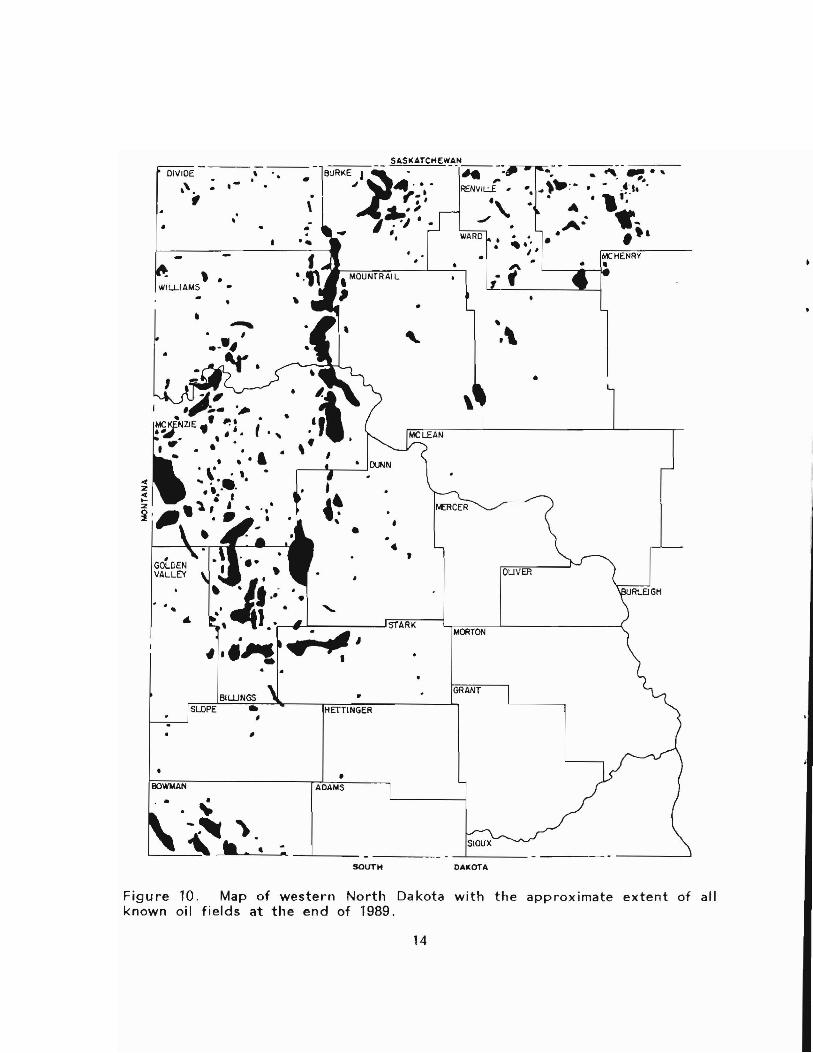
10. Map of western North Dakota with the approximate extent of all known oil fields at the end of 1989 . . . . . . . . . . 14
Table Page
1. I98R and 1989 New Pool Discoveries Listed by County and Formation . . . . . 9
Appendix
I. Oil and Gas Discovery Wells in North Dakota During 1988. . . . . . . . . . . . . . . . . . . . . . . . . . . . 17
II. Oil and Gas Discovery Wells in North Dakota During 1989. . . . . . . . . . . . . . . . . . . . . . . . . . . . 20
iv
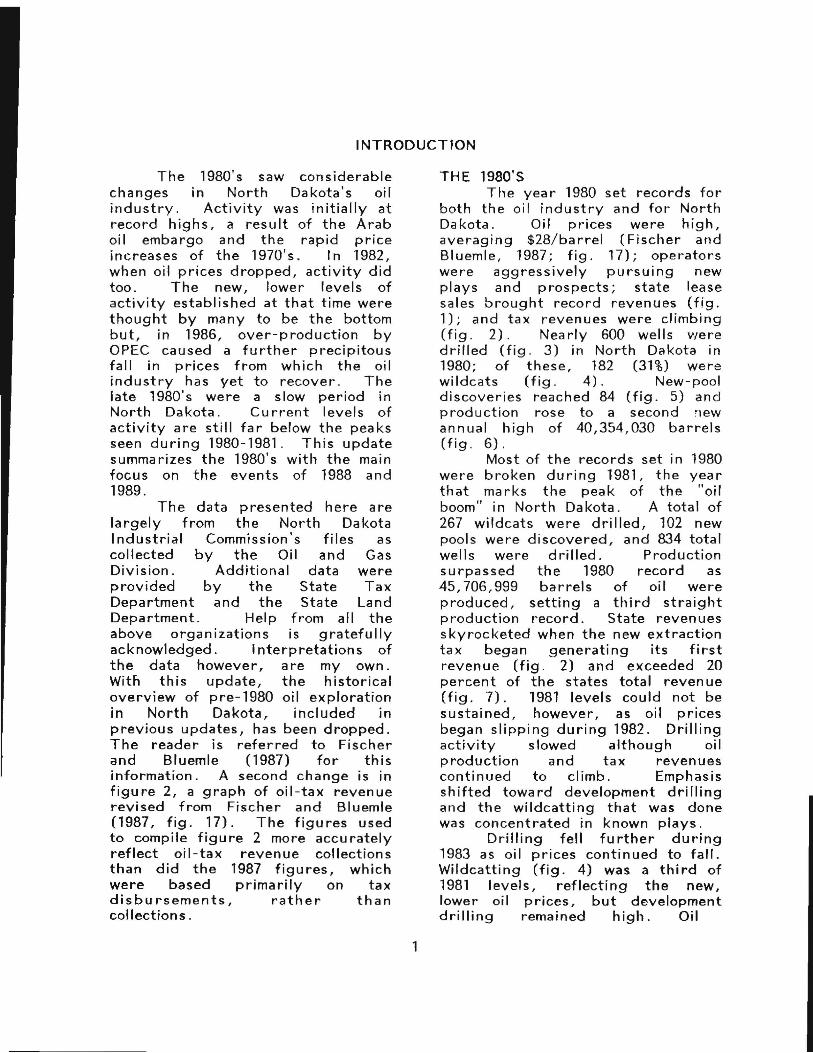
INTRODUCTION
The 1980's saw considerable changes in North Dakota's oil industry. Activity was in itially at record highs, a result of the Arab oil embargo and the rapid price increases of the 1970's. In 1982, when oil prices dropped, activity did too. The new, lower levels of activity established at that time were thought by many to be the bottom but, in 1986, over-production by OPEC caused a further precipitous fall in prices from which the oil industry has yet to recover. The late 1980's were a slow period in North Dakota. Cu rrent levels of activity are still far below the peaks seen during 1980-1981. This update summarizes the 1980's with the main focus on the events of 1988 and 1989.
The data presented here are largely from the North Dakota Industrial Commission's files as collected by the Oil and Gas Division. Additional data were provided by the State Tax Department and the State Land Department. Help from all the above organizations is gratefully acknowledged. Interpretations of the data however, a re my own. Witn this update, the historical overview of pre-1980 oil exploration in North Dakota, included in previous updates, has been dropped. The reader is referred to Fischer and Bluemle (1987) for this information. A second change is in figure 2, a graph of oil-tax revenue revised from Fischer and Bluemle (1987, fig. 17). The figures used to compile figure 2 more accurately reflect oil-tax revenue collections than did the 1987 figures, which were based primarily on tax disbursements, rather than collections.
THE 1980'S The year 1980 set records for
both the oi I industry and for North Da kota. Oil prices were high, averaging $28/barrel (Fischer and Bluemle, 1987; fig. 17); operators were aggressively pursuing new plays and prospects; state lease sales brought record revenues (fig. 1); and tax revenues were climbing (fig. 2). Nea rly 600 wells were drilled (fig. 3) in North DClkota in 1980; of these, 182 (31%) were wildcats (fig. 4). New-pool discoveries reached 84 (fig. 5) and production rose to a second 'lew annual high of 40,354,030 barrels (fig. 6).
Most of the records set in 1980 were broken during 1981, the year that marks the peak of the "oil boom" in North Dakota. A total of 267 wildcats were drilled, 102 new pools were discovered, and 834 total wells were drilled. Production surpassed the 1980 record as 45,706,999 barrels of oil were produced, setting a thi rd straight production record. State revenues skyrocketed when the new extraction tax began generating its first revenue (fig. 2) and exceeded 20 percent of the states total revenue (fig. 7). 1981 levels could not be sustained, however, as oil prices began slipping during 1982. Drilling activity slowed although oil production and tax revenues conti nued to climb. Emphasis shifted toward development drilling and the wildcatting that was done was concentrated in known plays.
Drilling fell further during 1983 as oil prices continued to fall. Wildcatting (fig. 4) was a third of 1981 levels, reflecting the new, lower oil prices, but development drilling remained high. Oil
1
LEASE SALE REVENUE
~ j j ....+--------------fjJ'JI--------------j ~ ! o o
o.J
YEAR
Figure 1. Bar diagram of total annual revenue from quarterly state lease sales held during the years 1970-1989. (Source: N.D. State Land Department).
2
TAX REVENUE (MIlliONS OF DOLLARS)
~
z ~ w 0:;
1970
I ··_..· _·--··1
.. ~ ....-.~ ...:::_.:.: - . ]
1~ _ _............... FIRST.EXTR.ACTION.. _ -._.. TAX REVENUE
t2& _ .._ _ _.._._ __ _ _ __ .
YEAR
BE PRODUCTION TAX c=J EXTRACTION TAX
Figure 2. Bar diagram of total tax revenue generated annually from the state production and extraction taxes for the period 1970-1989. Extraction tax went into effect on January 1,1981. (Source: N.D. State Tax Commission).
3
TOTAL WELLS PER YEAR 900
800
700
600 ~ ~ 500
400~ 0 ~ 300
200
100
0 1950 1955
834
454
274 285 255
190 188
90
1960 1965 1970 1975 1980 1985 1990 YEAR
Figure 3. Graph of total number of oil wells drilled annually in North Dakota since 1951. (Sou rce: N. D. Oil and Gas Division).
4
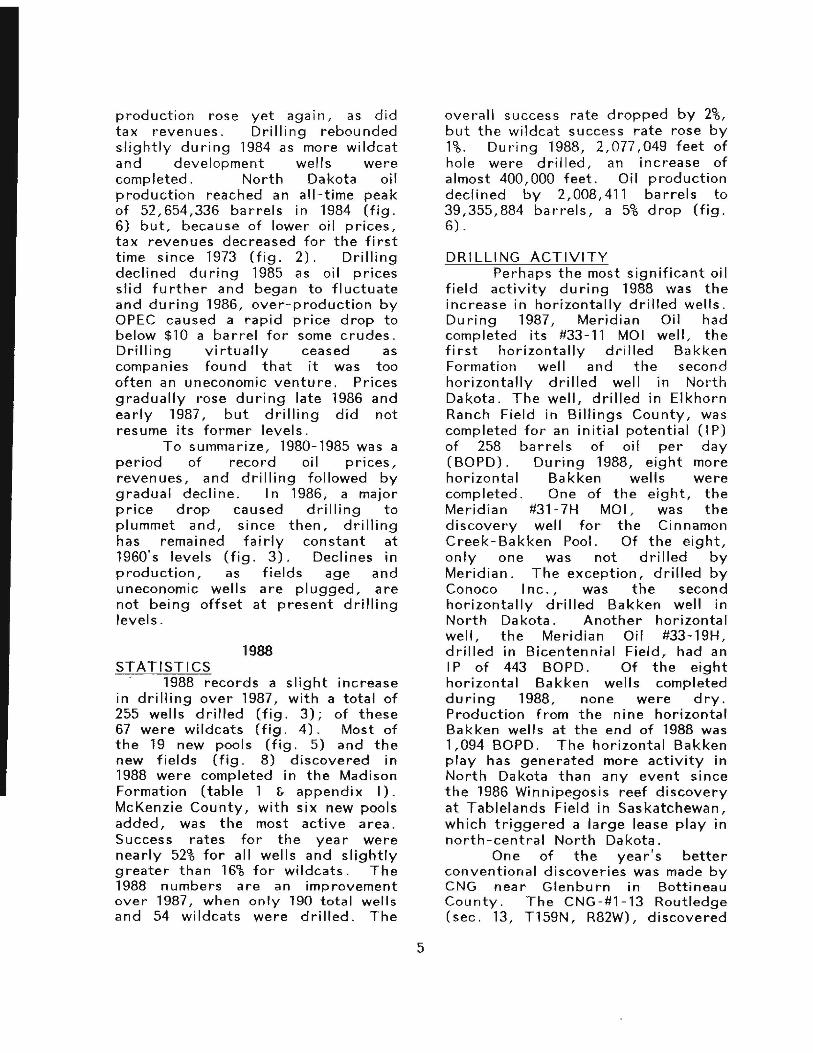
production rose yet again, as did tax revenues. Drilling rebounded slightly during 1984 as more wildcat and development wells were completed. North Dakota oil production reached an all-time peak of 52,654,336 barrels in 1984 (fig. 6) but, because of lower oil prices, tax revenues decreased for the first time since 1973 (fig. 2). Drilling declined during 1985 as oil prices slid further and began to fluctuate and during 1986, over-production by OPEC caused a rapid price drop to below $10 a barrel for some crudes. Drilling virtually ceased as companies found that it was too often an uneconomic venture. Prices gradually rose during late 1986 and early 1987, but drilling did not resume its former levels.
To summarize, 1980-1985 was a period of record oil prices, revenues, and drilling followed by gradual decline. In 1986, a major price drop caused drilling to plummet and, since then, drilling has remained fairly constant at 1960's levels (fig. 3). Declines in production, as fields age and uneconomic wells are plugged, are not being offset at present drilling levels.
1988 STATISTICS
1988 records a slight increase in drilling over 1987, with a total of 255 wells drilled (fig. 3); of these 67 were wildcats (fig. 4). Most of the 19 new pools (fig. 5) and the new fields (fig. 8) discovered in 1988 were completed in the Madison Formation (table 1 &. appendix I). McKenzie County, with six new pools added, was the most active area. Success rates for the year were nearly 52% for all wells and slightly greater than 16% for wildcats. The 1988 numbers are an improvement over 1987, when only 190 total wells and 54 wildcats were drilled. The
overall success rate dropped by 2%, but the wildcat success rate rose by 1%. During 1988, 2,077,049 feet of hole were drilled, an increase of almost 400,000 feet. Oil production declined by 2,008,411 barrels to 39,355,884 barrels, a 5% drop (fig. 6).
DRILLING ACTIVITY Perhaps the most significant oil
field activity during 1988 was the increase in horizontally drilled wells. During 1987, Meridian Oil had completed its #33-11 Mal well, the first horizontally drilled Bakken Formation well and the second horizontally drilled well in North Dakota. The well, drilled in Elkhorn Ranch Field in Billings County, was completed for an initial potential (lP) of 258 barrels of oil per day (BOPD). During 1988, eight more horizontal Bakken wells were completed. One of the eight, the Meridian #31-7H Mal, was the discovery well for the Cinnamon Creek-Bakken Pool. Of the eight, only one was not drilled by Meridian. The exception, drilled by Conoco Inc. , was the second horizontally drilled Bakken well in North Dakota. Another horizontal well, the Meridian Oil #33-19H, drilled in Bicentennial Field, had an IP of 443 BOPD. Of the eight horizontal Bakken wells completed during 1988, none were dry. Production from the nine horizontal Bakken wells at the end of 1988 was 1,094 BOPD. The horizontal Bakken play has generated more activity in North Dakota than any event since the 1986 Winnipegosis reef discovery at Tablelands Field in Saskatchewan, which triggered a large lease play in north-central North Dakota.
One of the year's better conventional discoveries was made by CNG near Glenburn in Bottineau County. The eNG -#1-13 Routledge (sec. 13, T159N, R82W), discovered
5
WILDCATS PER YEAR 300-r-----------------------
200+---------------------+-----4--------1
267
250-t-------------------!+---------j
rIJ
E ~ 150
50+---+--------~---++--¥---------~
100+----++---+---+----
O~......__.~......__.~......____r__.,..............,.___._ .................,................__r_............__r_...............,.....................,.....................,................_.__...__r_.__.--..--..........__.__
1950 1955 1960 1965 1970 1975 1980 1985 1990 YEAR
Figure 4. Graph of total number of exploratory wells drilled annually in North Dakota since 1951.
6
35
NEW POOL DISCOVERIES 120-.----------------------------,
102
100-+----------------------Ir----------l
~
.~ 80+------------+---+--------1
~ o ~ 60-+-------------------+----+----------1
Q ~ 40+--------------1-----+------\
~
O........,-,-.,--,.---,--,.-,-.---r--.----r-.--.....-r-T--,---,r-r--.--r----r--"f--,--,....-,-,--,--,r-r--r--r--.----r---.--.....-.---r'
1950 1955 1960 1965 1970 1975 1980 1985 1990
YEAR
Figure 5. Graph of number of oil pools discovered annually since 1951.
7
13
ANNUAL PRODUCTION 60...--------------------------,
52.654
1990
27.126
1O~---+-----------------------l
4O-t-------------------I---------.:~----I
~ '""'
~I~+----=
2O+-------+------------::=--..~----------l
Figure 6. Graph of annual oil production since 1951.
8
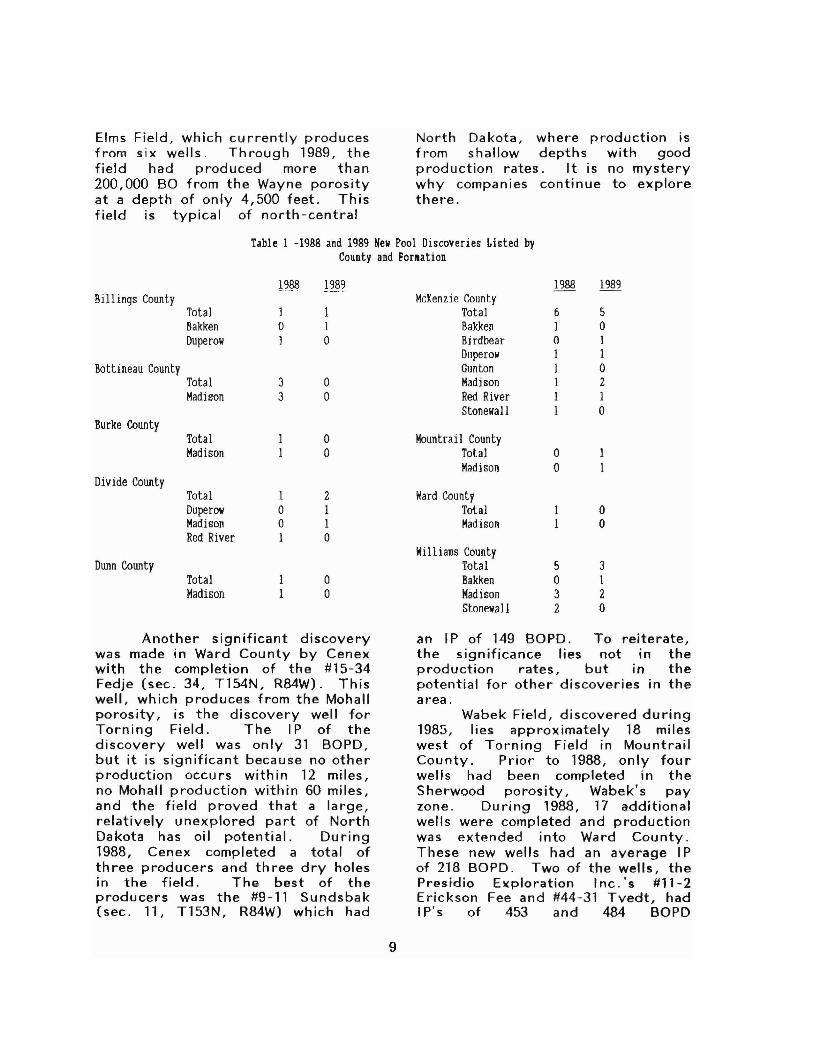
Elms Field, which currently produces from six wells. Through 1989, the field had produced more than 200,000 80 from the Wayne porosity at a depth of only 4,500 feet. This field is typical of north-central
North Dakota, where production is from shallow depths with good production rates. It is no mystery why companies continue to explore there.
Table 1 -1988 and 1989 New Pool Discoveries Listed by County and For.ation
1988 1989 Billings County
Total ] 1 Bakken o 1 Dupe rOil J 0
Bottineau County Total 3 0 Madison 3 0
Burke County Total o Madison o
Divide County Total 1 2 Duperow o ] Madison o 1 Red River J 0
Dunn County Total o Madison o
Another significant discovery was made in Ward County by Cenex with the completion of the #15-34 Fedje (sec. 34, T154N, R84W). This well, which produces from the Mohall porosity, is the discovery well for Torning Field. The IP of the discovery well was only 31 BOPD, but it is significant because no other production occurs within 12 miles, no Mohall production within 60 miles, and the field proved that a large, relatively unexplored part of North Dakota has oil potential. During 1988, Cenex completed a total of th ree producers and th ree dry holes in the field. The best of the producers was the #9-11 Sundsbak (sec. 11, T153N, R84W) which had
McKenzie County Tota] Bakken Birdbear Duperow Gunton Madison Red River Stonewall
Mountrail County Total Madison
Ward County Total Madison
Williams County Total Bakken Madison Stonewall
1988 1989
6 5 1 0 0 I ] 1 1 0 J 2 I 1 J 0
0 0
0 0
5 3 0 1 3 2 2 0
an IP of 149 BOPD. To reiterate, the significance lies not in the production rates, but in the potential for other discoveries in the area.
Wabek Field, discovered during 1985, lies approximately 18 miles west of Torning Field in Mountrail County. Prior to 1988, only four wells had been completed in the Sherwood porosity, Wabek's pay zone. During 1988, 17 additional wells were completed and production was extended into Ward County. These new wells had an average IP of 218 BOPD. Two of the wells, the Presidio El(ploration Inc.·s #11-2 Erickson Fee and #44-31 Tvedt, had Ip' s of 453 and 484 BOPD
9
respectively. During 1988, while in the midst of development, Wabek produced 785,092 barrels of oil. Th is field promises to be one of the largest Sherwood fields in the state. It has spurred considerable interest in the area.
Another 1985 discovery that saw considerable development activity during 1988 is Smith Field in Renville Cou nty. A total of nine wells were drilled in the field during 1988 and, of them, seven were productive. This field, like Wabek, produces from the Sherwood, but has Bluet! pay too. The I P of the seven wells averaged 240 BOPD and two of the wells flowed nearly 400 BOPD.
Several interesting finds were made in western North Dakota during 1988. Sun Exploration discovered the Hay Creek Red River pool in sec. 9, T150N, Rl04W, McKenzie County with the completion of their #1 Langwald well. The well flowed 817 BO, 805 MCFG, and 38 BWPD. Through 1989 it had produced 173,172 BO.
Texaco, Inc. discovered Stockyard Creek Field, a Madison producer, in Williams County with their completion of the #18-1 Otto Boss in sec. 18, T154N, R99W. The well flowed 272 BO, 221 MCFG, and o BWPD and it has made more than 71,000 BO through 1989. Texaco successfully extended the field during late 1988, but this well, the State of North Dakota "K" #1, has not equaled the discovery well.
Meridian Oil discovered the Duperow pool in Pierre Creek Field in T147N, Rl02W, McKenzie County. Since the discovery, three additional wells have been completed and nearly 350,000 BO produced. This field is an excellent example of the multi-pay potential in western North Dakota.
Infill/development programs accounted for much of the 1988
drilling. Active programs in northcentral North Dakota included those at Cimbel and Haram Field~ in Bottineau County. Tyler/Madison reservoirs were the target near Davis Creek and Dance Creek Fields as well as in several of the nearby older fields in Stark County. The Billings Nose saw considerable activity as the Bakken Formation shale was targeted with both vertical and horizontal wells.
1989 STATISTICS
Total drilling decreased 67 wells from its 1988 level (fig. 3) to 188 wells, 35 of which were wildcats (fig. 4). The seven wildcats that were completed represented a 20% wildcat success rate and the overall success rate exceeded 57%, improvements of 4% and 5% respectively over 1988 rates. New-pool discoveries, however, fell to 13 (fig. 5 and appendi x II) and new fields to two (fig. 9). Th is can be partially attributed to the fact that drilling levels were lower. Once again, more discoveries were made in McKenzie County than anywhere else (table 1) and the Madison was again the most commonly completed formation. During the year, 1,557,827 feet of hole were drilled, a drop of 519,222 feet or 25%. Oil production fell to 36,737,516 barrels, a decrease of 2,618,368 barrels (6.7%) (fig. 6). Figure 10 approximately locates all the fields producing at the end of 1989.
DRI LLI NG ACTIVITY During 1989, 29 horizontal
wells were completed, almost a fourfold increase over 1988. Of these, only one was classified as a wildcat well, Meridian Oil's #43-7H, the discovery well for Four Eyes-Bakken Pool. Development drilling accounts for the remaining 28 wells and at least one well was drilled in each of
10
TAX REVENUE SOURCES
100
o-lC==== 1990
~ OIL & GAS TAX [:::: .d:! SALES TAX BINCOMETAX ~ FUELS USE TAX Imm COAL TAX D OTIIER TAXES
L- ......:::::============================================:::::.-._____ .j Figure 7. Bar diagram of state tax revenue sources.
11
1980 1985 YEAR
SASKArCH~WAN
SOUTH
NRV
l TORNING
~
.\
DAKOTA
GRANT
,
• •
•
•
HETTINGER
ADAMS
- ---'------
BIWNGS SLOP€ ..
~--------=--..
•..--I-.L- ....JSTARI<
•
_--,L,,-_O-, DUNN
DIVIDE • -18uRKE ]-- - - - ~.-~:
,'..,
•
• ~ It, ·. -'" , .
WILLIAMS
IlQWMAN
.J .- . .. • WI!' ~ I
\ ~;~ '"";\.
. L1TTL BuM:
Figure 8. Map of western North Dakota with 1988 new field discoveries shown.
12
SASKATCHEWAN
~HENR,(
••
..
•
. A'•..'..
I '
-.\
DAXOTA
WARD ••
CULVE •.
.. PLAZA
...
sount
, ADAhlS
--~---
;- ---. -lSURKE ~--. - - "'. ;:
" • . •• • RENVIL:..£ I ,. ('; , '\.... " . ,--I'.• •
DIVIDE
.' .,
, WILLIAMS
BOWMAN
C(
t2
~~ •, •
• • •
.. ....... STARK
MORTON
Fig'J re 9. Map of western North Dakota with 1989 new field discoveries shown.
13
SASKATCHEWAN ,DIVIDE • -lBURKEJ1-- .,.- •• --~ ,'. ,- • ~ •
~ \ • ~Z'
WARD
MCHENRY•
..,
MORTON
GRANT
STARK
•
;:
REN\lH..:..£"
BIlLINGS
.\. 1~1 • . -"• ,
•
__
, SLOPE •
•
SOUTH DAKOTA
.•
HETTINGER, •
•IlOWIlIAN ADll.MS
- _.1..
Figure 10. Map of western North Dakota with the approximate extent of all known oil fields at the end of 1989.
14
Elkhorn Ranch, Bicentennial, Roosevelt, Rough Rider, Pierre Creek, Poker Jim, Demores, Buckhorn, and Morgan Draw Fields. Temple Field's Bakken Pool was also discovered in 1989 by Dekalb Energy at their #22-24 McCoy in sec. 24, T159N, R96W, Williams County. The Bakken play had considerable impact on drilling in North Dakota. More than 15% of the wells drilled in 1989 were horizontal Bakken wells. Dai Iy production from horizontal Bakken wells at the end of 1989 had risen to 5, 132 BOPD I a five-fold increase over 1988.
Several significant discoveries were made during the year. The first, and most important discovery, was at Plaza Field in Mountrail County. Bluell pay was found downdip of the Sherwood "shoal" producing in Wabek Field. Eight wells were completed during the year with an average I P of 309 BOPD. In Wabek itself, seven more wells were drilled, with four completed producers. Th rough 1989, Wabek Field had produced nearly two million ba rrels and Plaza Field, with less than one year onstream, made more than 240,000 barrels and is sti II bei ng actively developed.
A second find was the Antelope-Red River pool discovered by Amerada Hess at their #30-23 McKeen in McKenzie County. The well, located in sec. 30, T153N, R94W, had an IP of 113 BO, 1452 MCF, and 28 BWPD and has produced more than 17,000 BO and nearly 175,000 MCF to date. This well was a pa rt of la rger individual efforts by Amerada Hess and Oryx Exploration to eval uate the potential of the Cambro-Ordovician section on the Nesson Anticline and in the central part of the Williston Basin. Additional wells were drilled in Beaver Lodge, Tioga, Dimmick Lake, and North Fork Fields by these two companies as a part of the program.
Conoco and Wyoming Resources completed several prolific Red River development wells in Buffalo Wallow Field, while Kerr-McGee completed another Red River development well in Boxcar Butte Field. Thei r #2 Haugen well (sec. 9, T148N, R102W, McKenzie County), was completed for 755 BO, 592 MCF, and 11 BWPD.
Raymond T. Duncan recompleted the #1 Rivers well in Dolphin Field. This well, which had discovered the field's Sou ris River Pool, was recompleted in the Rival fOI' 720 BO and 563 MCFGPD and produced 112,514 BO during 1989. Unfortu nately, the only offset well d ri lied to date was dry.
Comdisco Exploration discovered Todd Field with the completion of their #1-32 Foster in sec. 32, T154N, R101W, Williams County. The well flowed 218 BO, 108 MCF, and 5 BWPD from the Rival I nterval (the Rival I nterval is sometimes referred to as the "Nesson pay", but the North Dakota Geological Su rvey discou rages that usage because the name Nesson was p re-empted by the Jurassic Nesson Formation). An offset well was completed later in the yea r in Todd Field and fu rther development work IS pending.
The Birdbear was the target in North Branch Field as four wells were recompleted or drilled during 1989. IP's ranged between 243 and 490 BOPD and averaged 356 BOPD. More than 86,000 BO were produced in a combined total of 605 days of production for a sustai ned average of 142 BOPD. The Birdbear Formation is a promising target.
Development of the BufordMadison pool cantin ued with th ree new completions in three attempts. Of the seven new wells drilled in Torning Field, only one produced. This 1988 discovery has been an elusive target. Nine development wells were drilled in Sherwood and
15
Mouse River Park Fields. Of these, seven were successfu I, proving that there still is life in some of the older fields.
Finally, at 3:15 P. M. on October 23, 1989, North Dakota's billionth barrel of oil was produced. Appropriately, the oil was taken from an oil well located one mile from the Clarence Iverson #1 well in Beaver Lodge Field, the discovery well for oil in North Dakota. A gathering in Williston celebrated the event.
SUMMARY
During 1988 and 1989, the two years covered in this update, several important events occurred. Activity has remai ned low, at the 1960's level, reflecting unstable oil prices and uncertain economics, but a bright spot has been the steady increase in drilling in the horizontal Bakken play. Development drilling in several fields, notably in Plaza
and Wabek Fields, was tremendously successful. Recompletions in several older wells found new zones and one wildcat opened a large part of North Da kota to exploration when oil was discovered ina "nonproductive" a rea. Several companies began programs to eval uate the deep potential of western North Dakota; this should lead to the discovery of some significant new fields. A number of the last two year's discoveries were one-well finds. Even with rising Ba kken production and the discovery of Wabek, Plaza, and all the other new pools, North Dakota's annual production continued to decline during 1988 and 1989. The 1989 rate of decl ine increased by nearly 2% over 1988's. Given the fact that a large percentage of North Dakota's revenue comes from oil taxes, lease sales, and state and federal royalties, some method of increasing production in the state must be found to offset the decline.
16
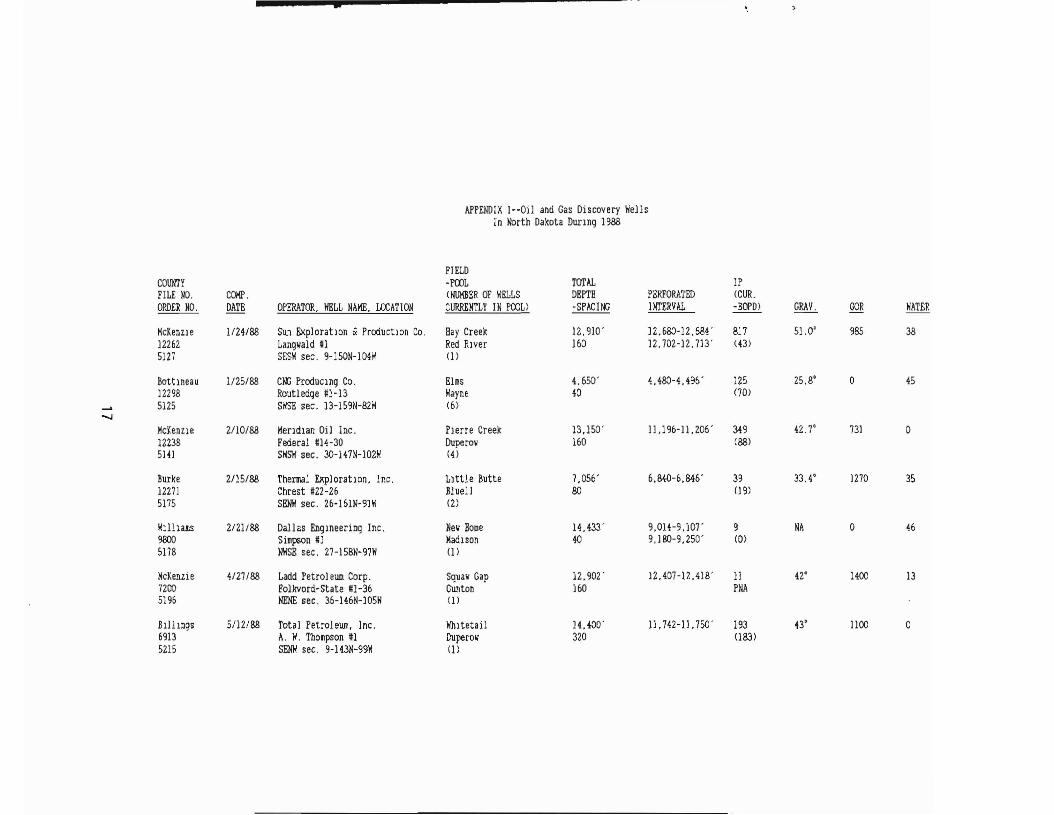
APPENDIX I--Oil and Gas Oiscovery Wells In North Dakota DurIng 1988
COUNTY FILE NO. ORDER NO.
COHI'. DATE OPERATOR, \/ELL NAME, LOCATION
FIELD -POOL (HUMBER OF WELLS CURRENTLY IN POOL)
TOTAL DEPTH -SPACING
PERFORATED INTERVAL
IP (CUR. -BOPD) GRAV. GOR HATER
McKenZie 12262 5127
1/24188 Sun &><ploratlDn IX Production Co. Langwa1d #1 SESH sec. 9-150N-104W
Bay Creek Red River (])
12,910' 160
12.680-12 ,584 . 12,702-12,713'
817 (43)
51.0' 985 38
-..,j
Bottineau 12298 5125
Mdenzle 12238 5141
1/25/88
2/10/88
CIl) Prexluc Ing Co. Routledge #]-13 SWSE sec. 13-J59N-82W
MerIdian Oil Inc. Federal 114-30 SWSW sec. 3O-H7N-l02\/
ElliS \layne (6)
PIerre Creek Dupero~' (4)
4.650' 40
13.150' 160
4,480-4.496 '
II ,196-11 ,206 '
125 (0)
349 (88)
25,8'
42.7'
0
131
45
0
Burke 1227] 5175
2/15/88 Thermal ElIploratlOn, Inc. Chrest #22-26 SIlNW sec. 26-161N-91W
Ll ttl e Butte Blue11 (2)
7.056' 80
6,840-6.846' 39 () 9)
33.4' 1270 35
WIlluns 9800 5178
2/21/88 Dallas EngIneering Inc, Sill~n #1 N'rISB sec. 27 -15BN- 9111'
New Home MadISon (I)
14,433' 40
9.01H,107' 9.180-9,250'
'3 (0)
NA 0 46
McKenzie 7200 5196
4127/88 Ladd Petrol eum Corp. Folkvord-State 11-36 HEME sec. 36-146N-105\/
Squaw Gap Gunton (l)
12.902' 160
12.401-12.418' 11 PNA
42' 1400 13
Billings 6913 5215
5/12/88 Total Petrol eum. Inc. A. II. TboDlpson !l1 SENlI' sec. 9-H3N-99W
1I')lltetail Duperow ()
14,400' 320
)1.742-11.750' 193 (183)
43' 1100 0
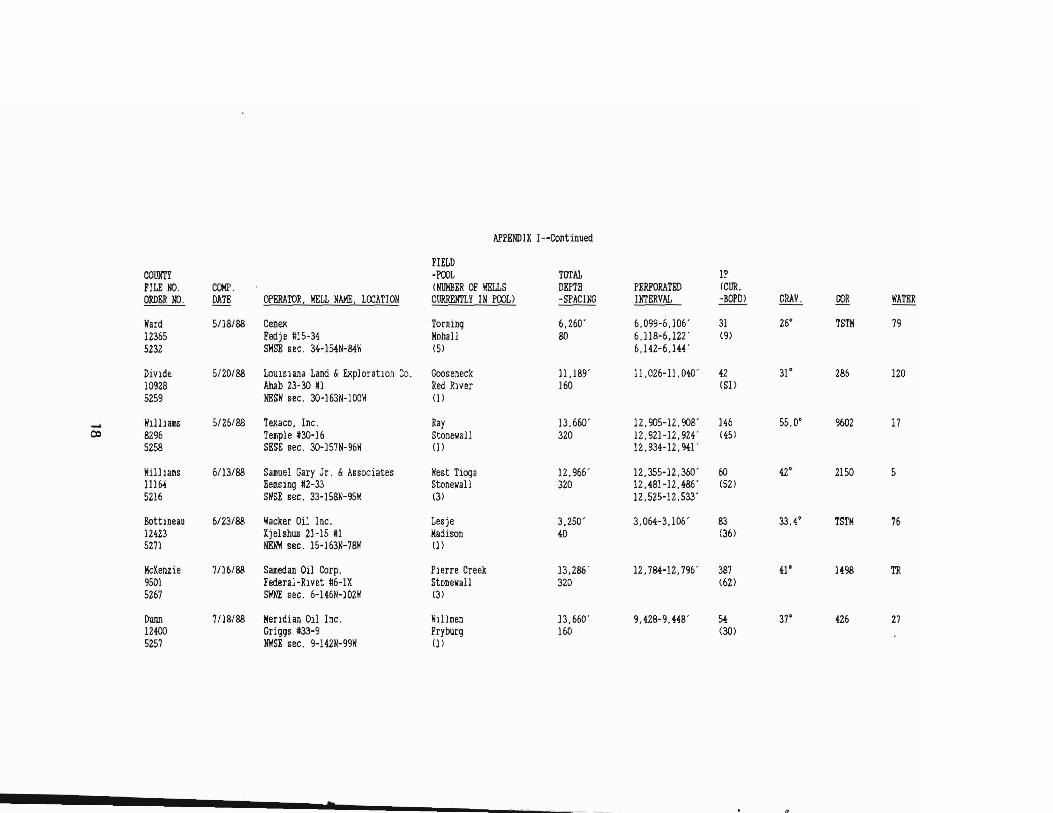
APPENDIX I--Continued
COUNTY FILE NO. ORDER NO.
COMP. DATE OPERATOR, WELL NAME. LOCATION
FIELD -POOL (NlOOlER OF WELLS CURREN'l'L YIN POOL)
TurAL DEPTH -SPACING
PERFORATED INTERVAL
IP (CUR. -BOPD) GRAV. OOR WATER
liard 12365 5232
5/18/88 Cenex Pedje #15-34 SWSE sec. 34-154N-84W
Torning Mohall (5)
6,260' BO
6.099-6,106 ' 6.llS-6.122 ' 6.142-6.144 .
31 (9)
26· TSTM 19
Divlde 10928 5259
5/20/88 LoUISIana Land &. ExploratIon Co. Ahab 23-30 U NESW sec. 30-163N-l DOW
Gooseneck Red Rmf (])
11.189' 160
11.026-11.040' 42 (Sl)
31· 286 120
-CO IhJllallS 8296 5258
5/26/88 Texaco. Inc. Tellple #30-16 SESE sec, 30-157 N- 96W
Ray StoneliaJ] (J)
13,660' 320
12.905-12.908' 12.921-12.914' 12.934-12.941'
146 (45)
55.0· 9602 17
Will lams 111604 5216
6113/88 Salluel Gary Jr. &. Associates Helllsing #2-33 SIiSE sec. 33-158N-95W
West Tioga Stonewall (3)
12.966' 320
12.355-12,360' 12,481-12.4.% ' 12.525-12.533'
60 (52)
42' 2150 5
BottIneau 12423 5271
6/23/88 Wacker Oil Inc. l:.jelshus 21-IS n NENri sec. lS-163N-78W
Lesje Madison 0)
3,250' 40
3.064-3.106' a3 (36)
33.4' TSTM 76
McKenzie 9501 5267
7/16/88 SaJledan Oil Corp. Federal-Rlvet 1t6-1X SWNE sec. 6-H6N-102h'
Pl erre Creek Stonewall (3)
13.2.%' 320
12.784-12,796' 381 (62)
U· 1498 TR
Dunn 12400 5251
7118/88 Mendian Oil Inc. Griggs #33-9 NIISE sec. 9-142N-99W
Hllllllen Fryburg 0)
13.660' 160
9,428-9.448' 54 (30)
37' m 27
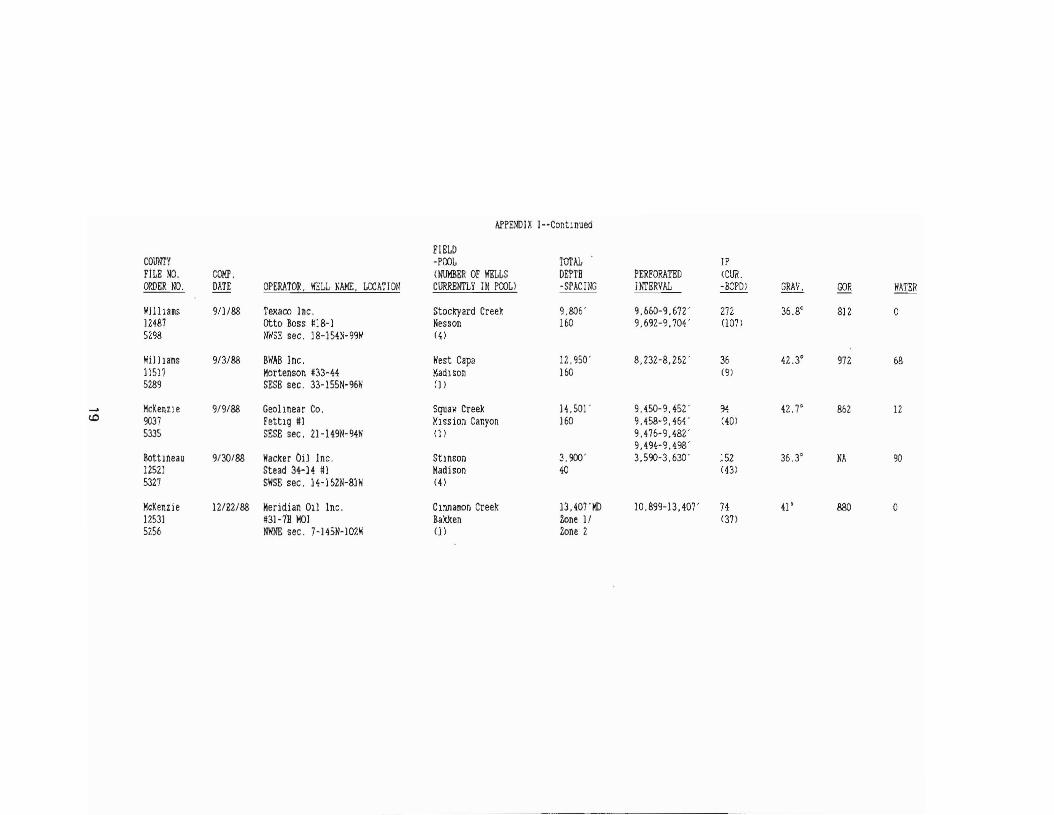
hPPENDIX I--Contwued
COUNTY FILE NO. ORDER NO.
COMP • DATE OPERATOR. lIELL NAME. LOCATION
FIELD -POOL (NUMBER OF WELLS CURROOLY IN POOL)
TOTAL DEPTH -SPACING
PERFORATED INTERVAL
IP (CUR. -BOPDI GRAV. GOR WATER
W11l1ams 12481 5298
9/1/88 Texaco Inc. otto Boss ~18-1
NWSE sec. 18-154N- 9%'
Stockyard Creek Nesson W
9.806' 160
9.660-9.672' 9,692-9.704'
272 (l07 I
36.8· 812 0
Will Jams 11517 5289
9/3/88 IlWAIl Inc. Mortenson ~33-44
SESE sec. 33-155N-96~
West Capa Madl son (])
12.950' 1&0
8,232-8.262 . 36 (9)
42.3· 972 68
~
(.Cl McKenne 9037 5335
BottIneau 12521 5327
9/9/88
9/30/88
Geollnear Co. FettIg ~I
SESE sec, 21-149N-94~
Wacker Oil Inc. Stead 34-H ~ I SWSE sec, IH52N-81W
Squaw Creel< Mlsslon Canyon (])
StInson Madison (4)
14,501' 160
3,900' 40
9. ~50-9, 452' 9, -458- 9,46~ , 9, -476-9.482' 9,494-9,498' 3.590-3,630'
'l4 (40)
152 (43)
42,7°
36,3°
862
NA
12
90
McKenzi e 12531 5z55
12/22/88 Meridian OIl Inc, #31 -78 MOl lOOlE sec. 7-145N- J02W
Clnnamon Creek Bakken ()}
13,407'M!) Zone I I Zone 2
10, A99-13. 407' 74 (37)
41 ' B80 0
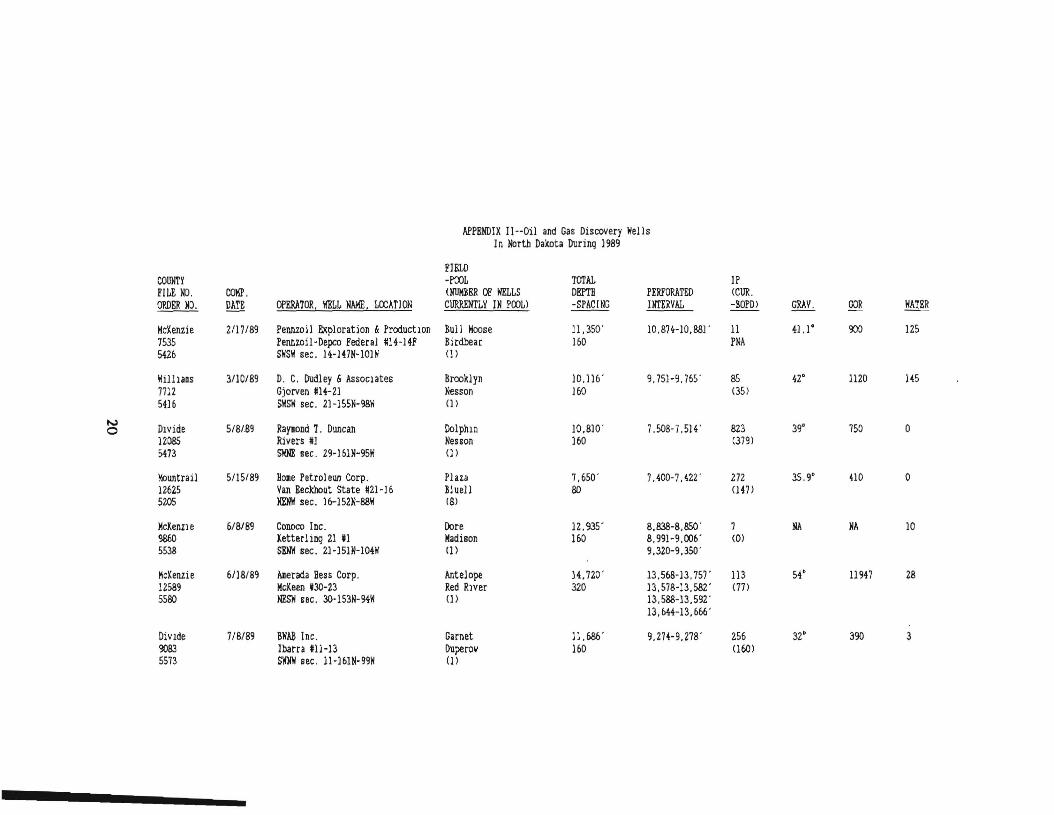
APPBNDIX II--Oil and Gas Discovery Wells In North Dalrota During 1989
COIDll'~
FILE NO. ORDKR NO.
COKP, DATE OPERATOR. WELL NAME, LOCATION
~IELD
-POOL (NlJlmER OF WELLS CURRENTLY IN POOL)
TO'I'AL DEPTB -SPACING
PERFORATED INTERVAL
IP (CUR, -BOPD) GRAY. GOR WATER
McKenzie 7535 5426
Zfl7/89 Pennzoil Exploration & ProductlOn Pennzoil-Depco Federal llB-l4P SliSW sec, 14-147N-101 Ii
Bull Moose Birdbear 0)
11,350' 160
10,874-10,881 ' 11 PNA
41.1" 900 125
WHllallS 7712 5416
3/10/89 D. C. Dudley & Assoclates Gjorven #14-21 SHSH sec. 2H55N-98H
Brooklyn Nesson (J)
10.116' 160
9.751-9,765' as (35)
42" 1120 145
I'.,,)
0 Dlvide 12085 5473
5/8/89 RayllOnd T. Duncan Rivers #1 SWNE sec. 29-161N-95H
Dolphln Nesson 0)
10.810' 160
7.508-7.514' 823 (379)
39" 750 0
Mountrail 12625 5205
5/15/89 BODIe Petrol eum Corp. Van Eeckhout State m -16 lIENW sec. 16-l52N-88W
Plaza Sluell (8)
7,650' 80
7.400-7,422 ' 272 om
35.9· 410 0
McKenzle 9860 5538
6/8/BlJ Conoco Inc, Ketterling 21 #1 SBNW sec. 21-15111-104W
Dore Madison Cll
12.935' 160
8.838-8, S50' 8.991-9.006' 9.320-9.350'
7 (0)
lIA NA 10
McKenzie 12589 5580
6/18/89 Alietada Bes sCarp. McKeen #30-23 NESW sec. 3O'153N-94H
Antelope Red RlVer (1 )
14.720' 320
13,568-13,757' )3,578-13,582' 13,588-13,592 ' 13,644-13,666'
113 (17)
54· 11947 28
DiVIde 9083 5573
7/8/89 SWAB Inc. Ibarra 111-13 S\IlIli sec. IH61N-m
Garnet Duperow (j)
11.686' 160
9.27H.278' 256 (60)
32· 390 3
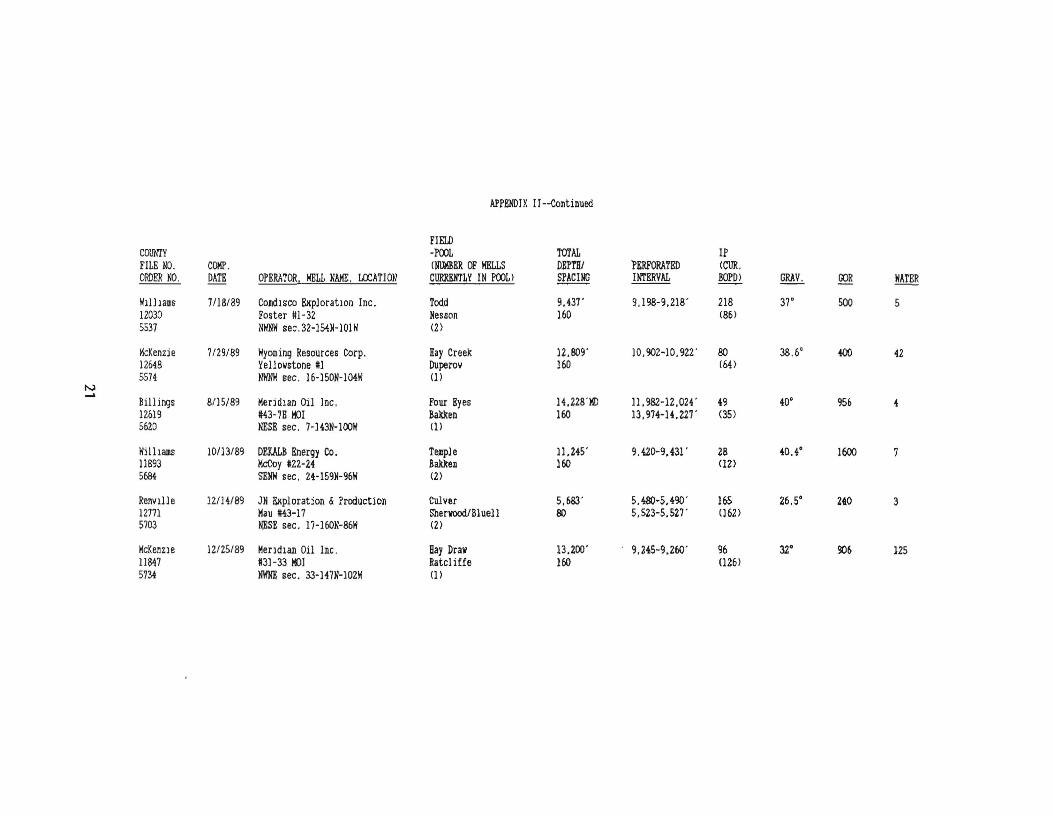
APPENDIX Il--Continued
COUNTY FILE NO. ORDER NO.
COIIP. DATE OPERATOR. WELL NAME. LOCATION
FJELD -POOL (NlOOIKR OF HELLS CIlRRKN'M INPOOL)
TOTAL DBPTBI illillQ
PERFORATED INTERVAL
IP (CUR,
BOPD) GRAV, OOR HATER
Wllllams 12030 5537
7118/89 Comdlsco ExploratIOn Inc. Foster 111- 32 NWlfH sec. 32-15411-101 W
Todd Nesson (2)
9.437" 160
9,198-9.218' 218 (86)
37· SOO 5
I-..,) ~
IolcKenzie 12648 5574
Bill ings 12619 5620
7/29/89
8115/89
lIyom ing Resources Corp, Yell oilstone 111 IIWNII sec. 16-15011-1041'1
Meridlan Oil Inc. #43-78 1«)1 NESE sec, 7-143N-1OOW
Ray Creek Dupero\l (])
Four Ryes BalUten (1)
12.809' 160
1U28'lID 160
10,902-10.922'
n. 982-12.024' 13, 974-1U27 ,
80 (64)
49 (35)
38.6·
40·
400
95&
42
4
Williams 1J893 56B4
10113/89 DElliB Energy Co. McCoy m-24 SENW sec. U-159N-96W
Tellple Bakken (2)
11.245" 160
9A20-9.431· 28 (m
40.4· 1600
RenvIlle 12771 5703
121H/89 IN Exploration &Production Hau 1l43-17 NllSE sec. 11-16011-8611
Culver ShervoodlBlue11 (2)
5.683' SO
5.4.80-5.490" 5.523-5.527'
165 (62)
26.5" 2tO 3
IolcKenzle 11847 5734
12125/89 Mendlan Oil Inc. 113] -33 1«)] lOOIE sec. 33-H711-102W
Hay Draw Ratcliffe (])
13.400' 160
9.245-9.260' 96 (26)
32.. 906 125
REFERENCES
Fischer, D. W' j and Bluemle, J. P., Folsom, C. B. Jr.; 1980, A History 1988, Oil Exploration and of the North Dakota Geological Development in the North Dakota Survey; N.D.G.S. Miscellaneous Williston Basin: 1986-1987 update: Series No. 58, 51 p. North Dakota Geological Survey Miscellaneous Series 72, 36 p.
22