Embed Size (px)
Citation preview
Reporting2015
THE GLOBAL OIL AND GASINDUSTRY ASSOCIATIONFOR ENVIRONMENTALAND SOCIAL ISSUES
www.ipieca.org
Oil and gas industry guidance onvoluntary sustainability reportingA
LEGAL NOTE
This voluntary guidance document is designed to serve as a resource for interested companies; the indicatorsand information referenced in this work do not establish an industry standard as to the nature of a company’spublic reporting practice. The recommendations in this Guidance on how to report on a particular issue areaddressed to those companies who choose to include that issue in their voluntary sustainability reporting, andterms such as ’the reporting company should …’ are to be understood in this sense.
The terms and definitions used in this document are not necessarily the same as terms and definitions used invarious statutes, rules, codes or other authoritative legal documents. Users and readers of this document shouldrefer to relevant legal sources or consult their own legal counsel for explanations as to how the terms anddefinitions used in this document may differ from the legal terms and definitions (e.g. spills and hazardouswastes) used in their particular areas of operation. Anything in this document regarding voluntary reporting ofindicators is not intended to imply that any of the indicators are required to be reported under any national, localor other law. Furthermore, it is not intended to serve as a substitute for existing public reporting requirementsand regulations. Any company reporter that has a question as to whether or not reports that follow theinformation contained herein will meet any specific reporting requirements applicable to their particularoperations should consult with the reporter’s own legal counsel.
A CAUTIONARY NOTE REGARDING PERFORMANCE INDICATORS
Aggregated, company-level, non-financial performance data, developed using the indicators in this Guidance,can be informative for comparing relative performance among different companies, such as benchmarkingsafety incident statistics across the oil and gas industry. A company can use such comparisons to evaluate itsown performance relative to peers, and identify areas for potential improvement. However, limitations tocomparability exist due to various factors including the different methods companies may use to measure,normalize and report specific indicators. Although efforts have been made throughout the Guidance to improvecomparability, report users are advised to exercise caution when using data from sustainability reports tocompare performance. For example, comparing two companies that report greenhouse gas emissions on adifferent basis (e.g. equity share vs. operated, as described in Appendix A) could be misleading regarding actualperformance. Specific indicators from similar operations can sometimes be usefully compared to helpperformance management. However, the company-level, aggregate data typically reported in sustainabilityreports may not provide adequate comparability for some metrics. Where this Guidance mentions comparability,it is not intended to imply that data in sustainability reports, and therefore companies’ performance, are alwaysdirectly comparable.
Separate from company sustainability reporting, industry associations and others may choose to implementspecific performance benchmarking studies, which may build upon the indicators in this Guidance.
It is also recognized that it may take a number of years for companies to begin to report new or revisedindicators and/or reporting elements. This is particularly important for social and economic indicators that arestill evolving within company sustainability reports.
IOGP Report 437
© IPIECA/API/IOGP 2015 All rights reserved.
No part of this publication may be reproduced, stored in a retrieval system, or transmitted in any form or by any means, electronic,mechanical, photocopying, recording or otherwise, without the prior consent of IPIECA, API and IOGP.
Oil and gas industryguidance on voluntarysustainability reporting
5th Floor, 209–215 Blackfriars Road, London SE1 8NL, United Kingdom
Telephone: +44 (0)20 3763 9700
E-mail: [email protected] Internet: www.iogp.org
International Association of Oil & Gas Producers
5th Floor, 209–215 Blackfriars Road, London SE1 8NL, United Kingdom
Telephone: +44 (0)20 7633 2388
E-mail: [email protected] Internet: www.ipieca.org
The global oil and gas industry association for environmental and social issues
The American Petroleum Institute
1220 L Street NW, Washington DC, 20005-4070, USA
Telephone: +1 202 682 8000
Internet: www.api.org
3rd Edition, 2015
IPIECA • API • IOGP
ii
OIL AND GAS INDUSTRY GUIDANCE ON VOLUNTARY SUSTAINABILITY REPORTING
Section 4 39Environmental issues and indicators
Environmental issues and indicators: an overview 40
l Climate change and energy 41
E1: Greenhouse gas (GHG) emissions 42
E2: Energy use 46
E3: Alternative energy sources 49
E4: Flared gas 51
l Biodiversity and ecosystem services 53
E5: Biodiversity and ecosystem services 54
l Water 57
E6: Fresh water 59
E7: Discharges to water 63
l Local environmental impact 65
E8: Other air emissions 66
E9: Spills to the environment 68
E10: Waste 71
E11: Decommissioning 74
Section 5 77Health and safety issues and indicators
Health and safety issues and indicators: 78an overview
l Workforce protection 79
HS1: Workforce participation 80
HS2: Workforce health 82
HS3: Occupational injury and illness incidents 84
l Product health, safety and 87environmental risks
HS4: Product stewardship 88
l Process safety and asset integrity 90
HS5: Process safety 91
Legal and cautionary notes Inside front cover
Improving our transparency: a foreword 2from the oil and gas industry associations
Joint statement of the independent 4Stakeholder Panel
Acknowledgements 6
Section 1 7Setting the context: why report?
Benefits of reporting 8
About the Guidance 9
Using the Guidance 9
Section 2 11The reporting process: how to report
General reporting principles 12
Process overview 12
Engaging stakeholders 13
Step 1: Articulate vision and strategy 15
Step 2: Describe governance and management systems 16
Step 3: Determine and prioritize material 18issues for reporting
Step 4 Select indicators and collect data 21
Step 5 Analyse data and incorporate into narrative 23
Step 6 Provide assurance 27
Section 3 29Issues and indicators: what to report
Value chain 30
Life-cycle considerations 31
Overview of issues and indicators 31
Issue reporting 33
Indicator reporting elements 33
Data management 35
Data normalization 36
Standard issue and indicator format 38
Contents
1
OIL AND GAS INDUSTRY GUIDANCE ON VOLUNTARY SUSTAINABILITY REPORTING
Section 6 95Social and economic issues and indicators
Social and economic issues and indicators: an overview 96
l Community and society 97
SE1: Local community impacts and engagement 98
SE2: Indigenous peoples 100
SE3: Involuntary resettlement 102
SE4: Social investment 104
l Local content 106
SE5: Local content practices 107
SE6: Local hiring practices 109
SE7: Local procurement and 110supplier development
l Human rights 112
SE8: Human rights due diligence 114
SE9: Human rights and suppliers 116
SE10: Security and human rights 117
l Business ethics and transparency 118
SE11: Preventing corruption 120
SE12: Preventing corruption involving 121business partners
SE13: Transparency of payments to 122host governments
SE14: Public advocacy and lobbying 124
l Labour practices 125
SE15: Workforce diversity and inclusion 127
SE16: Workforce engagement 128
SE17: Workforce training and development 129
SE18: Non-retaliation and workforce 130grievance system
Appendix A: Detailed guidance on 131developing a reporting boundary
Appendix B: Practical guidance on 139implementation of a materiality process
Appendix C: Summary of key changes 145since 2010 and mapping against theGRI G4 Guidelines
Appendix D: Measurement units and 157conversion factors (from IOGP)
Appendix E: References and 161source materials
Appendix F: Glossary 167

We are pleased to introduce the third edition of the Oiland Gas Industry Guidance on Voluntary SustainabilityReporting (hereinafter the ‘Guidance’).
IPIECA, the global oil and gas industry association forenvironmental and social issues, the AmericanPetroleum Institute (API) and the InternationalAssociation of Oil & Gas Producers (IOGP) have beenproviding sustainability reporting guidance for theindustry since 2005. This third edition marks over tenyears of sharing, assessing, debating and consensusbuilding for our three associations. The update wasundertaken recognizing that industry sustainabilityreporting is continuously progressing, with issue areasthat mature and develop at different paces. To maintaincontinuity, the revisions are not intended to effectextensive changes to the 2010 Guidance, but to addressfeedback received from subject matter experts, bothwithin and outside the industry, as well asimprovements in reporting practices.
IPIECA, API and IOGP believe that it is essential tocontinue providing this robust industry-developedframework to help companies shape the structure andcontent of their sustainability reporting, particularly fornew reporters. Recent years have been characterizedby an evolution in existing frameworks on voluntarysustainability reporting, the emergence of newvoluntary initiatives and mandatory sustainabilityreporting requirements in some countries. Thesevarying expectations and different definitions of how
and what companies should report have led tochallenges for many oil and gas companies.
The membership of our three associations includescompanies that are leaders in sustainability reporting, aswell as new reporters. This revision brings together theircollective wealth of technical expertise and reflects thereporting challenges that some companies continue toface. The industry’s commitment to this project isevidenced through the substantial participation in theupdate, as noted in the Acknowledgements on page 6.
EXPANDING ENGAGEMENT
The third edition reflects feedback and improvements inreporting practices from many sources within andoutside the industry. As in 2010, we engaged anexternal Stakeholder Panel of leading experts to adviseus on both the process and the content of theGuidance. We retained the same individuals andorganizations from the 2010 Panel where possible, andadded an additional member representing a humanrights perspective. We held a dialogue session in April2014 to provide the Panel with information on uptakeand feedback for the second edition, discuss drivers forthe update, share our future plans and ambitions, andreview improvement opportunities under consideration.We looked closely at materiality, how companies areidentifying and addressing the impacts of their businessand communicating the main sustainability issues theyface, and how this process could be improved.
IPIECA • API • IOGP
Improving our transparencyA foreword from the oil and gas industry associations
2
Brian Sullivan, IPIECAExecutive Director
Jack N. Gerard,API President and CEO
Michael Engell-Jensen,IOGP Executive Director
The Stakeholder Panel engagement for the 2015update resulted in comprehensive outcomes including:
l new guidance on strategic reporting for each of the12 sustainability issues; this is intended to helpcompanies report information on their managementapproach and strategies to address the sustainabilityissue and its related impacts—this extends reportingbeyond key performance indicators and numericalresponses, for example, in relation to climate changemitigation, adaptation and strategy;
l expanded guidance on materiality that aims to helpcompanies identify and prioritize impacts and issues,including a new appendix to provide practical guidanceon implementation of a materiality process; and
l new guidance on reporting across the value chainand life-cycle considerations to help ensure that allrelevant business activities are addressed whenreporting on material sustainability issues.
ENCOURAGING CONTINUOUS IMPROVEMENTTHROUGH THIS UPDATE
The oil and gas sector continues to provide essentialenergy for society’s development. Our membercompanies also recognize that managing sustainabilityimpacts associated with producing energy is an importantresponsibility, including addressing the challengesassociated with climate change risks, human rights andoperating in remote and sensitive areas of the world.
The Guidance continues to cover a range ofsustainability issues relevant to the oil and gas industry,based on industry consensus. It allows companies toselect from related indicators that offer a choice on thedepth and detail to be communicated. By providing
flexibility and consistency, the Guidance aims to serveboth new and experienced reporters while avoiding thepitfalls of formulaic reporting.
The Guidance remains voluntary and does not setminimum requirements or predetermine stakeholderrequests. Instead, we encourage a consistent ‘how-to’approach, with companies determining what to reportbased on a materiality process and stakeholderexpectations.
Key changes within the 2015 update include:
l a new issue area on water, with comprehensiveupdates to two water indicators;
l a new indicator covering planning and execution ofdecommissioning activities;
l alignment of the Social and economic section withthe United Nations Guiding Principles on Businessand Human Rights;
l upgrade of a range of reporting elements across thethree categories within each indicator, ‘common’,‘supplemental’ and ‘other’ reflecting improvedmaturity and consistency of reporting by companies;and
l additional or improved reporting elements for nine ofthe existing indicators.
For a more detailed list of changes see Appendix C.
LOOKING AHEAD
Our industry will continue to address multiplesustainability challenges as it seeks to provide theenergy essential for societal development. Throughoutthis journey, communication and engagement withstakeholders will be essential. It is our hope that theGuidance will continue to support the momentum wesee within our industry to publish sustainabilityinformation. Our aim is that the Guidance, as theprimary industry reporting framework, supportscompanies across the global oil and gas industry toimprove the quality and consistency of theirsustainability reporting.
IPIECA, API and IOGP will continue to encourage ourmembers and others in the industry to report on theirperformance in addressing sustainability issues. Ourassociations plan to continue supporting our membercompanies through sharing good practices, anddeveloping and maintaining our guidance onsustainability reporting as evidenced through this update.
OIL AND GAS INDUSTRY GUIDANCE ON VOLUNTARY SUSTAINABILITY REPORTING
3
ROGER HAMMOND (1956-2012)
We would like to recognize thecontribution of Roger Hammond, thefounder of Living Earth Foundation, intothe development of the second editionof the Guidance. In his role as a memberof the Stakeholder Panel, Rogerprovided key insights into sustainabilityissues which led to significantimprovements. We continue to valuethe inputs he provided, as well as the work he undertookwith the industry more broadly through Living Earth.
Roger Hammond,
Living Earth

IPIECA • API • IOGP
Joint statement of the Independent Stakeholder Panel
4
We are pleased to offer our comments on thisthird edition of IPIECA’s sustainability reportingguidance. Our role as a panel has been to offerour guidance to IPIECA as experts andstakeholders in relation to the industry’ssustainability impacts. Our purpose in doing thishas been two-fold: first, to help ensure that thenew edition of this sustainability reportingguidance adequately captures the sustainabilitylandscape, from impacts to risks andopportunities, relevant to the oil and gas sectorand its stakeholders; and second, to help ensurethat the guidance is designed to producetransparent, honest and informative reports thatadvance sustainability strategy and practice.
At a technical level, the updates to the guidancehave been thoughtful and highly competent,responsive both to stakeholders’recommendations and to wider trends insustainability practice and reporting. We areespecially pleased to see significant improvements
in particular to the sections on water, biodiversityand ecosystem services and human rights, all ofwhich help bring IPIECA’s guidance more closely inline with international best practice in reporting.
We also welcome the improvements to theguidance on how to describe sustainability issuesand impacts in reports beyond measurementprotocols and indicators. The new guidance ismore consistent and specific in terms of howreporters are asked to discuss the nature andsignificance of issues, how they relate to thecompany’s strategy, vision and future plans, andtheir general approach to managing the issues.We hope this improvement will result in reportsthat are clearer and more strategic, and thatenable greater accountability over time.
The guidance has also improved with respect tothe process of reporting. This includes identifyingand prioritizing reported content using theprinciple of materiality. While the materialityguidance is technically robust, it will not in itself
To improve external engagement as part of the Guidance revision process for both the second and thirdeditions, the IPIECA Reporting Working Group (RWG) convened a Panel made up of independentstakeholders with expertise in sustainability practices relating to the oil and gas industry. As knowledgeablemembers of the reporting community, the Panel represented views of typical report reader groups: businessand industry; environmental and community-oriented NGOs; investors; UN bodies; and multilateralinstitutions. At the onset of this engagement, the Panel was asked to assess the quality, credibility andeffectiveness of the revision process and to provide ideas for improvement. Through ongoingcommunications during the revision process, including a face-to-face dialogue in 2014, the Panel providedcandid, significant and challenging input on the RWG’s proposed updates to the second edition. For theRWG’s initial update proposals and the final draft, the Panel provided high-level feedback and detailedsuggestions, which were all reviewed and most were incorporated as improvements within this third edition.The following is the joint statement from the Independent Stakeholder Panel.
Tom Delfgaauw,
Independent
Matthias Beer, F&C
Asset Management
Margaret Jungk,
UN Working Group
on Business and
Human Rights
Judy Kuszewski,
Independent,
Panel Chair
Janet Ranganathan,
World Resources
Institute
Trevor Rees,
Living Earth
Robin Sandenburgh,
IFC

OIL AND GAS INDUSTRY GUIDANCE ON VOLUNTARY SUSTAINABILITY REPORTING
5
l Greater emphasis on targets: targets areessential for driving performance and creatinga basis for accountability and trust amongstakeholders. The 2015 Guidance does little toadvance the setting and reporting of targetsand progress against them compared with the2010 version.
l The absence of minimum reporting standards:the Guidance does not establish any basicrequirements for what would constitute anacceptable sustainability report for an IPIECAmember company. Today, as in 2010,members are free to choose whether or notthey will report at all. We encourage IPIECA todo more to encourage and measuremembers’ uptake of the Guidance, andprovide assurance that voluntary reporting ismaking a material difference. This includesensuring that members:
• produce public sustainability reports;
• use the IPIECA reporting Guidance as thebasis for their reports; and
• report all ‘common’ reporting elements at aminimum.
The time has come to move beyondsustainability reporting as a voluntary exercisedriven by idiosyncratic corporate circumstances,towards a sector that recognizes its responsibilityto account for its activities and performance, andto defend its strategies and instill confidence andtrust among stakeholders through robustreporting—to a minimum agreed level throughthis Guidance.
Ultimately, technical reporting challenges cannottake place in a vacuum without the clear supportof company leadership. We therefore encourageIPIECA to strengthen its role in driving changewithin the oil and gas sector by harnessing thevoice of CEOs and board level leaders to chart avision for the industry’s key sustainabilitychallenges. Now, more than ever, this leadershipvoice is required to enable the industry toreconcile the twin challenges of energy securityand climate change, while managing andmitigating a broad range of increasingly complexsustainability risks.
guarantee that companies will implement it asintended. We encourage companies to invest inhigh quality stakeholder engagement across themany aspects of their operations to ensure thatthe concerns of those most affected by thecompany’s operations are involved in reportingdecisions.
There are areas in which we would havepreferred the guidance to have gone further. Webelieve the future sustainability of the oil and gassector will be strongly influenced by threeinterconnected factors: 1) society’s need to limitglobal average atmospheric temperature rise totwo degrees above preindustrial levels; 2) rapidlyfalling prices for clean energy alternatives; and3) the transition to electric vehicles. As a result,‘stranded assets’ may pose a significant risk toboth the economic value and performance ofthe industry in the near future. While theguidance makes reference to this challenge, wefeel it could have advanced the state of reportingby strengthening recommendations on the riskmanagement approaches that companies areimplementing to anticipate this challenge.
Oil and gas companies face other risks to theirviability. Operating in regions that areinsufficiently democratically mature leads toconflict, social strife, bribery and corruption. Weexpect companies to acknowledge these risksand demonstrate how their operations fit intothat wider human perspective. We hope thatfuture editions of the guidance will inspirereporting in that direction.
We would prefer the guidance to give clearerinstruction to reporters on how their reportsmight be improved in the future, and what wouldconstitute a path of progress. The framework’semphasis on ‘common’, ‘supplemental’ and‘other’ reporting elements might drive a degreeof conformity, but may do so on the basis of thelowest common denominator rather thanencouraging leadership in reporting.
We regret that there are several significant areasin which the panel’s comments and suggestionsin 2010 have not been addressed. These remainimportant and should be addressed withurgency:
IPIECA • API • IOGP
6
ACKNOWLEDGEMENTS
The information contained in this document was developed jointly under the auspices of IPIECA,API and IOGP. It represents the work of a Reporting Working Group (RWG), composed of 80representatives from 28 companies and 4 trade associations.
The document benefitted significantly from the input and review of a Stakeholder Panel, whichmet formally with the RWG in April 2014 and also contributed throughout the process. IPIECA, APIand IOGP would also like to thank the organizations and individuals that responded during thepublic consultation period in December 2014. The comments received were of substantial valueto the revision. Particular thanks are given to Tamara Bergkamp, from the Global ReportingInitiative (GRI), for her contribution to the mapping document between the Guidance and GRI G4(pages 148–155).
In addition to input from many technical groups within IPIECA, API and IOGP, experts from thefollowing companies contributed substantial personal effort to the Guidance update:
For the 2015 edition, the IPIECA Secretariat project manager was Helen Murphy. Consultantsupport was provided by Bill Boyle (IPIECA senior associate) and Nigel Jones (design).
Anadarko
BG Group
BP
Chevron
ConocoPhillips
Eni
ExxonMobil
Hess
Husky Energy
Maersk Oil
Noble Energy
Petrobras
Repsol
Schlumberger
Shell
Statoil
Total
Photographs reproduced courtesy of the following: cover (upper left, lower left and lower right) and pages 11, 15, 29, 39, 58, 65, 66 (bottom), 70,77, 90, 95, 100, 102 and 104 (top): Shutterstock.com; pages 13, 16, 18, 23, 27, 49, 53, 54, 57, 63, 66 (top), 79, 84, 87, 89, 103, 114, 119, 125 and127: iStockphoto.com; cover (centre left) and page 106: BP; page 107 (bottom): Chevron; page 34: ©Larry Lee Photography/Corbis; cover (bottomcentre) and pages 25, 85, 97, 98, 104, 107 (top) and 112: ExxonMobil Corporation; pages 36, 80 and 110: Marathon Oil.
7
OIL AND GAS INDUSTRY GUIDANCE ON VOLUNTARY SUSTAINABILITY REPORTING
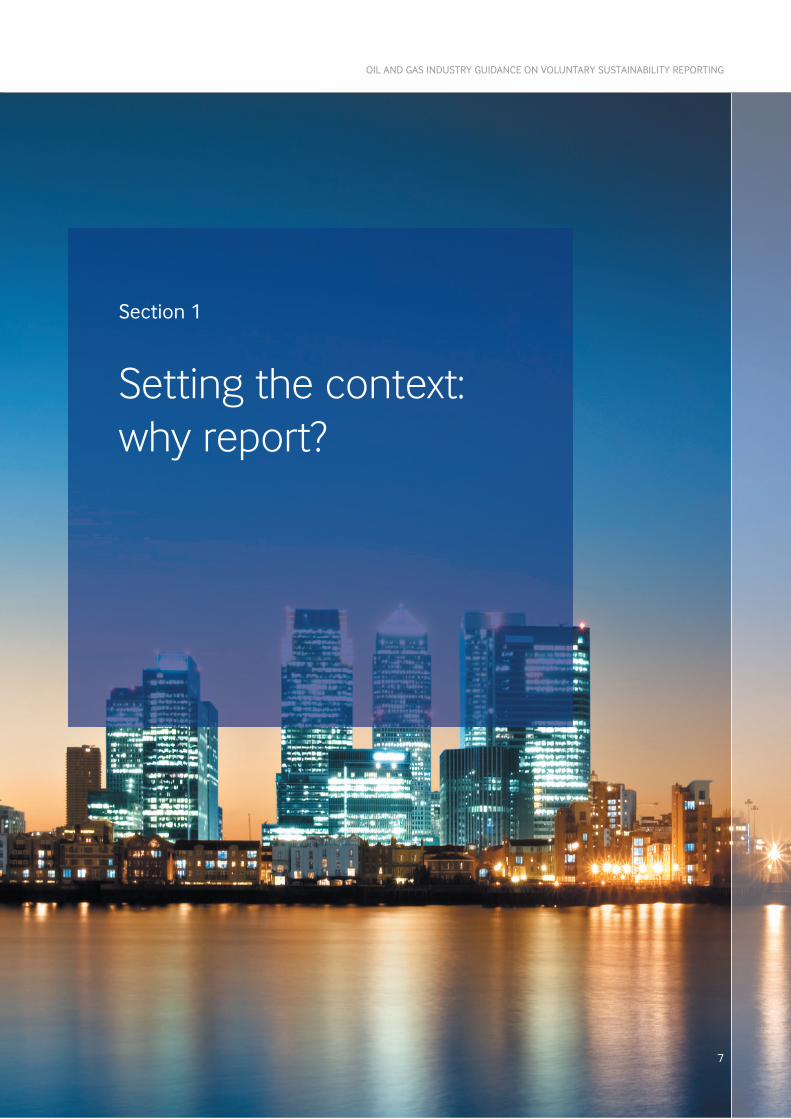
Section 1
Setting the context:why report?
IPIECA • API • IOGP
8
Sect
ion
1 S
ettin
g th
e co
ntex
t: w
hy r
epor
t?
The oil and gas sector is a fundamental part oftoday’s world, providing essential energy and rawmaterials for global development. A dynamic andinnovative business, the industry constantly seeksto adapt to new situations and challenges. It investsnot only in the search for new oil and gas, but alsoin facilities, infrastructure, technology, localcommunities, health and safety, and theenvironment. The sector continually examinesopportunities to meet growing energy demandaround the world, while seeking to mitigate adverseimpacts of its activities as well as to address thepotential risks associated with climate change.
Not surprisingly, many people and organizationsworldwide want to understand the oil and gassector’s business and participate in dialogue withcompanies on the effects of their activities—theimpacts, benefits, risks and trade-offs. In addition toannual reports on financial performance and othercommunication initiatives, sustainability reporting—also known as corporate citizenship, corporateresponsibility or environmental, social andgovernance (ESG) reporting—is an important way forcompanies in the sector to engage with stakeholdersand help foster informed dialogue andunderstanding.
Oil and gas companies have been among thepioneers of sustainability reporting and haveprovided leading examples of good reportingpractices. This Guidance has been developed toshare good practice across the industry and toencourage companies, both current and newreporters, to keep their stakeholders informedabout their performance. The Guidance representsindustry consensus on the most prevalentsustainability issues and indicators, and aims tosupport continuous improvement of sustainabilityreporting and performance across the sector.
BENEFITS OF REPORTING
Reporting can bring companies recognizablebusiness benefits. Through communication on itsmost important sustainability issues, a company’sreport becomes a reliable source of information for
its stakeholders. By transparently describing itsbiggest challenges, reporting underpins stakeholderengagement and represents the company’s valuesin action.
For oil and gas companies, reporting provides arobust platform for describing how strategic globalissues—such as climate change and energy—arebeing addressed through long-term plans andcurrent initiatives. The report can also explain howthe company is managing the socio-economicimpacts and environmental, health and safety risksof operating in different locations. Once published,this information enables further communicationand engagement with stakeholders. The long-termbenefits of reporting include:
l enhanced business value as investorconfidence grows in response to evidence thatthe company is managing important risks andpositioning itself to take advantage of emergingopportunities;
l improved operations as employees develop adeeper understanding of a company’ssustainability values and performance indicatorsprovide insight to support continuousimprovement;
l strengthened relationships as local communityleaders, civil society representatives, governmentofficials and regulators, and other keystakeholders learn how the company responsiblymanages sustainability issues; and
l enhanced trust and credibility as customers,suppliers and the wider society understand thecompany’s brand, operations and products.
For many companies, sustainability reporting isonly one of the channels used to engagestakeholders. For example, a company may alsoproduce an annual report for its shareholders, ESGfilings for investment funds and research houses,an integrated report for providers of capital,statutory stock market filings in differentcountries, and regular publications for employees,customers or communities. Generating asustainability report using a consistent, robust
Section 1
Setting the context: why report?
9
OIL AND GAS INDUSTRY GUIDANCE ON VOLUNTARY SUSTAINABILITY REPORTING
Section 1 Setting the context: w
hy report?
process also provides reliable, verifiableinformation and data that can underpin otherreports and communications.
ABOUT THE GUIDANCE
This third edition of the Guidance replaces thesecond edition published in December 2010. Thisrevision is based on industry experience, feedbackon the 2010 document, and significant insights andsuggestions from an independent panel ofstakeholders with expertise in the sector andsustainability reporting (see pages 4–5).
The Guidance aims to assist oil and gas companiesin developing and enhancing the quality andconsistency of their sustainability reporting. It isdesigned for use by any oil and gas companyoperating nationally, regionally or internationally.The Guidance deliberately provides choices, notonly for experienced reporters, but also to enablenew reporters or smaller companies to focus ontheir most important issues at a level appropriateto their business and stakeholders. It recognizesthat while some reporters are multinational publiccorporations, others may be state- or privately-owned companies, where local reporting tailoredto individual stakeholders may be more importantthan aggregated reporting at the global level.
The Guidance may also serve as a reference to helpreaders of company reports, including onlineinformation channels, to understand the basis forreporting in the oil and gas sector.
USING THE GUIDANCE
The Guidance is a reference tool aimed at helpingcompany sustainability managers, communicationsprofessionals and environmental, health and safetyor socio-economic specialists to develop corporate-level reporting for internal and external stakeholderaudiences. It can be used to report performance todifferent audiences in different ways—for activitiesin a single country, for large projects or for a singleoperation. The Guidance is designed to offerflexibility in support of new reporters, who may
initially focus on a limited number of keysustainability issues, geographical locations orspecific audiences, and then, over time, graduallyincrease coverage of their reporting.
This Guidance is voluntary. It does not setminimum requirements or predeterminestakeholder needs. Instead, it encouragescompanies to make informed choices on what isimportant for reporting by engaging with theirstakeholders and understanding their needs. Then,to support these choices, reporters can includerelevant data and information that benefit from theconsistency of industry consensus on the issues,indicators and reporting elements detailed in theGuidance. With effort focused primarily on thoseissues of significance to the individual companyand its stakeholders, reporting time and cost canbe better managed.
The Guidance provides two types of assistance byhelping companies decide:
l ‘how’ to report, by describing a process forreporting; and
l ‘what’ to report, by providing options fordeveloping the content of the report.
Process
In Section 2, companies are encouraged to employa stepwise process for reporting by:
l setting the context for the report by outlining thecompany’s high-level vision and strategy,together with governance and managementsystems;
l determining the issues to include by using amateriality process that identifies the completeset of issues of relevance to both the companyand its stakeholders; and
l selecting indicator data to be collected within thecompany’s reporting boundary and incorporatedinto the narrative.
IPIECA • API • IOGP
10
Sect
ion
1 S
ettin
g th
e co
ntex
t: w
hy r
epor
t?
The objective of each step is to build transparentand concise reporting as part of stakeholderengagement. The process helps the company toverify which issues and indicators are not materialand thus avoid unnecessary and time-consumingreporting which can obscure the relevant issues.
Content
Sections 3 to 6 provide direction on the content ofa typical oil and gas industry report. The Guidanceprovides a set of performance indicatorsappropriate to sustainability issues in the industry.Each indicator provides a choice of reportingelements depending on the depth or accuracyrequired (i.e. depending on the materiality of theissue for the company). The reporting elementsinclude measures that are ‘common’, being themost established and consistent across the industrytoday. Section 3 provides guidance (including onreporting boundaries and data normalization) that isbroadly applicable to the performance indicatorsprovided in Sections 4, 5 and 6, covering(respectively) environmental, health and safety, andsocial and economic issues.
The breadth and depth of the reporting content mayvary significantly between companies depending onthe extent of business activities and related impactsacross the value chain, as well as the materiality ofsustainability issues to the company and itsstakeholders. Listed below are several basiccomponents that are commonly included within anoil and gas sustainability report or website:
l CEO statement: this introductory statementfrom the company’s most senior executiveemphasizes the importance of reporting to thecompany, provides stakeholders with a strategicoverview and context for the sustainability issues,and highlights performance challenges andprogress for the reporting year.
l Addressing climate change risks: this issuecontinues to be regarded as the sector’s primarylong-term environmental issue, and companiestypically provide information on their position,strategy and actions related to the issue, as wellas disclosure of greenhouse gas (GHG) emissionsand other performance indicators.
l Managing risks of accidents: the oil and gasindustry has inherent hazards throughout thevalue chain that must be responsibly managedto prevent events that could potentially result inharm to people, damage to the environment,and socio-economic impacts. Companiestypically describe their systems to managesafety and related risks, and openly disclosetheir annual performance record including anysignificant incidents.
l Local impacts and benefits: oil and gascompanies often operate in places where theiractivities can have significant benefits, atcommunity or national level, but may also havelocal impacts which affect people or theenvironment. In addition to describing corporatepolicies and processes, reported content candraw attention to operations in developingcountries or sensitive environments, whereissues may include respect for human rights,transparency of payments to host governments,access to fresh water, or protection ofbiodiversity.
l Reporting process: companies generally explaintheir reporting process, including howstakeholders are engaged, how issues areprioritized for reporting, how information isprepared and validated, and whether any nationalor international reporting guidelines are used.
While the Guidance addresses many othercomponents of reporting content, the stakeholdersengaged during the development of this editionhave highlighted these five components as basicexpectations.
Referencing the Guidance
Companies who use the process and/or thecontent sections are encouraged to reference theGuidance, acknowledging IPIECA, API and IOGP,since doing so demonstrates a company’s efforts toreport consistently by applying oil and gas industrygood practice. Within their reports, companies maywish to include an index of the Guidance indicatorsused, which would signal that their reporting meetsthe intent of the indicator description and follows atleast one reporting element.

11
OIL AND GAS INDUSTRY GUIDANCE ON VOLUNTARY SUSTAINABILITY REPORTING
Section 2
The reporting process:how to report
IPIECA • API • IOGP
12
Section 2
The reporting process: how to report
Sect
ion
2 T
he r
epor
ting
proc
ess:
how
to
repo
rt
This section provides the foundation for goodpractice through sound principles and a six-step reporting process.
GENERAL REPORTING PRINCIPLES
The following general reporting principles1
provide constructive concepts forconsideration as companies develop contentfor sustainability reporting:
l Relevance: The reported information shouldappropriately reflect the sustainability issuesof the company and meet the needs ofstakeholders—both internal and external tothe company.
l Transparency: Information should bereported in a clear, understandable, factualand coherent manner, and should facilitateindependent review. Transparency includesdisclosure of the processes, procedures,assumptions and limitations affecting reportpreparation.
l Consistency: For reports to be credible,information-gathering processes anddefinitions must be systematically applied.Consistency in what is reported and how it isreported enables meaningful review of acompany’s performance over time, andfacilitates comparison internally and withpeer companies.
l Completeness: Information should beincluded in a manner that is consistent withthe stated purpose, scope and boundaries ofthe report.
l Accuracy: Information should be sufficientlyprecise to enable intended users tounderstand the relevance of informationwith a suitable level of confidence.
1 The five principles listed were drawn from the reporting principles stated within The Greenhouse Gas Protocol (WRI/WBCSD, 2004) and their
use has evolved here to provide wider applicability for this Guidance. These principles have also been adapted for specific application in other
IPIECA/API/IOGP documents, including the Petroleum Industry Guidelines for Reporting Greenhouse Gas Emissions (2011).
12
34
5
6����������� ������ �����
� ���������������������
� ��
�������������������������� �
������������
������������� ������������
���� ��������������������
������
������� ����
��������������������������������� ���� ���� � ���� ����������������
������ �������������������������
Figure 1 The sustainability reporting process

PROCESS OVERVIEW
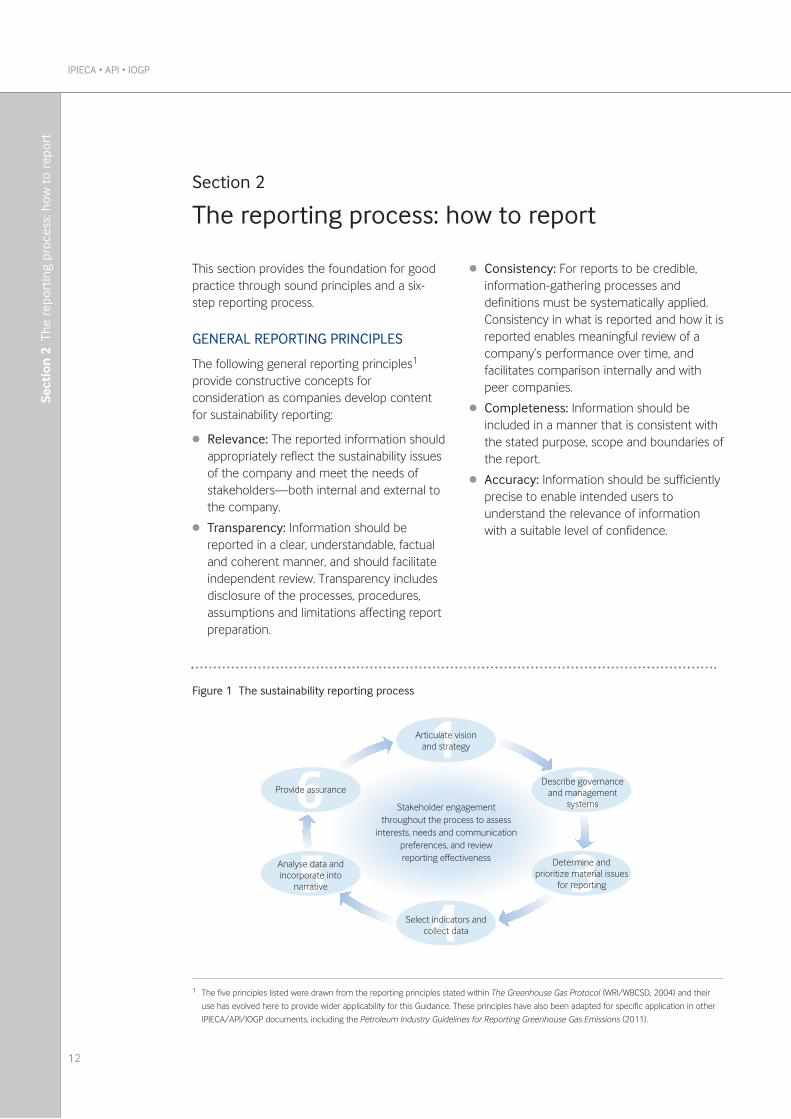
The publication of a sustainability report, oronline content, is generally the result ofinternal corporate processes combined withexternal dialogue. Although each company willhave its own approach, Figure 1 illustrateshow stakeholder engagement underpins sixtypical process steps, which are discussed indetail in the rest of this section.
ENGAGING STAKEHOLDERS
Stakeholder engagement has an importantrole throughout the reporting process.Stakeholder viewpoints and dialogue can helpto ensure that the report is relevant,accessible and credible to external audiences.Feedback on the completed report canprovide valuable insight to improve futurereports and to initiate dialogue on issues.Thus, as an integral part of the reporting
process, companies could considerproactively soliciting stakeholder views atdifferent stages:
l Starting out: stakeholder opinion on thecompany’s vision and strategy, governance,management plans and approach, relevantissues and performance can be gathereddirectly through dialogue or indirectlythrough media articles, public reports andsurveys.
l During production: stakeholders can beinvited to comment on reportingexpectations or to review drafts. Stakeholderinput can also help to confirm the relevanceof the proposed content.
l Post-publication: stakeholders can be givenopportunities to review the completedreport, indicating how they might make useof it, and what they would like to see in thefuture.
13
OIL AND GAS INDUSTRY GUIDANCE ON VOLUNTARY SUSTAINABILITY REPORTING
Section 2 The reporting process: how
to report
Many channels exist to further engagestakeholders on the report, including focusgroups, surveys, panels, web forums and socialnetworking. It is important to take care toensure consistency with the primary messagescontained in the report.
The process of reporting and relatedengagement is typically annual, providing aperiodic opportunity for stakeholders to assessprogress over time. Reported information may
be provided in different formats, from stand-alone printed reports to internet-accessibleformats that can allow a greater level of detail,timely updates and online feedback.
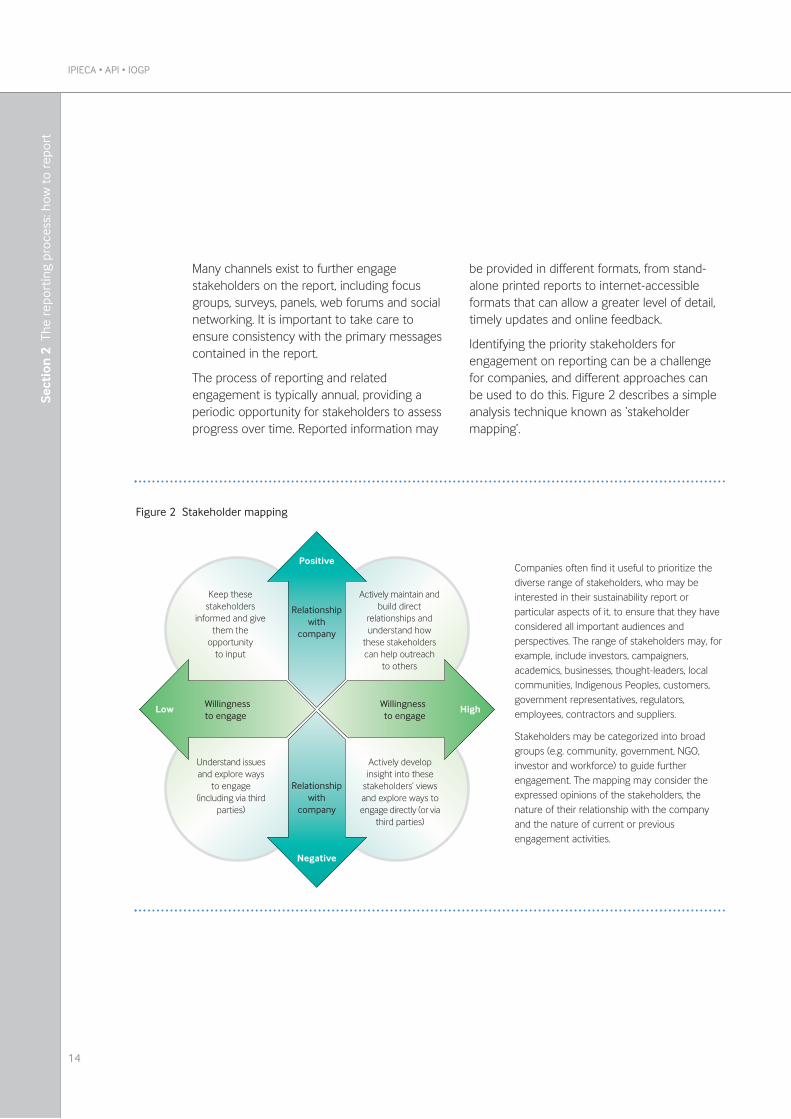
Identifying the priority stakeholders forengagement on reporting can be a challengefor companies, and different approaches canbe used to do this. Figure 2 describes a simpleanalysis technique known as ‘stakeholdermapping’.
IPIECA • API • IOGP
14
Sect
ion
2 T
he r
epor
ting
proc
ess:
how
to
repo
rt
��������
���������� ���
������
����� �������
���������������������������������������
����������������������������
������ ��� ������� ��������� � ������� �������������
�������
��� ����� � ���!�������
������"������������������
���� #
��������������� ������������ ������� $���� ���!������� ���������������"�����
���������� #
���������������
������
���������� ���
������
�� ��� ���������������
Figure 2 Stakeholder mapping
Companies often find it useful to prioritize thediverse range of stakeholders, who may beinterested in their sustainability report orparticular aspects of it, to ensure that they haveconsidered all important audiences andperspectives. The range of stakeholders may, forexample, include investors, campaigners,academics, businesses, thought-leaders, localcommunities, Indigenous Peoples, customers,government representatives, regulators,employees, contractors and suppliers.
Stakeholders may be categorized into broadgroups (e.g. community, government, NGO,investor and workforce) to guide furtherengagement. The mapping may consider theexpressed opinions of the stakeholders, thenature of their relationship with the companyand the nature of current or previousengagement activities.
A sustainability report should set out how acompany’s sustainability priorities are integratedinto its overall vision and business strategy.These priorities should cover both currentoperational issues, such as health and safety,environmental compliance, social/culturalrequirements and labour practices, as well aslonger-term considerations, such as climatechange risks or access to new energy resources.
DEFINE SUSTAINABILITY
Reports generally describe a company’sunderstanding of what ‘sustainability’, ‘corporateresponsibility’ or ‘corporate citizenship’ meansto their company, and indicate the mainimplications and opportunities for its core oiland gas businesses. For example, a companymay wish to discuss how its long-term successdepends on supplying necessary products andservices; but at the same time, how itrecognizes the need to respect and contributeto the communities where it operates and tosafeguard the environment and culturalheritage. Such a statement of intent helps toset the scene for describing the company’sforward vision and strategy.
REVEAL VISION
A company’s vision statement can look to thesustainability opportunities and challenges ofsupplying energy into the future. The vision willoften be presented in the context of existingcorporate values, principles and policycommitments with reference to:
l quality of products;
l safety and reliability of operations;
l care for the environment and communities;
l engaging stakeholders;
l respect for others and their rights; and
l innovation and pioneering solutions.
15
OIL AND GAS INDUSTRY GUIDANCE ON VOLUNTARY SUSTAINABILITY REPORTING
Section 2 The reporting process: how
to report
Step 1: Articulate vision and strategy
EXPLAIN STRATEGY
A company can explain how its strategy andplans create value for its shareholders bymeans of its current performance and—in thatcontext—describe its principal sustainabilityissues and its approach to addressing them.The high-level vision and strategy are often setout in an executive management or chairman’sletter at the opening of the report. Thisintroduction to the report serves todemonstrate top-level personal commitment tosustainability and involvement in leading thebusiness to achieve the company’s vision andstrategy. The introduction is also anopportunity to show how management istaking responsibility for any difficult challenges,decisions or dilemmas faced by the company,and to set out how these will be addressed, forexample, through new investments, initiativesor goals. The description of the strategy can bedeveloped further throughout the reportcontent or on the company website with moredetail as appropriate.
Having articulated the vision and strategy, it isimportant for companies to report on the roleof the board and/or executives with regard tosustainability-related governance andmanagement systems.
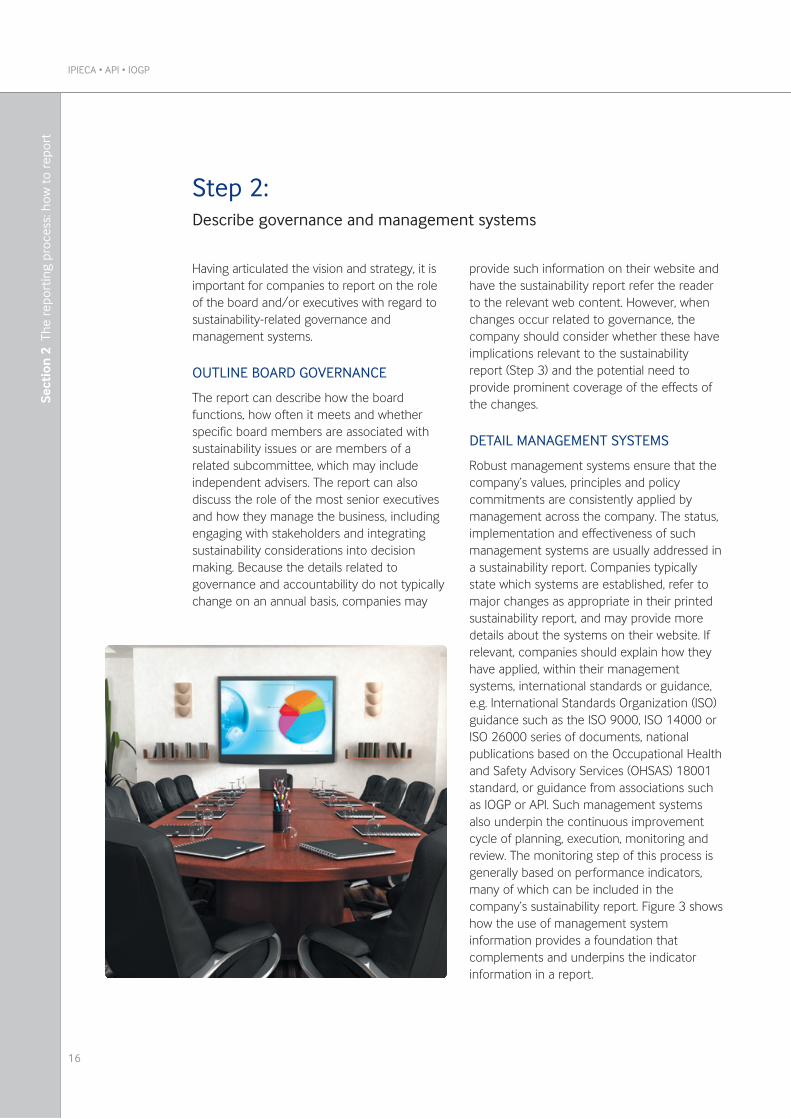
OUTLINE BOARD GOVERNANCE
The report can describe how the boardfunctions, how often it meets and whetherspecific board members are associated withsustainability issues or are members of arelated subcommittee, which may includeindependent advisers. The report can alsodiscuss the role of the most senior executivesand how they manage the business, includingengaging with stakeholders and integratingsustainability considerations into decisionmaking. Because the details related togovernance and accountability do not typicallychange on an annual basis, companies may
provide such information on their website andhave the sustainability report refer the readerto the relevant web content. However, whenchanges occur related to governance, thecompany should consider whether these haveimplications relevant to the sustainabilityreport (Step 3) and the potential need toprovide prominent coverage of the effects ofthe changes.
DETAIL MANAGEMENT SYSTEMS
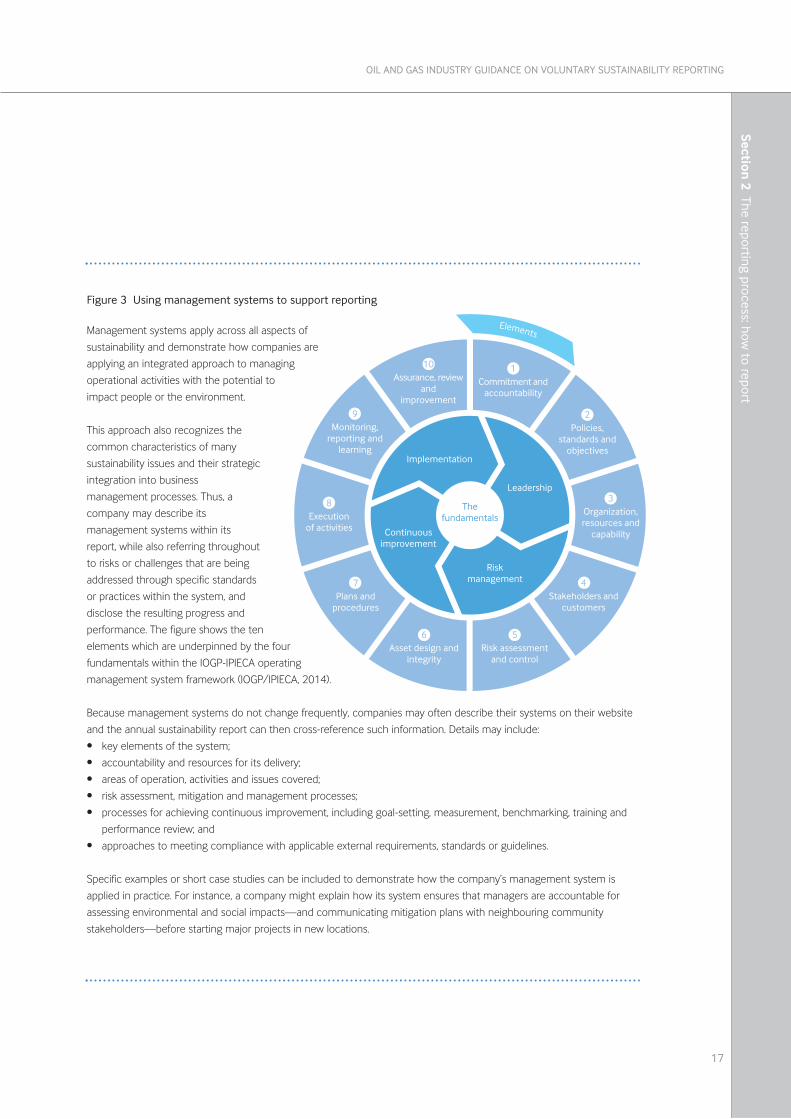
Robust management systems ensure that thecompany’s values, principles and policycommitments are consistently applied bymanagement across the company. The status,implementation and effectiveness of suchmanagement systems are usually addressed ina sustainability report. Companies typicallystate which systems are established, refer tomajor changes as appropriate in their printedsustainability report, and may provide moredetails about the systems on their website. Ifrelevant, companies should explain how theyhave applied, within their managementsystems, international standards or guidance,e.g. International Standards Organization (ISO)guidance such as the ISO 9000, ISO 14000 orISO 26000 series of documents, nationalpublications based on the Occupational Healthand Safety Advisory Services (OHSAS) 18001standard, or guidance from associations suchas IOGP or API. Such management systemsalso underpin the continuous improvementcycle of planning, execution, monitoring andreview. The monitoring step of this process isgenerally based on performance indicators,many of which can be included in thecompany’s sustainability report. Figure 3 showshow the use of management systeminformation provides a foundation thatcomplements and underpins the indicatorinformation in a report.
IPIECA • API • IOGP
16
Sect
ion
2 T
he r
epor
ting
proc
ess:
how
to
repo
rt
Step 2: Describe governance and management systems
17
OIL AND GAS INDUSTRY GUIDANCE ON VOLUNTARY SUSTAINABILITY REPORTING
Section 2 The reporting process: how
to report
Management systems apply across all aspects of
sustainability and demonstrate how companies are
applying an integrated approach to managing
operational activities with the potential to
impact people or the environment.
This approach also recognizes the
common characteristics of many
sustainability issues and their strategic
integration into business
management processes. Thus, a
company may describe its
management systems within its
report, while also referring throughout
to risks or challenges that are being
addressed through specific standards
or practices within the system, and
disclose the resulting progress and
performance. The figure shows the ten
elements which are underpinned by the four
fundamentals within the IOGP-IPIECA operating
management system framework (IOGP/IPIECA, 2014).
Because management systems do not change frequently, companies may often describe their systems on their website
and the annual sustainability report can then cross-reference such information. Details may include:
• key elements of the system;
• accountability and resources for its delivery;
• areas of operation, activities and issues covered;
• risk assessment, mitigation and management processes;
• processes for achieving continuous improvement, including goal-setting, measurement, benchmarking, training and
performance review; and
• approaches to meeting compliance with applicable external requirements, standards or guidelines.
Specific examples or short case studies can be included to demonstrate how the company’s management system is
applied in practice. For instance, a company might explain how its system ensures that managers are accountable for
assessing environmental and social impacts—and communicating mitigation plans with neighbouring community
stakeholders—before starting major projects in new locations.
Figure 3 Using management systems to support reporting
�����������������
�����������
���������
������������
������
����������� ����������
����!�����
"#$����� ������
������������
%&�������
�����������������
"������������
�������!�����
'(������
����������!)������
*���������
���������
+$����������
��������
,(�����
���������
-�.������
�/����������
01�������������
�������
2��/��������
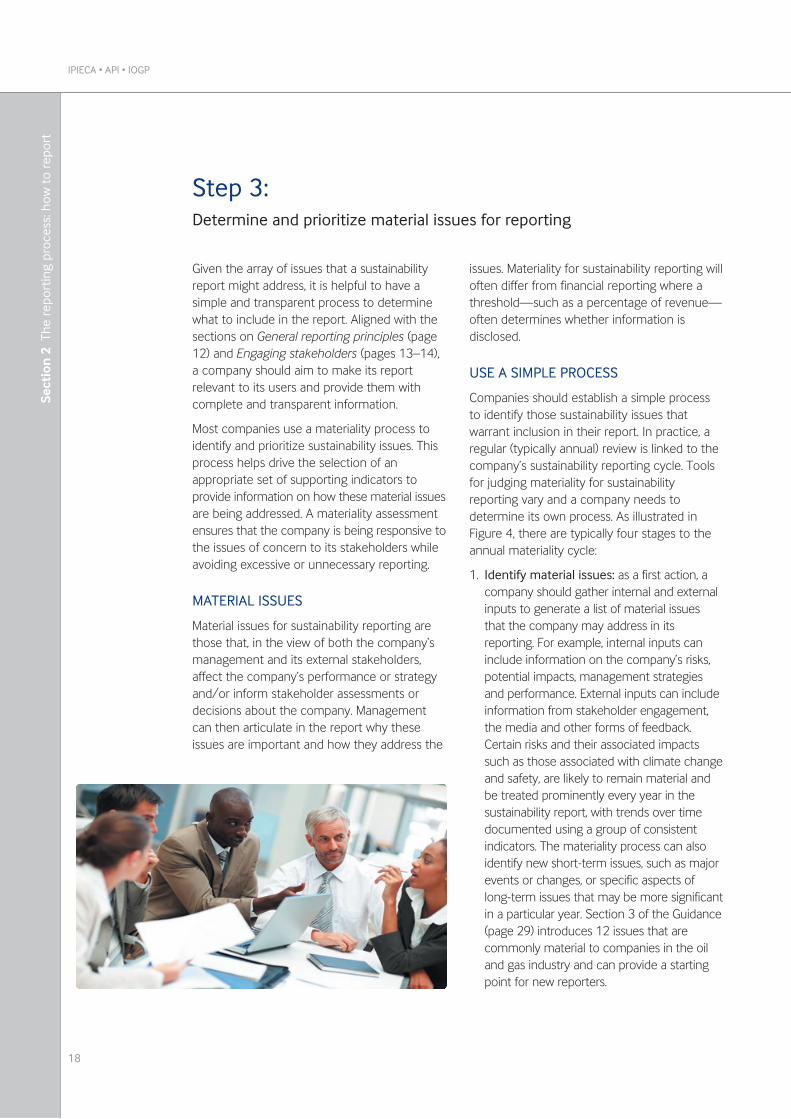
Given the array of issues that a sustainabilityreport might address, it is helpful to have asimple and transparent process to determinewhat to include in the report. Aligned with thesections on General reporting principles (page12) and Engaging stakeholders (pages 13–14),a company should aim to make its reportrelevant to its users and provide them withcomplete and transparent information.
Most companies use a materiality process toidentify and prioritize sustainability issues. Thisprocess helps drive the selection of anappropriate set of supporting indicators toprovide information on how these material issuesare being addressed. A materiality assessmentensures that the company is being responsive tothe issues of concern to its stakeholders whileavoiding excessive or unnecessary reporting.
MATERIAL ISSUES
Material issues for sustainability reporting arethose that, in the view of both the company‘smanagement and its external stakeholders,affect the company’s performance or strategyand/or inform stakeholder assessments ordecisions about the company. Managementcan then articulate in the report why theseissues are important and how they address the
issues. Materiality for sustainability reporting willoften differ from financial reporting where athreshold—such as a percentage of revenue—often determines whether information isdisclosed.
USE A SIMPLE PROCESS
Companies should establish a simple processto identify those sustainability issues thatwarrant inclusion in their report. In practice, aregular (typically annual) review is linked to thecompany’s sustainability reporting cycle. Toolsfor judging materiality for sustainabilityreporting vary and a company needs todetermine its own process. As illustrated inFigure 4, there are typically four stages to theannual materiality cycle:
1. Identify material issues: as a first action, acompany should gather internal and externalinputs to generate a list of material issuesthat the company may address in itsreporting. For example, internal inputs caninclude information on the company’s risks,potential impacts, management strategiesand performance. External inputs can includeinformation from stakeholder engagement,the media and other forms of feedback.Certain risks and their associated impactssuch as those associated with climate changeand safety, are likely to remain material andbe treated prominently every year in thesustainability report, with trends over timedocumented using a group of consistentindicators. The materiality process can alsoidentify new short-term issues, such as majorevents or changes, or specific aspects oflong-term issues that may be more significantin a particular year. Section 3 of the Guidance(page 29) introduces 12 issues that arecommonly material to companies in the oiland gas industry and can provide a startingpoint for new reporters.
IPIECA • API • IOGP
18
Sect
ion
2 T
he r
epor
ting
proc
ess:
how
to
repo
rt
Step 3: Determine and prioritize material issues for reporting
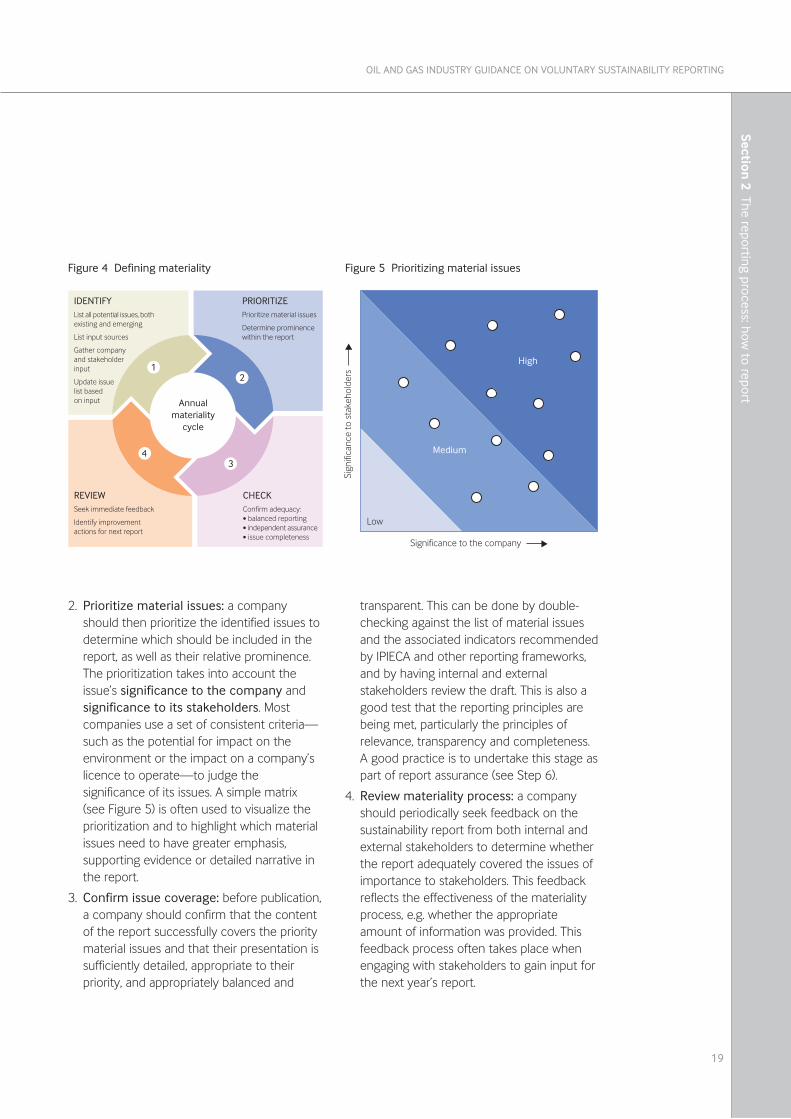
2. Prioritize material issues: a companyshould then prioritize the identified issues todetermine which should be included in thereport, as well as their relative prominence.The prioritization takes into account theissue’s significance to the company andsignificance to its stakeholders. Mostcompanies use a set of consistent criteria—such as the potential for impact on theenvironment or the impact on a company’slicence to operate—to judge thesignificance of its issues. A simple matrix(see Figure 5) is often used to visualize theprioritization and to highlight which materialissues need to have greater emphasis,supporting evidence or detailed narrative inthe report.
3. Confirm issue coverage: before publication,a company should confirm that the contentof the report successfully covers the prioritymaterial issues and that their presentation issufficiently detailed, appropriate to theirpriority, and appropriately balanced and
transparent. This can be done by double-checking against the list of material issuesand the associated indicators recommendedby IPIECA and other reporting frameworks,and by having internal and externalstakeholders review the draft. This is also agood test that the reporting principles arebeing met, particularly the principles ofrelevance, transparency and completeness.A good practice is to undertake this stage aspart of report assurance (see Step 6).
4. Review materiality process: a companyshould periodically seek feedback on thesustainability report from both internal andexternal stakeholders to determine whetherthe report adequately covered the issues ofimportance to stakeholders. This feedbackreflects the effectiveness of the materialityprocess, e.g. whether the appropriateamount of information was provided. Thisfeedback process often takes place whenengaging with stakeholders to gain input forthe next year’s report.
19
OIL AND GAS INDUSTRY GUIDANCE ON VOLUNTARY SUSTAINABILITY REPORTING
Section 2 The reporting process: how
to report
Figure 4 Defining materiality
$��������������
�����
�3�42�56%� �������������� � ������!� ��������������
%� �������� ����
&������������� ������������
����� ��� ��� ���������
(�����2�7������������������ �
������������������������������
�8��9'��������(���)*���������������*���������� ����*�� ���������
��:������������������
+��������������������� ������!�������
"'
0�
Figure 5 Prioritizing material issues
&�����
8���
%��
�����������������������
�������������� �������
*���������� �����
�������������
� ���������
����,���������
����,�������
��,��������
���������
���������� ���� ���
*�� ����������� *�����������������������*������������ *���� �����
*������ ������������ ���*������������ *������������������*�������� ����� *�������� *���������������
*��-�� �����*�� ���� ��������*�������������������� *�� �������� ���� *���� �� ����� *������������*��������������������
*�������� *��������������*��������
*������ ���� *��� �*���� ��� ������*��������� ��������� � ��� ���� *���� ���� �������
The word ‘issue’ is used in this Guidance as a broad term to group types of sustainability aspects, including
risks, impacts and benefits, related to the life cycle and value chain of a company’s activities. Figure 6
illustrates the inter-connecting social, economic and environmental dimensions of sustainable development
as well as the types of sustainability topics that can be considered when determining material issues for
inclusion in a sustainability report. The figure is not intended to be comprehensive but it provides an
overview of the most significant issues commonly associated with the oil and gas industry, as described in
Sections 3–6 of this Guidance.
Figure 6 Sustainability issues
See Appendix B for further guidance on thepractical implementation of the materialityprocess.
REFLECT THE MATERIALITY PROCESSIN REPORTS
It is good practice to describe a company’smateriality process in its sustainability reportingand the outcomes of the process in terms of adescription or list of the key issues identified,with an indication of any significant changessince the previous report. As described in
Section 3, the report should then put thepriority issues into the context of sustainabilityfor the company and convey why the issuesare important in terms of factors such asbusiness strategy and impacts. The materialissues that make up the core content of thecompany’s reporting also provide theframework for the company to report itsperformance supported by relevantquantitative and qualitative indicatorsappropriate to each key issue as described inStep 4 and in Sections 4–6.
IPIECA • API • IOGP
20
Sect
ion
2 T
he r
epor
ting
proc
ess:
how
to
repo
rt
21
OIL AND GAS INDUSTRY GUIDANCE ON VOLUNTARY SUSTAINABILITY REPORTING
Section 2 The reporting process: how
to report
Step 4: Select indicators and collect data
INDICATOR SELECTION
Identification of a company’s material issuesfor reporting should inform the selection ofindicators. Section 3 of the Guidanceintroduces 12 ‘issue categories’ that are likelyto be relevant to many oil and gas companiesfor reporting, along with 34 ‘performanceindicators’ for use by companies, asappropriate, to demonstrate how the issuesare being addressed. While companies areencouraged to report in accordance withthese defined indicators, to enhancecomparability across the oil and gas sector,companies may also customize indicators ordevelop additional measures to improvereporting on key issues. Focused engagementwith internal and external stakeholders prior toreporting can provide useful early feedback onindicator selection.
Below are some factors to consider whenselecting indicators:
l Indicators for long-term issues need to bereported consistently every year, particularlyto track trends in performance againstcontinuous improvement objectives and toprovide comparability within and betweencompanies.
l Other issues may have emerged orincreased in importance over a short period.The company may decide to supplementpreviously used indicators with newmeasures to improve disclosures on itsassociated performance.
l In some instances, a significant or complexissue will relate to more than one of theissue categories, for instance with social,economic, health, safety and environmentaldimensions, and involve reporting against avariety of different indicators. Step 5provides two examples of reporting on thesetypes of issues—Research and technology,and Impacts on communities.
DATA COLLECTION
Having selected indicators, the next stage is todetermine what quantitative data andqualitative information will be collected withinthe company. The prominence that thecompany decides to give a material issue in itsreport will help to guide the depth and breadthof data or information collected. For eachindicator provided in Sections 4–6, a choice of‘reporting elements’ is provided that may beapplicable to the company’s operations, andwhich define the types of information or datathat can be collected:
l Common reporting elements provideperformance measures that are wellestablished across the industry and are agood starting point for new reporters or forthose seeking comparability.
l Supplemental reporting elements providealternate or additional choices of measuresthat provide more depth or differentapproaches.
l Other reporting elements provide furtherreporting options through less-establishedcomplementary measures, or emergingpractices.
Having defined and determined the quantitativedata and qualitative information to be collected,the company should request the data internally,supported by appropriate guidance anddefinitions. Requests for information should betimely: business and operational organizationsand functions need a reasonable opportunity tocollect data and verify its accuracy. Oncereceived, data can be consolidated on a
corporate basis and reviewed for completenesswithin the ‘reporting boundary’. (For detailedguidance on the reporting boundary and ondata management, such as establishingbaselines, see Section 3 and Appendix A.)
Figure 7 illustrates the practical application ofSteps 3 and 4.
�
�
�
�
�
�
%� ��� � �������������������������".�.�� ������������������� ����������������� ������������ ������ #.
%� ��� � ���� ��������������".�.�������������������������������������������� ��������+�+/'���������� ������� #.
�������������������!��� ������������� � �����������0���������������������������/����������������������������������.
1������������� ����������������� ������������;� ����������������������������$ ������������������ ������������������� �������� �.
1��������������� ���������� ����������������������������������������� ���������������������� �������������������������������������������������������������(����.
'���������������<�������������������<������������/����������������������������������!������������� ��������������������������������������������� .
The selection of issues and indicators for reporting is informed by Steps 3 and 4 of the reporting process.
This example flow chart provides a practical illustration of applying these two steps.
Figure 7 Issue materiality and selection of reporting indicators
* If the indicator choice within the Guidance is not suitable, use other recognized guidance or develop in-house measures.
IPIECA • API • IOGP
22
Sect
ion
2 T
he r
epor
ting
proc
ess:
how
to
repo
rt
23
OIL AND GAS INDUSTRY GUIDANCE ON VOLUNTARY SUSTAINABILITY REPORTING
Step 5: Analyse data and incorporate into narrative
Section 2 The reporting process: how
to report
A sustainability report aims to demonstrate,through quantitative and qualitative evidence,that a company is systematically appraising andresponsibly managing its sustainabilityperformance. A major step in the reportingprocess is to analyse the indicator data andincorporate the results into a narrative thatdescribes performance progress within thecontext of the sustainability issues.
PUTTING RESULTS INTO CONTEXT
Providing context through narrative requires acompany to think strategically about how itcommunicates material issues and relevantindicator data. A report can help to explain thesignificance of a company’s performance byclarifying:
l how the results are relevant to thecompany’s operations;
l their significance in the context of historic orrecent trends and/or in relation to priorexpectations of performance, such ascontinuous improvement objectives;
l the nature of impacts on relevantstakeholders;
l the opinions of stakeholders or othercredible third parties on those impacts;
l the effect of existing strategy andmanagement on results;
l how the results may compare to relevantindustry benchmarks or averages; and
l strategic responses, goals or lessons learned.
The example on Research and technology, onpage 24, illustrates incorporation of indicatordata into narrative where it is important toprovide context for a strategic issue.
EXPLAIN PROGRESS AGAINST GOALS
Supported by the indicator information anddata, the narrative can plot progress againstthe company’s plans to achieve it’s goals,together with explanations for variations inrelated performance. Continuous improvementis a cornerstone of management systems andis generally based on a cycle of planning,implementing, measurement (using indicators)and assessment, which results in regularlyupdated improvement plans at the local level.Objectives, targets and other information canbe reported to demonstrate progress, forexample:
l quantitative targets based on outcomes,such as reduction of emissions or incidents;
l quantitative or qualitative objectives in termsof inputs, such as completion ofmanagement system initiatives by a planneddate;
l annual progress measured against acommitment to continuous improvement; or
l case studies providing evidence ofprogrammes planned across a specifiedperiod.
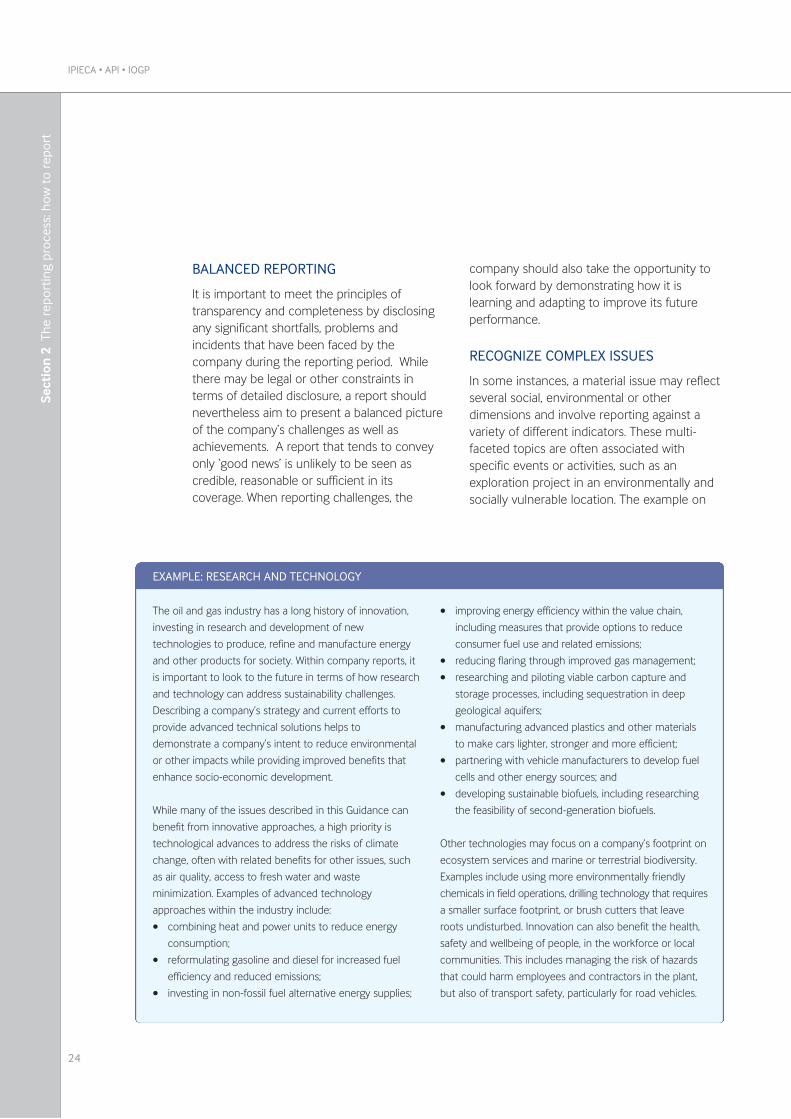
The oil and gas industry has a long history of innovation,
investing in research and development of new
technologies to produce, refine and manufacture energy
and other products for society. Within company reports, it
is important to look to the future in terms of how research
and technology can address sustainability challenges.
Describing a company’s strategy and current efforts to
provide advanced technical solutions helps to
demonstrate a company’s intent to reduce environmental
or other impacts while providing improved benefits that
enhance socio-economic development.
While many of the issues described in this Guidance can
benefit from innovative approaches, a high priority is
technological advances to address the risks of climate
change, often with related benefits for other issues, such
as air quality, access to fresh water and waste
minimization. Examples of advanced technology
approaches within the industry include:
• combining heat and power units to reduce energy
consumption;
• reformulating gasoline and diesel for increased fuel
efficiency and reduced emissions;
• investing in non-fossil fuel alternative energy supplies;
• improving energy efficiency within the value chain,
including measures that provide options to reduce
consumer fuel use and related emissions;
• reducing flaring through improved gas management;
• researching and piloting viable carbon capture and
storage processes, including sequestration in deep
geological aquifers;
• manufacturing advanced plastics and other materials
to make cars lighter, stronger and more efficient;
• partnering with vehicle manufacturers to develop fuel
cells and other energy sources; and
• developing sustainable biofuels, including researching
the feasibility of second-generation biofuels.
Other technologies may focus on a company’s footprint on
ecosystem services and marine or terrestrial biodiversity.
Examples include using more environmentally friendly
chemicals in field operations, drilling technology that requires
a smaller surface footprint, or brush cutters that leave
roots undisturbed. Innovation can also benefit the health,
safety and wellbeing of people, in the workforce or local
communities. This includes managing the risk of hazards
that could harm employees and contractors in the plant,
but also of transport safety, particularly for road vehicles.
EXAMPLE: RESEARCH AND TECHNOLOGY
IPIECA • API • IOGP
24
Sect
ion
2 T
he r
epor
ting
proc
ess:
how
to
repo
rt
BALANCED REPORTING
It is important to meet the principles oftransparency and completeness by disclosingany significant shortfalls, problems andincidents that have been faced by thecompany during the reporting period. Whilethere may be legal or other constraints interms of detailed disclosure, a report shouldnevertheless aim to present a balanced pictureof the company’s challenges as well asachievements. A report that tends to conveyonly ‘good news’ is unlikely to be seen ascredible, reasonable or sufficient in itscoverage. When reporting challenges, the
company should also take the opportunity tolook forward by demonstrating how it islearning and adapting to improve its futureperformance.
RECOGNIZE COMPLEX ISSUES
In some instances, a material issue may reflectseveral social, environmental or otherdimensions and involve reporting against avariety of different indicators. These multi-faceted topics are often associated withspecific events or activities, such as anexploration project in an environmentally andsocially vulnerable location. The example on
25
OIL AND GAS INDUSTRY GUIDANCE ON VOLUNTARY SUSTAINABILITY REPORTING
Section 2 The reporting process: how
to report
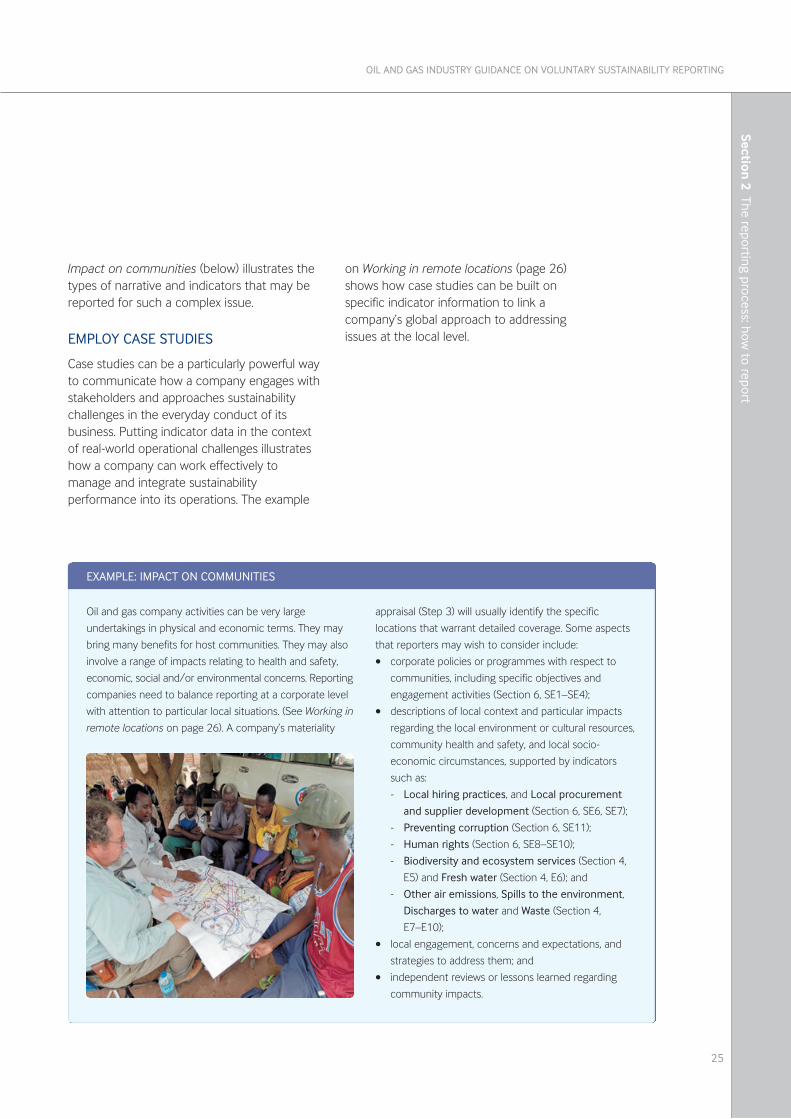
Oil and gas company activities can be very large
undertakings in physical and economic terms. They may
bring many benefits for host communities. They may also
involve a range of impacts relating to health and safety,
economic, social and/or environmental concerns. Reporting
companies need to balance reporting at a corporate level
with attention to particular local situations. (See Working in
remote locations on page 26). A company’s materiality
appraisal (Step 3) will usually identify the specific
locations that warrant detailed coverage. Some aspects
that reporters may wish to consider include:
• corporate policies or programmes with respect to
communities, including specific objectives and
engagement activities (Section 6, SE1–SE4);
• descriptions of local context and particular impacts
regarding the local environment or cultural resources,
community health and safety, and local socio-
economic circumstances, supported by indicators
such as:
- Local hiring practices, and Local procurement
and supplier development (Section 6, SE6, SE7);
- Preventing corruption (Section 6, SE11);
- Human rights (Section 6, SE8–SE10);
- Biodiversity and ecosystem services (Section 4,
E5) and Fresh water (Section 4, E6); and
- Other air emissions, Spills to the environment,
Discharges to water and Waste (Section 4,
E7–E10);
• local engagement, concerns and expectations, and
strategies to address them; and
• independent reviews or lessons learned regarding
community impacts.
EXAMPLE: IMPACT ON COMMUNITIES
Impact on communities (below) illustrates thetypes of narrative and indicators that may bereported for such a complex issue.
EMPLOY CASE STUDIES
Case studies can be a particularly powerful wayto communicate how a company engages withstakeholders and approaches sustainabilitychallenges in the everyday conduct of itsbusiness. Putting indicator data in the contextof real-world operational challenges illustrateshow a company can work effectively tomanage and integrate sustainabilityperformance into its operations. The example
on Working in remote locations (page 26)shows how case studies can be built onspecific indicator information to link acompany’s global approach to addressingissues at the local level.
Table 1 Typical financial and operatinginformation data
INCORPORATING FINANCIAL DATA
Another useful approach is to incorporateselected financial and operating information toprovide business context when reporting onsustainability issues. Typically these data arealready publicly available and should be drawnfrom a company’s annual financial report toensure consistency. In a sustainability report,basic financial and operating information—seeTable 1 for suggested items—can appear ashighlights or in a summary data table. Althoughfinancial data are generally reported at theglobal level, it can help to report selectedinformation at a national or regional level.Companies should also consider reporting anylarge acquisitions or divestments in thereporting year if the changes materially affectthe size and scale of the company.
EXAMPLE: WORKING IN REMOTE LOCATIONS
The oil industry increasingly works in remote
locations, often in developing countries or in sensitive
environments. In such areas of the world,
sustainability issues can be particularly important
and care must be taken to respect ecosystem
services and the rights of local communities or
indigenous people. The materiality of issues in such
circumstances can be significant for stakeholders at
a local level. In such cases it is more appropriate to
develop narrative using a case study that
demonstrates how corporate strategy and values
are applied to the specific circumstances in the
remote location. For example, a case study to
describe activities in a location where there are risks
of impacting freshwater availability and affecting
community relationships might provide:
• the strategy behind the company’s activities and
an overview of the sustainability risks for the
remote location;
• the high-level corporate strategy for operating in
water-stressed regions, and company
approaches to managing community impacts
and engagement, supported by indicators
(Section 4, E6 and Section 6, SE1);
• an explanation of the local water-stress risks,
management plans and progress to minimize
the environmental impact of fresh water used by
the operations;
• a description of the successes, challenges and
outcomes of the local community engagement
(Section 6, SE1), stating any future
commitments made by the company; and
• stakeholder or expert third-party opinion and/or
data that provides additional perspective.
l Total revenues
l Operating expenses
l Total taxes paid
l Profit after tax
l Capital expenditure
l Number of employees
l Number of countries of operation
l Total production (upstream)
l Total throughput (downstream)
IPIECA • API • IOGP
26
Sect
ion
2 T
he r
epor
ting
proc
ess:
how
to
repo
rt
27
OIL AND GAS INDUSTRY GUIDANCE ON VOLUNTARY SUSTAINABILITY REPORTING
Section 2 The reporting process: how
to report
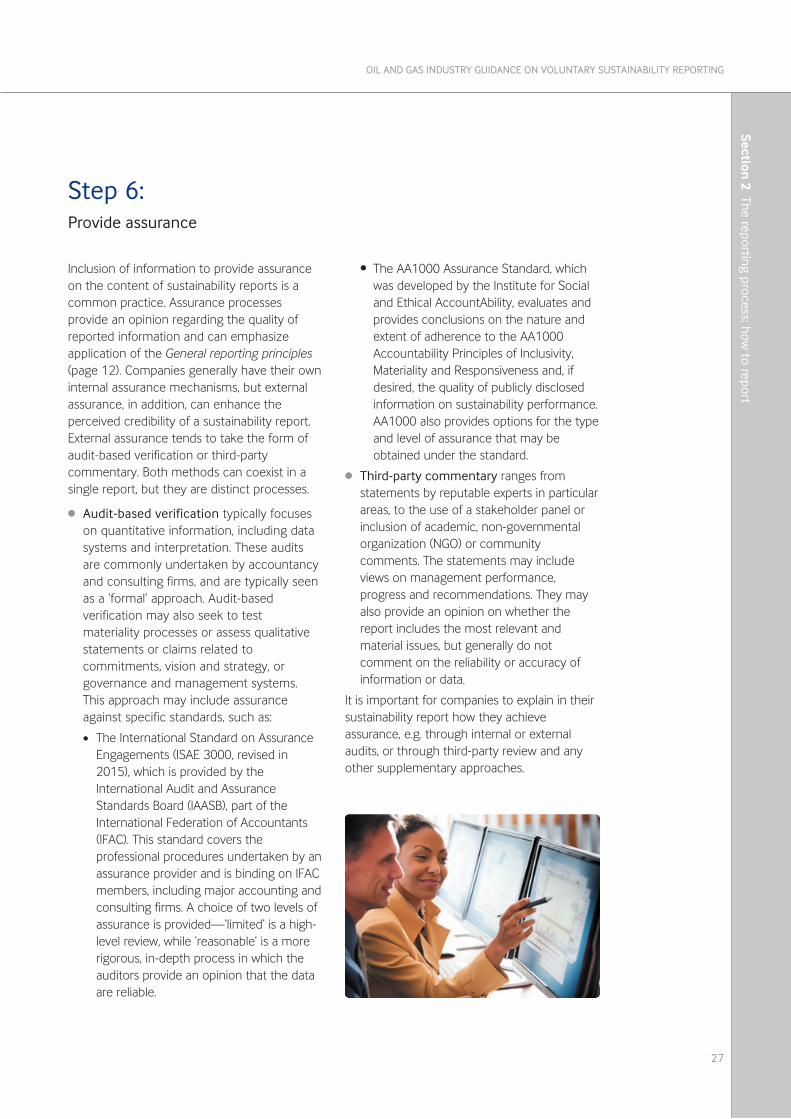
Inclusion of information to provide assuranceon the content of sustainability reports is acommon practice. Assurance processesprovide an opinion regarding the quality ofreported information and can emphasizeapplication of the General reporting principles(page 12). Companies generally have their owninternal assurance mechanisms, but externalassurance, in addition, can enhance theperceived credibility of a sustainability report.External assurance tends to take the form ofaudit-based verification or third-partycommentary. Both methods can coexist in asingle report, but they are distinct processes.
l Audit-based verification typically focuseson quantitative information, including datasystems and interpretation. These auditsare commonly undertaken by accountancyand consulting firms, and are typically seenas a ‘formal’ approach. Audit-basedverification may also seek to testmateriality processes or assess qualitativestatements or claims related tocommitments, vision and strategy, orgovernance and management systems.This approach may include assuranceagainst specific standards, such as:
• The International Standard on AssuranceEngagements (ISAE 3000, revised in2015), which is provided by theInternational Audit and AssuranceStandards Board (IAASB), part of theInternational Federation of Accountants(IFAC). This standard covers theprofessional procedures undertaken by anassurance provider and is binding on IFACmembers, including major accounting andconsulting firms. A choice of two levels ofassurance is provided—‘limited’ is a high-level review, while ‘reasonable’ is a morerigorous, in-depth process in which theauditors provide an opinion that the dataare reliable.
• The AA1000 Assurance Standard, whichwas developed by the Institute for Socialand Ethical AccountAbility, evaluates andprovides conclusions on the nature andextent of adherence to the AA1000Accountability Principles of Inclusivity,Materiality and Responsiveness and, ifdesired, the quality of publicly disclosedinformation on sustainability performance.AA1000 also provides options for the typeand level of assurance that may beobtained under the standard.
l Third-party commentary ranges fromstatements by reputable experts in particularareas, to the use of a stakeholder panel orinclusion of academic, non-governmentalorganization (NGO) or communitycomments. The statements may includeviews on management performance,progress and recommendations. They mayalso provide an opinion on whether thereport includes the most relevant andmaterial issues, but generally do notcomment on the reliability or accuracy ofinformation or data.
It is important for companies to explain in theirsustainability report how they achieveassurance, e.g. through internal or externalaudits, or through third-party review and anyother supplementary approaches.
Step 6:Provide assurance

This page intentionally left blank
Sect
ion
2: T
he
repo
rtin
g pr
oces
s
29
OIL AND GAS INDUSTRY GUIDANCE ON VOLUNTARY SUSTAINABILITY REPORTING
Section 3
Issues and indicators:what to report
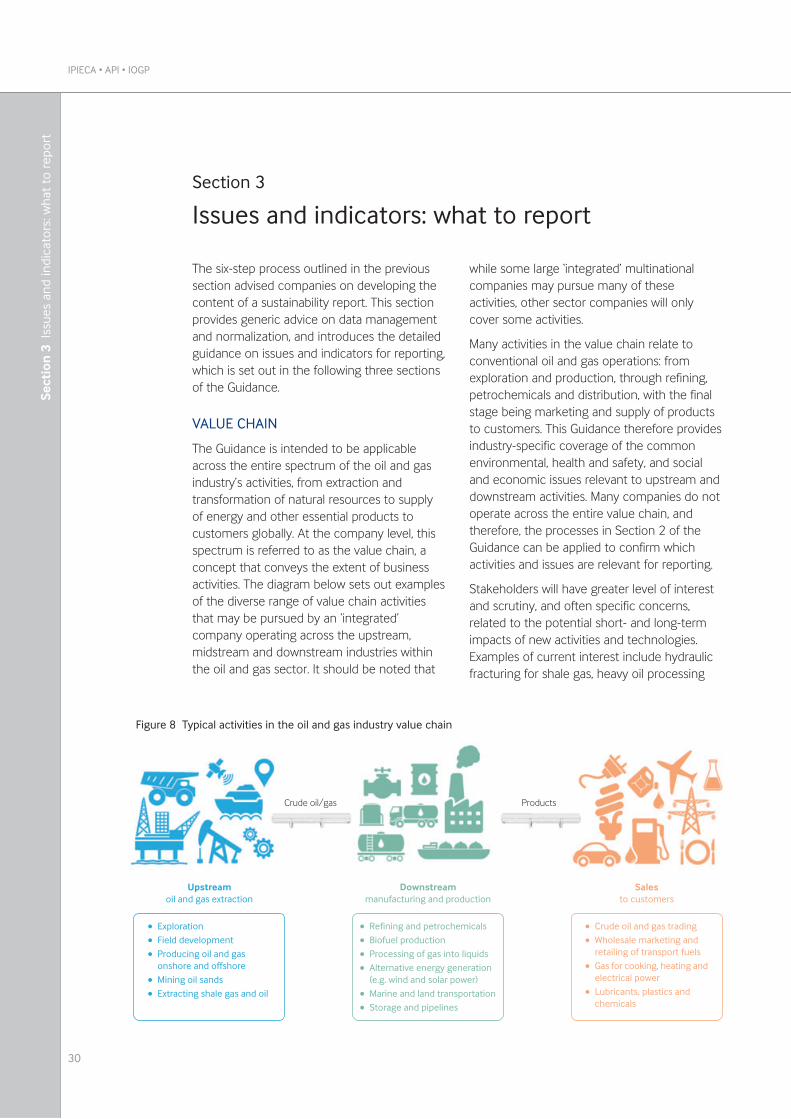
The six-step process outlined in the previoussection advised companies on developing thecontent of a sustainability report. This sectionprovides generic advice on data managementand normalization, and introduces the detailedguidance on issues and indicators for reporting,which is set out in the following three sectionsof the Guidance.
VALUE CHAIN
The Guidance is intended to be applicableacross the entire spectrum of the oil and gasindustry’s activities, from extraction andtransformation of natural resources to supplyof energy and other essential products tocustomers globally. At the company level, thisspectrum is referred to as the value chain, aconcept that conveys the extent of businessactivities. The diagram below sets out examplesof the diverse range of value chain activitiesthat may be pursued by an ‘integrated’company operating across the upstream,midstream and downstream industries withinthe oil and gas sector. It should be noted that
while some large ‘integrated’ multinationalcompanies may pursue many of theseactivities, other sector companies will onlycover some activities.
Many activities in the value chain relate toconventional oil and gas operations: fromexploration and production, through refining,petrochemicals and distribution, with the finalstage being marketing and supply of productsto customers. This Guidance therefore providesindustry-specific coverage of the commonenvironmental, health and safety, and socialand economic issues relevant to upstream anddownstream activities. Many companies do notoperate across the entire value chain, andtherefore, the processes in Section 2 of theGuidance can be applied to confirm whichactivities and issues are relevant for reporting.
Stakeholders will have greater level of interestand scrutiny, and often specific concerns,related to the potential short- and long-termimpacts of new activities and technologies.Examples of current interest include hydraulicfracturing for shale gas, heavy oil processing
IPIECA • API • IOGP
30
Section 3
Issues and indicators: what to report
Sect
ion
3 I
ssue
s an
d in
dica
tors
: wha
t to
rep
ort
'�������2� �������
�������������������.�������
� �.��������� 5���������������� (�����������������
����������//����� &����������� �.����������������������
�������������/��������������������
� ��/��������������������� =��/�������������� (��������/����������<���� $������������������������
>�?�?� ������������� ��@� &������������������������ 1�����������������
���������������
� ����������������������� ��������������������
����������/���������/���� A��/��������� ����������
������������� ��� ��!����� ����������
��������
Figure 8 Typical activities in the oil and gas industry value chain
including oil sands, and biofuels productionfrom plant materials. While the issues andindicators in the Guidance are sufficientlygeneral to cover emerging activities and issuesin the oil and gas industry, companies engagingwith stakeholders on their materialityassessments may conclude that such issuesneed to have higher priority and prominence,even when the activities do not yet represent asignificant proportion of their business.
LIFE-CYCLE CONSIDERATIONS
Companies should consider life-cycle benefitsand impacts related to their activities andproducts through the value chain. A company’sactivities at a single location may span four ormore decades starting with access and earlyexploration for oil and gas, through facilitydevelopment and production/manufacturingoperations, until eventually operations ceaseand the facilities are decommissioned. Acompany’s products also go through a life cycleof benefits and impacts. For example, a ‘wells towheels’ concept can be applied to transportfuels to examine the climate change and otherenvironmental risks of a single product such asgasoline within the entire value chain. A life-cycle approach, including information from alife-cycle analysis, can help to ensure that areport is complete in terms of the issuescovered, and also influence materialityconsiderations in prioritizing issues within thereporting cycle. In this third edition of theGuidance, an additional local environmentalimpacts indicator on Decommissioning (E11)has been included to increase coverage of life-cycle aspects in reports.
OVERVIEW OF ISSUES AND INDICATORS
Sections 4, 5 and 6 introduce sustainabilityissue and indicator ‘categories’ relevant to theoil and gas industry—environmental; healthand safety; and social and economic—asshown in Table 2 on page 32. Each category
was represented by a technical working groupof industry experts (i.e. representatives from oiland gas companies and associations). Theseindividuals brought together years ofexperience on development of sustainability-related metrics. The selection of issues andindicators was a consensus process using theknowledge of the working groups and inputfrom stakeholders inside and outside theindustry, including the Stakeholder Panel.
Collectively, the three categories cover 12sustainability issues that are prevalent for theoil and gas industry and are therefore likely tobe material for reporting by many oil and gascompanies. Section 2 outlined a materialityprocess that helps determine which issues arerelevant to an individual company and itsstakeholders. A company may decide thatseveral or all of the issues in Table 2 arematerial for reporting, and may also identifyadditional material issues or sub-issues whichare not covered in this Guidance but arespecific to the company’s activities oroperational locations.
Sections 4, 5 and 6 also introduce the 34performance indicators, using definitions thatare specific to this Guidance and the oil andgas industry. Table 2 on page 32 shows how theindicators have been grouped within the 12issues. For ease of use, each indicator isassociated with an issue, and is presented usinga standard indicator template which is providedat the end of this section. Any one performanceindicator may provide information relevant toseveral issues, and some indicators may relate toall three categories. Users of the Guidance shouldkeep in mind the potential for any indicator tobe relevant to several issues simultaneously.
Within the subsequent sections, the Guidanceprovides an introduction to each issue to helpcompanies construct their report narrative.Where overlaps exist between the issues,companies may choose to combine aspectsunder a single inclusive narrative.
31
OIL AND GAS INDUSTRY GUIDANCE ON VOLUNTARY SUSTAINABILITY REPORTING
Section 3 Issues and indicators: w
hat to report
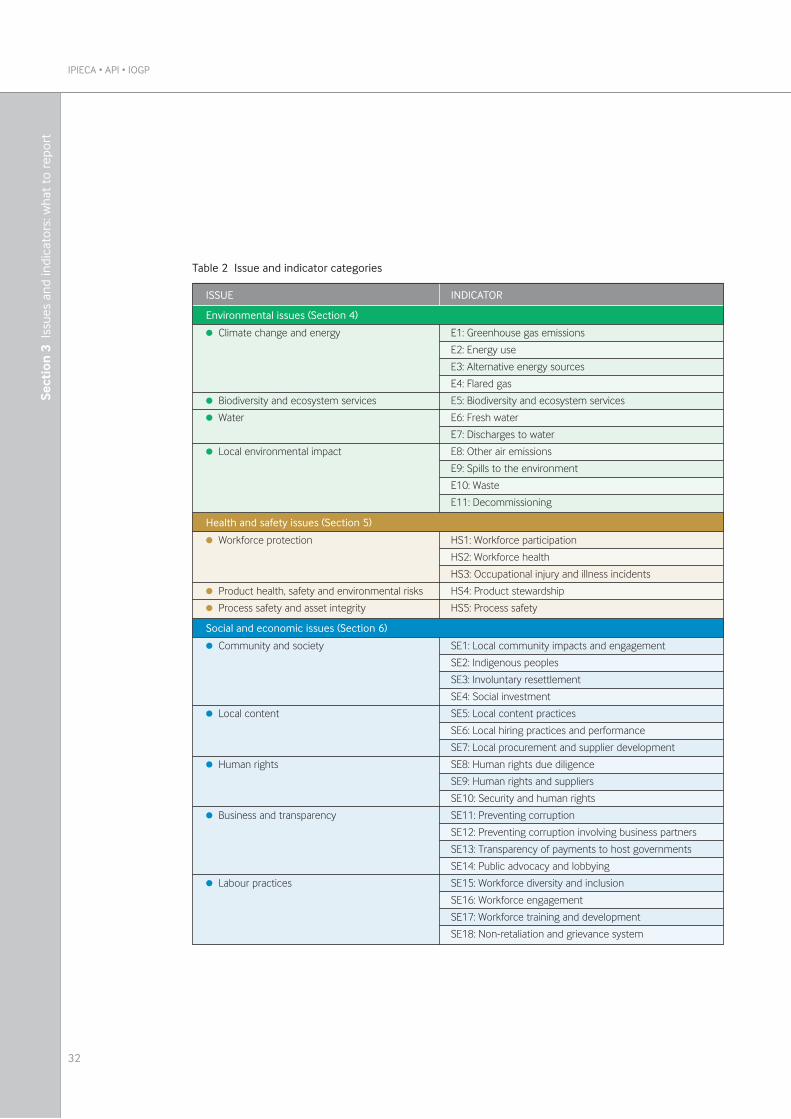
IPIECA • API • IOGP
32
Sect
ion
3 I
ssue
s an
d in
dica
tors
: wha
t to
rep
ort
Table 2 Issue and indicator categories
ISSUE INDICATOR
l Climate change and energy
l Biodiversity and ecosystem services
l Water
l Local environmental impact
E1: Greenhouse gas emissions
E2: Energy use
E3: Alternative energy sources
E4: Flared gas
E5: Biodiversity and ecosystem services
E6: Fresh water
E7: Discharges to water
E8: Other air emissions
E9: Spills to the environment
E10: Waste
E11: Decommissioning
Health and safety issues (Section 5)
l Workforce protection
l Product health, safety and environmental risks
l Process safety and asset integrity
HS1: Workforce participation
HS2: Workforce health
HS3: Occupational injury and illness incidents
HS4: Product stewardship
HS5: Process safety
Social and economic issues (Section 6)
l Community and society
l Local content
l Human rights
l Business and transparency
l Labour practices
SE1: Local community impacts and engagement
SE2: Indigenous peoples
SE3: Involuntary resettlement
SE4: Social investment
SE5: Local content practices
SE6: Local hiring practices and performance
SE7: Local procurement and supplier development
SE8: Human rights due diligence
SE9: Human rights and suppliers
SE10: Security and human rights
SE11: Preventing corruption
SE12: Preventing corruption involving business partners
SE13: Transparency of payments to host governments
SE14: Public advocacy and lobbying
SE15: Workforce diversity and inclusion
SE16: Workforce engagement
SE17: Workforce training and development
SE18: Non-retaliation and grievance system
Environmental issues (Section 4)
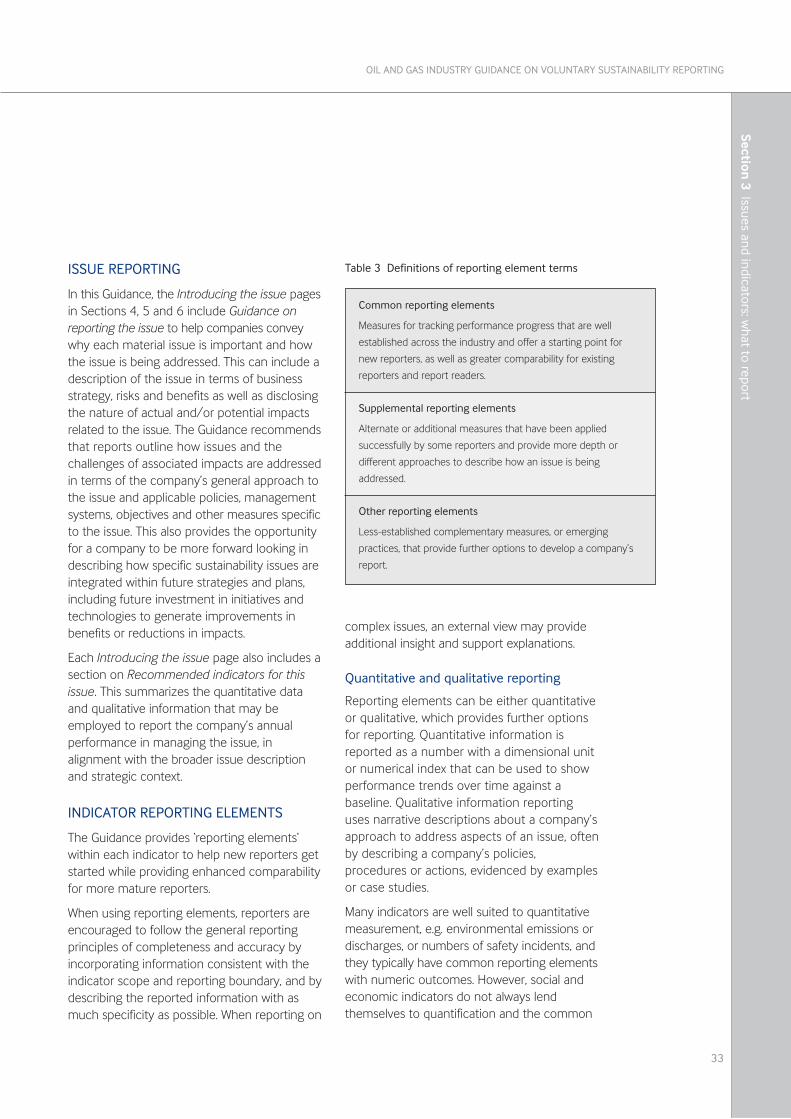
ISSUE REPORTING
In this Guidance, the Introducing the issue pagesin Sections 4, 5 and 6 include Guidance onreporting the issue to help companies conveywhy each material issue is important and howthe issue is being addressed. This can include adescription of the issue in terms of businessstrategy, risks and benefits as well as disclosingthe nature of actual and/or potential impactsrelated to the issue. The Guidance recommendsthat reports outline how issues and thechallenges of associated impacts are addressedin terms of the company’s general approach tothe issue and applicable policies, managementsystems, objectives and other measures specificto the issue. This also provides the opportunityfor a company to be more forward looking indescribing how specific sustainability issues areintegrated within future strategies and plans,including future investment in initiatives andtechnologies to generate improvements inbenefits or reductions in impacts.
Each Introducing the issue page also includes asection on Recommended indicators for thisissue. This summarizes the quantitative dataand qualitative information that may beemployed to report the company’s annualperformance in managing the issue, inalignment with the broader issue descriptionand strategic context.
INDICATOR REPORTING ELEMENTS
The Guidance provides ‘reporting elements’within each indicator to help new reporters getstarted while providing enhanced comparabilityfor more mature reporters.
When using reporting elements, reporters areencouraged to follow the general reportingprinciples of completeness and accuracy byincorporating information consistent with theindicator scope and reporting boundary, and bydescribing the reported information with asmuch specificity as possible. When reporting on
complex issues, an external view may provideadditional insight and support explanations.
Quantitative and qualitative reporting
Reporting elements can be either quantitativeor qualitative, which provides further optionsfor reporting. Quantitative information isreported as a number with a dimensional unitor numerical index that can be used to showperformance trends over time against abaseline. Qualitative information reportinguses narrative descriptions about a company’sapproach to address aspects of an issue, oftenby describing a company’s policies,procedures or actions, evidenced by examplesor case studies.
Many indicators are well suited to quantitativemeasurement, e.g. environmental emissions ordischarges, or numbers of safety incidents, andthey typically have common reporting elementswith numeric outcomes. However, social andeconomic indicators do not always lendthemselves to quantification and the common
33
OIL AND GAS INDUSTRY GUIDANCE ON VOLUNTARY SUSTAINABILITY REPORTING
Section 3 Issues and indicators: w
hat to report
Table 3 Definitions of reporting element terms
Common reporting elements
Measures for tracking performance progress that are well
established across the industry and offer a starting point for
new reporters, as well as greater comparability for existing
reporters and report readers.
Supplemental reporting elements
Alternate or additional measures that have been applied
successfully by some reporters and provide more depth or
different approaches to describe how an issue is being
addressed.
Other reporting elements
Less-established complementary measures, or emerging
practices, that provide further options to develop a company’s
report.
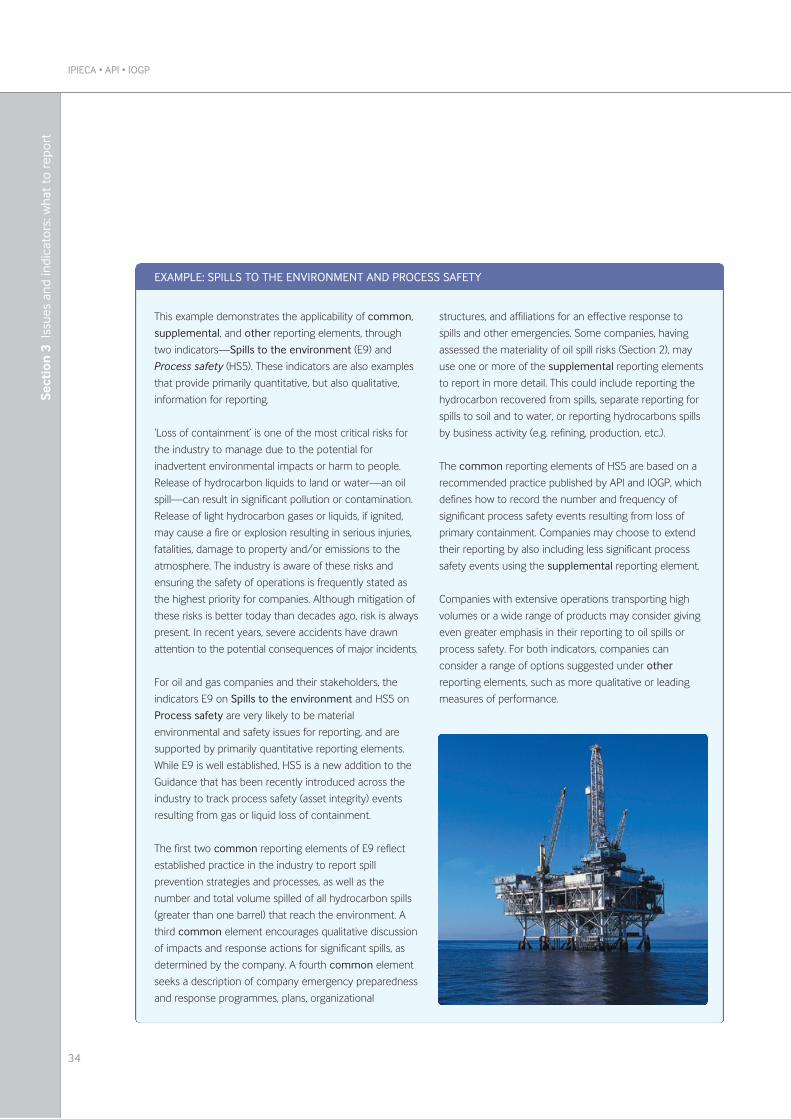
IPIECA • API • IOGP
34
Sect
ion
3 I
ssue
s an
d in
dica
tors
: wha
t to
rep
ort
This example demonstrates the applicability of common,
supplemental, and other reporting elements, through
two indicators—Spills to the environment (E9) and
Process safety (HS5). These indicators are also examples
that provide primarily quantitative, but also qualitative,
information for reporting.
‘Loss of containment’ is one of the most critical risks for
the industry to manage due to the potential for
inadvertent environmental impacts or harm to people.
Release of hydrocarbon liquids to land or water—an oil
spill—can result in significant pollution or contamination.
Release of light hydrocarbon gases or liquids, if ignited,
may cause a fire or explosion resulting in serious injuries,
fatalities, damage to property and/or emissions to the
atmosphere. The industry is aware of these risks and
ensuring the safety of operations is frequently stated as
the highest priority for companies. Although mitigation of
these risks is better today than decades ago, risk is always
present. In recent years, severe accidents have drawn
attention to the potential consequences of major incidents.
For oil and gas companies and their stakeholders, the
indicators E9 on Spills to the environment and HS5 on
Process safety are very likely to be material
environmental and safety issues for reporting, and are
supported by primarily quantitative reporting elements.
While E9 is well established, HS5 is a new addition to the
Guidance that has been recently introduced across the
industry to track process safety (asset integrity) events
resulting from gas or liquid loss of containment.
The first two common reporting elements of E9 reflect
established practice in the industry to report spill
prevention strategies and processes, as well as the
number and total volume spilled of all hydrocarbon spills
(greater than one barrel) that reach the environment. A
third common element encourages qualitative discussion
of impacts and response actions for significant spills, as
determined by the company. A fourth common element
seeks a description of company emergency preparedness
and response programmes, plans, organizational
structures, and affiliations for an effective response to
spills and other emergencies. Some companies, having
assessed the materiality of oil spill risks (Section 2), may
use one or more of the supplemental reporting elements
to report in more detail. This could include reporting the
hydrocarbon recovered from spills, separate reporting for
spills to soil and to water, or reporting hydrocarbons spills
by business activity (e.g. refining, production, etc.).
The common reporting elements of HS5 are based on a
recommended practice published by API and IOGP, which
defines how to record the number and frequency of
significant process safety events resulting from loss of
primary containment. Companies may choose to extend
their reporting by also including less significant process
safety events using the supplemental reporting element.
Companies with extensive operations transporting high
volumes or a wide range of products may consider giving
even greater emphasis in their reporting to oil spills or
process safety. For both indicators, companies can
consider a range of options suggested under other
reporting elements, such as more qualitative or leading
measures of performance.
EXAMPLE: SPILLS TO THE ENVIRONMENT AND PROCESS SAFETY
reporting elements are generally qualitative.Often indicators have both quantitative andqualitative elements, offering flexibility toreporters, which can be helpful when informationmay be more meaningful at a local or nationallevel (rather than at the global, corporate-widelevel on which most reports are constructed).The example on Spills to the environment andProcess safety on page 34 illustrates oneapplication of the reporting elements.
A company may initially apply a quantitativeindicator in a more qualitative fashion, based onthe maturity of the company’s data collectionprocess. For instance, companies may start outby describing operational performance throughthe use of anecdotal examples, local casestudies or limited data gathered for a subset ofoperations. In time, these anecdotaldescriptions may converge into a morecomplete, objective and quantitative index formeasuring performance or assessing impacts.
DATA MANAGEMENT
In selecting relevant indicators, companiesshould pay attention to the followingchallenges in data collection and management:
l Reporting boundaries: having selected anappropriate set of indicators and reportingelements, consistency in collecting quantitativeor qualitative data for inclusion in the reportis important. Clear definitions of what aspectsof the company’s holdings and operationsare to be included or excluded from thedata collection need to be established.These definitions are normally referred to asthe company’s ‘reporting boundaries’. Thesemay differ for different indicators but shouldbe consistent from year to year andbetween the organizational units of thecompany. Defining the reporting boundary isan important consideration. An indicator’sscope may often require data from a complexrange of organizational entities engaged indifferent commercial arrangements, such as
joint ventures. Normalization of quantitativedata requires consistency between theindicator data and normalization factor toachieve comparability over time. (See Datanormalization on page 36).
In Sections 4, 5 and 6 of the Guidance,boundary-related information is included inthe Scope section for each indicator.However, companies are encouraged todefine and document an overall boundaryfor collecting sustainability data.
A number of protocols exist for settingboundaries. For example, both IPIECA andGRI have protocols for GHG emissions, andIOGP has specific practices for upstreamreporting of safety and environmental data.Appendix A sets out a three-step processintended to help companies define practicalboundaries for their sustainability reporting.This process promotes consistency withinreports, supports comparability betweencompanies and facilitates inter-companybenchmarking (although benchmarking ofperformance will usually require moreexplicit and detailed standardization ofboundaries for individual indicators).
l Establishing baselines: many companiesestablish baselines to maintain dataconsistency and to track performance overtime. This facilitates internal performancemonitoring and decision making and helpsdemonstrate progress towards goals from adesignated starting point or base year. Theselection of a reference year should takeinto account the quality of historical dataand the frequency and/or significance ofunusual events. When a company acquiresor divests assets, resulting discontinuities indata can make performance trends difficultto interpret. In such cases, incorporatingbaseline adjustments would help the reportreader in understanding the data. Suchadjustments need to be clearly documentedand communicated to ensure transparency.
35
OIL AND GAS INDUSTRY GUIDANCE ON VOLUNTARY SUSTAINABILITY REPORTING
Section 3 Issues and indicators: w
hat to report
l Consistent reporting periods: Reportingcompanies are encouraged to publishreports on a regular schedule. Typically,reporting in the oil and gas sector is annual,based on calendar years.
l Information quality: Reporting companiesare encouraged to describe how quantitativedata and/or qualitative information areproduced using management protocols forcollection and review of information.Companies should provide appropriateinformation on data quality in terms of itssource, how it was assessed and the degreeof confidence in its accuracy.
l Data consolidation: companies can reportperformance data at varying levels ofaggregation, ranging from individual sites orfacilities to national/regional locations andto global coverage for the entirecorporation. Companies should determineaggregation levels for reporting on issuesand, if appropriate, these levels should alsoallow for normalization based on categoriesof business activity, such as those providedin Table 4 on page 37. It is often useful, forexample, to separate upstream (i.e.exploration and production) activities fromdownstream activities. Exploration andproduction activities can be defined byreference to the annual updated IOGPguidance on collection of safety andenvironmental data. Downstream activitiesmay be considered to encompass all otheractivities of the company; however, toenable a more meaningful interpretation ofperformance, it is often necessary toseparate specific downstream activities. (SeeData normalization, below.) Regionalbreakdowns of data can also provideimportant insights on operatingperformance and differences betweencompanies. Appendix A provides guidanceon approaches to data consolidation withrespect to reporting boundaries.
DATA NORMALIZATION
Internal and external users of sustainabilityperformance results are generally interested intwo types of indicator data presentation:
l Absolute quantities are values presented toreflect the full magnitude or size of anoutput, input, value or result. Such valuescan typically be expressed using a physicalunit of measurement related to weight,volume, energy or financial value. In general,absolute quantities can be expressed inunits of measurement that are readilyconvertible. (See Appendix D, Measurementunits and conversion factors.)
l Normalized quantities are relative valuespresented as ratios between two absolutequantities of the same or different kind.Typically, indicator data are the numeratorsof the ratio, and a suitable normalizationfactor is selected as the denominator.Normalized quantities allow comparisons ofindicator data between operations ofdifferent size, and facilitate comparisons ofsimilar products or processes. These ratioshelp compare the performance of onecompany, business unit or organization tothose of another. Normalized indicators canprovide information on the efficiency of anactivity, on the relative intensity of an output(e.g. energy intensity) or on the relativequality of a value or achievement.
Companies report normalized performanceindicators for a number of reasons, including:
l tracking performance over time;
l comparing performance between similarbusiness operations within the company;and
l benchmarking performance with othercompanies.
IPIECA • API • IOGP
36
Sect
ion
3 I
ssue
s an
d in
dica
tors
: wha
t to
rep
ort
Reporting performance based on both absoluteand normalized quantities is good practice andcan provide a more complete and balancedrepresentation of sustainability performanceand progress.
However, it is not always appropriate tonormalize data, especially where there is nowell-defined relationship of scale between theabsolute quantities and the normalizationfactors. Thus, reporting normalized data canpresent a challenge because differentnormalization factors are needed for differentactivities and for different purposes. In general,companies should normalize performanceindicators in ways that align with businessdecision making and in ways that allow clearercommunication of performance tostakeholders; for example by reportingnormalized data separately for oil and gasproduction activities versus refining orpetrochemical operations.
Normalization factors vary based on specificindicators. For example, for safety and healthindicators the absolute quantity of workforceoccupational injuries and illnesses can also bereported as the normalized rates of injuries orillnesses by using the number of hours workedby the workforce as a normalization factor.
Environmental performance indicators aretypically normalized using absolute quantitiesof related outputs (e.g. emissions per unitproduction from a process). Since the relativemagnitude of these outputs can varysubstantially for different oil and gas processesor products, for some key metrics it can behelpful for companies to report normalizedenvironmental data for each business activityseparately, so that performance can be moremeaningfully evaluated. Recommendednormalization factors are provided in Table 4.
37
OIL AND GAS INDUSTRY GUIDANCE ON VOLUNTARY SUSTAINABILITY REPORTING
Section 3 Issues and indicators: w
hat to report
Table 4 Recommended normalization factors for environmental performance data
Oil and gas industry activity
Exploration and production (upstream)
Refining
Transportation and terminals
Pipeline
Marketing (retail)
Marine
Petrochemicals
Normalization factor
Well head production of crude oil, condensates, natural gas liquids and dry gas
(including flared gas and gas used for fuel but excluding gas reinjected into the
reservoir) on an operated basis
Note: equity share GHG emissions may be normalized using net export production
on an equity share basis, as in financial reporting.
Refining throughput of crude oil and other feedstock
Product delivered or terminal throughput
Pipeline throughput
Motor fuel sales
Cargo volume transported
Petrochemicals production
STANDARD ISSUE AND INDICATOR FORMAT
For ease of reference, each issue and indicator described in Sections 4, 5 and 6 is organized usingthe template below:
IPIECA • API • IOGP
38
Sect
ion
3 I
ssue
s an
d in
dica
tors
: wha
t to
rep
ort
For each issue:
l Introduction to the issue: a short description of the issue, including why it may be material forcompanies to report.
l Guidance on reporting the issue: intended to help companies report information onmanagement approach and strategy to address the issue and its related impacts.
l Recommended indicators for the issue: brief overview of the indicators recommended tosupport reporting on the issue.
For each indicator within an issue:
l Description: briefly conveys the overall intent of the indicator, in particular for the commonreporting elements.
l Purpose: provides the reasoning behind the use of the indicator, including its potentialrelevance to a company in the oil and gas industry.
l Scope: describes the indicator and reporting elements in terms of applicability with any relevantqualifying information; a separate list of aspects that are ‘out of scope’ may also be provided.
l Reporting basis: defines measurement units (if applicable), and data consolidation/boundaryconsiderations.
l Definition of terms: offers a short specific glossary that clarifies terms specific to the indicator.
l Reporting elements: numbered (C1, C2, S1, etc.) and summarized in a table:
Common reporting elements (C)
Other reporting elements (O)
Supplemental reporting elements (S)
l Measures for tracking performance progress that
are well established across the industry and offer
a starting point for new reporters, as well as
greater comparability for existing reporters and
report readers.
l Alternate or additional measures that have
been applied successfully by some reporters
and provide options for more depth or different
approaches to describe how a material issue is
being addressed.
l Less-established complementary measures, or emerging practices, that provide further options to
develop a company’s report.
l References: international standards and/or industry guidance on sustainability issues, and helpwith sourcing and compiling data
39
OIL AND GAS INDUSTRY GUIDANCE ON VOLUNTARY SUSTAINABILITY REPORTING
Section 4
Environmental issues and indicators
Sect
ion
4 E
nviro
nmen
tal i
ssue
s an
d in
dica
tors
Environmental issues and indicators
OVERVIEW
The oil and gas industry recognizes that itsoperations have potential impacts on theenvironment. Some of the environmental impactsmay have health, safety, social and/or economicimplications. Companies in the industry generallyhave systematic processes in place to manage andreduce environmental impacts.
This section provides direction on narrative andstrategic reporting on four environmental issueslikely to be material for companies: climate changeand energy, biodiversity and ecosystem services,water and local environmental impact. These fourissues are supported by eleven indicators (see tablebelow) which describe the environmental systems,progress and performance of company operations.
Consolidation and normalization ofenvironmental data
For environmental indicators, a company generallyconsolidates performance data for operated assetsby applying the reporting boundary ‘operationalapproach’, except for greenhouse gas (GHG) emissionswhere both the ‘operational approach’ and the‘equity share approach’ may be applied (Appendix A).
Indicators for spills, emissions, energy use and wastescan be expressed as absolute and/or normalizedquantities. Absolute measures provide information onthe scale of releases at the corporate, regional orlocal level. Normalized quantities facilitatecomparisons among similar operations of differentsizes either over time or between different locations(Section 3). Because of the varying prices of oil andgas, normalization based on the monetary value ofoutputs is not recommended. Instead, environmentaldata should be normalized based on physical outputssuch as production or throughput (Table 4, Section 3).Care is required to account for the differing natureof specific operations. Emissions from oil production,for example, vary depending on the need forenhanced oil recovery techniques and whetherassociated gas produced with the oil is flared orcaptured for sale. Similarly, refining emissionsdepend on the type of crude oil processed and themix of products produced.
One approach to dealing with process and/orfeedstock differences is to normalize data using aweighted measure of production or throughput. Agood example is Solomon Associates’ EquivalentDistillation Capacity, which factors in the complexityof a refinery’s processes.
IPIECA • API • IOGP
40
Section 4
Environmental issues and indicators
Summary of environmental issues and indicators
Issue Indicator Page number
Climate change and energy E1: Greenhouse gas (GHG) emissions 42
E2: Energy use 46
E3: Alternative energy sources 49
E4: Flared gas 51
Biodiversity and ecosystem services E5: Biodiversity and ecosystem services 54
Water E6: Fresh water 59
E7: Discharges to water 63
Local environmental impact E8: Other air emissions 66
E9 Spills to the environment 68
E10: Waste 71
E11: Decommissioning 74
Section 4 Environm
ental issues and indicators
Environmental issues and indicators Climate change and energy
The challenges and risks posed by climate changerequire effective global action, while access toaffordable and reliable energy remains essential foreconomic and social development. Oil and gasproducts will likely account for a high proportion ofglobal energy demand for decades to come. At thesame time, companies have a continuing role to playin improving energy efficiency and in developing newtechnologies to minimize GHG emissions
How the oil and gas industry may be impacted by,and can contribute to addressing, the risks associatedwith climate change is complex. This also reflects aworld with many regional differences in terms ofenvironmental, social, political, technological andeconomic challenges. As such, companies may elect toreport on climate change risks and management withinthe context of their own business and its operations.
GUIDANCE ON REPORTING THE ISSUE
The following list suggests topics for considerationthat a company may wish to include within thenarrative of sustainability reporting2:
1. Climate change positions, policies orprinciples, including corporate views on thesignificance of climate risk, how these risks shouldbe addressed and principles for sound policy.
2. Responsibilities and accountabilities for managingclimate change risks, including the frequency ofreview with executives of the company.
3. Stakeholder engagement approaches throughpublic advocacy and lobbying (Section 6, SE14)with regulators, politicians, consumers, publicpolicy forums and trade associations, as well asother voluntary initiatives.
4. Implications of shifting energy supply/demandand climate policy to company’s asset base,business performance and value, including a viewon the future use of non-hydrocarbon energysources.
5. Corporate risk management approaches and howthese approaches apply to managing climatechange risks—may include commentary oninvestment evaluation and risk managementapproaches such as scenario planning and/or proxycost of carbon usage, and may also include adescription on the approach to ensuring theresilience of facilities and operations to protectagainst the physical impacts of climate change.
6. Emissions mitigation strategies, programmes,initiatives and activities, including commentary onhistorical performance and planned activities to, e.g.improve energy efficiency, reduce flaring, increase useof cogeneration, sequester carbon and/or improvethe efficiency of the use of the company’s products.
7. GHG regulatory compliance approaches,including participation in emission trading schemesand the use of offsets.
8. Research and development activities directedtowards reducing GHG emissions in oil and gassector operations as well as from hydrocarbonderived product use, including company internaland external activities.
9. Historical performance data including GHGemissions, energy use and flared gas.
10. Assurance approach for applicable data covered inclimate sustainability reporting.
RECOMMENDED INDICATORS FOR THIS ISSUE
The four indicators recommended below are commonto many companies. Of these, GHG emissions (E1)metrics are the most widely reported across the oil andgas industry and are based on well-established protocols.Energy use (E2) and Flared gas (E4) metrics areindicators of natural resource use, and are also directlyassociated with GHG emissions; they are also related tolocal environmental impacts (e.g. see E8). Alternativeenergy sources (E3) is an indicator that enablesreporting on company investments in identifying andproviding alternative and/or renewable solutions.
41
OIL AND GAS INDUSTRY GUIDANCE ON VOLUNTARY SUSTAINABILITY REPORTING
Introducing the issue:
Climate change and energy
2 The evolving and complex landscape of climate change reporting has led IPIECA to develop a framework, which supports companies in considering what topics to
report on by covering these 10 areas in greater detail. Released in 2015 as a Pilot, it is intended that this document will be provided as final guidance in 2016.
Sect
ion
4 E
nviro
nmen
tal i
ssue
s an
d in
dica
tors
Environmental issues and indicators Climate change and energy E1: Greenhouse gas emissions
DESCRIPTION
Report quantity of GHG emissions, includingcarbon dioxide and methane, from combustionand other processes.
PURPOSE
Greenhouse gases are generated by mostpetroleum industry operations and contribute toaggregate global atmospheric GHG concentra -tions. This indicator demonstrates how companiestrack and manage their GHG emissions.
SCOPE
The following scope summarizes key aspectsof the IPIECA/API/IOGP Petroleum IndustryGuidelines for Reporting Greenhouse GasEmissions which are recommended foraccounting and voluntary reporting of GHGemissions in the petroleum industry andshould be referred to for detailed guidance onthis indicator.
Oil and gas companies should consider including,if significant, the seven species of greenhousegases listed by the Intergovernmental Panel onClimate Change (IPCC):
l carbon dioxide (CO2);
l methane (CH4);
l nitrous oxide (N2O);
l hydrofluorocarbons (HFCs);
l perfluorocarbons (PFCs);
l sulphur hexafluoride (SF6); and
l nitrogen trifluoride (NF3).
For oil and natural gas operations, CO2 and CH4are usually the most significant components ofGHG emissions. N2O is emitted in very smallquantities from the combustion of fossil fuelsand its GHG contribution may be insignificantcompared to CO2. Depending on thecompany’s operations, the other greenhousegases—HFCs and PFCs used in refrigeration,and SF6 used in electrical equipment andsometimes as a tracer in pipelines—may ormay not make a substantial contributionrelative to the total GHG emissions from acompany’s operations. NF3, added by the IPCC in2013, is normally associated with emissions frommanufacturing in the electronics industry and istherefore not expected to be significant for oiland gas company reporting. For each listed GHGdetermined by the company to be a significantcontributor to total emissions, it is good practiceto report annual emissions in metric tonnesand/or the CO2 equivalent (CO2e) of each GHG,where the CO2e is calculated in accordance withpublished global warming potential (GWP) factors.Note that the preferred source for GWP factorsis the IPCC’s Fourth Assessment Report (2007)3.
GHG emissions from all company businessactivities should be included:
l combustion emissions (e.g. fuel use in gascompression, power generation, heating,coke burn);
l flaring (primarily CO2) and venting (primarilyCH4);
l process emissions (e.g. vessel loading, tankstorage and flushing, glycol dehydration,sulphur recovery units, hydrogen production);
IPIECA • API • IOGP
42
E1: Greenhouse gas (GHG) emissions
3 The 2010 version of the Guidance recommended use of the GWP factors in the IPCC’s 1995 publication, Second Assessment Report (SAR).
This recommendation has been revised to use of the GWP (100-year time horizon) factors from the IPCC’s 2007 publication, Fourth
Assessment Report (AR4) that, inter alia, increases the GWP for methane from 21 to 25, which is of significance for this indicator. In 2013 the
IPCC issued its Fifth Assessment Report (AR5) with further modifications to GWP factors including methane, for which two revised, alternative,
factors of 28 or 34 are provided, depending on whether carbon-cycle feedbacks are taken into account. Because of this additional complexity,
and because national and international inventories have generally not yet taken into account the GWP factors in AR5, this Guidance
recommends use of the AR4 factors in order to maintain consistency in reporting with prior data and transparency on performance. The
recommendation of which IPCC GWP factors to use for sustainability reporting will continue to be reviewed. It is good practice for companies
to state the source of GWP factors used to report GHG emissions in their reports.
Section 4 Environm
ental issues and indicators
Environmental issues and indicators Climate change and energy E1: Greenhouse gas emissions
l fugitive emissions of GHG gases (includingpiping and equipment leaks); and
l non-routine events (e.g. pipelinemaintenance, gas releases, equipmentmaintenance).
GHG emissions estimates should includesignificant stationary and mobile sources fromcompany business activities. Stationary sourcesshould include equipment at well sites,production facilities, refineries, chemical plants,terminals, fixed site drilling rigs and officebuildings. Mobile sources should include marinevessels transporting products, tank truck fleets,mobile drilling rigs, and moveable equipment atdrilling and production facilities.
The GHG Protocol, a partnership between theWorld Resources Institute and the WorldBusiness Council on Sustainable Development(WRI/WBCSD), classifies GHG emissions aseither Direct or Indirect based on three broad‘scopes’. Scope 1 emissions are defined asDirect GHG emissions resulting from equipmentor other sources owned (partly or wholly)and/or operated by the company. Where anoperation purchases energy alreadytransformed into electricity, heat or steam, theGHGs emitted to produce this energy arereported as Indirect GHG emissions fromimported energy (Scope 2 emissions). Forincreased clarity when reporting direct(Scope 1) GHG emissions, GHG emissionsassociated with energy sold to others can bereported separately as Direct emissions fromexported energy.
Companies may report Other indirect emissions(Scope 3) related to the value chain of theiractivities (see page 30). Of the 15 categories ofScope 3 emissions defined by The GHGProtocol, Use of sold products is the mostrelevant in relation to the oil and gas industry.While there are a variety of methodologies (bothregulated and voluntary) for estimatingconsumer emissions and such data may be
more comprehensively reported bygovernments on a societal basis (e.g. bycountry, region, etc.), companies may provideestimates of emissions related to product use intheir reports. As an alternative, companies mayprovide applicable product volumes (such as oiland gas production, refined products, retailsales, etc.) to enable stakeholders to estimateemissions using their preferred methodology.
The common reporting elements (see page 45)are based on reporting direct GHG emissionsand indirect GHG emissions associated withpurchased energy (Scope 1 and 2); thesupplemental reporting elements allow formore detailed reporting on direct GHGemissions and provide for reporting indirectGHG emissions related to consumer use ofproducts (Scope 3).
Based on current practice, the following are nottypically included by companies in their GHGemissions reporting:
l ozone-depleting gases such aschlorofluorocarbons (CFCs) andhydrochlorofluorocarbons (HCFCs), sincethese are not among the GHG species listedby the IPCC; and
l CO2 sold as product, used for enhanced oilrecovery, or sequestered (e.g. via carboncapture and sequestration).
REPORTING BASIS
Emissions are reported quantitatively at thecompany level as CO2e (reflecting the globalwarming potential of all of the GHG species)and as emissions of the individual gasesexpressed in mass and/or CO2e. Measurementunits are:
l GHG emissions (direct or indirect): metrictonnes CO2 equivalent (where CO2e = thesum of the emissions for each GHG speciesmultiplied by its respective GWP relative toCO2, in metric tonnes); and
43
OIL AND GAS INDUSTRY GUIDANCE ON VOLUNTARY SUSTAINABILITY REPORTING
Sect
ion
4 E
nviro
nmen
tal i
ssue
s an
d in
dica
tors
Environmental issues and indicators Climate change and energy E1: Greenhouse gas emissions
l GHG species (i.e. when reporting individualgases): metric tonnes and/or metric tonnesCO2 equivalent (where CO2e = the productof metric tonnes of the GHG species ofinterest by its GWP relative to CO2).
Companies should also clearly identify thespecific GHG species included in their emissionestimates and the GWP for each species.Companies that choose to report on GHGemissions related to consumer use of oil andgas products (Scope 3) should clarify the typesof product (such as crude oil, gas or otherproduction, fuels and other refinery outputs,direct retail sales, etc.) selected as a basis forthe methodology used to estimate theemissions and also the source of emissionfactors applied, e.g. reports of the IPCC.
Data should be consolidated within thecompany’s reporting boundary using either the
‘operational’ or the ‘equity share’ approach, orboth approaches (Appendix A), and canconsider the alternative ‘financial’ approach.Reporting boundaries and these dataconsolidation approaches are defined anddiscussed in detail in Chapter 3 of theIPIECA/API/IOGP Petroleum Industry Guidelinesfor Reporting Greenhouse Gas Emissions.Companies should clearly state theconsolidation approaches used.
In general, emissions should be reportedannually together with data from past years toshow performance trends. The company maystate a base year against which performanceis being assessed. It is also good practice toindicate the basis for the methodology usedto report Scope 1, 2 or 3 emissions data (e.g.the GHG Protocol, IPIECA/API/IOGP or other).
IPIECA • API • IOGP
44
DEFINITION OF TERMS
• Direct GHG emissions: total GHG emitted from sources at a facility owned (partly or wholly) and/or operated by the
company. Direct GHG emissions correspond to Scope 1 emissions as defined by the GHG Protocol.
• Indirect GHG emissions from imported energy: GHG emissions that occur at the point of energy generation
(owned or operated by a third party) for electricity, heat or steam imported (i.e. purchased) for use on site by the
reporting entity. Indirect GHG emissions from imported energy correspond to Scope 2 emissions as defined by the
GHG Protocol.
• Direct GHG emissions from exported energy: GHG emissions related to production of energy in the form of
electricity, heat or steam exported (i.e. sold) by the reporting entity to a facility owned or operated by a third party.
This is a subset of direct GHG emissions.
• GHG intensity: GHG emissions divided by the appropriate normalization factor for the business segment. This metric
can be useful in comparing performance within a company’s business segments (e.g. within production or within
refining or power generation). See Section 3 for additional information on normalization.
• Direct GHG emissions from cogeneration: GHG emissions related to production of electricity and steam in
cogeneration (simultaneous production of power and useful heat). This subset of direct GHG emissions typically
results in a reduction of GHG emissions from a public utility.
• Other indirect emissions: correspond to Scope 3 emissions as defined by the GHG Protocol. They represent indirect
emissions that are not Scope 2 emissions and that are not the direct result of a company’s activities. Examples
include emissions from the manufacture of purchased raw materials (such as hydrogen or steel), emissions from
third-party vessels or vehicles transporting company products or employees, or emissions from customer use of the
company’s fuel products.
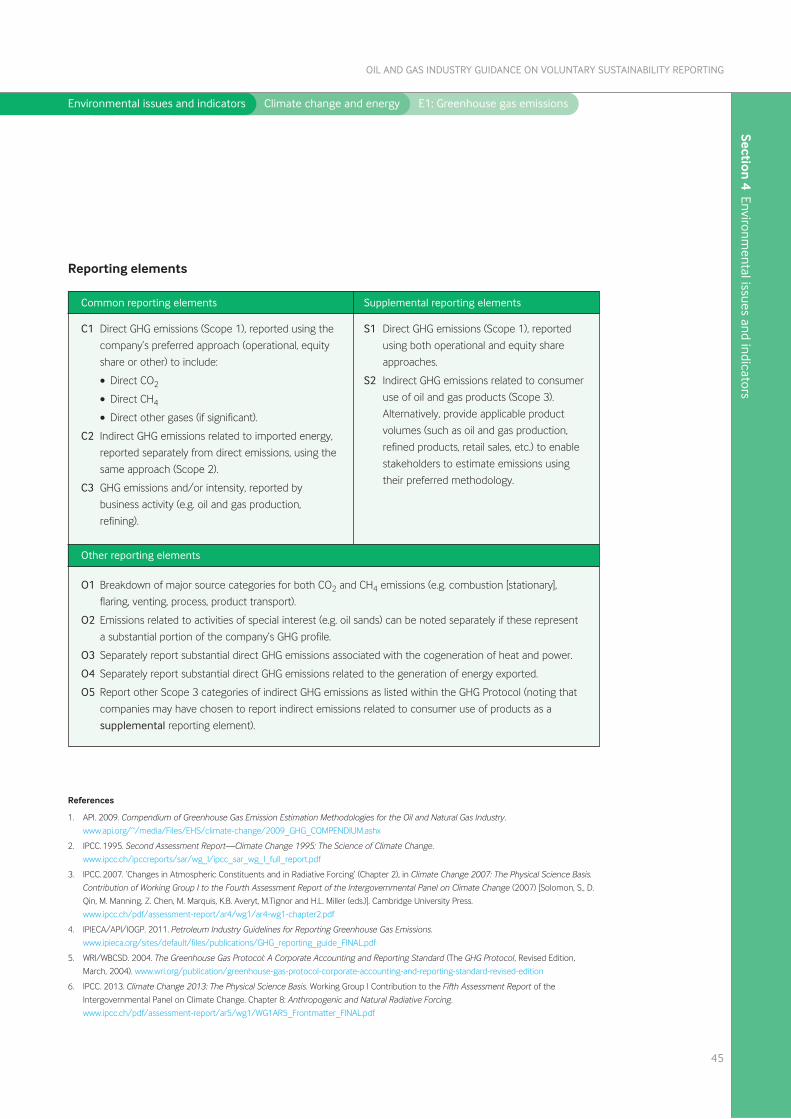
Section 4 Environm
ental issues and indicators
Environmental issues and indicators Climate change and energy E1: Greenhouse gas emissions
45
OIL AND GAS INDUSTRY GUIDANCE ON VOLUNTARY SUSTAINABILITY REPORTING
References
1. API. 2009. Compendium of Greenhouse Gas Emission Estimation Methodologies for the Oil and Natural Gas Industry.
www.api.org/~/media/Files/EHS/climate-change/2009_GHG_COMPENDIUM.ashx
2. IPCC. 1995. Second Assessment Report—Climate Change 1995: The Science of Climate Change.
www.ipcc.ch/ipccreports/sar/wg_I/ipcc_sar_wg_I_full_report.pdf
3. IPCC. 2007. ’Changes in Atmospheric Constituents and in Radiative Forcing‘ (Chapter 2), in Climate Change 2007: The Physical Science Basis.
Contribution of Working Group I to the Fourth Assessment Report of the Intergovernmental Panel on Climate Change (2007) [Solomon, S., D.
Qin, M. Manning, Z. Chen, M. Marquis, K.B. Averyt, M.Tignor and H.L. Miller (eds.)]. Cambridge University Press.
www.ipcc.ch/pdf/assessment-report/ar4/wg1/ar4-wg1-chapter2.pdf
4. IPIECA/API/IOGP. 2011. Petroleum Industry Guidelines for Reporting Greenhouse Gas Emissions.
www.ipieca.org/sites/default/files/publications/GHG_reporting_guide_FINAL.pdf
5. WRI/WBCSD. 2004. The Greenhouse Gas Protocol: A Corporate Accounting and Reporting Standard (The GHG Protocol, Revised Edition,
March, 2004). www.wri.org/publication/greenhouse-gas-protocol-corporate-accounting-and-reporting-standard-revised-edition
6. IPCC. 2013. Climate Change 2013: The Physical Science Basis. Working Group I Contribution to the Fifth Assessment Report of the
Intergovernmental Panel on Climate Change. Chapter 8: Anthropogenic and Natural Radiative Forcing.
www.ipcc.ch/pdf/assessment-report/ar5/wg1/WG1AR5_Frontmatter_FINAL.pdf
Common reporting elements
Other reporting elements
Supplemental reporting elements
C1 Direct GHG emissions (Scope 1), reported using the
company’s preferred approach (operational, equity
share or other) to include:
• Direct CO2
• Direct CH4
• Direct other gases (if significant).
C2 Indirect GHG emissions related to imported energy,
reported separately from direct emissions, using the
same approach (Scope 2).
C3 GHG emissions and/or intensity, reported by
business activity (e.g. oil and gas production,
refining).
S1 Direct GHG emissions (Scope 1), reported
using both operational and equity share
approaches.
S2 Indirect GHG emissions related to consumer
use of oil and gas products (Scope 3).
Alternatively, provide applicable product
volumes (such as oil and gas production,
refined products, retail sales, etc.) to enable
stakeholders to estimate emissions using
their preferred methodology.
O1 Breakdown of major source categories for both CO2 and CH4 emissions (e.g. combustion [stationary],
flaring, venting, process, product transport).
O2 Emissions related to activities of special interest (e.g. oil sands) can be noted separately if these represent
a substantial portion of the company’s GHG profile.
O3 Separately report substantial direct GHG emissions associated with the cogeneration of heat and power.
O4 Separately report substantial direct GHG emissions related to the generation of energy exported.
O5 Report other Scope 3 categories of indirect GHG emissions as listed within the GHG Protocol (noting that
companies may have chosen to report indirect emissions related to consumer use of products as a
supplemental reporting element).
Reporting elements
Sect
ion
4 E
nviro
nmen
tal i
ssue
s an
d in
dica
tors
Environmental issues and indicators Climate change and energy E2: Energy use
DESCRIPTION
Report total quantity of energy consumed in oiland gas operations or other business activities.
PURPOSE
Energy use is an indicator of resource use andis typically associated with the generation ofGHGs and other air emissions. Energy-relatedemissions to the atmosphere are aggregatedwithin Indicators E1, GHG emissions and E8,Other air emissions.
SCOPE
Reporters should state the total energyconsumed to operate their facilities andequipment. This includes the direct energyproduced and used by operations, any directenergy exported, as well as energy associatedwith the import of electricity, heat and steam.To reflect resource use, energy is reported asprimary energy (i.e. the energy content of thehydrocarbon fuels or other sources used toproduce the energy ultimately consumed bythe company’s operations).
Direct energy results from self-generation ofmechanical power, electricity, heat or steamon the company‘s operating sites, as well as inoffice buildings, marine vessels, trucks, or otherstationary or mobile equipment under theoperational control of the reporting company.Examples of energy-consuming equipmentinclude boilers, fired heaters, wasteincinerators, gas turbines, gas engines anddiesel engines. Direct energy use is a measureof the energy content of the fuels or otherenergy sources used to produce the power orheat generated directly at the facility.
Direct energy should reflect combustion offuels, whether produced by the company orpurchased.
Energy from fuel combustion should bedetermined as follows:
l Preferred: calculated based on the fuelvolume consumed and the fuel energycontent of the fuels used to generate therequired energy. Calculation may be carriedout by total fuel consumed if the same fuelis used by all energy sources, or by source iffuel types vary. Use of ‘lower heating value’is recommended because this reflects theamount of useable energy consumed andits use will promote a consistent reportingbasis. Use of ‘upper heating value’ in place of‘lower heating value’ will increase thereported energy consumption by up to 10%.
l Alternative: estimate based on the designenergy consumption specificationsassociated with various processingequipment, augmented with runtime orthroughput information if available.
On-site generation of solar or wind electricpower or other non-combustion energysources should be included and calculatedsimply from the electricity generated by thesesources.
Exported energy is the subset of the directprimary energy sold or otherwise exportedfrom the facility for use by others. It includesenergy losses from the company‘s own powergeneration equipment.
This indicator quantifies energy use related tooil and gas operations and, therefore, excludesexported energy not available to support on-site operations. As a consequence, companieswith significant export contributions frompower plants or cogeneration plants maychoose to report energy use related togeneration of exported power separately toprovide a clearer picture of overall resourceuse.
IPIECA • API • IOGP
46
E2: Energy use
Section 4 Environm
ental issues and indicators
Environmental issues and indicators Climate change and energy E2: Energy use
Imported energy should reflect the energycontent of the fuels that the supplier uses toproduce electricity, heat or steam imported bythe company. This approach is used to reflectthe use of primary energy resources. Forexample, imported energy derived from athermal power generation plant would be theenergy content of the fuel combusted by theprovider to produce the electrical powerreceived by the company‘s facility. Importedenergy accounts for the efficiency loss duringthe transformation of fuel combusted at thepower plant into electricity, heat or steam.
Imported energy is calculated by using thepurchased records of electricity, heat or steam,and then using efficiency factors to convertback to the energy content of the fuels orenergy sources. For purchased electricity, theimported electricity is converted to an estimateof the energy actually used by applying a local‘grid factor’ that reflects the average thermalefficiency (i.e. energy content of the fuel versusenergy produced) for the mix of electricalgeneration facilities providing electricity to thelocal electrical grid. For purchased heat orsteam, efficiency factors can typically beobtained from the supplier.
In the absence of efficiency or grid factors,including specific information from the energyprovider, it is possible to use published gridfactors such as those provided by the API‘Compendium’ (API, 2009) the US EPA E-GRIDfactors or other sources available in thecountry of operation. Alternatively, it may benecessary to use published conversion factorsand information on the type of generating unitsupplying the energy. In the absence of local orregional information, the following efficiencyfactors can be used for combustion-basedenergy sources:
l energy content of the fuel used to generatethe electricity = electricity purchased/received in gigajoules (GJ) divided by 0.38;
l energy content of the fuel used to generatethe steam = steam purchased/received in GJdivided by 0.8.
The factors provided are conservative values toaccount for efficiency losses during generationand transportation of power but do not reflectthe efficiency of the most recent powergeneration technology. If electricity importedcomes solely from non-combustion and non-nuclear generation (e.g. wind, hydroelectric,wave, tidal power) there is no need to apply agrid factor; simply report the imported energypurchased.
Total energy use reported should includedirect energy and imported energy but excludeexported energy to quantify energy consumedby a company’s oil and gas operations.
OUT OF SCOPE
The energy content of flared or vented gasshould be excluded from total energy useestimates. Although these do reflect loss ofenergy resources, they do not reflect energyuse required for production or manufacturingof products. These resource losses are coveredby a separate metric, E4, Flared gas.
REPORTING BASIS
Report in gigajoules (one British Thermal Unit[BTU] = 1055 joules; 1 kilowatt-hour (kWh) =0.0036 gigajoules). Energy data should beconsolidated within the company’s reportingboundary using the ‘operational approach’(Appendix A).
47
OIL AND GAS INDUSTRY GUIDANCE ON VOLUNTARY SUSTAINABILITY REPORTING
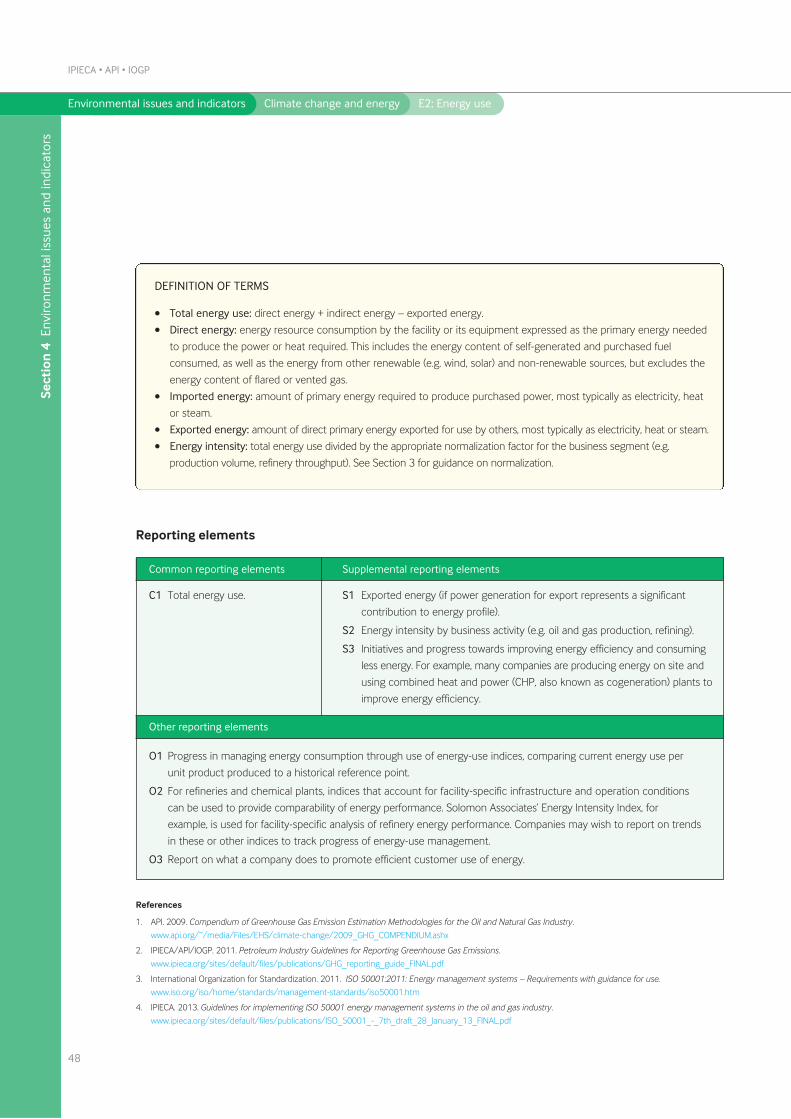
Sect
ion
4 E
nviro
nmen
tal i
ssue
s an
d in
dica
tors
Environmental issues and indicators Climate change and energy E2: Energy use
IPIECA • API • IOGP
48
DEFINITION OF TERMS
• Total energy use: direct energy + indirect energy – exported energy.
• Direct energy: energy resource consumption by the facility or its equipment expressed as the primary energy needed
to produce the power or heat required. This includes the energy content of self-generated and purchased fuel
consumed, as well as the energy from other renewable (e.g. wind, solar) and non-renewable sources, but excludes the
energy content of flared or vented gas.
• Imported energy: amount of primary energy required to produce purchased power, most typically as electricity, heat
or steam.
• Exported energy: amount of direct primary energy exported for use by others, most typically as electricity, heat or steam.
• Energy intensity: total energy use divided by the appropriate normalization factor for the business segment (e.g.
production volume, refinery throughput). See Section 3 for guidance on normalization.
References
1. API. 2009. Compendium of Greenhouse Gas Emission Estimation Methodologies for the Oil and Natural Gas Industry.
www.api.org/~/media/Files/EHS/climate-change/2009_GHG_COMPENDIUM.ashx
2. IPIECA/API/IOGP. 2011. Petroleum Industry Guidelines for Reporting Greenhouse Gas Emissions.
www.ipieca.org/sites/default/files/publications/GHG_reporting_guide_FINAL.pdf
3. International Organization for Standardization. 2011. ISO 50001:2011: Energy management systems – Requirements with guidance for use.
www.iso.org/iso/home/standards/management-standards/iso50001.htm
4. IPIECA. 2013. Guidelines for implementing ISO 50001 energy management systems in the oil and gas industry.
www.ipieca.org/sites/default/files/publications/ISO_50001_-_7th_draft_28_January_13_FINAL.pdf
Common reporting elements
Other reporting elements
Supplemental reporting elements
C1 Total energy use. S1 Exported energy (if power generation for export represents a significant
contribution to energy profile).
S2 Energy intensity by business activity (e.g. oil and gas production, refining).
S3 Initiatives and progress towards improving energy efficiency and consuming
less energy. For example, many companies are producing energy on site and
using combined heat and power (CHP, also known as cogeneration) plants to
improve energy efficiency.
O1 Progress in managing energy consumption through use of energy-use indices, comparing current energy use per
unit product produced to a historical reference point.
O2 For refineries and chemical plants, indices that account for facility-specific infrastructure and operation conditions
can be used to provide comparability of energy performance. Solomon Associates’ Energy Intensity Index, for
example, is used for facility-specific analysis of refinery energy performance. Companies may wish to report on trends
in these or other indices to track progress of energy-use management.
O3 Report on what a company does to promote efficient customer use of energy.
Reporting elements
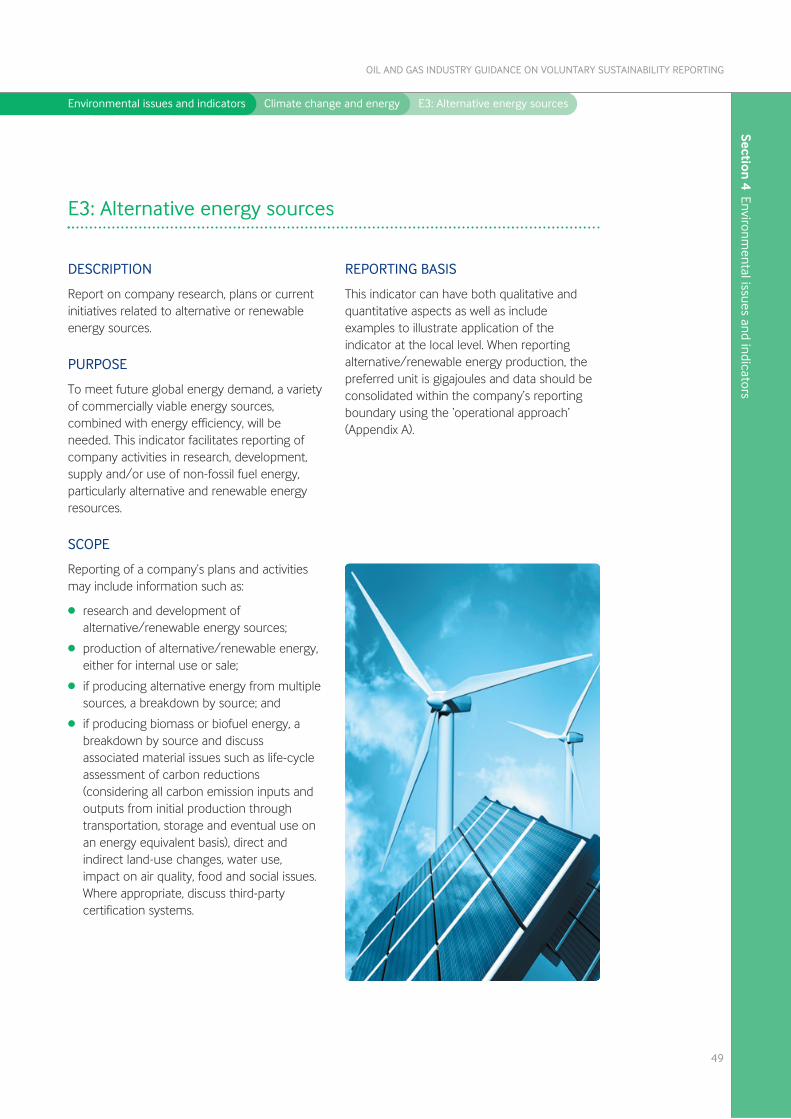
Section 4 Environm
ental issues and indicators
Environmental issues and indicators Climate change and energy E3: Alternative energy sources
DESCRIPTION
Report on company research, plans or currentinitiatives related to alternative or renewableenergy sources.
PURPOSE
To meet future global energy demand, a varietyof commercially viable energy sources,combined with energy efficiency, will beneeded. This indicator facilitates reporting ofcompany activities in research, development,supply and/or use of non-fossil fuel energy,particularly alternative and renewable energyresources.
SCOPE
Reporting of a company’s plans and activitiesmay include information such as:
l research and development ofalternative/renewable energy sources;
l production of alternative/renewable energy,either for internal use or sale;
l if producing alternative energy from multiplesources, a breakdown by source; and
l if producing biomass or biofuel energy, abreakdown by source and discussassociated material issues such as life-cycleassessment of carbon reductions(considering all carbon emission inputs andoutputs from initial production throughtransportation, storage and eventual use onan energy equivalent basis), direct andindirect land-use changes, water use,impact on air quality, food and social issues.Where appropriate, discuss third-partycertification systems.
REPORTING BASIS
This indicator can have both qualitative andquantitative aspects as well as includeexamples to illustrate application of theindicator at the local level. When reportingalternative/renewable energy production, thepreferred unit is gigajoules and data should beconsolidated within the company’s reportingboundary using the ‘operational approach’(Appendix A).
49
OIL AND GAS INDUSTRY GUIDANCE ON VOLUNTARY SUSTAINABILITY REPORTING
E3: Alternative energy sources
Sect
ion
4 E
nviro
nmen
tal i
ssue
s an
d in
dica
tors
Environmental issues and indicators Climate change and energy E3: Alternative energy sources
IPIECA • API • IOGP
50
Common reporting elements
Other reporting elements
Supplemental reporting elements
C1 Discuss approach to alternative/
renewable energy, including
descriptions of relevant operations
activities, investment plans or research
and development projects and
activities, broken down by type of
energy source.
S1 Discuss management of environmental and social issues
surrounding any research, development and production
of biofuel energy.
S2 Amount of alternative/renewable energy produced for
sale.
S3 Amount of alternative/renewable energy produced for
internal company use.
O1 Companies are encouraged to discuss their outlook on the supply and demand for renewable/alternative
energy, and its implications for sustainability.
O2 Report on use of alternative/renewable energy sourced from third parties, such as renewable energy
purchased from a utility supplier.
O3 Although nuclear energy is not typically considered to be an alternative fuel, companies with activities in
nuclear energy production may describe their activities and separately report nuclear energy produced
or used.
Reporting elements
References
1. IPIECA. 2012. Climate Change: A Glossary of Terms (Fifth edition)
http://www.ipieca.org/publication/climate-change-glossary-terms-5th-edition
DEFINITION OF TERMS
• Alternative energy: energy derived from non-fossil fuel sources. Nuclear energy, while it is a non-fossil
fuel, is typically not included as an alternative fuel.
• Renewable energy: energy sources that are constantly renewed by natural processes. These include
non-carbon technologies such as solar energy, hydropower and wind, as well as technologies based on
biomass. Life-cycle analyses are required to assess the extent to which biomass-based technologies may
limit net carbon emissions.
• Biofuel: fuel produced from organic matter produced by plants. Examples of biofuels include alcohol
(from fermented sugar), black liquor from the paper manufacturing process, wood, and palm and
soybean oil.
• Biomass: total dry organic matter or stored energy content of living organisms. Biomass can be used for
fuel directly by burning it (e.g. wood), indirectly by fermentation to an alcohol (e.g. sugar) or extraction of
combustible oils (e.g. soybeans).
Section 4 Environm
ental issues and indicators
Environmental issues and indicators Climate change and energy E4: Flared gas
DESCRIPTION
Report the quantity of hydrocarbon gas flaredto the atmosphere from operations.
PURPOSE
The flared gas indicator is a measure of naturalgas resource consumption and contributes toGHG emissions and other gaseous emissionsthat impact the local environment.
SCOPE
Gas flare systems are an essential safetymechanism in many petroleum operations.Flares can, for example, safely combust gasreleased from pressure relief valves and othersafety systems during plant upsets, gasreleased from various process or storageequipment, non-marketable gas or unusablegas. Sources and situations that may feed gasinto flare systems can include but are notlimited to:
l pressure relief valve systems used to preventoverpressure of equipment;
l emergency depressurizing systems used forsafe plant management;
l operations during plant start-ups andshutdowns;
l tank storage overhead vapours (e.g. fillingand breathing losses);
l glycol dehydrators;
l solution gas from separators or flash tanks atcrude oil batteries, terminals or otherproduction facilities;
l well testing, especially at newly-drilled wellsin frontier areas;
l well completion and clean-up operationswhere flaring is necessary for well bore andreservoir clean-up;
l blow-down and pigging operations on gasgathering or other pipeline systems;
l blow-downs of vessels, piping, gascompressors or other equipment duringmaintenance; and
l vessel and tank truck loading emissions (e.g.vapours displaced during loading of tankersor trucks).
Companies should report as flared gas the totalquantity of hydrocarbon gas sent tooperational flare systems at a facility. Thisshould include routine flaring operations as wellas any non-routine flaring events. Reportedflared gas should include purge gas, pilot lightfuel and assist gas, if these are substantialrelative to the total quantity flared. Data oninsignificant quantities of flared gases are notgenerally collected or reported.
Calculation of flared gas should be based onthe composition of the gas stream involvedand, if significant, should exclude the quantityof non-hydrocarbons, such as carbon dioxide(CO2), water, hydrogen (H2) and nitrogen (N2).In the absence of measured gas compositiondata, engineering estimates should be applied.
For most petroleum industry operations,venting of hydrocarbons represents a minorresource use and related emissions areeffectively covered by Indicator E1, GHGemissions, and by the volatile organiccompounds (VOC) metric under Indicator E8,Other air emissions. If gas venting issubstantial, companies should separately reportthe quantity of vented hydrocarbon gas.
REPORTING BASIS
Report quantitatively using units of metrictonnes of hydrocarbons flared. Reporting in unitsof mass is encouraged because this provides amore consistent and comparable measure ofproduct loss. When reporting on a volume basisuse standard cubic metres (Sm3) oralternatively standard cubic feet (SCF), which iscommonly used in industry operations and
51
OIL AND GAS INDUSTRY GUIDANCE ON VOLUNTARY SUSTAINABILITY REPORTING
E4: Flared gas
Sect
ion
4 E
nviro
nmen
tal i
ssue
s an
d in
dica
tors
Environmental issues and indicators Climate change and energy E4: Flared gas
may be better understood by some audiences.When reporting volume, specify units used andthe temperature/pressure bases for thestandardization.
Flared gas data should be consolidated withinthe company’s reporting boundary using the‘operational approach’ (Appendix A).
Data should be consolidated for all operationalactivities which contribute significantly to thecompany’s total flared gas.
Companies should determine significance (seeGlossary) in terms geographic locations/regions.
IPIECA • API • IOGP
52
Common reporting elements
Other reporting elements
Supplemental reporting elements
C1 Quantity of hydrocarbon gas flared from
operations.
S1 Separately report hydrocarbon gas flared for each
relevant business activity (e.g. oil and gas production,
refining).
O1 Contribution of flaring to the company’s total GHG emissions in CO2e.
O2 Indicate geographic locations/regions of significant flaring.
O3 Reporting flaring by type can convey the causes of flaring and indicate areas for operational
improvement. For example, flaring can be split between routine causes (e.g. normal operations, well
testing) and non-routine causes (e.g. plant start-ups and shutdowns, pressure safety valve releases,
emergency depressurization).
O4 Describe flare reduction activities including sustainable reduction improvements versus short-term
operational fluctuations.
O5 Separately report vented gas if hydrocarbon venting represents a substantial portion of a company’s
resource use.
Reporting elements
References
1. API. 2009. Compendium of Greenhouse Gas Emission Estimation Methodologies for the Oil and Natural Gas Industry.
www.api.org/~/media/Files/EHS/climate-change/2009_GHG_COMPENDIUM.ashx
2. IPIECA/API/IOGP. 2011. Petroleum Industry Guidelines for Reporting Greenhouse Gas Emissions.
www.ipieca.org/sites/default/files/publications/GHG_reporting_guide_FINAL.pdf
3. US EPA. 1995. Compilation of Air Pollutant Emission Factors, Volume I: Stationary Point and Area Sources, AP-42. Fifth Edition
(GPO 055-000-005-001), January 1995, with Supplements A and B (1996), C (1997), D (1998), E (1999) and F (2000). US EPA Office of Air
Quality Planning and Standards. www.epa.gov/ttnchie1/ap42
DEFINITION OF TERMS
• Flared gas: total mass (or volume) of hydrocarbon directed to operational flare systems, wherein the
hydrocarbons are consumed through combustion.
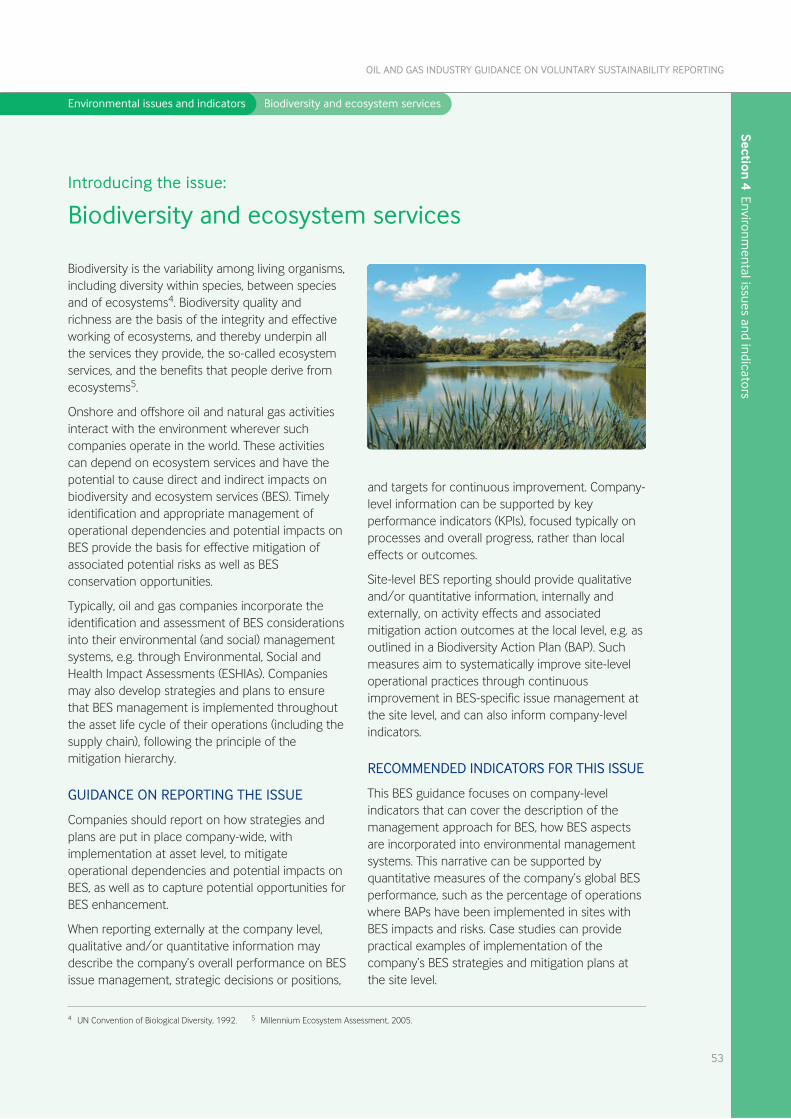
Section 4 Environm
ental issues and indicators
Environmental issues and indicators Biodiversity and ecosystem services
Biodiversity is the variability among living organisms,including diversity within species, between speciesand of ecosystems4. Biodiversity quality andrichness are the basis of the integrity and effectiveworking of ecosystems, and thereby underpin allthe services they provide, the so-called ecosystemservices, and the benefits that people derive fromecosystems5.
Onshore and offshore oil and natural gas activitiesinteract with the environment wherever suchcompanies operate in the world. These activitiescan depend on ecosystem services and have thepotential to cause direct and indirect impacts onbiodiversity and ecosystem services (BES). Timelyidentification and appropriate management ofoperational dependencies and potential impacts onBES provide the basis for effective mitigation ofassociated potential risks as well as BESconservation opportunities.
Typically, oil and gas companies incorporate theidentification and assessment of BES considerationsinto their environmental (and social) managementsystems, e.g. through Environmental, Social andHealth Impact Assessments (ESHIAs). Companiesmay also develop strategies and plans to ensurethat BES management is implemented throughoutthe asset life cycle of their operations (including thesupply chain), following the principle of themitigation hierarchy.
GUIDANCE ON REPORTING THE ISSUE
Companies should report on how strategies andplans are put in place company-wide, withimplementation at asset level, to mitigateoperational dependencies and potential impacts onBES, as well as to capture potential opportunities forBES enhancement.
When reporting externally at the company level,qualitative and/or quantitative information maydescribe the company’s overall performance on BESissue management, strategic decisions or positions,
and targets for continuous improvement. Company-level information can be supported by keyperformance indicators (KPIs), focused typically onprocesses and overall progress, rather than localeffects or outcomes.
Site-level BES reporting should provide qualitativeand/or quantitative information, internally andexternally, on activity effects and associatedmitigation action outcomes at the local level, e.g. asoutlined in a Biodiversity Action Plan (BAP). Suchmeasures aim to systematically improve site-leveloperational practices through continuousimprovement in BES-specific issue management atthe site level, and can also inform company-levelindicators.
RECOMMENDED INDICATORS FOR THIS ISSUE
This BES guidance focuses on company-levelindicators that can cover the description of themanagement approach for BES, how BES aspectsare incorporated into environmental managementsystems. This narrative can be supported byquantitative measures of the company’s global BESperformance, such as the percentage of operationswhere BAPs have been implemented in sites withBES impacts and risks. Case studies can providepractical examples of implementation of thecompany’s BES strategies and mitigation plans atthe site level.
53
OIL AND GAS INDUSTRY GUIDANCE ON VOLUNTARY SUSTAINABILITY REPORTING
Introducing the issue:
Biodiversity and ecosystem services
4 UN Convention of Biological Diversity, 1992. 5 Millennium Ecosystem Assessment, 2005.
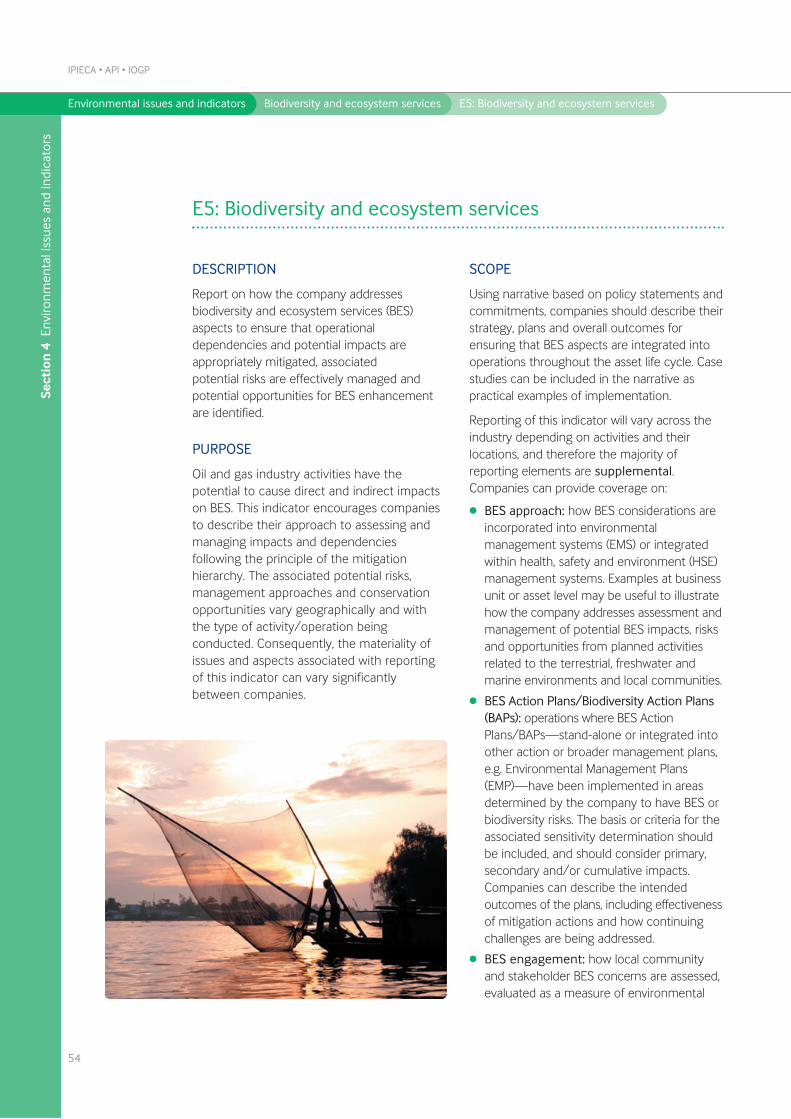
Sect
ion
4 E
nviro
nmen
tal i
ssue
s an
d in
dica
tors
Environmental issues and indicators Biodiversity and ecosystem services E5: Biodiversity and ecosystem services
DESCRIPTION
Report on how the company addressesbiodiversity and ecosystem services (BES)aspects to ensure that operationaldependencies and potential impacts areappropriately mitigated, associatedpotential risks are effectively managed andpotential opportunities for BES enhancementare identified.
PURPOSE
Oil and gas industry activities have thepotential to cause direct and indirect impactson BES. This indicator encourages companiesto describe their approach to assessing andmanaging impacts and dependenciesfollowing the principle of the mitigationhierarchy. The associated potential risks,management approaches and conservationopportunities vary geographically and withthe type of activity/operation beingconducted. Consequently, the materiality ofissues and aspects associated with reportingof this indicator can vary significantlybetween companies.
SCOPE
Using narrative based on policy statements andcommitments, companies should describe theirstrategy, plans and overall outcomes forensuring that BES aspects are integrated intooperations throughout the asset life cycle. Casestudies can be included in the narrative aspractical examples of implementation.
Reporting of this indicator will vary across theindustry depending on activities and theirlocations, and therefore the majority ofreporting elements are supplemental.Companies can provide coverage on:
l BES approach: how BES considerations areincorporated into environmentalmanagement systems (EMS) or integratedwithin health, safety and environment (HSE)management systems. Examples at businessunit or asset level may be useful to illustratehow the company addresses assessment andmanagement of potential BES impacts, risksand opportunities from planned activitiesrelated to the terrestrial, freshwater andmarine environments and local communities.
l BES Action Plans/Biodiversity Action Plans(BAPs): operations where BES ActionPlans/BAPs—stand-alone or integrated intoother action or broader management plans,e.g. Environmental Management Plans(EMP)—have been implemented in areasdetermined by the company to have BES orbiodiversity risks. The basis or criteria for theassociated sensitivity determination shouldbe included, and should consider primary,secondary and/or cumulative impacts.Companies can describe the intendedoutcomes of the plans, including effectivenessof mitigation actions and how continuingchallenges are being addressed.
l BES engagement: how local communityand stakeholder BES concerns are assessed,evaluated as a measure of environmental
IPIECA • API • IOGP
54
E5: Biodiversity and ecosystem services
Section 4 Environm
ental issues and indicators
Environmental issues and indicators Biodiversity and ecosystem services E5: Biodiversity and ecosystem services
55
OIL AND GAS INDUSTRY GUIDANCE ON VOLUNTARY SUSTAINABILITY REPORTING
sensitivity, documented and addressed inbiodiversity conservation/action planning.
l BES adaptive management: operating areaswhere adaptive management of impacts onbiodiversity and/or ecosystems is in place.Case study examples demonstrate thepractical application of the company-wide
DEFINITION OF TERMS
• Adaptive management: the process of measuring, monitoring and reporting the results of current
management practices and using those results to modify management and operational practices to
improve future biodiversity performance.
• BES Action Plans/Biodiversity Action Plans (BAPs): A set of future actions that will lead to the
conservation or enhancement of BES/biodiversity.
• Biodiversity: the UN Convention on Biological Diversity (1992) defines biodiversity as the variability
among living organisms within species, between species and between ecosystems. Biodiversity quality
and richness are the basis of the integrity and effective working of ecosystems and thereby underpins
all services they provide, i.e. the so-called ecosystem services—the benefits that people derive from
ecosystems (Millennium Ecosystem Assessment, 2005).
• Dependencies: these are the ecosystem services that the project or operation relies on to complete the
work/run the business, e.g. water, aggregates, storm/flood protection, water discharge treatment etc.
• Ecosystem services: the Millennium Ecosystem Assessment (2005) defines ecosystem services as the
benefits (direct and indirect) that people obtain from ecosystems. The Assessment defines four categories
of ecosystem services: provisioning services (products obtained from ecosystems such as fresh water or
timber); regulating services (ecosystems’ control of natural processes such as climate, disease, water flows
and pollination); cultural services (recreation, aesthetic enjoyment); and supporting services (natural
processes such as nutrient cycling that maintain other services).
• Ecosystem: a dynamic complex of plant, animal and microorganism communities and their non-living
environment interacting as a functional unit (Millennium Ecosystem Assessment, 2005). They include,
but are not limited to, coral reefs, tundra, wetlands, forests, grasslands and farmlands.
• Mitigation hierarchy: a tool which aims to help manage biodiversity risk, and is commonly applied in
Environmental Impact Assessments (EIAs). This tool includes a hierarchy of steps for which the order of
preference is:
- Avoid;
- Reduce;
- Restore, and
- Offset (in some cases where significant residual biodiversity impacts remain).
• Operating area: an area where business activities take place with potential to interact with the adjacent
environment. Geographically, the term ‘operating area’ may encompass an area of any size with a
unifying environmental and/or operating feature (e.g. platform, field, watershed, habitat).
approach to BES and adaptive managementprocesses or policies at the site level.
l Effectiveness of the BES Action Plan/BAP:effectiveness of the verification process and/ormitigation actions based on assessment ofongoing BES Action Plan/BAP results.
Sect
ion
4 E
nviro
nmen
tal i
ssue
s an
d in
dica
tors
Environmental issues and indicators Biodiversity and ecosystem services E5: Biodiversity and ecosystem services
IPIECA • API • IOGP
56
References
1. Connick et al. 2014. A Biodiversity and Ecosystem Services Management Framework for the Oil and Gas Sector. Society of Petroleum
Engineers. doi:10.2118/168421-MS
2. Energy and Biodiversity Initiative (EBI) guidelines and products. 2003. www.theebi.org
3. IPIECA. 2007. An Ecosystem Approach to Oil and Gas Industry Biodiversity Conservation.
www.ipieca.org/publication/ecosystem-approach-oil-and-gas-industry-biodiversity-conservation
4. IPIECA/IOGP. 2005. A Guide to Developing Biodiversity Action Plans for the Oil and Gas Sector.
www.ipieca.org/publication/guide-developing-biodiversity-action-plans-oil-and-gas-sector
5. ISO. Environmental Management Systems (ISO 14001 2004), especially section 4.3.1.
www.iso.org/iso/iso_catalogue/catalogue_tc/catalogue_detail.htm?csnumber=31807
6. Landberg et al. 2014. Weaving Ecosystem Services into Impact Assessment: A Step-by-Step Method. Technical appendix Version 1,0.
www.wri.org/publication/weaving-ecosystem-services-into-impact-assessment
7. Millennium Ecosystem Assessment. 2005. Ecosystems and human well-being: synthesis. Washington, DC: Island Press. ISBN 1-59726-040-1.
www.millenniumassessment.org/documents/document.356.aspx.pdf
8. UN. 1992. United Nations Convention on Biological Diversity. https://www.cbd.int
9. WBCSD, Meridian Institute, World Resources Institute. 2008. Corporate Ecosystem Services Review: Guidelines for Identifying Business Risks
and Opportunities Arising from Ecosystem Change Version 2.0 (January 2012).
www.wri.org/sites/default/files/corporate_ecosystem_services_review_1.pdf
Common reporting elements
Other reporting elements
Supplemental reporting elements
C1 Describe the company’s
management approach (policy,
strategy, plans and outcomes),
in addressing biodiversity and
ecosystem services (BES)
aspects.
S1 Describe how mitigation of dependencies and potential impacts
of planned activities, management of associated potential risks
and identification of enhancement opportunities related to BES
is integrated into the company’s HSE management systems.
S2 The percentage of BES sensitive operating areas (as determined
by the company) where BES Action Plans/Biodiversity Actions
Plans (BAPs) have been implemented. Include the criteria used
to determine sensitivity and any applicable metrics.
S3 Explanation of how community and stakeholder concerns are
assessed, evaluated and addressed.
S4 Examples or case studies of operating areas where adaptive
management of impacts on biodiversity and/or BES is in place.
S5 Describe effectiveness of mitigation actions, verification
processes for BES Action Plans/BAPs and monitoring data
and/or actions based on assessment of ongoing results.
None
Reporting elements
REPORTING BASIS
Qualitative information including examples toillustrate application of the indicator at the locallevel. This may be supported by some
quantitative data, which should be consolidatedwithin the company’s reporting boundary usingthe ‘operational approach’ (Appendix A).
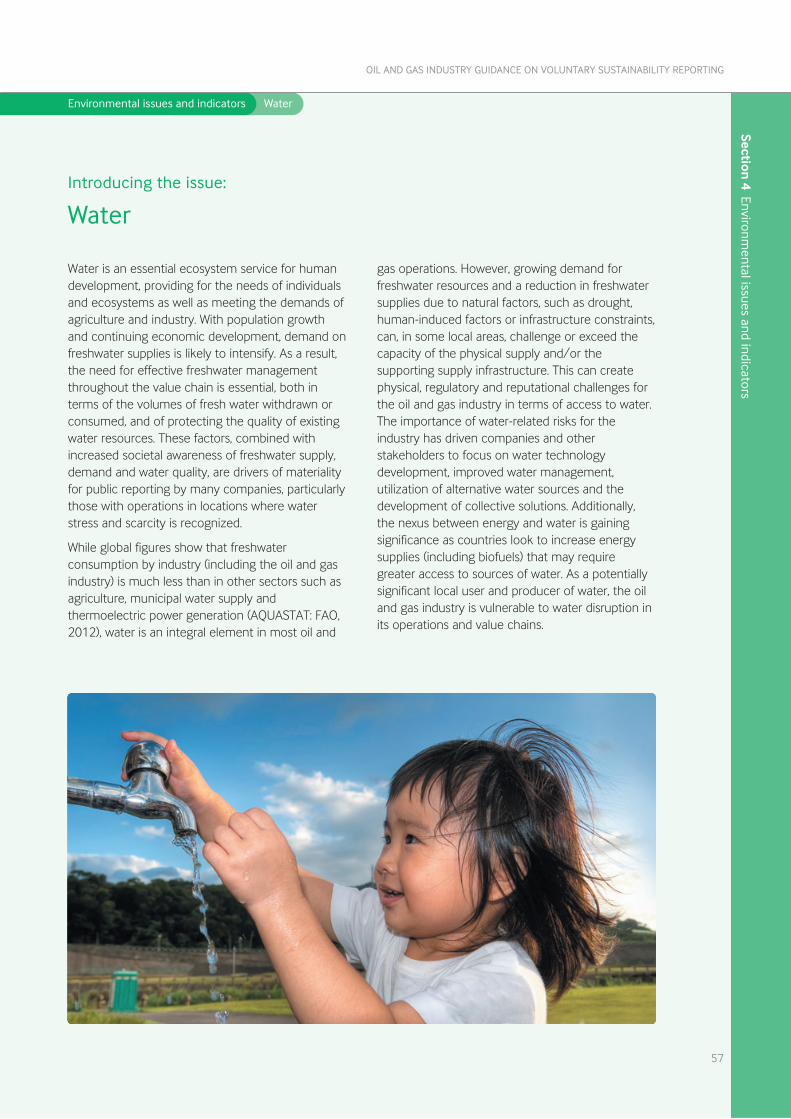
Section 4 Environm
ental issues and indicators
Environmental issues and indicators Water
Water is an essential ecosystem service for humandevelopment, providing for the needs of individualsand ecosystems as well as meeting the demands ofagriculture and industry. With population growthand continuing economic development, demand onfreshwater supplies is likely to intensify. As a result,the need for effective freshwater managementthroughout the value chain is essential, both interms of the volumes of fresh water withdrawn orconsumed, and of protecting the quality of existingwater resources. These factors, combined withincreased societal awareness of freshwater supply,demand and water quality, are drivers of materialityfor public reporting by many companies, particularlythose with operations in locations where waterstress and scarcity is recognized.
While global figures show that freshwaterconsumption by industry (including the oil and gasindustry) is much less than in other sectors such asagriculture, municipal water supply andthermoelectric power generation (AQUASTAT: FAO,2012), water is an integral element in most oil and
gas operations. However, growing demand forfreshwater resources and a reduction in freshwatersupplies due to natural factors, such as drought,human-induced factors or infrastructure constraints,can, in some local areas, challenge or exceed thecapacity of the physical supply and/or thesupporting supply infrastructure. This can createphysical, regulatory and reputational challenges forthe oil and gas industry in terms of access to water.The importance of water-related risks for theindustry has driven companies and otherstakeholders to focus on water technologydevelopment, improved water management,utilization of alternative water sources and thedevelopment of collective solutions. Additionally,the nexus between energy and water is gainingsignificance as countries look to increase energysupplies (including biofuels) that may requiregreater access to sources of water. As a potentiallysignificant local user and producer of water, the oiland gas industry is vulnerable to water disruption inits operations and value chains.
57
OIL AND GAS INDUSTRY GUIDANCE ON VOLUNTARY SUSTAINABILITY REPORTING
Introducing the issue:
Water

Sect
ion
4 E
nviro
nmen
tal i
ssue
s an
d in
dica
tors
Environmental issues and indicators Water
GUIDANCE ON REPORTING THE ISSUE
While the demand for freshwater supplies is aglobal issue, it largely has a local impact, andpotential solutions need to take into account localconstraints and the regulatory framework.Therefore, in addition to corporate level reporting,companies should assess whether a significantnumber of the company’s facilities are impacted bylocal water stress/scarcity. If so, it is thenappropriate to add narrative to the report todescribe both the company’s overall approach towater management and to demonstrateresponsible stewardship approaches to managingwater demands and discharges in relevantoperational locations, especially in places wherewater stress is recognized.
Depending on the reporting company’s activitiesand locations, water management may addressfreshwater access and use, the treatment ofwastewaters, processes involving produced waterfrom resource extraction, and the use of brackishor saline water. The narrative description shouldclarify the types of activities where watermanagement is significant, such as involvement innon-conventional extraction from shale or oilsands, or investments in alternative or renewableenergy sources such as biofuels.
The description of a company’s approach to watermanagement can demonstrate how the issue isintegrated within its management systems andthe importance of water as a resource within itsbusiness strategy. The report may also highlightprogress or outcomes from stakeholder andregulatory engagements, risk assessments,resource efficiency plans, implementationactivities, performance evaluations andmanagement reviews.
When reporting performance, water managementcan be amenable to quantitative measures fromaggregated totals to water consumption intensitymetrics. However, the associated potential impactsmay be highly localized—for instance, related tooperations in areas of freshwater stress and
IPIECA • API • IOGP
58
Introducing the issue:
Water (continued)
scarcity—so case studies can be beneficial whenreporting on this issue. (See the example onWorking in remote locations in Section 2, page 26).
RECOMMENDED INDICATORS FOR THIS ISSUE
The two key areas of environmental concern areincreasing quantities of fresh water withdrawn andwater quality issues (UNEP, 2013). Therefore inthis guidance, there are two indicators thatsupport reporting on this issue. Indicator E6focuses on management of fresh water as aresource while E7 focuses on managing localenvironmental impacts when treated effluentscontaining hydrocarbons are discharged intowater bodies. Companies may also wish to reportperformance data related to other types of water,such as produced water or desalinated water, ifsignificant to their operational activities.
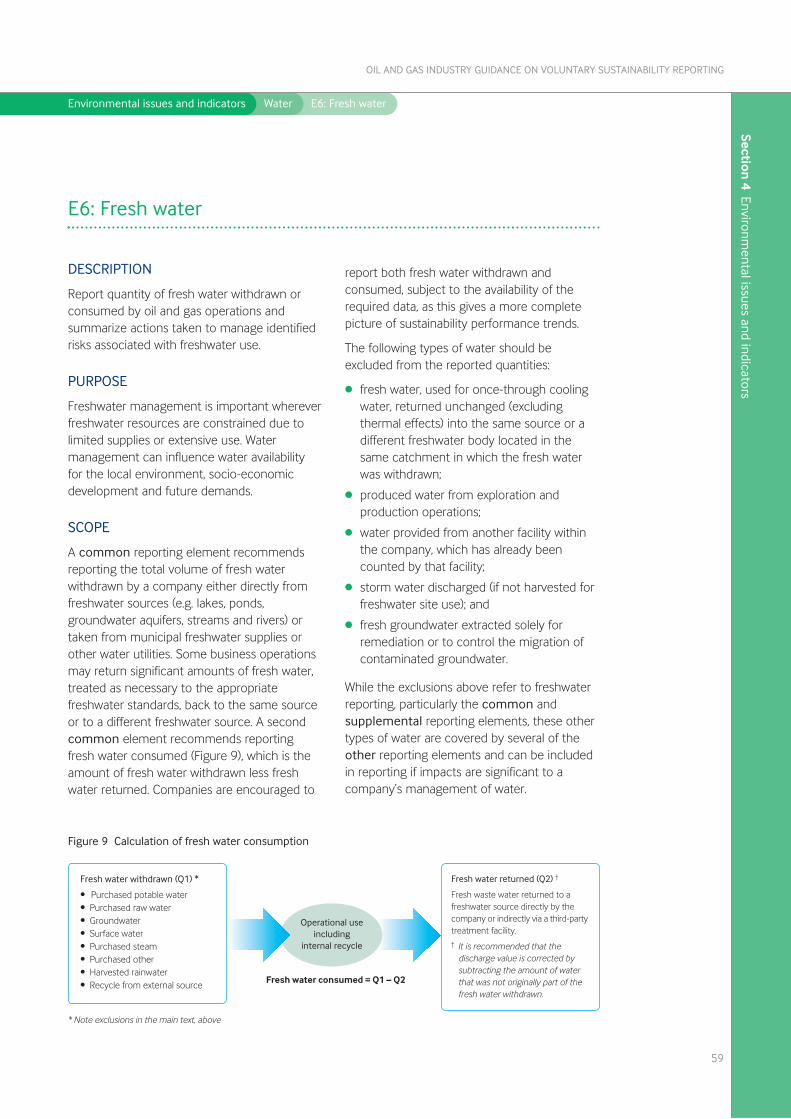
Section 4 Environm
ental issues and indicators
Environmental issues and indicators Water E6: Fresh water
DESCRIPTION
Report quantity of fresh water withdrawn orconsumed by oil and gas operations andsummarize actions taken to manage identifiedrisks associated with freshwater use.
PURPOSE
Freshwater management is important whereverfreshwater resources are constrained due tolimited supplies or extensive use. Watermanagement can influence water availabilityfor the local environment, socio-economicdevelopment and future demands.
SCOPE
A common reporting element recommendsreporting the total volume of fresh waterwithdrawn by a company either directly fromfreshwater sources (e.g. lakes, ponds,groundwater aquifers, streams and rivers) ortaken from municipal freshwater supplies orother water utilities. Some business operationsmay return significant amounts of fresh water,treated as necessary to the appropriatefreshwater standards, back to the same sourceor to a different freshwater source. A secondcommon element recommends reportingfresh water consumed (Figure 9), which is theamount of fresh water withdrawn less freshwater returned. Companies are encouraged to
59
OIL AND GAS INDUSTRY GUIDANCE ON VOLUNTARY SUSTAINABILITY REPORTING
E6: Fresh water
Figure 9 Calculation of fresh water consumption
������������ ���������������
���������������� �������
� �������� ��������������������������������������������������������������������������������������������������������������������������������
�������������� ���������
����������������������������������������������������� ���������������������������� ��������������������!� ������������ � ���������
���������������������� ������������������������������������������������������������������������������� �����
������ ������ ����� �
� �� ���������
�������������������������������������
report both fresh water withdrawn andconsumed, subject to the availability of therequired data, as this gives a more completepicture of sustainability performance trends.
The following types of water should beexcluded from the reported quantities:
l fresh water, used for once-through coolingwater, returned unchanged (excludingthermal effects) into the same source or adifferent freshwater body located in thesame catchment in which the fresh waterwas withdrawn;
l produced water from exploration andproduction operations;
l water provided from another facility withinthe company, which has already beencounted by that facility;
l storm water discharged (if not harvested forfreshwater site use); and
l fresh groundwater extracted solely forremediation or to control the migration ofcontaminated groundwater.
While the exclusions above refer to freshwaterreporting, particularly the common andsupplemental reporting elements, these othertypes of water are covered by several of theother reporting elements and can be includedin reporting if impacts are significant to acompany’s management of water.
Sect
ion
4 E
nviro
nmen
tal i
ssue
s an
d in
dica
tors
Environmental issues and indicators Water E6: Fresh water
IPIECA • API • IOGP
60
If fresh water used for once-through coolingwater is not returned to the same water sourceor another freshwater body, it is a consumptiveuse, is not excluded, and should be included infreshwater withdrawals.
As potential impacts are likely to be localizedand more significant in areas where the freshwater environment is stressed or supply isscarce, a supplemental reporting elementencourages companies to provide additionalinformation on operations in such locations.
REPORTING BASIS
The volume of fresh water should be reportedin cubic metres (m3) and consolidated withinthe company’s reporting boundary using the‘operational approach’ (Appendix A). Reportsshould include examples and/or case studiesto illustrate application of the indicator at thelocal level. Companies should determinesignificance (see Glossary) when addressing theother reporting element on management ofother types of water (O7).
References
1. AQUASTAT website. FAO’s global water information system. Food and Agriculture Organization of the United Nations, Rome.
www.fao.org/nr/water/aquastat/main/index.stm
2. AWS. 2014. The AWS International Water Stewardship Standard (Version 1.0).
www.allianceforwaterstewardship.org/assets/documents/AWS-Standard-v-1-Abbreviated-print.pdf
3. CEO Water Mandate. 2014a. Driving Harmonization of Water-Related Terminology.
http://ceowatermandate.org/files/MandateTerminology.pdf
4. CEO Water Mandate. 2014b. Corporate Water Disclosure Guidelines: Toward an Common Approach to Reporting Water Issues.
http://ceowatermandate.org/files/Disclosure2014.pdf
5. CDP. 2014. www.cdp.net/water
6. IPIECA. 2011. Global Water Tool for Oil and Gas. www.ipieca.org/publication/global-water-tool-oil-and-gas
7. IPIECA. 2012. The biofuels and water nexus. Guidance document for the oil and gas industry.
http://www.ipieca.org/publication/biofuels-and-water-nexus-guidance-document-oil-and-gas-industry
8. IPIECA. 2014. Efficiency in water use. Guidance document for the upstream onshore oil and gas industry.
www.ipieca.org/publication/efficiency-water-use-guidance-document-upstream-onshore-oil-and-gas-industry
9. IPIECA. 2013. The IPIECA Water Management Framework for onshore oil and gas activities. www.ipieca.org/water-management-framework
10. IPIECA. 2014. Identifying and assessing water sources: Guidance document for the onshore oil and gas industry.
www.ipieca.org/publication/identifying-and-assessing-water-sources
11. IPIECA. 2014. Review of water risk tools. Guidance document for the oil and gas industry.
www.ipieca.org/publication/review-water-risk-tools-guidance-document-oil-and-gas-industry
12. UNEP. 2013. GEO-5 for Business: Impacts of a Changing Environment on the Corporate Sector.
www.unep.org/geo/pdfs/geo5/geo5_for_business.pdf
13. UNESCO World Water Assessment Programme (WWAP—2008 data). www.unesco.org/new/en/natural-sciences/environment/water/wwap
Section 4 Environm
ental issues and indicators
Environmental issues and indicators Water E6: Fresh water
61
OIL AND GAS INDUSTRY GUIDANCE ON VOLUNTARY SUSTAINABILITY REPORTING
DEFINITION OF TERMS
• Fresh water: the definition varies in accordance with local statutes and regulations. Where it is not defined by local
regulations, fresh water is defined for reporting purposes as non-brackish water and may include drinking water,
potable water, water used in agriculture, etc. The total dissolved solids (TDS) concentration of this water type is up
to 2000 mg/l.
• Fresh water withdrawn: the volume of fresh water removed from sources (including surface water, groundwater,
harvested rainwater and municipal water supplies) and taken into the boundaries of the reporting company for use.
• Fresh water returned: the volume of fresh water discharged from a facility (directly or via a third party) into the
same source or a different freshwater source but in the same catchment/watershed. It is recommended that the
discharge value is corrected by subtracting the amount of water which was not originally part of the fresh water
withdrawn. Examples include collected storm water, or any groundwater from remediation activities (unless used in
the facility as a source of fresh water). Fresh water that is discharged to a different source that is a non-freshwater
supply, body or aquifer should not be considered fresh water returned.
• Fresh water consumption: the difference between fresh water withdrawn and fresh water returned.
• Fresh water withdrawal intensity: the ratio between freshwater withdrawal and a defined unit of production (for
example barrels of oil for upstream operations and crude oil throughput for downstream/refining operations, and
product specific for petrochemical operations). Can be calculated by dividing the volume of fresh water withdrawn
by the output or volume of product created.
• Fresh water consumption intensity: the ratio between freshwater consumption and a defined unit of production
(for example barrels of oil for upstream operations and crude oil throughput for downstream/refining operations,
and product specific for petrochemical operations). Can be calculated by dividing the volume of fresh water
consumed by the output or volume of product created.
• Water replaced: water sourced from a non-freshwater body that has replaced an existing freshwater source to
reduce freshwater withdrawal and/or consumption.
• Water reused/recycled: water that has been used more than once in a process or used in other processes, with
treatment as appropriate, to reduce freshwater withdrawal. Note that the terms reused and recycled are similar and
not differentiated for this indicator. If reused/recycled water is reported quantitatively, the reported volume should
equal the reduction in the volume of freshwater withdrawn that resulted from the reuse/recycling.
• Reduction in fresh water withdrawn or consumed: a decrease in fresh water withdrawn or consumed in the
reporting year due to planned actions, projects or measures to replace or reuse/recycle water. Freshwater
reductions should be sustainable in future years and can only be aggregated over multiple years when referenced
against the total change in fresh water withdrawn or consumed in the same period.
• Water stress/scarcity: when reporting qualitative and quantitative water stress and scarcity information, the
definition or indicator of stress and scarcity should be defined by the company. There is no one measure of stress
and scarcity that is universally accepted. Many tools and models have been developed that map stress and scarcity.
IPIECA has looked at a range of these tools in the 2014 publication Review of water risk tools, and does not make
any specific recommendation to companies on which one to use. Examples of definitions that can be used include:
- The Falkenmark Water Stress Indicator, as used in the IPIECA Global Water Tool for Oil and Gas (2011). This is an
availability indicator to define stress and scarcity mapped on a country and watershed level.
- The CEO Water Mandate (2014a) has recently developed qualitative definitions of water stress and scarcity
drawing on approaches and commentary from organizations such as the Alliance for Water Stewardship, CDP and
the Water Footprint Network. These are broad definitions: scarcity is related to the physical availability of water
while stress includes availability, quality and accessibility.
Sect
ion
4 E
nviro
nmen
tal i
ssue
s an
d in
dica
tors
Environmental issues and indicators Water E6: Fresh water
IPIECA • API • IOGP
62
Common reporting elements
Other reporting elements
Supplemental reporting elements
C1 Report total volume of
fresh water withdrawn.
C2 Report total volume of
fresh water consumed.
O1 Report total reduction in fresh water withdrawn or consumed due to water reduction measures, or water replaced
or recycled/reused within the boundaries of the reporting company.
O2 Report separately the volume of water recycled from an external source, such as a third-party effluent treatment
plant, taken into the boundaries of the reporting company, as an alternative to fresh water withdrawn from surface
or groundwater sources or purchased as potable water. This is often termed ‘reclaimed water’.
O3 Report freshwater withdrawal as a percentage of total water withdrawn.
O4 Report the percentage of freshwater withdrawal or consumption located in water-stressed or water-scarce areas,
detailing how the percentage was derived.
O5 Report the total volume of fresh water returned to the freshwater environment.
O6 Provide quantitative and qualitative information on operations located in water-stressed or water-scarce areas or
other locations where potential water management risks have been identified, including:
• volumes of water withdrawn and/or consumed from sources such as municipal water supplies or other water
utilities, and surface water, including water from lakes, ponds, streams, rivers and aquifers;
• the volume of fresh water (treated as necessary) returned to the freshwater environment;
• the freshwater withdrawal or consumption intensity (as described in supplemental reporting elements) for the
location;
• the water management practices being adopted;
• describe how freshwater withdrawals have been avoided or minimized; and
• describe community and stakeholder engagement activities in relation to water management and the
environment.
O7 Describe how other types of water, if significant, are managed. Other types of water may include produced water,
process waste water, storm water or desalinated water. Descriptions may include:
• water treatment;
• water reused/recycled (indicating use by the company or others); and/or
• returned to the environment by destination (e.g. types of water environment, irrigation, evaporation ponds, deep
wells), indicating water volumes if appropriate.
O8 Provide information on company use of fresh groundwater extracted for remediation or to control the migration of
contaminated groundwater.
Reporting elements
S1 Report freshwater consumption per unit of production, the freshwater
consumption intensity, by business activity (e.g. oil and gas production, refining).
S2 Report freshwater withdrawal per unit of production, the freshwater withdrawal
intensity, by business activity (e.g. oil and gas production, refining).
S3 Report percentage of operations located in water-stressed or scarce areas,
detailing how the percentage was derived.
S4 Report freshwater withdrawals related to once-through cooling water, not
included in the common reporting elements.
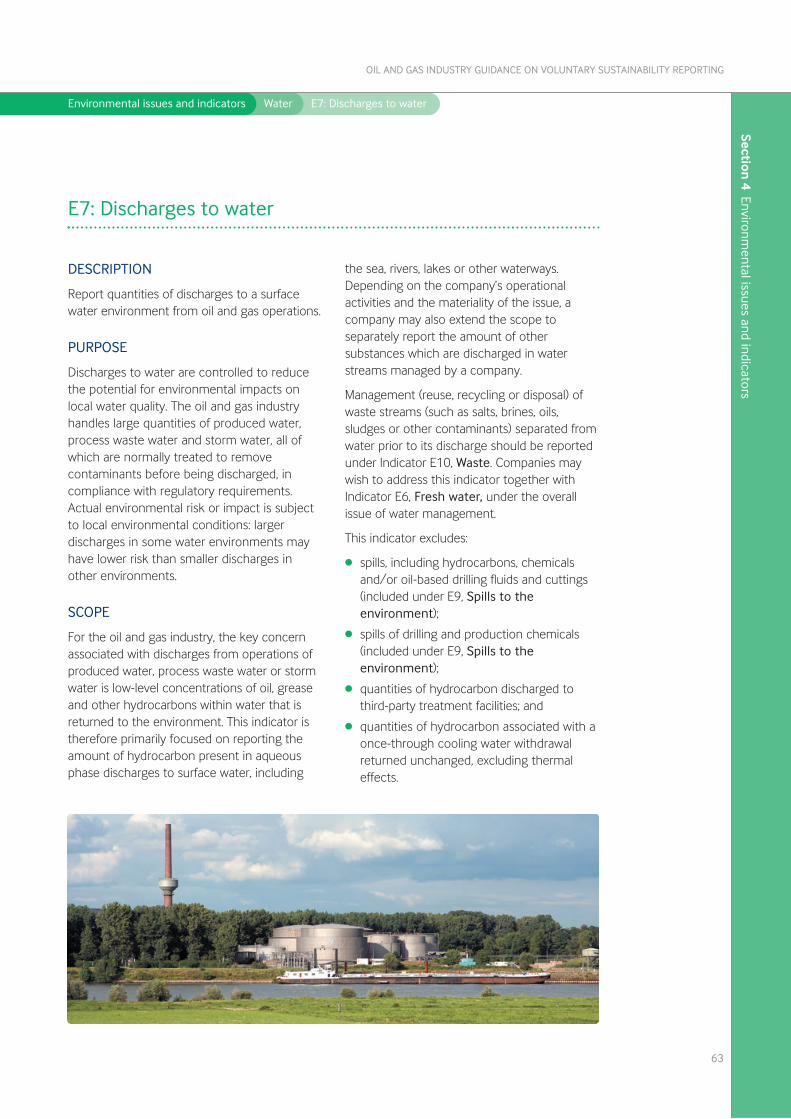
Section 4 Environm
ental issues and indicators
Environmental issues and indicators Water E7: Discharges to water
DESCRIPTION
Report quantities of discharges to a surfacewater environment from oil and gas operations.
PURPOSE
Discharges to water are controlled to reducethe potential for environmental impacts onlocal water quality. The oil and gas industryhandles large quantities of produced water,process waste water and storm water, all ofwhich are normally treated to removecontaminants before being discharged, incompliance with regulatory requirements.Actual environmental risk or impact is subjectto local environmental conditions: largerdischarges in some water environments mayhave lower risk than smaller discharges inother environments.
SCOPE
For the oil and gas industry, the key concernassociated with discharges from operations ofproduced water, process waste water or stormwater is low-level concentrations of oil, greaseand other hydrocarbons within water that isreturned to the environment. This indicator istherefore primarily focused on reporting theamount of hydrocarbon present in aqueousphase discharges to surface water, including
the sea, rivers, lakes or other waterways.Depending on the company’s operationalactivities and the materiality of the issue, acompany may also extend the scope toseparately report the amount of othersubstances which are discharged in waterstreams managed by a company.
Management (reuse, recycling or disposal) ofwaste streams (such as salts, brines, oils,sludges or other contaminants) separated fromwater prior to its discharge should be reportedunder Indicator E10, Waste. Companies maywish to address this indicator together withIndicator E6, Fresh water, under the overallissue of water management.
This indicator excludes:
l spills, including hydrocarbons, chemicalsand/or oil-based drilling fluids and cuttings(included under E9, Spills to theenvironment);
l spills of drilling and production chemicals(included under E9, Spills to theenvironment);
l quantities of hydrocarbon discharged tothird-party treatment facilities; and
l quantities of hydrocarbon associated with aonce-through cooling water withdrawalreturned unchanged, excluding thermaleffects.
63
OIL AND GAS INDUSTRY GUIDANCE ON VOLUNTARY SUSTAINABILITY REPORTING
E7: Discharges to water
Sect
ion
4 E
nviro
nmen
tal i
ssue
s an
d in
dica
tors
Environmental issues and indicators Water E7: Discharges to water
REPORTING BASIS
Report discharge data in metric tonnes ofhydrocarbons (oil and grease) or othersubstances reported. Quantities may also beexpressed in terms of average concentrations(in mg/l or ppm).
Discharge data should be consolidated usingthe reporting boundary ‘operational approach’
(Appendix A) and, where appropriate,companies can include examples to illustrateapplication of the indicator at the local level.
Measurements should be made using testmethods required or approved by localregulatory authorities (or equivalent applicablestandards).
IPIECA • API • IOGP
64
Common reporting elements
Other reporting elements
Supplemental reporting elements
C1 For upstream facilities, report quantity of
hydrocarbons (in metric tonnes) in produced
water and process waste water discharged to
surface water.
C2 For refineries and other oil and gas processing
facilities, report quantity of hydrocarbons (in
metric tonnes) discharged to surface water
from process waste water and storm water.
S1 Report separately the quantity of substances
other than hydrocarbons (in metric tonnes)
discharged to surface water from oil and gas
facilities. Other measures may include chemical
oxygen demand (COD), sulphides, ammonia,
phenols and total suspended solids (TSS), or non-
aqueous drilling fluids discharged).
O1 Discuss efforts to manage discharges within local water environments where there is greater potential for
environmental impacts or benefits, with case studies and examples as appropriate.
O2 Describe community and stakeholder engagement activities in relation to management of discharges to
water.
O3 Explain trends in discharged quantities with respect to operating conditions affected by field age.
Reporting elements
DEFINITION OF TERMS
• Produced water: water that is brought to the surface during the production of hydrocarbons including
formation water, flow-back water and condensation water.
• Process wastewater: water associated with operations that comes into contact with hydrocarbons or
other chemicals.
• Storm water: precipitation falling on (or run-off flowing across) a site that is collected and discharged
from point source outlets (e.g. pipes, collection ditches, storm sewers).
• Discharges: intentional releases from a facility into a water body, typically through a permitted outlet
after treatment.
• Surface water environment: fresh or saline surface water bodies, including rivers, lakes, wetlands, seas
or oceans. Surface water excludes water in the atmosphere or groundwater.
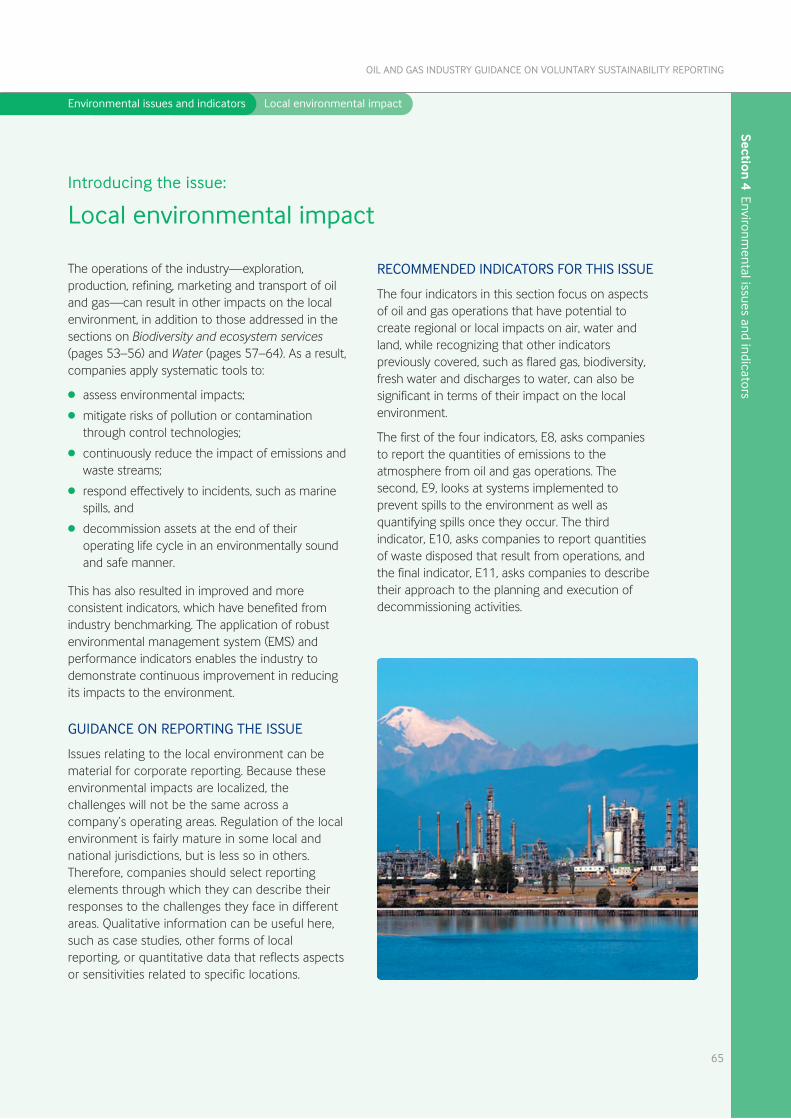
Section 4 Environm
ental issues and indicators
Environmental issues and indicators Local environmental impact
The operations of the industry—exploration,production, refining, marketing and transport of oiland gas—can result in other impacts on the localenvironment, in addition to those addressed in thesections on Biodiversity and ecosystem services(pages 53–56) and Water (pages 57–64). As a result,companies apply systematic tools to:
l assess environmental impacts;
l mitigate risks of pollution or contaminationthrough control technologies;
l continuously reduce the impact of emissions andwaste streams;
l respond effectively to incidents, such as marinespills, and
l decommission assets at the end of theiroperating life cycle in an environmentally soundand safe manner.
This has also resulted in improved and moreconsistent indicators, which have benefited fromindustry benchmarking. The application of robustenvironmental management system (EMS) andperformance indicators enables the industry todemonstrate continuous improvement in reducingits impacts to the environment.
GUIDANCE ON REPORTING THE ISSUE
Issues relating to the local environment can bematerial for corporate reporting. Because theseenvironmental impacts are localized, thechallenges will not be the same across acompany’s operating areas. Regulation of the localenvironment is fairly mature in some local andnational jurisdictions, but is less so in others.Therefore, companies should select reportingelements through which they can describe theirresponses to the challenges they face in differentareas. Qualitative information can be useful here,such as case studies, other forms of localreporting, or quantitative data that reflects aspectsor sensitivities related to specific locations.
RECOMMENDED INDICATORS FOR THIS ISSUE
The four indicators in this section focus on aspectsof oil and gas operations that have potential tocreate regional or local impacts on air, water andland, while recognizing that other indicatorspreviously covered, such as flared gas, biodiversity,fresh water and discharges to water, can also besignificant in terms of their impact on the localenvironment.
The first of the four indicators, E8, asks companiesto report the quantities of emissions to theatmosphere from oil and gas operations. Thesecond, E9, looks at systems implemented toprevent spills to the environment as well asquantifying spills once they occur. The thirdindicator, E10, asks companies to report quantitiesof waste disposed that result from operations, andthe final indicator, E11, asks companies to describetheir approach to the planning and execution ofdecommissioning activities.
65
OIL AND GAS INDUSTRY GUIDANCE ON VOLUNTARY SUSTAINABILITY REPORTING
Introducing the issue:
Local environmental impact
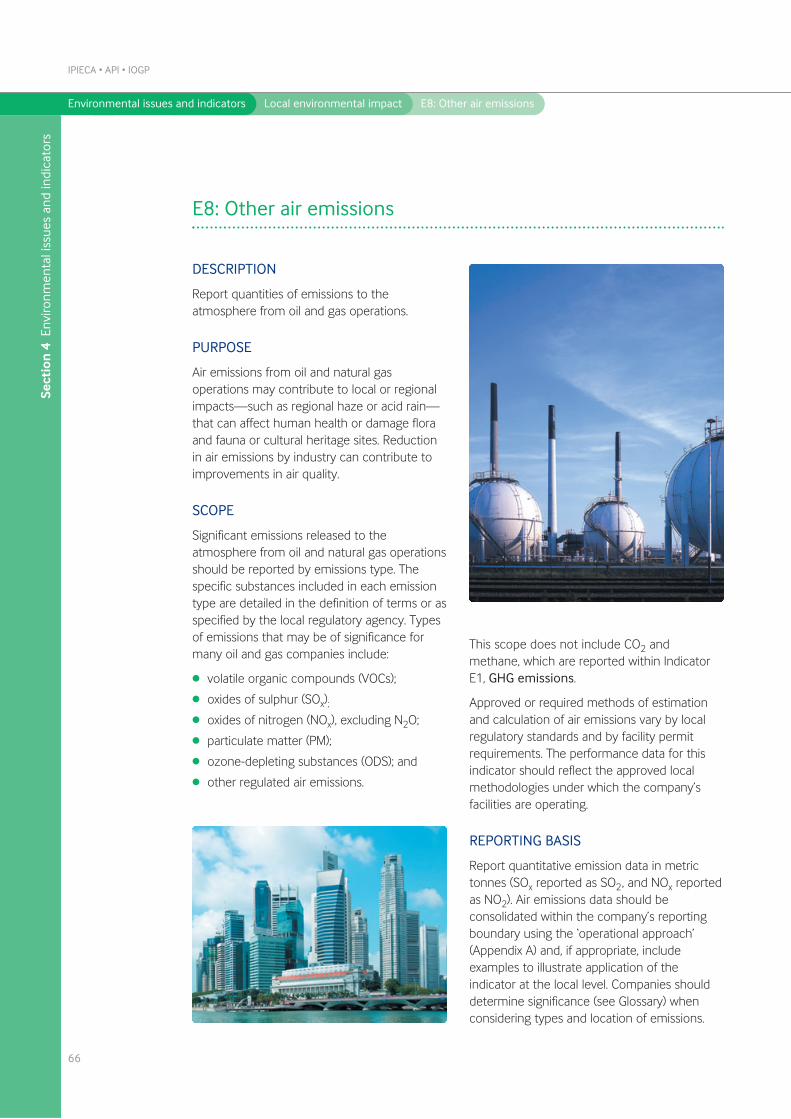
Sect
ion
4 E
nviro
nmen
tal i
ssue
s an
d in
dica
tors
Environmental issues and indicators Local environmental impact E8: Other air emissions
DESCRIPTION
Report quantities of emissions to theatmosphere from oil and gas operations.
PURPOSE
Air emissions from oil and natural gasoperations may contribute to local or regionalimpacts—such as regional haze or acid rain—that can affect human health or damage floraand fauna or cultural heritage sites. Reductionin air emissions by industry can contribute toimprovements in air quality.
SCOPE
Significant emissions released to theatmosphere from oil and natural gas operationsshould be reported by emissions type. Thespecific substances included in each emissiontype are detailed in the definition of terms or asspecified by the local regulatory agency. Typesof emissions that may be of significance formany oil and gas companies include:
l volatile organic compounds (VOCs);
l oxides of sulphur (SOx);l oxides of nitrogen (NOx), excluding N2O;
l particulate matter (PM);
l ozone-depleting substances (ODS); and
l other regulated air emissions.
This scope does not include CO2 andmethane, which are reported within IndicatorE1, GHG emissions.
Approved or required methods of estimationand calculation of air emissions vary by localregulatory standards and by facility permitrequirements. The performance data for thisindicator should reflect the approved localmethodologies under which the company’sfacilities are operating.
REPORTING BASIS
Report quantitative emission data in metrictonnes (SOx reported as SO2, and NOx reportedas NO2). Air emissions data should beconsolidated within the company’s reportingboundary using the ‘operational approach’(Appendix A) and, if appropriate, includeexamples to illustrate application of theindicator at the local level. Companies shoulddetermine significance (see Glossary) whenconsidering types and location of emissions.
IPIECA • API • IOGP
66
E8: Other air emissions
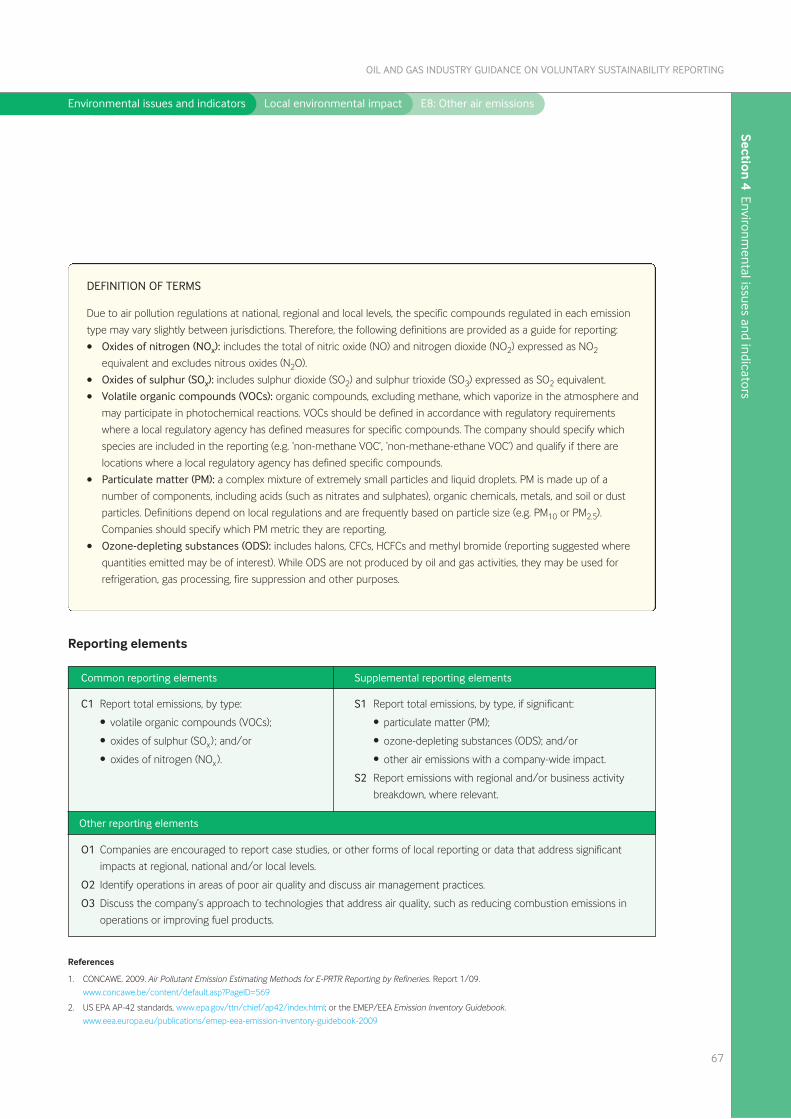
Section 4 Environm
ental issues and indicators
Environmental issues and indicators Local environmental impact E8: Other air emissions
67
OIL AND GAS INDUSTRY GUIDANCE ON VOLUNTARY SUSTAINABILITY REPORTING
DEFINITION OF TERMS
Due to air pollution regulations at national, regional and local levels, the specific compounds regulated in each emission
type may vary slightly between jurisdictions. Therefore, the following definitions are provided as a guide for reporting:
• Oxides of nitrogen (NOx): includes the total of nitric oxide (NO) and nitrogen dioxide (NO2) expressed as NO2
equivalent and excludes nitrous oxides (N2O).
• Oxides of sulphur (SOx): includes sulphur dioxide (SO2) and sulphur trioxide (SO3) expressed as SO2 equivalent.
• Volatile organic compounds (VOCs): organic compounds, excluding methane, which vaporize in the atmosphere and
may participate in photochemical reactions. VOCs should be defined in accordance with regulatory requirements
where a local regulatory agency has defined measures for specific compounds. The company should specify which
species are included in the reporting (e.g. ‘non-methane VOC’, ‘non-methane-ethane VOC’) and qualify if there are
locations where a local regulatory agency has defined specific compounds.
• Particulate matter (PM): a complex mixture of extremely small particles and liquid droplets. PM is made up of a
number of components, including acids (such as nitrates and sulphates), organic chemicals, metals, and soil or dust
particles. Definitions depend on local regulations and are frequently based on particle size (e.g. PM10 or PM2.5).
Companies should specify which PM metric they are reporting.
• Ozone-depleting substances (ODS): includes halons, CFCs, HCFCs and methyl bromide (reporting suggested where
quantities emitted may be of interest). While ODS are not produced by oil and gas activities, they may be used for
refrigeration, gas processing, fire suppression and other purposes.
Common reporting elements Supplemental reporting elements
C1 Report total emissions, by type:
• volatile organic compounds (VOCs);
• oxides of sulphur (SOx) ; and/or
• oxides of nitrogen (NOx).
S1 Report total emissions, by type, if significant:
• particulate matter (PM);
• ozone-depleting substances (ODS); and/or
• other air emissions with a company-wide impact.
S2 Report emissions with regional and/or business activity
breakdown, where relevant.
O1 Companies are encouraged to report case studies, or other forms of local reporting or data that address significant
impacts at regional, national and/or local levels.
O2 Identify operations in areas of poor air quality and discuss air management practices.
O3 Discuss the company’s approach to technologies that address air quality, such as reducing combustion emissions in
operations or improving fuel products.
Reporting elements
References
1. CONCAWE. 2009. Air Pollutant Emission Estimating Methods for E-PRTR Reporting by Refineries. Report 1/09.
www.concawe.be/content/default.asp?PageID=569
2. US EPA AP-42 standards, www.epa.gov/ttn/chief/ap42/index.html; or the EMEP/EEA Emission Inventory Guidebook.
www.eea.europa.eu/publications/emep-eea-emission-inventory-guidebook-2009
Other reporting elements
DESCRIPTION
Describe systems implemented to preventspills to the environment and quantify spillsincluding details of any significant spills andresponse measures undertaken.
PURPOSE
Upstream and downstream activities, includingtransportation of oil using pipelines, marinevessels, road tankers and railcars, pose a risk ofaccidental spills of oil or other materials thatcan pollute water, contaminate soil, harmspecies and affect livelihoods. This indicatormeasures the number and volume of spills(unintended releases) of materials that couldlocally impact the environment, communitiesor cultural heritage.
SCOPE
The most established industry measure is toreport the number and volume of hydrocarbonspills greater than one barrel (bbl) that reachthe environment. (For reference, 1 bbl = 42 USgallons or 159 litres; for solids, convert mass tovolume in barrels, for example, using 159 kg orsimilar default value for weight of material.)The volume reported should represent the totalestimated amount spilled that reached theenvironment. It should not be reduced by theamount of such hydrocarbon subsequentlyrecovered, evaporated or otherwise lost.
In addition to reporting spills that reach theenvironment, companies may choose to reportseparately the number and volume of spillswhether or not the spill reached theenvironment. Thus, total spills would includereleases—hydrocarbon and/or non-hydrocarbon materials—from primarycontainment (e.g. spills that reach theenvironment, plus spills that are containedwithin impermeable secondary containment).This indicator provides further insight onoperational performance and reliability.
Companies should include releases from:
l operations, including but not limited toreleases from above-ground and below-ground facilities or from company-ownedand operated transport; and
l events outside operational control, includingbut not limited to sabotage, earthquakesand extreme weather events.
Leakage over time, above ground orunderground, is counted once at the time it isidentified.
Companies may report spills to soil and waterseparately. A spill that qualifies as a spill to bothsoil and water should be reported as a singlespill to water, with the volume properlyapportioned to soil and water.
The following should be excluded from thereported data:
l once previously reported, spilled materials inthe environment from historical losses (i.e.historical or past leakage/spills that reachedthe environment from tanks, pipes or othervessels, but not associated with a currentrelease); and
l hydrocarbons in produced water dischargesor otherwise permitted discharges (i.e. wastewater effluents etc.), which are included inIndicator E7, Discharges to water.
In the absence of analytical data, reportingcompanies may choose to estimate thehydrocarbon content of spills of oil-watermixtures (e.g. oil–water emulsions, tankbottoms), stating the scope or basis of theestimate. If reporting spills with bothhydrocarbon and non-hydrocarboncomponents, companies should report a singlehydrocarbon spill with the volumes properlyapportioned.
Sect
ion
4 E
nviro
nmen
tal i
ssue
s an
d in
dica
tors
Environmental issues and indicators Local environmental impact E9: Spills to the environment
IPIECA • API • IOGP
68
E9: Spills to the environment
Section 4 Environm
ental issues and indicators
Environmental issues and indicators Local environmental impact E9: Spills to the environment
69
OIL AND GAS INDUSTRY GUIDANCE ON VOLUNTARY SUSTAINABILITY REPORTING
If relevant, companies may separately report spills ofother materials, including chemicals. For chemicalspills involving:
l miscible solutions, the spill volume is based onthe total volume of material spilled; and
l insoluble mixtures, the spill volume is based onthe volume of the chemical constituent.
When reporting significant chemical spills, include adescription of the nature of the substance spilledand any associated risks
REPORTING BASIS
Report the number of spills greater than one barrel(42 US gallons or 159 litres) and the volume of thesespills in barrels (bbl) or cubic metres.
Oil spill data should be consolidated within thecompany’s reporting boundary using the ‘operationalapproach’ (Appendix A) and include examples toillustrate application of the indicator at the local level.
Companies should determine significance (seeGlossary) when considering reporting by type orlocation, or for individual spills.
DEFINITION OF TERMS
• Spill to the environment: any unintended release of liquids or solids associated with current operations, from primary or
secondary containment, into the environment.
• Environment: surface water, soil, groundwater, and ice-covered surface whereby:
- ‘soil’ includes surfaces (e.g. soil, sand, silts, shells, gravel) not designated as impermeable secondary containment, as well as
the underlying sediments and groundwater resources;
- ‘surface water’ includes creeks, rivers, ponds, seas, oceans, etc. but excludes ponds, pits, basins, etc. in place on company
property for purposes of hydrocarbon containment/treatment;
- spills to snow- or ice-covered surfaces are classified based on the surface below the snow or ice; and
- spills to standing rainwater are classified as a spill to soil.
• Hydrocarbon liquids: crude oil, condensate and petroleum-related products containing hydrocarbons that are used or
manufactured, such as: gasoline, residuals, distillates, asphalt, jet fuel, lubricants, naphthas, light ends, bilge oil, kerosene,
aromatics, refinery petroleum-derivatives, non-aqueous drilling fluids (NADFs). Includes:
- biofuels, regardless of percentage mixture with petroleum-based materials (if 100% methanol or ethanol it would be a
chemical spill); and
- the oil fraction of oil/water mixtures (e.g. emulsions, production fluids).
• Non-hydrocarbon materials: materials such as chemicals, aqueous-based drilling fluids, produced water and other process-related
non-hydrocarbons. Examples of chemicals include methanol, ethanol, ketones, methyl tertiary butyl ether (MTBE), sulphuric acid,
caustic, molten sulphur, stimulation acid, brine, dry salts, uncured or powdered cement. Excluded are spills of inert solid materials
such as plastic pellets, solid sulphur, barium sulphate, bentonite or cured solid concrete as well as treated or untreated waste water.
• Containment: primary containment is the vessel, pipe, barrel, etc. designed to keep a material within it; secondary
containment is an impermeable, non-leaking physical barrier specifically designed and maintained to keep spilled materials
from contacting the soil or water (e.g. high-density polyethylene (HDPE) liners, engineered clay liners, asphalt, concrete).
Earthen berms do not count as secondary containment unless they are engineered to be sufficiently impermeable to prevent
spilled oil from contaminating underlying soil and/or groundwater.
• Recovered hydrocarbons: the spilled hydrocarbons removed from the environment through short-term spill response activities. This
does not include longer-term remediation of the spill site. Oil which evaporates or burns should not be included in recovered
volumes. This volume provides an indication of the effectiveness of immediate oil spill response measures.
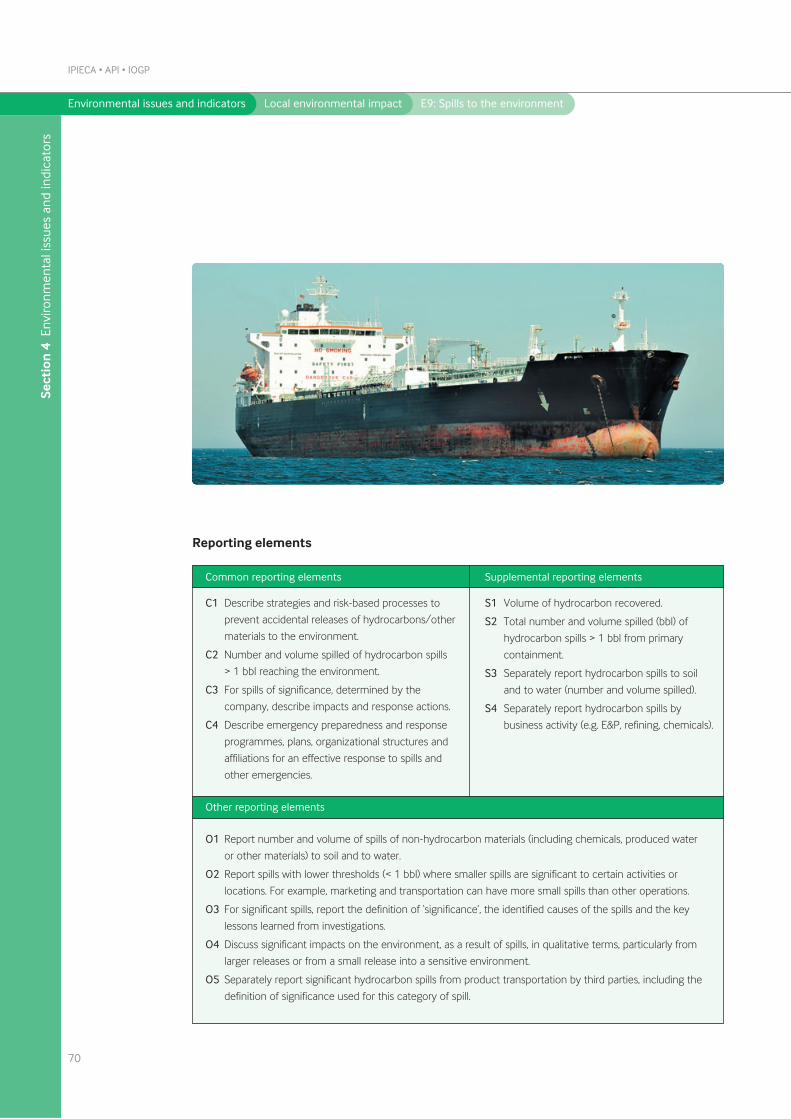
Common reporting elements
Other reporting elements
Supplemental reporting elements
C1 Describe strategies and risk-based processes to
prevent accidental releases of hydrocarbons/other
materials to the environment.
C2 Number and volume spilled of hydrocarbon spills
> 1 bbl reaching the environment.
C3 For spills of significance, determined by the
company, describe impacts and response actions.
C4 Describe emergency preparedness and response
programmes, plans, organizational structures and
affiliations for an effective response to spills and
other emergencies.
S1 Volume of hydrocarbon recovered.
S2 Total number and volume spilled (bbl) of
hydrocarbon spills > 1 bbl from primary
containment.
S3 Separately report hydrocarbon spills to soil
and to water (number and volume spilled).
S4 Separately report hydrocarbon spills by
business activity (e.g. E&P, refining, chemicals).
O1 Report number and volume of spills of non-hydrocarbon materials (including chemicals, produced water
or other materials) to soil and to water.
O2 Report spills with lower thresholds (< 1 bbl) where smaller spills are significant to certain activities or
locations. For example, marketing and transportation can have more small spills than other operations.
O3 For significant spills, report the definition of ‘significance’, the identified causes of the spills and the key
lessons learned from investigations.
O4 Discuss significant impacts on the environment, as a result of spills, in qualitative terms, particularly from
larger releases or from a small release into a sensitive environment.
O5 Separately report significant hydrocarbon spills from product transportation by third parties, including the
definition of significance used for this category of spill.
Reporting elements
Sect
ion
4 E
nviro
nmen
tal i
ssue
s an
d in
dica
tors
Environmental issues and indicators Local environmental impact E9: Spills to the environment
IPIECA • API • IOGP
70
Section 4 Environm
ental issues and indicators
54Environmental issues and indicators Local environmental impact E10: Waste
71
OIL AND GAS INDUSTRY GUIDANCE ON VOLUNTARY SUSTAINABILITY REPORTING
E10: Waste
DESCRIPTION
Report quantities of waste from oil and gasoperations.
PURPOSE
Effective waste management practices areintegral throughout operations to helpminimize localized risks to the environment,communities or cultural heritage, to enhanceresource utilization, and to potentially reducecosts. Waste is not defined consistentlyworldwide and its management often varieswith local conditions. This indicator is usedrecognizing that an important way of reducingwaste impacts is to minimize the generation ofwaste, and that effective waste management isan aspect of operational efficiency.
SCOPE
Report the quantity of hazardous waste disposed,including both on-site and off-site disposal.Companies may report separately the quantitiesof non-hazardous waste disposed, and of wastereused, recycled or recovered. The companyshould clearly state the basis for its reporteddata. Sources that should be included are:
l wastes from operational activities;
l wastes from the immediate response andclean-up of a spill; and
l wastes from replacement or upgrade ofexisting facilities (e.g. during the rebuilding ofa retail service station).
Excluded from the scope are:
l wastes from the remediation of historicalcontamination at active sites;
l wastes from the remediation of inactive orabandoned properties;
l wastes from the construction of newfacilities upon greenfield sites;
l wastes generated by contractors duringmaintenance of their own equipment, or anymaterials brought onto site and eventuallydisposed of as surplus by the contractor;
l drilling muds and cuttings;
l mine tailings6; and
l produced water and waste water.
If a regulatory authority defines any of theseout-of-scope materials as hazardous—or someequivalent term—and they are disposed of asdefined above, they should be reportedaccordingly as hazardous waste.
Separate reporting of waste from unusual orhigh-volume events may enable stakeholders tobetter understand year-to-year fluctuations.Examples of events that can lead to short-termfluctuations in waste generated includeshutdowns and periodic maintenance activitiesin downstream operations and, in upstreamoperations, some drilling operations thatgenerate high volumes of aqueous wastes. Thewaste streams included in separate reportingshould be clearly described.
In areas of the world where no wasteinfrastructure exists, waste may need to besafely stored on-site for an extended period oftime before final disposal or a recovery optioncan take place. Companies should reportseparately the quantity of waste in suchstorage if the amount is significant to theoverall company total of waste reported.Similarly, companies should explain theinclusion of large one-off disposals of storedwaste in their reported numbers.
REPORTING BASIS
Report mass of waste in metric tonnes. Wastedata should be consolidated within thecompany’s reporting boundary using the‘operational approach’ (Appendix A).
6 Companies may choose to report these wastes separately as noted in Other reporting elements on page 73.
It may not be practical to account for all wastefrom operations. If a company has adopted aninternal de minimis reporting threshold, bywhich a facility does not track waste information,it is good practice to disclose the de minimisthreshold and indicate the significance to thecompany’s data—indicating if, for example,routine waste from marketing operations isbelow an established de minimis level.
It is useful to measure or estimate quantities ofwastes (both hazardous and non-hazardous)using methods required or recommended byregulatory agencies or authorities. The method
of measurement and estimation selected shouldbe stated. Recommended methods include:
l direct measurement of quantity on site;
l direct measurement by transporters at thepoint of shipping or loading (consistent withshipping papers);
l direct measurement of quantity by wastedisposal contractor at the point of wastedisposal or by transporters, at the point ofshipping or loading; and
l engineering estimates or processknowledge.
DEFINITION OF TERMS
• Waste: material (solid or liquid) intended to be disposed of, reused, recycled or recovered either on-site or
off-site that is the result of company operations. Includes domestic waste and other discarded material
from offices and commercial (e.g. retail) activity. It does not include regulated or authorized water
discharges such as effluent from water treatment plants or produced water from oil and gas production.
• Hazardous waste: waste that is defined as hazardous, toxic, dangerous, listed, priority, special—or similar
term—per an applicable country, regulatory agency or authority.
• Non-hazardous waste: industrial wastes resulting from company operations, including process and oil
field wastes (solid and liquid) disposed either on-site or off-site. Includes industrial waste and other office,
commercial (e.g. retail) or packaging-related wastes. Excludes hazardous waste as defined above.
• Disposal: any waste management option, either on-site or off-site, classified as ‘disposal’ by an appropriate
regulatory agency or authority, or in cases where such classification is absent, any waste management that
does not meet the definition of ‘reused, recycled and recovered’ wastes (e.g. land filling or burning without
energy recovery). Temporary storage is not considered disposal.
• Reused, recycled or recovered wastes: wastes from an industrial or commercial (e.g. retail) process that
are not disposed of, but are reused (e.g. used as a raw material for another process) or recovered for
beneficial use. The term ‘Reused, recycled or recovered materials’ is equivalent and may be preferred to
align reporting with local regulatory definitions. Examples may include: catalysts sent for reclamation;
sludge used for fuel; reused construction materials; recovered used oil and solvents; recycled scrap metal;
drums, pallets and packaging returned or reused; plastic, glass or paper reused or reprocessed; and
uncontaminated earthen materials used as fill.
Sect
ion
4 E
nviro
nmen
tal i
ssue
s an
d in
dica
tors
Environmental issues and indicators Local environmental impact E10: Waste
IPIECA • API • IOGP
72
Section 4 Environm
ental issues and indicators
Environmental issues and indicators Local environmental impact E10: Waste
73
OIL AND GAS INDUSTRY GUIDANCE ON VOLUNTARY SUSTAINABILITY REPORTING
Common reporting elements
Other reporting elements
Supplemental reporting elements
C1 Total quantity, in metric tonnes, of hazardous
waste disposed.
S1 Total quantity of non-hazardous waste disposed.
S2 Waste recycled, reused or recovered.
O1 Report separately quantities of waste by waste streams and by business.
O2 Report separately quantities of waste stored and awaiting treatment prior to disposal or recycling.
O3 In addition to reporting quantities of waste disposed, companies may wish to also report waste generated,
prior to recycle, reuse or recovery measures.
O4 Report separately wastes excluded from routine reporting: e.g. wastes from remediation activities at either
active and/or inactive sites, waste associated with unusual activities such as large one-time construction
projects, or large-volume wastes such as drill mud and cuttings, or mine tailings.
O5 Describe efforts to minimize the generation of waste and improve on company waste management
practices.
Reporting elements
References
1. European Parliament. Directive 2008/98/EC on Waste. (19 November 2008).
eur-lex.europa.eu/LexUriServ/LexUriServ.do?uri=OJ:L:2008:312:0003:0003:EN:PDF
2. IOGP. 2008. Guidelines for waste management with special focus on areas with limited infrastructure. IOGP Report 413. (Rev. 1.1 September
2008; updated March 2009). www.iogp.org/pubs/413.pdf
Sect
ion
4 E
nviro
nmen
tal i
ssue
s an
d in
dica
tors
Environmental issues and indicators Local environmental impact E11: Decommissioning
IPIECA • API • IOGP
74
E11: Decommissioning
At the supplemental reporting level, companiescan provide the number, geographic location,description and progress status of anysignificant decommissioning projects currentlyunder way, individually or by type. Discussionmay also consider intended outcomes and anyplans for disposition of the asset for beneficialend use. Companies may focus on larger singleprojects such as the decommissioning of entirefacilities, e.g. onshore or offshore oil and gasproduction rigs, refineries, gas processingplants or large-scale terminals. Alternatively,companies may collectively describe thedifferent types of decommissioning activitiesundertaken, which could include smaller assets,such as fuel terminals, well sites, servicestations or mobile and/or floating equipment.
REPORTING BASIS
Companies should clarify the terminology usedand the types of assets covered by theirapproach. For reporting at the supplementallevel, companies should determine whichprojects are ‘significant’ for reporting based onthe scale, location, type and potential impact ofcurrent decommissioning activities (includingabatement, demolition, remediation andreclamation). The determination can besupported by assessment of materiality of theissue to the company and its stakeholders, interms of financial scale or environmental/socialimpact (see Appendix B).
DESCRIPTION
Describe the company’s approach to planningand execution of decommissioning activities(includes abatement, demolition, remediationand reclamation).
PURPOSE
Companies plan and undertake activities todecommission assets at the end of theiroperating life cycle. The plans for such projectsare detailed and often involve regulators andother stakeholders. Effective plans addresspotential environmental impacts and also helpto ensure that decommissioning activities aresafe and compliant with regulations. While thetechnical complexity and potential impacts ofonshore versus offshore decommissioning willvary depending on the type, scale andgeographic location of the assets, as well asecosystem and socio-economic considerations,the overall goals are the same with respect toprotecting the environment and the safety ofthe workforce.
SCOPE
The company’s overall management approachmay include descriptions of establishedpolicies, standards, processes, practices orprocedures. Information on the company’sapproach to decommissioning can includeplanned resources (finance, labour), recyclingand/or reuse of materials, asset disposition,safety, security and engagement withcommunities and/or local authorities.
Plans for decommissioning relate to the plannedclosure and/or retirement of assets at the endof their operational life cycle. Whether onshore oroffshore, decommissioning planning is normallyregulated, with governments and industryworking to ensure that provisions are set asidefor plans that meet defined standards forenvironmental protection, protect cultural heritageresources and address societal expectations.
Section 4 Environm
ental issues and indicators
Environmental issues and indicators Local environmental impact E11: Decommissioning
75
OIL AND GAS INDUSTRY GUIDANCE ON VOLUNTARY SUSTAINABILITY REPORTING
DEFINITION OF TERMS
• Assets: an identifiable resource that is owned or controlled by the company. Typically, an asset is a facility
or group of facilities, and may comprise land or sea acreage, buildings and engineered structures (e.g.
refineries, production rigs or platforms, chemical facilities, process plant, wells, pipelines, terminals,
electrical distribution systems, roads, retail outlets, offices or supporting infrastructure).
• Decommissioning: a formal process to permanently remove an asset after active service, with due regard
for potential impacts on the environment. The term ‘decommissioning’ is intended to include the
following activities:
- Abatement: safe removal of hazards such as asbestos, PCBs (polychlorinated biphenyls), hydrocarbon,
or H2S from an asset.
- Demolition: a process and activities surrounding removal of an asset.
- Remediation: a process that reduces or eliminates potential impacts in areas of land or water in order
to restore environmental conditions to acceptable levels with reference to regulatory or company
standards as appropriate.
- Reclamation: the restoration of disturbed lands to similar pre-development condition, other
economically productive use, or natural or semi-natural habitat.
Common reporting elements
Other reporting elements
Supplemental reporting elements
C1 Report the company’s management approach,
for planning and execution of decommissioning
activities for:
• offshore assets; and
• onshore assets.
S1 Provide the number, location, status and brief
description of significant decommissioning and
remediation projects.
S2 Describe technology and research initiatives
related to decommissioning and remediation.
O1 Report the total financial provision made by the company for decommissioning offshore and/or onshore
projects.
Reporting elements
References
1. IOGP. 2012. Decommissioning of offshore concrete gravity based structures (CGBS) in the OSPAR maritime area/other global regions.
IOGP Report 484, November 2012
2. IOGP. 1997. Offshore pipeline decommissioning. IOGP Report 258, August 1997.
3. IOGP. 1996. Decommissioning remediation and reclamation guidelines for onshore E&P sites. IOGP Report 242, October 1996.

This page intentionally left blank
77
OIL AND GAS INDUSTRY GUIDANCE ON VOLUNTARY SUSTAINABILITY REPORTING
Section 5
Health and safetyissues and indicators
Health and safety issues and indicators
OVERVIEW
The oil and gas industry undertakes activitiesthat are intrinsically hazardous, for example,containment of flammable hydrocarbons atelevated temperatures and pressures, work atheights and in confined spaces, or helicoptertransfers to offshore facilities. The health andsafety risks related to these hazards have to bemanaged systematically across a company’sactivities, including seismic and drilling projects,facility operations, maintenance, construction,and marine and road transport.
Companies are encouraged to report on theiroverall approach to managing health and safetyrisks, including planned initiatives andmeasures to improve performance.Management systems (see page 16) have beensuccessful in mitigating health and safety risksand reducing the number of incidents. Animportant aspect of these systems iscontinuous improvement that is assessed bymonitoring performance using indicators.
The most common types of health and safetyincidents occur in the workplace, and therefore,three of the five indicators focus on protectionof the workforce, including measurement ofincidents that can provide lessons for the future.Less frequent, but potentially more severe, arefailures of plant integrity or product-relatedhazards to third parties. Process safety (HS5) isan indicator that addresses the potential forserious loss-of-containment events, while theProduct stewardship indicator (HS4) reportson measures to manage product-related risks.Health and safety related incidents can havemultiple connections to environmental,economic and social issues, and indicators, whichare covered in Sections 4 and 6 of the Guidance.
The five indicators strike a balance betweenproviding quantitative ‘lagging’ data, on theoutcomes and consequences of health andsafety risks, and qualitative ‘leading’information that focuses on the systems inplace to continuously improve performanceand reduce risk.
IPIECA • API • IOGP
78
Section 5
Health and safety issues and indicators
Sect
ion
5 H
ealth
and
saf
ety
issu
es a
nd in
dica
tors
Summary of health and safety issues and indicators
Issue Indicator Page number
Workforce protection HS1: Workforce participation 80
HS2: Workforce health 82
HS3: Occupational injury and illness incidents 84
Product health, safety and HS4: Product stewardship 88
environmental risks
Process safety and asset integrity HS5: Process safety 91
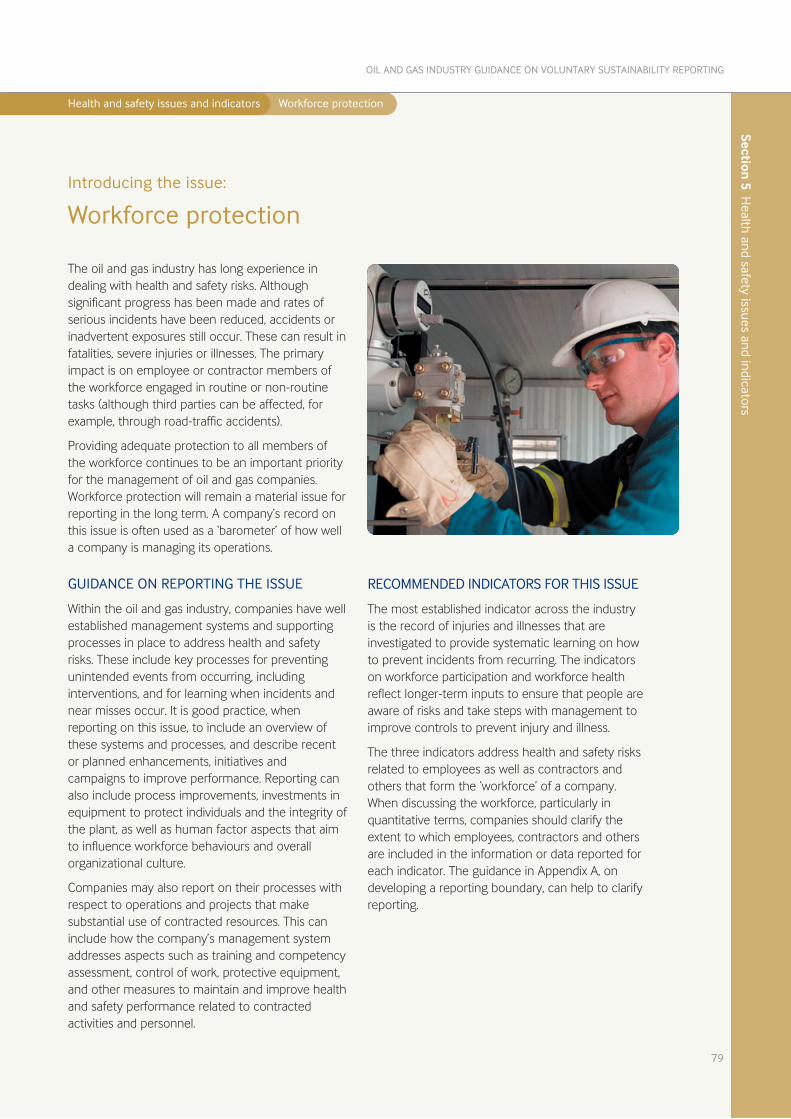
Health and safety issues and indicators Workforce protection
The oil and gas industry has long experience indealing with health and safety risks. Althoughsignificant progress has been made and rates ofserious incidents have been reduced, accidents orinadvertent exposures still occur. These can result infatalities, severe injuries or illnesses. The primaryimpact is on employee or contractor members ofthe workforce engaged in routine or non-routinetasks (although third parties can be affected, forexample, through road-traffic accidents).
Providing adequate protection to all members ofthe workforce continues to be an important priorityfor the management of oil and gas companies.Workforce protection will remain a material issue forreporting in the long term. A company’s record onthis issue is often used as a ‘barometer’ of how wella company is managing its operations.
GUIDANCE ON REPORTING THE ISSUE
Within the oil and gas industry, companies have wellestablished management systems and supportingprocesses in place to address health and safetyrisks. These include key processes for preventingunintended events from occurring, includinginterventions, and for learning when incidents andnear misses occur. It is good practice, whenreporting on this issue, to include an overview ofthese systems and processes, and describe recentor planned enhancements, initiatives andcampaigns to improve performance. Reporting canalso include process improvements, investments inequipment to protect individuals and the integrity ofthe plant, as well as human factor aspects that aimto influence workforce behaviours and overallorganizational culture.
Companies may also report on their processes withrespect to operations and projects that makesubstantial use of contracted resources. This caninclude how the company’s management systemaddresses aspects such as training and competencyassessment, control of work, protective equipment,and other measures to maintain and improve healthand safety performance related to contractedactivities and personnel.
RECOMMENDED INDICATORS FOR THIS ISSUE
The most established indicator across the industryis the record of injuries and illnesses that areinvestigated to provide systematic learning on howto prevent incidents from recurring. The indicatorson workforce participation and workforce healthreflect longer-term inputs to ensure that people areaware of risks and take steps with management toimprove controls to prevent injury and illness.
The three indicators address health and safety risksrelated to employees as well as contractors andothers that form the ‘workforce’ of a company.When discussing the workforce, particularly inquantitative terms, companies should clarify theextent to which employees, contractors and othersare included in the information or data reported foreach indicator. The guidance in Appendix A, ondeveloping a reporting boundary, can help to clarifyreporting.
79
OIL AND GAS INDUSTRY GUIDANCE ON VOLUNTARY SUSTAINABILITY REPORTING
Introducing the issue:
Workforce protection
Section 5 H
ealth and safety issues and indicators
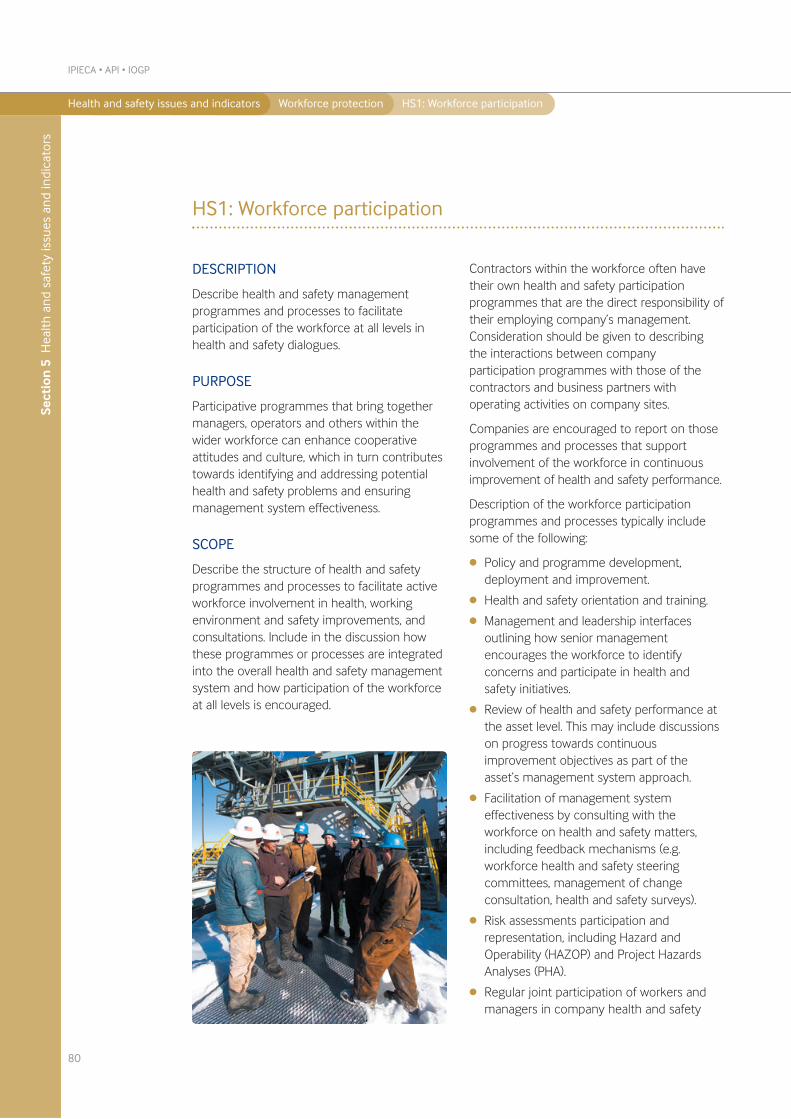
Health and safety issues and indicators Workforce protection HS1: Workforce participation
DESCRIPTION
Describe health and safety managementprogrammes and processes to facilitateparticipation of the workforce at all levels inhealth and safety dialogues.
PURPOSE
Participative programmes that bring togethermanagers, operators and others within thewider workforce can enhance cooperativeattitudes and culture, which in turn contributestowards identifying and addressing potentialhealth and safety problems and ensuringmanagement system effectiveness.
SCOPE
Describe the structure of health and safetyprogrammes and processes to facilitate activeworkforce involvement in health, workingenvironment and safety improvements, andconsultations. Include in the discussion howthese programmes or processes are integratedinto the overall health and safety managementsystem and how participation of the workforceat all levels is encouraged.
Contractors within the workforce often havetheir own health and safety participationprogrammes that are the direct responsibility oftheir employing company’s management.Consideration should be given to describingthe interactions between companyparticipation programmes with those of thecontractors and business partners withoperating activities on company sites.
Companies are encouraged to report on thoseprogrammes and processes that supportinvolvement of the workforce in continuousimprovement of health and safety performance.
Description of the workforce participationprogrammes and processes typically includesome of the following:
l Policy and programme development,deployment and improvement.
l Health and safety orientation and training.
l Management and leadership interfacesoutlining how senior managementencourages the workforce to identifyconcerns and participate in health andsafety initiatives.
l Review of health and safety performance atthe asset level. This may include discussionson progress towards continuousimprovement objectives as part of theasset’s management system approach.
l Facilitation of management systemeffectiveness by consulting with theworkforce on health and safety matters,including feedback mechanisms (e.g.workforce health and safety steeringcommittees, management of changeconsultation, health and safety surveys).
l Risk assessments participation andrepresentation, including Hazard andOperability (HAZOP) and Project HazardsAnalyses (PHA).
l Regular joint participation of workers andmanagers in company health and safety
IPIECA • API • IOGP
80
HS1: Workforce participation
Sect
ion
5 H
ealth
and
saf
ety
issu
es a
nd in
dica
tors
Health and safety issues and indicators Workforce protection HS1: Workforce participation
programme, e.g. behaviour-based safetyprogrammes, site and activity observations,job safety analysis meetings, andresponsibilities for all to identify andrespond to workplace risks. This shouldinclude steps to ensure workforce inclusionthereby preventing segmentation,discrimination or exclusion.
REPORTING BASIS
The leading indicator is qualitative andreportable at a global level, and may besupported by local case studies and, whereavailable, quantitative data on extent ofprogrammes. The workforce includes bothcompany employees and contractors.Quantitative workforce data should beconsolidated within the company’s reportingboundary using the ‘workforce approach’(Appendix A).
81
OIL AND GAS INDUSTRY GUIDANCE ON VOLUNTARY SUSTAINABILITY REPORTING
Section 5 H
ealth and safety issues and indicators
Common reporting elements
Other reporting elements
Supplemental reporting elements
C1 Describe the company’s approach to
managing workforce participation in
health and safety dialogues.
S1 Provide case studies on specific activities at the
facility level that illustrate the application of the
management approach (e.g. local workforce
participation programmes, verification processes,
outcomes or actions based on assessment of results).
O1 Discuss coverage of programmes and the extent to which contractors are included.
Reporting elements
References
1. ILO. 1999. Report of the Director General: Decent Work. International Labour Organization 87th session, Geneva, June 1999.
www.ilo.org/public/english/standards/relm/ilc/ilc87/rep-i.htm
2. ILO. 2009. Tripartite Meeting on Promoting Social Dialogue and Good Industrial Relations from Oil and Gas Exploration and Production to Oil
and Gas Distribution. International Labour Organization, Geneva, 11–14 May 2009.
www.ilo.org/sector/activities/sectoral-meetings/WCMS_161182/lang--en/index.htm
Health and safety issues and indicators Workforce protection HS2: Workforce health
DESCRIPTION
Describe programmes and processes foridentifying and addressing significant workforcehealth issues, especially at the community andcountry level.
PURPOSE
Understanding the workforce health profilehelps identify opportunities for improvingworkforce health and the company’s businessperformance through an effective healthprogramme.
SCOPE
This indicator provides a group of measuresthat focus on the potential health risks in theworkplace but can also include health issues inthe communities where businesses arelocated. Sources of information may includelocal public health officials, absenteeism data,benefit claims, and clinic and incident data.Dialogue with workforce is an effectivemethod for obtaining an understanding ofopportunities for improvement (see Workforceparticipation, HS1).
Occupational health programmes andprocesses to support a Health ManagementSystem (HMS) and health performanceindicators are described in Health PerformanceIndicators: A Guide for the Oil and Gas Industry(IOGP-IPIECA, 2007). Key elements of HMSinclude:
l Health risk assessment: providesworkplace tools such as Health RiskAssessment (HRA) for health protectionplanning during the design of new projects,products and operations or modifications toexisting processes, products or operations.This includes gender-based profile issues(e.g. cardiovascular data, chemical exposurelevels, reproductive heath, etc.).
l Industrial hygiene and control ofworkplace exposures: focuses on potentialhealth hazards in the workplace, such asbenzene, hearing conservation, confinedspace entry, food and water safety, repetitivestress injury prevention programmes, etc.
l Medical emergency management:describes processes such as emergencyresponse, emergency evacuation,communication and business continuityplans.
l Management of ill health in theworkplace: includes medical andpsychological illness or injury, and capabilityto deliver an appropriate level of routine andemergency care.
l Fitness for task assessment and healthsurveillance: provides methodology todetermine whether employees are able tomeet the essential physical, psychologicaland cognitive requirements of their jobwithout risk to self, others or theenvironment, and are not impaired byfatigue, drugs, alcohol or disabling medicalconditions.
l Health impact assessment (HIA): detailsprocesses that support environmental andsocial impact assessments for new projectsand the reassessment of existing operations.
l Health reporting and recordmanagement: outlines steps that ensuredocuments, procedures, records and otherinformation are current, accessible andcontrolled for quality, confidentiality, legalcompliance and retention standards.
l Public health interface and promotion ofgood health: describes programmes, basedon risk and epidemiological information, topromote personal health awareness in areassuch as obesity, smoking, nutrition, exercise,mental health, substance abuse, hygiene,and infectious communicable diseases (e.g.tuberculosis, malaria, HIV/AIDS, food-borne/waterborne illness, dengue, Ebola, etc.).
IPIECA • API • IOGP
82
HS2: Workforce health
Sect
ion
5 H
ealth
and
saf
ety
issu
es a
nd in
dica
tors
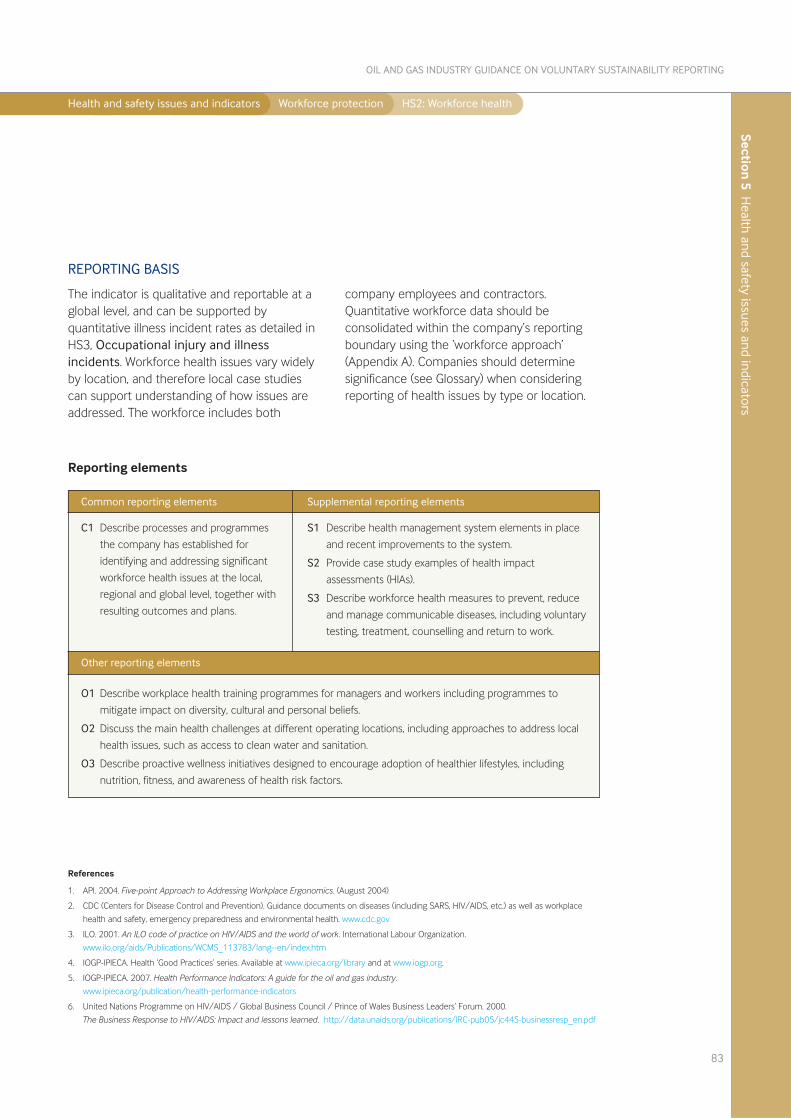
Health and safety issues and indicators Workforce protection HS2: Workforce health
83
OIL AND GAS INDUSTRY GUIDANCE ON VOLUNTARY SUSTAINABILITY REPORTING
Section 5 H
ealth and safety issues and indicators
Common reporting elements
Other reporting elements
Supplemental reporting elements
C1 Describe processes and programmes
the company has established for
identifying and addressing significant
workforce health issues at the local,
regional and global level, together with
resulting outcomes and plans.
S1 Describe health management system elements in place
and recent improvements to the system.
S2 Provide case study examples of health impact
assessments (HIAs).
S3 Describe workforce health measures to prevent, reduce
and manage communicable diseases, including voluntary
testing, treatment, counselling and return to work.
O1 Describe workplace health training programmes for managers and workers including programmes to
mitigate impact on diversity, cultural and personal beliefs.
O2 Discuss the main health challenges at different operating locations, including approaches to address local
health issues, such as access to clean water and sanitation.
O3 Describe proactive wellness initiatives designed to encourage adoption of healthier lifestyles, including
nutrition, fitness, and awareness of health risk factors.
Reporting elements
References
1. API. 2004. Five-point Approach to Addressing Workplace Ergonomics. (August 2004)
2. CDC (Centers for Disease Control and Prevention). Guidance documents on diseases (including SARS, HIV/AIDS, etc.) as well as workplace
health and safety, emergency preparedness and environmental health. www.cdc.gov
3. ILO. 2001. An ILO code of practice on HIV/AIDS and the world of work. International Labour Organization.
www.ilo.org/aids/Publications/WCMS_113783/lang--en/index.htm
4. IOGP-IPIECA. Health ‘Good Practices’ series. Available at www.ipieca.org/library and at www.iogp.org.
5. IOGP-IPIECA. 2007. Health Performance Indicators: A guide for the oil and gas industry.
www.ipieca.org/publication/health-performance-indicators
6. United Nations Programme on HIV/AIDS / Global Business Council / Prince of Wales Business Leaders’ Forum. 2000.
The Business Response to HIV/AIDS: Impact and lessons learned. http://data.unaids.org/publications/IRC-pub05/jc445-businessresp_en.pdf
REPORTING BASIS
The indicator is qualitative and reportable at aglobal level, and can be supported byquantitative illness incident rates as detailed inHS3, Occupational injury and illnessincidents. Workforce health issues vary widelyby location, and therefore local case studiescan support understanding of how issues areaddressed. The workforce includes both
company employees and contractors.Quantitative workforce data should beconsolidated within the company’s reportingboundary using the ‘workforce approach’(Appendix A). Companies should determinesignificance (see Glossary) when consideringreporting of health issues by type or location.

Health and safety issues and indicators Workforce protection HS3: Occupational injury and illness incidents
DESCRIPTION
Report health and safety data on workforceinjuries or illnesses resulting from occupationalincidents.
PURPOSE
The reporting and analysis of workforceoccupational incident injury and illness ratesprovides trend and causation information onhealth and safety performance and enablesassessment of continuous improvementobjectives. Incident reporting and investigationsupports consistency of health and safetymanagement standards and facilitatesperformance benchmarking among oil and gascompanies.
SCOPE
Guidelines for reporting injuries and illnesseshave been published by a number oforganizations, including the U.S. OccupationalSafety and Health Administration (OSHA), IOGPand the European Chemical Industry Council(CEFIC). While there is broad alignment amongthem, there are some differences in definitionsand exemptions. The reporting basis usedshould therefore be clearly stated. Thepreferred basis is the IOGP guidance, due towidespread adoption within the oil and gasindustry, however it is recognized that this maynot be appropriate for some companies insome areas.
The various guidelines provide details on thedetermination of whether an event was anoccupational incident. The guidelines alsoprovide for the appropriate categorization ofincident severity including criteria such asmedical treatment beyond first aid, restrictedduty, lost time, loss of consciousness or death.It is important for overall reporting integrity thatinjury or illness classifications are made on anaccurate and consistent basis.
An occupational incident (i.e. a work-relatedevent or exposure) is recordable if it eithercaused or contributed (in any amount) to:
l a new injury or illness;
l an exacerbation of a pre-existing non-occupational injury or illness; or
l an exacerbation of a pre-existingoccupational injury or illness.
The guidelines provide a list of exceptions toexclude incidents that have occurred in thework environment but are not occupational (i.e.not work-related).
Reporting of total recordable injury and illness,lost time injury and illness and fatal accidentrates should include separate rates for bothcompany employees and contracted workers.Injury and illness rates should be reportedseparately. Companies may also include relateddata such as combined rates for the totalworkforce, numbers of incidents and hoursworked.
Data should be set into the appropriate contextthat can include interpretation of incidenttrends, or progress and plans aimed atachieving management system objectives.
IPIECA • API • IOGP
84
HS3: Occupational injury and illness incidents
Sect
ion
5 H
ealth
and
saf
ety
issu
es a
nd in
dica
tors
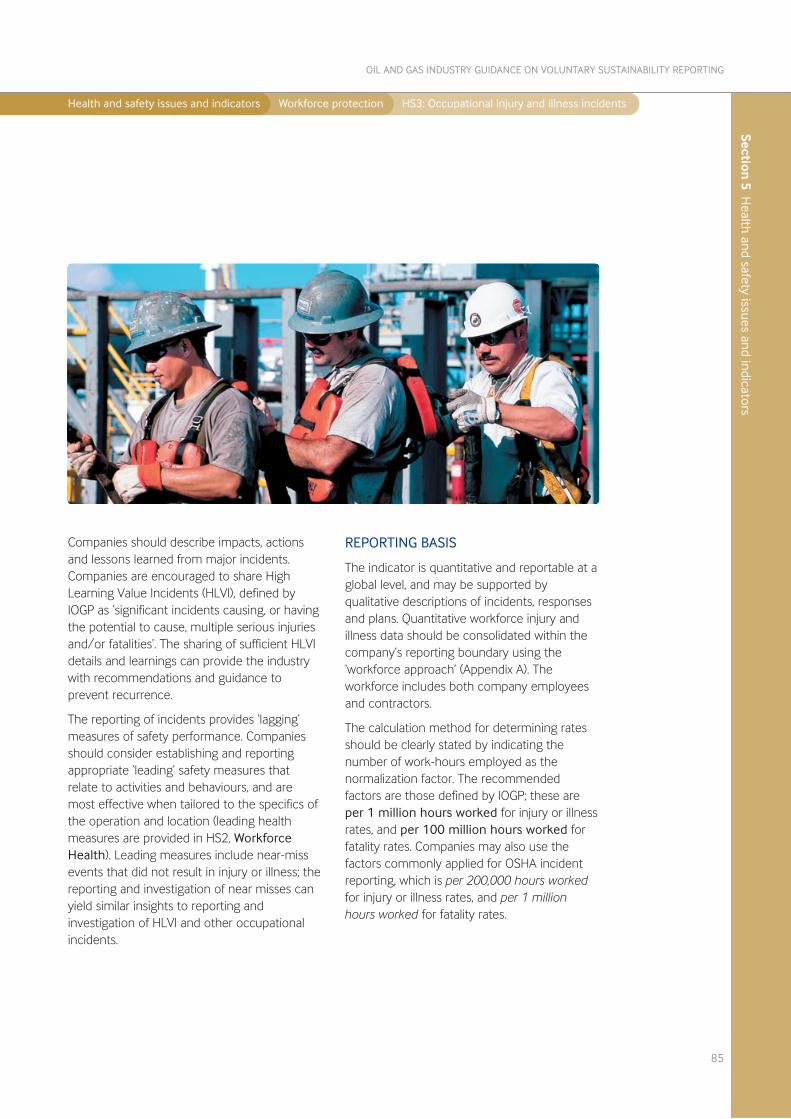
Health and safety issues and indicators Workforce protection HS3: Occupational injury and illness incidents
Companies should describe impacts, actionsand lessons learned from major incidents.Companies are encouraged to share HighLearning Value Incidents (HLVI), defined byIOGP as ‘significant incidents causing, or havingthe potential to cause, multiple serious injuriesand/or fatalities’. The sharing of sufficient HLVIdetails and learnings can provide the industrywith recommendations and guidance toprevent recurrence.
The reporting of incidents provides ‘lagging’measures of safety performance. Companiesshould consider establishing and reportingappropriate ‘leading’ safety measures thatrelate to activities and behaviours, and aremost effective when tailored to the specifics ofthe operation and location (leading healthmeasures are provided in HS2, WorkforceHealth). Leading measures include near-missevents that did not result in injury or illness; thereporting and investigation of near misses canyield similar insights to reporting andinvestigation of HLVI and other occupationalincidents.
REPORTING BASIS
The indicator is quantitative and reportable at aglobal level, and may be supported byqualitative descriptions of incidents, responsesand plans. Quantitative workforce injury andillness data should be consolidated within thecompany’s reporting boundary using the‘workforce approach’ (Appendix A). Theworkforce includes both company employeesand contractors.
The calculation method for determining ratesshould be clearly stated by indicating thenumber of work-hours employed as thenormalization factor. The recommendedfactors are those defined by IOGP; these areper 1 million hours worked for injury or illnessrates, and per 100 million hours worked forfatality rates. Companies may also use thefactors commonly applied for OSHA incidentreporting, which is per 200,000 hours workedfor injury or illness rates, and per 1 millionhours worked for fatality rates.
85
OIL AND GAS INDUSTRY GUIDANCE ON VOLUNTARY SUSTAINABILITY REPORTING
Section 5 H
ealth and safety issues and indicators
Health and safety issues and indicators Workforce protection HS3: Occupational injury and illness incidents
IPIECA • API • IOGP
86
Sect
ion
5 H
ealth
and
saf
ety
issu
es a
nd in
dica
tors
References
1. CEFIC. 2001. Reporting of Occupational Illness Frequency Rate. www.cefic.org
2. IOGP. 2010. Health and safety incident reporting system users’ guide, 2010 data. IOGP Report 444. London, UK. www.iogp.org/pubs/444.pdf
3. IOGP. Safety data reporting users’ guide. (Updated yearly). London, UK. www.iogp.org
4. IOGP-IPIECA. 2007. Health Performance Indicators: A guide for the oil and gas industry.
www.ipieca.org/publication/health-performance-indicators
5. OSHA (U.S. Department of Labor, Occupational Safety and Health Administration). 2001. Recording and Reporting Occupational Injuries and
Illnesses. 29 CFR Part 1904. (January 2001).
www.osha.gov/pls/oshaweb/owastand.display_standard_group?p_toc_level=1&p_part_number=1904
6. OSHA. Handbook on Injury and Illness Recordkeeping. www.osha.gov/recordkeeping/index.html
7. Step Change in Safety. 2006. Leading Performance Indicators—Guidance for Effective Use.
https://www.stepchangeinsafety.net/node/2667
Common reporting elements
Other reporting elements
Supplemental reporting elements
C1 Report occupational injuries separately for employees
and contractors:
• Total Recordable Injury Rate;
• Lost Time Injury Rate;
• Number of fatalities (excluding illness fatalities);
• Fatal Accident Rate (excluding illness fatalities); and
• Fatal Incident Rate.
C2 Describe incidents of major consequence,
determined by the company, together with impacts
and response actions.
S1 Report occupational illnesses separately
for employees and/or contractors:
• Total Recordable Illness Rate;
• Lost Time Illness Rate; and
• Number of illness fatalities.
S2 Describe initiatives to reduce occupational
incidents.
O1 Describe High Learning Value Incidents, including how lessons learned have been shared.
O2 Reporting approach and application of leading safety measures that may include:
• significant near-miss events (including first aid and ‘no-treatment’ incidents);
• behaviour-based safety programmes (peer-to-peer observations, feedback sessions) (to demonstrate
workforce engagement and the maturity of an organization’s safety culture);
• safety management system audits and site/activity assessments of the design and effectiveness of the
system and of improvement plans;
• incident investigation completion and corrective action closure (demonstrates effective investigation
processes and management oversight);
• workplace job safety/hazard analysis completion by the workforce (is an indicator of safety culture); and
• health, safety and environmental orientations and training (track the number and effectiveness of
activities designed to raise awareness and improve competency of the workforce).
Reporting elements
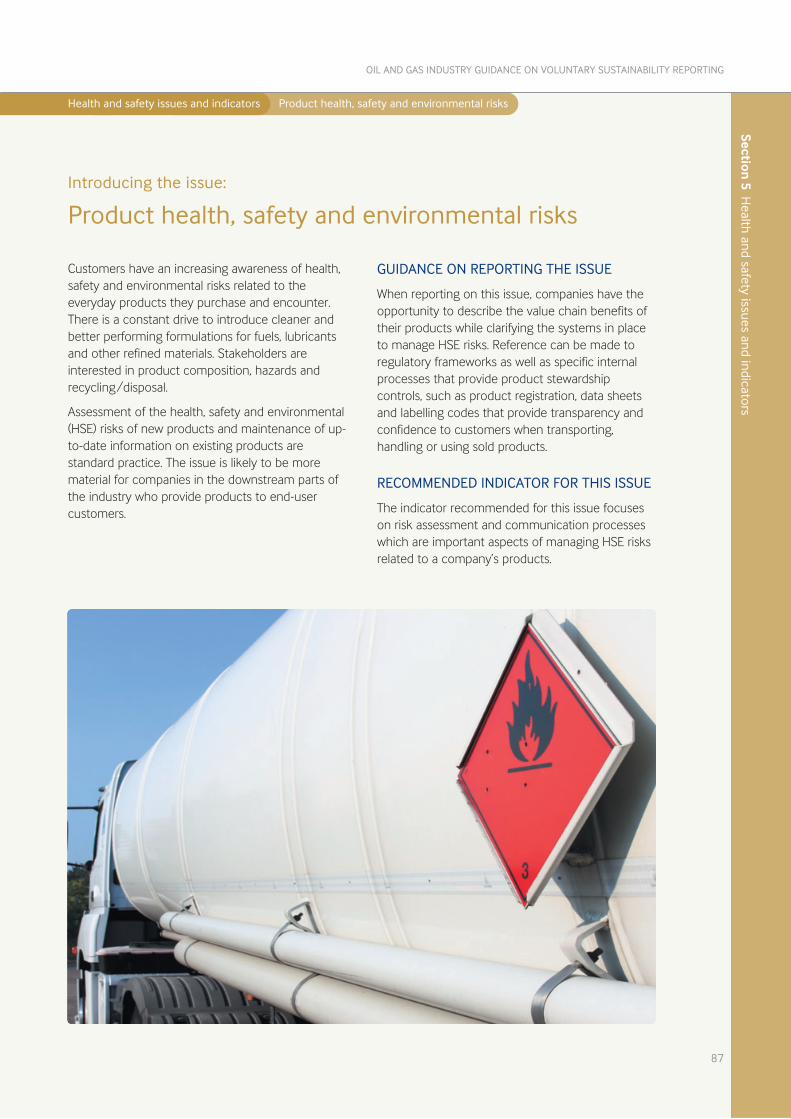
Health and safety issues and indicators Product health, safety and environmental risks
Customers have an increasing awareness of health,safety and environmental risks related to theeveryday products they purchase and encounter.There is a constant drive to introduce cleaner andbetter performing formulations for fuels, lubricantsand other refined materials. Stakeholders areinterested in product composition, hazards andrecycling/disposal.
Assessment of the health, safety and environmental(HSE) risks of new products and maintenance of up-to-date information on existing products arestandard practice. The issue is likely to be morematerial for companies in the downstream parts ofthe industry who provide products to end-usercustomers.
GUIDANCE ON REPORTING THE ISSUE
When reporting on this issue, companies have theopportunity to describe the value chain benefits oftheir products while clarifying the systems in placeto manage HSE risks. Reference can be made toregulatory frameworks as well as specific internalprocesses that provide product stewardshipcontrols, such as product registration, data sheetsand labelling codes that provide transparency andconfidence to customers when transporting,handling or using sold products.
RECOMMENDED INDICATOR FOR THIS ISSUE
The indicator recommended for this issue focuseson risk assessment and communication processeswhich are important aspects of managing HSE risksrelated to a company’s products.
87
OIL AND GAS INDUSTRY GUIDANCE ON VOLUNTARY SUSTAINABILITY REPORTING
Introducing the issue:
Product health, safety and environmental risks
Section 5 H
ealth and safety issues and indicators
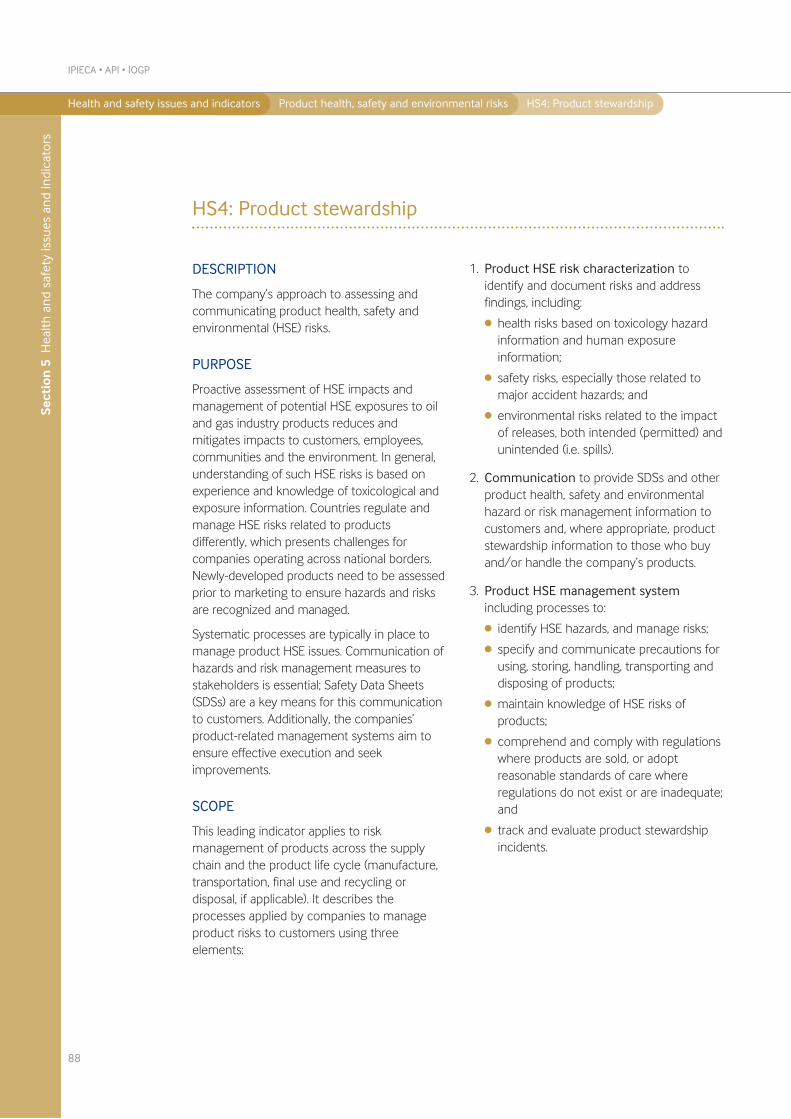
Health and safety issues and indicators Product health, safety and environmental risks HS4: Product stewardship
DESCRIPTION
The company’s approach to assessing andcommunicating product health, safety andenvironmental (HSE) risks.
PURPOSE
Proactive assessment of HSE impacts andmanagement of potential HSE exposures to oiland gas industry products reduces andmitigates impacts to customers, employees,communities and the environment. In general,understanding of such HSE risks is based onexperience and knowledge of toxicological andexposure information. Countries regulate andmanage HSE risks related to productsdifferently, which presents challenges forcompanies operating across national borders.Newly-developed products need to be assessedprior to marketing to ensure hazards and risksare recognized and managed.
Systematic processes are typically in place tomanage product HSE issues. Communication ofhazards and risk management measures tostakeholders is essential; Safety Data Sheets(SDSs) are a key means for this communicationto customers. Additionally, the companies’product-related management systems aim toensure effective execution and seekimprovements.
SCOPE
This leading indicator applies to riskmanagement of products across the supplychain and the product life cycle (manufacture,transportation, final use and recycling ordisposal, if applicable). It describes theprocesses applied by companies to manageproduct risks to customers using threeelements:
1. Product HSE risk characterization toidentify and document risks and addressfindings, including:
l health risks based on toxicology hazardinformation and human exposureinformation;
l safety risks, especially those related tomajor accident hazards; and
l environmental risks related to the impactof releases, both intended (permitted) andunintended (i.e. spills).
2. Communication to provide SDSs and otherproduct health, safety and environmentalhazard or risk management information tocustomers and, where appropriate, productstewardship information to those who buyand/or handle the company’s products.
3. Product HSE management systemincluding processes to:
l identify HSE hazards, and manage risks;
l specify and communicate precautions forusing, storing, handling, transporting anddisposing of products;
l maintain knowledge of HSE risks ofproducts;
l comprehend and comply with regulationswhere products are sold, or adoptreasonable standards of care whereregulations do not exist or are inadequate;and
l track and evaluate product stewardshipincidents.
IPIECA • API • IOGP
88
HS4: Product stewardship
Sect
ion
5 H
ealth
and
saf
ety
issu
es a
nd in
dica
tors
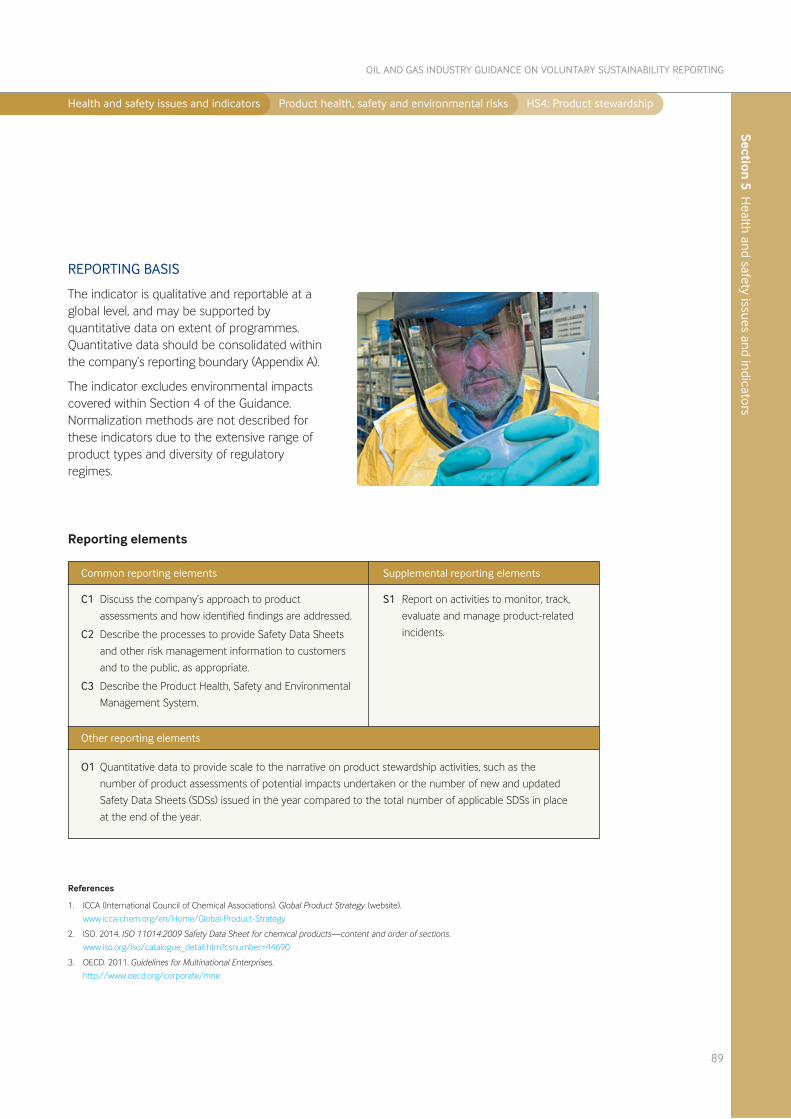
Health and safety issues and indicators Product health, safety and environmental risks HS4: Product stewardship
REPORTING BASIS
The indicator is qualitative and reportable at aglobal level, and may be supported byquantitative data on extent of programmes.Quantitative data should be consolidated withinthe company’s reporting boundary (Appendix A).
The indicator excludes environmental impactscovered within Section 4 of the Guidance.Normalization methods are not described forthese indicators due to the extensive range ofproduct types and diversity of regulatoryregimes.
89
OIL AND GAS INDUSTRY GUIDANCE ON VOLUNTARY SUSTAINABILITY REPORTING
Section 5 H
ealth and safety issues and indicators
Common reporting elements
Other reporting elements
Supplemental reporting elements
C1 Discuss the company’s approach to product
assessments and how identified findings are addressed.
C2 Describe the processes to provide Safety Data Sheets
and other risk management information to customers
and to the public, as appropriate.
C3 Describe the Product Health, Safety and Environmental
Management System.
S1 Report on activities to monitor, track,
evaluate and manage product-related
incidents.
O1 Quantitative data to provide scale to the narrative on product stewardship activities, such as the
number of product assessments of potential impacts undertaken or the number of new and updated
Safety Data Sheets (SDSs) issued in the year compared to the total number of applicable SDSs in place
at the end of the year.
Reporting elements
References
1. ICCA (International Council of Chemical Associations). Global Product Strategy (website).
www.icca-chem.org/en/Home/Global-Product-Strategy
2. ISO. 2014. ISO 11014:2009 Safety Data Sheet for chemical products—content and order of sections.
www.iso.org/iso/catalogue_detail.htm?csnumber=44690
3. OECD. 2011. Guidelines for Multinational Enterprises.
http://www.oecd.org/corporate/mne
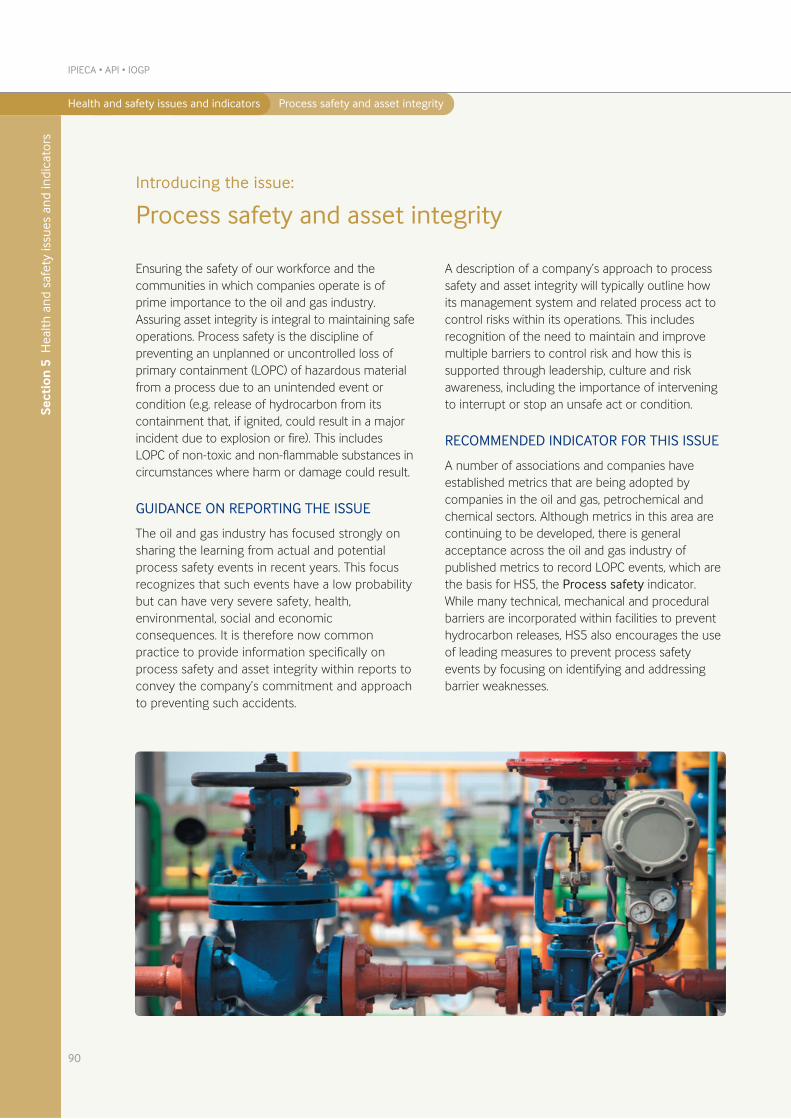
Health and safety issues and indicators Process safety and asset integrity
Ensuring the safety of our workforce and thecommunities in which companies operate is ofprime importance to the oil and gas industry.Assuring asset integrity is integral to maintaining safeoperations. Process safety is the discipline ofpreventing an unplanned or uncontrolled loss ofprimary containment (LOPC) of hazardous materialfrom a process due to an unintended event orcondition (e.g. release of hydrocarbon from itscontainment that, if ignited, could result in a majorincident due to explosion or fire). This includesLOPC of non-toxic and non-flammable substances incircumstances where harm or damage could result.
GUIDANCE ON REPORTING THE ISSUE
The oil and gas industry has focused strongly onsharing the learning from actual and potentialprocess safety events in recent years. This focusrecognizes that such events have a low probabilitybut can have very severe safety, health,environmental, social and economicconsequences. It is therefore now commonpractice to provide information specifically onprocess safety and asset integrity within reports toconvey the company’s commitment and approachto preventing such accidents.
A description of a company’s approach to processsafety and asset integrity will typically outline howits management system and related process act tocontrol risks within its operations. This includesrecognition of the need to maintain and improvemultiple barriers to control risk and how this issupported through leadership, culture and riskawareness, including the importance of interveningto interrupt or stop an unsafe act or condition.
RECOMMENDED INDICATOR FOR THIS ISSUE
A number of associations and companies haveestablished metrics that are being adopted bycompanies in the oil and gas, petrochemical andchemical sectors. Although metrics in this area arecontinuing to be developed, there is generalacceptance across the oil and gas industry ofpublished metrics to record LOPC events, which arethe basis for HS5, the Process safety indicator.While many technical, mechanical and proceduralbarriers are incorporated within facilities to preventhydrocarbon releases, HS5 also encourages the useof leading measures to prevent process safetyevents by focusing on identifying and addressingbarrier weaknesses.
IPIECA • API • IOGP
90
Introducing the issue:
Process safety and asset integrity
Sect
ion
5 H
ealth
and
saf
ety
issu
es a
nd in
dica
tors
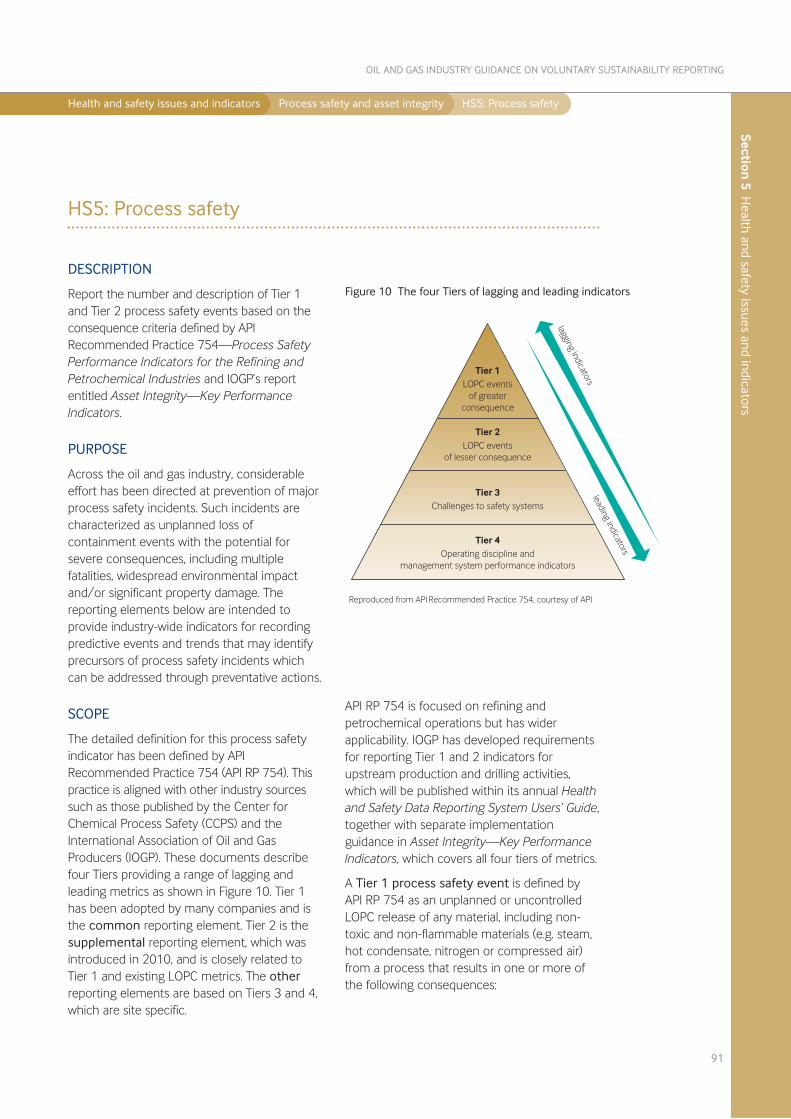
Health and safety issues and indicators Process safety and asset integrity HS5: Process safety
DESCRIPTION
Report the number and description of Tier 1and Tier 2 process safety events based on theconsequence criteria defined by APIRecommended Practice 754—Process SafetyPerformance Indicators for the Refining andPetrochemical Industries and IOGP’s reportentitled Asset Integrity—Key PerformanceIndicators.
PURPOSE
Across the oil and gas industry, considerableeffort has been directed at prevention of majorprocess safety incidents. Such incidents arecharacterized as unplanned loss ofcontainment events with the potential forsevere consequences, including multiplefatalities, widespread environmental impactand/or significant property damage. Thereporting elements below are intended toprovide industry-wide indicators for recordingpredictive events and trends that may identifyprecursors of process safety incidents whichcan be addressed through preventative actions.
SCOPE
The detailed definition for this process safetyindicator has been defined by APIRecommended Practice 754 (API RP 754). Thispractice is aligned with other industry sourcessuch as those published by the Center forChemical Process Safety (CCPS) and theInternational Association of Oil and GasProducers (IOGP). These documents describefour Tiers providing a range of lagging andleading metrics as shown in Figure 10. Tier 1has been adopted by many companies and isthe common reporting element. Tier 2 is thesupplemental reporting element, which wasintroduced in 2010, and is closely related toTier 1 and existing LOPC metrics. The otherreporting elements are based on Tiers 3 and 4,which are site specific.
API RP 754 is focused on refining andpetrochemical operations but has widerapplicability. IOGP has developed requirementsfor reporting Tier 1 and 2 indicators forupstream production and drilling activities,which will be published within its annual Healthand Safety Data Reporting System Users’ Guide,together with separate implementationguidance in Asset Integrity—Key PerformanceIndicators, which covers all four tiers of metrics.
A Tier 1 process safety event is defined byAPI RP 754 as an unplanned or uncontrolledLOPC release of any material, including non-toxic and non-flammable materials (e.g. steam,hot condensate, nitrogen or compressed air)from a process that results in one or more ofthe following consequences:
91
OIL AND GAS INDUSTRY GUIDANCE ON VOLUNTARY SUSTAINABILITY REPORTING
HS5: Process safety
Section 5 H
ealth and safety issues and indicators
%����#%6�'���� �������
��� (���
%����&'����� ���� ���� � ��
%����$%6�'����
���� ����� (���
%����'6��������� ���������
������� � ��������������������
��������������
���������������
Figure 10 The four Tiers of lagging and leading indicators
Reproduced from API Recommended Practice 754, courtesy of API
Health and safety issues and indicators Process safety and asset integrity HS5: Process safety
1. An employee, contractor or subcontractor‘days away from work’ injury and/or fatality.
2. Hospital admission and/or fatality of a thirdparty.
3. Community evacuation or communityshelter-in-place (officially declared by a localauthority).
4. Fires or explosions resulting in greater thanor equal to US$100,000 of direct value.
5. A discharge from a pressure relief deviceresulting in one or more of fourconsequences—liquid carryover; dischargeto an unsafe location; on-site shelter-in-place; or a public protective measure—andis in excess of the Tier 1 threshold quantitiesdetailed in API RP 754.
6. A release of material greater than the Tier 1threshold quantities in API RP 754, in anyone-hour period.
A Tier 2 process safety event is broadlydefined as an order of magnitude less severethan the Tier 1 criteria above. (See API RP 754for detailed definitions and guidance.)
It should be noted that any process safetyevent causing, or having the potential to cause,multiple serious injuries and/or fatalities, is alsoa High Learning Value Event (HLVE) and canprovide important learnings for industry, asdescribed in HS3, Occupational injury andillness incidents.
It is recommended that companies report bothTier 1 and 2 process safety events, as well ascontext and narrative to broadly describe thenature, consequences and interpretation of thedata.
In addition to Tier 1 and 2 reporting,companies are encouraged to develop, select,use and evaluate site-specific process safetyand asset integrity leading metrics. A leadingmetric reporting programme supportscontinuous improvement of the company’ssafety performance. These Tier 3 and 4
metrics support actions to improve safetybarriers and management system elementsthat have been identified through causes ofpast incidents, company experience with riskcontrols, and knowledge of their specific sitesand facilities.
As Tier 3 and 4 metrics will be driven by site-specific programmes and issues, these are notenvisioned to be normalized or compared.
REPORTING BASIS
The indicator is quantitative and should bereported for Tier 1 and 2 process safety eventsat a global level, supported by qualitativedescriptions of incidents, responses and plans.Quantitative data should be consolidated withinthe company’s reporting boundary using the‘operational approach’ (Appendix A).
To provide comparability between majoractivities or companies of different scale, thenumber of events can be expressed as anormalized rate based on workforce hours asapplied in HS3 for calculation of Occupationalinjury and illness incidents (see additionalnotes on normalization below).
NORMALIZATION
Tier 1 can be normalized for comparability, butthe normalized data is statistically only likely tobe valid at an industry, industry segment orlarge enterprise level, and is not expected to bevalid at an asset level. Tier 2 normalized datamay be valid for most statistical comparisonsbetween assets. Tiers 3 and 4 are not usuallysuitable for industry roll-up or even forcomparisons from asset to asset. Since Tiers 3and 4 will often be asset-specific, each locationshould determine whether count or normalizedrates are appropriate to assist them in analysingtheir data.
IPIECA • API • IOGP
92
Sect
ion
5 H
ealth
and
saf
ety
issu
es a
nd in
dica
tors
Health and safety issues and indicators Process safety and asset integrity HS5: Process safety
93
OIL AND GAS INDUSTRY GUIDANCE ON VOLUNTARY SUSTAINABILITY REPORTING
Section 5 H
ealth and safety issues and indicators
Common reporting elements
Other reporting elements
Supplemental reporting elements
C1 Number of Tier 1 process safety events with
narrative per API RP 754 definitions and
reported per business activity (refining,
upstream, etc.).
S1 Number of Tier 2 process safety events with
narrative per API RP 754 definitions and
reported per business activity (refining,
upstream, etc.).
O1 Reporting process safety event frequency rates (see Normalization notes above).
O2 Describe approach and application of Tier 3 and 4 leading metrics, such as:
• demand on safety systems intended to protect against LOPC events (e.g. pressure relief valve release,
safety instrumented system events);
• HSE operating envelope deviations;
• effectiveness of management system execution;
• training and competency;
• leadership/management committee/culture;
• management of change, and
• permit to work.
Reporting elements
References
1. API. 2010. ANSI/API Recommended Practice 754: Process Safety Performance Indicators for the Refining and Petrochemical Industries (First
Edition, April 2010). Available from API at: www.api.org/environment-health-and-safety/process-safety/process-safety-standards/standard-rp-754
2. CCPS (Center for Chemical Process Safety). 2007. Guidelines for Risk-Based Process Safety. American Institute of Chemical Engineers, New
York, 2007.
3. CCPS. 2009. Guidelines for Process Safety Metrics. American Institution of Chemical Engineers, New York, 2009.
4. CCPS. 2008. Process Safety Leading and Lagging Metrics. American Institute of Chemical Engineers, New York, 2008.
5. OECD. 2008. Guidance on Developing Safety Performance Indicators Related to Chemical Accident Prevention, Preparedness and Response
for Industry (2nd Edition). OECD Environment, Health and Safety Publications, Series on Chemical Accidents. No. 19, Paris, 2008.
www.oecd.org/env/ehs/chemical-accidents/41269639.pdf
6. IOGP. 2008. Asset Integrity—the Key to Managing Major Incident Risks. IOGP Report 415. www.iogp.org/pubs/415.pdf
7. IOGP, 2011. Process safety: recommended practice on key performance indicators. IOGP Report 456. www.iogp.org/pubs/456.pdf
8. IOGP. 2011. Asset Integrity—Key Performance Indicators. (Provides guidance for E&P industry use of API Recommended Practice 754.
www.iogp.org
9. IOGP. Health and Safety Data Reporting System Users’ Guide. This ‘User’s Guide’ for reporting health and safety data is typically updated
annually in December. Use of the most recent guide is recommended. www.iogp.org
10. UK Health and Safety Executive (HSE). 2006. Step-By-Step Guide to Developing Process Safety Performance Indicators.
HSG254, Sudbury, Suffolk, UK, 2006. www.hse.gov.uk/pubns/books/hsg254.htm
There is no uniformly applicable normalizationfactor for process safety/asset integrityindicators. As such, industry segments maywant to develop a specific normalized rate or aseverity index. However, general consensusprefers to use worker exposure hours (as used
for injury rates) as a convenient, easily obtainedfactor for Tier 1 and 2 indicators. This providesa simple basis for year-to-year trending andallows limited comparison between similarbusiness activities.

This page intentionally left blank
95
OIL AND GAS INDUSTRY GUIDANCE ON VOLUNTARY SUSTAINABILITY REPORTING
Section 6
Social and economicissues and indicators
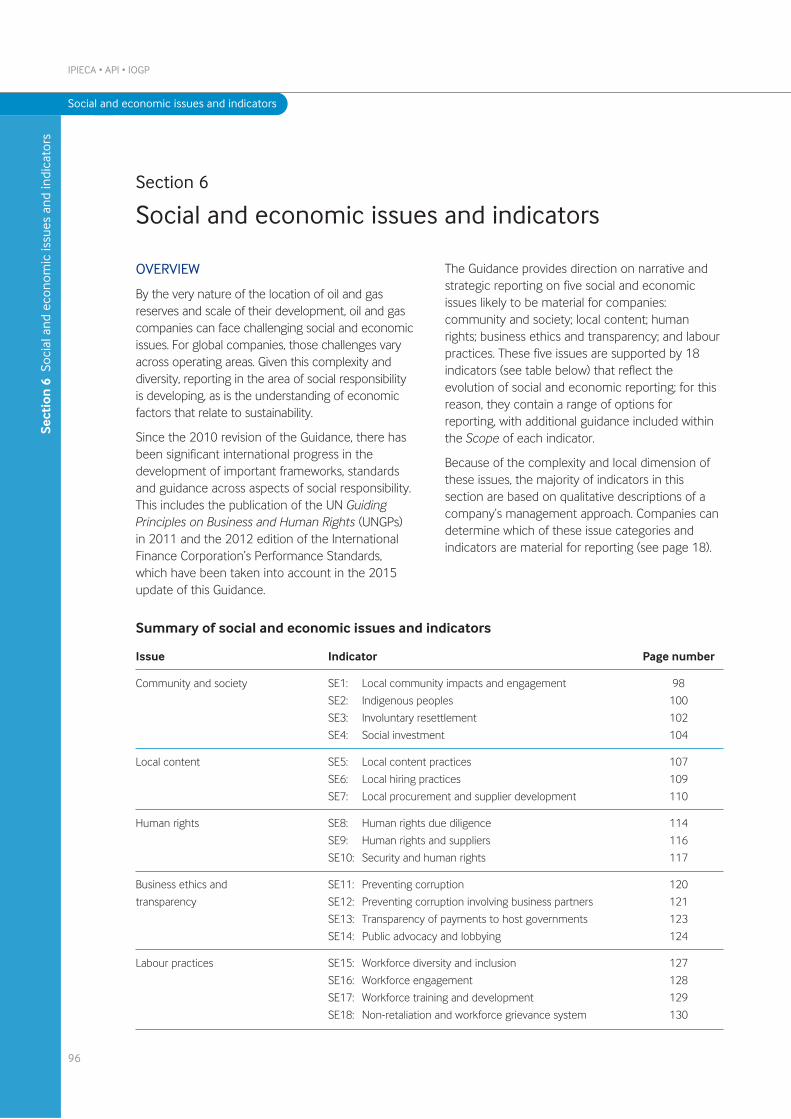
Social and economic issues and indicators
OVERVIEW
By the very nature of the location of oil and gasreserves and scale of their development, oil and gascompanies can face challenging social and economicissues. For global companies, those challenges varyacross operating areas. Given this complexity anddiversity, reporting in the area of social responsibilityis developing, as is the understanding of economicfactors that relate to sustainability.
Since the 2010 revision of the Guidance, there hasbeen significant international progress in thedevelopment of important frameworks, standardsand guidance across aspects of social responsibility.This includes the publication of the UN GuidingPrinciples on Business and Human Rights (UNGPs)in 2011 and the 2012 edition of the InternationalFinance Corporation’s Performance Standards,which have been taken into account in the 2015update of this Guidance.
The Guidance provides direction on narrative andstrategic reporting on five social and economicissues likely to be material for companies:community and society; local content; humanrights; business ethics and transparency; and labourpractices. These five issues are supported by 18indicators (see table below) that reflect theevolution of social and economic reporting; for thisreason, they contain a range of options forreporting, with additional guidance included withinthe Scope of each indicator.
Because of the complexity and local dimension ofthese issues, the majority of indicators in thissection are based on qualitative descriptions of acompany’s management approach. Companies candetermine which of these issue categories andindicators are material for reporting (see page 18).
IPIECA • API • IOGP
96
Section 6
Social and economic issues and indicators
Sect
ion
6 S
ocia
l and
eco
nom
ic is
sues
and
indi
cato
rs
Summary of social and economic issues and indicators
Issue Indicator Page number
Community and society SE1: Local community impacts and engagement 98
SE2: Indigenous peoples 100
SE3: Involuntary resettlement 102
SE4: Social investment 104
Local content SE5: Local content practices 107
SE6: Local hiring practices 109
SE7: Local procurement and supplier development 110
Human rights SE8: Human rights due diligence 114
SE9: Human rights and suppliers 116
SE10: Security and human rights 117
Business ethics and SE11: Preventing corruption 120
transparency SE12: Preventing corruption involving business partners 121
SE13: Transparency of payments to host governments 123
SE14: Public advocacy and lobbying 124
Labour practices SE15: Workforce diversity and inclusion 127
SE16: Workforce engagement 128
SE17: Workforce training and development 129
SE18: Non-retaliation and workforce grievance system 130
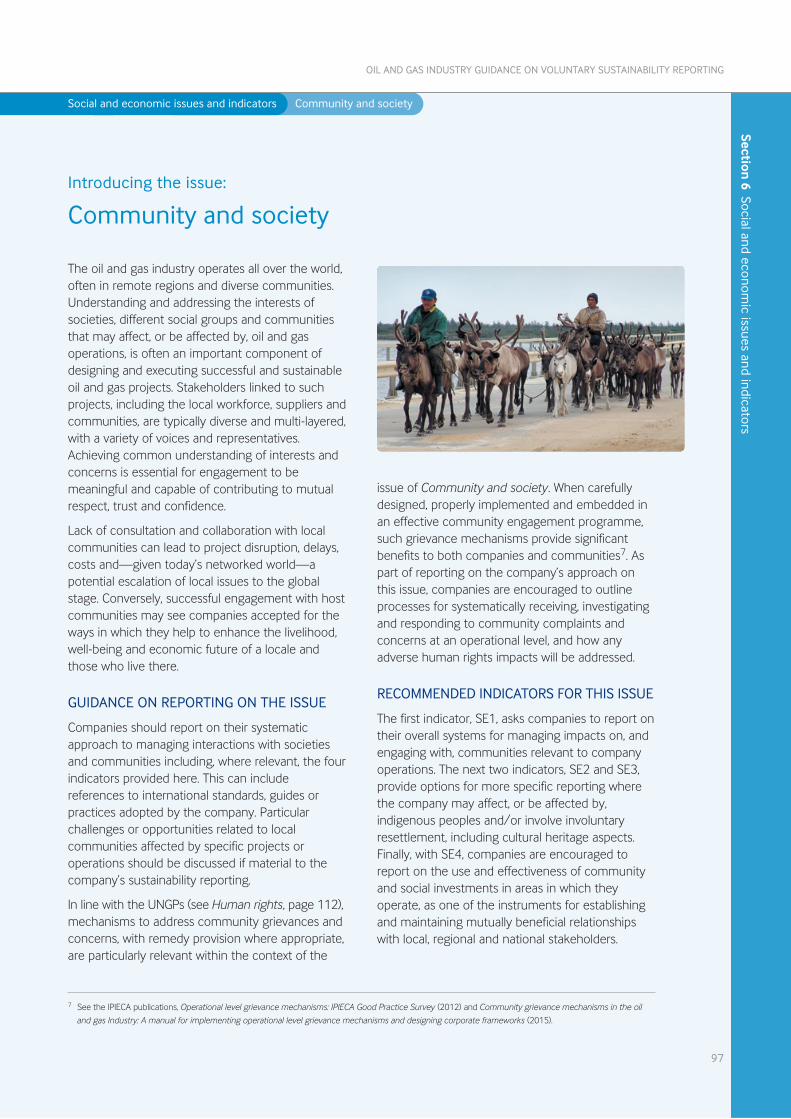
Social and economic issues and indicators Community and society
The oil and gas industry operates all over the world,often in remote regions and diverse communities.Understanding and addressing the interests ofsocieties, different social groups and communitiesthat may affect, or be affected by, oil and gasoperations, is often an important component ofdesigning and executing successful and sustainableoil and gas projects. Stakeholders linked to suchprojects, including the local workforce, suppliers andcommunities, are typically diverse and multi-layered,with a variety of voices and representatives.Achieving common understanding of interests andconcerns is essential for engagement to bemeaningful and capable of contributing to mutualrespect, trust and confidence.
Lack of consultation and collaboration with localcommunities can lead to project disruption, delays,costs and—given today’s networked world—apotential escalation of local issues to the globalstage. Conversely, successful engagement with hostcommunities may see companies accepted for theways in which they help to enhance the livelihood,well-being and economic future of a locale andthose who live there.
GUIDANCE ON REPORTING ON THE ISSUE
Companies should report on their systematicapproach to managing interactions with societiesand communities including, where relevant, the fourindicators provided here. This can includereferences to international standards, guides orpractices adopted by the company. Particularchallenges or opportunities related to localcommunities affected by specific projects oroperations should be discussed if material to thecompany’s sustainability reporting.
In line with the UNGPs (see Human rights, page 112),mechanisms to address community grievances andconcerns, with remedy provision where appropriate,are particularly relevant within the context of the
issue of Community and society. When carefullydesigned, properly implemented and embedded inan effective community engagement programme,such grievance mechanisms provide significantbenefits to both companies and communities7. Aspart of reporting on the company’s approach onthis issue, companies are encouraged to outlineprocesses for systematically receiving, investigatingand responding to community complaints andconcerns at an operational level, and how anyadverse human rights impacts will be addressed.
RECOMMENDED INDICATORS FOR THIS ISSUE
The first indicator, SE1, asks companies to report ontheir overall systems for managing impacts on, andengaging with, communities relevant to companyoperations. The next two indicators, SE2 and SE3,provide options for more specific reporting wherethe company may affect, or be affected by,indigenous peoples and/or involve involuntaryresettlement, including cultural heritage aspects.Finally, with SE4, companies are encouraged toreport on the use and effectiveness of communityand social investments in areas in which theyoperate, as one of the instruments for establishingand maintaining mutually beneficial relationshipswith local, regional and national stakeholders.
97
OIL AND GAS INDUSTRY GUIDANCE ON VOLUNTARY SUSTAINABILITY REPORTING
Introducing the issue:
Community and society
Section 6 Social and econom
ic issues and indicators
7 See the IPIECA publications, Operational level grievance mechanisms: IPIECA Good Practice Survey (2012) and Community grievance mechanisms in the oil
and gas Industry: A manual for implementing operational level grievance mechanisms and designing corporate frameworks (2015).
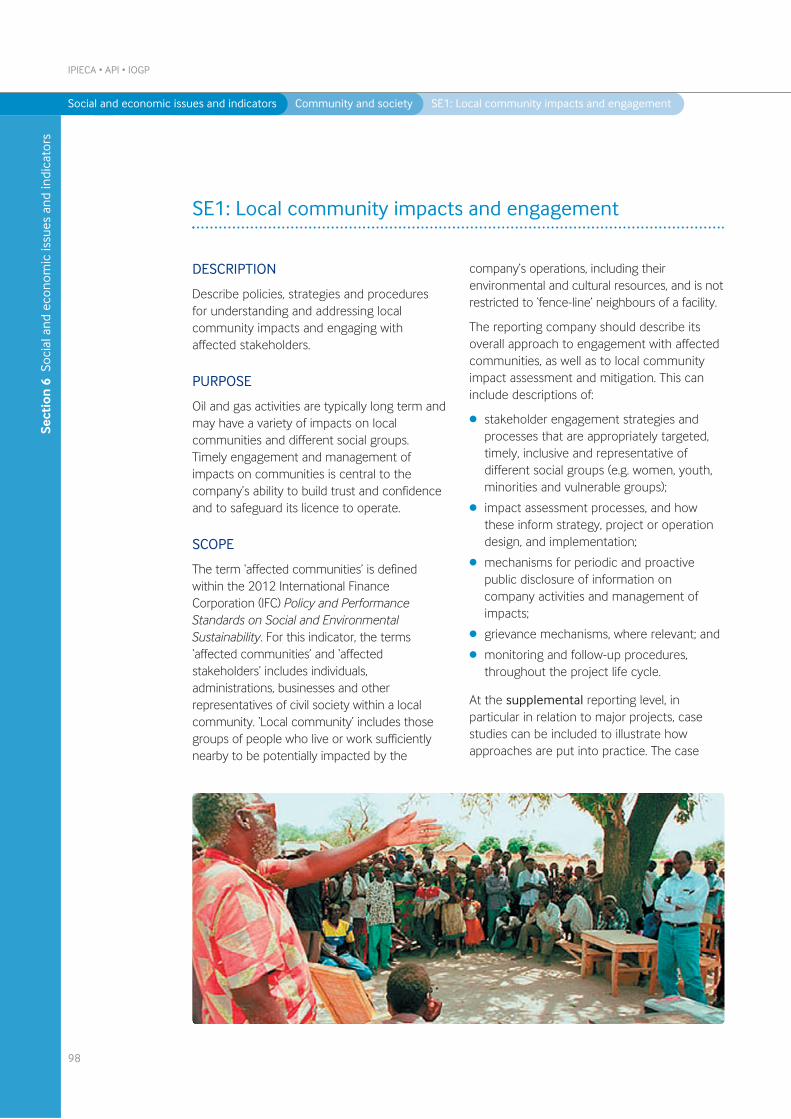
DESCRIPTION
Describe policies, strategies and proceduresfor understanding and addressing localcommunity impacts and engaging withaffected stakeholders.
PURPOSE
Oil and gas activities are typically long term andmay have a variety of impacts on localcommunities and different social groups.Timely engagement and management ofimpacts on communities is central to thecompany’s ability to build trust and confidenceand to safeguard its licence to operate.
SCOPE
The term ‘affected communities’ is definedwithin the 2012 International FinanceCorporation (IFC) Policy and PerformanceStandards on Social and EnvironmentalSustainability. For this indicator, the terms‘affected communities’ and ‘affectedstakeholders’ includes individuals,administrations, businesses and otherrepresentatives of civil society within a localcommunity. ‘Local community’ includes thosegroups of people who live or work sufficientlynearby to be potentially impacted by the
company’s operations, including theirenvironmental and cultural resources, and is notrestricted to ‘fence-line’ neighbours of a facility.
The reporting company should describe itsoverall approach to engagement with affectedcommunities, as well as to local communityimpact assessment and mitigation. This caninclude descriptions of:
l stakeholder engagement strategies andprocesses that are appropriately targeted,timely, inclusive and representative ofdifferent social groups (e.g. women, youth,minorities and vulnerable groups);
l impact assessment processes, and howthese inform strategy, project or operationdesign, and implementation;
l mechanisms for periodic and proactivepublic disclosure of information oncompany activities and management ofimpacts;
l grievance mechanisms, where relevant; and
l monitoring and follow-up procedures,throughout the project life cycle.
At the supplemental reporting level, inparticular in relation to major projects, casestudies can be included to illustrate howapproaches are put into practice. The case
IPIECA • API • IOGP
98
SE1: Local community impacts and engagement
Sect
ion
6 S
ocia
l and
eco
nom
ic is
sues
and
indi
cato
rs
Social and economic issues and indicators Community and society SE1: Local community impacts and engagement
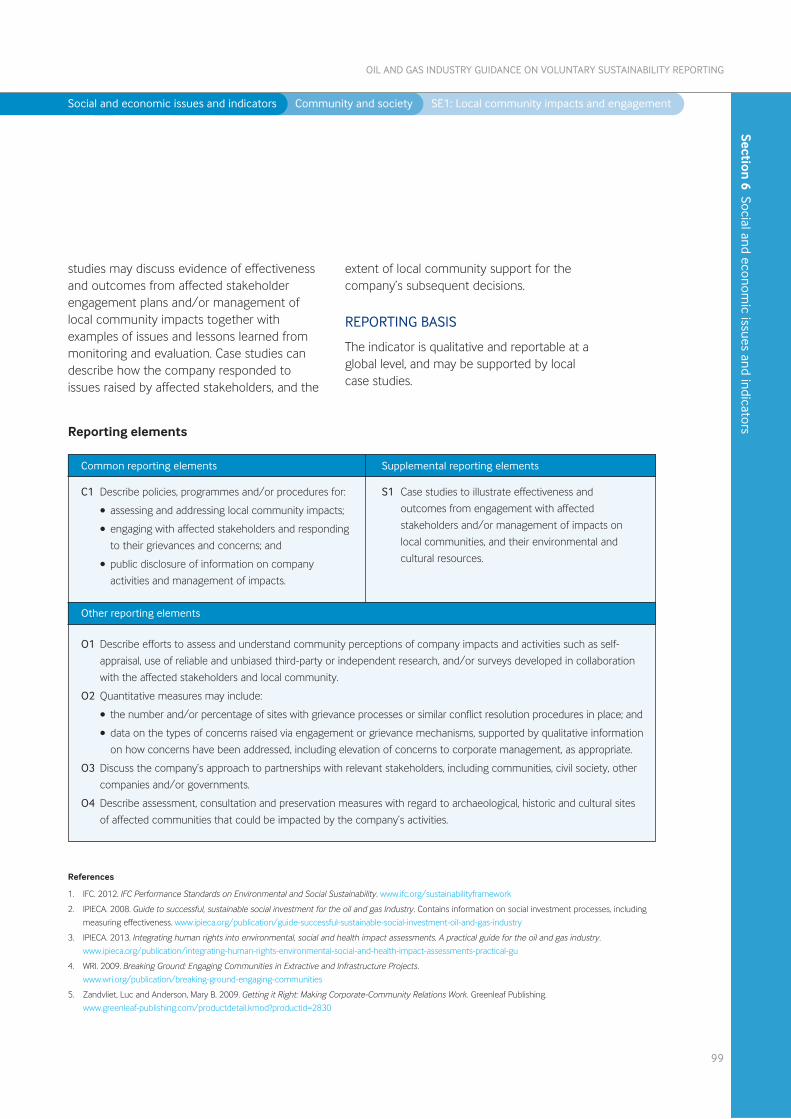
studies may discuss evidence of effectivenessand outcomes from affected stakeholderengagement plans and/or management oflocal community impacts together withexamples of issues and lessons learned frommonitoring and evaluation. Case studies candescribe how the company responded toissues raised by affected stakeholders, and the
extent of local community support for thecompany’s subsequent decisions.
REPORTING BASIS
The indicator is qualitative and reportable at aglobal level, and may be supported by localcase studies.
99
OIL AND GAS INDUSTRY GUIDANCE ON VOLUNTARY SUSTAINABILITY REPORTING
Section 6 Social and econom
ic issues and indicators
Social and economic issues and indicators Community and society SE1: Local community impacts and engagement
Common reporting elements
Other reporting elements
Supplemental reporting elements
C1 Describe policies, programmes and/or procedures for:
• assessing and addressing local community impacts;
• engaging with affected stakeholders and responding
to their grievances and concerns; and
• public disclosure of information on company
activities and management of impacts.
S1 Case studies to illustrate effectiveness and
outcomes from engagement with affected
stakeholders and/or management of impacts on
local communities, and their environmental and
cultural resources.
O1 Describe efforts to assess and understand community perceptions of company impacts and activities such as self-
appraisal, use of reliable and unbiased third-party or independent research, and/or surveys developed in collaboration
with the affected stakeholders and local community.
O2 Quantitative measures may include:
• the number and/or percentage of sites with grievance processes or similar conflict resolution procedures in place; and
• data on the types of concerns raised via engagement or grievance mechanisms, supported by qualitative information
on how concerns have been addressed, including elevation of concerns to corporate management, as appropriate.
O3 Discuss the company’s approach to partnerships with relevant stakeholders, including communities, civil society, other
companies and/or governments.
O4 Describe assessment, consultation and preservation measures with regard to archaeological, historic and cultural sites
of affected communities that could be impacted by the company’s activities.
Reporting elements
References
1. IFC. 2012. IFC Performance Standards on Environmental and Social Sustainability. www.ifc.org/sustainabilityframework
2. IPIECA. 2008. Guide to successful, sustainable social investment for the oil and gas Industry. Contains information on social investment processes, including
measuring effectiveness. www.ipieca.org/publication/guide-successful-sustainable-social-investment-oil-and-gas-industry
3. IPIECA. 2013. Integrating human rights into environmental, social and health impact assessments. A practical guide for the oil and gas industry.
www.ipieca.org/publication/integrating-human-rights-environmental-social-and-health-impact-assessments-practical-gu
4. WRI. 2009. Breaking Ground: Engaging Communities in Extractive and Infrastructure Projects.
www.wri.org/publication/breaking-ground-engaging-communities
5. Zandvliet, Luc and Anderson, Mary B. 2009. Getting it Right: Making Corporate-Community Relations Work. Greenleaf Publishing.
www.greenleaf-publishing.com/productdetail.kmod?productid=2830
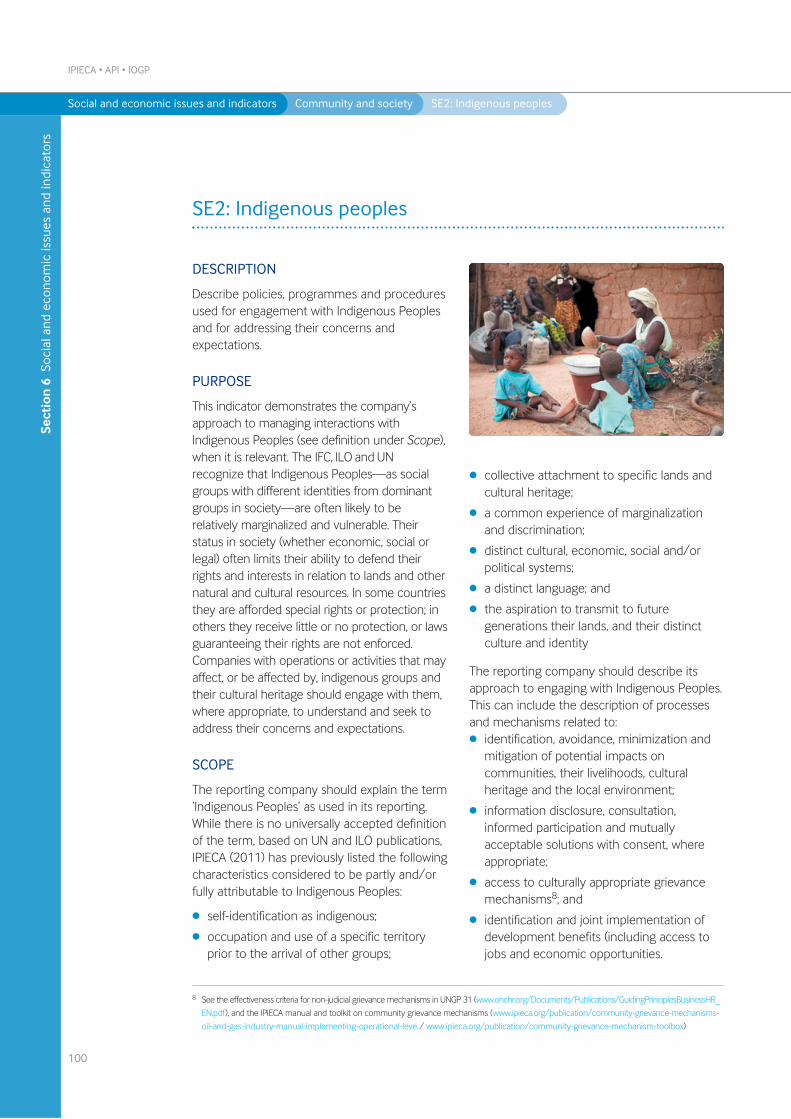
DESCRIPTION
Describe policies, programmes and proceduresused for engagement with Indigenous Peoplesand for addressing their concerns andexpectations.
PURPOSE
This indicator demonstrates the company’sapproach to managing interactions withIndigenous Peoples (see definition under Scope),when it is relevant. The IFC, ILO and UNrecognize that Indigenous Peoples—as socialgroups with different identities from dominantgroups in society—are often likely to berelatively marginalized and vulnerable. Theirstatus in society (whether economic, social orlegal) often limits their ability to defend theirrights and interests in relation to lands and othernatural and cultural resources. In some countriesthey are afforded special rights or protection; inothers they receive little or no protection, or lawsguaranteeing their rights are not enforced.Companies with operations or activities that mayaffect, or be affected by, indigenous groups andtheir cultural heritage should engage with them,where appropriate, to understand and seek toaddress their concerns and expectations.
SCOPE
The reporting company should explain the term‘Indigenous Peoples’ as used in its reporting.While there is no universally accepted definitionof the term, based on UN and ILO publications,IPIECA (2011) has previously listed the followingcharacteristics considered to be partly and/orfully attributable to Indigenous Peoples:
l self-identification as indigenous;
l occupation and use of a specific territoryprior to the arrival of other groups;
l collective attachment to specific lands andcultural heritage;
l a common experience of marginalizationand discrimination;
l distinct cultural, economic, social and/orpolitical systems;
l a distinct language; and
l the aspiration to transmit to futuregenerations their lands, and their distinctculture and identity
The reporting company should describe itsapproach to engaging with Indigenous Peoples.This can include the description of processesand mechanisms related to:l identification, avoidance, minimization and
mitigation of potential impacts oncommunities, their livelihoods, culturalheritage and the local environment;
l information disclosure, consultation,informed participation and mutuallyacceptable solutions with consent, whereappropriate;
l access to culturally appropriate grievancemechanisms8; and
l identification and joint implementation ofdevelopment benefits (including access tojobs and economic opportunities.
IPIECA • API • IOGP
100
SE2: Indigenous peoples
Sect
ion
6 S
ocia
l and
eco
nom
ic is
sues
and
indi
cato
rs
Social and economic issues and indicators Community and society SE2: Indigenous peoples
8 See the effectiveness criteria for non-judicial grievance mechanisms in UNGP 31 (www.ohchr.org/Documents/Publications/GuidingPrinciplesBusinessHR_
EN.pdf), and the IPIECA manual and toolkit on community grievance mechanisms (www.ipieca.org/publication/community-grievance-mechanisms-
oil-and-gas-industry-manual-implementing-operational-leve / www.ipieca.org/publication/community-grievance-mechanism-toolbox)
If appropriate, the company may also report onhuman rights aspects related to IndigenousPeoples when reporting on its human rightsdue diligence processes (see Indicator SE8,Human rights due diligence).
At a supplemental level, provide case studies,examples or other evidence of how IndigenousPeoples (including their traditional knowledgeand cultural resources) are involved in planningand decision making, and/or impactidentification and mitigation processes.
REPORTING BASIS
The indicator is qualitative and reportable at aglobal level, and may be supported by localcase studies and supporting quantitative data, ifappropriate.
101
OIL AND GAS INDUSTRY GUIDANCE ON VOLUNTARY SUSTAINABILITY REPORTING
Section 6 Social and econom
ic issues and indicators
Social and economic issues and indicators Community and society SE2: Indigenous peoples
Common reporting elements
Other reporting elements
Supplemental reporting elements
C1 Describe policies, programmes, procedures and
practices used to:
• identify and limit impacts on Indigenous Peoples;
• engage with them and address their grievances,
concerns and expectations; and
• collaborate on opportunities that create mutual
benefits.
S1 Provide case studies, examples or other
evidence related to participation and
involvement of Indigenous Peoples.
O1 Describe issues raised by Indigenous Peoples in specified countries, and actions taken by the company to
address the issues.
Reporting elements
References
1. IFC. 2012. Performance standards on social and environmental sustainability. ( Performance Standard 7: Indigenous Peoples)
www.ifc.org/wps/wcm/connect/115482804a0255db96fbffd1a5d13d27/PS_English_2012_Full-Document.pdf?MOD=AJPERES
2. ILO. 1989. Convention 169 on Indigenous and Tribal Peoples. www.ilo.org/ilolex/cgi-lex/convde.pl?C169
(see also: ILO. 1957. Convention 107 on Indigenous and Tribal Populations Convention. www.ilo.org/indigenous/Conventions/no107/lang--
en/index.htm)
3. IPIECA. 2011. Indigenous Peoples and the oil and gas industry—Context, issues and emerging good practice. Scheduled for publication in
2011. www.ipieca.org
4. United Nations General Assembly (UNGA). 2007. Declaration on the Rights of Indigenous Peoples. Adopted by the UNGA in 2007.
www.un.org/esa/socdev/unpfii/en/drip.html
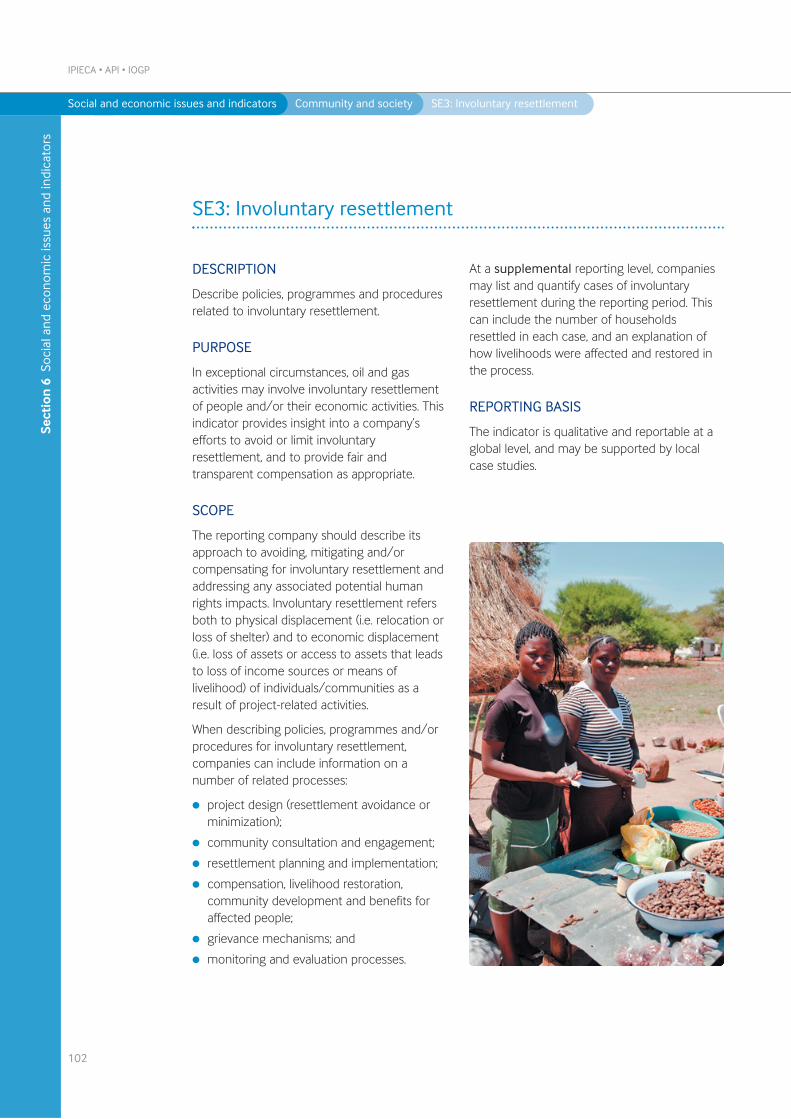
DESCRIPTION
Describe policies, programmes and proceduresrelated to involuntary resettlement.
PURPOSE
In exceptional circumstances, oil and gasactivities may involve involuntary resettlementof people and/or their economic activities. Thisindicator provides insight into a company’sefforts to avoid or limit involuntaryresettlement, and to provide fair andtransparent compensation as appropriate.
SCOPE
The reporting company should describe itsapproach to avoiding, mitigating and/orcompensating for involuntary resettlement andaddressing any associated potential humanrights impacts. Involuntary resettlement refersboth to physical displacement (i.e. relocation orloss of shelter) and to economic displacement(i.e. loss of assets or access to assets that leadsto loss of income sources or means oflivelihood) of individuals/communities as aresult of project-related activities.
When describing policies, programmes and/orprocedures for involuntary resettlement,companies can include information on anumber of related processes:
l project design (resettlement avoidance orminimization);
l community consultation and engagement;
l resettlement planning and implementation;
l compensation, livelihood restoration,community development and benefits foraffected people;
l grievance mechanisms; and
l monitoring and evaluation processes.
At a supplemental reporting level, companiesmay list and quantify cases of involuntaryresettlement during the reporting period. Thiscan include the number of householdsresettled in each case, and an explanation ofhow livelihoods were affected and restored inthe process.
REPORTING BASIS
The indicator is qualitative and reportable at aglobal level, and may be supported by localcase studies.
IPIECA • API • IOGP
102
SE3: Involuntary resettlement
Sect
ion
6 S
ocia
l and
eco
nom
ic is
sues
and
indi
cato
rs
Social and economic issues and indicators Community and society SE3: Involuntary resettlement
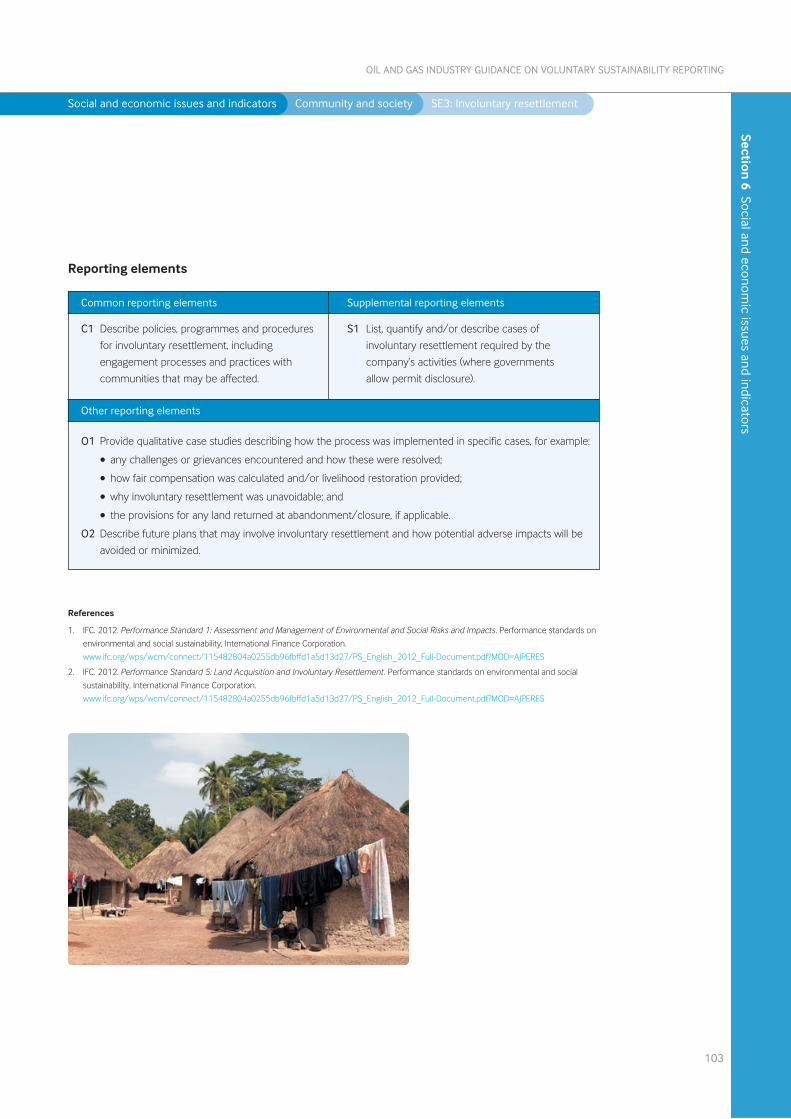
103
OIL AND GAS INDUSTRY GUIDANCE ON VOLUNTARY SUSTAINABILITY REPORTING
Section 6 Social and econom
ic issues and indicators
Social and economic issues and indicators Community and society SE3: Involuntary resettlement
Common reporting elements
Other reporting elements
Supplemental reporting elements
C1 Describe policies, programmes and procedures
for involuntary resettlement, including
engagement processes and practices with
communities that may be affected.
S1 List, quantify and/or describe cases of
involuntary resettlement required by the
company’s activities (where governments
allow permit disclosure).
O1 Provide qualitative case studies describing how the process was implemented in specific cases, for example:
• any challenges or grievances encountered and how these were resolved;
• how fair compensation was calculated and/or livelihood restoration provided;
• why involuntary resettlement was unavoidable; and
• the provisions for any land returned at abandonment/closure, if applicable.
O2 Describe future plans that may involve involuntary resettlement and how potential adverse impacts will be
avoided or minimized.
Reporting elements
References
1. IFC. 2012. Performance Standard 1: Assessment and Management of Environmental and Social Risks and Impacts. Performance standards on
environmental and social sustainability, International Finance Corporation.
www.ifc.org/wps/wcm/connect/115482804a0255db96fbffd1a5d13d27/PS_English_2012_Full-Document.pdf?MOD=AJPERES
2. IFC. 2012. Performance Standard 5: Land Acquisition and Involuntary Resettlement. Performance standards on environmental and social
sustainability, International Finance Corporation.
www.ifc.org/wps/wcm/connect/115482804a0255db96fbffd1a5d13d27/PS_English_2012_Full-Document.pdf?MOD=AJPERES

DESCRIPTION
Describe strategies, programmes andprocedures relating to social investment, andtheir effectiveness.
PURPOSE
This indicator demonstrates a company’sapproach to social investment. Since socialinvestment decisions are often the result ofconsultation and engagement activities aimedat understanding and meeting communityneeds and aspirations, successful socialinvestment projects can be an indicator of thequality of relationships of a company with localcommunities.
SCOPE
Companies should describe their overarchingsocial investment strategy. This may includedescriptions of corporate objectives,engagement strategy on social investments,decision-making criteria, and spending tosupport community development. Companiescan include details on whether initiatives arecommunity-owned and driven, third-party orcompany-facilitated.
At a supplemental reporting level, companiescan discuss the effectiveness of their socialinvestments, including descriptions of:
l processes and methods for assessing andevaluating social investment effectiveness;
l outcomes, impacts and lessons-learned; and
l how social investments may have attractedadditional funding to the community fromother sources, other long-term partnershipsand/or other development activities.
Social investment generally includes company-financed investments and donations for charity,community and social developmentprogrammes. It can include contributions ofexpertise, access to facilities, training or othernon-financial resources.
REPORTING BASIS
The indicator has both qualitative andquantitative aspects, is reportable at a globallevel, and may be supported by local casestudies. Quantitative data should beconsolidated within the company’s reportingboundary (Appendix A).
IPIECA • API • IOGP
104
SE4: Social investment
Sect
ion
6 S
ocia
l and
eco
nom
ic is
sues
and
indi
cato
rs
Social and economic issues and indicators Community and society SE4: Social investment
The company should define what it considersas social investment. In particular whenreporting financial data, explain the basis forreporting total social investment spend (e.g.whether it includes employee giving, marketingprojects, sponsorship, and leveraged funding).
Social investment is separate from anycompensation procedures described inIndicator SE3, Involuntary resettlement.
105
OIL AND GAS INDUSTRY GUIDANCE ON VOLUNTARY SUSTAINABILITY REPORTING
Section 6 Social and econom
ic issues and indicators
Social and economic issues and indicators Community and society SE4: Social investment
Common reporting elements
Other reporting elements
Supplemental reporting elements
C1 Describe the company’s social
investment strategies, programmes
and procedures.
C2 Total social investment.
S1 Provide appraisals of quality and effectiveness of social
investment strategy, including outcomes and impacts.
S2 Social investment broken down by region or country.
O1 Case studies to illustrate implementation of strategy and associated lessons learned, for example:
• how significant segments of the local community feel they are benefiting, including the extent
livelihoods and economic opportunities are improving; or
• whether social investments are fostering improved community relations or creating tensions.
O2 Social investment broken down by voluntary and contractually obligated spend.
Reporting elements
References
1. IPIECA. 2008. Creating Successful, Sustainable Social Investment: Guidance Document for the Oil and Gas Industry.
Contains information on social investment processes, including measuring effectiveness.
www.ipieca.org/publication/guide-successful-sustainable-social-investment-oil-and-gas-industry
2. The London Benchmarking Group provides a model used by many companies around the world to assess and report on the value and
achievements of their social investments. www.lbg-online.net
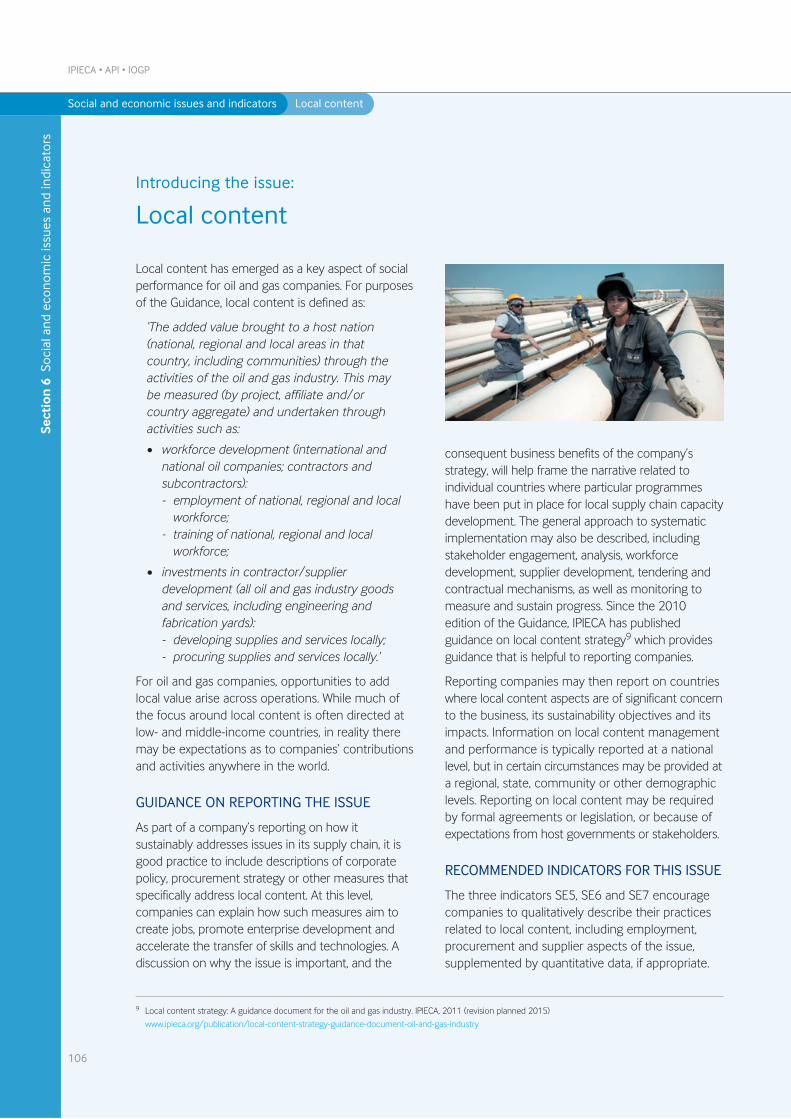
Social and economic issues and indicators Local content
Local content has emerged as a key aspect of socialperformance for oil and gas companies. For purposesof the Guidance, local content is defined as:
‘The added value brought to a host nation(national, regional and local areas in thatcountry, including communities) through theactivities of the oil and gas industry. This maybe measured (by project, affiliate and/orcountry aggregate) and undertaken throughactivities such as:
• workforce development (international andnational oil companies; contractors andsubcontractors):- employment of national, regional and local
workforce;- training of national, regional and local
workforce;
• investments in contractor/supplierdevelopment (all oil and gas industry goodsand services, including engineering andfabrication yards):- developing supplies and services locally;- procuring supplies and services locally.’
For oil and gas companies, opportunities to addlocal value arise across operations. While much ofthe focus around local content is often directed atlow- and middle-income countries, in reality theremay be expectations as to companies’ contributionsand activities anywhere in the world.
GUIDANCE ON REPORTING THE ISSUE
As part of a company’s reporting on how itsustainably addresses issues in its supply chain, it isgood practice to include descriptions of corporatepolicy, procurement strategy or other measures thatspecifically address local content. At this level,companies can explain how such measures aim tocreate jobs, promote enterprise development andaccelerate the transfer of skills and technologies. Adiscussion on why the issue is important, and the
consequent business benefits of the company’sstrategy, will help frame the narrative related toindividual countries where particular programmeshave been put in place for local supply chain capacitydevelopment. The general approach to systematicimplementation may also be described, includingstakeholder engagement, analysis, workforcedevelopment, supplier development, tendering andcontractual mechanisms, as well as monitoring tomeasure and sustain progress. Since the 2010edition of the Guidance, IPIECA has publishedguidance on local content strategy9 which providesguidance that is helpful to reporting companies.
Reporting companies may then report on countrieswhere local content aspects are of significant concernto the business, its sustainability objectives and itsimpacts. Information on local content managementand performance is typically reported at a nationallevel, but in certain circumstances may be provided ata regional, state, community or other demographiclevels. Reporting on local content may be requiredby formal agreements or legislation, or because ofexpectations from host governments or stakeholders.
RECOMMENDED INDICATORS FOR THIS ISSUE
The three indicators SE5, SE6 and SE7 encouragecompanies to qualitatively describe their practicesrelated to local content, including employment,procurement and supplier aspects of the issue,supplemented by quantitative data, if appropriate.
IPIECA • API • IOGP
106
Introducing the issue:
Local content
Sect
ion
6 S
ocia
l and
eco
nom
ic is
sues
and
indi
cato
rs
9 Local content strategy: A guidance document for the oil and gas industry. IPIECA, 2011 (revision planned 2015)
www.ipieca.org/publication/local-content-strategy-guidance-document-oil-and-gas-industry
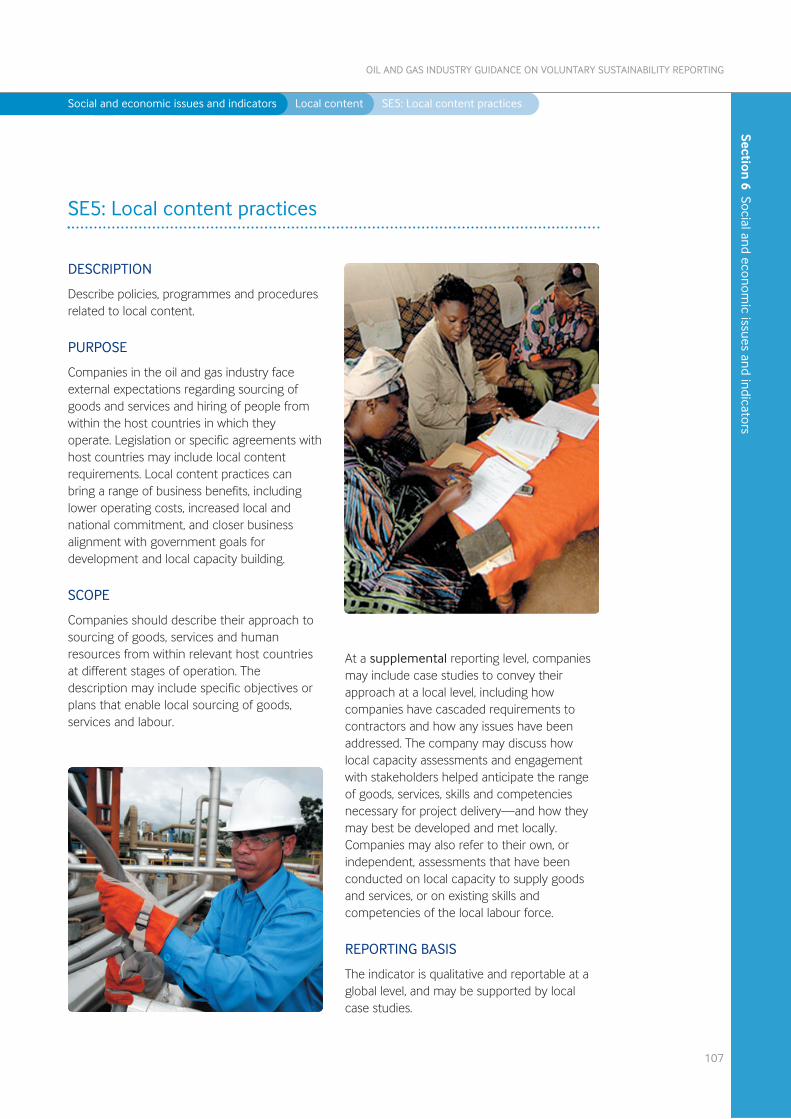
DESCRIPTION
Describe policies, programmes and proceduresrelated to local content.
PURPOSE
Companies in the oil and gas industry faceexternal expectations regarding sourcing ofgoods and services and hiring of people fromwithin the host countries in which theyoperate. Legislation or specific agreements withhost countries may include local contentrequirements. Local content practices canbring a range of business benefits, includinglower operating costs, increased local andnational commitment, and closer businessalignment with government goals fordevelopment and local capacity building.
SCOPE
Companies should describe their approach tosourcing of goods, services and humanresources from within relevant host countriesat different stages of operation. Thedescription may include specific objectives orplans that enable local sourcing of goods,services and labour.
At a supplemental reporting level, companiesmay include case studies to convey theirapproach at a local level, including howcompanies have cascaded requirements tocontractors and how any issues have beenaddressed. The company may discuss howlocal capacity assessments and engagementwith stakeholders helped anticipate the rangeof goods, services, skills and competenciesnecessary for project delivery—and how theymay best be developed and met locally.Companies may also refer to their own, orindependent, assessments that have beenconducted on local capacity to supply goodsand services, or on existing skills andcompetencies of the local labour force.
REPORTING BASIS
The indicator is qualitative and reportable at aglobal level, and may be supported by localcase studies.
107
OIL AND GAS INDUSTRY GUIDANCE ON VOLUNTARY SUSTAINABILITY REPORTING
SE5: Local content practices
Section 6 Social and econom
ic issues and indicators
Social and economic issues and indicators Local content SE5: Local content practices
IPIECA • API • IOGP
108
Sect
ion
6 S
ocia
l and
eco
nom
ic is
sues
and
indi
cato
rs
Social and economic issues and indicators Local content SE5: Local content practices
Common reporting elements
Other reporting elements
Supplemental reporting elements
C1 Company policies, programmes and
procedures to sourcing goods, services
and human resources.
S1 Using case studies, describe how company policies,
programmes and procedures are implemented
locally, including results and lessons learned.
S2 List of countries/regions where local capacity
assessments have been made.
O1 Quantify the number (or percentage) of the company’s organizational entities that are covered by formal
agreements or legislation within host countries regarding local content.
O2 Case studies may be useful for discussing the socio-economic impacts of company local content activities
on the host country. This may be linked to reporting of Indicator SE1, Local community impacts and
engagement.
Reporting elements
References
1. IPIECA. 2011. Local content strategy: A guidance document for the oil and gas industry. (Revision planned 2015)
www.ipieca.org/publication/local-content-strategy-guidance-document-oil-and-gas-industry
74
DESCRIPTION
Describe the company’s strategies,programmes and procedures to provideemployment opportunities to residents ornationals of host countries and communities.
PURPOSE
This indicator demonstrates the reach andeffectiveness of a company’s managementstrategy on local employment in relevantlocations. It is one aspect of the company’slocal economic impact.
SCOPE
Companies should describe the nature andeffectiveness of their processes and strategyaimed at providing employment opportunitiesto residents or nationals of host countries,broken down by countries, regions,
communities, business units or otherdemographics, where relevant. This shouldinclude descriptions of:
l processes related to staff hiring, appraisal,training, development and progression; and
l specific education programmes to enhancelocal employability.
At a supplemental reporting level, companiescan provide further evidence of theirprogrammes by reporting and discussingannual statistical data on local hiring related tokey job posts in relevant locations.
REPORTING BASIS
The indicator is qualitative and reportable at aglobal level, and may be supported byquantitative information and local case studies.If reported, quantitative data should beconsolidated within the company’s reportingboundary (Appendix A).
109
OIL AND GAS INDUSTRY GUIDANCE ON VOLUNTARY SUSTAINABILITY REPORTING
SE6: Local hiring practices
Section 6 Social and econom
ic issues and indicators
Social and economic issues and indicators Local content SE6: Local hiring practices
Common reporting elements
Other reporting elements
Supplemental reporting elements
C1 Describe strategies, programmes and
procedures aimed at providing
employment opportunities to residents
or nationals of host countries.
S1 Number and/or percentage of local (national) versus
expatriate (international) employees in management
and other senior roles in target countries or regions.
O1 Provide information on how local employment strategies promote diversity and inclusion (e.g. in relation
to gender, ethnicity, disability) at the local level. Include management roles. (See also Indicator SE15,
Workforce diversity and inclusion).
O2 Include information and/or quantitative data on local employees that are given training in other (non-
local) assets of the company.
O3 Discussion on indirect job creation and economic development resulting from the company’s activities.
Reporting elements
References
Econometric models exist for estimating multiplier effects (creation of indirect jobs), and may be found in the following (among others):
1. EBRD (European Bank for Reconstruction and Development). Maximising the Positive Socio-Economic Impact of Mineral Extraction on
Regional Development in Transition Economies: A Review of the Literature. www.ebrd.com/downloads/research/economics/auty.pdf
2. ICMM. 2008. Resource Endowment Toolkit: The Challenge of Mineral Wealth: Using Resource Endowments to Foster Sustainable
Development. International Council on Mining and Metals. www.icmm.com/document/423
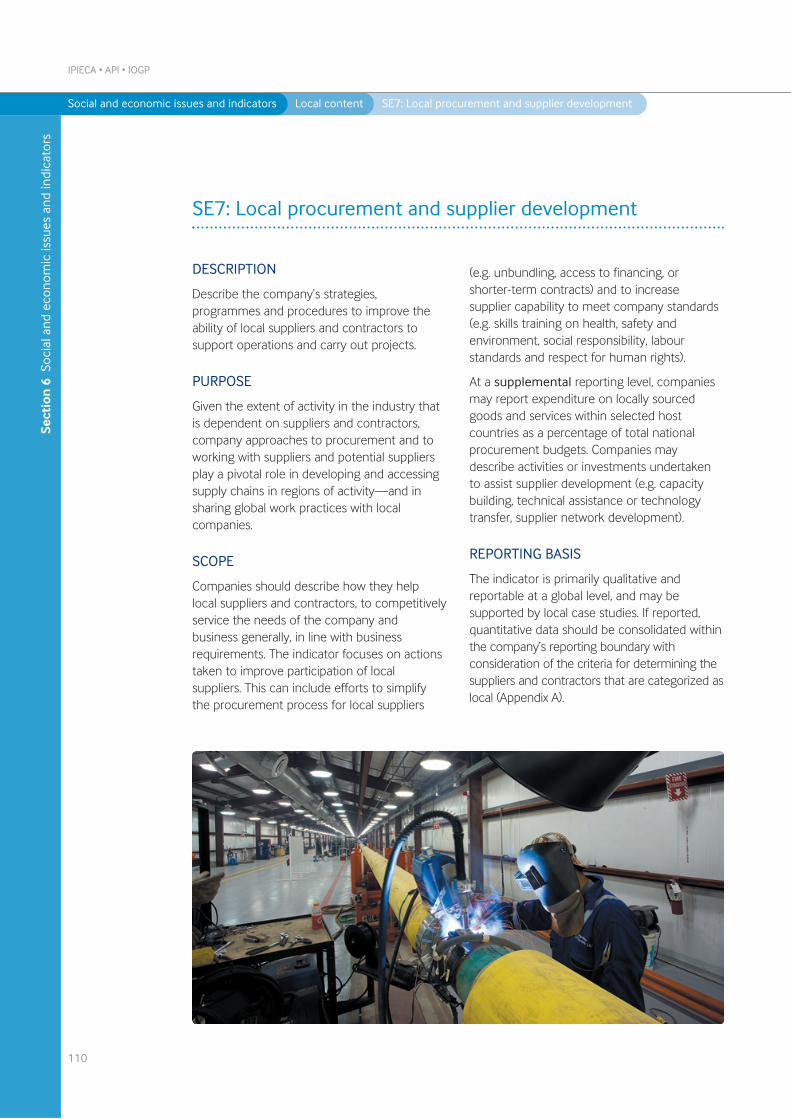
DESCRIPTION
Describe the company’s strategies,programmes and procedures to improve theability of local suppliers and contractors tosupport operations and carry out projects.
PURPOSE
Given the extent of activity in the industry thatis dependent on suppliers and contractors,company approaches to procurement and toworking with suppliers and potential suppliersplay a pivotal role in developing and accessingsupply chains in regions of activity—and insharing global work practices with localcompanies.
SCOPE
Companies should describe how they helplocal suppliers and contractors, to competitivelyservice the needs of the company andbusiness generally, in line with businessrequirements. The indicator focuses on actionstaken to improve participation of localsuppliers. This can include efforts to simplifythe procurement process for local suppliers
(e.g. unbundling, access to financing, orshorter-term contracts) and to increasesupplier capability to meet company standards(e.g. skills training on health, safety andenvironment, social responsibility, labourstandards and respect for human rights).
At a supplemental reporting level, companiesmay report expenditure on locally sourcedgoods and services within selected hostcountries as a percentage of total nationalprocurement budgets. Companies maydescribe activities or investments undertakento assist supplier development (e.g. capacitybuilding, technical assistance or technologytransfer, supplier network development).
REPORTING BASIS
The indicator is primarily qualitative andreportable at a global level, and may besupported by local case studies. If reported,quantitative data should be consolidated withinthe company’s reporting boundary withconsideration of the criteria for determining thesuppliers and contractors that are categorized aslocal (Appendix A).
IPIECA • API • IOGP
110
SE7: Local procurement and supplier development
Sect
ion
6 S
ocia
l and
eco
nom
ic is
sues
and
indi
cato
rs
Social and economic issues and indicators Local content SE7: Local procurement and supplier development
111
OIL AND GAS INDUSTRY GUIDANCE ON VOLUNTARY SUSTAINABILITY REPORTING
Section 6 Social and econom
ic issues and indicators
Social and economic issues and indicators Local content SE7: Local procurement and supplier development
Common reporting elements
Other reporting elements
Supplemental reporting elements
C1 Describe strategies, programmes and
procedures to improve the ability of local
suppliers and contractors to support
operations and projects.
S1 Proportion of money spent on goods and services
sourced locally.
S2 Describe further activities undertaken to assist
supplier development.
O1 Describe how the procurement process facilitates or encourages first-tier suppliers and contractors to buy
locally.
O2 Discuss pre-qualification criteria for potential suppliers, which could include:
• track record of working with local firms;
• strategies for developing local content in a given country; and
• demonstrable experience of developing capacity of local suppliers and subcontractors.
O3 Evidence of local business development not directly related to meeting current company needs, but as a
result of increased economic activity and opportunities made possible by the project and its local
economic benefits.
Reporting elements
References
1. Engineers Against Poverty. Maximising the Contributions of Local Enterprises to the Supply Chain of Oil, Gas and Mining Projects in Low
Income Countries. A briefing note for supply chain managers and technical end users.
www.engineersagainstpoverty.org/documentdownload.axd?documentresourceid=22
2. WBCSD. 2007. Promoting Small and Medium Enterprises for Sustainable Development. Development Focus Area - Issue Brief
www.wbcsd.org/web/publications/sme.pdf
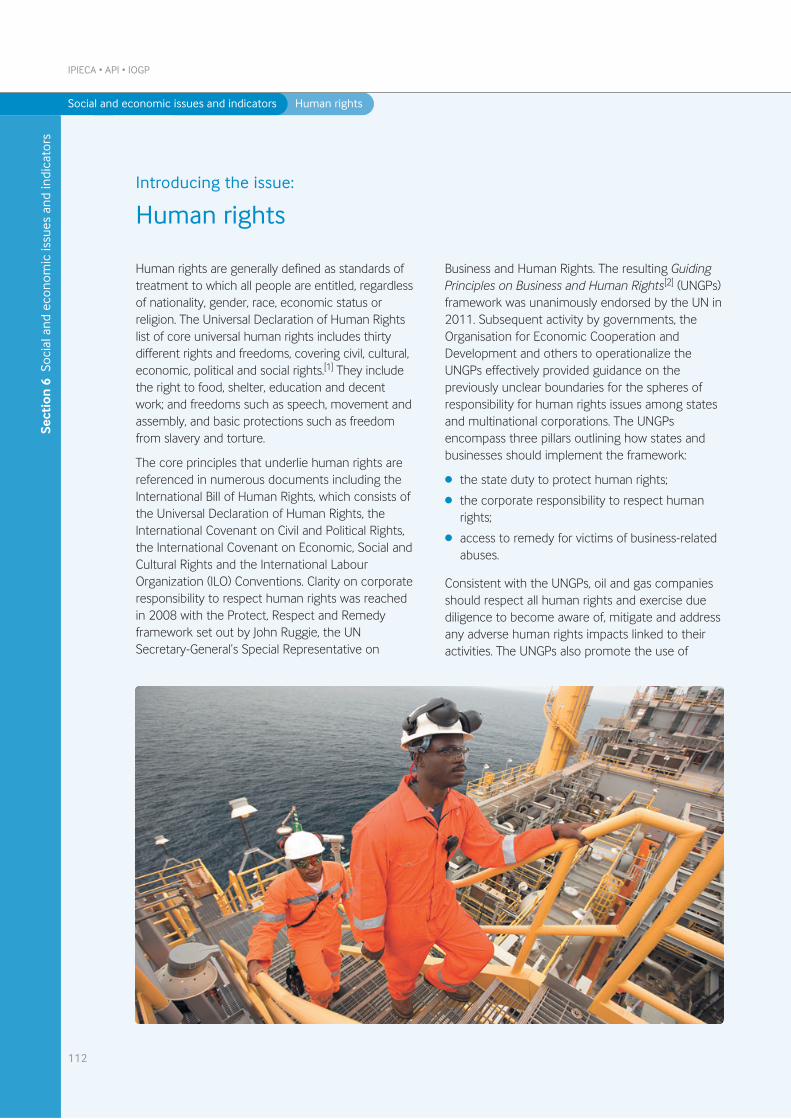
Social and economic issues and indicators Human rights
Human rights are generally defined as standards oftreatment to which all people are entitled, regardlessof nationality, gender, race, economic status orreligion. The Universal Declaration of Human Rightslist of core universal human rights includes thirtydifferent rights and freedoms, covering civil, cultural,economic, political and social rights.[1] They includethe right to food, shelter, education and decentwork; and freedoms such as speech, movement andassembly, and basic protections such as freedomfrom slavery and torture.
The core principles that underlie human rights arereferenced in numerous documents including theInternational Bill of Human Rights, which consists ofthe Universal Declaration of Human Rights, theInternational Covenant on Civil and Political Rights,the International Covenant on Economic, Social andCultural Rights and the International LabourOrganization (ILO) Conventions. Clarity on corporateresponsibility to respect human rights was reachedin 2008 with the Protect, Respect and Remedyframework set out by John Ruggie, the UNSecretary-General’s Special Representative on
Business and Human Rights. The resulting GuidingPrinciples on Business and Human Rights[2] (UNGPs)framework was unanimously endorsed by the UN in2011. Subsequent activity by governments, theOrganisation for Economic Cooperation andDevelopment and others to operationalize theUNGPs effectively provided guidance on thepreviously unclear boundaries for the spheres ofresponsibility for human rights issues among statesand multinational corporations. The UNGPsencompass three pillars outlining how states andbusinesses should implement the framework:
l the state duty to protect human rights;
l the corporate responsibility to respect humanrights;
l access to remedy for victims of business-relatedabuses.
Consistent with the UNGPs, oil and gas companiesshould respect all human rights and exercise duediligence to become aware of, mitigate and addressany adverse human rights impacts linked to theiractivities. The UNGPs also promote the use of
IPIECA • API • IOGP
112
Introducing the issue:
Human rights
Sect
ion
6 S
ocia
l and
eco
nom
ic is
sues
and
indi
cato
rs
Social and economic issues and indicators Human rights
effective community grievance mechanisms (CGMs)which can provide channels for affected individualsor communities to raise questions or concerns with acompany and to have them addressed, and whereappropriate remedied, in a prompt, fair and consistentmanner. CGMs can complement, but do not replace,state-based judicial or non-judicial forms of remedy.
IPIECA publications support understanding andimplementation of the UNGPs, particularly in theareas of due diligence, impact assessment andCGMs. The content of these publications is reflectedin this 2015 update of the Guidance.
GUIDANCE ON REPORTING THE ISSUE
The oil and gas industry operates in some of themost challenging locations in the world, and canface complex human rights-related issues. Althoughit is for each company to develop its own approachto reporting on human rights, the following types ofnarrative may be included:
l At the corporate level, a description of anyrelevant processes, positions or policy principlesto ensure respect for human rights through thelife cycle of activities and within the supply chain,referencing human rights frameworks andguidance adopted by the company.
l At the regional, country or asset level, adiscussion on the relevance of human rights totheir operations, including specific localchallenges and opportunities.
l For companies operating in locations wherethere is a heightened risk to human rights, adiscussion of the importance of being proactivewith due diligence measures to ensure humanrights are respected, including assessment ofpotential impacts, grievance mechanisms andremedial support.
l Highlights of initiatives to improve the company’soverall approach to human rights, such as theuse of integrated Environmental and Social andHealth Impact Assessment (ESHIA) processes,enhancements to procurement and supply chainmanagement processes, or awareness/training.
The human rights issue cuts across other issues inthis Guidance, in particular Community and Society,Labour Practices, Health and Safety andEnvironment. For this reason, a company maydiscuss how these issues are interrelated andsystematically managed.
RECOMMENDED INDICATORS FOR THIS ISSUE
The three indicators, SE8, SE9 and SE10, areprimarily qualitative and focus on human rights duediligence and on specific areas related to suppliersand security that are relevant to oil and gascompanies.
113
OIL AND GAS INDUSTRY GUIDANCE ON VOLUNTARY SUSTAINABILITY REPORTING
Section 6 Social and econom
ic issues and indicators
References
1. Universal Declaration of Human Rights. 1948. Adopted by the United Nations General Assembly in December 1948. www.un.org/en/documents/udhr
2. Ruggie, J. 2011. Guiding Principles on Business and Human Rights: Implementing the United Nations ‘Protect, Respect and Remedy’ Framework. Report of the
Special Representative of the Secretary-General on the issue of human rights and transnational corporations and other business enterprises. United Nations
Human Rights Council, Geneva, 21 March 2011. http://business-humanrights.org/sites/default/files/media/documents/ruggie/ruggie-guiding-principles-21-
mar-2011.pdf. See also www.ohchr.org/Documents/Publications/GuidingPrinciplesBusinessHR_EN.pdf.
3. International Bill of Rights. Includes the Universal Declaration on Human Rights (UDHR), the International Covenant on Civil and Political Rights (ICCPR), the
International Covenant on Economic, Social and Cultural Rights (ICESCR) and the two Optional Protocols to the ICCPR. In addition to the covenants in the
International Bill of Human Rights, the United Nations has adopted more than twenty principal treaties further elaborating human rights. These include
conventions to prevent and prohibit specific abuses such as torture and genocide and to protect specific vulnerable populations such as Indigenous Peoples
(Convention on Indigenous and Tribal Peoples in Independent Countries, 1989), refugees (Convention Relating to the Status of Refugees, 1951), women
(Convention on the Elimination of All Forms of Discrimination Against Women, 1979), and children (Convention on the Rights of the Child, 1989). Other
conventions cover racial discrimination, prevention of genocide, political rights of women, prohibition of slavery (www.humanrights.com/what-are-human-
rights/videos/no-slavery.html) and torture.
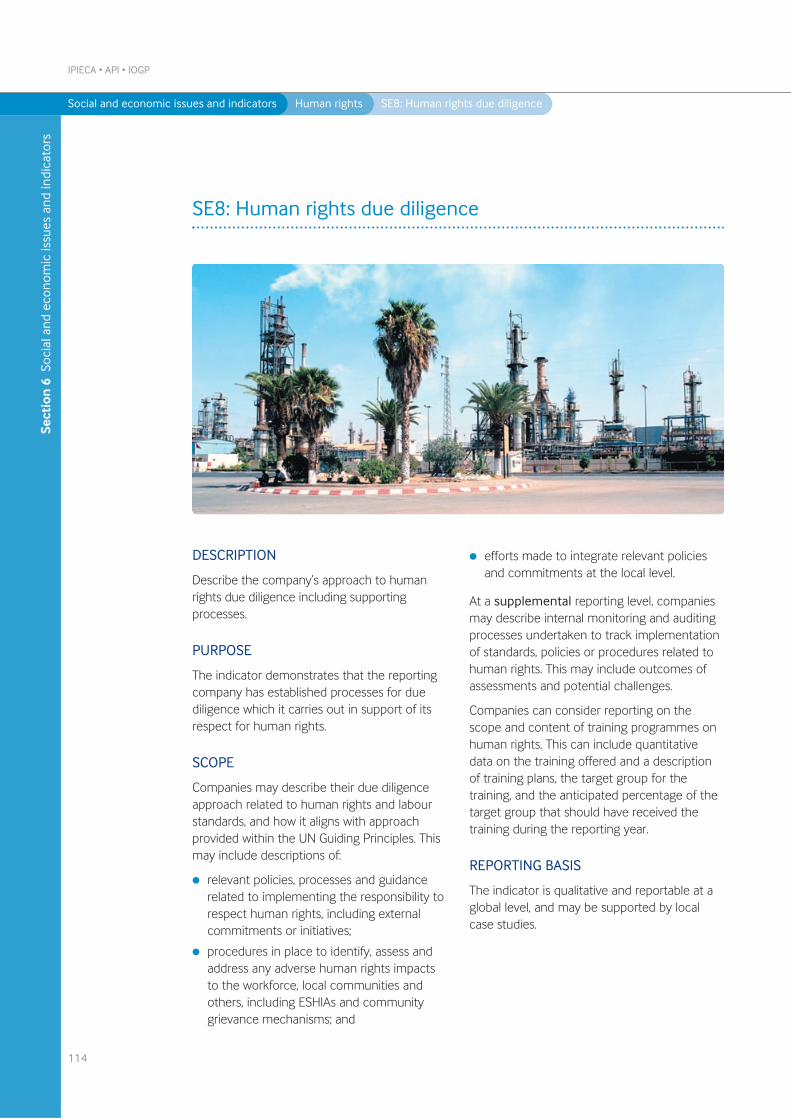
IPIECA • API • IOGP
114
SE8: Human rights due diligence
Sect
ion
6 S
ocia
l and
eco
nom
ic is
sues
and
indi
cato
rs
Social and economic issues and indicators Human rights SE8: Human rights due diligence
DESCRIPTION
Describe the company’s approach to humanrights due diligence including supportingprocesses.
PURPOSE
The indicator demonstrates that the reportingcompany has established processes for duediligence which it carries out in support of itsrespect for human rights.
SCOPE
Companies may describe their due diligenceapproach related to human rights and labourstandards, and how it aligns with approachprovided within the UN Guiding Principles. Thismay include descriptions of:
l relevant policies, processes and guidancerelated to implementing the responsibility torespect human rights, including externalcommitments or initiatives;
l procedures in place to identify, assess andaddress any adverse human rights impactsto the workforce, local communities andothers, including ESHIAs and communitygrievance mechanisms; and
l efforts made to integrate relevant policiesand commitments at the local level.
At a supplemental reporting level, companiesmay describe internal monitoring and auditingprocesses undertaken to track implementationof standards, policies or procedures related tohuman rights. This may include outcomes ofassessments and potential challenges.
Companies can consider reporting on thescope and content of training programmes onhuman rights. This can include quantitativedata on the training offered and a descriptionof training plans, the target group for thetraining, and the anticipated percentage of thetarget group that should have received thetraining during the reporting year.
REPORTING BASIS
The indicator is qualitative and reportable at aglobal level, and may be supported by localcase studies.
115
OIL AND GAS INDUSTRY GUIDANCE ON VOLUNTARY SUSTAINABILITY REPORTING
Section 6 Social and econom
ic issues and indicators
Social and economic issues and indicators Human rights SE8: Human rights due diligence
Common reporting elements
Other reporting elements
Supplemental reporting elements
C1 Describe the components of the
company’s human rights due diligence
approach including supporting processes
to assess, address, monitor and
communicate actual or potential human
rights impacts.
S1 Describe strategies and programmes that support the
company’s approach to human rights at the local
level, supported by specific examples for clarification,
as appropriate.
S2 Scope, content and tracking of human rights training
programmes.
O1 Provide additional context on the relevance of human rights standards to operations, which may include
references to external country and/or human rights risk indices or rankings.
O2 Case studies to illustrate how potential human rights issues related to company operations are being
assessed and addressed through management plans with procedures to monitor concerns and
grievances, and to progress these to closure.
O3 Qualitative and/or quantitative measures for tracking implementation and outcomes of policies and
procedures (e.g. human rights considerations in evaluating investments and/or business relationships, and
results of monitoring/auditing).
O4 Qualitative and/or quantitative measures to track the effectiveness of human rights due diligence.
Reporting elements
References
1. Danish Institute for Human Rights. Business and human rights tools and publications.
www.humanrightsbusiness.org/?f=compliance_assessment
2. GRI. 2009. A Resource Guide to Corporate Human Rights Reporting. (GRI Research and Development Series).
https://www.globalreporting.org/resourcelibrary/A-Resource-Guide-to-Corporate-Human-Rights-Reporting.pdf
3. ICCPR (The International Covenant on Civil and Political Rights). 1966. Adopted by the United Nations General Assembly in December 1966.
www2.ohchr.org/english/law/ccpr.htm
4. ILO. 1998. Declaration on Fundamental Principles and Rights at Work. www.ilo.org/declaration/lang--en/index.htm
5. IPIECA. 2012. Human rights due diligence process: a practical guide to implementation for oil and gas companies
www.ipieca.org/publication/human-rights-due-diligence-process-practical-guide-implementation-oil-and-gas-companies
6. OECD. 2011. Guidelines for Multinational Enterprises. http://www.oecd.org/corporate/mne
7. Ruggie, J. 2011. Guiding Principles on Business and Human Rights: Implementing the United Nations ‘Protect, Respect and Remedy’
Framework. Report of the Special Representative of the Secretary-General on the issue of human rights and transnational corporations and
other business enterprises. United Nations Human Rights Council, Geneva, 21 March 2011. http://business-
humanrights.org/sites/default/files/media/documents/ruggie/ruggie-guiding-principles-21-mar-2011.pdf.
See also www.ohchr.org/Documents/Publications/GuidingPrinciplesBusinessHR_EN.pdf
8. Shift Project Ltd. 2015. UN Guiding Principles Reporting Framework. http://www.ungpreporting.org
9. Universal Declaration of Human Rights. 1948. Adopted by the United Nations General Assembly in December 1948.
www.un.org/en/documents/udhr
10. Voluntary Principles on Security and Human Rights. 2000. www.voluntaryprinciples.org
DESCRIPTION
Describe the approach, programmes andprocesses to promote respect for human rightsand labour practices by suppliers.
PURPOSE
As providers of goods and services, suppliersplay a key role in the operations of the oil andgas industry. Hence, the conduct of suppliersand contractors concerning human rights andlabour practices can have a significant impacton the company and its stakeholders.
SCOPE
The reporting company may describe its overallapproach, in procurement and contracting, topromote respect for human rights andequitable labour practices by its suppliers andcontractors. This may include:
• relevant processes and guidance providedto suppliers and contractors;
• steps taken before entering into contractswith suppliers and contractors (such assupplier engagement, review of policies andperformance, and assessment/audit); and
• training or capacity building to improvesupplier performance to meet contractrequirements.
SE9: Human rights and suppliers
Common reporting elements
Other reporting elements
Supplemental reporting elements
C1 Describe approach and processes that the
company has for promoting respect for
human rights and labour practices by suppliers.
S1 Estimated percentage of significant contracts with relevant clauses.
S2 Efforts aimed at promoting the UN Guiding Principles in the supply
chain, including due diligence processes and grievance mechanisms.
O1 Procedures to monitor supplier adherence to contractual agreements related to human rights and actions taken when
findings do not meet the company’s expectations.
Reporting elements
IPIECA • API • IOGP
116
Sect
ion
6 S
ocia
l and
eco
nom
ic is
sues
and
indi
cato
rs
Social and economic issues and indicators Human rights SE9: Human rights and suppliers
At the supplemental reporting level,companies may include quantitativeinformation by estimating the percentage ofsignificant supplier contracts that containspecific human rights clauses. Companiesshould define the term ‘significant’ (seeGlossary). They may decide to base thedetermination on the size of the contractsissued to suppliers in particular regions/countries or other criteria set out by thereporting company.
Companies may discuss specific efforts toengage suppliers in developing common goals,attitudes and behaviour related to respectinghuman rights. Companies may incorporaterelevant aspects of the labour practices issue(see pages 125–130, including IndicatorsSE16–18) related to specific actions thatpromote good practices within the supply chain.
REPORTING BASIS
The indicator is qualitative and reportable at aglobal level and may be supported by localcase studies. The company should determinewhich issues related to their supply chains arematerial for reporting (see page 18). Wherequantitative data is included, the companyshould determine an appropriate reportingboundary, including consideration of the extentto which subcontractors and further levels ofthe supply chain are included (see Appendix Afor further guidance.)
117
OIL AND GAS INDUSTRY GUIDANCE ON VOLUNTARY SUSTAINABILITY REPORTING
Section 6 Social and econom
ic issues and indicators
Social and economic issues and indicators Human rights SE10: Security and human rights
DESCRIPTION
Describe policies, programmes and processesrelated to security and human rights.
PURPOSE
Maintaining safe and secure operations whilerespecting human rights is an importantelement of oil and gas operations. Thisindicator demonstrates how the reportingcompany manages and monitors performancepertaining to security and human rights.
SCOPE
The reporting company should describe thecompany’s approach to security and humanrights practices. This may include a descriptionof relevant global level policies, proceduresand/or guidelines, such as:
l risk assessment processes;
l procedures to monitor, report and respondto security-related incidents with humanrights implications;
l procedures for entering into relations withpublic or private security providers; and
l efforts to raise awareness of security andhuman rights for relevant staff.
At a supplemental reporting level, companiesmay discuss implementation of their country-specific policies, programmes and processes.This may include an overview of countrieswhere implementation is taking place, such as:
l descriptions of engagement withstakeholders;
l criteria for the selection and contracting ofprivate security forces or arrangements withpublic security forces; and
l examples of support for outreach, educationand training of relevant personnel, privatesecurity, public security and civil society.
REPORTING BASIS
The indicator is qualitative and reportable at aglobal level, and may be supported by country-level information.
SE10: Security and human rights
Common reporting elements
Other reporting elements
Supplemental reporting elements
C1 Describe relevant policies, programmes
and processes pertaining to security and
human rights.
S1 Describe how policies, programmes and processes
related to security and human rights are
implemented at the country-specific level.
O1 Companies that are participants in the Voluntary Principles on Security and Human Rights (VPSHR) may
also report on implementation of the Voluntary Principles.
O2 Report on specific objectives set during the reporting period, or on lessons and issues encountered at the
country level.
Reporting elements
References
1. Voluntary Principles on Security and Human Rights. 2000. www.voluntaryprinciples.org
Social and economic issues and indicators Business ethics and transparency
The bribing of private or public persons to obtainbusiness advantage can distort internationalcompetitive conditions and negatively affect theeconomic and political progress of societies, inaddition to being illegal in most countries. There aretwo international conventions against corruptionthat have been widely endorsed and incorporatedinto national legislation:
l OECD Convention on Combating Bribery ofForeign Public Officials in International BusinessTransactions (1997); and
l United Nations Convention against Corruption(2005).
At the national level, legislation can vary. The USForeign Corrupt Practices Act of 1977 and the UKBribery Act of 2010 are both widely recognized, asare the EU Anti-Corruption Conventions of 1997and 2003. Countries including Russia, China, Braziland Canada have more recently enactedcomparable legislation and today many countrieshave anti-corruption measures. While legislationtackles corruption, there are practices thatlegislation does not always address clearly, includingfacilitation payments, donations and gifts.Companies therefore commonly establish their ownbusiness ethics policies supported by codes ofconduct or integrity programmes.
Transparency is an important aspect of this issue,particularly with respect to revenue payments tohost governments and any advocacy or lobbyingactivities.
Oil and gas companies contribute large sums ofmoney to the fiscal revenue streams of hostgovernments. Revenue transparency is amechanism for disclosing information aboutrevenue flows from oil and gas activities inresource-rich countries. The best-known effortaimed at promoting and standardizing revenuetransparency is the Extractive IndustriesTransparency Initiative (EITI), under which:
l companies within a country report on theirsignificant payments to the host government;
l the host government reports what it receives;and
l the host government issues a public report oncompany payments and government revenues.
More recently, at the regional level, the 2012 Dodd-Frank Wall Street Reform and Consumer ProtectionAct (Section 1504) in the US was followed by newEU disclosure rules within the EU AccountingDirective and the revised EU Transparency Directive.
Business can have influence through participation inpublic policy debates and input to legislativedevelopments. Engagement of this sort is bothlegitimate and necessary. However, transparencyregarding a company’s political engagement andfinancial contributions is an important part ofmaintaining trust with a variety of stakeholders.
IPIECA • API • IOGP
118
Introducing the issue:
Business ethics and transparency
Sect
ion
6 S
ocia
l and
eco
nom
ic is
sues
and
indi
cato
rs

Social and economic issues and indicators Business ethics and transparency
GUIDANCE ON REPORTING THE ISSUE
The legislation and practices described above haveresulted in greater clarity on business ethics andtransparency for extractive industries. In theirsustainability reports, companies should explain howthey address this issue through governance, policiesand systems of internal control that are deployed toensure robust standards of business conductcentrally and in countries where they operate.
Companies may provide information on how anti-corruption and business ethics policies areimplemented and monitored. On revenuetransparency, the combination of EITI and US/EUmeasures has been an enabler of financialdisclosure and companies are better positioned toprovide financial data regarding payments to hostgovernments; this is reflected in a significantrevision to Indicator SE13 in this 2015 update ofthe Guidance.
RECOMMENDED INDICATORS FOR THIS ISSUE
Reporting on business ethics and transparency issupported by four indicators. Ethical standards andpractices aimed at preventing corruption, includingbribery, are the focus of the first two indicators,SE11 and SE12, with the latter providing theopportunity to discuss supplier, contractor andother business relationships. The third indicator,SE13, provides a basis for describing how revenuetransparency is promoted, with the option ofproviding data on payments to governments. Therelevance of the fourth indicator, SE14 on publicadvocacy and lobbying, is more dependent on thelocation and nature of a company’s businessactivities, and therefore the prominence of thisindicator is likely to vary by company.
119
OIL AND GAS INDUSTRY GUIDANCE ON VOLUNTARY SUSTAINABILITY REPORTING
Section 6 Social and econom
ic issues and indicators
DESCRIPTION
Describe policies, programmes and proceduresto prevent bribery and corruption, andmechanisms to monitor compliance.
PURPOSE
This indicator demonstrates the company’spolicies and commitments to preventemployees from violating applicable anti-bribery/anti-corruption laws, and procedures inrelation to parties with whom the companydoes business.
SCOPE
Companies should describe key elements ofthe company’s approach to preventingcorruption including giving or receiving bribes.Companies should refer to mechanisms topromote anti-corruption policies andprogrammes, including information, resourcesand tools for raising employee awareness.
The indicator includes a description ofcompliance mechanisms for:
l reporting suspected violations, e.g. through acompany hotline (see also Indicator SE18referring to non-retaliation against ‘whistle-blowing’), supervisory reviews, and employeeand third-party tip-offs; and
l detecting, investigating and preventingbribery and corruption, e.g. through internalcontrols and audits.
At a supplemental reporting level, companiesmay report on the scope and content of anti-bribery and anti-corruption trainingprogrammes offered for employees, includingthe relevance and applicability to theemployees’ specific work. Reporters canprovide a description of the training plans andexpectations for the percentage of employeestrained.
REPORTING BASIS
The indicator is qualitative and reportable at aglobal level.
IPIECA • API • IOGP
120
SE11: Preventing corruption
Sect
ion
6 S
ocia
l and
eco
nom
ic is
sues
and
indi
cato
rs
Social and economic issues and indicators Business ethics and transparency SE11: Preventing corruption
Common reporting elements
Other reporting elements
Supplemental reporting elements
C1 Describe company's policy to address bribery and
corruption.
C2 Describe employee awareness programmes.
C3 Describe internal procedures for reporting and
following-up suspected violations.
S1 Describe the scope, content and
tracking of anti-corruption training
programmes provided.
O1 Describe risks associated with bribery and corruption which are relevant to company operations.
O2 Participation and level of involvement in voluntary initiatives or international conventions.
O3 Disciplinary measures as a result of non-compliance.
Reporting elements
DESCRIPTION
Describe anti-corruption policies andprocedures applicable to business partners,including suppliers and contractors.
PURPOSE
This indicator demonstrates a company’simplementation of policies and commitmentsto address the risk of bribery and corruptioninvolving its business partners, includingsuppliers, contractors and other intermediaries,particularly those representing a companybefore government officials.
SCOPE
Describe the company’s procurement andcontracting approach related to preventingbribery or corruption by its business partners,including suppliers and contractors. This mayinclude descriptions of anti-corruption policiesand due diligence procedures applicable tobusiness partners including:
l communication, including contractualclauses, and actions taken to encouragebusiness partners, including suppliers andcontractors, to implement anti-corruptionprogrammes; and
l processes to monitor compliance with anti-corruption policies and/or compliance withprovisions set forth in contracts.
At a supplemental reporting level, companiesmay estimate the expected percentage ofsignificant contracts that contain specificlanguage intended to prevent corruption. Acompany would be expected to define‘significant’ based on, for example, the size ofthe contract or other criteria set out by thereporting company.
REPORTING BASIS
The indicator is primarily qualitative andreportable at a global level, and may besupported by quantitative data and local casestudies.
121
OIL AND GAS INDUSTRY GUIDANCE ON VOLUNTARY SUSTAINABILITY REPORTING
SE12: Preventing corruption involving business partners
Section 6 Social and econom
ic issues and indicators
Social and economic issues and indicators Business ethics and transparency SE12: Preventing corruption involving business partners
Common reporting elements
Other reporting elements
Supplemental reporting elements
C1 Describe anti-corruption policies and due diligence
procedures applicable to business partners,
including suppliers and contractors.
S1 Percentage of significant contracts that
contain specific language intended to
prevent corruption.
O1 Local case studies or examples to illustrate the implementation of policies, communication and actions.
02 Disciplinary measures as a result of non-compliance.
Reporting elements
DESCRIPTION
Describe policies and programmes for thepromotion of revenue transparency.
PURPOSE
Oil and gas companies often make asignificant contribution to the public revenuesof host governments around the world. Thisindicator encourages companies to describetheir efforts to achieve transparency ofpayments to host governments.
SCOPE
The reporting company should describe itspolicies and programmes for the promotionand achievement of transparency of paymentsto host governments.
The company should indicate:
l participation in transparency initiatives, suchas the Extractive Industries TransparencyInitiative (EITI);
l compliance scope for applicable nationaland regional reporting mandates onpublication of payments, such as thosebeing implemented in the United States andEuropean Union; and
l adoption of any other standards or practiceson transparency of payments.
Companies should also list those EITI-implementing countries where upstreamcompany operations are taking place andpayments are being reported. In addition,companies may include links to any EITI orother public reports that meet legal or otherrequirements for disclosure of payments togovernments.
IPIECA • API • IOGP
122
SE13: Transparency of payments to host governments
Sect
ion
6 S
ocia
l and
eco
nom
ic is
sues
and
indi
cato
rs
Social and economic issues and indicators Business ethics and transparency SE13: Transparency of payments to host governments
At the supplemental reporting level, thecompany may report on payment disclosuresin response to government policy or EITIcommitments. Companies may also reportpayments to countries not yet subject toreporting mandates. Payment information canbe provided at different levels of detail.Companies can consider reporting payment bytype (e.g. taxes, royalties, bonuses, fees,production entitlements, infrastructuredevelopment or other payments) or byamounts paid to individual receivinggovernment agencies.
The company may also report information onany additional transparency efforts to informcommunities and governments about thequantified economic value it is delivering overand above direct government paymentobligations.
REPORTING BASIS
The indicator is qualitative and quantitative withreporting at a global and country level, ifappropriate. Reporters should provideinformation related to activities in countrieswhere revenue transparency issues may be ofparticular relevance.
123
OIL AND GAS INDUSTRY GUIDANCE ON VOLUNTARY SUSTAINABILITY REPORTING
Section 6 Social and econom
ic issues and indicators
Social and economic issues and indicators Business ethics and transparency SE13: Transparency of payments to host governments
Common reporting elements
Other reporting elements
Supplemental reporting elements
C1 Describe company policies and programmes
on revenue transparency.
C2 Describe scope of legal and policy mandates
for government revenue reporting with which
the company is obliged to comply.
C3 Describe participation in the EITI and any
other voluntary reporting initiatives, where
relevant for individual companies, including a
list of EITI-implementing countries where the
company has upstream operations.
S1 Report, by country, payments to countries for
which reporting is subject to governmental legal
or policy mandates, or EITI requirements.
S2 Report, by country, payments to countries for
which there is no reporting requirement.
S3 Explain changes in the reported data compared to
prior years.
S4 If applicable, include links to any EITI or other
public reports of the company that disclose
payments to governments.
S5 Information on further transparency, governance
or anti-corruption efforts related to revenue
transparency.
O1 Case studies that illustrate the company’s transparency efforts with specific governments and communities.
O2 Report other payments outside the scope of national or regional reporting standards or practices.
Reporting elements
References
1. EITI (Extractive Industries Transparency Initiative), including the EITI Business Guide. www.eiti.org
2. EU Accounting Directive 2013/34/EU on the annual financial statements, consolidated financial statements and related reports of certain
types of undertakings. http://eur-lex.europa.eu/legal-content/EN/ALL/?uri=CELEX:32013L0034
3. EU Transparency Directive 2004/109/EC on the harmonisation of transparency requirements in relation to information about issuers whose
securities are admitted to trading on a regulated market and amending Directive 2001/34/EC.
http://eur-lex.europa.eu/legal-content/EN/ALL/?uri=CELEX:02004L0109-20080320
4. United States Dodd-Frank Wall Street Reform And Consumer Protection Act, Sec. 1504, Disclosure of payments by resource extraction
issuers. https://www.sec.gov/about/laws/wallstreetreform-cpa.pdf
DESCRIPTION
Describe the company’s approach to managingpublic advocacy, lobbying and politicalcontributions.
PURPOSE
This indicator demonstrates how a reportingcompany contributes to public policy debatesand legislative development, including policiescovering transparency, political engagementand financial contributions. It shows how acompany is working to maintain stakeholdertrust regarding the nature of its potentialinfluence.
SCOPE
The reporting company should describe keyelements of its advocacy and lobbyingactivities. This may include:
l the company’s overall approach to thereporting of such activities;
l descriptions of priority public policy issuesthe company is advocating; and
l quantitative indications of the amount ofmoney paid for public advocacy andlobbying purposes.
At a supplemental reporting level, thecompany can explain how it reports on politicalcontributions. The company can also report onthe amount of money paid to:
l candidates, politicians and political parties;and
l individuals, organizations and institutionswhose prime function is to fund politicalparties or their candidates.
REPORTING BASIS
The indicator is primarily qualitative andreportable at a global level, and may besupported by quantitative data or country levelinformation. Since definitions and legislationrelated to lobbying and political contributionsvary between countries, it is helpful to explainwhich definitions or standards are applied inmanaging a company’s contributions.
IPIECA • API • IOGP
124
SE14: Public advocacy and lobbying
Sect
ion
6 S
ocia
l and
eco
nom
ic is
sues
and
indi
cato
rs
Social and economic issues and indicators Business ethics and transparency SE14: Public advocacy and lobbying
Common reporting elements
Other reporting elements
Supplemental reporting elements
C1 Describe the key elements of the company’s
advocacy and lobbying activities.
S1 Describe the company’s approach to the
reporting of political contributions.
S2 Provide quantitative indications of the amount of
money spent on political contributions.
O1 Provide examples to illustrate the implementation of the company’s approach in specific countries or on
particular issues.
Reporting elements

Social and economic issues and indicators Labour practices
125
OIL AND GAS INDUSTRY GUIDANCE ON VOLUNTARY SUSTAINABILITY REPORTING
Introducing the issue:
Labour practices
Section 6 Social and econom
ic issues and indicators
Companies are expected to treat all workers withrespect and dignity and promote diversity in theworkplace. The workforce is a key stakeholdergroup and underpins the success of a company. Aswith other stakeholders, engagement is a key toolto ensure that the company culture is positive, i.e.motivation is strong and workers are satisfied withtheir treatment, remuneration and conditions. It isessential that systems are in place to bring forwardgrievances without fear of retaliation.
Fair and equitable treatment of workers is a basicexpectation of society that needs to be approachedsystematically and underpinned with robust policiesand procedures.
GUIDANCE ON REPORTING THE ISSUE
Companies should describe their approach toimplementation of labour practices, includingpolicies if applicable. It is helpful in the report,when discussing policies and corporate practices,to highlight any changes, initiatives or newprocesses that the company has put in place toaddress particular challenges or opportunities that
were material during the reporting year. Oftentopics for discussion will have a geographic ordemographic dimension that serve to illustratelabour practices by case study, for example inrelation to local supply chains, to specific groupswithin the workforce or to human resources indeveloping countries.
When discussing company policies and practices, itis helpful to make reference to, or state alignmentwith, relevant national or international laws,standards or guidelines. At an international level,labour standards consist of conventions or non-binding recommendations, which are negotiatedthrough the tripartite International LabourOrganization (ILO). The four core labour standards,set out in eight ILO Labour Conventions designatedas fundamental by the ILO governing body, include:
l freedom of association and the right to collectivebargaining;
l elimination of forced and compulsory labour;
l abolition of child labour; and
l elimination of discrimination in the workplace.
Social and economic issues and indicators Labour practices
These four core labour standards also form thebasis of principles 3–6 of the United Nations GlobalCompact. With the 1998 adoption by the ILOConference on the Declaration on FundamentalPrinciples and Rights at Work, all ILO member statesbecame obligated to recognize the rights in theseeight conventions as universal irrespective of therelevant conventions’ ratification status.
Apart from these eight fundamental conventions,ILO labour standards include up to 80 otherconventions and recommendations, which havebeen ratified or adopted, and integrated intonational legislation and regulations to varyingdegrees. Standards of particular relevance to the oiland gas industry address specific groups in societysuch as indigenous and tribal peoples, migrantworkers, seafarers and fishermen, or cover subjectssuch as working time, employment security, wages,vocational guidance and training, and occupationalhealth and safety. Following the requirements oflocal law and regulations, together with effectiveimplementation of aligned corporate policies andprocesses, enables companies to meet or exceedinternational labour standards.
RECOMMENDED INDICATORS FOR THIS ISSUE
Indicators in this section describe characteristicsregarding recognition of the need to respect workerrights and to value human capital by, among otherpractices, provision of equal opportunities tocurrent or prospective workers through promotionof diversity and inclusion. It includes investmentthrough activities like training and development, in amanner consistent with company policy andcultural expectations.
The four indicators recognize the need for inclusionof employees as well as contractors and others whoform the workforce of a company. When discussingthe workforce, particularly in quantitative terms,companies should clarify the extent to which eachindicator includes employees, contractors andothers.
IPIECA • API • IOGP
126
Sect
ion
6 S
ocia
l and
eco
nom
ic is
sues
and
indi
cato
rs
References
1. ILO. 1998 (Annex revised 2010). Declaration on Fundamental Principles and Rights at Work. www.ilo.org/declaration/thedeclaration/textdeclaration/lang--
en/index.htm
2. ILO Standards (Conventions and Recommendations) www.ilo.org/global/standards/introduction-to-international-labour-standards/conventions-and-
recommendations/lang--en/index.htm
3. IFC. 2012. Performance Standards on Environmental and Social Sustainability
www.ifc.org/wps/wcm/connect/115482804a0255db96fbffd1a5d13d27/PS_English_2012_Full-Document.pdf?MOD=AJPERES
DESCRIPTION
Describe policies, programmes and procedurespromoting diversity and inclusion.
PURPOSE
This indicator demonstrates the effectivenessof the reporting company’s policies onworkforce diversity and inclusion, particularly inrelation to gender, ethnicity and disability.
SCOPE
The reporting company should describe itspolicies, programmes and/or procedures toaddress workforce diversity and inclusion at aglobal level, illustrated by examples ofimplementation at national levels. Non-discrimination aspects are treated separatelyunder SE8, Human rights due diligence.
At a supplemental reporting level, thecompany can use local or national case studiesto demonstrate how its policies andprocedures are implemented in practice.Implementation outcomes can be evidencedthrough a discussion on the composition of theworkforce, particularly at management level, orby providing quantitative data for relevantdiversity categories, such as gender.
REPORTING BASIS
The indicator is qualitative and reportable at aglobal level, and may be supported byworkforce data and local case studies. Ifreported, quantitative data should beconsolidated within the company’s reportingboundary using the ‘workforce approach’(Appendix A).
127
OIL AND GAS INDUSTRY GUIDANCE ON VOLUNTARY SUSTAINABILITY REPORTING
SE15: Workforce diversity and inclusion
Section 6 Social and econom
ic issues and indicators
Social and economic issues and indicators Labour practices SE15: Workforce diversity and inclusion
Common reporting elements
Other reporting elements
Supplemental reporting elements
C1 Describe the reporting company’s
policies, programmes and procedures to
promote workforce diversity and
inclusion.
C2 Workforce composition data for gender
and/or other diversity categories.
S1 Case study material to illustrate local implementation
of policies, procedures and programmes.
S2 Discuss workforce composition particularly with
reference to management positions.
O1 Provide information on other inclusion parameters such as equal pay for equal work.
Reporting elements
DESCRIPTION
Describe the company’s approach toworkforce engagement.
PURPOSE
Worker engagement promotes organizationalefficiency, encourages a conscientious cultureand can affect external perception of thecompany. This indicator demonstrates thereporting company’s approach to engaging itsworkers to determine their satisfaction with thecompany’s employment practices, generalworking conditions, company culture andcompliance with rights of workers.
SCOPE
The reporting company should describe itssystematic approach to worker engagementand dialogue. Companies can include anexplanation of how it defines and measures‘satisfaction’ and how significant concerns orissues (e.g. confidentiality, feedback, access toinformation and survey results) raised throughdialogue are taken into account. The indicatorcan be reported at a global level, with
examples included to demonstrate workers’freedom of speech and dialogue withmanagement at national or local levels. For thepurpose of this Guidance, ‘engagement’includes a wide range of approaches includingsatisfaction surveys, employees’ representationsystems, dialogues, etc.
At a supplemental reporting level, thecompany can describe dialogues withmembers of the workforce, including unions,and may provide examples or case studymaterial to illustrate outcomes includingspecific issues or themes raised and addressed.
REPORTING BASIS
The indicator is qualitative and reportable at aglobal level. When discussing the workforce,companies should clarify the extent thatemployees, contractors and others areincluded.
IPIECA • API • IOGP
128
SE16: Workforce engagement
Sect
ion
6 S
ocia
l and
eco
nom
ic is
sues
and
indi
cato
rs
Social and economic issues and indicators Labour practices SE16: Workforce engagement
Common reporting elements
Other reporting elements
Supplemental reporting elements
C1 Describe workforce engagement such as approach,
frequency, coverage within the company,
communication of the results, action plans.
C2 Explanation of the reporting company’s approach to
handling worker concerns and issues.
S1 Describe formal dialogues with
workers.
O1 Discussion of significant issues, challenges and outcomes, arising from workforce surveys or other
engagements.
Reporting elements
DESCRIPTION
Describe approach, programmes andprocedures for providing workforce trainingand development opportunities.
PURPOSE
The development of workers is a key benefitthat the company can offer to society in areasin which it operates, and is an importantelement of the company’s ability to attract andretain talent. Training and development can bepart of a company’s programme to ensurediversity and inclusion, and to encourageparticipation at all levels. This indicator appliesto activities that the company engages in toimprove its human capital, through training anddevelopment to enhance competence, jobskills, efficiency, knowledge, mobility andexperience for meeting job requirements andcareer goals.
SCOPE
The reporting company should describe itsprogrammes and approach related to trainingand development. To support this descriptiveinformation, the company can provideevidence of its approach by quantifying the
scale and extent of training programmes usingmeasures such as:
l average hours of training per year peremployee and by category of worker;
l average training investment per year; and
l percentage of workers receiving training inthe reporting period.
At a supplemental reporting level, thecompany can provide case studies on how thecompany’s approach has been locallyimplemented, and to illustrate progress,typically at the national level. Case studyexamples may include the provision ofinternational work experience and thedevelopment of international employees,support for the continued development ofworkers, and managing career endings.
REPORTING BASIS
The indicator is primarily qualitative andreportable at a global level, and may besupported by workforce data and local casestudies. If reported, quantitative data should beconsolidated within the company’s reportingboundary using the ‘workforce approach’, andbroken down by region or country (seeAppendix A).
129
OIL AND GAS INDUSTRY GUIDANCE ON VOLUNTARY SUSTAINABILITY REPORTING
SE17: Workforce training and development
Section 6 Social and econom
ic issues and indicators
Social and economic issues and indicators Labour practices SE17: Workforce training and development
Common reporting elements
Other reporting elements
Supplemental reporting elements
C1 Describe the key elements of the company’s approach to
training and development.
C2 Provide quantitative measures to illustrate the
implementation of training and development programmes.
S1 Case study material to demonstrate
implementation and progress.
None
Reporting elements
DESCRIPTION
Describe non-retaliation policy and confidentialworkforce grievance system.
PURPOSE
Non-retaliation and grievance mechanismspromote fairness and respect for the dignityof workers and effective engagementbetween management and workforceregarding worker concerns. This indicatorapplies to the company’s activities to protectits workers’ ability to raise their grievancesabout workplace issues, and/or to identifynon-compliance and ethical incidents withoutfear of reprisal.
SCOPE
Issues covered by a grievance mechanism ornon-compliance system could include humanrights, ethics, environmental, safety and health-related concerns, labour/employment issues,and whistle blowing. The reporting companyshould describe its policies, systems and
mechanisms to address non-retaliation andgrievance, including non-retaliation againstwhistleblowers.
At a supplemental reporting level, thecompany can demonstrate the accessibilityand use of any employee workforce grievancesystems within the company, by providingquantitative data such as the approximateproportion of workers covered by the systemor the number of issues raised through thesystem. Case studies can show how thesystems are communicated and promoted, andsteps taken to build workforce confidence.
REPORTING BASIS
The indicator is primarily qualitative andreportable at a global level, and may besupported by quantitative data and local casestudies. If reported, quantitative data should beconsolidated within the company’s reportingboundary using the ‘workforce approach’ (seeAppendix A).
IPIECA • API • IOGP
130
SE18: Non-retaliation and workforce grievance system
Sect
ion
6 S
ocia
l and
eco
nom
ic is
sues
and
indi
cato
rs
Social and economic issues and indicators Labour practices SE18: Non-retaliation and workforce grievance system
Common reporting elements
Other reporting elements
Supplemental reporting elements
C1 Describe policies, approach and/or
mechanisms to address non-
retaliation and grievances.
S1 Provide quantitative data to illustrate use of systems within
the company.
S2 Case study material to describe generation of workforce
confidence in the systems, including promotion of use.
O1 Describe assurance of non-retaliation and grievance mechanisms for short-term or contract workers, if
relevant to the company’s operations.
Reporting elements

131
OIL AND GAS INDUSTRY GUIDANCE ON VOLUNTARY SUSTAINABILITY REPORTING
Appendix A
Detailed guidanceon developing areporting boundary
As noted in Section 3, detailed guidance is providedhere to encourage companies to set a clear,consistent reporting boundary. The guidance belowis based on three basic steps to determine whichparts of the company’s organization will provide data,and how this data will be consolidated for eachselected indicator:
1. Define the reporting boundary based on howthe company is organized, including a list of everyreporting unit within the company from whichdata will be requested related to its assets,people, processes or activities.
2. For each indicator, determine whether anoperational, equity share, workforce orcorporate approach will be applied to consolidatedata within the reporting boundary.
3. For each indicator, collect data at the local,national or global level based on the scope of theindicator and the applicable reporting elements.
The description of the reporting boundary process isdeliberately generic and aims to help any companyto develop its sustainability reporting. A company willnormally develop its reporting boundary to reflect itsown specific system and organizationalnomenclature, and to ensure internal clarity onreporting requirements. In addition, more detailedindustry guidance may be available and referencedfor specific indicators, particularly if the intent is touse the data for other purposes, includingcomparisons within or between companies, or toconsolidate sector data.
STEP 1: DEFINE THE REPORTING BOUNDARYFOR THE COMPANY
The starting point for setting the reporting boundaryis to identify and list all of the reporting units thatare part of the company for the purposes ofsustainability reporting. Reporting units should beselected to represent the smallest practical buildingblocks reflecting the internal management of thecompany, and to allow data to be reported at local,country, region or global levels, as appropriate. Areporting unit can be all or part of a subsidiary
company, joint venture, investment, facility, plant,office or business location, depending on whatworks best for the company given the way in whichit is organized and managed.
Within the oil and gas industry, reporting units aregenerally grouped by types of upstream anddownstream activities, such as exploration,production, drilling, refining, chemical manufacturingand marketing. A company’s reporting units manageassets that provide benefits to stakeholders andhave intrinsic financial value to the company, butalso have associated risks of environmental, social oreconomic impact. Assets may be operated and/orowned by the reporting company. A company willalready be organized into groups of activities andassets for financial accounting and this provides auseful starting point to define the list of reportingunits for sustainability reporting.
In the oil and gas industry, ensuring that thecompany’s reporting boundary is correctly describedin terms of reporting units can be complex becausetwo or more companies are often commerciallyinvolved in an asset, such as in a joint venture, andwork together under a variety of legal forms. In orderto facilitate consolidation of data (Step 2), typically,each reporting unit:
l represents a discrete piece of business that isunlikely to be split during internal restructuring orportfolio change (acquisition or divestments);
l manages assets operated by a single company(i.e. the operator of the reporting unit’s assets iseither the reporting company itself or anothercompany, so that there is not a mix of differentcompanies’ operating assets within the reportingunit);
l manages assets which have the same reportingcompany ownership (i.e. try to avoid creatingreporting units that comprise assets with differentpercentage equity share); and
l covers a narrow range of related businessactivities located within one country.
IPIECA • API • IOGP
132
Appendix A
Detailed guidance on developing areporting boundary
App
endi
x A
Det
aile
d gu
idan
ce o
n de
velo
ping
a r
epor
ting
boun
dary
The manager for the reporting unit is generallyresponsible for providing complete and accurateindicator data as appropriate and relevant to thereporting unit’s activities and assets. It is goodpractice to check that the list of reporting units issufficiently inclusive to ensure that the consolidateddata will adequately address the material issues tobe reported. This helps to ensure that thesustainability report provides a complete picture ofperformance (see Section 2, general reportingprinciple on completeness). For example, this checkcould confirm that the reporting units collectivelyrepresent the company’s most significant emissions,employee and contractor numbers, supply-chainexpenditure, or customer base.
STEP 2: DATA CONSOLIDATION WITHIN THEREPORTING BOUNDARY
The indicators in the Guidance are generallyintended to provide consolidated data which isrepresentative of the benefits and impacts of thecompany as a whole. There are a number ofapproaches to consolidating the data within thereporting boundary depending on the purpose andscope of each indicator. Four approaches aredescribed which are applicable for this Guidance.
The application of the four consolidation approachescan be illustrated by considering a company thatdecides to collect the following data from eachreporting unit in its reporting boundary:
a) Direct GHG emissions (E1) data from significantstationary and mobile sources are collected andthen consolidated based on all emissions fromassets operated by the reporting company, todemonstrate its management performance toreduce emissions—an example of theoperational approach.
b) Direct GHG emissions (E1) data from significantstationary and mobile sources are collected andthen consolidated in proportion to the reportingcompany’s percentage share of emissions from itspartly or wholly owned assets (both operatedand non-operated), because the company wishesto provide information on the significance of itsemissions in a manner more aligned with itsfinancial reporting—an example of the equityshare approach.
c) Data on numbers of injuries, illnesses andhours worked (HS3) are collected andconsolidated for each reporting unit’s employeesand contractors because the companyrecognizes its responsibility to manageoccupational safety and health risks—an exampleof the ‘workforce approach’.
d) The company provides a description of thecompany’s corporate policies and practices forLocal content (SE5) supported by case studiescollected from reporting units to illustrate how itapplies consistent policies in host countries whereit operates—an example of the corporateapproach.
Table 5 (page 137) has been provided to suggestlikely data consolidation approaches for eachindicator in the Guidance. It should be noted thatmore than one approach may be applicable for anyindicator depending on the reporting elementsselected.
When normalized quantities are calculated (seeSection 3), for example when reporting injury orillness rates, or reporting emissions per unitproduction, it is important to ensure that thereporting boundary and consolidation approach isconsistent for both the indicator data and thenormalization factor.
In some cases, particularly when applying thecorporate approach, a data consolidation step is notrequired. For example, if the indicator informationneeded was, ‘Describe policies, programmes and/orprocedures related to security and human rights’(Indicator SE10), there may be no need toconsolidate reporting unit data as the company mayhave a standardized policy across the entireorganization. However, a company may have aninternal process to check policy implementationwithin its reporting units and may choose to applythe operational approach to consolidate theverification data within the reporting boundary.
133
OIL AND GAS INDUSTRY GUIDANCE ON VOLUNTARY SUSTAINABILITY REPORTING
Appen
dix A D
etailed guidance on developing a reporting boundary
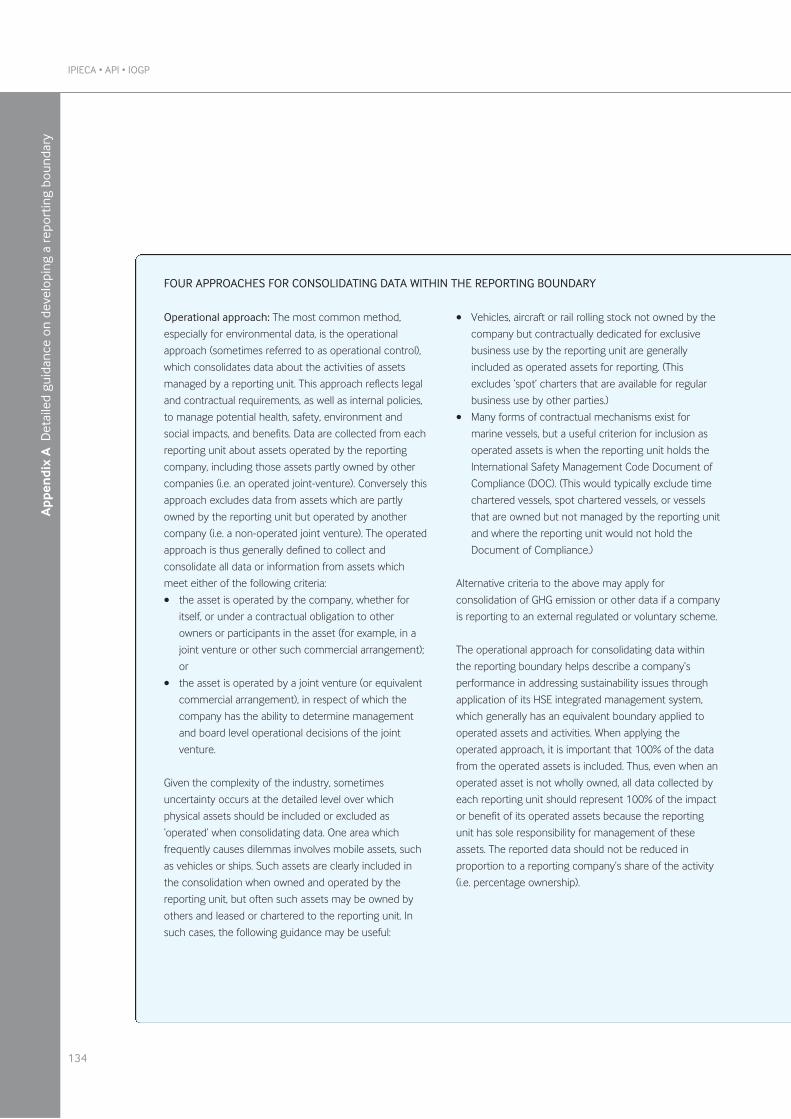
IPIECA • API • IOGP
134
App
endi
x A
Det
aile
d gu
idan
ce o
n de
velo
ping
a r
epor
ting
boun
dary
FOUR APPROACHES FOR CONSOLIDATING DATA WITHIN THE REPORTING BOUNDARY
Operational approach: The most common method,
especially for environmental data, is the operational
approach (sometimes referred to as operational control),
which consolidates data about the activities of assets
managed by a reporting unit. This approach reflects legal
and contractual requirements, as well as internal policies,
to manage potential health, safety, environment and
social impacts, and benefits. Data are collected from each
reporting unit about assets operated by the reporting
company, including those assets partly owned by other
companies (i.e. an operated joint-venture). Conversely this
approach excludes data from assets which are partly
owned by the reporting unit but operated by another
company (i.e. a non-operated joint venture). The operated
approach is thus generally defined to collect and
consolidate all data or information from assets which
meet either of the following criteria:
• the asset is operated by the company, whether for
itself, or under a contractual obligation to other
owners or participants in the asset (for example, in a
joint venture or other such commercial arrangement);
or
• the asset is operated by a joint venture (or equivalent
commercial arrangement), in respect of which the
company has the ability to determine management
and board level operational decisions of the joint
venture.
Given the complexity of the industry, sometimes
uncertainty occurs at the detailed level over which
physical assets should be included or excluded as
‘operated’ when consolidating data. One area which
frequently causes dilemmas involves mobile assets, such
as vehicles or ships. Such assets are clearly included in
the consolidation when owned and operated by the
reporting unit, but often such assets may be owned by
others and leased or chartered to the reporting unit. In
such cases, the following guidance may be useful:
• Vehicles, aircraft or rail rolling stock not owned by the
company but contractually dedicated for exclusive
business use by the reporting unit are generally
included as operated assets for reporting. (This
excludes ‘spot’ charters that are available for regular
business use by other parties.)
• Many forms of contractual mechanisms exist for
marine vessels, but a useful criterion for inclusion as
operated assets is when the reporting unit holds the
International Safety Management Code Document of
Compliance (DOC). (This would typically exclude time
chartered vessels, spot chartered vessels, or vessels
that are owned but not managed by the reporting unit
and where the reporting unit would not hold the
Document of Compliance.)
Alternative criteria to the above may apply for
consolidation of GHG emission or other data if a company
is reporting to an external regulated or voluntary scheme.
The operational approach for consolidating data within
the reporting boundary helps describe a company’s
performance in addressing sustainability issues through
application of its HSE integrated management system,
which generally has an equivalent boundary applied to
operated assets and activities. When applying the
operated approach, it is important that 100% of the data
from the operated assets is included. Thus, even when an
operated asset is not wholly owned, all data collected by
each reporting unit should represent 100% of the impact
or benefit of its operated assets because the reporting
unit has sole responsibility for management of these
assets. The reported data should not be reduced in
proportion to a reporting company’s share of the activity
(i.e. percentage ownership).
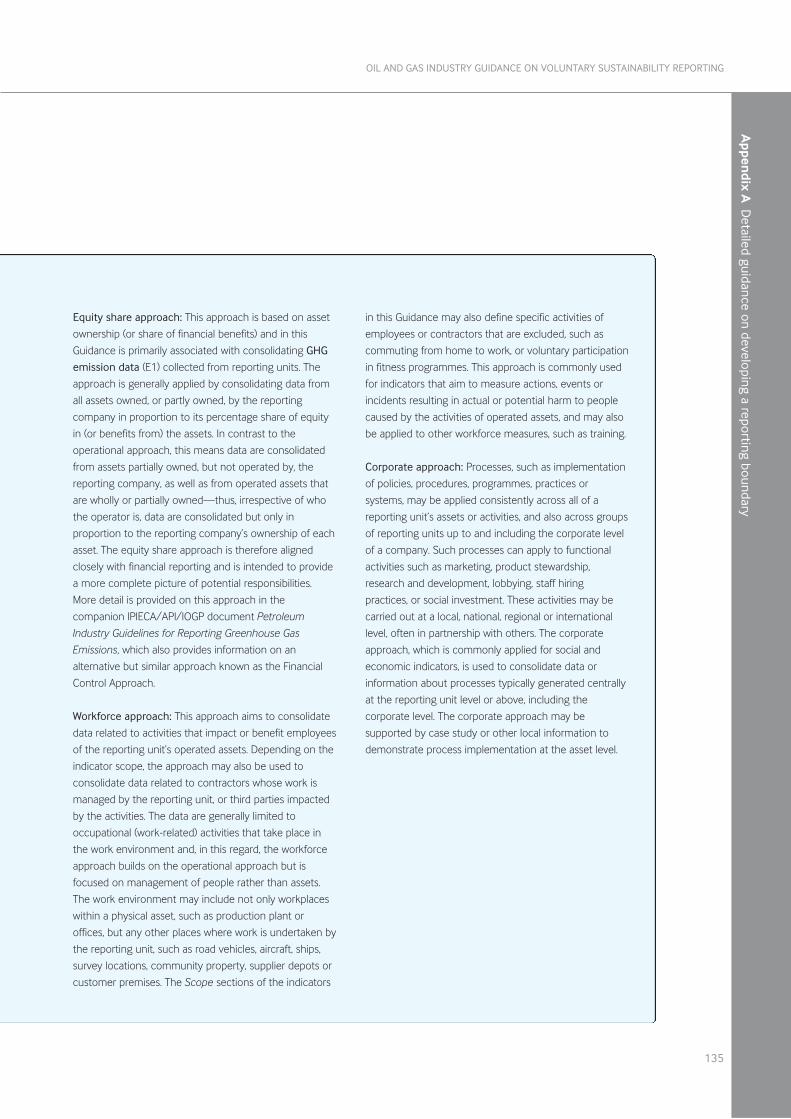
135
OIL AND GAS INDUSTRY GUIDANCE ON VOLUNTARY SUSTAINABILITY REPORTING
Appen
dix A D
etailed guidance on developing a reporting boundary
Equity share approach: This approach is based on asset
ownership (or share of financial benefits) and in this
Guidance is primarily associated with consolidating GHG
emission data (E1) collected from reporting units. The
approach is generally applied by consolidating data from
all assets owned, or partly owned, by the reporting
company in proportion to its percentage share of equity
in (or benefits from) the assets. In contrast to the
operational approach, this means data are consolidated
from assets partially owned, but not operated by, the
reporting company, as well as from operated assets that
are wholly or partially owned—thus, irrespective of who
the operator is, data are consolidated but only in
proportion to the reporting company’s ownership of each
asset. The equity share approach is therefore aligned
closely with financial reporting and is intended to provide
a more complete picture of potential responsibilities.
More detail is provided on this approach in the
companion IPIECA/API/IOGP document Petroleum
Industry Guidelines for Reporting Greenhouse Gas
Emissions, which also provides information on an
alternative but similar approach known as the Financial
Control Approach.
Workforce approach: This approach aims to consolidate
data related to activities that impact or benefit employees
of the reporting unit’s operated assets. Depending on the
indicator scope, the approach may also be used to
consolidate data related to contractors whose work is
managed by the reporting unit, or third parties impacted
by the activities. The data are generally limited to
occupational (work-related) activities that take place in
the work environment and, in this regard, the workforce
approach builds on the operational approach but is
focused on management of people rather than assets.
The work environment may include not only workplaces
within a physical asset, such as production plant or
offices, but any other places where work is undertaken by
the reporting unit, such as road vehicles, aircraft, ships,
survey locations, community property, supplier depots or
customer premises. The Scope sections of the indicators
in this Guidance may also define specific activities of
employees or contractors that are excluded, such as
commuting from home to work, or voluntary participation
in fitness programmes. This approach is commonly used
for indicators that aim to measure actions, events or
incidents resulting in actual or potential harm to people
caused by the activities of operated assets, and may also
be applied to other workforce measures, such as training.
Corporate approach: Processes, such as implementation
of policies, procedures, programmes, practices or
systems, may be applied consistently across all of a
reporting unit’s assets or activities, and also across groups
of reporting units up to and including the corporate level
of a company. Such processes can apply to functional
activities such as marketing, product stewardship,
research and development, lobbying, staff hiring
practices, or social investment. These activities may be
carried out at a local, national, regional or international
level, often in partnership with others. The corporate
approach, which is commonly applied for social and
economic indicators, is used to consolidate data or
information about processes typically generated centrally
at the reporting unit level or above, including the
corporate level. The corporate approach may be
supported by case study or other local information to
demonstrate process implementation at the asset level.
STEP 3: COLLECT DATA WITHIN THEINDICATOR SCOPE
It is important to distinguish the company’s activitiesand assets managed by its reporting units thatconstitute the company’s reporting boundary, fromthe indicator scope. The ‘scope’ of each indicator inthe Guidance helps limit the applicability of reportingelements to ensure that collected data are relevantand focused on how the company has managed anissue sustainably. The scope, supported bydefinitions of terms, provides guidance on the extentand limitations of the indicator to reflect potentialimpacts of the company’s activities. The indicatorscope aims to provide specificity, applicability,consistency, comparability and relevance for eachindicator, and it is therefore not necessary to detailthe people, part of the environment or ‘value-chain’included in a company’s overall reporting boundary(beyond its activities, assets and workforce).
Depending on the materiality of an issue and theextent of any impact, a company needs to ensurethat a complete set of relevant data is collected foreach selected indicator. Relevance andcompleteness will vary for different issues and,therefore, each Scope section contains specificguidance for the respective indicator. Variousoptions to report relevant data or information for theindicator are then provided as reporting elements.
The indicator scope includes potential impacts, orbenefits, to parties not directly managed by thecompany. For example the scope of indicators maybe inclusive of contractors or other suppliers,customers, local communities or governments.Examples follow on how indicators provide optionsto increase the scope to report on impacts orbenefits from assets and activities beyond thoserelated to a reporting company’s directly managedoperations and employees:
l The scope of the GHG emissions (E1) indicatorprovides the option for a company to report‘indirect’ emissions data related to powersupplied by generating plants owned oroperated by others, as well as reporting their own‘direct’ emissions from combustion of fossil fuelwithin the reporting company’s owned oroperated assets.
l As well as an indicator to report on how acompany might address Human rights duediligence (SE8), a separate indicator providesscope to report on Human rights and suppliers(SE9). Similarly, another indicator addresses Localprocurement and supplier development (SE7).
l The health and safety indicator on Occupationalinjury and illness incidents (HS3) applies tocontractors as well as employees, while theProduct stewardship (HS4) indicator includesscope to address how a company communicatesproduct risks to customers.
REPORTING BEYOND THE DEFINED BOUNDARY
A company may choose to extend its collection andconsolidation of data beyond its defined reportingboundary. This may apply only to certain indicators,where an issue is particularly material. This couldinclude, for example:
l Large joint ventures where the company is notthe operator but has a substantial equity share.While GHG emissions (E1) suggests that data canbe consolidated using both equity share andoperational approaches, the company may wishto further describe a specific joint venture’sperformance related to other environmental,safety or social responsibility issues, supported byany available data from the joint venture.
l Some contracted activities, such as roadtransport, construction projects or shipping, maybe partially excluded from the consolidated databecause certain assets are non-operated or theactivities are outside the indicator scope. Thecompany may wish to expand its description ofrisks or incidents, or other potentially significantimpacts, and discuss mitigation measures,supported by any available data.
In such cases, companies may wish to includerelevant data in their report, acknowledging the datasource, as appropriate. However, such data shouldbe reported separately so that base comparability ismaintained for the data consolidated within thecompany’s reporting boundary.
IPIECA • API • IOGP
136
App
endi
x A
Det
aile
d gu
idan
ce o
n de
velo
ping
a r
epor
ting
boun
dary
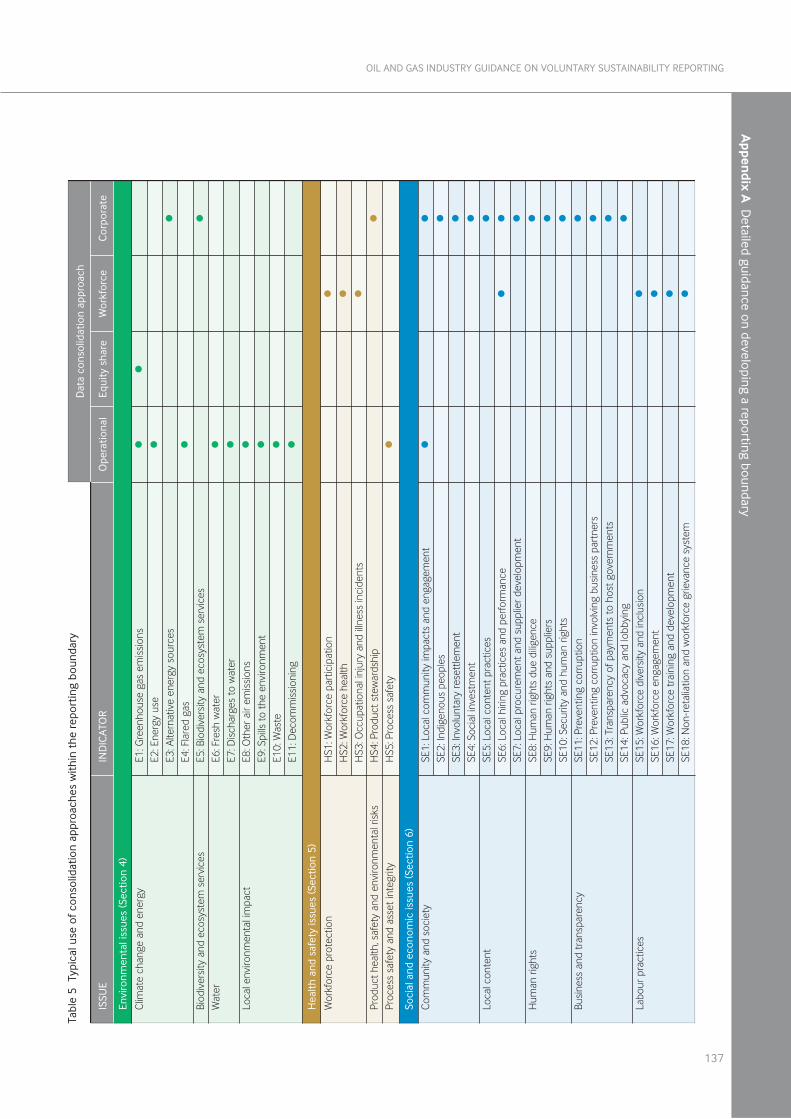
137
OIL AND GAS INDUSTRY GUIDANCE ON VOLUNTARY SUSTAINABILITY REPORTING
Appen
dix A D
etailed guidance on developing a reporting boundary
Envi
ronm
enta
l iss
ues
(Sec
tion
4)
Soci
al a
nd e
cono
mic
issu
es (S
ectio
n 6)
Hea
lth a
nd s
afet
y is
sues
(Sec
tion
5)
Clim
ate
chan
ge a
nd e
nerg
y
Biod
iver
sity
and
eco
syst
em s
ervi
ces
Wat
er
Loca
l env
ironm
enta
l im
pact
E1: G
reen
hous
e ga
s em
issi
ons
E2: E
nerg
y us
eE3
: Alte
rnat
ive
ener
gy s
ourc
esE4
: Fla
red
gas
E5: B
iodi
vers
ity a
nd e
cosy
stem
ser
vice
sE6
: Fre
sh w
ater
E7: D
isch
arge
s to
wat
erE8
: Oth
er a
ir em
issi
ons
E9: S
pills
to th
e en
viro
nmen
tE1
0: W
aste
E11:
Dec
omm
issi
onin
g
l l l l l l l l l
l
l l
l
l l l l l
l l l l l l l l l l l l l l
l
l l l
l
Wor
kfor
ce p
rote
ctio
n
Prod
uct h
ealth
, saf
ety
and
envi
ronm
enta
l ris
ksPr
oces
s sa
fety
and
ass
et in
tegr
ity
HS1
: Wor
kfor
ce p
artic
ipat
ion
HS2
: Wor
kfor
ce h
ealth
HS3
: Occ
upat
iona
l inj
ury
and
illnes
s in
cide
nts
HS4
: Pro
duct
ste
war
dshi
pH
S5: P
roce
ss s
afet
y
Com
mun
ity a
nd s
ocie
ty
Loca
l con
tent
Hum
an ri
ghts
Busi
ness
and
tran
spar
ency
Labo
ur p
ract
ices
SE1:
Loc
al c
omm
unity
impa
cts
and
enga
gem
ent
SE2:
Indi
geno
us p
eopl
esSE
3: In
volu
ntar
y re
sett
lem
ent
SE4:
Soc
ial i
nves
tmen
tSE
5: L
ocal
con
tent
pra
ctic
esSE
6: L
ocal
hiri
ng p
ract
ices
and
per
form
ance
SE7:
Loc
al p
rocu
rem
ent a
nd s
uppl
ier d
evel
opm
ent
SE8:
Hum
an ri
ghts
due
dilig
ence
SE9:
Hum
an ri
ghts
and
sup
plie
rsSE
10: S
ecur
ity a
nd h
uman
righ
tsSE
11: P
reve
ntin
g co
rrup
tion
SE12
: Pre
vent
ing
corr
uptio
n in
volv
ing
busi
ness
par
tner
sSE
13: T
rans
pare
ncy
of p
aym
ents
to h
ost g
over
nmen
tsSE
14: P
ublic
adv
ocac
y an
d lo
bbyi
ngSE
15: W
orkf
orce
div
ersi
ty a
nd in
clus
ion
SE16
: Wor
kfor
ce e
ngag
emen
tSE
17: W
orkf
orce
trai
ning
and
dev
elop
men
tSE
18: N
on-r
etal
iatio
n an
d w
orkf
orce
grie
vanc
e sy
stem
ISSU
EIN
DIC
ATO
RO
pera
tiona
lEq
uity
sha
reW
orkf
orce
Dat
a co
nsol
idat
ion
appr
oach
Cor
pora
te
Tabl
e 5
Typ
ical
use
of c
onso
lidat
ion
appr
oach
es w
ithin
the
rep
ortin
g bo
unda
ry

This page intentionally left blank

139
OIL AND GAS INDUSTRY GUIDANCE ON VOLUNTARY SUSTAINABILITY REPORTING
Appendix B
Practical guidance onimplementation of amateriality process
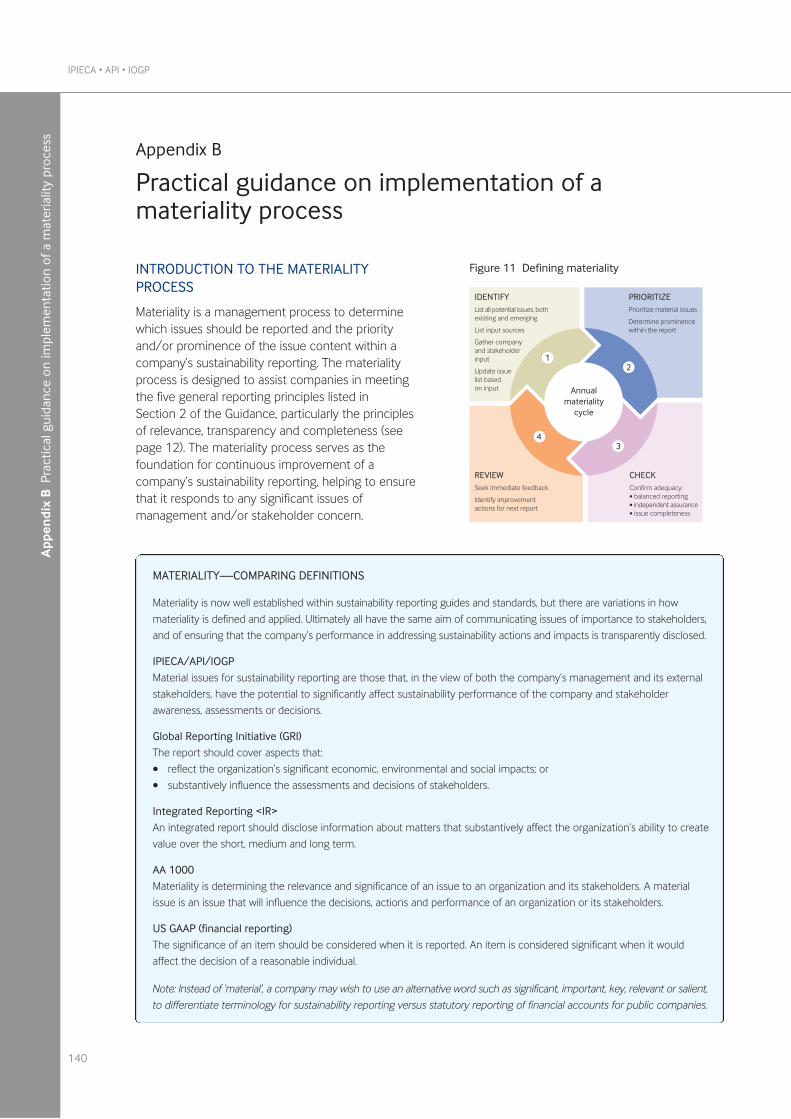
$��������������
�����
�3�42�56%� �������������� � ������!� ��������������
%� �������� ����
&������������� ������������
����� ��� ��� ���������
(�����2�7������������������ �
������������������������������
�8��9'��������(���)*���������������*���������� ����*�� ���������
��:������������������
+��������������������� ������!�������
"'
0�
INTRODUCTION TO THE MATERIALITYPROCESS
Materiality is a management process to determinewhich issues should be reported and the priorityand/or prominence of the issue content within acompany’s sustainability reporting. The materialityprocess is designed to assist companies in meetingthe five general reporting principles listed inSection 2 of the Guidance, particularly the principlesof relevance, transparency and completeness (seepage 12). The materiality process serves as thefoundation for continuous improvement of acompany’s sustainability reporting, helping to ensurethat it responds to any significant issues ofmanagement and/or stakeholder concern.
IPIECA • API • IOGP
140
Appendix B
Practical guidance on implementation of amateriality process
App
endi
x B
Pra
ctic
al g
uida
nce
on im
plem
enta
tion
of a
mat
eria
lity
proc
ess
Figure 11 Defining materiality
MATERIALITY—COMPARING DEFINITIONS
Materiality is now well established within sustainability reporting guides and standards, but there are variations in how
materiality is defined and applied. Ultimately all have the same aim of communicating issues of importance to stakeholders,
and of ensuring that the company’s performance in addressing sustainability actions and impacts is transparently disclosed.
IPIECA/API/IOGP
Material issues for sustainability reporting are those that, in the view of both the company’s management and its external
stakeholders, have the potential to significantly affect sustainability performance of the company and stakeholder
awareness, assessments or decisions.
Global Reporting Initiative (GRI)
The report should cover aspects that:
• reflect the organization’s significant economic, environmental and social impacts; or
• substantively influence the assessments and decisions of stakeholders.
Integrated Reporting <IR>
An integrated report should disclose information about matters that substantively affect the organization’s ability to create
value over the short, medium and long term.
AA 1000
Materiality is determining the relevance and significance of an issue to an organization and its stakeholders. A material
issue is an issue that will influence the decisions, actions and performance of an organization or its stakeholders.
US GAAP (financial reporting)
The significance of an item should be considered when it is reported. An item is considered significant when it would
affect the decision of a reasonable individual.
Note: Instead of ‘material’, a company may wish to use an alternative word such as significant, important, key, relevant or salient,
to differentiate terminology for sustainability reporting versus statutory reporting of financial accounts for public companies.
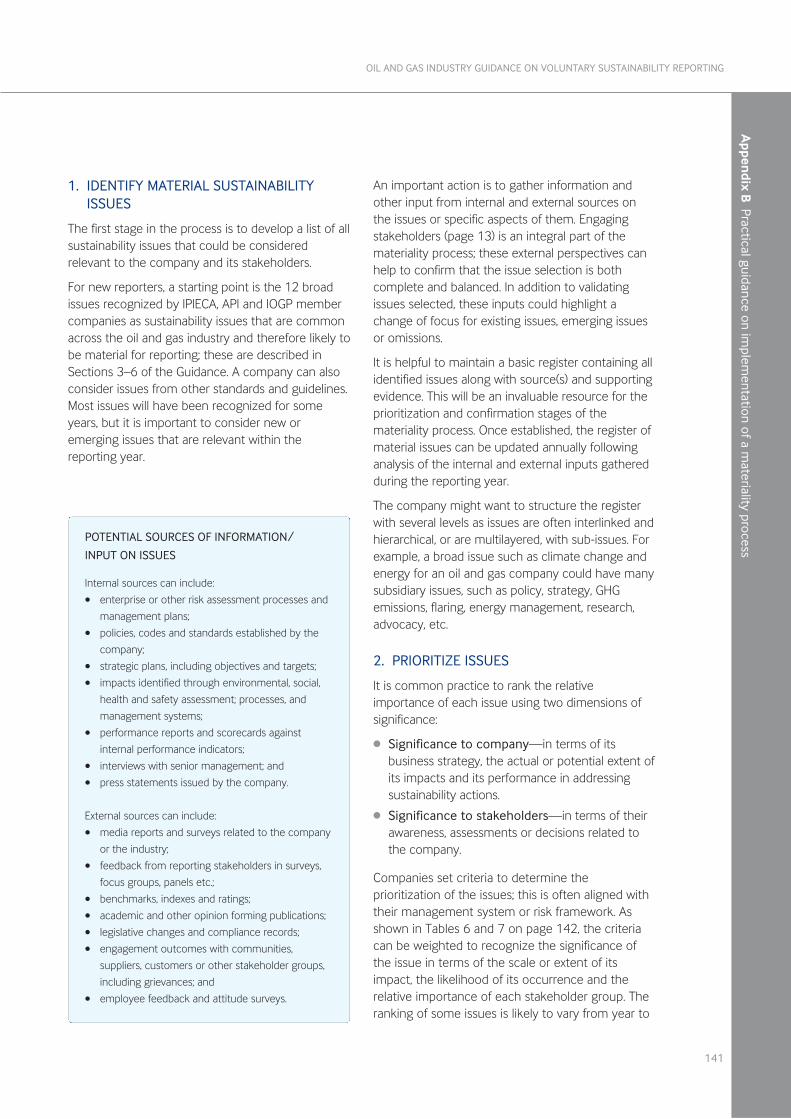
1. IDENTIFY MATERIAL SUSTAINABILITYISSUES
The first stage in the process is to develop a list of allsustainability issues that could be consideredrelevant to the company and its stakeholders.
For new reporters, a starting point is the 12 broadissues recognized by IPIECA, API and IOGP membercompanies as sustainability issues that are commonacross the oil and gas industry and therefore likely tobe material for reporting; these are described inSections 3–6 of the Guidance. A company can alsoconsider issues from other standards and guidelines.Most issues will have been recognized for someyears, but it is important to consider new oremerging issues that are relevant within thereporting year.
An important action is to gather information andother input from internal and external sources onthe issues or specific aspects of them. Engagingstakeholders (page 13) is an integral part of themateriality process; these external perspectives canhelp to confirm that the issue selection is bothcomplete and balanced. In addition to validatingissues selected, these inputs could highlight achange of focus for existing issues, emerging issuesor omissions.
It is helpful to maintain a basic register containing allidentified issues along with source(s) and supportingevidence. This will be an invaluable resource for theprioritization and confirmation stages of themateriality process. Once established, the register ofmaterial issues can be updated annually followinganalysis of the internal and external inputs gatheredduring the reporting year.
The company might want to structure the registerwith several levels as issues are often interlinked andhierarchical, or are multilayered, with sub-issues. Forexample, a broad issue such as climate change andenergy for an oil and gas company could have manysubsidiary issues, such as policy, strategy, GHGemissions, flaring, energy management, research,advocacy, etc.
2. PRIORITIZE ISSUES
It is common practice to rank the relativeimportance of each issue using two dimensions ofsignificance:
l Significance to company—in terms of itsbusiness strategy, the actual or potential extent ofits impacts and its performance in addressingsustainability actions.
l Significance to stakeholders—in terms of theirawareness, assessments or decisions related tothe company.
Companies set criteria to determine theprioritization of the issues; this is often aligned withtheir management system or risk framework. Asshown in Tables 6 and 7 on page 142, the criteriacan be weighted to recognize the significance ofthe issue in terms of the scale or extent of itsimpact, the likelihood of its occurrence and therelative importance of each stakeholder group. Theranking of some issues is likely to vary from year to
141
OIL AND GAS INDUSTRY GUIDANCE ON VOLUNTARY SUSTAINABILITY REPORTING
Appen
dix B Practical guidance on im
plementation of a m
ateriality process
POTENTIAL SOURCES OF INFORMATION/
INPUT ON ISSUES
Internal sources can include:
• enterprise or other risk assessment processes and
management plans;
• policies, codes and standards established by the
company;
• strategic plans, including objectives and targets;
• impacts identified through environmental, social,
health and safety assessment; processes, and
management systems;
• performance reports and scorecards against
internal performance indicators;
• interviews with senior management; and
• press statements issued by the company.
External sources can include:
• media reports and surveys related to the company
or the industry;
• feedback from reporting stakeholders in surveys,
focus groups, panels etc.;
• benchmarks, indexes and ratings;
• academic and other opinion forming publications;
• legislative changes and compliance records;
• engagement outcomes with communities,
suppliers, customers or other stakeholder groups,
including grievances; and
• employee feedback and attitude surveys.
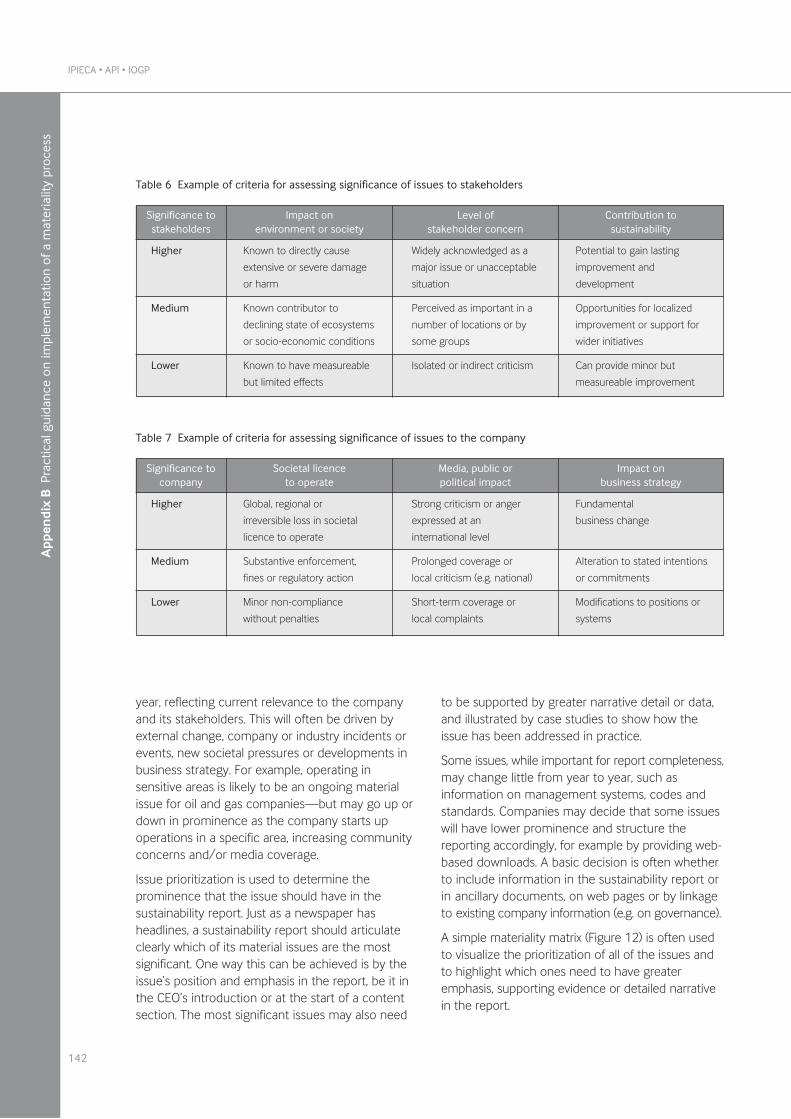
year, reflecting current relevance to the companyand its stakeholders. This will often be driven byexternal change, company or industry incidents orevents, new societal pressures or developments inbusiness strategy. For example, operating insensitive areas is likely to be an ongoing materialissue for oil and gas companies—but may go up ordown in prominence as the company starts upoperations in a specific area, increasing communityconcerns and/or media coverage.
Issue prioritization is used to determine theprominence that the issue should have in thesustainability report. Just as a newspaper hasheadlines, a sustainability report should articulateclearly which of its material issues are the mostsignificant. One way this can be achieved is by theissue’s position and emphasis in the report, be it inthe CEO’s introduction or at the start of a contentsection. The most significant issues may also need
to be supported by greater narrative detail or data,and illustrated by case studies to show how theissue has been addressed in practice.
Some issues, while important for report completeness,may change little from year to year, such asinformation on management systems, codes andstandards. Companies may decide that some issueswill have lower prominence and structure thereporting accordingly, for example by providing web-based downloads. A basic decision is often whetherto include information in the sustainability report orin ancillary documents, on web pages or by linkageto existing company information (e.g. on governance).
A simple materiality matrix (Figure 12) is often usedto visualize the prioritization of all of the issues andto highlight which ones need to have greateremphasis, supporting evidence or detailed narrativein the report.
IPIECA • API • IOGP
142
App
endi
x B
Pra
ctic
al g
uida
nce
on im
plem
enta
tion
of a
mat
eria
lity
proc
ess
Table 6 Example of criteria for assessing significance of issues to stakeholders
Significance tostakeholders
Higher
Medium
Lower
Impact on environment or society
Level of stakeholder concern
Contribution to sustainability
Known to directly cause
extensive or severe damage
or harm
Known contributor to
declining state of ecosystems
or socio-economic conditions
Known to have measureable
but limited effects
Widely acknowledged as a
major issue or unacceptable
situation
Perceived as important in a
number of locations or by
some groups
Isolated or indirect criticism
Potential to gain lasting
improvement and
development
Opportunities for localized
improvement or support for
wider initiatives
Can provide minor but
measureable improvement
Table 7 Example of criteria for assessing significance of issues to the company
Significance tocompany
Higher
Medium
Lower
Societal licence to operate
Media, public or political impact
Impact on business strategy
Global, regional or
irreversible loss in societal
licence to operate
Substantive enforcement,
fines or regulatory action
Minor non-compliance
without penalties
Strong criticism or anger
expressed at an
international level
Prolonged coverage or
local criticism (e.g. national)
Short-term coverage or
local complaints
Fundamental
business change
Alteration to stated intentions
or commitments
Modifications to positions or
systems
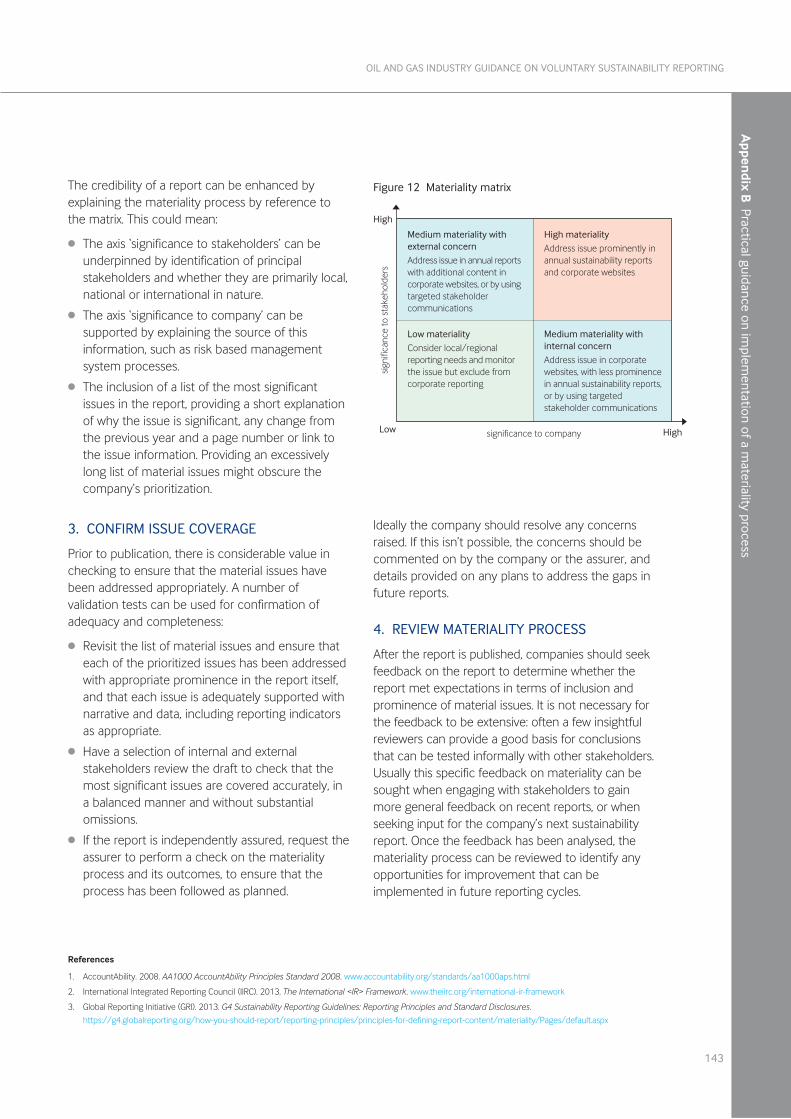
The credibility of a report can be enhanced byexplaining the materiality process by reference tothe matrix. This could mean:
l The axis ‘significance to stakeholders’ can beunderpinned by identification of principalstakeholders and whether they are primarily local,national or international in nature.
l The axis ‘significance to company’ can besupported by explaining the source of thisinformation, such as risk based managementsystem processes.
l The inclusion of a list of the most significantissues in the report, providing a short explanationof why the issue is significant, any change fromthe previous year and a page number or link tothe issue information. Providing an excessivelylong list of material issues might obscure thecompany’s prioritization.
3. CONFIRM ISSUE COVERAGE
Prior to publication, there is considerable value inchecking to ensure that the material issues havebeen addressed appropriately. A number ofvalidation tests can be used for confirmation ofadequacy and completeness:
l Revisit the list of material issues and ensure thateach of the prioritized issues has been addressedwith appropriate prominence in the report itself,and that each issue is adequately supported withnarrative and data, including reporting indicatorsas appropriate.
l Have a selection of internal and externalstakeholders review the draft to check that themost significant issues are covered accurately, ina balanced manner and without substantialomissions.
l If the report is independently assured, request theassurer to perform a check on the materialityprocess and its outcomes, to ensure that theprocess has been followed as planned.
Ideally the company should resolve any concernsraised. If this isn’t possible, the concerns should becommented on by the company or the assurer, anddetails provided on any plans to address the gaps infuture reports.
4. REVIEW MATERIALITY PROCESS
After the report is published, companies should seekfeedback on the report to determine whether thereport met expectations in terms of inclusion andprominence of material issues. It is not necessary forthe feedback to be extensive: often a few insightfulreviewers can provide a good basis for conclusionsthat can be tested informally with other stakeholders.Usually this specific feedback on materiality can besought when engaging with stakeholders to gainmore general feedback on recent reports, or whenseeking input for the company’s next sustainabilityreport. Once the feedback has been analysed, themateriality process can be reviewed to identify anyopportunities for improvement that can beimplemented in future reporting cycles.
143
OIL AND GAS INDUSTRY GUIDANCE ON VOLUNTARY SUSTAINABILITY REPORTING
Appen
dix B Practical guidance on im
plementation of a m
ateriality process
8���
&������������������ ����.��������������� �� ��������������� ��������������������������������� �� ��������� ��������� �������������������
�� ������������'�� ��������2����������������� ��������������� ������!�������������������������
&������������������ ������������������� �� �������������� �� �������� ����������������� � ��������������� �������� ��������� ��������������������
8������������������� �� �������������������� � ��������������� ������������� ��
��
8���
�������������������
������������� �������
Figure 12 Materiality matrix
References
1. AccountAbility. 2008. AA1000 AccountAbility Principles Standard 2008. www.accountability.org/standards/aa1000aps.html
2. International Integrated Reporting Council (IIRC). 2013. The International <IR> Framework. www.theiirc.org/international-ir-framework
3. Global Reporting Initiative (GRI). 2013. G4 Sustainability Reporting Guidelines: Reporting Principles and Standard Disclosures.
https://g4.globalreporting.org/how-you-should-report/reporting-principles/principles-for-defining-report-content/materiality/Pages/default.aspx

This page intentionally left blank
145
OIL AND GAS INDUSTRY GUIDANCE ON VOLUNTARY SUSTAINABILITY REPORTING
Appendix C
Summary of keychanges since 2010and mapping againstthe GRI G4 Guidelines
After a major restructuring in 2010, the 2015 updateof the Guidance to the 3rd edition aims to preservecontinuity with the previous edition and to facilitateimplementation of improvements by minimizingchanges to the overall structure and core content.The number of sustainability issues relevant to theoil and gas industry has been increased from 11 to12 to provide more emphasis on water as anenvironmental issue of growing global and localimportance. One new indicator on decommissioninghas been added, bringing the total number to 34.
In this 2015 edition, the most significant change isto encourage stronger reporting practices thatdisclose and explain a company’s strategic position,approach and intent to address the most importantissues and related impacts across its value chain.The key improvements supporting this changeinclude:
l new guidance on strategic reporting for each ofthe 12 sustainability issues intended to helpcompanies express information that falls outsideof key performance indicators and numericalresponses, for example, in relation to climatechange—mitigation, adaptation and strategy;
l expanded guidance on materiality that aims tohelp companies identify and prioritize impactsand issues, including a new appendix to providepractical guidance on the implementation of amateriality process; and
l new guidance on reporting across the value chainand life-cycle considerations to help ensure allrelevant business activities are addressed whenreporting on material sustainability issues.
Changes to indicators within the 2015 update include:
l a new issue area on water, with comprehensiveupdates to two water indicators covering freshwater withdrawn or consumed by oil and gasoperations together with discharges to water;
l alignment of the Social and Economic sectionwith the United Nations Guiding Principles onBusiness and Human Rights unanimouslyendorsed by the UN in 2011; and
l upgrade of a range of reporting elements acrossthe three categories within each indicator(common reporting elements that are well-established; supplemental reporting elementsthat enable greater depth of reporting; and otherreporting elements that are less-established butemerging) to enable more consistent reporting andreflect the maturing of issues across the industry:
• Indirect greenhouse gas emissions related topurchased energy has been added tocommon (E1).
• Emissions intensity has been added tocommon (E1).
• Energy efficiency and consumption initiativeshas been added to supplemental (E2).
• Operations in fresh water scarce areas hasbeen added to supplemental (E6).
• Freshwater withdrawals related to once-through cooling water has been added tosupplemental (E6).
• Improvement of other elements related toreporting on freshwater impacts (E6).
• Improvement of common element related tocommunity engagement (SE1).
• Community engagement has been added tothe common element of Involuntaryresettlement (SE3).
• Human rights common, supplemental andother elements have been improved toencourage focus on due diligence separatelyfrom strategies and programmes (SE8).
• Common and supplemental elements ontransparency of payments to hostgovernments have been fully updated to reflectnew and emerging legislation (SE13).
• Quantitative measures on workforce trainingand development have been added tocommon (SE17).
IPIECA • API • IOGP
146
Appendix C
Summary of key changes since 2010 andmapping against the GRI G4 Guidelines
App
endi
x C
Sum
mar
y of
key
cha
nges
sin
ce 2
010
and
map
ping
aga
inst
the
GRI
G4
Gui
delin
es
l New indicators and reporting elements in thisupdate include:
• a new indicator covering planning andexecution of decommissioning activities (E11);
• indirect emissions related to use of soldproducts is now a separate supplementalelement (E1);
• geographic locations/regions for flaring hasbeen added to other (E4);
• freshwater consumption intensity has beenadded to supplemental (E6);
• water discharge management and communityand stakeholder engagement have been addedto other (E7);
• technologies that address air quality have beenadded to other (E8);
• spills prevention strategies and processes havebeen added to common (E9);
• element on proactive wellness initiatives toencourage healthier lifestyles has been addedto other (HS2);
• measures to preserve archaeological, historicand cultural sites for communities has beenadded to other (SE1); and
• promotion of the UN Guiding Principles in thesupply chain has been added to supplemental(SE9).
l Revision of language with more consistent use ofthe words ‘should’, ‘can’ and ‘may’, as well asterms such as ‘potentially’, ‘material’, ‘significant’and ‘important’, with ‘significance’ added as aglossary term to differentiate it from ‘materiality’.
RELATIONSHIP TO THE GRI GUIDELINES
In line with the previous editions of the Guidance,the Reporting Working Group and related task forcesacross IPIECA, API and IOGP have been directed to,and have drawn on, the work of GRI during theupdate process. It is recognized that GRI’s cross-industry guidelines represent the views of a widerange of stakeholders, and that their documents areused by many businesses and other organizations,including oil and gas companies. IPIECA and GRIhave continued to maintain an open andcollaborative dialogue on reporting practices,including development of revised or new guides,while a number of our association members havebeen directly engaged as stakeholders within GRIprocesses. While the IPIECA/API/IOGP Guidance isdifferentiated from the GRI series of documents asbeing a stand-alone, sector-specific reference tool,there is alignment of intent in many areas. Since the2nd edition of the Guidance, the new GRI ‘G4Guidelines’ were issued, with incorporation of thepreviously issued GRI Oil and Gas SectorSupplement. The opportunity has therefore beentaken to update the previous mapping on the extentof alignment between the IPIECA indicators and thenew GRI G4 indicators (including those listed in theOil and Gas Sector Supplement). It is also noted thatthere is improved alignment with GRI’s StandardDisclosures on Management Approach with theenhanced materiality process and reportingrecommendations for each of the 12 issues withinthis update to the Guidance.
Table 8 on pages 148–155 cross-references the2015 indicators in this third edition of the Guidanceagainst the current GRI G4 indicators.
147
OIL AND GAS INDUSTRY GUIDANCE ON VOLUNTARY SUSTAINABILITY REPORTING
Appen
dix C Sum
mary of key changes since 2010 and m
apping against the GRI G
4 Guidelines
IPIECA • API • IOGP
148
App
endi
x C
Sum
mar
y of
key
cha
nges
sin
ce 2
010
and
map
ping
aga
inst
the
GRI
G4
Gui
delin
es
2�!�
��-�
�&��
���
�����
'#"*
�A��
���
����
��
�����
�A��
�A0�
A���
���
�
�(��
�$��
����
���
�'#"
*A�
��A0�
���
����
�$�
���
��
�/��
���
����
4��
���
��3
���
���
�
/7 /8 /9
&���������
������(���������� �� .
&���������
������(���������� �� .
������
������(���������� �� ���������� ����������������
+�+/'�.�+��������� ��� ������������ ����� ������������
������� �� �������� ������ �����
���������������
��������
8:7;�������.
+�+/'�������� �&3&����� ��������� ��������������������������
��
�� ����������� � �������������������������.�<��� ��
��� � �����������&4+����+�+/'�������������������� ������
� �������������=� ����� ������������ ���� ��
����� =
�������������������� �7��8����9.
>��� ������������.
?���� ����������������+�+/'�������������� ���������������
������������������� ����������.
&���������
������(���������� �� .
+�+/'�������� ���������� ���� ������������������
������� ��������������� �� �������������� ����������
����������� .�<��+�+/'�� �����(��� ��������������������
������������� ����������&4+� ���� �������������������� ���
��������������������� ������������������������� �� ���
������������"��������������������������� �������#
�������������.�&4+�� �� � ����� ����������������
����
����������� ������.
+�+/'���� ������
���!��������������� �������� ���� �&4+�� �
� ���������������� ����������(������ � ��� ���������
�������� .
+�+/'���� ������
���!��������������� �������� ���� �&4+�� �
� ���������������� ����������(������ � ��� ���������
�������� .
+�+/'���� ���������!��������������� �������� ���� �&4+���
�����(�����������������.
&���������
������(���������� �� .
�4:�
��4
&�4
2$��
�43
��$2
��1
&����� �� ��� ���
/������
�������������� ����
&@,/?7;
&@,/?7A
&@,/?7B
&@,/?7C
&@,/?7D
&@,/?9:
&@,/?9
&@,/?;
&@,/?A
&@,/?B
&@,/?B
6&8
6&9
<���������������� �� ��
� ��� �" ����7#
/������������������� �� ��
� ��� �" ����8#
6������������������ �� ��
� ��� �" ����9#
&3&��
� ��� ����� ��������
+������� ��������������� �� ��
� ��� ������������
�����
������������������
��������� ������� ��������������� ���
��������� ��������� �� �������������������$ �������� �
������ ����������
�� ���������������
/�������� ����������������������������
/��������� ��������
/����� ������������ ��������������������������
�� �
����������� ������������������������� ��
��������
�������� ������
+������� ���������������,����������������������� �
������� ���� ���� ������������� ����������(������ �
�� ��������� ���������
+������� ���������������,����������������������� �
������� ���� ���� ������������� ����������(������ �
�� ��������� ���������
<������������� ����������������
<��������������������������������� ����
���
��
�
�11C
�D���
�����
����
���
���
���
���
A0E3
&$
3�
���
����
��&
���
���
��$��
����
��/�
�D*
���
��
�$
����
���
���
����
$��
���>�
4:�
��4
&�4
2@*
5�
���/�
���
�!�
�����
�$
����
�>(��
3C
�2��
�1(�
41�
=���
26@
=���
�A��
���
��(��
�$���
���
����
����
����
���
����
/���
���
��
����
���
�����
����
���
����
����
�����
����
���
����
8
���
3���
3���
E����
E����
3���
%��
3���
3���
3���
E����
E����
E����
3���
149
OIL AND GAS INDUSTRY GUIDANCE ON VOLUNTARY SUSTAINABILITY REPORTING
Appen
dix C Sum
mary of key changes since 2010 and m
apping against the GRI G
4 Guidelines
���
����
��
����
���
����
����
�11C
�D���
����
A0E3
&$
3�
���
����
��&
���
���
��$��
����
��/�
�D*
���
���$
���
� ��/
/���
���
���
���
�$�
����>
�4:�
��4
&�4
2@�
����
���
����
���
�����
���
����
� ���
���
������
���
�
���
����
����
�8
���
�11C
�D��=
����
���
�����
���
���
���
���
����
A0
E3&
$3
���
���
���
�&�
����
���$
����
����
/��D
*��
��
���
���
����
��
����
���
=���
����
���
�$�
�����
��
����
�$�
����>
�4:�
��4
&�4
2@
=���
�A��
���
��(��
�$���
���
����
����
����
���
����
/����
���
��
�����
���
����
8��
�
/;&4+��� ������� ��� ������ ����������������� �+�+/'������
�����������
����������������� ����!��� .
&4+��� ��������� ����������� ��������� ��
�� �+�+/'������
������������������ ������������� .
&4+�� ���� ����(������ �� ������������� ���������
+�+/'��� ���������������������� ����� � �����!�
�� .
+�+/'������� � ���������� ������������������������� ���������
4��%� �.
?�����!�������+�+/'�������������������������������/;����/D.
&4+��(��� ������������������������� �+�+/'������� ���
��������������������� ����!�
�� .
0������ ��������� � ��� ����
&@,/?77
&@,/?78
&@,/?79
&@,/?7@
&@,/?8A
6&@
%���������� ����������������� ����������������-���
������������� ����� ���������������� ����������� ��
���������
� ������������ ��������������� ����������� ��������� ����
���� ����������� ���������������� ����� ��������
������� ����������� ������������
3���� ������������� ����
?��
������+ '?�4��%� �� ��� �������������� ��������� �
��� ����������� ����� ����������������� �����������
!����������� �
+�������� ������������ ��� ������������ ��������������
���� �������������� � ��������������������������������
����������$ ��� ���� ��������������,���
?��
���������������� ������������������ �� ���������
������� ������ ��� ���� �������������
E����
E����
E����
%��
E����
E����
/A /B
&���������
������(���������� �� .
>��� ������������.
+�+/'�� ��� � ���������������!�
�� ����������(�������
�������������� ������� �����������+�+/'��/A� ����"
1�����A#.
>��� ������������������� ��������������� �����
����� �" �6&;����
���#.
?�����!�������+�+/'�������������������������������/;����/D.
���������������������������
����)�+�+/'���(� � �(���������
�����������"������������� #��������������������� �� �
������� ����������� ��������� ���������������&4+� �
�����������������
������ �� �������� �����������.
1� �����
�� ���� �������
&@,/?C
&@,/?D
&@,/?7:
&@,/?88
&@,/?8A
6&;
<�������������������� ����
F��� ���� � ������������������������������������
��������������������
�������������������� �
<���������� ��������(���������� �������
+�������� ������������ ��� ������������ ��������������
���� �������������� � ��������������������������������
����������$ ��� ���� ��������������,���
>���������� �� ����������������������������
3���
3���
3���
3���
E����
E����
/@
&4+����������� �!���������������������������� .�+�+/'����������
� ����������������(� � � ��������.
������
������(���������� �� ��+�+/'���(� � ����������
������.
1�����
6&7@
6&A
>�������������� ����������������� �������� � ���������
������
>�������������������������������
3���
3���
IPIECA • API • IOGP
150
App
endi
x C
Sum
mar
y of
key
cha
nges
sin
ce 2
010
and
map
ping
aga
inst
the
GRI
G4
Gui
delin
es
2�!�
��-�
>��
����
�@��&
����
����
��'#
"*�A
����
���
����
���
���A
���A
0�A�
����
��
3�
���
����
��&
���
���
��$��
����
��/�
�D*
&��
����
��$
���
� ���
��
��
$��
�� ��
//���
��
���
��
��$
����
���
�2��
��
���$
���
��>�4
:���
4&
�42@
�(��
�$��
����
���
�'#"
*A�
��A0�
���
����
�$�
���
��
�/��
���
����
4��
���
��3
���
���
�
�4:�
��4
&�4
2$��
�43
��$2
��1
�����
����
��
���
��
�
�11C
�D���
����
���
����
���
����
����
A0E3
&$
:���
���
������
��
� �!�
���(�
��$�
���
���
�/���
��
�&��
����
�8
���
/C /D /7:
/77
������
������(���������� �� ���������� ������������.
&���������
������(���������� �� .
������
������(���������� �� ��+�+/'���(� ���
��������
������.
?���� ����������������+�+/'�������������� ���������������
������������������� ����������.
&4+����� ��������������������������������
���� ����+�/'�
���� ������������2�� ��������� ������� �� �.
&���������
������(���������� �� .
��������������������+�+/'��� � �� ����������������(������
���������0 ��'������������� ����&4+.
+�+/'��!�����
������������������ ������
������(��������
������������� ���������������������������������������������
�����,������ �.
�������������������+�+/'������(�������������(��������������
��������� �� ����������������� ��� .�<��&4+���������� ���
����������������������� �� ����� �� ������� ��������� ���.
6��������
� ���
����� ��������������
��
F �
������ ������
&@,/?8:
&@,/?87
&@,/?8@
&@,/?9:
&@,/?8
&@,/?89
&@,/?8;
6&B
6&77
/�� ��� ��������,�������� �� ��� ���������
?6!���6!���������� ��������������
� ���
<�������
�����������
���� ���������� ����
������������������
��������� ������� ��������������� ���
��������� ��������� �� �������������������$ �������� �
������ ����������
�� ���������������
�����������
���� �� ����������������������
����
<�������������� �������������� �� �������
F����������� ����������������!���������������� �����
������ ������������ �������0 ��'������������!�+��++��+++�
���>+++������������������ ������� �� ������������������
�������������������� ��"�������������������� #���� ����� ����
������������ �� �
?��
������ �� ���������������
�� �������� �� ����
������������ �������������
�� ����
3���
3���
3���
%��
%��
3���
E����
E����
E����
8�$
�28
�$4
3�1
$5�2
6�(�
�5�
�&$4
����4
3��
$2�
�1
3�7
3�8
3�9
>��� �����������.
&4+����� ����� ��������� �+�+/'���������� ���������
�������������� �������������&@,�E��6�����������������
����� ���.
&@,%�B��������� ����� ���� ��� ��+�+/'��������"�����
������&@,�E��6������������������ ����� ���#������ �
����� ������ ���� ��� �������������������������.
>��� �����������.
F�������������������
F������������
6������������-����������� �����
&@,%�;
&@,%�C
&@,%�B
&@,%�A
��������������������������� �������������-����
����
��,�
������������� ����������� ��������
�������������� ����������������������� �����������
3������� ��������� ��������������������� ���������
�����
F���� ����������������������������� ������� �������������
���������
<��������-��������� ������-������������������ ���� ���� �
���� ��� �
�������������
����������,����������� ����
����������������
3���
3���
3���
3���
3�
���
����
��&
���
���
��$��
����
��/�
�D*
���
����
���
�����
�����
���
/���
�$�
����>
�$=�
C��
(�$�
2���
1$4
3�3
���4
2��
��9
@�1
1C�D
�����
�/��
����
����
����
A0
E3&
$1�
���
����
����
���
����
���
�� �
���
���
���
A11�
����
��
��
��
�/��
����
�����
����
���
���
����
���
�����
���
��>�
?�?�
�����
�@
���
���
����
?8
���
151
OIL AND GAS INDUSTRY GUIDANCE ON VOLUNTARY SUSTAINABILITY REPORTING
Appen
dix C Sum
mary of key changes since 2010 and m
apping against the GRI G
4 Guidelines
���
����
��
����
���
����
����
3�@
������������
��.
4 ����������������
��������������������&4+��(� ��(��������
����.
4 ����������
�����������.
4 ����������
�����������.
4 ����������
�����������.
4 ����������������
��������������������&4+��(� ��(��������
����.
4 ����������
�����������.
�������� ���� ���
&@,�47
&@,�48
&@,�49
&@,�4@
&@,�4A
&@,�4B
&@,/?8B
���������� ����������������� ���� ���� ������� ����������
�������� ��������� ��� �������������
��
<�������
������������� �������,���
������������������� ���
������������ ������������������� ��������� �����������
��� ���� �����������������
<����������������� �����������������(��������������� �
������������� ����������������� ���� ���� � ��-������ ���
������������(������
<�������
������������� �������,���
������������������� ���
������������ ���������������������� ������������������
�������������������������
���������������� ������������
<�������
������������� �������,���
������������������� ���
������������ ������������������������������� �����������
����� ������������������� ��� �� ��������������������
/!����������������������������������
������
��� �����������
��� ����
3���
E����
E����
E����
E����
E����
E����
3�
���
����
��&
���
���
��$��
����
��/�
�D*
���
����
����
�����
��
�/��
��$
����
�(��
����
���
���
����
��!�
����
�$�
�����
��&
����
����
���
��
����
��
�$�
���
>(��
3C
�2��
�1(�
41�
=���
26@
�11C
�D(�
����
�����
��� �
�/��
���
��
����
��
�����
��
A0E3
&$
����
���
���
����
��
/���
���
���
���
����
��
���/��
����
���
8��
�
3�;
0����&4+����+�+/'���������������+2+6&�� ����� .
���� � ���
6&79
?��
���������� � ������� ������� �� ��������
3���
3�
���
����
��&
���
���
��$��
����
��/�
�D*
$�
����
�����
���
��(�
���
��
/���
�$�
����>
1���
�26@
�11C
�D��(
����
�
�/��
���
���
����
���
����
A0E3
&$
1���
���
����
��
8��
�
1���
$��$
43
����
4�
&��
��43
��$2
��1
3�
���
����
��&
���
���
��$��
����
��/�
�D*
����
�����
��
����
�$�
�����
���
����
���
����
���
���
��
$��
���>1
���
�26@
*�
����
��
�����
��$
���
��>8
���
����
��@
*��
���
����
��/�
���
���$
���
����
����
����
����
��
����
����
�$
����
�>���
4�
&��
@
�11C
�D���
���
����
���
���
����
A0E3
&$
1���
���
����
��
8��
�
�/7
+���������������� ����� �����������&4+��� ������
���(��������
������.
<��&4+�������������� �����������������������������������
����� ����������������������������������&4+����+�+/'�
�������� .�+��� ������ ���������������������+/'��&���������
���������� ���������������� �����/7������ �������G�����
������� $.
&���������
������������&4+�������� ���������(��������
��.
%�������
������������ ����������
&@,�67
&@,�68
6&7:
����������������� �����������
������������
������
�������������� ��� ���������������������
6������ ������ �������������������������������������
�����������
������
?��
������� ������������ ������������ ��� ����������
��������� ������������ �����
3���
%��
3���
IPIECA • API • IOGP
152
App
endi
x C
Sum
mar
y of
key
cha
nges
sin
ce 2
010
and
map
ping
aga
inst
the
GRI
G4
Gui
delin
es
2�!�
��-�
>��
����
�@��&
����
����
��'#
"*�A
����
���
����
���
���A
���A
0�A�
����
��
�(��
�$��
����
���
�'#"
*A�
��A0�
���
����
�$�
���
��
�/��
���
����
4��
���
��3
���
���
�
1���
$��$
43
����
4�
&��
��43
��$2
��1
�����
����
��
���
��
�
�/;
�/A
&���������
��������&4+����+�+/'�.
����������������������.
&4+�������������� ���������������������� ������
��������������� �+�+/'������������ ��������� ����
�����
��������������������� ��������� ������������
&@,�E��+�������������������� �� ���.
%�����������������
%�����������������
&@,/'D
&@,/'A
&@,/'C
�������������� ��������������� ������ ��� �����������������
����������
�������������� ���������
������������������������
������
�� ����������������� �����������
�������������������������������� ���������������!������
�����
3���
3���
E����
3�
���
����
��&
���
���
��$��
����
��/�
�D*
&��
�����
���
���
���
���
����
�����
���
��$
���
� ��
����
����
���
�����
����
�$
����
���
�(��
����
��
�����
����
�$
����
�>���
4�
&��
@
�11C
�D���
����
���
���
A0E3
&$
���
����
����
�A��
��(��
�$��
����
����
�����
����
���
����
���
���
���
����
� ��
�����
���
��
���!
��/�
���
����
����
���
��$�/
��
����
����
��
���
����
�����
�(��
�$��
����
���
���
�/���
��
���
���
�/���
���
�E��
���
�����
����
���
����
���
��
&��
���
3�
���
����
��&
���
���
��$��
����
��/�
�D*
����
�����
��
����
�$�
�����
���
����
���
����
���
���
��
$��
���>1
���
�26@
*�
����
��
�����
��$
���
��>8
���
����
��@
*��
���
����
��/�
���
���$
���
����
����
����
����
��
����
����
�$
����
�>���
4�
&��
@
�11C
�D���
���
����
���
���
����
�����
����
��
A0E3
&$
1���
���
����
��
8��
�
�/8
�/9
�/@
+������� �����
+����������� ����
��
��������� ����
&@,34C
6&D
6&7:
6&78
&@,/'7
&@,/'B
&@,/'C
<�������
������������� ������������ ���������������� ���
�������� �������������� ����
6������ ������������� ����
������ ����� �����������
���������� �������� �����������
��� ����� �����
���
?��
������� ������������ ������������ ��� ����������
��������� ������������ �����
6������ ����������������� ����
���������������������
������ ���� �� �������������������������������� ���
����������������
����������������������������� ������������������
���� ������������ � ���
��������
�� �������������
�����������
���������� ���� ������������� ����
����� ����������������� ����������
��
������
������������������� ����������� ���� ���
���� � �������
�������������������������������� ���������������!������
�����
E����
3���
3���
3���
E����
E����
E����
+�+/'���/8����� �G� � ��� �$����G����� ����$�������� �����
����������������2������G������� ������������ $������
� ��������������������
����.�<��&@,�E
��� � �������
����� �����������
�����������������������
����� �����+��������&@,34C� � �����(�����������������.
F���� ������������ ����������&4+��(� � ����� ���
������� ��������
��� �����=�+�/'�� � ������ � ����
���������������������.�� �������� ����������� ���
������������������������� ����.
&���������
������������&4+�������� ���������(��������
��.
������������
��.
6�����(������������������������������ ����������� ������
+�+/'������������<���7�������89�����+�+/'���������
��������������������� ���������������������������� ���
�������� ����.
&���������
���������������������������� �������� �� .
&���������
���������������������������� �������� �� .
153
OIL AND GAS INDUSTRY GUIDANCE ON VOLUNTARY SUSTAINABILITY REPORTING
Appen
dix C Sum
mary of key changes since 2010 and m
apping against the GRI G
4 Guidelines
���
����
��
����
���
����
����
�/B
&���������
��������&4+����+�+/'�.
%����������������� ������
������
��
&@,/'D
�������������� ��������������� ������ ��� �����������������
����������
3���
�/C
�/D
�/7:
+����� ���������������(������������������ ���
����
����������
��
�������/C.
+����� ���������������(������������������ ���
����
����������
��
�������/C.
?�����!�������(���������� �������+�+/'������������������
���������������������3��
��4���� �����/C�����(��������
��� ��� �������/C2�/7C��������������
������.
+�+/'�������� ���������� ����������������������������
������� ��������������3��
��4���� �����������������������/C
����/D.
'����������������������� �� �������������������������������
������������������3��
��4���� �������������/C�����/D.
1����2���
��� ����������� ������������������������������
+�+/'���������������3��
��4���� ���������������/C��������
� ������������.
+���������������� ����� ��
���������&4+��� ���������(��������
������.
'����������������������� �� �������������������������������
������������������3��
��4���� �������������/C�����/D.
+�+/'�������� ���������� ����������������������������
������� ��������������3��
��4���� �����������������������/C
����/D.
+����� ���������������(������������������ ���6������������
��
�������/D.
+������ ������������������������� � �����������/D�
���������������� ������������+�+/'���/7����������
�������
������������� ��(� ������&4+.
+���������������� ����� ��
���������&4+��� ���������(��������
������.
3��
������� �����������
3��
������� ���� ������
���������������������
&@,347
&@,348
&@,349
&@,34@
&@,34;
&@,34A
&@,34D
&@,34@
&@,34;
&@,347:
&@,3478
&@,34B
<�������
���������������� ������������� ����������
���������� ���������������������� ���� ���������������
���������� � ������
<�������� ��������������������������� ����������� ����������
��� �������
������� ����������������������� ��������������
��������������� ������
<�������
������������� ������ ����
������������������������
���
6������ ���� ���������� ������ ������������������������������
!��� ���������� ���������������������������������
������������ ������������ ����������� �������� ��������� ������
6������ ���� ������ ���������� ������� ������������ �������������
�������������������� �� ������������������������������
�����������������������
6������ ���� ���������� ������ ���������� ������� ���������
�� ������������� ����������������
��� ��������������� �� ���
������������������������������������ ����������������
��� ���
�����
������������������
������������� ����������� ��-��
������
������� ����� ���������� ���
6������ ���� ���������� ������ ������������������������������
!��� ���������� ���������������������������������
������������ ������������ ����������� �������� ��������� ������
6������ ���� ������ ���������� ������� ������������ �������������
������������������� �� ������������������������������
�����������������������
���������� ���������� ������ ������������� ���������������
�������������
������� ��������� ����.
?��
������������ ���������
������� ������ ���������� �
���� ������������������������������� �
���������� ��������� ��������������������������� $�������
���������� ����������� ��� �������
������� ������������
����������
3���
3���
E����
E����
E����
%��
3���
E����
E����
3���
%��
3���
3�
���
����
��&
���
���
��$��
����
��/�
�D*
���
��
���$
���
� �4
�E�
���
���
����
�$
����
�5��
����
�/��
��
�����
��
����
�����
����
!���
���
��$
���
� ���
������
!���
$��
�� �5
����
����
����
���
����
��!�
���$
���
� �1�
�����
���
�����
��$
���
����
�1��
����
��8��
���
����
�$
�
��
�$
����
�>8C
&$4
���A
821
@
�11C
�D��8
���
�����
�A0
E3&
$�(
���$
����
���
���
����
�/�
����
��/�8
���
����
��
���
����
�/�
���
����
�1�-
���
�1�%
?&
����
�
IPIECA • API • IOGP
154
App
endi
x C
Sum
mar
y of
key
cha
nges
sin
ce 2
010
and
map
ping
aga
inst
the
GRI
G4
Gui
delin
es
2�!�
��-�
>��
����
�@��&
����
����
��'#
"*�A
����
���
����
���
���A
���A
0�A�
����
��
�(��
�$��
����
���
�'#"
*A�
��A0�
���
����
�$�
���
��
�/��
���
����
4��
���
��3
���
���
�
���
����
���
����
���
�����
����
�����
����
��
��
���
��
�
3�
���
����
��&
���
���
��$��
����
��/�
�D*
���
����
����
/���
���
�$�
�����
���
����
����
���
���
����
���
$��
���>�
��4
�&
��@
*$
��E��
����
����
$��
����
��(
�!���
����
����
$��
���>1
���
�26@
��
�D=�
��
��
����
��
����
��
���
��
A0E*
+A0
E*,
A0E*
-A0
E3&
$
���
���
����
�����
� ��
����
����
�����
����
�����
��:�
���
����
(��
����
��
����
����
���
��
��
�����
��F
����
�/��
��E�
//���
����
���
��
����
���
�����
����
����
���
A��
����
���
?���
�����
����
����
�A��
��(�
��$�
����
���
����
�����
����
���
��
���
����
���
���
� ��
�����
���
��
���!
��/�
���
��
���
���
/��
����
�����
��
���
����
����
�/�
���
���
� �
����
/���
����
E��
���
�����
����
���
����
���
��?
�>1��
���
��1�
"� ��
��
D��
��
����
���
���
����
���
�1�0
@?
&��
���
�������������������
�����������������������������
�� �� ������
<�� �������������� ������ �
��������
�������������������������
&@,�69
&@,�6@
&@,�6;
&@,�69
&@,�6D
&@,�67:
&@,/'7
&@,/'@
&@,�6A
&@,�E�
&@,�6A
<�������
����������������������� � �������� �
������������������������� ������������ � ���������
'�����������������������������,����������������� ���
�������
'������
��������� ����������������������� ����
������������������
�������� �� ����� ���� �������� �
������������������
������������� ������ �������� ������ ����������
��������� ���� �����
�������������������������������������� ���� ��������
����������'������������ ����
������������������������������ ������������������
���� ������������ � ���
��������
�� �������������
�����������
���������� ���� ������������� ����
����� ����������������� ����������
��
������������������� � ��������������
�������
��
<�������������������������������� ��������������
�������2��������
4����������������������������� � ���������������� ���������
���������"������������������������#�������������������������
�����������2 �������.
<�������������������������������� ��������������
�������2��������
+�+/'������������ �����(������������������������� � �������
� ���6����4��������/��
��.�&4+� � ������������� �
��� ���� ������������ � ���������.
4 ����������������
�����������=�+�+/'�� ����������
�� �� ������ �����/78.
+�+/'������ ������ ���������� �� � ���6����4�������
/��
��.
4 ����������������
�����������.
+�+/'������ � ����������������� ���������� ������ �"�����
������������������� #.
+�+/'������ ������ ���������� �� � ���6����4�������
/��
��.
6�����(������������������������������ ����������� ������
+�+/'������������<���7�������8@�����+�+/'���������
��������������������� ���������������������������� ���
�������� ����.
?��������������+�+/'������������������� ��
�� � ���
������������������������
��������
�� .
+��������������=��������+�+/'������ ����������� ��
(������������������&4+������ ����� � ���������� ����� .
'��������&4+$ ����������������E
�����&@����������6������&
�������� ��� �� ������������������������������������
������.�+�+/'��������� ���������� ��������������������
����������������������������.
+�+/'�� � �����(������������������ �����������������
���
���������������������������� ������ � �����(��������!���
�����������������������������������.
�/77
�/78
�/79
�/7@
E����
3���
E����
3���
E����
E����
E����
%��
E����
E����
E����
155
OIL AND GAS INDUSTRY GUIDANCE ON VOLUNTARY SUSTAINABILITY REPORTING
Appen
dix C Sum
mary of key changes since 2010 and m
apping against the GRI G
4 Guidelines
3�
���
����
��&
���
���
��$��
����
��/�
�D*/�
��������� �����%����2�
���
��������� �� ����
6������������������ ����� �����<�����������������
� ��������� �������(���������������� �����/(��
�����������������
��������� �������%�����������
������������ � �� ����"%�06 4��4�'<+'/���?�
�/'/?<�F64�#
*E������ ���� ����"/'6?6E+'#
��
�D��
!���
����
����
�A0
E3&
$�
���
�����
��
&��
���
F������������ ������������ ���
F������������
��
F���������������������������
?��,������������������� � ��
&@,%�7
&@,%�78
&@,%�79
&@,/';
&@,%�@
&@,%�C
&@,%�D
&@,%�7:
&@,%�77
&@,%�7A
&@,349
&@,3478
<�������
������������������������ �����
����
���������������������������������
'���� ��������������������� ��������������������
���������������������������������������������������
��
�� �������������������� �������� ���
4�������� ��� �����������������������
����������
����������������� ����������������� �����������
4���������� ���� �����������������������������
���
���������������
������ ����������������� �����������
E������
������������" #��������� ������������������
���� ���������������������� � ������������������������
3������� ��������� ��������������������� ���������
�����
��������� �������������������������������
����
������
������� ����� ���� �����
������������������������
��������������������
������������������� ���� � �
���
��������������������
��������������� ��������������������������
����������������� �����������������
�����������
?��
������������ ������������������ ���������� �
���� ������������������������������� �
<�������
������+������ ������ ����
��������������� ����
?��
������������ ���������
������� ���������� ����
� ������������������������������� �
?��������������+�+/'��������� �� ��������������������
��������������������������"���8@#� ��������/7;.
<������&4+�� ���� ����(���������������������������� ��
���� �����.
&4+� � �(�������������������+�+/'�� ��� � ����������
����� � ���� �(����������(�������.
?���!����������������������������������������������������
(����������(�������.
&4+��(� � �(��������������� ����� �����������
(�������������� �������������������� ����������� .
&4+����� ������������������� ���� �+�+/'����������
��������������.
+�+/'�� �����
���������������
������ �������������
�� �H������ ����������������������� ����.
+�+/'�����&4+����� ��
����������+�+/'��������������
���� �����������.
&4+����������� ����� �����������+�+/'�$ ����������(�������
������������������� �� ���������� �������������������
� ����� ���.
����+�+/'���/7C����������������������� � ��
������������������(������������" �����
���#������������
������������� �������������� �&4+.��/7C��'7�� ������
�����������������&4+$ �%���������� ���������F
�����E
�.
?�����!�������(���������� �������+�+/'������������������
���������������������3��
��4���� �����/C�����(��������
��� ��� �������/C2�/7C��������������
������.
+���������������� ����� �����������&4+� � �����(��������
����������.
�/7;
�/7A
�/7B
�/7C
%��
3���
E����
%��
%��
%��
3���
3���
E����
E����
E����
3���

This page intentionally left blank
157
OIL AND GAS INDUSTRY GUIDANCE ON VOLUNTARY SUSTAINABILITY REPORTING
Appendix D
Measurement unitsand conversion factors(from IOGP)
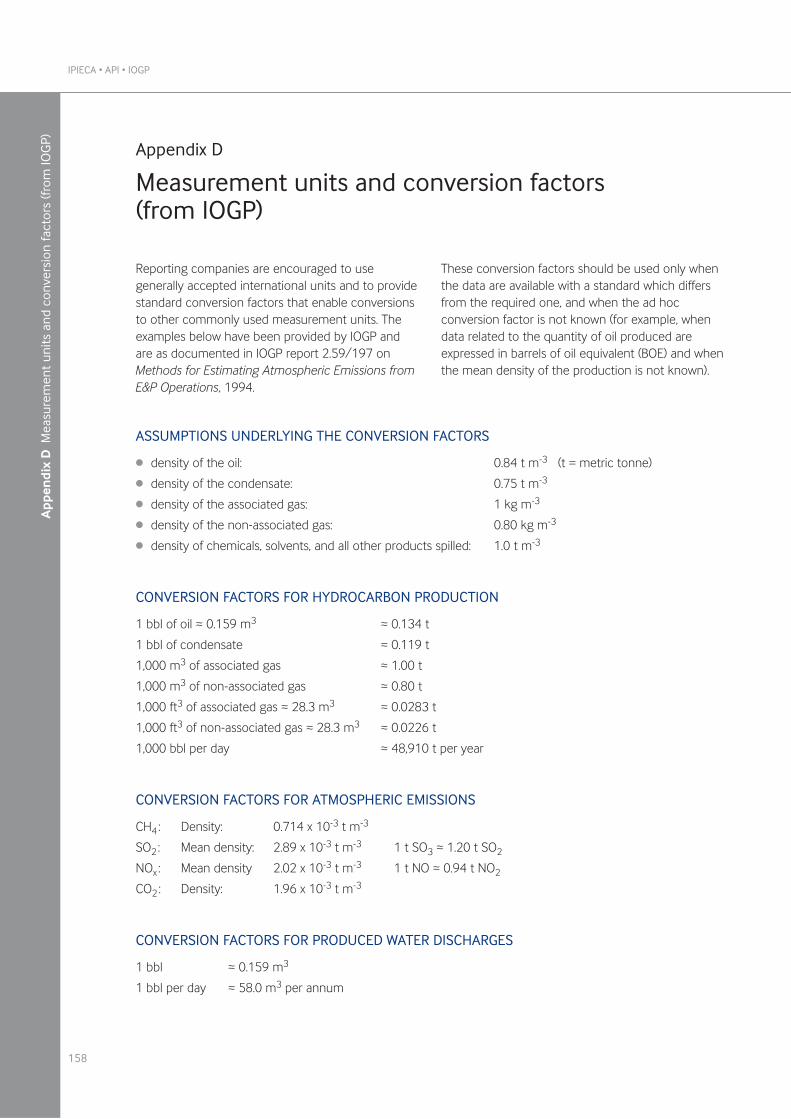
IPIECA • API • IOGP
158
Appendix D
Measurement units and conversion factors(from IOGP)
App
endi
x D
Mea
sure
men
t un
its a
nd c
onve
rsio
n fa
ctor
s (fr
om IO
GP)
Reporting companies are encouraged to usegenerally accepted international units and to providestandard conversion factors that enable conversionsto other commonly used measurement units. Theexamples below have been provided by IOGP andare as documented in IOGP report 2.59/197 onMethods for Estimating Atmospheric Emissions fromE&P Operations, 1994.
These conversion factors should be used only whenthe data are available with a standard which differsfrom the required one, and when the ad hocconversion factor is not known (for example, whendata related to the quantity of oil produced areexpressed in barrels of oil equivalent (BOE) and whenthe mean density of the production is not known).
ASSUMPTIONS UNDERLYING THE CONVERSION FACTORS
l density of the oil: 0.84 t m-3 (t = metric tonne)
l density of the condensate: 0.75 t m-3
l density of the associated gas: 1 kg m-3
l density of the non-associated gas: 0.80 kg m-3
l density of chemicals, solvents, and all other products spilled: 1.0 t m-3
CONVERSION FACTORS FOR HYDROCARBON PRODUCTION
1 bbl of oil ≈ 0.159 m3 ≈ 0.134 t
1 bbl of condensate ≈ 0.119 t
1,000 m3 of associated gas ≈ 1.00 t
1,000 m3 of non-associated gas ≈ 0.80 t
1,000 ft3 of associated gas ≈ 28.3 m3 ≈ 0.0283 t
1,000 ft3 of non-associated gas ≈ 28.3 m3 ≈ 0.0226 t
1,000 bbl per day ≈ 48,910 t per year
CONVERSION FACTORS FOR ATMOSPHERIC EMISSIONS
CH4 : Density: 0.714 x 10⁻³ t m-3
SO2 : Mean density: 2.89 x 10⁻³ t m-3 1 t SO3 ≈ 1.20 t SO2
NOx : Mean density 2.02 x 10⁻³ t m-3 1 t NO ≈ 0.94 t NO2
CO2 : Density: 1.96 x 10⁻³ t m-3
CONVERSION FACTORS FOR PRODUCED WATER DISCHARGES
1 bbl ≈ 0.159 m3
1 bbl per day ≈ 58.0 m3 per annum
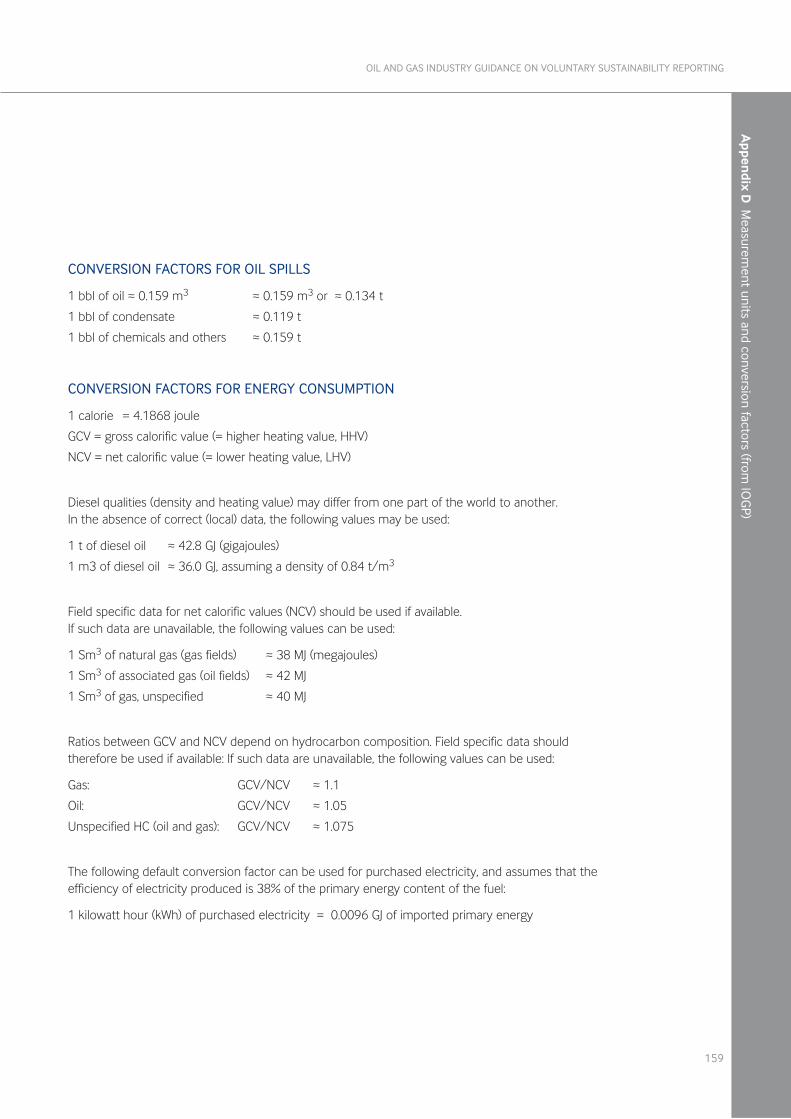
159
OIL AND GAS INDUSTRY GUIDANCE ON VOLUNTARY SUSTAINABILITY REPORTING
Appen
dix D M
easurement units and conversion factors (from
IOG
P)
CONVERSION FACTORS FOR OIL SPILLS
1 bbl of oil ≈ 0.159 m3 ≈ 0.159 m3 or ≈ 0.134 t
1 bbl of condensate ≈ 0.119 t
1 bbl of chemicals and others ≈ 0.159 t
CONVERSION FACTORS FOR ENERGY CONSUMPTION
1 calorie = 4.1868 joule
GCV = gross calorific value (= higher heating value, HHV)
NCV = net calorific value (= lower heating value, LHV)
Diesel qualities (density and heating value) may differ from one part of the world to another. In the absence of correct (local) data, the following values may be used:
1 t of diesel oil ≈ 42.8 GJ (gigajoules)
1 m3 of diesel oil ≈ 36.0 GJ, assuming a density of 0.84 t/m3
Field specific data for net calorific values (NCV) should be used if available. If such data are unavailable, the following values can be used:
1 Sm3 of natural gas (gas fields) ≈ 38 MJ (megajoules)
1 Sm3 of associated gas (oil fields) ≈ 42 MJ
1 Sm3 of gas, unspecified ≈ 40 MJ
Ratios between GCV and NCV depend on hydrocarbon composition. Field specific data shouldtherefore be used if available: If such data are unavailable, the following values can be used:
Gas: GCV/NCV ≈ 1.1
Oil: GCV/NCV ≈ 1.05
Unspecified HC (oil and gas): GCV/NCV ≈ 1.075
The following default conversion factor can be used for purchased electricity, and assumes that theefficiency of electricity produced is 38% of the primary energy content of the fuel:
1 kilowatt hour (kWh) of purchased electricity = 0.0096 GJ of imported primary energy

This page intentionally left blank

161
OIL AND GAS INDUSTRY GUIDANCE ON VOLUNTARY SUSTAINABILITY REPORTING
Appendix E
References and source materials
GENERAL REPORTING REFERENCES
AccountAbility. 2008. AA1000 Principles Standard.London, UK and Washington D.C., USA.www.accountability.org/standards/aa1000aps.html
AccountAbility. 2008. AA1000 Assurance StandardLondon, UK and Washington D.C., USA.www.accountability.org/standards/aa1000as.html
API. 1998. Model Environmental, Health and Safety(EHS) Management Systems and GuidanceDocument. API Publication 9011. Order No. R9100S.Washington, D.C., USA. www.api.org
GEMI. 2004. Transparency: A Path to Public Trusthttp://gemi.org/solutions/publications
GRI. 2013. Sustainability Reporting Guidelines.The Netherlands. www.globalreporting.org
IAASB (International Audit and Assurance StandardsBoard). 2012. International Standard on AssuranceEngagements: ISAE 3000 (Revised), AssuranceEngagements Other than Audits or Reviews ofHistorical Financial Information. InternationalFederation of Accountants. New York, USA. https://www.ifac.org/publications-resources/international-standard-assurance-engagements-isae-3000-revised-assurance-enga
IIRC. 2013. International Integrated ReportingFramework. http://integratedreporting.org/resource/international-ir-framework
IOGP-IPIECA. 2014. Operating Management SystemFramework. IOGP Report 510.www.iogp.org/pubs/510.pdf
IPIECA/API. 2002. Compendium of SustainabilityReporting Practices and Trends for the Oil and GasIndustry. London, UK and Washington, D.C., USA.[E1–E4]
IPIECA/API/IOGP. 2010. Oil and Gas Industry Guidanceon Voluntary Sustainability Reporting. London, UK andWashington, D.C., USA. www.ipieca.org/publication/oil-and-gas-industry-guidance-voluntary-sustainability-reporting-2010-update
ENVIRONMENTAL SECTION REFERENCES
API. 2009. Compendium of Greenhouse Gas EmissionEstimation Methodologies for the Oil and Natural GasIndustry. Washington, D.C., USA.http://www.api.org/~/media/files/ehs/climate-change/2009_ghg_compendium.pdf [E1, E2 and E4]
AQUASTAT (website). FAO’s global water informationsystem. Food and Agriculture Organization of theUnited Nations, Rome.www.fao.org/nr/water/aquastat/main/index.stm [E6]
AWS. 2014. The AWS International Water StewardshipStandard (Version 1.0).www.allianceforwaterstewardship.org/assets/documents/AWS-Standard-v-1-Abbreviated-print.pdf [E6]
CEO Water Mandate. 2014a. Driving Harmonization ofWater-Related Terminology.http://ceowatermandate.org/files/MandateTerminology.pdf [E6]
CEO Water Mandate. 2014b. Corporate WaterDisclosure Guidelines: Toward an Common Approachto Reporting Water Issues.http://ceowatermandate.org/files/Disclosure2014.pdf[E6]
CDP. 2014. CDP Worldwide—Water Program (website)www.cdp.net/water [E6]
CONCAWE. Air Pollutant Emission Estimating Methodsfor E-PRTR Reporting by Refineries (revised 2009).Report 1/09. Brussels, Belgium.https://www.concawe.eu/publications/23/40/Report-No-1-09 [E8]
IPIECA • API • IOGP
162
Appendix E
References and source materials
App
endi
x E
Ref
eren
ces
and
sour
ce m
ater
ials
EBI (Energy and Biodiversity Initiative). Guidelines andproducts, 2003. www.theebi.org/products.html [E5]
EMEP/EEA. 2013. Emission Inventory Guidebook.www.eea.europa.eu//publications/emep-eea-guidebook-2013 [E8]
FAO (Food and Agriculture Organization of the UnitedNations). www.fao.org/nr/water/index.html [E6]
IPCC. 1990–2014. Assessment Reports (first to fifth).https://www.ipcc.ch/publications_and_data/publications_and_data_reports.shtml#1 [E1]
IPIECA. 2007. An Ecosystem Approach to Oil and GasIndustry Biodiversity Conservation. London, UK.www.ipieca.org/publication/ecosystem-approach-oil-and-gas-industry-biodiversity-conservation [E5]
IPIECA. 2011. Global Water Tool for Oil and Gas.www.ipieca.org/publication/global-water-tool-oil-and-gas [E6]
IPIECA. 2012. Climate Change: A Glossary of Terms.5th Edition. London, UK. www.ipieca.org/publication/climate-change-glossary-terms-5th-edition [E3]
IPIECA. 2012. The biofuels and water nexus. Guidancedocument for the oil and gas industry.www.ipieca.org/publication/biofuels-and-water-nexus-guidance-document-oil-and-gas-industry [E6]
IPIECA. 2013. The IPIECA Water ManagementFramework for onshore oil and gas activities.www.ipieca.org/water-management-framework [E6]
IPIECA. 2014. Efficiency in water use. Guidancedocument for the upstream onshore oil and gasindustry. www.ipieca.org/publication/efficiency-water-use-guidance-document-upstream-onshore-oil-and-gas-industry [E6]
IPIECA. 2014. Identifying and assessing water sources:Guidance document for the onshore oil and gasindustry. www.ipieca.org/publication/identifying-and-assessing-water-sources [E6]
IPIECA. 2014. Review of water risk tools. Guidancedocument for the oil and gas industry.www.ipieca.org/publication/review-water-risk-tools-guidance-document-oil-and-gas-industry [E6]
IPIECA/API/IOGP. 2011. Petroleum Industry Guidelinesfor Reporting Greenhouse Gas Emissions. London, UK.www.ipieca.org [E1, E2 and E4].
IPIECA/IOGP. 2005. A Guide to Developing BiodiversityAction Plans for the Oil and Gas Sector. London, UK.www.ipieca.org/publication/guide-developing-biodiversity-action-plans-oil-and-gas-sector [E5]
IPPC. 2007. ‘Changes in Atmospheric Constituents andin Radiative Forcing’. Chapter 2 in: Climate Change 2007:The Physical Science Basis. Contribution of WorkingGroup I to the Fourth Assessment Report of theIntergovernmental Panel on Climate Change.Solomon, S., Qin, D., Manning, M., Chen, Z., Marquis, M.,Averyt, K.B., Tignor, M. and Miller H.L. (eds.). Cambridge,UK. www.ipcc.ch/publications_and_data/ar4/wg1/en/contents.html [E1]
ISO. 2004. Environmental Management System—Specification with Guidance for Use. ISO 14001.Geneva, Switzerland. www.iso.org/iso/home/standards/management-standards/iso14000.htm [E5]
Millennium Ecosystem Assessment. 2005. Ecosystemsand human well-being: synthesis. Washington, DC:Island Press. ISBN 1-59726-040-1.www.millenniumassessment.org/documents/document.356.aspx.pdf
UN. 1992. United Nations Convention on BiologicalDiversity. https://www.cbd.int
UNEP. 2013. GEO-5 for Business: Impacts of aChanging Environment on the Corporate Sector.www.unep.org/geo/pdfs/geo5/geo5_for_business.pdf [E6]
UNESCO World Water Assessment Programme(WWAP—2008 data).www.unesco.org/new/en/natural-sciences/environment/water/wwap [E6]
163
OIL AND GAS INDUSTRY GUIDANCE ON VOLUNTARY SUSTAINABILITY REPORTING
Appen
dix E References and source m
aterials
US EPA. 1995. Compilation of Air Pollutant EmissionFactors, Volume I: Stationary Point and AreasSources, AP-42. Fifth Edition. (GPO 055-000-005-001). January 1995, with Supplements A and B(1996), C (1997), D (1998), E (1999) and F (2000).US EPA Office of Air Quality Planning and Standards,Washington D.C. www.epa.gov/ttnchie1/ap42 [E4, E8]
US Geological Survey. http://water.usgs.gov [E6]
WHO (World Health Organization).www.who.int/topics/water/en [E6]
WRI. 2008. The Corporate Ecosystem Services Review:Guidelines for Identifying Business Risks andOpportunities Arising from Ecosystem Change.Hanson C., Ranganathan, J., Iceland, C., Finisdore, J.(eds.). Washington, D.C., USA.www.wri.org/publication/corporate-ecosystem-services-review [E5]
WRI/WBCSD. 2004. The Greenhouse Gas Protocol: ACorporate Accounting and Reporting Standard(Revised Edition). Geneva, Switzerland andWashington, D.C., USA. www.ghgprotocol.org/standards/corporate-standard [E1]
WRI/WBCSD. 2009. Global Water Tool.www.wbcsd.org/work-program/sector-projects/water/global-water-tool.aspx [E6]
HEALTH AND SAFETY SECTION REFERENCES
API. 2004. Five-point Approach to AddressingWorkplace Ergonomics.
API. 2010. Recommended Practice 754—ProcessSafety Performance Indicators for the Refining andPetrochemical Industries. Washington, D.C., USA.http://www.api.org/environment-health-and-safety/process-safety/process-safety-standards/measuring-process-safety-rp-754 [HS5]
CDC (Centres for Diseases Control and Prevention).www.cdc.gov [HS2]
CEFIC. 2001. Reporting of Occupational IllnessFrequency. www.cefic.org [HS3]
CCPS. 2007. Guidelines for Risk Based Process Safety.American Institution of Chemical Engineers. New York,USA. www.aiche.org/ccps [HS5]
CCPS. 2008. Process Safety Leading and LaggingMetrics. American Institute of Chemical Engineers.New York, USA. www.aiche.org/ccps [HS5]
CCPS. 2009. Guidelines for Process Safety Metrics.American Institute of Chemical Engineers. New York,USA. www.aiche.org/ccps [HS5]
ICCA. 2008. Global Product Strategy. www.icca-chem.org/en/Home/Global-Product-Strategy [HS4]
ILO. 1999. Report of the Director General: DecentWork. 87th Session. Geneva, Switzerland.www.ilo.org/public/english/standards/relm/ilc/ilc87/rep-i.htm [HS1]
ILO. 2001. The ILO Code of Practice on HIV/AIDS andthe World of Work. Geneva, Switzerland.www.ilo.org/wcmsp5/groups/public/@ed_protect/@protrav/@ilo_aids/documents/publication/wcms_113783.pdf [HS2]
ILO. 2009. Tripartite Meeting on Promoting SocialDialogue and Good Industrial Relations from Oil andGas Exploration and Production to Oil and GasDistribution. Geneva, Switzerland, 11–14 May 2009.www.ilo.org/sector/activities/sectoral-meetings/WCMS_161182/lang--en/index.htm [HS1]
IOGP. 2010. Health and safety incident reportingsystem users’ guide, 2010 data. IOGP Report 444.London, UK. www.iogp.org/pubs/444.pdf [HS5]
IOGP. Safety data reporting users’ guide. (Updatedyearly) London, UK. www.iogp.org [HS3]
IOGP. 2008. Asset integrity—the key to managingmajor incident risks. Report No. 403. London, UK.www.iogp.org/pubs/403.pdf [HS5]
IPIECA • API • IOGP
164
App
endi
x E
Ref
eren
ces
and
sour
ce m
ater
ials
IOGP. 2011. Asset Integrity—Key PerformanceIndicators. London, UK. Scheduled for publication in2011. www.iogp.org [HS5]
IOGP-IPIECA Health Committee. ‘Good practice’ HealthSeries. London, UK. www.ipieca.org/library [HS2]
IOGP-IPIECA. 2008. Health Performance Indicators: Aguide for the oil and gas industry. London, UK.www.ipieca.org/publication/health-performance-indicators [HS2]
ISO. 2014. ISO 11014:2009 Safety Data Sheet forchemical products—content and order of sections.www.iso.org/iso/catalogue_detail.htm?csnumber=44690 [HS4]
OECD. 2000. Guidelines for Multinational Enterprises.www.oecd.org/corporate/mne [HS4]
OECD. 2008. Guidance on Safety PerformanceIndicators Related to Chemical Accident Prevention,Preparedness and Response for Industry.Environment, Health and Safety Publications, Serieson Chemical Accidents No. 19. Paris, France.http://www.oecd.org/env/ehs/chemical-accidents/41269639.pdf [HS5]
Step Change in Safety. 2006. Leading PerformanceIndicators—Guidance for Effective Use.https://www.stepchangeinsafety.net/node/2667[HS3]
UK Health and Safety Executive (HSE). 2006. Step-By-Step Guide to Developing Process Safety PerformanceIndicators. HSG254. Sudbury, Suffolk, UK.www.hse.gov.uk/pubns/books/hsg254.htm [HS5]
United Nations Programme on HIV/AIDS/GlobalBusiness Council/Prince of Wales Business Leaders’Forum. 2000. The Business Response to HIV/AIDS:Impact and Lessons Learned. www.gbcimpact.org[HS2]
U.S. Department of Labor, Occupational Safety andHealth Administration. 2001. Occupational Injury andIllness Recording and Reporting Requirements. 29CFR Part 1904.www.osha.gov/recordkeeping/index.html [HS3]
SOCIAL AND ECONOMIC SECTIONREFERENCES
DIHR. 2005. Human Rights Compliance Assessment Tool.https://hrca2.humanrightsbusiness.org [SE8]
EAP. 2009. Maximising the Contributions of LocalEnterprises to the Supply Chain of Oil, Gas and MiningProjects in Low Income Countries. Briefing note.www.engineersagainstpoverty.org/documentdownload.axd?documentresourceid=22 [SE7]
EBRD. Maximising the Positive Socio-Economic Impactof Mineral Extraction on Regional Development inTransition Economies: A Review of the Literature.Professor R.M. Auty, Lancaster University (ed.).www.ebrd.org/downloads/research/economics/auty.pdf [SE6]
EITI. Since 2002. Extractive Industries TransparencyInitiative, including the EITI Business Guide.www.eiti.org [SE13]
GRI. 2009. A Resource Guide to Corporate HumanRights Reporting. GRI Research and DevelopmentSeries. Amsterdam, The Netherlands.https://www.globalreporting.org/resourcelibrary/A-Resource-Guide-to-Corporate-Human-Rights-Reporting.pdf [SE8]
IBLF (International Business Leaders Forum)/BSR(Business for Social Responsibility). 2000. VoluntaryPrinciples on Security and Human Rights.www.voluntaryprinciples.org [SE8]
165
OIL AND GAS INDUSTRY GUIDANCE ON VOLUNTARY SUSTAINABILITY REPORTING
Appen
dix E References and source m
aterials
ICMM. 2008. Resource Endowment Toolkit: TheChallenge of Mineral Wealth: Using ResourceEndowments to Foster Sustainable Development.www.icmm.com/page/2915/resource-endowment-initiative-toolkit [SE6]
IFC. 2012. Performance Standards on Environmentaland Social Sustainability (1, 5, 7). Washington D.C.,USA. www.ifc.org/wps/wcm/connect/115482804a0255db96fbffd1a5d13d27/PS_English_2012_Full-Document.pdf?MOD=AJPERES [SE2, SE3]
IFC. 2010. Strategic Community Investment: A GoodPractice Handbook for Companies Doing Business inEmerging Markets. Washington, D.C., USA.www.ifc.org/hb-communityinvestment [SE1]
ILO. 1989. Convention 169 on Indigenous and TribalPeoples. Geneva, Switzerland.www.ilo.org/indigenous/lang--en/index.htm [SE2]
ILO. 1998. Declaration on Fundamental Principles andRights at Work. Geneva, Switzerland. [SE8]
IPIECA. 2006. Partnerships in the Oil and Gas Industry.London, UK. www.ipieca.org/publication/partnerships-oil-and-gas-industry [SE1]
IPIECA. 2008. Creating Successful, Sustainable SocialInvestment: Guidance document for the oil and gasindustry. London, UK.www.ipieca.org/publication/guide-successful-sustainable-social-investment-oil-and-gas-industry[SE1, SE4]
IPIECA. 2011. Oil and Gas Industry Guidance onDeveloping a Local Content Strategy. London, UK.Scheduled for publication in 2011. www.ipieca.org [SE5]
OECD. 2000. Guidelines for Multinational Enterprises.www.oecd.org/corporate/mne [SE8]
The London Benchmarking Group provides a modelused by many companies around the world to assessand report on the value and achievements of theirsocial investments. www.lbg-online.net/lbg [SE4]
UN General Assembly. December 1948. UniversalDeclaration of Human Rights (UDHR).www.un.org/en/documents/udhr [SE8]
UN General Assembly. December 1966. TheInternational Covenant on Civil and Political Rights(ICCPR).https://treaties.un.org/doc/Publication/UNTS/Volume%20999/volume-999-I-14668-English.pdf [SE8]
UN General Assembly. June 2007. Declaration on theRights of Indigenous Peoples.www.un.org/esa/socdev/unpfii/en/declaration.html[SE2]
UN Secretary-General’s Special Representative forBusiness and Human Rights. 2008. Protect, Respectand Remedy: a Framework for Human Rights andBusiness. Professor John Ruggie. www.business-humanrights.org/Links/Repository/965591 [SE8]
Voluntary Principles on Security and Human RightsReporting Guideline. The Voluntary Principles SteeringCommittee, 2009. [SE10]
WBCSD. 2007. Promoting Small and MediumEnterprises for Sustainable Development. Issue brief.Geneva, Switzerland.www.wbcsd.org/web/publications/sme.pdf [SE7]
Zandvliet, L. and Anderson M.B. 2009. Getting it Right:Making Corporate-Community Relations Work. ISBN 978-1-906093-19-8. Greenleaf Publishing. [SE1]
IPIECA • API • IOGP
166
App
endi
x E
Ref
eren
ces
and
sour
ce m
ater
ials

167
OIL AND GAS INDUSTRY GUIDANCE ON VOLUNTARY SUSTAINABILITY REPORTING
Appendix F
Glossary
Alternative energy: The energy derived from non-fossil fuel sources [E3].
Asset integrity: A systematic approach to ensuringthe safe containment of hazardous materials orenergy by applying good design, construction andoperating principles [HS5]. In this Guidance, this termis used synonymously with Process safety.
Barrel of oil equivalent (BOE): For liquids, one BOEequals one barrel of oil or condensate. For gases,one BOE equals approximately 5,800 standard cubicfeet (SCF) of gas.
Baseline: Dated information or data that establishesa reference point against which performance trendscan be consistently assessed on a regular, usuallyannual, basis.
Benchmarking: The process of assessing relativeperformance against a group of peers.
Biodiversity: Biological diversity, or biodiversity, isvery broadly the variety of life on earth at thegenetic, species, and ecosystem levels of biologicalorganization [E5].
Biofuel: A fuel produced from organic matterproduced by plants [E3].
Biomass: The total dry organic matter or storedenergy content of living organisms [E3].
Bribery: The payment of money or the provision ofanother benefit to someone in business orgovernment to influence that person’s judgment orconduct in order to gain commercial advantage[SE11].
Business activities: The types of oil and gas industryoperations or other commercial affairs of acompany, such as Exploration, Production, Pipelines,Shipping, Refining, Marketing or Petrochemicals.
Business partners: Organization with which thereporting company has some form of commercialalliance or contract.
Carbon dioxide (CO2): A naturally occurringgreenhouse gas that is also emitted duringcombustion when burning fossil fuels andbiomass [E1].
Child labour: The use of children as workers belowthe minimum age at which they can enter intodifferent kinds of work.
Climate change: Statistical variation in thedistribution of weather which, at a global level, hasbeen associated with increased levels ofatmospheric CO2 produced largely by the increasingcombustion of fossil fuels from the 20th centuryonwards [E1, E2].
CO2 equivalent: The mass of CO2 multiplied by itsGlobal warming potential (GWP) [E1].
Cogeneration/combined heat and power (CHP): Afacility producing electricity and steam or heatsimultaneously using the same fuel supply toachieve energy efficiency and lower emissions [E2].
Consolidation: The process of gathering andaggregating information (usually quantitative data)from a company’s business activities within itsReporting boundary to generate Indicators of overallcompany performance [Appendix A].
Communities: A group of people who share acommon sense of identity and interact with oneanother on a sustained basis [SE1].
Containment: See Primary containment andSecondary containment.
IPIECA • API • IOGP
168
Appendix F
Glossary
App
endi
x F
Glo
ssar
y
Note: the references in square parentheses refer to a Section, Indicator or Appendix in the Guidance wherefurther definitional information is provided.
Continuous improvement: A cyclic process appliedby management for planning, implementing,measuring and reviewing the company’s activities inorder to achieve better performance.
Contractor: In the context of the Workforce, acontractor refers to a person not employed directlyby the reporting company who performs servicesunder contract for the company, especially at one ofits worksites.
Corruption: Any dishonest or illegal practice thatresults in loss of business integrity [SE11]. (See alsoBribery.)
Cultural heritage: Protection of archaeological andhistoric resources such as ancient sites andbuildings, together with respect for local customs,language, lifestyles, religion and history. [SE1]
Cuttings: In drilling, pieces of drilled rocks broughtto the surface by the returning drilling mud stream[E9, E10]
Direct energy: The amount of Primary energy usedby a facility or its equipment to generate power orheat [E2].
Direct GHG emissions: GHG emitted from sourcesat company facilities [E1].
Discharges: In this Guidance, refers to releases ofliquids (products, by-products or waste streams) intowater or land [E7, E9].
Discrimination: A prejudicial outlook, action ortreatment towards a person or a group of people.Discrimination may be based on race, colour, sex,religion, political opinion, nationality, social origin,social status, indigenous status, disability, age [SE1,SE15].
Downstream: Operations involving the refining,processing, distribution, and marketing of productsderived from oil and gas, including service stations.
Drilling mud: The fluids used in drilling to controlpressure and serve as a lubricant [E9, E10].
Ecosystem: A dynamic complex of communities ofliving organisms and their non-living environmentinteracting as a functional unit [E5].
Ecosystem services: The benefits (direct andindirect) that people obtain from ecosystems [E5, E6]
Emissions: The release of gases, vapours, fumes,mist, and particulate matter into the atmosphere [E1,E4, E8].
Employee: A person legally contracted and paiddirectly by a company to undertake work associatedwith its Business activities.
Energy efficiency: The ratio of measured output toenergy input which describes efforts to use energyin a responsible manner such that maximum benefitis achieved for the resource consumed [E2].
Energy intensity: Energy use divided by theappropriate normalization factor for a businessactivity, e.g. production volume, refinery throughput[E2].
Energy use: The total Primary energy used by afacility calculated as the sum of Direct energy andImported energy less any Exported energy [E2].
Environment: An external setting comprised of itsphysical, chemical, biological and social components.In this Guidance, the term ‘environment’ refersespecially to the natural environment, which broadlyincludes all non-anthropogenic living and non-livingentities, whether solid, liquid or gas, occurringnaturally on earth.
Environmental impact: The outcome of actions orevents on the natural environment; while impactsmay be beneficial, in this Guidance, the term refersto adverse, undesirable outcomes.
Environmental management system (EMS): A setof processes and procedures applied by managersto assess and implement actions or programmes tomitigate environmental impacts from operations.
Equity share: The percentage of ownership oreconomic interest in an operation [E1, Appendix A]
Event: An unplanned or uncontrolled outcome of abusiness operation or activity that has, or couldhave, contributed to an injury, illness, or physicaldamage or environmental damage. [HS3, HS5]
Exploration: The activities of a company to findnaturally occurring fossil fuels. (See also Upstream.)
169
OIL AND GAS INDUSTRY GUIDANCE ON VOLUNTARY SUSTAINABILITY REPORTING
Appen
dix F Glossary
Exported energy: The Primary energy content of afuel or other source required to produce power (inthe form of electricity, heat or steam) that isexported from the facility [E2].
Fatality: An occurrence of death resulting from anIncident [HS3].
Fatal accident rate: The aggregate number ofEmployee or Contractor fatalities that have occurredwithin the company’s Workforce during a statedperiod of time, reported as a rate (frequency) per100 million hours worked during the same timeperiod [HS3].
Fatal incident rate: The aggregate number ofIncidents resulting in Employee or Contractorfatalities that have occurred during a stated periodof time, reported as a rate (frequency) per 100million hours worked during the same timeperiod [HS3].
First-tier supplier: An organization that suppliesgoods and/or services directly to the company, i.e.without the use of an intermediateorganization [SE7].
Flared gas: Total mass (or volume) of hydrocarbondirected to operational flare systems, wherein thehydrocarbons are consumed throughcombustion [E4].
Flaring: The burning of gases in a thermaldestruction device; includes flaring of associated gasfrom oil production [E4].
Freedom of association: The right of Employees toform and join groups for the promotion and defenceof their occupational interests [SE8].
Fresh water: Naturally occurring above-ground andunderground non-brackish water. Typically used asdrinking water, potable water or in agriculture [E6].
Fresh water returned: The Fresh water dischargedfrom a facility (directly or via a third party) into afreshwater body or aquifer [E6].
Fresh water withdrawn: The volume of Fresh waterremoved from all sources, including surface water,groundwater, harvested rainwater and municipalwater supply [E6].
Fresh water net consumption: The differencebetween Fresh water withdrawn and Fresh waterreturned [E6].
Fugitive emissions: The mass of uncontrolledreleases of gas from pressurized process equipment,such as valves, flanges, pump and compressor seals,and open-ended lines, as well as tanks wherehydrocarbons are exposed to the atmosphere [E1].
GHG emissions from exported energy: Theamount of Direct GHG emissions related toproduction of power (in the form of electricity, heator steam) that is supplied to a third party [E1].
GHG intensity: GHG emissions divided by anappropriate output factor for a business activity suchas oil and gas production or refinery throughput [E1].
Global warming: An overall increase in worldtemperatures which may be caused by additionalheat being trapped by Greenhouse gases.
Global warming potential (GWP): A factor whichestimates the contribution to Global warming of agiven mass of a Greenhouse gas species, relative tothe same mass of CO2 [E1].
Greenhouse gases (GHGs): Gases in theatmosphere that absorb and emit radiation withinthe thermal infrared range and may consequentlycontribute to Global warming. For the purpose ofthese Guidelines, GHGs are the six gases (or familiesof gases) listed in the Kyoto Protocol [E1].
Hazardous waste: Waste that is defined ashazardous, toxic, dangerous, listed, priority, special orsome other similar term as defined by anappropriate country, regulatory agency or authority[E10].
Health impact assessment (HIA): A process toassess potential effects of a project on the health ofa population [HS2].
Health risk assessment (HRA): A process that aimsto identify health hazards, evaluate risks to health,and determine appropriate control and recoverymeasures [HS2].
Human rights: Basic standards of treatment towhich all people are entitled, regardless ofnationality, gender, race, economic status or religion[SE8, SE9, SE10].
IPIECA • API • IOGP
170
App
endi
x F
Glo
ssar
y
Imported energy: The amount of Primary energy toproduce power which has been purchased and usedby the company, in the form of electricity, heat orsteam [E2].
Incident: An unplanned or uncontrolled Event orchain of Events that has resulted in Recordableinjury, illness, or physical or environmental damage.[HS3].
Indicator: Information or data which providesevidence of a company’s performance in addressingsustainability issues which are material for reporting.
Indigenous communities, peoples and nations:Social groups, with unique characteristics andidentities, that historically existed before thedevelopment of the dominant societal group in acountry or territory [SE2].
Indirect GHG emissions for imported energy: GHGemissions that occur at the point of generatingpower that is supplied by a third party in the form ofelectricity, heat or steam for use in the reportingcompany’s facilities [E1].
Issues: Identified sustainability aspects, benefits orimpacts of a company’s activities.
Local: The use of this term may differ in a reportdepending on the issue being described or indicatorused, and additional context is usually required forclarity. ‘Local’ can be used to narrowly referenceneighbouring communities or the naturalenvironment adjacent to company activities, or toprovide wider reference to national or regionalgeographies.
Loss of primary containment (LOPC): Anunplanned or uncontrolled release of any materialfrom Primary containment, including non-toxic andnon-flammable materials (e.g. steam, hotcondensate, nitrogen, compressed CO2 orcompressed air) [HS5].
Lost time illness: An Occupational illness thatresulted in an Employee or Contractor fatality orLost workday [HS3].
Lost time illness rate: The aggregate number ofEmployee or Contractor Lost time illnesses that haveoccurred within the company’s Workforce during astated period of time, reported as a rate (frequency)per million hours worked during the same timeperiod [HS3].
Lost time injury: An Occupational injury thatresulted in an Employee or Contractor fatality orLost workday [HS3].
Lost time injury rate: The aggregate number ofEmployee or Contractor Lost time injuries that haveoccurred within the company’s Workforce during astated period of time, reported as a rate (frequency)per million hours worked during the same timeperiod [HS3].
Lost workday: A severity classification for anOccupational injury or an Occupational illnessincident that resulted in a person being unfit forwork on any day after the occurrence of theIncident, irrespective of whether work was scheduledfor that day [HS3].
Marketing: The facilities and process steps to supplyproducts from refining to customers, includingdistribution terminals, transportation and retail.
Materiality: A process to determine the Issuesrelevant to the company and its stakeholders forinclusion in its Sustainability reporting, including therelative importance and prominence of each issue.
Methane (CH4): A hydrocarbon compound that isthe primary component of natural gas anddesignated a greenhouse gas [E1, E8].
Near miss: An unplanned on uncontrolled Event orchain of Events that has not resulted in recordableinjury, illness, or physical damage or environmentaldamage but had the potential to do so in othercircumstances [HS3].
Nitrogen oxides (NOx): A general term for nitrogenoxide gases. These are produced by combustionand contribute to the formation of smog and acidrain [E8].
Non-financial reporting: A term synonymous withSustainability reporting. The term ‘non-financial’ isused by some companies to distinguish thesereports from more traditional company financialreports.
Non-governmental organization (NGO): A nonprofit group organized outside of institutionalizedpolitical structures to realize particular socialobjectives or serve particular constituencies.
171
OIL AND GAS INDUSTRY GUIDANCE ON VOLUNTARY SUSTAINABILITY REPORTING
Appen
dix F Glossary
Non-hazardous waste: Waste, other thanHazardous waste, resulting from companyoperations, including process and oil field wastesdisposed of, on site or off site, as well as office,commercial or packaging related wastes [E10].
Normalization: The ratio of a quantitative indicatoroutput (e.g. emissions) to an aggregated measure ofanother output (e.g. oil and gas production orrefinery throughput) [Section 3].
Occupational illness: An Employee or Contractorhealth condition or disorder requiring medicaltreatment due to a workplace Incident, typicallyinvolving multiple exposures to hazardoussubstances or to physical agents. Examples includenoise-induced hearing loss, respiratory disease, andcontact dermatitis [HS3].
Occupational injury: Harm of an Employee orContractor resulting from a single instantaneousworkplace Incident that results in medical treatment(beyond simple first aid), work restrictions, days awayfrom work (lost time) or a Fatality [HS3].
Operating area: An area where business activitiestake place with potential to interact with theadjacent environment [E5].
Operation: A generic term used to denote any kindof business activity involving product-relatedprocesses, such as production, manufacturing andtransport. Note: the term oil and gas operations usedin the Guidance is intended to be broad and inclusiveof other types of product, such as chemicals.
Particulate matter: A complex mixture of smallparticles or droplets such as salts, organic chemicals,metals and soil particles [E8].
Petrochemicals: Chemical products derived from oiland gas.
Pipelines: Construction and use of facilities totransport liquid or gaseous hydrocarbons over longdistances in above-ground, below-ground orunderwater pipes.
Primary containment: The vessel, pipe, barrel,equipment or other barrier that is designed to keepa material within it [E8, HS5].
Primary energy: The energy content of ahydrocarbon fuel or other energy source used toproduce power, usually in the form of electricity,heat or steam [E2].
Process safety: A systematic approach to ensuringthe safe containment of hazardous materials orenergy by applying good design, construction andoperating principles [HS5]. In this Guidance, this termis used synonymously with Asset integrity.
Process safety event: A Recordable Loss of primarycontainment.
Process safety event rate: The number of Processsafety events per 1,000,000 (1 million) work hours(production and drilling work hours only).
Produced water: Water that is brought to thesurface during operations which extracthydrocarbons from oil and gas reservoirs [E9].
Product: Any material of commercial value which isextracted, processed, refined, manufactured ortransported by an oil and gas company.
Product life cycle: The various stages of a Product’sexistence—from procuring the raw materials, tomanufacture, distribution and use of the product, tohow it is disposed of or recycled at the end of itsusefulness [HS4].
Product stewardship: The process of addressingand communicating health, safety andenvironmental risks associated with oil and gasproducts [HS4].
Production: the activities of a company to extractnaturally occurring fossil fuel resources.
Recordable: A type of Event, Incident, injury, illness,release or other outcome which has beendetermined to meet or exceed definitions, criteria orthresholds for inclusion and classification in reporteddata.
Recovered hydrocarbons: The amount of spilledhydrocarbons removed from the environmentthrough short-term spill response activities. It doesnot include longer-term remediation or oil whichevaporates or burns [E9].
Refining: Operating plant and processes to convertextracted hydrocarbons (crude oil, condensates andnatural gas) into fuel, lubricants and other productsfor marketing to customers.
IPIECA • API • IOGP
172
App
endi
x F
Glo
ssar
y
Renewable energy: Primary energy sources that areconstantly replenished by natural processesincluding solar, hydro, geothermal and wind power,as well as biomass [E2, E3].
Reporting: Disclosing relevant information and datato internal and external stakeholders such asmanagement, Employees, governments, regulators,shareholders, the general public, local communitiesor specific interest groups.
Reporting boundary: A defined list of organizationalunits based on a company’s entities, assets andBusiness activities from which information isConsolidated for reporting an Indicator [Appendix A].
Resettlement: Voluntary or involuntary relocation ofindividuals or communities due to land userequirements associated with industry operations[SE3].
Reused, recycled or recovered waste: Waste froman industrial or commercial process that is notdisposed of, but beneficially used again in the sameor another process [E10].
Risk: The combination of likelihood (frequency) andseverity (consequence) of potential adverse impacts,from actions or events, on the environment or people.
Safety Data Sheet (SDS): Information provided onhazards, risks, handling, storage and emergencymeasures for users of a chemical product [HS4].
Secondary containment: An impermeable physicalbarrier specifically designed to prevent leakage ofmaterials into the environment that have breachedprimary containment [E9].
Shipping: Transport of oil or gas by ocean, sea orriver using specifically designed vessels.
Significance: A judgement determined by thecompany on whether a specific aspect, impact,event, action or other type of outcome of acompany’s activities or performance is sufficientlyimportant in terms of management and/orreporting. The judgement may be informed by anumber of factors such as the extent of actual orpotential consequences, local stakeholder concerns,regulatory or legal exposure, or risk/impactassessment processes.
Note: in this guidance, ‘significant’ applies toindividual, usually localized, outcomes whereas‘material’ applies to an entire issue which can be
informed by multiple outcomes across the entirecompany and reflects the issue’s relevance to thecompany’s management and stakeholders overall. Asignificant localized impact, such as a major safetyincident, can result in a material issue for thecompany as a whole (or affect the materiality of anexisting issue).
Spill to the environment: Any unintended releaseof liquids or solids associated with current operation,from Primary containment or Secondarycontainment, into the environment.
Stakeholders: People that affect, or are affected by,company activities or operations (e.g. customers,shareholders, management, Employees, Suppliers,local communities, advocacy groups andgovernment).
Subcontractors: Secondary Contractors who arecontracted by a supplier (and not by the reportingcompany directly) to perform some or all of thesupplier’s contractual obligations to the reportingcompany.
Sulphur dioxide (SO2): An emission that resultsprimarily from the combustion of sulphur inhydrocarbons and contributes to acid rain and otherair quality problems [E8].
Supplier: A third-party organization paid by thecompany under contract to provide goods and/orservices.
Supply chain: Entire network of entities, directly orindirectly interlinked and/or interdependent inserving the same consumer or customer with goodsand/or services.
Sustainability reporting: Defined, for this Guidance,as reporting on the range of environmental, healthand safety, social, and economic issues and impactsthat relate to oil and gas company activities.Companies may use a variety of other terms for thistype of reporting, such as non-financial reporting,corporate responsibility, corporate citizenship, orenvironmental, social and governance.
Total recordable illness rate: The aggregate numberof Employee or Contractor Occupational illnessesthat are recordable and have occurred within thecompany’s Workforce during a stated period of time,reported as a rate or frequency per million hoursworked during the same time period [HS3].
173
OIL AND GAS INDUSTRY GUIDANCE ON VOLUNTARY SUSTAINABILITY REPORTING
Appen
dix F Glossary
Total recordable injury rate: The aggregate numberof Employee or Contractor Occupational injuries thatare recordable and have occurred within thecompany’s workforce during a stated period of time,reported as a rate or frequency per million hoursworked during the same time period [HS3].
Upstream: Activities and/or operations involving theexploration, development, and production of oil andgas.
Venting: The controlled release of gases in theatmosphere. The gases might be natural gas orother hydrocarbon vapours, water vapour and othergases, such as carbon dioxide, separated in theprocessing of oil or natural gas [E4].
Volatile organic compounds (VOCs): Organiccompounds, excluding methane, which vaporize inthe atmosphere and may participate inphotochemical reactions [E8].
Waste: Material (solid or liquid) intended to bedisposed of, reused, recycled or recovered eitheron site or off site, that is the result of companyoperations [E10].
Waste disposal: Final placement or destruction, onsite or off site, of Waste under proper process andauthority with no intention to retrieve [E10].
Workforce: All people undertaking work activitiesmanaged by a company, which can includeEmployees, Contractors and others as specified inthe company’s report.
IPIECA • API • IOGP
174
App
endi
x F
Glo
ssar
y

IPIECA is the global oil and gas industry association for environmental and social issues. It develops, shares andpromotes good practices and knowledge to help the industry improve its environmental and socialperformance, and is the industry’s principal channel of communication with the United Nations.
Through its member-led working groups and executive leadership, IPIECA brings together the collectiveexpertise of oil and gas companies and associations. Its unique position within the industry enables its membersto respond effectively to key environmental and social issues.
5th floor, 209-215 Blackfriars Road, London SE1 8NL, United KingdomTelephone: +44 (0)20 7633 2388 E-mail: [email protected] Web: www.ipieca.org @IPIECA IPIECA
© IPIECA/API/IOGP 2015 All rights reserved.
The American Petroleum Institute is the primary trade association in the United States representing the oil andnatural gas industry, and the only one representing all segments of the industry.
Representing one of the most technologically advanced industries in the world, API’s membership includes morethan 400 corporations involved in all aspects of the oil and gas industry, including exploration and production,refining and marketing, marine and pipeline transportation and service and supply companies to the oil andnatural gas industry. API is headquartered in Washington, D.C. and has offices in 27 state capitals and providesits members with representation on state issues in 33 states. API provides a forum for all segments of the oil andnatural gas industry to pursue public policy objectives and advance the interests of the industry. API undertakesin-depth scientific, technical and economic research to assist in the development of its positions, and developsstandards and quality certification programmes used throughout the world. As a major research institute, APIsupports these public policy positions with scientific, technical and economic research.
1220 L Street NW, Washington DC, 20005-4070, USATelephone: +1 202 682 8000 Internet: www.api.org
IOGP represents the upstream oil and gas industry before international organizations including the InternationalMaritime Organization, the United Nations Environment Programme (UNEP) Regional Seas Conventions andother groups under the UN umbrella. At the regional level, IOGP is the industry representative to the EuropeanCommission and Parliament and the OSPAR Commission for the North East Atlantic. Equally important is IOGP’srole in promulgating best practices, particularly in the areas of health, safety, the environment and socialresponsibility.
London office 5th Floor, 209–215 Blackfriars Road, London SE1 8NL, United KingdomTelephone: +44 (0)20 3763 9700 E-mail: [email protected] Internet: www.iogp.org
Brussels officeBoulevard du Souverain 165, 4th Floor, B-1160 Brussels, BelgiumTelephone: +32 (0)2 566 9150 E-mail: [email protected] Internet: www.iogp.org