Embed Size (px)
Citation preview
Oil and gas exploration and appraisal
Borders & Southern Petroleum PlcAnnual report and accounts 2013
Bord
ers & S
ou
thern
Petroleu
m P
lc An
nu
al rep
ort a
nd
acco
un
ts 20
13

47 48 49 50 51 52 53
59 60 61
018 019 020
62 63 64
71 72 73
35
36 37 38
39 40 41
23 24 25 26 27 28 29
About us
In this reportStrategic report
Chairman’s statement 02
Our business model 04
Operations review 06
Our strategy 08
Principal risks and uncertainties 10
Corporate responsibility 11
Governance
Corporate governance 12
Board of directors 13
Directors’ report 14
Remuneration Committee report 17
Financial statements
Independent auditor’s report 18
Consolidated statement of comprehensive income 20
Consolidated statement of financial position 21
Consolidated statement of changes in equity 22
Company statement of financial position 23
Company statement of changes in equity 24
Consolidated statement of cash flows 25
Company statement of cash flows 26
Notes to the financial statements 27
Corporate directory 44
Borders & Southern is an independent oil and gas exploration company. Headquartered in London, the Company’s principal area of activity is in the Falkland Islands.
The Company holds a 100% operated interest in three Production licences covering an area of nearly 10,000 square kilometres.
In 2012 Borders & Southern made a significant gas condensate discovery with its first exploration well. The company is currently working towards the appraisal of this discovery along with further exploration of the surrounding area.

Strategic report Governance Financial statements
Annual report and accounts 2013 | Borders & Southern Petroleum Plc 01
Exploration and appraisal drilling in the South Atlantic
47 48 49 50 51 52 53
59 60 61
018 019 020
62 63 64
71 72 73
35
36 37 38
39 40 41
23 24 25 26 27 28 29
Darwin gas condensate discovery
Toroa
Stebbing
For all the up-to-date share price information and latest news, visit www.bordersandsouthern.com

Borders & Southern Petroleum Plc | Annual report and accounts 201302
Chairman’s statementwith Harry Dobson, Non-executive Chairman
Our ongoing technical evaluation of Darwin has increased our confidence in the quality of the discovery.
2013 was a very active year for the Company as we drove forward the technical evaluation of our Darwin gas condensate discovery and initiated a programme to bring partners into our Licences to help fund the next phase of appraisal and exploration drilling. Whilst we have been really encouraged by the ongoing technical assessment of Darwin, which has confirmed the quality of the discovery, we are frustrated that the farmout process is taking longer than originally anticipated.
We believe that this is a reflection of the current commercial environment in the international E&P sector. Whilst the oil price has remained relatively stable, the industry has lacked positive news stories. Exploration success has been limited, mid-sized companies (and the majors) are in restructuring mode and onshore US shale plays have attracted a significant proportion of the available capital. In the UK, the AIM Oil & Gas index – a good proxy for international early stage E&P – fell for the third year in a row in 2013, along with many fully listed independents. Our challenge has been to attract the significant capital resources we need to a remote area outside of current industry hot spots such as Africa.
That said, we have had a good response to the farmout and have been extremely encouraged by other companies’ views on the sub-surface data, endorsing our own interpretations. Darwin appears to be a relatively simple discovery with good quality reservoir. We have been very close to completing a farmout, having negotiated commercial terms, only for transactions to break down at the last minute due to external factors unrelated to the project. Needless to say, we will only close a farmout transaction on terms we believe will deliver full value to all of our shareholders.
In the last quarter of 2013, in anticipation of closing out a farmout, we initiated a rig search for a harsh environment, deep water rig for the next drilling campaign. When our farmout negotiations broke down we passed over the lead for the rig contract negotiations to our Falkland Islands rig consortium partners. Even though we will not have secured a partner prior to the signature of the rig contract, we will be able to join the consortium at a later stage. We remain confident
that a suitable partner will be secured and that we will participate in a 2015 drilling programme to appraise Darwin.
From an operations point of view we safely acquired additional 3D seismic data in 2013. The objective of the survey was to track the Darwin reservoir over nearby prospects that had previously been mapped on 2D data. The fast track data has been received and interpreted and early signs are that amplitude anomalies, that represent hydrocarbons on the Darwin structure, can be seen on other prospects. At this stage we are careful not to reach conclusions too soon and have just commenced assessing prospects and their associated risks using the final processed 2013 data and newly reprocessed 2008 seismic data.
Looking forward, following the interpretation of the new data, we plan to release an updated assessment of Darwin’s recoverable resource and in due course provide some comments on the Lower Cretaceous prospects along trend from Darwin. Our main focus however continues to be on the farmout and we will report to shareholders as soon as an agreement has been reached. Our balance sheet remains strong and we have enough funds to undertake all necessary work in the interim.
Harry DobsonNon-executive Chairman19 May 2014

Strategic report Governance Financial statements
Annual report and accounts 2013 | Borders & Southern Petroleum Plc 03
“ The Darwin discovery is a relatively simple structure with a good quality reservoir”
The Darwin reservoir comprises quartz rich, shallow marine sands. Seismic data indicates they are laterally continuous across both fault blocks. Darwin West is structurally higher than Darwin East and may contain additional reservoir intervals not penetrated by the discovery well.
Geo-schematic diagram of reservoir intervals at Darwin West. The top yellow unit represents the main reservoir interval encountered by the Darwin East well. The lower two units represent potential reservoir intervals that have been identified on the seismic data (the dashed line represents the shared fluid contact). All units exhibit amplitude conformance to structure.
If these additional reservoir intervals can be proven by future appraisal wells, it could lead to an increase in the total recoverable resource.
South-north seismic line through Darwin West.
Borders & Southern Petroleum Plc | Annual report and accounts 201304
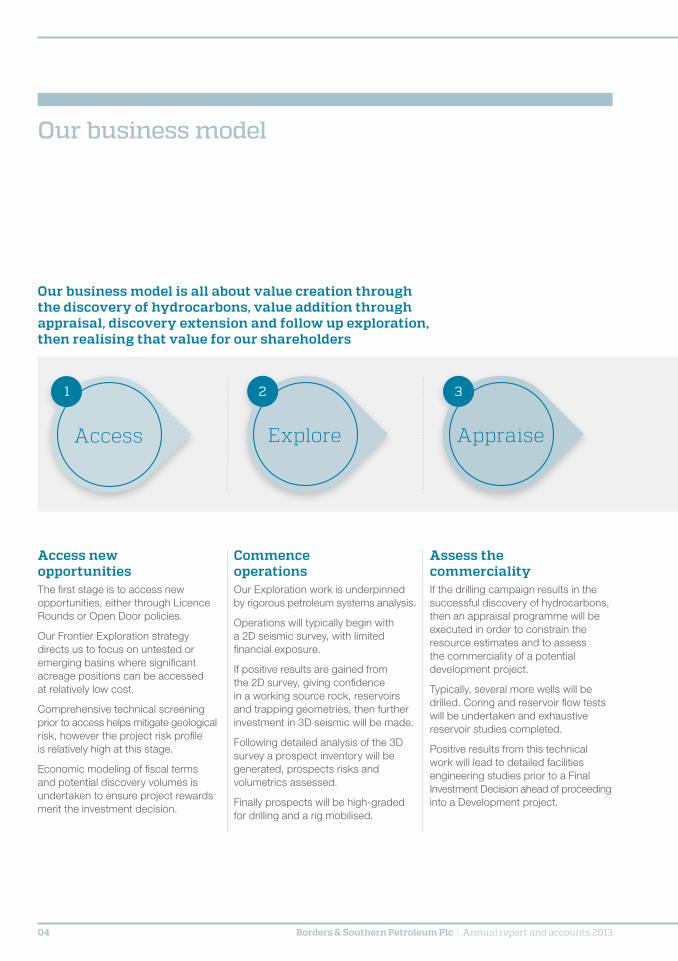
Our business model
Access
1
Explore
2
Appraise
3
Our business model is all about value creation through the discovery of hydrocarbons, value addition through appraisal, discovery extension and follow up exploration, then realising that value for our shareholders
Access new opportunitiesThe first stage is to access new opportunities, either through Licence Rounds or Open Door policies.
Our Frontier Exploration strategy directs us to focus on untested or emerging basins where significant acreage positions can be accessed at relatively low cost.
Comprehensive technical screening prior to access helps mitigate geological risk, however the project risk profile is relatively high at this stage.
Economic modeling of fiscal terms and potential discovery volumes is undertaken to ensure project rewards merit the investment decision.
Commence operationsOur Exploration work is underpinned by rigorous petroleum systems analysis.
Operations will typically begin with a 2D seismic survey, with limited financial exposure.
If positive results are gained from the 2D survey, giving confidence in a working source rock, reservoirs and trapping geometries, then further investment in 3D seismic will be made.
Following detailed analysis of the 3D survey a prospect inventory will be generated, prospects risks and volumetrics assessed.
Finally prospects will be high-graded for drilling and a rig mobilised.
Assess the commercialityIf the drilling campaign results in the successful discovery of hydrocarbons, then an appraisal programme will be executed in order to constrain the resource estimates and to assess the commerciality of a potential development project.
Typically, several more wells will be drilled. Coring and reservoir flow tests will be undertaken and exhaustive reservoir studies completed.
Positive results from this technical work will lead to detailed facilities engineering studies prior to a Final Investment Decision ahead of proceeding into a Development project.

Strategic report Governance Financial statements
Annual report and accounts 2013 | Borders & Southern Petroleum Plc 05
Accrete
4
Monetise
5
Build a strong positionOnce a working petroleum system has been demonstrated through the discovery of hydrocarbons, the objective will be to maximise the acreage position and add value to the asset.
Near field targets will be tested to extend the discovery and exploration will continue focusing on analogue prospects within the prospect inventory.
Alternative play types will also be tested in order to assess the overall value of the acreage.
Maximise asset valuePartial monetisation can occur at all stages of the business cycle. Partners can be brought into a project soon after Access or during the Exploration, Appraisal and Accrete phases in order to help fund further work.
But maximum value will be obtained following the Appraisal and Accrete phases.
B&S believes its core skills lie in the pre-development phase of the Exploration and Production cycle and will seek to monetise pre-production or partially monetise and retain a lower interest non-operated role through production.
p08
Read about our business model in action in our strategy

Borders & Southern Petroleum Plc | Annual report and accounts 201306
Operations reviewwith Howard Obee and Peter Fleming
Chief Executive’s statementFollowing a successful year in 2012, during which we made the Darwin gas condensate discovery, the objectives of the past year were partially to increase our understanding of the discovery but primarily to secure a technically competent and financially strong partner. We have made significant strides forward with the technical work, but have yet to sign a farmout agreement. The process is ongoing and it remains our central focus.
The year commenced with the acquisition of new 3D seismic data. PGS were awarded the contract for both acquisition and processing. The survey was completed safely and within budget. In total, 1,025 square kilometres were acquired in the area immediately to the north of our existing 3D data, which had been acquired in 2008. Our aim was to enhance our 2D based interpretation to track the Darwin Lower Cretaceous reservoir over adjacent look-alike prospects, gain more information on the deeper untested plays and prospects (such as Sulivan and Stokes) and to reduce the overall risk profile of our prospect inventory.
A fast track processed product has already been received and interpreted. Initial interpretations indicate that the Darwin reservoir does indeed extend north-eastwards over the next fault blocks. In addition, we have identified another potential reservoir unit stratigraphically slightly younger than the Darwin reservoir. This interval does not occur over Darwin East or Darwin West, only clipping the edge of the older survey. We currently interpret this younger horizon to represent laterally continuous shallow marine sands similar to Darwin’s reservoir.
Amplitude anomalies are observed over previous mapped prospects: Covington, Childs and Clarke. However, it is too early to assess whether these anomalies represent hydrocarbons. The final processed data is required for us to undertake detailed analysis, but this is now with us and a full interpretation has commenced. Reprocessing of the 2008 3D survey occurred at the same time as the new survey processing. This has allowed the two surveys to be merged into one, giving us a total 2,517 square kilometres of 3D seismic data. This will allow us to directly compare the amplitude response of proven hydrocarbons at Darwin East with the amplitudes mapped on nearby prospects. We can already see the quality of the combined data is excellent. We will report further when the work has been completed.
Reservoir engineering studies of the discovery continued during the year. Considerable effort has been made to develop geologically and petrophysically more sophisticated reservoir models in order to better assess the recoverable volumes of condensate. As we have previously reported, our current mid case recoverable resource estimate is 200 million barrels of condensate. A potential development would involve six production wells and four gas re-injection wells, having stripped out the liquids. Our intention is to update the estimated recoverable resource, incorporating the new engineering studies and an evaluation of the reprocessed 3D.
Strategic report Governance Financial statements
Annual report and accounts 2013 | Borders & Southern Petroleum Plc 07
The Board and senior management remain completely focused on securing partners so that we can accelerate the appraisal of Darwin and the exploration of the adjacent areas.
Planning for the next drilling campaign has commenced with initial well designs completed and coring and well testing programmes defined. Our current plan is to target two locations on Darwin West and one on Darwin East. This should provide sufficient information to assess the commerciality of the discovery. Final decisions on the appraisal well programme will be made once partners have been brought into the Licence.
The Company reported a loss for the year of $3.0 million compared to a loss of $1.3 million for the previous year. This largely reflects the decrease in finance income. Administrative expense decreased slightly to $2.8 million. During the year a further $28.9 million was invested with a large part of this going into a new 3D seismic acquisition programme and the reprocessing of our existing 3D data. At the end of the year the Company held cash and cash equivalents of $23.3 million. This is held in short term treasury deposits, both in dollars and sterling. The cash reserves are sufficient to cover forward overhead costs and all necessary short-term technical studies. However, in order to finance the next drilling campaign, partners will be necessary.
Our share price performance during the year has been disappointing. This partially reflects the state of the oil and gas sector, particularly our peer group of exploration–led, AIM listed companies but it also reflects the delay in bringing a partner into our Licences. The market has given us little credit for making what we believe is a significant condensate discovery. The Board and Senior Management remain completely focused on securing partners so that we can accelerate the appraisal of Darwin and exploration of the adjacent areas in order to deliver value to our shareholders.
Key Performance IndicatorsDuring 2013 the Company’s KPIs were to complete the 3D acquisition, progress the farmout process and further develop the reservoir model for the Darwin discovery. The 3D was acquired during the year and the reservoir model has been enhanced. As noted elsewhere, the farmout process was not concluded during the year and is ongoing.
At this stage the Company does not consider financial KPIs appropriate.
Howard Obee Peter FlemingChief Executive Finance Director19 May 2014

Borders & Southern Petroleum Plc | Annual report and accounts 201308
Our strategy
Our long-term strategy is in place and we are making excellent progress
Access
1
Explore
2
Appraise
3
Accrete
4
Monetise
5
Our progress to date
AccessBorders & Southern was formed in 2004 with the goal of making significant hydrocarbon discoveries in frontier basins.
Our strategy is to identify opportunities, preferably in a non-competitive situation, where we can licence large tracts of acreage with potentially multiple play types and prospects. Our focus is on frontier or emerging basins where we could demonstrate the presence of a regional source rock.
Our idea in the Falkland Islands was to test the area to the south of the Islands where folds and tilted fault blocks were identified on sparsely spaced vintage regional seismic lines. Although no structures could be mapped, the fold belt trend had good potential to deliver large-scale structural traps.
Our regional work gave us confidence in a good quality Late Jurassic to Early Cretaceous marine source rock. We were prepared to take risk on finding a good quality reservoir.
In November 2004 we applied for and were successfully awarded an area of approximately 20,000 square kilometres, covering a large section of the east-west trending fold belt.
Our initial work commitment was relatively low and financial exposure modest, reflecting the relatively high risk nature of the project. As our knowledge of the geology grew we were able to progressively reduce the technical risks and increase our investment in the area.
ExplorationExploration commenced in 2005 with the acquisition of 2,862 kilometres of non-exclusive 2D seismic data. This data proved that numerous robust structural traps existed within our acreage. However, the 2D data did not provide enough insight into potential hydrocarbon charged reservoir.
At that stage the technical risk had been reduced, but not enough to merit drilling. Funds were raised and 1,492 square kilometres of 3D seismic was acquired in 2008. It was this data that significantly reduced the risk profile of the project giving us confidence on the presence of reservoir and hydrocarbons due to compelling direct hydrocarbon indicators – an excellent flat spot was noted on the Darwin structure.
Following a major fund raising, a rig contract was signed with the objective of testing two independent prospects: Darwin and Stebbing. In 2012 success was achieved with the Company’s first exploration well, Darwin East, which resulted in a rich 46-49 API condensate discovery. Our current mid case recoverable resource estimate is 200 million barrels. The second well, Stebbing, had very strong hydrocarbon shows but failed to reach its main target due to high pressures making it unsafe to continue to drill.
Having proven the petroleum system, the next stage was to determine whether the successful play type occurred over nearby prospects. In 2013 a new 1,025 square kilometres 3D seismic survey was acquired. The results of the survey will soon be available.
Strategic report Governance Financial statements
Annual report and accounts 2013 | Borders & Southern Petroleum Plc 09
Access
1
Explore
2
Appraise
3
Accrete
4
Monetise
5
What’s next?
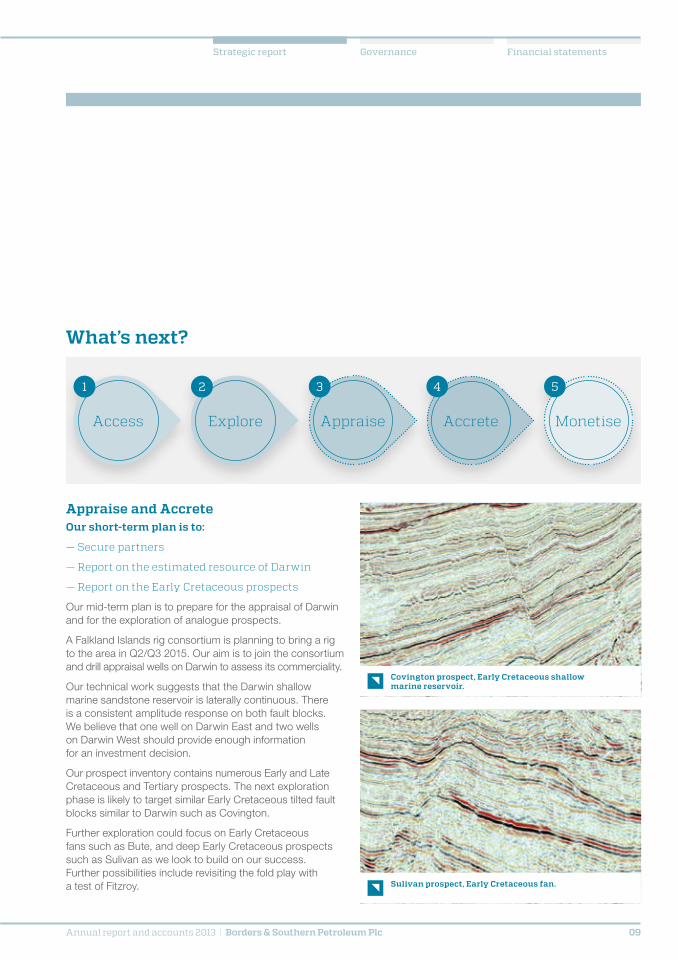
Appraise and AccreteOur short-term plan is to:
— Secure partners
— Report on the estimated resource of Darwin
— Report on the Early Cretaceous prospects
Our mid-term plan is to prepare for the appraisal of Darwin and for the exploration of analogue prospects.
A Falkland Islands rig consortium is planning to bring a rig to the area in Q2/Q3 2015. Our aim is to join the consortium and drill appraisal wells on Darwin to assess its commerciality.
Our technical work suggests that the Darwin shallow marine sandstone reservoir is laterally continuous. There is a consistent amplitude response on both fault blocks. We believe that one well on Darwin East and two wells on Darwin West should provide enough information for an investment decision.
Our prospect inventory contains numerous Early and Late Cretaceous and Tertiary prospects. The next exploration phase is likely to target similar Early Cretaceous tilted fault blocks similar to Darwin such as Covington.
Further exploration could focus on Early Cretaceous fans such as Bute, and deep Early Cretaceous prospects such as Sulivan as we look to build on our success. Further possibilities include revisiting the fold play with a test of Fitzroy.
Covington prospect, Early Cretaceous shallow marine reservoir.
Sulivan prospect, Early Cretaceous fan.

Borders & Southern Petroleum Plc | Annual report and accounts 201310
Principal risks and uncertainties
Effective risk managementThe Company regularly monitors its key risks and reviews its management processes and systems to ensure that they are both effective and consistent with good industry practice. This is particularly the case during operations where, as we demonstrated during the 2012 drilling campaign, the Company is required to comply with strict regulations within The Falkland Islands.
Risk status key (*RS refers to risk status)
Risk increase Risk unchanged Risk decrease
Risk Nature of risk RS* Risk mitigation
Exploration There are inherent technical and commercial risks in exploration. For example, exploration or appraisal wells can have positive, negative or inconclusive results
Throughout the Company’s history, management has been careful to employ experienced technical people and acquire data so that rigorous analysis can be undertaken to understand and mitigate risk before incurring drilling expenditures
Health, safety,
security and
environment
incidents
The Company’s licences are located in a remote, environmentally sensitive, deep-water environment with the commensurate risks to health, safety and security of the people involved and to the environment
Before and during operations, the Company has developed and followed detailed project specific health, safety and environmental management procedures
Funding risk The Company is dependent on funding both from its internal resources, existing and new shareholders and from incoming partners to fund future exploration programmes
The Company has and continues to work with investors and potential partners to ensure that it has the necessary funds going forward. The next step for the Company is to bring in a partner to help fund the appraisal programme and further exploration and the Company is confident of achieving this
Oil price The commercial viability of the Company’s projects is partially dependent upon the oil price
Whilst we cannot do anything to influence the oil price, we model our projects using conservative assumptions to ensure they are robust to changes in circumstances
Reliance on
key personnel
The Company is reliant upon a small number of employees to undertake day to day operations
The Company has service contracts with key employees that provide for notice periods that would allow sufficient time to source replacements. Also, the Company has a wide network of consultants and other industry experience to call upon for specific areas of expertise and during operations
Supply chain The Falkland Islands are geographically isolated and, because of political issues, most of the Company’s supplies need to be sourced from the UK
The Company demonstrated during the previous drilling campaign that all the necessary supplies could both be sourced from the UK and brought to the Company’s operations without disruption to the Company’s operations
Availability of drilling
rigs and services
There is a very limited number of harsh environment, deep-water drilling rigs that the Company requires for its operations
The rig market conditions appear to be improving as more new builds come into the market to increase supply and oil companies reduce their exploration expenditure and, in doing so, demand for drilling rigs
Country risk There is a ongoing dispute over the sovereign status of The Falkland Islands and there is the potential for the fiscal terms of the country to change
The British Government strongly supports the Falkland Islanders’ rights for self-determination. A recent referendum recorded an overwhelming majority to continue as a UK overseas territory. The current fiscal terms are internationally competitive to attract investment into the sector and we have no reason to believe that they will change in the foreseeable future

Strategic report Governance Financial statements
Annual report and accounts 2013 | Borders & Southern Petroleum Plc 11
Corporate responsibility
The Company is committed to conducting its business in a responsible and sustainable way. During operations, a particular focus is on environmental impact and health and safety to ensure that these operations are conducted using best practice systems and policies. It is a priority of the Company’s board and management that all employees, contractors and suppliers have the necessary experience and competence and are made aware of the policies and procedures developed for operations.
Given the geographic isolation and small size of The Falkland Islands, whilst we use local suppliers as much as possible, it was impossible to use local suppliers for all of the goods and services required. As a result, many of the required goods and services are brought into The Falklands during operations. However, as we demonstrated during the 2012 drilling campaign, considerable effort is made to share logistics and resources with other operators in the area to greatly limit cost and the environmental and social impact.
The Company introduced policies to comply with the Bribery Act before the 2012 drilling campaign. These policies remain in place and are reviewed regularly.
The Strategic report on pages 2 to 11 is issued and signed on behalf of the board by:
Howard ObeeChief Executive19 May 2014
Corporate responsibility at a glance
— Committed to conducting business in a responsible and sustainable way
— Strong focus on limiting and mitigating environmental impact
— Practising good health and safety is of paramount concern
— Local suppliers and service providers are contracted where possible
— Efforts are made to share logistics and resources with other regional operators
Surf Bay, Falkland Islands
Borders & Southern Petroleum Plc | Annual report and accounts 201312
Corporate governance
The Company is committed to applying robust corporate governance practices across all its activities. The Company does not fully comply with the UK Corporate Governance Code (“the Code”) but the board has sought to comply with a number of the provisions of the Code in so far as it considers them to be appropriate to a company of its size and nature.
The boardThe Company recognises that an effective board facilitates the efficient discharge of the duties imposed by law on directors and contributes to the delivery of the Company’s strategic objectives. Accordingly, the Company has structured its board so that it:
— has a proper understanding of, and the competencies to deal with, the current and emerging issues in the Company’s business;
— exercises independent judgement; and
— effectively reviews and challenges management’s performance and exercises independent judgement.
The board currently comprises the Chairman, two executive directors and two non-executive directors. Each of the executive directors has extensive knowledge of the oil and gas industry combined with general business and financial skills. All of the directors bring independent judgement to bear on issues of strategy, performance, resources, key appointments and standards. The board meets regularly throughout the year and all the necessary information is supplied to the directors on a timely basis to enable them to discharge their duties effectively.
Role of the ChairmanHarry Dobson was appointed Chairman of the Company at its inception. As Chairman, he is responsible for the effective running of the board and for ensuring that it plays a constructive role in the development of the Company. Together with the Chief Executive Officer, the Chairman sets and runs the agenda for board meetings.
Roles of the non-executive directorsThe non-executive directors bring a wealth of business experience to the board and its committees. They provide independent views on the Company’s performance, operations and strategy.
All directors retire by rotation.
Remuneration CommitteeThe board has a Remuneration Committee comprising the Chairman and two non-executive directors. The members of the Remuneration Committee and their attendance at meetings of the Remuneration Committee during 2013 are detailed in the Directors’ report.
The strategy of the Remuneration Committee is to ensure the Company:
— remunerates fairly and responsibly. Borders & Southern’s policy is to ensure that the level and composition of remuneration for all employees is competitive and reasonable;
— includes both short-term and long-term performance-based components in its remuneration practices; and
— benchmarks its remuneration with comparable companies.
Audit CommitteeThe board has an Audit Committee comprising the Chairman and two non-executive directors. The members of the Audit Committee and their attendance at meetings of the Audit Committee during 2013 are detailed in the Directors’ report.
The objectives of the Audit Committee are to ensure:
— the accuracy and integrity of the financial statements and related disclosures;
— the keeping of adequate books, records and internal controls;
— the auditor is independent and is qualified and its performance is monitored; and
— compliance with legal and regulatory requirements.
InsurancesThe Company has taken out directors’ and officers’ insurance that provides insurance cover for all directors and senior officers of the Company. This insurance is reviewed annually.

GovernanceStrategic report Financial statements
Annual report and accounts 2013 | Borders & Southern Petroleum Plc 13
Board of directors
Harry Dobson (Non-executive Chairman)
Harry Dobson is a former investment banker and senior partner of Yorkton Securities. He currently engages in various merchant banking and venture capital activities in North America and Europe, and has acted as Chairman of a number of resource companies (including American Pacific Mining Company Inc. and Lytton Minerals Limited). He is currently the Chairman of Kirkland Lake Gold Inc. (a Toronto Stock Exchange and AIM quoted company) and Rambler Metals and Mining plc (an AIM quoted company). He is experienced in the organisation and funding of resource projects, including those located in inaccessible locations.
Harry is Chairman of the Remuneration Committee and sits on the Audit Committee.
Peter Fleming (Finance Director)
Peter Fleming has over 22 years of upstream oil and gas experience, the majority of which was gained at BHP Billiton both in London and Melbourne. Whilst at BHP Billiton, Peter held senior positions in exploration and business development, investment evaluation, acquisitions and disposals and strategic planning. Prior to joining BHP Billiton, he worked for Bridge Oil and Banque Indosuez. He holds masters degrees in business administration and finance.
Stephen Posford (Non-executive Director)
Stephen Posford was a partner of stockbrokers W.Greenwell and Co. In 1986, he became Managing Director of Greenwell Montagu Gilt Edged and in 1989 moved to Salomon Brothers to head up its proprietary trading department in London. He then became Salomon Brothers European CEO before retiring in 1996.
Stephen sits on the Audit and Remuneration Committees.
Nigel Hurst-Brown (Non-executive Director)
Since qualifying as a Chartered Accountant, Nigel Hurst-Brown has pursued a career in fund management. From 1986 to 1990 he was Chairman of Lloyd’s Investment Managers. In 1990 he moved to Mercury Asset Management as a main board Director and following Mercury’s acquisition by Merrill Lynch in 1997 became a Managing Director of Merrill Lynch Investment Managers. Currently he is Chief Executive of Hotchkis and Wiley (UK) Limited and a member of the Executive Committee of its US parent Hotchkis and Wiley Capital Management LLC and non-executive Chairman of Central Asia Metals plc.
Nigel is Chairman of the Audit Committee and sits on the Remuneration Committee.
Howard Obee (Chief Executive)
Howard Obee was appointed Chief Executive when the Company was incorporated in June 2004. He has a PhD in structural geology from Imperial College and has spent 29 years in the oil industry, initially with BP (1985–1992), and subsequently with BHP Billiton (1992–2004). He trained as an exploration geologist and has held numerous technical and commercial roles, incorporating exploration, new ventures, strategic planning and business development. He has experience of executing seismic and drilling programmes in frontier basins, including those in deep water.
1
32
4 5
1 2
43
5
Borders & Southern Petroleum Plc | Annual report and accounts 201314
Directors’ report for the year ended 31 December 2013
The directors present their report and the audited consolidated financial statements for the year ended 31 December 2013.
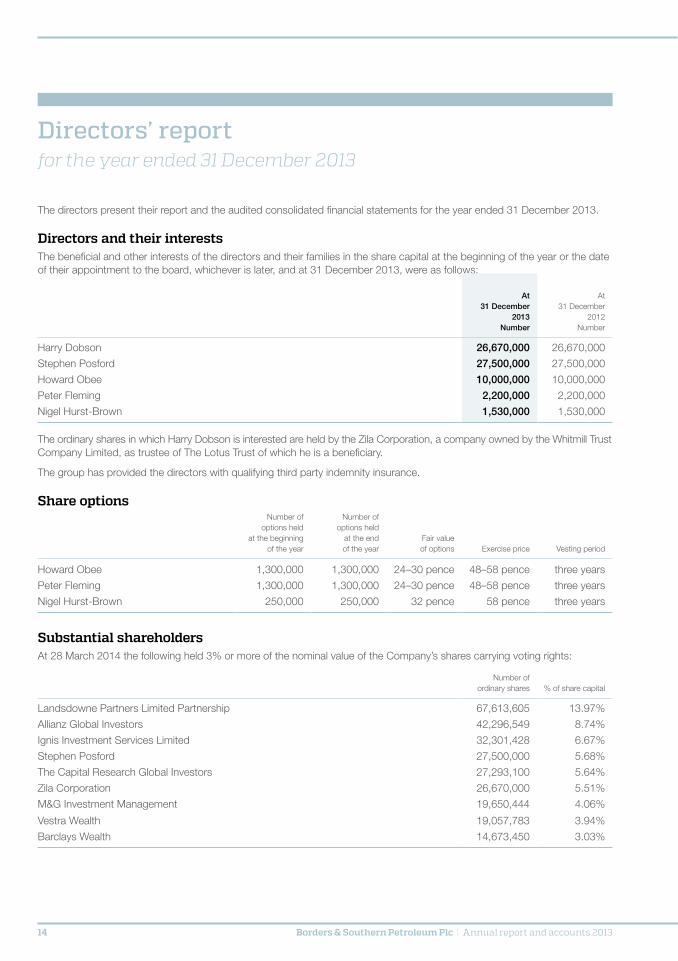
Directors and their interests The beneficial and other interests of the directors and their families in the share capital at the beginning of the year or the date of their appointment to the board, whichever is later, and at 31 December 2013, were as follows:
At 31 December
2013Number
At 31 December
2012Number
Harry Dobson 26,670,000 26,670,000
Stephen Posford 27,500,000 27,500,000
Howard Obee 10,000,000 10,000,000
Peter Fleming 2,200,000 2,200,000
Nigel Hurst-Brown 1,530,000 1,530,000
The ordinary shares in which Harry Dobson is interested are held by the Zila Corporation, a company owned by the Whitmill Trust Company Limited, as trustee of The Lotus Trust of which he is a beneficiary.
The group has provided the directors with qualifying third party indemnity insurance.
Share optionsNumber of
options held at the beginning
of the year
Number of options held
at the endof the year
Fair value of options Exercise price Vesting period
Howard Obee 1,300,000 1,300,000 24–30 pence 48–58 pence three years
Peter Fleming 1,300,000 1,300,000 24–30 pence 48–58 pence three years
Nigel Hurst-Brown 250,000 250,000 32 pence 58 pence three years
Substantial shareholdersAt 28 March 2014 the following held 3% or more of the nominal value of the Company’s shares carrying voting rights:
Number ofordinary shares % of share capital
Landsdowne Partners Limited Partnership 67,613,605 13.97%
Allianz Global Investors 42,296,549 8.74%
Ignis Investment Services Limited 32,301,428 6.67%
Stephen Posford 27,500,000 5.68%
The Capital Research Global Investors 27,293,100 5.64%
Zila Corporation 26,670,000 5.51%
M&G Investment Management 19,650,444 4.06%
Vestra Wealth 19,057,783 3.94%
Barclays Wealth 14,673,450 3.03%

GovernanceStrategic report Financial statements
Annual report and accounts 2013 | Borders & Southern Petroleum Plc 15
DomicileThe parent company of the group, Borders & Southern Petroleum Plc, is a public limited company and is registered and domiciled in England.
Results and dividendsThe group statement of comprehensive income is set out on page 20 and shows the result for the year.
The directors do not recommend the payment of a dividend (2012: $nil).
Review of business and future developments A review on the operations of the group is contained in the Operations review on pages 6 to 7.
Post reporting date eventsThere are no events that have occurred since the year end which require reporting.
Charitable and political donationsThere were no political or charitable contributions made by the Company or the group during the year (2012: $nil).
Financial instrumentsDetails of the use of financial instruments by the Company and its subsidiary undertaking are contained in note 20 of the financial statements.
Directors’ responsibilitiesThe directors are responsible for preparing the Directors’ report, the Strategic report and the financial statements in accordance with applicable law and regulations.
Company law requires the directors to prepare financial statements for each financial year. Under that law the directors have prepared the group and Company financial statements in accordance with International Financial Reporting Standards (IFRSs) as adopted by the European Union and elected to prepare the company financial statements in accordance with IFRSs. Under company law the directors must not approve the financial statements unless they are satisfied that they give a true and fair view of the state of affairs of the group and Company and of the profit or loss of the group for that period. The directors are also required to prepare financial statements in accordance with the rules of the London Stock Exchange for companies trading securities on AIM.
In preparing these financial statements, the directors are required to:
— select suitable accounting policies and then apply them consistently;
— make judgements and accounting estimates that are reasonable and prudent;
— state whether they have been prepared in accordance with IFRSs as adopted by the European Union, subject to any material departures disclosed and explained in the financial statements;
— prepare the financial statements on the going concern basis unless it is inappropriate to presume that the Company will continue in business.
The directors are responsible for keeping adequate accounting records that are sufficient to show and explain the Company’s transactions and disclose with reasonable accuracy at any time the financial position of the Company and enable them to ensure that the financial statements comply with the requirements of the Companies Act 2006. They are also responsible for safeguarding the assets of the Company and hence for taking reasonable steps for the prevention and detection of fraud and other irregularities.

Borders & Southern Petroleum Plc | Annual report and accounts 201316
Directors’ report continuedfor the year ended 31 December 2013
Number of board meetings during the year
Attendance BoardRemuneration
CommitteeAudit
Committee
Harry Dobson 3 1 2
Howard Obee 3 — —
Peter Fleming 3 — —
Nigel Hurst-Brown 3 1 2
Stephen Posford 3 1 2
Website publicationThe directors are responsible for ensuring the Annual report and the financial statements are made available on a website. Financial statements are published on the Company’s website in accordance with legislation in the United Kingdom governing the preparation and dissemination of financial statements, which may vary from legislation in other jurisdictions. The maintenance and integrity of the Company’s website is the responsibility of the directors. The directors’ responsibility also extends to the ongoing integrity of the financial statements contained therein.
AuditorAll of the current directors have taken all the steps that they ought to have taken to make themselves aware of any information needed by the Company’s auditor for the purposes of its audit and to establish that the auditor is aware of that information. The directors are not aware of any relevant audit information of which the auditor is unaware.
BDO LLP has expressed its willingness to continue in office and a resolution to reappoint them will be proposed at the annual general meeting.
By order of the board
William SlackCompany Secretary19 May 2014
GovernanceStrategic report Financial statements
Annual report and accounts 2013 | Borders & Southern Petroleum Plc 17
Remuneration Committee report
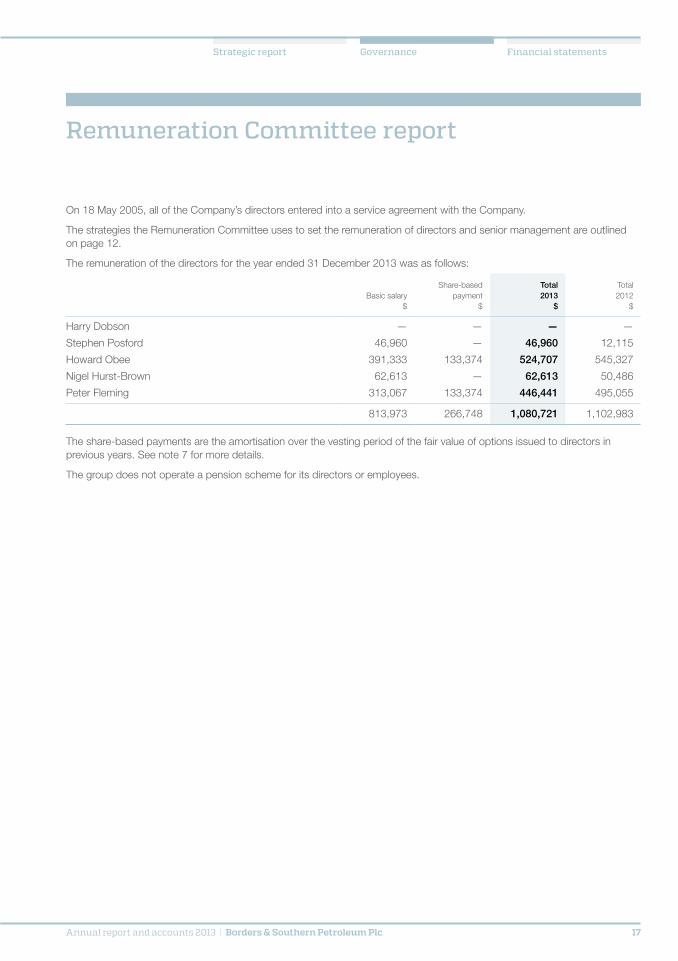
On 18 May 2005, all of the Company’s directors entered into a service agreement with the Company.
The strategies the Remuneration Committee uses to set the remuneration of directors and senior management are outlined on page 12.
The remuneration of the directors for the year ended 31 December 2013 was as follows:
Basic salary$
Share-based payment
$
Total2013
$
Total 2012
$
Harry Dobson — — — —
Stephen Posford 46,960 — 46,960 12,115
Howard Obee 391,333 133,374 524,707 545,327
Nigel Hurst-Brown 62,613 — 62,613 50,486
Peter Fleming 313,067 133,374 446,441 495,055
813,973 266,748 1,080,721 1,102,983
The share-based payments are the amortisation over the vesting period of the fair value of options issued to directors in previous years. See note 7 for more details.
The group does not operate a pension scheme for its directors or employees.

Borders & Southern Petroleum Plc | Annual report and accounts 201318
Independent auditor’s report to the members of Borders & Southern Petroleum Plc
We have audited the financial statements of Borders & Southern Petroleum Plc for the year ended 31 December 2013 which comprise the consolidated statement of comprehensive income, the consolidated statement of financial position, the consolidated statement of changes in equity, the company statement of financial position, the company statement of changes in equity, the consolidated statement of cash flows, the company statement of cash flows and the related notes. The financial reporting framework that has been applied in their preparation is applicable law and International Financial Reporting Standards (IFRSs) as adopted by the European Union and, as regards the parent company financial statements, as applied in accordance with the provisions of the Companies Act 2006.
This report is made solely to the company’s members, as a body, in accordance with Chapter 3 of Part 16 of the Companies Act 2006. Our audit work has been undertaken so that we might state to the company’s members those matters we are required to state to them in an auditor’s report and for no other purpose. To the fullest extent permitted by law, we do not accept or assume responsibility to anyone other than the company and the company’s members as a body, for our audit work, for this report, or for the opinions we have formed.
Respective responsibilities of directors and auditorsAs explained more fully in the statement of directors’ responsibilities, the directors are responsible for the preparation of the financial statements and for being satisfied that they give a true and fair view. Our responsibility is to audit and express an opinion on the financial statements in accordance with applicable law and International Standards on Auditing (UK and Ireland). Those standards require us to comply with the Financial Reporting Council’s (FRC’s) Ethical Standards for Auditors.
Scope of the audit of the financial statementsA description of the scope of an audit of financial statements is provided on the FRC’s website at www.frc.org.uk/auditscopeukprivate.
Opinion on financial statementsIn our opinion:
— the financial statements give a true and fair view of the state of the group’s and the parent company’s affairs as at 31 December 2013 and of the group’s loss for the year then ended;
— the group financial statements have been properly prepared in accordance with IFRSs as adopted by the European Union;
— the parent company financial statements have been properly prepared in accordance with IFRSs as adopted by the European Union and as applied in accordance with the provisions of the Companies Act 2006; and
— the financial statements have been prepared in accordance with the requirements of the Companies Act 2006.
Opinion on other matters prescribed by the Companies Act 2006In our opinion the information given in the Strategic report and Directors’ report for the financial year for which the financial statements are prepared is consistent with the financial statements.

GovernanceStrategic report Financial statements
Annual report and accounts 2013 | Borders & Southern Petroleum Plc 19
Matters on which we are required to report by exceptionWe have nothing to report in respect of the following matters where the Companies Act 2006 requires us to report to you if, in our opinion:
— adequate accounting records have not been kept by the parent company, or returns adequate for our audit have not been received from branches not visited by us; or
— the parent company financial statements are not in agreement with the accounting records and returns; or
— certain disclosures of directors’ remuneration specified by law are not made; or
— we have not received all the information and explanations we require for our audit.
Anthony Perkins (senior statutory auditor)For and on behalf of BDO LLP, statutory auditorLondonUnited Kingdom19 May 2014
BDO LLP is a limited liability partnership registered in England and Wales (with registered number OC305127).

Borders & Southern Petroleum Plc | Annual report and accounts 201320
Consolidated statement of comprehensive incomefor the year ended 31 December 2013
Note2013
$2012
$
Administrative expenses (2,819,593) (3,125,685)
Loss from operations 2 (2,819,593) (3,125,685)
Finance income 8 71,163 2,023,224
Finance expense 8 (207,096) —
Loss before tax (2,955,526) (1,102,461)
Tax expense 9 — (178,043)
Loss for the year and total comprehensive loss for the year attributable to owners of the parent (2,955,526) (1,280,504)
Basic and diluted loss per share (see note 3) (0.6) cents (0.3) cents
The notes on pages 27 to 43 form part of the financial statements.
GovernanceStrategic report Financial statements
Annual report and accounts 2013 | Borders & Southern Petroleum Plc 21
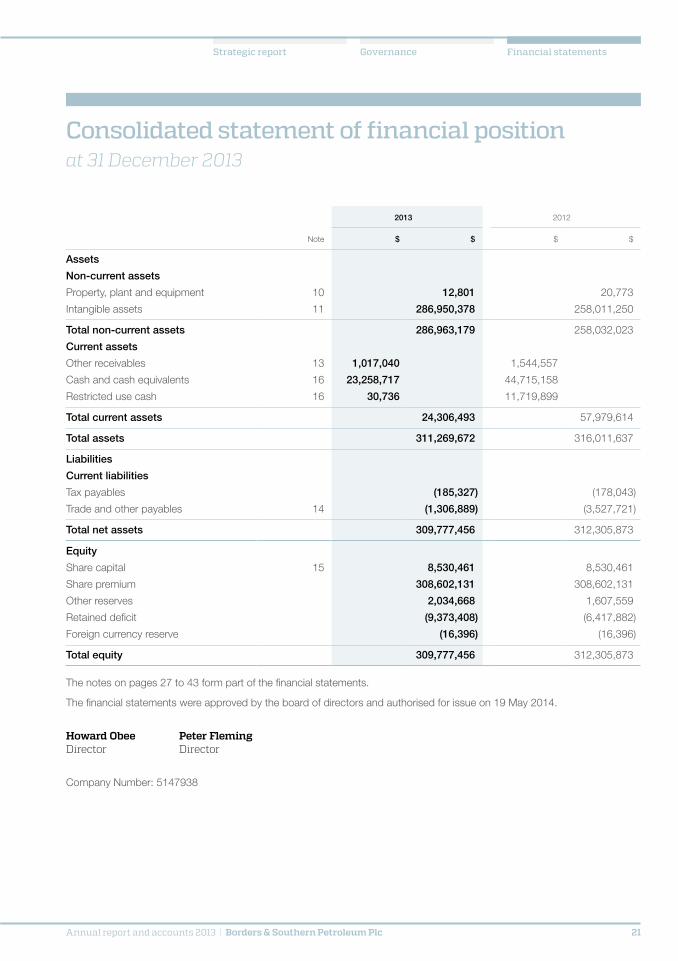
Consolidated statement of financial positionat 31 December 2013
2013 2012
Note $ $ $ $
Assets
Non-current assets
Property, plant and equipment 10 12,801 20,773
Intangible assets 11 286,950,378 258,011,250
Total non-current assets 286,963,179 258,032,023
Current assets
Other receivables 13 1,017,040 1,544,557
Cash and cash equivalents 16 23,258,717 44,715,158
Restricted use cash 16 30,736 11,719,899
Total current assets 24,306,493 57,979,614
Total assets 311,269,672 316,011,637
Liabilities
Current liabilities
Tax payables (185,327) (178,043)
Trade and other payables 14 (1,306,889) (3,527,721)
Total net assets 309,777,456 312,305,873
Equity
Share capital 15 8,530,461 8,530,461
Share premium 308,602,131 308,602,131
Other reserves 2,034,668 1,607,559
Retained deficit (9,373,408) (6,417,882)
Foreign currency reserve (16,396) (16,396)
Total equity 309,777,456 312,305,873
The notes on pages 27 to 43 form part of the financial statements.
The financial statements were approved by the board of directors and authorised for issue on 19 May 2014.
Howard Obee Peter FlemingDirector Director
Company Number: 5147938

Borders & Southern Petroleum Plc | Annual report and accounts 201322
Consolidated statement of changes in equity for the year ended 31 December 2013
Share capital
$
Share premium
reserve$
Other reserves
$
Retained deficit
$
Foreigncurrency
reserve$
Total$
Balance at 1 January 2012 7,675,453 238,034,095 1,046,565 (5,137,378) (16,396) 241,602,339
Total comprehensive loss for the year — — — (1,280,504) — (1,280,504)
Issue of shares 855,008 73,158,509 — — — 74,013,517
Share issue costs — (2,590,473) — — — (2,590,473)
Recognition of share-based payments — — 560,994 — — 560,994
Balance at 31 December 2012 8,530,461 308,602,131 1,607,559 (6,417,882) (16,396) 312,305,873
Total comprehensive loss for the year — — — (2,955,526) — (2,955,526)
Recognition of share-based payments — — 427,109 — — 427,109
Balance at 31 December 2013 8,530,461 308,602,131 2,034,668 (9,373,408) (16,396) 309,777,456
The following describes the nature and purpose of each reserve within owners’ equity:
Reserve Description and purposeShare capital This represents the nominal value of shares issued.
Share premium Amount subscribed for share capital in excess of nominal value.
Other reserves Fair value of options issued.
Retained deficit Cumulative net gains and losses recognised in the consolidated statement of comprehensive income.
Foreign currency reserves Differences arising on change of presentation and functional currency to US Dollars.
The notes on pages 27 to 43 form part of the financial statements.
GovernanceStrategic report Financial statements
Annual report and accounts 2013 | Borders & Southern Petroleum Plc 23
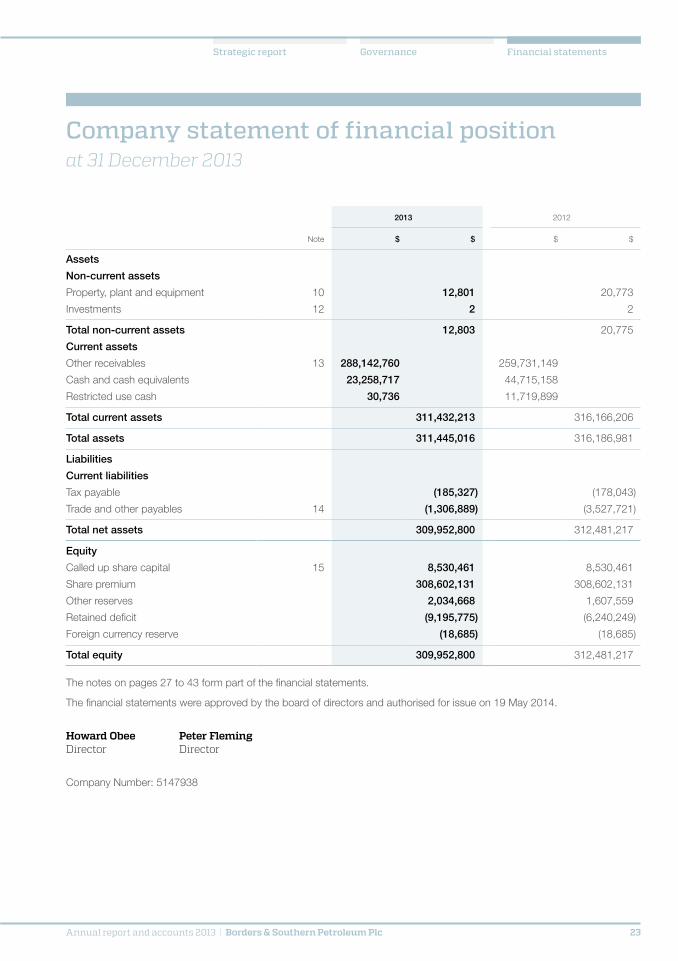
Company statement of financial positionat 31 December 2013
2013 2012
Note $ $ $ $
Assets
Non-current assets
Property, plant and equipment 10 12,801 20,773
Investments 12 2 2
Total non-current assets 12,803 20,775
Current assets
Other receivables 13 288,142,760 259,731,149
Cash and cash equivalents 23,258,717 44,715,158
Restricted use cash 30,736 11,719,899
Total current assets 311,432,213 316,166,206
Total assets 311,445,016 316,186,981
Liabilities
Current liabilities
Tax payable (185,327) (178,043)
Trade and other payables 14 (1,306,889) (3,527,721)
Total net assets 309,952,800 312,481,217
Equity
Called up share capital 15 8,530,461 8,530,461
Share premium 308,602,131 308,602,131
Other reserves 2,034,668 1,607,559
Retained deficit (9,195,775) (6,240,249)
Foreign currency reserve (18,685) (18,685)
Total equity 309,952,800 312,481,217
The notes on pages 27 to 43 form part of the financial statements.
The financial statements were approved by the board of directors and authorised for issue on 19 May 2014.
Howard Obee Peter FlemingDirector Director
Company Number: 5147938

Borders & Southern Petroleum Plc | Annual report and accounts 201324
Company statement of changes in equityfor the year ended 31 December 2013
Share capital
$
Share premium
reserve$
Other reserves
$
Retained deficit
$
Foreign currency
reserve$
Total$
Balance at 1 January 2012 7,675,453 238,034,095 1,046,565 (4,959,745) (18,685) 241,777,683
Total comprehensive loss for the year — — — (1,280,504) — (1,280,504)
Issue of shares 855,008 73,158,509 — — — 74,013,517
Share issue costs — (2,590,473) — — — (2,590,473)
Recognition of share-based payments — — 560,994 — — 560,994
Balance at 31 December 2012 8,530,461 308,602,131 1,607,559 (6,240,249) (18,685) 312,481,217
Total comprehensive loss for the year — — — (2,955,526) — (2,955,526)
Recognition of share-based payments — — 427,109 — — 427,109
Balance at 31 December 2013 8,530,461 308,602,131 2,034,668 (9,195,775) (18,685) 309,952,800
The following describes the nature and purpose of each reserve within owners’ equity:
Reserve Description and purposeShare capital This represents the nominal value of shares issued.
Share premium Amount subscribed for share capital in excess of nominal value.
Other reserves Fair value of options issued.
Retained deficit Cumulative net gains and losses recognised in the consolidated statement of comprehensive income.
Foreign currency reserves Differences arising on change of presentation and functional currency to US Dollars.
The notes on pages 27 to 43 form part of the financial statements.

GovernanceStrategic report Financial statements
Annual report and accounts 2013 | Borders & Southern Petroleum Plc 25
Consolidated statement of cash flows for the year ended 31 December 2013
2013 2012
Note $ $ $ $
Cash flow from operating activities
Loss before tax (2,955,526) (1,102,461)
Adjustments for:
Depreciation 9,248 4,000
Share-based payment 427,109 560,994
Net finance costs/(income) 135,933 (2,023,224)
Realised foreign exchange (losses)/gains 49,243 532,591
Cash flows from operating activities before changes in working capital (2,333,993) (2,028,100)
Decrease/(increase) in other receivables 527,517 (454)
(Decrease)/increase in trade and other payables (2,087,083) 11,248
Net cash inflow/(outflow) from operating activities (3,893,559) (2,017,306)
Cash flows used in investing activities
Interest received 71,163 225,545
Purchase of intangible assets (28,939,128) (191,181,369)
Purchase of property, plant and equipment (1,276) (4,144)
Net cash used in investing activities (28,869,241) (190,959,968)
Cash flows from financing
Proceeds from issue of shares — 71,423,044
Cash flows from financing activities — 71,423,044
Net decrease in cash and cash equivalents (32,762,800) (121,554,230)
Cash and cash equivalents at the beginning of the year 16 56,435,057 176,724,199
Exchange gain/(loss) on cash and cash equivalents (382,804) 1,265,088
Cash and cash equivalents and cash held in escrow at the end of the year 23,289,453 56,435,057
Cash and cash equivalents 23,258,717 44,715,158
Restricted use cash 30,736 11,719,899
Borders & Southern Petroleum Plc | Annual report and accounts 201326
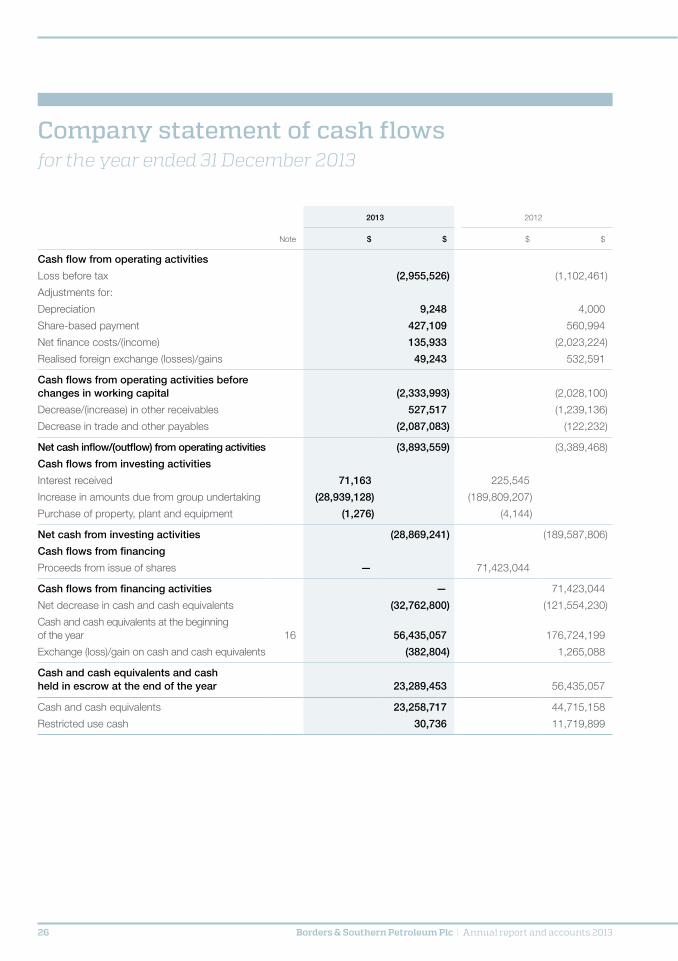
Company statement of cash flows for the year ended 31 December 2013
2013 2012
Note $ $ $ $
Cash flow from operating activities
Loss before tax (2,955,526) (1,102,461)
Adjustments for:
Depreciation 9,248 4,000
Share-based payment 427,109 560,994
Net finance costs/(income) 135,933 (2,023,224)
Realised foreign exchange (losses)/gains 49,243 532,591
Cash flows from operating activities before changes in working capital (2,333,993) (2,028,100)
Decrease/(increase) in other receivables 527,517 (1,239,136)
Decrease in trade and other payables (2,087,083) (122,232)
Net cash inflow/(outflow) from operating activities (3,893,559) (3,389,468)
Cash flows from investing activities
Interest received 71,163 225,545
Increase in amounts due from group undertaking (28,939,128) (189,809,207)
Purchase of property, plant and equipment (1,276) (4,144)
Net cash from investing activities (28,869,241) (189,587,806)
Cash flows from financing
Proceeds from issue of shares — 71,423,044
Cash flows from financing activities — 71,423,044
Net decrease in cash and cash equivalents (32,762,800) (121,554,230)
Cash and cash equivalents at the beginning of the year 16 56,435,057 176,724,199
Exchange (loss)/gain on cash and cash equivalents (382,804) 1,265,088
Cash and cash equivalents and cash held in escrow at the end of the year 23,289,453 56,435,057
Cash and cash equivalents 23,258,717 44,715,158
Restricted use cash 30,736 11,719,899

GovernanceStrategic report Financial statements
Annual report and accounts 2013 | Borders & Southern Petroleum Plc 27
Notes to the financial statements for the year ended 31 December 2013
1 Accounting policiesBasis of preparationThe principal accounting policies adopted in the preparation of the financial statements are set out below and have been consistently applied to all years presented.
These consolidated and parent financial statements have been prepared in accordance with International Financial Reporting Standards (IFRSs and IFRIC interpretations) issued by the International Accounting Standards Board (IASB) as adopted by the European Union and with those parts of the Companies Act 2006 applicable to companies preparing their accounts under IFRS.
The consolidated financial statements have been prepared under the historical cost convention.
New and revised standards effective for 31 December 2013 year end There were no new standards issued in respect of the year ended 31 December 2013 that were relevant for adoption by the group.
New and revised standards issued but not effective for 31 December 2013 year end There were no new standards issued but not effective for the year ended 31 December 2013 that would be relevant for adoption by the group.
Basis of consolidationWhere the Company has the power, either directly or indirectly, to govern the financial and operating policies of another entity or business so as to obtain benefits from its activities, it is classified as a subsidiary. The consolidated financial statements present the results of the Company and its subsidiaries (“the group”) as if they formed a single entity. Intercompany transactions and balances between group companies are therefore eliminated in full.
Loss for the financial yearThe Company has taken advantage of the exemption allowed under Section 408 of the Companies Act 2006 and has not presented its own income statement in these financial statements. The group loss for the year includes a loss after tax of $2,955,526 (2012: loss after tax of $1,280,504) which is dealt with in the financial statements of the parent company.
The Company’s investments in subsidiariesThe parent company’s subsidiaries are carried at cost less amounts provided for impairment.
Finance incomeFinance income consists of interest on cash deposits and foreign exchange gains.
Segment reportingOperating segments are reported in a manner consistent with the internal reporting provided to the chief operating decision-maker. The chief operating decision-maker, who is responsible for allocating resources and assessing performance of the operating segments, has been identified as the board of directors.
Property, plant and equipmentOffice equipment is initially recorded at cost. Depreciation is provided on office equipment so as to write off the cost, less any estimated residual value, over their expected useful economic life as follows:
Office equipment 33 1/3%
Assets are depreciated from the date of acquisition and on a straight line basis.
Borders & Southern Petroleum Plc | Annual report and accounts 201328
Notes to the financial statements continuedfor the year ended 31 December 2013
1 Accounting policies continuedExploration and evaluation expenditureThe group applies the requirements of IFRS 6 Exploration for and evaluation of mineral resources in respect of its exploration and evaluation expenditure. The requirements of IFRS 6 are not applied to expenditure incurred by the group before legal title to explore for and evaluate hydrocarbon resources in a specific area, generally referred to as pre-licence expenditure. Likewise the group do not apply the requirements of IFRS 6 after the point at which the technical feasibility and commercial viability of extracting hydrocarbons are demonstrable.
The costs of exploring for and evaluating hydrocarbon resources are accumulated and capitalised as intangible assets by reference to appropriate cash-generating units (CGU), generally referred to as full cost accounting. Such CGUs have been determined by the group to be a Darwin CGU and a Stebbing CGU and are noted as not being larger than an operating segment as determined in accordance with IFRS 8 Operating segments.
Capitalised exploration and evaluation expenditure may include, amongst other costs, costs of licence acquisition, third party technical services and studies, seismic acquisition, exploration drilling and testing but do not include general overheads. Any property, plant and equipment (PPE) acquired for use in exploration and evaluation activities is classified as property, plant and equipment. However, to the extent that such PPE is consumed in developing an intangible exploration and evaluation asset the amount reflecting that consumption is recorded as part of the cost of the intangible exploration and evaluation asset.
Intangible exploration and evaluation assets are not depreciated and are carried forward, subject to the provisions of the group’s impairment of exploration and evaluation policy, until the technical feasibility and commercial viability of extracting hydrocarbons are demonstrable. At such point exploration and evaluation assets are assessed for impairment and any impairment loss is recognised before reclassification of the assets to a category of property, plant and equipment.
Impairment of exploration and evaluation expenditureThe group’s exploration and evaluation assets are assessed for impairment when facts and circumstances suggest that the carrying amount of the exploration and evaluation assets may exceed the assets recoverable amount.
In accordance with IFRS 6 the group firstly considers the following facts and circumstances in their assessment of whether the group’s exploration and evaluation assets may be impaired:
— whether the period for which the group has the right to explore in a specific area has expired during the period or will expire in the near future, and is not expected to be renewed;
— whether substantive expenditure on further exploration for and evaluation of mineral resources in a specific area is neither budgeted nor planned;
— whether exploration for and evaluation of hydrocarbons in a specific area have not led to the discovery of commercially viable quantities of hydrocarbons and the group has decided to discontinue such activities in the specific area; and
— whether sufficient data exists to indicate that although a development in a specific area is likely to proceed, the carrying amount of the exploration and evaluation assets is unlikely to be recovered in full from successful development or by sale.
If any such facts or circumstances are noted, the group, as a next step, perform an impairment test in accordance with the provisions of IAS 36. In such circumstances the aggregate carrying value of the exploration and evaluations assets is compared against the expected recoverable amount of the CGU. The recoverable amount is the higher of value in use and the fair value less costs to sell.
The group has identified two cash-generating units, a Darwin CGU and a Stebbing CGU. In accordance with the provisions of IFRS 6 the level identified for the purposes of assessing the group’s exploration and evaluation assets for impairment may comprise one or more cash-generating units.
GovernanceStrategic report Financial statements
Annual report and accounts 2013 | Borders & Southern Petroleum Plc 29
1 Accounting policies continuedProvisionsA provision is recognised in the statement of financial position when the group has a present legal or constructive obligation as a result of a past event and it is probable that an outflow of economic benefits will be required to settle the obligation.
Foreign currenciesTransactions in foreign currencies are translated into US Dollars at the exchange rate ruling at the date of the transaction. Monetary assets and liabilities denominated in foreign currencies are translated into US Dollars at the closing rates at the reporting date and the exchange differences are included in the statement of comprehensive income. The functional and presentational currency of the parent and all group companies is the US Dollar.
Operating leasesRentals payable under operating leases are charged to the statement of comprehensive income on a straight line basis over the lease term.
Share-based paymentsThe fair value of employee share option plans is calculated using the Black-Scholes pricing model. Non-employee options granted as part of consideration for services rendered are valued at the fair value of those services. Where information on the fair value of services rendered is not readily available, the fair value is calculated using the Black-Scholes pricing model. In accordance with IFRS 2 Share-based payments the resulting cost is charged to the statement of comprehensive income over the vesting period of the options. The amount of charge is adjusted each year to reflect expected and actual levels of options vesting.
Where equity-settled share options are awarded, the fair value of the options at the date of grant is charged to the statement of comprehensive income over the vesting period. Non-market vesting conditions are taken into account by adjusting the number of equity instruments expected to vest at each reporting date so that, ultimately, the cumulative amount recognised over the vesting period is based on the number of options that eventually vest. Market vesting conditions are factored into the fair value of the options granted.
As long as all other vesting conditions are satisfied, a charge is made irrespective of whether the market vesting conditions are satisfied. The cumulative expense is not adjusted for failure to achieve a market vesting condition.
Where the terms and conditions of options are modified before they vest, the increase in the fair value of the options, measured immediately before and after the modification, is also charged to the consolidated statement of comprehensive income over the remaining vesting period.
Financial instrumentsFinancial instruments are initially recorded at fair value. Subsequent measurement depends on the designation of the instrument, as follows:
— Trade and other receivables are initially recognised at fair value and subsequently at amortised cost using the effective rate of interest, net of allowances for impairment.
— Trade and other payables are initially recognised at fair value and subsequently at amortised cost using the effective rate of interest.
— Financial instruments issued by group companies are treated as equity only to the extent that they do not meet the definition of a financial liability. The group’s and Company’s ordinary shares are all classified as equity instruments.
— Cash and cash equivalents consist of cash at bank on demand and balances on deposit with an original maturity of three months or less. Some of these funds are held in restricted deposits or escrow accounts as security for suppliers to the Company.
Borders & Southern Petroleum Plc | Annual report and accounts 201330
Notes to the financial statements continuedfor the year ended 31 December 2013
1 Accounting policies continuedTaxesThe major components of tax on the profit or loss include current and deferred tax.
Current tax is based upon the profit or loss for the year adjusted for items that are non-assessable or disallowed and is calculated using tax rates that have been enacted, or substantively enacted, by the reporting date.
Tax is charged or credited to the statement of comprehensive income, except where the tax relates to items credited or charged directly to equity, in which case the tax is also dealt within equity.
Deferred tax assets and liabilities are recognised where the carrying amount of an asset or liability in the statement of financial position differs to its tax base.
Recognition of deferred tax assets is restricted to those instances where it is probable that taxable profit will be available against which the difference can be utilised.
The amount of the asset or liability is determined using tax rates that have been enacted or substantively enacted by the reporting date and are expected to apply when deferred tax liabilities and assets are settled or recovered.
Critical accounting estimates and judgements and key sources of estimation uncertaintyThe preparation of the financial statements requires management to make estimates and assumptions that affect the reported amounts of revenues, expenses, assets and liabilities, and the disclosure of contingent liabilities at the date of the financial statements. If in the future such estimates and assumptions, which are based on management’s best judgement at the date of the financial statements, deviate from the actual circumstances, the original estimates and assumptions will be modified as appropriate in the year in which the circumstances change. Where necessary, the comparatives will be reclassified from the previously reported results to take into accounts presentational changes.
Management has made the following judgements which have the most significant effects on the amounts recognised in the financial statements:
Recoverability of exploration and evaluation costsExpenditure is capitalised as an intangible asset by reference to appropriate CGUs and is assessed for impairment when circumstances suggest that the carrying amount may exceed its recoverable value. This assessment involves judgement as to: (i) the timing of future development of the asset; (ii) funding structures and financing costs of development; (iii) commercial development opportunities for extracting value from the asset; and (iv) modelling inputs such as the appropriateness of discount rates, reserve and resource estimates, oil and gas pricing predictions, etc.
Share optionsThe group’s share-based payments were recognised at fair value using a 75% volatility rate based on long-term average standard deviation of the Company’s share price and a 1% risk free rate based on current UK Government bond yields. See note 7.

GovernanceStrategic report Financial statements
Annual report and accounts 2013 | Borders & Southern Petroleum Plc 31
2 Loss from operations2013
$2012
$
Staff costs (note 5) 1,185,338 1,305,596
Share-based payment – equity settled 427,109 560,994
Services provided by the auditor:
Fees payable to the Company’s auditor for the audit of the parent company and consolidated annual accounts 69,250 84,400
Fees payable to the Company’s auditor and its associates for other services:
– Tax services 2,473 14,000
– Extended audit services 61,418 —
Depreciation of office equipment 9,248 4,000
Operating lease expenses – property 294,475 284,338
Foreign exchange loss/(gain) 207,096 (1,797,679)
3 Basic and dilutive loss per share The calculation of the basic and diluted loss per share is based on the loss attributable to ordinary shareholders divided by the weighted average number of shares in issue during the year. The loss for the financial year for the group was $2,955,526 (2012: loss $1,280,504) and the weighted average number of shares in issue for the year was 484,098,484 (2012: 463,145,812). During the year the potential ordinary shares are anti-dilutive and therefore diluted loss per share has not been presented. At the reporting date, there were 6,150,000 (2012: 5,500,000) potentially dilutive ordinary shares being the share options (see note 7).
4 Segment analysisThe Company operates in one operating segment (exploration for oil and gas) and in substantially one geographical market (the Falkland Islands); therefore no additional segmental information is presented.
Of the group’s total non-current assets, the property, plant and equipment is based in the UK and all other non-current assets are located in the Falkland Islands.

Borders & Southern Petroleum Plc | Annual report and accounts 201332
Notes to the financial statements continuedfor the year ended 31 December 2013
5 Staff costsCompany and groupStaff costs (including directors) comprise:
2013$
2012$
Wages and salaries 1,048,773 1,152,106
Employer’s national insurance contribution 136,565 153,490
1,185,338 1,305,596
Share-based payment – equity settled 427,109 446,899
1,612,447 1,752,495
The average number of employees (including directors) employed during the year by the Company was six (2012: six) and for the group was six (2012: six). All employees and directors of the group and the Company are considered to be the key management personnel.
Of the $427,109 (2012: $560,994) share-based payment charge included in the consolidated statement of comprehensive income, $427,109 (2012: $446,899) has been charged in respect of share options granted to staff (including directors) in the current and prior years. The remaining $nil (2012: $114,095) relates to share options granted to external parties; see note 7 for further details.
6 Directors’ emolumentsThe directors’ emoluments for the year are as follows:
2013$
2012$
Directors’ fees 813,973 738,700
Share-based payments – equity settled 266,748 364,283
1,080,721 1,102,983
The fees and share-based payments made to each director are disclosed in the Remuneration Committee report. During the year, the highest paid director received total cash remuneration of $391,333 (2012: $299,587).
In 2009, the group granted to three directors of Borders & Southern Petroleum Plc, for nil consideration, 250,000 share options each, with a total fair value of $374,446. Of this amount $nil (2012: $103,000) has been expensed during the year.
In 2011, the group granted to two directors of Borders & Southern Petroleum Plc, for nil consideration, 1,000,000 share options each, with a total fair value of $774,447. Of this amount $266,748 (2012: $261,283) has been expensed during the year.
GovernanceStrategic report Financial statements
Annual report and accounts 2013 | Borders & Southern Petroleum Plc 33
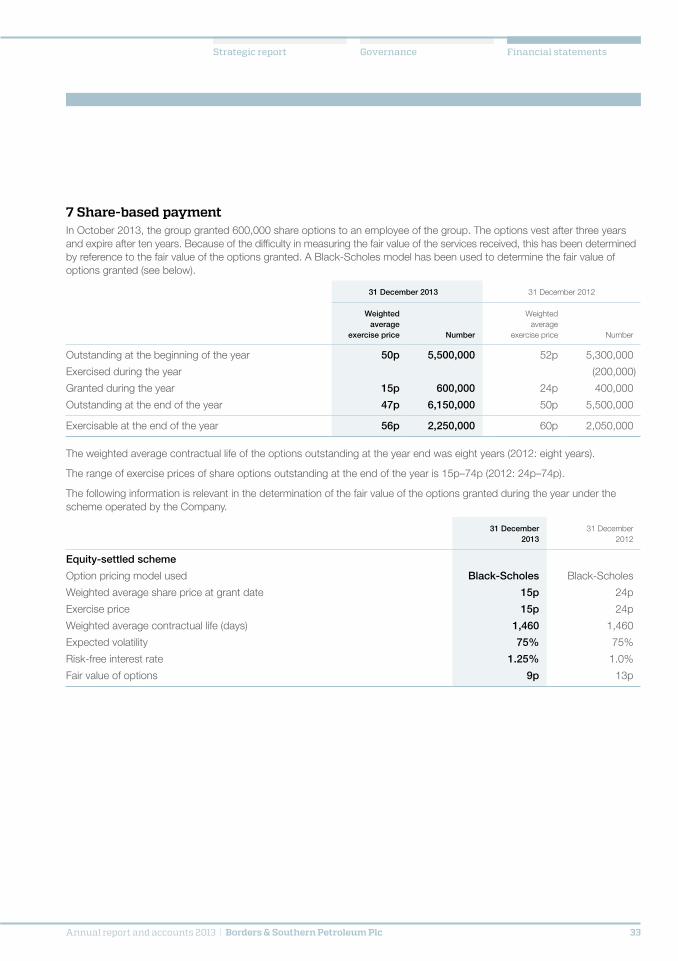
7 Share-based paymentIn October 2013, the group granted 600,000 share options to an employee of the group. The options vest after three years and expire after ten years. Because of the difficulty in measuring the fair value of the services received, this has been determined by reference to the fair value of the options granted. A Black-Scholes model has been used to determine the fair value of options granted (see below).
31 December 2013 31 December 2012
Weighted average
exercise price Number
Weighted average
exercise price Number
Outstanding at the beginning of the year 50p 5,500,000 52p 5,300,000
Exercised during the year (200,000)
Granted during the year 15p 600,000 24p 400,000
Outstanding at the end of the year 47p 6,150,000 50p 5,500,000
Exercisable at the end of the year 56p 2,250,000 60p 2,050,000
The weighted average contractual life of the options outstanding at the year end was eight years (2012: eight years).
The range of exercise prices of share options outstanding at the end of the year is 15p–74p (2012: 24p–74p).
The following information is relevant in the determination of the fair value of the options granted during the year under the scheme operated by the Company.
31 December 2013
31 December 2012
Equity-settled scheme
Option pricing model used Black-Scholes Black-Scholes
Weighted average share price at grant date 15p 24p
Exercise price 15p 24p
Weighted average contractual life (days) 1,460 1,460
Expected volatility 75% 75%
Risk-free interest rate 1.25% 1.0%
Fair value of options 9p 13p
Borders & Southern Petroleum Plc | Annual report and accounts 201334
Notes to the financial statements continuedfor the year ended 31 December 2013
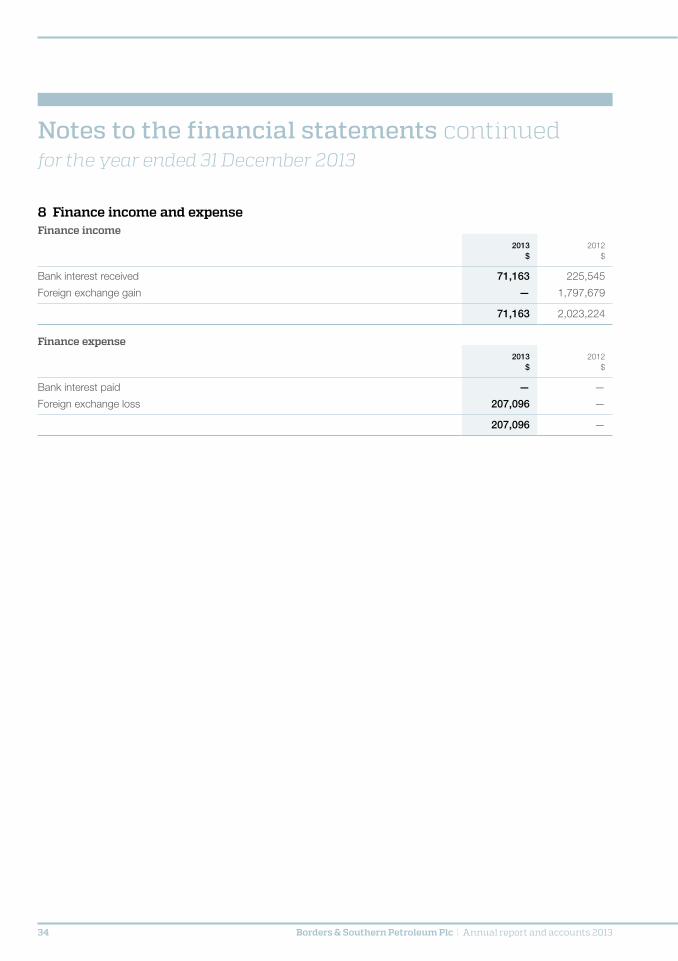
8 Finance income and expenseFinance income
2013$
2012$
Bank interest received 71,163 225,545
Foreign exchange gain — 1,797,679
71,163 2,023,224
Finance expense2013
$2012
$
Bank interest paid — —
Foreign exchange loss 207,096 —
207,096 —
GovernanceStrategic report Financial statements
Annual report and accounts 2013 | Borders & Southern Petroleum Plc 35
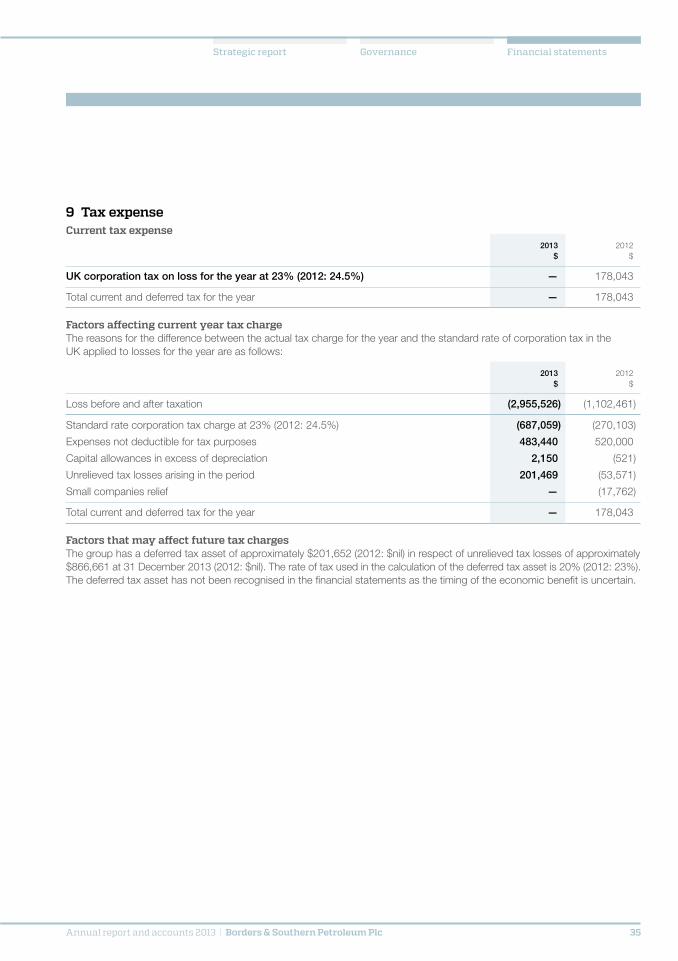
9 Tax expenseCurrent tax expense
2013$
2012$
UK corporation tax on loss for the year at 23% (2012: 24.5%) — 178,043
Total current and deferred tax for the year — 178,043
Factors affecting current year tax chargeThe reasons for the difference between the actual tax charge for the year and the standard rate of corporation tax in the UK applied to losses for the year are as follows:
2013$
2012$
Loss before and after taxation (2,955,526) (1,102,461)
Standard rate corporation tax charge at 23% (2012: 24.5%) (687,059) (270,103)
Expenses not deductible for tax purposes 483,440 520,000
Capital allowances in excess of depreciation 2,150 (521)
Unrelieved tax losses arising in the period 201,469 (53,571)
Small companies relief — (17,762)
Total current and deferred tax for the year — 178,043
Factors that may affect future tax chargesThe group has a deferred tax asset of approximately $201,652 (2012: $nil) in respect of unrelieved tax losses of approximately $866,661 at 31 December 2013 (2012: $nil). The rate of tax used in the calculation of the deferred tax asset is 20% (2012: 23%).The deferred tax asset has not been recognised in the financial statements as the timing of the economic benefit is uncertain.

Borders & Southern Petroleum Plc | Annual report and accounts 201336
Notes to the financial statements continuedfor the year ended 31 December 2013
10 Property, plant and equipmentGroup and company
Office equipment
$
Cost
As at 1 January 2012 107,906
Additions 4,144
As at 31 December 2012 112,050
Depreciation
As at 1 January 2012 87,277
Charge for the year 4,000
As at 31 December 2012 91,277
Net book value
As at 31 December 2012 20,773
As at 31 December 2011 20,629
Office equipment
$
Cost
As at 1 January 2013 112,050
Additions 1,276
As at 31 December 2013 113,326
Depreciation
As at 1 January 2013 91,277
Charge for the year 9,248
As at 31 December 2013 100,525
Net book value
As at 31 December 2013 12,801
GovernanceStrategic report Financial statements
Annual report and accounts 2013 | Borders & Southern Petroleum Plc 37
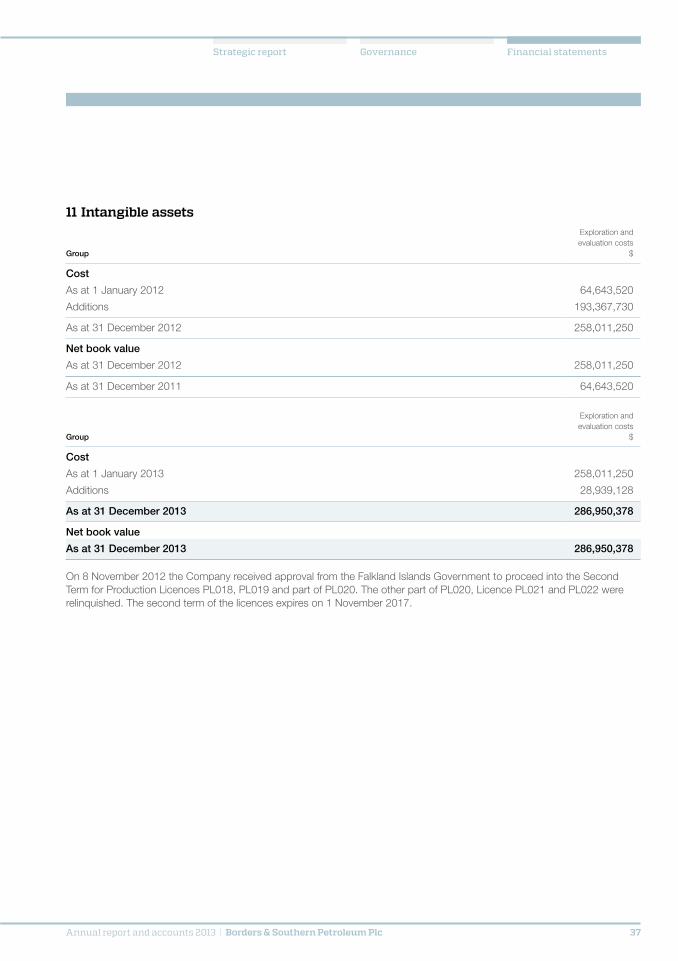
11 Intangible assets
Group
Exploration andevaluation costs
$
Cost
As at 1 January 2012 64,643,520
Additions 193,367,730
As at 31 December 2012 258,011,250
Net book value
As at 31 December 2012 258,011,250
As at 31 December 2011 64,643,520
Group
Exploration andevaluation costs
$
Cost
As at 1 January 2013 258,011,250
Additions 28,939,128
As at 31 December 2013 286,950,378
Net book value
As at 31 December 2013 286,950,378
On 8 November 2012 the Company received approval from the Falkland Islands Government to proceed into the Second Term for Production Licences PL018, PL019 and part of PL020. The other part of PL020, Licence PL021 and PL022 were relinquished. The second term of the licences expires on 1 November 2017.

Borders & Southern Petroleum Plc | Annual report and accounts 201338
Notes to the financial statements continuedfor the year ended 31 December 2013
12 Investments in subsidiary
Company2013
$2012
$
Cost
As at 1 January and 31 December 2 2
Net book value
As at 31 December 2 2
The Company owns the one ordinary £1 subscriber share, being 100% of the issued share capital, in Borders & Southern Falkland Islands Limited. The company was registered in England and its principal activity is oil and gas exploration.
13 Other receivablesGroup Company
2013$
2012$
2013$
2012$
Amounts owed by group undertakings — — 287,125,726 258,186,598
Other receivables 247,392 1,481,056 247,392 1,481,056
Prepayments and accrued income 769,648 63,501 769,642 63,495
1,017,040 1,544,557 288,142,760 259,731,149
All amounts shown under receivables fall due for payment within one year.
Amounts owed by group undertakings are not interest bearing and are payable on demand.
14 Trade and other payablesGroup Company
2013$
2012$
2013$
2012$
Trade payables 612,699 2,013,333 612,699 2,013,333
Other taxes and social security costs 48,403 47,706 48,403 47,706
Accruals and deferred income 645,787 1,466,682 645,787 1,466,682
1,306,889 3,527,721 1,306,889 3,527,721

GovernanceStrategic report Financial statements
Annual report and accounts 2013 | Borders & Southern Petroleum Plc 39
15 Share capital2013 2012
Authorised
750,000,000 ordinary shares of 1 pence each (2012: 750,000,000) 14,926,125 14,926,125
484,098,484 ordinary shares of 1 pence each (2012: 484,098,484) 8,530,461 8,530,461
Allotted, called up and fully paid shares
Brought forward 484,098,484 428,578,404
Shares issued in year — 55,520,080
Carried forward 484,098,484 484,098,484
2013$
2012$
Share capital
Brought forward 8,530,461 7,675,453
Shares issued in year — 855,008
Carried forward 8,530,461 8,530,461
Share premium
Brought forward 308,602,131 238,034,095
Shares issued in year — 70,568,036
Carried forward 308,602,131 308,602,131
16 Cash and cash equivalents and restricted use cash
Group and company2013
$2012
$
Cash available on demand 1,820,722 4,296,872
Cash on deposit 21,437,995 40,418,286
Restricted use cash 30,736 11,719,899
Total 23,289,453 56,435,057
Cash and cash equivalents consist of cash at bank on demand and balances on deposit with an original maturity of three months or less.
Restricted use cash is made up of deposits used as security for funds held in an escrow account in both cases to provide suppliers with security of payment.

Borders & Southern Petroleum Plc | Annual report and accounts 201340
Notes to the financial statements continuedfor the year ended 31 December 2013
17 Related party transactionsCompanyDuring the year Borders & Southern Petroleum Plc paid expenses of $29,939,128 (2012: $193,217,525) on behalf of Borders & Southern Falkland Islands Limited. At the year end $287,125,726 (2012: $258,186,598) was due from the subsidiary.
The employees and directors of the group and the Company are considered to be the key management personnel. There were no transactions between the group, the Company and the key management personnel during the year. The remuneration paid to the key management personnel is disclosed in note 6.
18 Commitments The total future value of minimum lease payments on office property is due as follows:
Land and buildings
2013 $
2012 $
Not later than one year 79,543 148,430
During 2013, the Company entered into an agreement with PGS Geophysical AS for the acquisition of 3D seismic. This seismic was acquired during 2013 and there is $750,000 outstanding under this contract which will be paid during 2014 according to the terms of the contract.
19 Events after the reporting periodThere were no reportable events post reporting date.
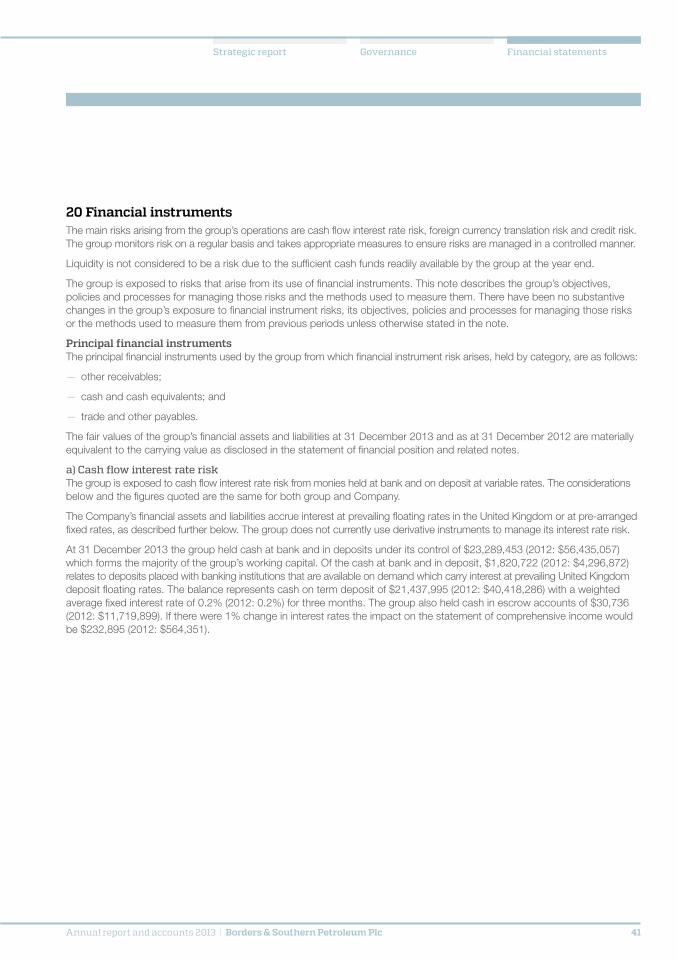
GovernanceStrategic report Financial statements
Annual report and accounts 2013 | Borders & Southern Petroleum Plc 41
20 Financial instrumentsThe main risks arising from the group’s operations are cash flow interest rate risk, foreign currency translation risk and credit risk. The group monitors risk on a regular basis and takes appropriate measures to ensure risks are managed in a controlled manner.
Liquidity is not considered to be a risk due to the sufficient cash funds readily available by the group at the year end.
The group is exposed to risks that arise from its use of financial instruments. This note describes the group’s objectives, policies and processes for managing those risks and the methods used to measure them. There have been no substantive changes in the group’s exposure to financial instrument risks, its objectives, policies and processes for managing those risks or the methods used to measure them from previous periods unless otherwise stated in the note.
Principal financial instrumentsThe principal financial instruments used by the group from which financial instrument risk arises, held by category, are as follows:
— other receivables;
— cash and cash equivalents; and
— trade and other payables.
The fair values of the group’s financial assets and liabilities at 31 December 2013 and as at 31 December 2012 are materially equivalent to the carrying value as disclosed in the statement of financial position and related notes.
a) Cash flow interest rate riskThe group is exposed to cash flow interest rate risk from monies held at bank and on deposit at variable rates. The considerations below and the figures quoted are the same for both group and Company.
The Company’s financial assets and liabilities accrue interest at prevailing floating rates in the United Kingdom or at pre-arranged fixed rates, as described further below. The group does not currently use derivative instruments to manage its interest rate risk.
At 31 December 2013 the group held cash at bank and in deposits under its control of $23,289,453 (2012: $56,435,057) which forms the majority of the group’s working capital. Of the cash at bank and in deposit, $1,820,722 (2012: $4,296,872) relates to deposits placed with banking institutions that are available on demand which carry interest at prevailing United Kingdom deposit floating rates. The balance represents cash on term deposit of $21,437,995 (2012: $40,418,286) with a weighted average fixed interest rate of 0.2% (2012: 0.2%) for three months. The group also held cash in escrow accounts of $30,736 (2012: $11,719,899). If there were 1% change in interest rates the impact on the statement of comprehensive income would be $232,895 (2012: $564,351).
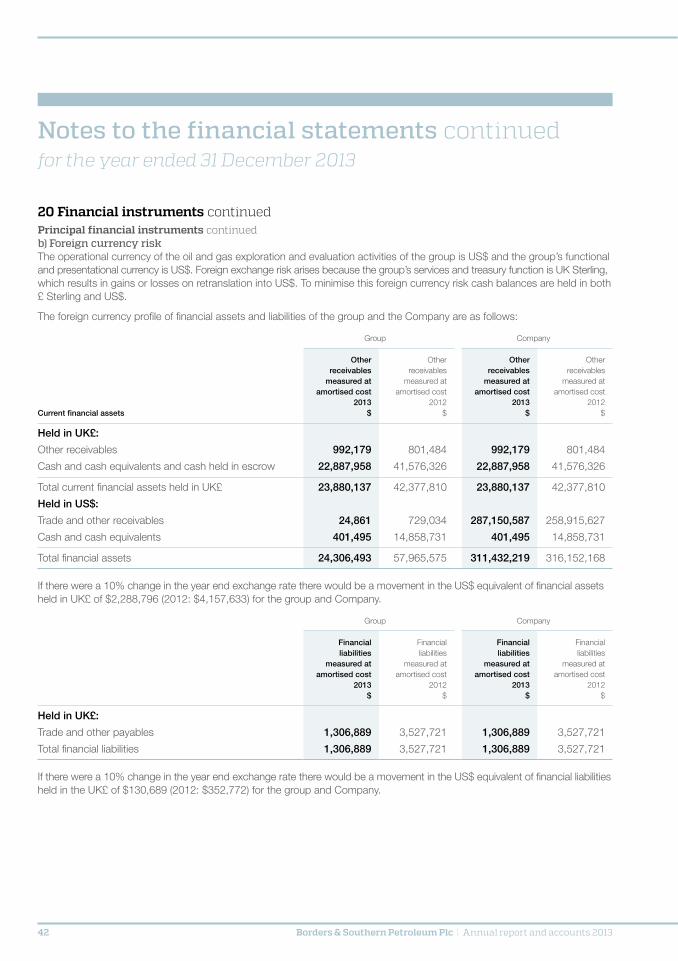
Borders & Southern Petroleum Plc | Annual report and accounts 201342
Notes to the financial statements continuedfor the year ended 31 December 2013
20 Financial instruments continuedPrincipal financial instruments continuedb) Foreign currency riskThe operational currency of the oil and gas exploration and evaluation activities of the group is US$ and the group’s functional and presentational currency is US$. Foreign exchange risk arises because the group’s services and treasury function is UK Sterling, which results in gains or losses on retranslation into US$. To minimise this foreign currency risk cash balances are held in both £ Sterling and US$.
The foreign currency profile of financial assets and liabilities of the group and the Company are as follows:
Group Company
Current financial assets
Other receivables
measured at amortised cost
2013$
Other receivables
measured at amortised cost
2012$
Other receivables
measured at amortised cost
2013$
Other receivables
measured at amortised cost
2012$
Held in UK£:
Other receivables 992,179 801,484 992,179 801,484
Cash and cash equivalents and cash held in escrow 22,887,958 41,576,326 22,887,958 41,576,326
Total current financial assets held in UK£ 23,880,137 42,377,810 23,880,137 42,377,810
Held in US$:
Trade and other receivables 24,861 729,034 287,150,587 258,915,627
Cash and cash equivalents 401,495 14,858,731 401,495 14,858,731
Total financial assets 24,306,493 57,965,575 311,432,219 316,152,168
If there were a 10% change in the year end exchange rate there would be a movement in the US$ equivalent of financial assets held in UK£ of $2,288,796 (2012: $4,157,633) for the group and Company.
Group Company
Financial liabilities
measured at amortised cost
2013$
Financial liabilities
measured at amortised cost
2012$
Financial liabilities
measured at amortised cost
2013$
Financial liabilities
measured at amortised cost
2012$
Held in UK£:
Trade and other payables 1,306,889 3,527,721 1,306,889 3,527,721
Total financial liabilities 1,306,889 3,527,721 1,306,889 3,527,721
If there were a 10% change in the year end exchange rate there would be a movement in the US$ equivalent of financial liabilities held in the UK£ of $130,689 (2012: $352,772) for the group and Company.

GovernanceStrategic report Financial statements
Annual report and accounts 2013 | Borders & Southern Petroleum Plc 43
20 Financial instruments continuedPrincipal financial instruments continuedc) Credit riskNeither the group nor the Company have customers so formal credit procedures are in the process of being established. During drilling operations, the group incurred 100% of costs that were shared with other companies and these were invoiced to these companies with all amounts due for these shared costs paid to the group during the year. Credit risk on cash balances is managed by only banking with reputable financial institutions with a high credit rating. The only significant concentration of credit risk on an ongoing basis is cash held at bank and the maximum credit risk exposure for the group and Company is detailed in the table below:
2013 2012
Carrying value
$
Maximum exposure
$
Carrying value
$
Maximum exposure
$
Cash and cash equivalents and cash held in escrow 23,289,453 23,289,453 56,435,057 56,435,057
Maximum credit risk exposure 23,289,453 23,289,453 56,435,057 56,435,057
The Company has a credit risk exposure to the loans to group companies which is expected to be removed when these loans are repaid through successful exploitation of the Company’s oil and gas discoveries.
CapitalThe objective of the directors is to maximise shareholder return and minimise risk by keeping a reasonable balance between debt and equity. To date the group has minimised risk by being purely equity financed. The group considers its capital to comprise its ordinary share capital, share premium, accumulated retained deficit and other reserves.

Borders & Southern Petroleum Plc | Annual report and accounts 201344
Corporate directory
Directors Harry Dobson Howard Obee Peter Fleming Stephen Posford Nigel Hurst-Brown
Secretary William Slack
Registered office One Fleet Place London EC4M 7WS
Business address 33 St James’s Square London SW1Y 4JS
Nominated advisor Panmure Gordon & Co and joint broker One New Change
London EC4M 9AF
Joint broker Mirabaud Securities LLP 33 Grosvenor Place London SW1X 7HY
Joint broker Pareto Securities Ltd 8 Angel Court London EC2R 7HJ
Solicitors Dentons UKMEA LLP One Fleet Place London EC4M 7WS
Registrars Capita Asset Services Northern House Woodsome Park Fenay Bridge Huddersfield HD8 0LA
Bankers Lloyds TSB Bank plc 19–21 The Quadrant Richmond Surrey TW9 1BP
HSBC Bank plc
69 Pall Mall London SW1Y 5EZ
Independent auditor BDO LLP 55 Baker Street London W1U 7EU


Bord
ers & S
ou
thern
Petroleu
m P
lc An
nu
al rep
ort a
nd
acco
un
ts 20
13
33 St James’s Square London SW1Y 4JS United Kingdom
Telephone: +44 (0)20 7661 9348 Fax: +44 (0)20 7661 8055
[email protected] www.bordersandsouthern.com

Bord
ers & S
ou
thern
Petroleu
m P
lc An
nu
al rep
ort a
nd
acco
un
ts 20
13