Embed Size (px)
Citation preview

1
PETROBRASBrazilian Oil and Gas Exploration &
ProductionChallenges and Opportunities
IBSEN FLORES LIMA
June/2011
Seoul, Korea

2Cluster blocks
Houston
Colombia
Argentina
Angola
United Kingdom
USA
BRASIL
BoliviaRio de
Janeiro
Nigeria
Venezuela
Equador
Peru
Mexico
Tanzania
Iran
New York
Tokio
Beijing
Singapure
Libia
Mozambique
Uruguay
Turkey
Senegal
Jordan
Pakistan
India
Portugal
Paraguay
Okinawa
Trading
Upstream
Head Office
Downstream
Representative Offices
Petrobras 2010

3
Proven Reserves : 16
billion boe (SPE)
Refineries: 15
- Installed Capacity: 2.223 million bpd
- Output of Oil Products: 2.034 million bpd
Service stations- Brazil: 5,998- Abroad: 1,223
Net Operating
Revenues:
US$ 91.9 billion
Total Investments
- 2010-2014: US$ 224.1 billion
Natural Gas Sales: 37 million m3/d
Vessels- Own fleet: 52
- Chartered: 120
Power Plants- Thermoelectric: 18- Installed Capacity : 6,136 MW
Pipelines : 29,398 km
Terminals: 47- Storage capacity: 10 million m³
Average O&G
Production:
2.3 million boed
- Oil: 2.0 million bpd
- Gas: 0.3 million boed
Producing Platforms
- Fixed: 86
- Floating: 47
Producing Wells:
- Onshore: 14,115
- Offshore: 790
Fertilizer Plants: 2
Drilling Rigs (domestic)
- Onshore: 34
- Offshore: 53
LNG Terminals- Pecém: 7 million m3/d- Rio de Janeiro: 14 million m3/d
Petrobras Overview*: An integrated oil major
*As of Nov/2010
4
Our exploratory activities in Brazilian sedimentary basinshave uncovered a huge hydrocarbons potential…
Paleozoic basinsLight oil condensate &
natural gas
Eastern/Northeastern margin basins
Light oil & natural gas Recent offshore discoveries
Equatorial margin basins(frontier)
High risks & high rewardsNatural gas & light oil
Espirito Santo, Campos &Santos Basins
Search for new producible heavy oil discoveries
Search for light oil & natural gas discoveriesPre-Salt Section
Carbonates
Internal basinsInitial stages of
exploration
6
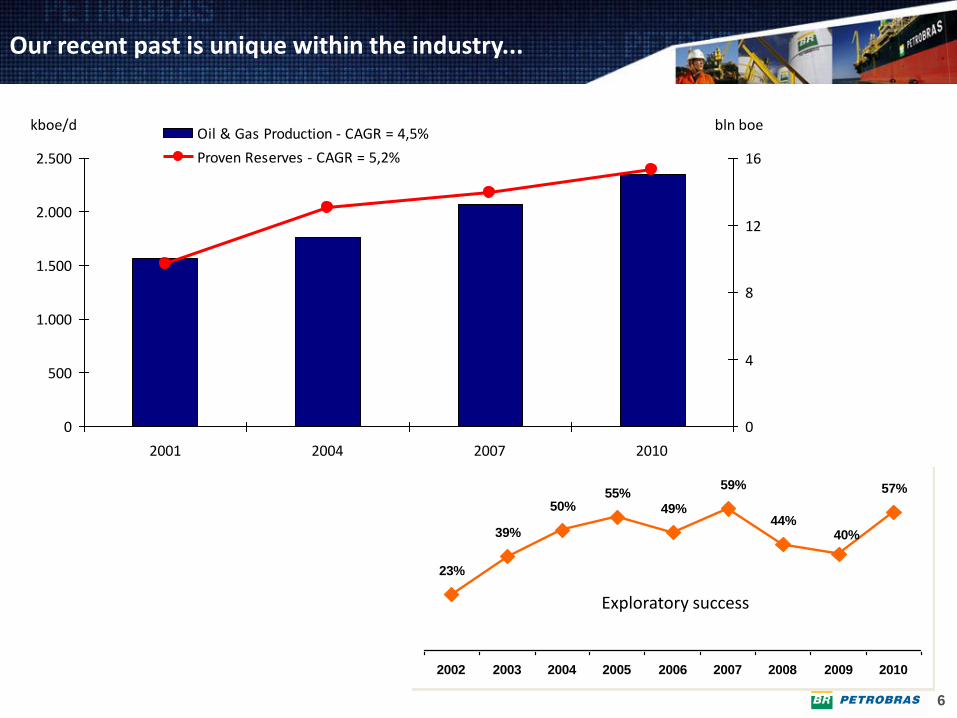
Our recent past is unique within the industry...
23%
39%
50%55%
49%44%
57%
40%
59%
2002 2003 2004 2005 2006 2007 2008 2009 2010
Exploratory success
0
500
1.000
1.500
2.000
2.500
2001 2004 2007 2010
0
4
8
12
16
Oil & Gas Production - CAGR = 4,5%
Proven Reserves - CAGR = 5,2%
kboe/d bln boe
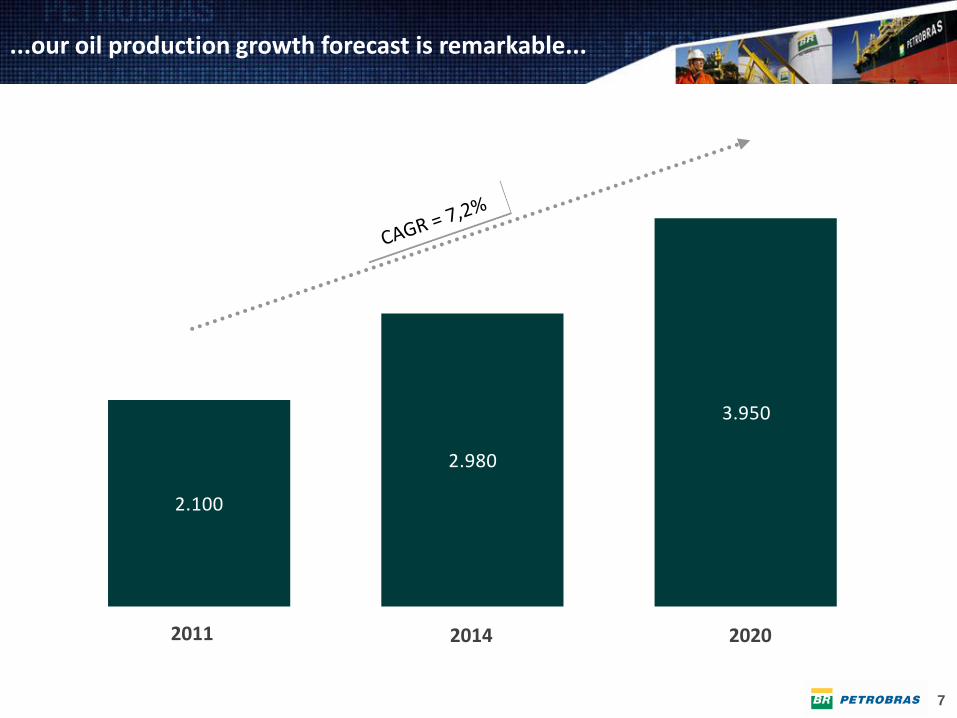
7
2.100
2.980
3.950
2011
...our oil production growth forecast is remarkable...
2014 2020
8
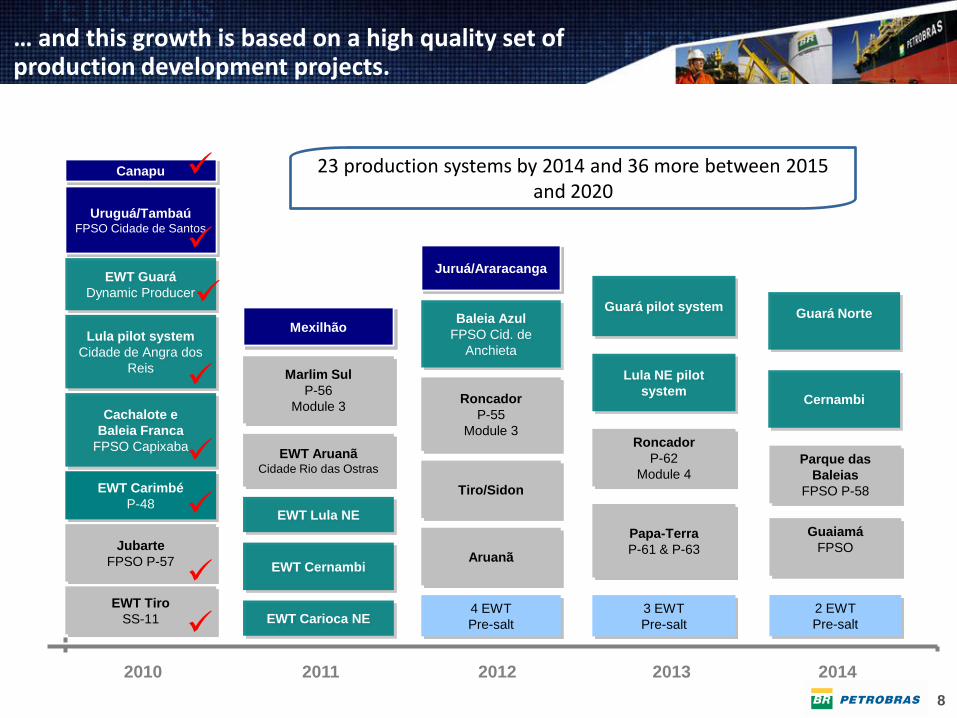
… and this growth is based on a high quality set of production development projects.
EWT Cernambi
EWT Guará
Dynamic Producer
Lula pilot system
Cidade de Angra dos
Reis
Cachalote e
Baleia Franca
FPSO Capixaba
Marlim Sul
P-56
Module 3
Jubarte
FPSO P-57
Baleia Azul
FPSO Cid. de
Anchieta
Roncador
P-55
Module 3
Papa-Terra
P-61 & P-63
Guará pilot system
Parque das
Baleias
FPSO P-58
Lula NE pilot
system
Tiro/Sidon
EWT AruanãCidade Rio das Ostras
EWT Tiro
SS-11
Mexilhão
Aruanã
Guaiamá
FPSO
Uruguá/TambaúFPSO Cidade de Santos
4 EWT
Pre-salt
3 EWT
Pre-salt
2 EWT
Pre-salt
Juruá/Araracanga
Canapu
EWT Carimbé
P-48
Cernambi
Guará Norte
Roncador
P-62
Module 4
EWT Lula NE
EWT Carioca NE
2010 2011 2012 2013 2014
8
6
23 production systems by 2014 and 36 more between 2015 and 2020
9
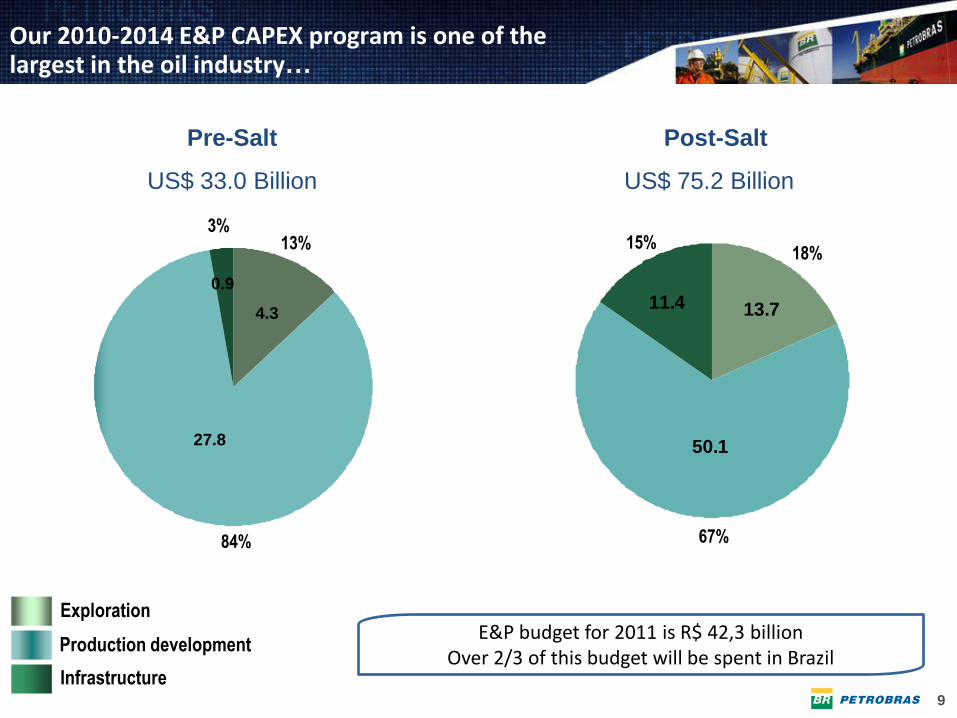
Our 2010-2014 E&P CAPEX program is one of the largest in the oil industry…
Exploration
Production development
Infrastructure
27.8
0.9
4.3
84%
3%13%
Pre-Salt
US$ 33.0 Billion
Post-Salt
US$ 75.2 Billion
50.1
11.4 13.7
15%18%
67%
E&P budget for 2011 is R$ 42,3 billion Over 2/3 of this budget will be spent in Brazil
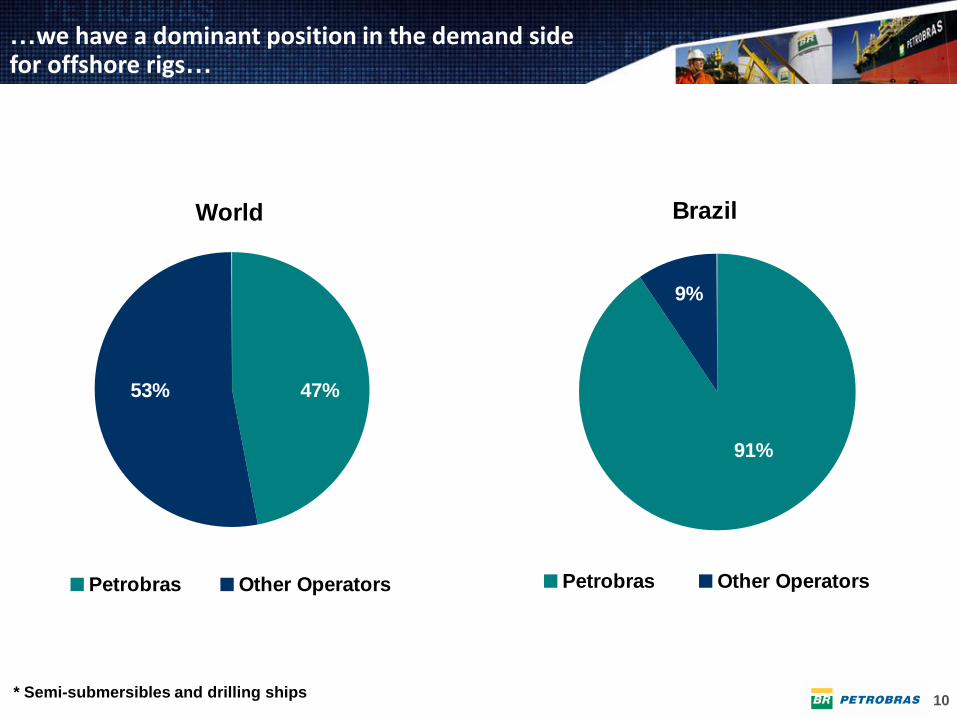
10
World
53% 47%
Petrobras Other Operators
Brazil
91%
9%
Petrobras Other Operators
* Semi-submersibles and drilling ships
…we have a dominant position in the demand side for offshore rigs…
11
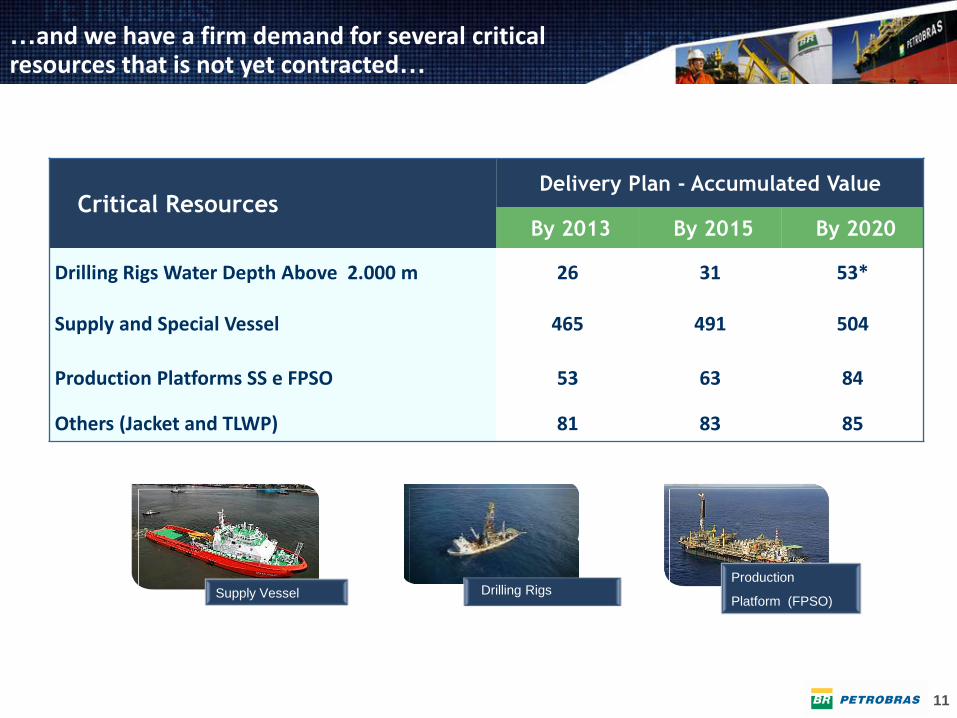
Critical ResourcesDelivery Plan - Accumulated Value
By 2013 By 2015 By 2020
Drilling Rigs Water Depth Above 2.000 m 26 31 53*
Supply and Special Vessel 465 491 504
Production Platforms SS e FPSO 53 63 84
Others (Jacket and TLWP) 81 83 85
Production
Platform (FPSO)Drilling RigsSupply Vessel
…and we have a firm demand for several critical resources that is not yet contracted…
12
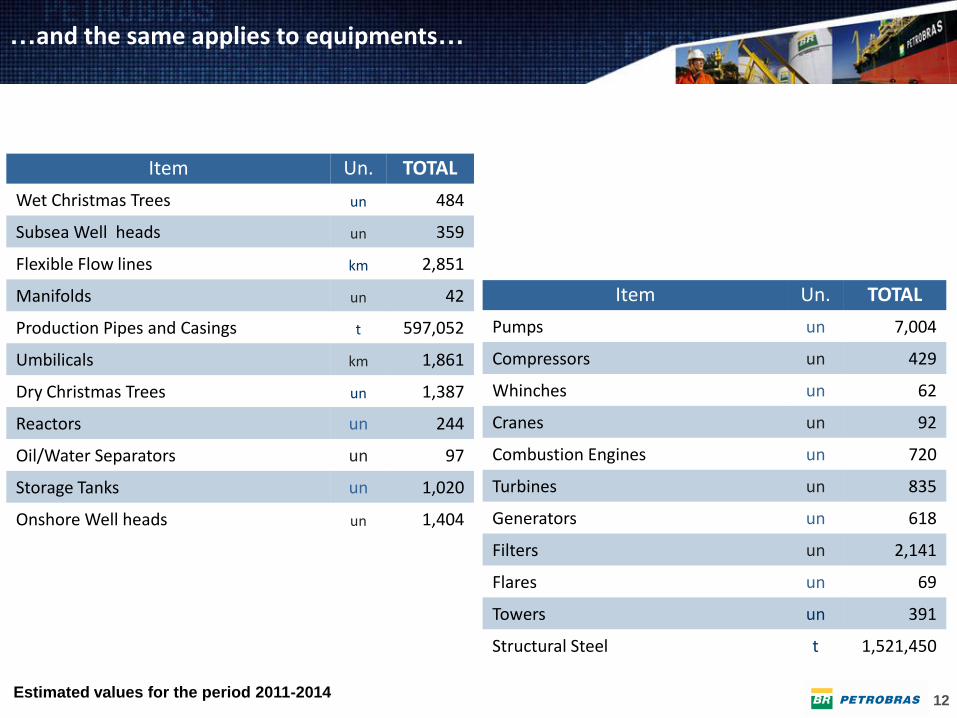
Item Un. TOTAL
Wet Christmas Trees un 484
Subsea Well heads un 359
Flexible Flow lines km 2,851
Manifolds un 42
Production Pipes and Casings t 597,052
Umbilicals km 1,861
Dry Christmas Trees un 1,387
Reactors un 244
Oil/Water Separators un 97
Storage Tanks un 1,020
Onshore Well heads un 1,404
Item Un. TOTAL
Pumps un 7,004
Compressors un 429
Whinches un 62
Cranes un 92
Combustion Engines un 720
Turbines un 835
Generators un 618
Filters un 2,141
Flares un 69
Towers un 391
Structural Steel t 1,521,450
…and the same applies to equipments…
Estimated values for the period 2011-2014
13
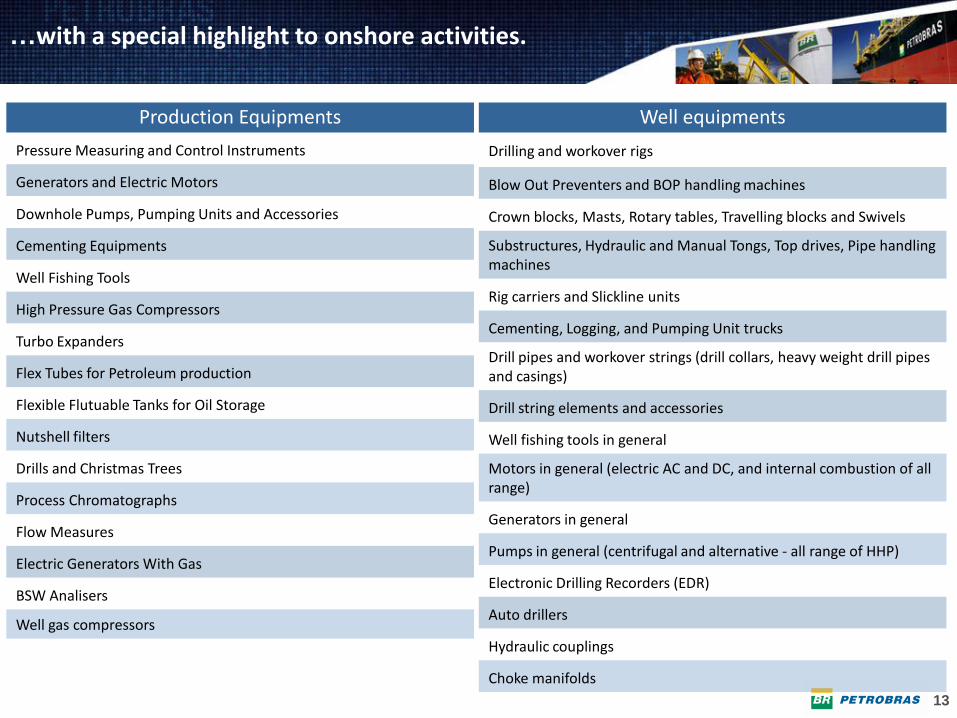
Production Equipments
Pressure Measuring and Control Instruments
Generators and Electric Motors
Downhole Pumps, Pumping Units and Accessories
Cementing Equipments
Well Fishing Tools
High Pressure Gas Compressors
Turbo Expanders
Flex Tubes for Petroleum production
Flexible Flutuable Tanks for Oil Storage
Nutshell filters
Drills and Christmas Trees
Process Chromatographs
Flow Measures
Electric Generators With Gas
BSW Analisers
Well gas compressors
…with a special highlight to onshore activities.
Well equipments
Drilling and workover rigs
Blow Out Preventers and BOP handling machines
Crown blocks, Masts, Rotary tables, Travelling blocks and Swivels
Substructures, Hydraulic and Manual Tongs, Top drives, Pipe handling machines
Rig carriers and Slickline units
Cementing, Logging, and Pumping Unit trucks
Drill pipes and workover strings (drill collars, heavy weight drill pipes and casings)
Drill string elements and accessories
Well fishing tools in general
Motors in general (electric AC and DC, and internal combustion of all range)
Generators in general
Pumps in general (centrifugal and alternative - all range of HHP)
Electronic Drilling Recorders (EDR)
Auto drillers
Hydraulic couplings
Choke manifolds
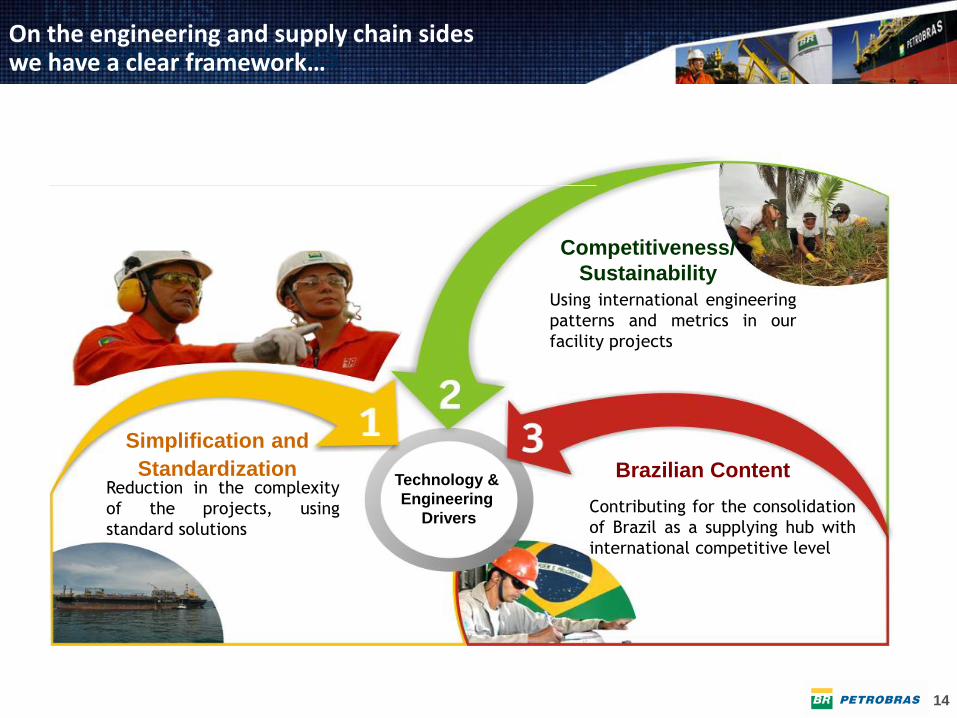
14
ENGINEERING CHALLENGES
Reduction in the complexity
of the projects, using
standard solutions
Contributing for the consolidation
of Brazil as a supplying hub with
international competitive level
Using international engineering
patterns and metrics in our
facility projects
Simplification and
Standardization
Competitiveness/
Sustainability
Brazilian ContentTechnology &
Engineering
Drivers
On the engineering and supply chain sideswe have a clear framework…

15
…and Petrobras has crafted a program to help replicating this success…
Local content requirements in
contracts
Cooperation agreements to
develop new products and
technologies
Long term contracts
Cooperation agreements for
imports substitution
Examples
Platforms Rigs Refineries
Ships (PROMEF) Vessels
(PSV, AHTS, ORSV)
Oil-water subsea separation Umbilical, Special xmas tree (BCS)
Lifeboats Steam turbine Flexible pipes - monitoring
New plants in Brazil Shipyards Offshore cranes Pumping units Pumps and valves
Expansions Umbilical Wet xmas tree Pressure vases.
Strategies
16
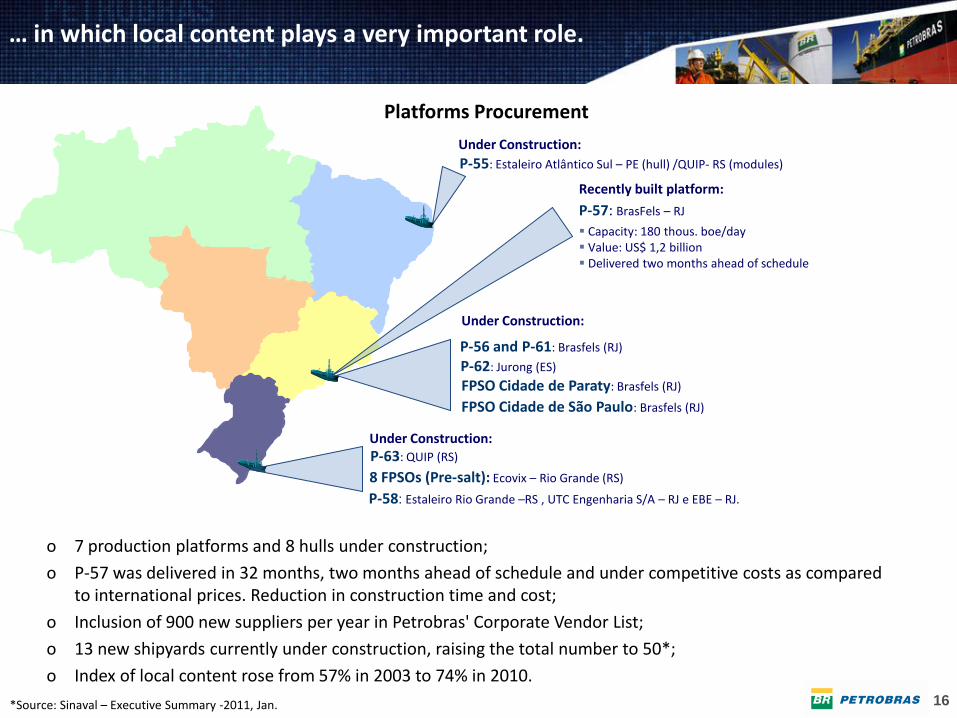
o 7 production platforms and 8 hulls under construction;
o P-57 was delivered in 32 months, two months ahead of schedule and under competitive costs as compared to international prices. Reduction in construction time and cost;
o Inclusion of 900 new suppliers per year in Petrobras' Corporate Vendor List;
o 13 new shipyards currently under construction, raising the total number to 50*;
o Index of local content rose from 57% in 2003 to 74% in 2010.
Recently built platform:
P-57: BrasFels – RJ
Capacity: 180 thous. boe/day Value: US$ 1,2 billion Delivered two months ahead of schedule
8 FPSOs (Pre-salt): Ecovix – Rio Grande (RS)
P-56 and P-61: Brasfels (RJ)
P-62: Jurong (ES)
P-63: QUIP (RS)
FPSO Cidade de Paraty: Brasfels (RJ)
FPSO Cidade de São Paulo: Brasfels (RJ)
Under Construction:
Under Construction:
Platforms Procurement
Under Construction:
P-55: Estaleiro Atlântico Sul – PE (hull) /QUIP- RS (modules)
P-58: Estaleiro Rio Grande –RS , UTC Engenharia S/A – RJ e EBE – RJ.
*Source: Sinaval – Executive Summary -2011, Jan.
… in which local content plays a very important role.
1717
THANK YOU