Embed Size (px)
Citation preview

Report No. FAA-NA-14-61
£Oh itd OCULOMETER MEASUREMENT OF AIR TRAFFIC
CONTROLLER VISUAL ATTENTION~;
Gloria Karsten Bernard Goldberg
Richard Rood Richard Sulzer
•
~ . .
•
FEBRUARY 1915
INTERIM REPORT
Document is available to the public through the National Technical Information Service.
Spri ngfie Id. Virgi nia 2215 I
Prepared for
U.S. DEPARTMENT OF TRANSPORTATION FEDERAL AVIATION' ADMINISTRATION Systems Researcb , Dnelap.e.t Senin
. Wasbinlton, D. C. 20590
NAFEC LIBRARY
MAR 20 1~75
\RECEIVED

NOTICE
This document is disseminated under the sponsorship of the Department of Transportation in the interest of information exchange. The United States Government assumes no liability for its contents or us e thereof.
,

Technical ~eport Documentation Page
1. Report No. 3. Recipi ent' s Catalog No.2. Government Accession No.
FAA-NA-74-6l
4. Title and Subtitle 5. Report Date
OCULOMETER MEASUREMENT OF AIR TRAFFIC February 1975 6. Performing Organization CodeCONTROLLER VISUAL ATTENTION
~~~~~~~~~~~~~~~~~~~~~~~~~~~~~~~~8. Performing Organization Report No. 7. Author's) Gloria Karsten, Bernard Goldberg,
Richard Rood, and Richard Sulzer FAA-NA-74-6l 10. Work Unit No. (TRAIS)9. Performing Organi zation Name and Address
Federal Aviation Administration National Aviation Facilities Experimental Center 11. Contract or Grant No:
Atlantic City, New Jersey 08405 13. Type of Report and Period Covered
r------------~~-~------~-~--~-~---___' 12. Sponsoring Agency Name and Address
U.S. Department of Transportation Interim Federal Aviation Administration July - August 1974 Systems Research and Development Service 14. Sponsoring Agency Code
Washington, D.C. 20590 15. Supplementary Notes
16. Abstract
To evaluate the Oculometer as a visual fixation measuring device for man/machine interface investigations, six air traffic controllers performed simulated radar control functions. A seventh controller performed the control tasks, while both an Oculometer record and a manual record were made of visual attention. It was found that all the controllers spent approximately 80 percent of the test time looking at the radar display, with a mean of 76 glances at the display per l5-minute session. Average glance duration was 10 seconds. Approximately 11 .percent of the remaining time was spent looking at the flight progress strips, less than 5 percent looking at the computer input keyboard, and less than 3 percent looking at miscellaneous or indeterminate objects. No marked differences appeared in the scores of individual controllers although they had been selected to represent a diversity of air traffic control experience. In the comparison of methods of recording visual performance, good agreement was obtained between the Oculometer and manual kymograph recorder on time spent looking at the radar, flight strips, and keyboard. The Oculometer was capable of recording brief eye movements and additional detail which was difficult if not impossible with the manual obser
~ vation method. This additional precision of recording was accompanied, however, by an additional workload in data reduction. It was concluded that the Oculometer has the potential to produce reliable and accurate information when used within the limits of its design. The addition of automatic output of coordinates of fixation would be a valuable improvement resulting in reduced test workload.
17. Key Words ViSl0n Human Engineering Eye Movements ATC Systems
18. Di stri bution Statement Document is available to the public through the National Technical Information Service, Springfield, Virginia 22151
19. Security Classif. (of this report) 20. Security Classif. (of this page) 21. No. of Pages 22. Pri ce
Unclassified Unclassified 26
Form DOT F 1700.7 (8-72) Reproduction of completed page authori zed

c.
"
•
-

I
TABLE OF CONTENTS
Page
INTRODUCTION
Purpose Background
1
11
DISCUSSION
The Simulated Air Traffic Work Situation 3 Test Procedures 3 Visual Attention Results as Measured by the Oculometer 7 Comparison with Results Obtained by the Manual Method 12 Shortcomings of the Oculometer System 14 Suggestions for Improvement of the Oculometer 19
CONCLUSIONS 20
RECOMMENDATIONS 21
REFERENCES 22
APPENDIX - Controller Questionnaire
..
iii
3

LIST OF ILLUSTRATIONS
Figure Page
1 Simulated Radar Control Position 4
2 Kymograph Chart Drive Us.ed in Manual Recording 6
3 Oculometer System in Use 15
4 Helmet and Visor Assembly, in Two Views 16
5 Oculometer Control Panel with Oscilloscope and Monitor 17
6 Detail of Oculometer in Use 18
LIST OF TABLES
Table Page
1 Visual Attention Results Measured by the Oculometer 8 on Three Terminal Controllers, Each Performing Three Radar Type Tasks
2 Visual Attention Results Measured by the Oculometer 9 on Three Enroute Controllers, Each Performing Three Radar Type Tasks
3 Visual Attention Results for All Six Controller 11 Subjects Pooled
4 Comparison of Visual Attention Results Obtained with 13 the Oculometer and with the Manual Method
. i-v

INTRODUCTION
PURPOSE.
The purpose of this evaluation was to determine the utility of the Oculometer as a tool for the study of visual performance in a radar control situation.
BACKGROUND.
In tests of display and data entry equipment, it is often necessary to measure and record what the human operator is looking at. In the analysis of air traffic control (ATC) systems, the commonly used method of activity recording consists of stationing an observer next to the subject controller and equipping this observer with a device that moves graduated graph paper across an aperture at a constant speed. Called the method of kymograph recording, or the manual recording method, this technique depends on the observer's judement of the direction of the subject's attention for ,the decision of what the controller is looking at. Principal clues to the direction of attention are the movements of the subject controller observed, particularly hand and head movements, and the direction of the controller's gaze, insofar as it can be noted by watching him move, turn toward, and reach for things.
In some special situations, the most important activities for recording are shifts of visual attention. This is the case when scanning patterns are investigated or when time-sharing performance is important in a task heavily loaded in the visual channel. With pilots, for example~ a special type of kymograph has been used to determine how much time is spent looking at the cockpit instruments versus how much time is spent in outside search for possible collision threats. This recording device produces a recorded auditory tone when a button is pressed and held down. Different frequencies are recorded for each area of attention. But the procedure is essentially the same as that for ATC systems, since the sound recorder is activated by an observer who watches the subject and codes the observed behavior into categories as it is observed in real time.
Motion picture and video recordings have been used in time and motion study of highly repetitive operations in industry. This method is costly and is less useful in the study of human data processing and decision making because much is not detected by a stationary camera. In light of this,the Oculometer was developed to improve the measurement and recording of visual performance, with particular application to the problem of aircraft-pilot visual time sharing. A precise and automated system was needed because of the difficulty of squeezing an observer into cockpit position to view pilot eye movements and because of the need to determine exactly where the pilot was looking in response to warning information conveyed by a variety of displays.
Since it is a helmet-mounted camera, the Oculometer moves with head movements to record the scene before the subject. A focus index produced by projecting
1

- - - - - - - - - - - - - - - - - - - - - - - - - - - -
a signal into and back out of the eye shows the spot in the scene that is being viewed by the subject at a given instant. With the additional feature of a video tape recording of the combined forward scene and focus index t it becomes possible to record the precise line of sight and play back the recorded information as many times as necessary and as slowly as necessary to make accurate judgments as to the focus of visual attention. For example, when the hands are being used to depress keys to put information into a data processing system t the eyes will move to the same spot as the hands. The visual scene that the Oculameter plays back will show, then, the fingers moving to and pressing the keys at the same time that the focus index swings to the same keys. Watching the playback ·of both the hand action and the' shift of visual attention, the observer obtains considerable assurance that an intentional action took place, and he has the means at hand to determine the time duration of the action.
The features of the Oculometer as described above made it appear that the system might find a useful application in the study of ATe displays and procedures. Like the pilot for whom the Oculometer was originally developed, the controller is heavily loaded in the visual channel. Often he is seated before a radar display that shows map, route, and weather information~ the positions of several aircraft under control, and alphanumeric data blocks attached to the tracked aircraft. The positions of the aircraft are moving, and important changes are appearing in the data blocks. Hence) the radar display must be watched closely. At the same time, the controller is required to refer to posted information and particularly to data that is tabulated on flight progress strips in columnar bays alongside the radar display. A third category of requirement for the visual attention of the controller in a typical radar control situation is the data input keyboards and associated controls. In many instances, when the controller notes significant information or decides on a new control action, he must not only verbalize the decis~on to an associate or a pilot of a controlled aircraft, but he must also press a series of keys to put the information into the computer system. Important changes such as a new altitude or speed must be written on the flight progress strip which bears data on the particular flight. This also requires the controller to look away from his primary display.
Manual recording with a hand-held kymograph can be used to evaluate the effect on visual performance of a change in display equipment or procedures s but the potential advantages of the Oculometer for the purpose are apparent. Since primary attention is on the radar display, many glances to the strips or data entry keyboards will be very brief. This makes it easy to miss some of them when using the manual method in real time. In addition, when the test involves a change in display format or the utilization of a particular item of information such as a particular flight progress strip, a higher degree of precision than can be obtained manually may be required. The only way to tell whether the controller is looking at a particular item is to have a precise recording system. The Oculometer appears to be an approach in that direction.
2

After the original model of the Oculometer was delivered to the Federal Aviation Administration (FAA) by the design contractor, the system was redesigned by the National Aviation Facilities Experimental Center's (NAFEC's) engineering staff to reduce the weight of the helmet and improve overall system reliability. When these efforts were successfully completed, the system was assigned to the Human Engineering Branch at NAFEC for evaluation.
DISCUSSION
THE SIMULATED AIR TRAFFIC WORK SITUATION.
To measure the".visual performance of ~ont~ollers and compare the measureb obtained by the manual recording method, if was necessary to create a controlled' work situation. The presence in the controller-computer int·erface laboratory of a console roughly similar to an enroute plan view display and the availability of a recorded air traffic scenario made it feasible to make up a partial' simulation of an enroute sector position. A flight-strip mounting board was attached to the right of the display, similar to a strip board in the current enroute sector. This approximation of the radar control position is,illus~rated
in figure 1. The general experimental question was: "What is the division'of visual attention between the radar display, the data entry devices (keyboard and slew ball), the flight progress strips, and miscellaneous areas during the period the controller was evaluating the traffic situation presented to him, resolving the conflicts which would occur, and marking the strips to show his decisions?" Since the recorded radar display problems were available in three different versions, three different sessions were completed by each controller subject.
TEST PROCEDURES.
Three l5-minute radar problems were presented to each of six subjects. The radar display depicted a relatively simple ATC routing pattern over which a moderate level of simulated operational air traffic was portrayed. In a few cases, conflicts involving the violation of normal' .separation standards were included. This display was considered to constitute a partial replica of the situation display usually found in enroute air traffic centers·and to have enough traffic movement to require a normal amount of controller attention.
In addition to monitoring the radar display, the controller subject was asked to do the following two things: First, he was to update the flight information marked on the flight progress strips; second, he was asked to make simulated handoffs to adjacent sectors and acknowledge handoffs from other sectors, using the keyboard and slew ball. These input devices were, however, deactivated, so that there was no feedback from such simulated handoffs. When a potential conflict was detected, the subject was asked to determine what control action would best resolve it and to speak the control instruction and update the strip involved to show the action taken.
3

.~
4

The test design called for two groups of three subjects each, with each man wearing the Oculometer helmet in three successive test sessions. Hence, in the basic series there were eighteen, 15-minute tests with the Oculometer. The first controller group, subjects numbered I through 3, were men experienced primarily in terminal air traffic facilities. The second group, subjects 4 through 6, were former enroute controllers. All subjects had normal uncorrected vision. This was a necessary selection standard because the Oculometer is not designed to track visual fixations of a person wearing eye glasses or contact lenses. Subjects 2 and 6 were -found to be left-eye dominant.
In pretests, it was found that certain sweeping eye movements without corresponding head movement resulted in loss of tracking. Hence, the visor was reframed by adding tape to reduce the field of vision. The subject then was looking out through a 6 3/4-inch-wide by 2 1/4-inch-high aperture.
The rectangular aperture was so placed before the subject's eyes that he was, in reality, looking through a 1 1/2-incp by 6 3/4-inch window, the plexiglass being slanted at an angle of 40° to the vertical. The center of the slanted helmet window was 2 1/2 inches in front of the eyes of the average subject. This geometry enabled the helmet optical system to reflect the infrared light from its generator to various mirror planes and to the eyeball and return. It was calculated that the horizontal field of vision was 40° to either side of the line of sight of the subject (total = 80°). The vertical field was about plus 14° and minus 20° (total = 34°). This total field of view was about 50 percent greater than the effective tracking field, but sufficed to enforce head movement in the subject so that tracking was rarely lost.
The outputs of the Oculometer were recorded on video tape for later analysis. This analysis was carried out by having an experimenter watch the playback of the taped scene and translate the eye fixations to chart paper on a hand--held kymograph similar to the type ordinarily used in manual recording of visual performance (figure 2). In this rerecording, all fixations were categorized into five areas, the radar (R) (cathode-ray tube display), the flight progress strips (5), the keyboard and slew ball (data entry devices(K)), a miscellaneous category that included such things as looking at the watch, cigarette, or other irrelevant object (M), and a lost-data category called undetermined (U). If the clues present on playback of the video recording were insufficient to determine the particular fixation, or if the fixation seemed to be halfway between main classifications, the time of the fixation was allocated to undetermined.
To insure that the experimenter viewing the video playback did not miss any glances, two people were employed in the rerecording. One watched the playback continuously and called out the appropriate category to an assistant who marked the chart paper. It appeared that the reaction-time delays in mark~·
ing the start of a glance were equivalent to the delays in marking the end of a glance, so that this two-man method did not introduce a large measure-ment error.
5

FIGURE 2. KYMOGRAPH CHART DRIVE USED IN MANUAL RECORDING
6
Following the main test series of 18 sessions, one 1S-minute radar problem was given to a seventh subject with both the Ocu10meter recording its video tape and an observer making a manual recording on the kymograph. After the test session, the video tape was rerecorded on chart paper as in the earlier 18 cases, providing two kymograph recordings for comparison of the alternate methods of recording visual performance.
VISUAL ATTENTION RESULTS AS MEASURED BY THE OCULOMETER.
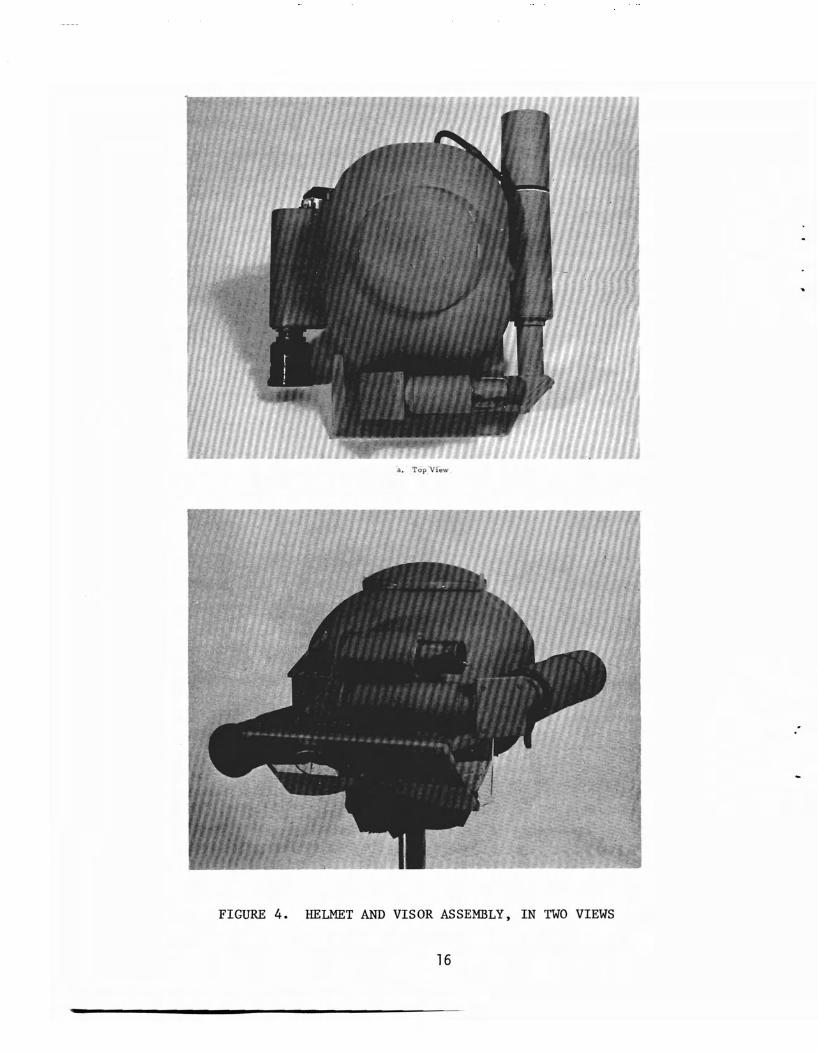
In tables 1 and 2, the visual performances of the subjects in the first and second controller groups are summarized. The five categories of fixation, R for radar, S for strips, K for keyboard - slew ball, M for miscellaneous, and U for undetermined, are arranged vertically, while the first, second, and third problems for each of the three subjects in each group are arranged across the top of the tables. The total time spent looking at the five categories, the percentage conversion of that total time, the number of individual glances contributing to the total time in category, and the average duration of glance for each category are shown. Inspection of the tables will show that the results were roughly comparable for both groups of controllers. All six subjects spent the vast majority of the problem time looking at the radar. This was to be expected from the nature of the task, and the results suggest that the simulated work situation was successful, at least to a degree, in simulating an actual control situation. Field surveys have shown the same result, that the radar controller spends the bulk of his time monitoring the cathode-ray tube display. Radar controllers find the usual work situation made more difficult by a requirement to look away from the radar for other parts of the control task.
In descending order following the radar category, the subjects spent the most time looking at the strips, then the input devices. Miscellaneous areas of fixation accounted for, at most, 2 percent of the controllers time, while the undetermined category was less than 1 percent for all but subject 6. Inspection of the tables reveals also that the performances did not vary widely between the first, second, and third radar problems. Thus, the fixation category data from the main series of 18 test sessions gave the appearance of a high degree of regularity across problem replications and across different test subjects. This finding may suggest that the recording and transcribing procedures were fairly reliable and that the subjects performed the assigned tasks with a degree of consistency. Before making that decision, however, it is necessary to consider the subjective impressions of the experimenters. On the question of the definiteness and certainty of the recorded data, could the experimenters judge whether or not the playback of the video tapes showed the subject to be scanning the radar in a way that would enable him to perceive the data blocks, and whether or not he shifted his eyes from the data block on a particular track to the flight strip for that same track, as would be expected considering the task assigned. There is no numerical data available on this point, but it is believed that the impressions of the three experimenters who observed all the video playbacks were quite definite that the
7

TABLE 1. VISUAL ATTENTION RESULTS MEASURED BY THE OCULOMETER ON THREE TERMINAL CONTROLLERS, EACH PERFORMING THREE RADAR TYPE TASKS
Subj~ct~
PI 1 P2 P3 PI
2 P2 P3 PI -
3 P2 - P3
Group Mean for Three Subjects
Total Time Looking At (seconds)
R S K M U
714 102
82 2 0
765 82 53
0 0
696 117
84 3 0
805 63 27 5 0
824 45 29
2 0
784 59 40 17
0
710 144
40 5 1
738 107
44 11 0
700 141
53 6 0
748 96 50
6 0
Proportion of Time Looking At (percent)
R S K M U
79 11
9 0 0
85 9 6 0 0
77 13
9 0 0
89 7 3 1 0
92 5 3 0 0
87 7 4 2 0
79 16
4 1 0
82 12
5 1 0
78 16
() 1 0
83 11
5 1 0
ex>
Number of Glances At
R S K M U
89 49 37
2 0
66 32 28 0 0
65 35 32
2 0
62 30 24
4 0
46 16 20
2 0
62 23 29 3 0
83 48 23 3 1
81 44 23
7 0
91 50 31
5 0
72 36 27 3 0
Mean Glance Duration (seconds)
R S K M U
8 2 2 1 -
12 3 2 --
11 3 3 2 -
13 2 1 1 -
18 3 1 I -
13 3 1 6 -
9 3 2 2 1
9 2 2 2
8 3 2 1
11 3 2 2
NOTE: Dash (-) indicates an indeterminate mean due to a nil number of glances.
I ,

• lr
TABLE 2. VISUAL ATTENTION RESULTS MEASURED BY THE OCULOt1ETER ON THREE ENROUTE CONTROLLERS, EACH PERFORMING THREE RADAR TYPE TASKS
Subj ects
4 5 6 Group }lean for PI P2 P3 PI P2 - P3 PI P2 - P3 Three Subjects
Total R 725 784 741 724 755 653 674 667 621 705 Time S 111 94 107 148 126 228 59 80 50 111 Looking K 54 17 37 22 12 12 59 48 75 37 At M 10 5 15 8 7 6 12 20 9 10 (seconds) U 0 0 0 1 0 1 96 85 145 36
Proportion R 81 87 82 80 84 73 75 74 69 78 of Time S 12 10 12 16 14 25 7 9 6 12 Looking K 6 2 4 2 1 1 7 5 8 4 At M 1 1 2 1 1 1 1 2 1 1 (percent) U 0 0 0 0 0 0 11 9 16 4
\0
Number R 77 53 58 85 59 82 113 85 108 80 of S 32 28 30 56 35 63 28 27 21 35 Glances K 32 15 24 17 10 11 29 25 35 22 At M 10 5 11 7 7 6 10 11 5 8
U 0 0 0 1 0 1 50 43 65 18
Mean R 9 15 13 8 13 8 6 8 6 10 Glance S 3 3 4 3 4 4 2 3 2 3 Duration K 2 1 2 1 1 1 2 2 2 2 (seconds) M 1 1 1 1 1 1 1 2 2 1
U - - - 1 - 1 2 2 2 2
NOTE: Dash (-) indicates an indeterminate mean due to a nil number of glances.

visual fixations as revealed in the playback were consistent with the logical sequence of the task demands. Also, it appeared that the particular data block fixated and the particular strip could generally be identified in the video recording. Hence, the experimenters believed-that there was little chance that time recorded as radar was erroneously interpreted and was actually spent looking at another area. The subjective impressions of the experimenters were that the data in the tables were accurate as interpreted from the video playback.
Table 3 presents the visual attention data with all six subj ects pooled., Out of the 900 seconds of problem time per session (15 minutes), the controllers spent 726 seconds looking at the radar display. This accounts for about 81 percent of their time. Strips were fixated for about 103 seconds, nearly 11 percent of the time, input devices, 44 seconds, which is less than 5 percent of the time, and miscellaneous and undetermined together made up the remaining 3 percent of the total time. Radar glances were the most frequent, but by an even larger margin, they were longer in duration. Keyboard glances averaged less than 2 seconds each, a figure that is realistic only for a procedure that emphasized use of the slew ball and keyboard entry of only single-key and very brief input messages.
When using the slew ball, it is normal to fix one's gaze on the radar display. The eyes may be averted to the slew ball itself for only an instant as the hand moves to the baIlor as the ENTER button next to the ball is depressed. Similarly, a simulated handoff requires only one to four keys to be touched. To accept a handoff, the subject was instructed to use the slew ball and ENTER button or to go to the keyboard and insert the aircraft identity and hit the ENTER button. To give a handoff, the controller used the keyboard to select a sector, an aircraft identification, and the ENTER button, or he used the slew ball to select an aircraft, the keyboard to note a sector identification, and hit the ENTER button. In the real enroute situation, it may be noted that the radar controller sometimes enters more complicated and lengthy keyboard messages. Hence, it is probable that the present work situation distorts the results in the direction of short glances at input devices.
Since the experimenter observing the playback of the video tape made by the Oculometer could identify even the particular item fixated within a category, such as the radar or strips, the Oculometer data would appear to add something of possible value to the kind of data usually obtained with manual recording techniques. Simply watching where the controller is looking does not allow detection of the specific item fixated, and it does not allow detection of the scanning pattern in running over a small area.
As noted previously, subject 6 was one of two with left-eye dominance. This subject also differed from the average of the others in producing a relatively large proportion of undetermined time. The mean for his three problems was 12 percent of the total time indeterminate. A careful replay of the video tapes produced by the Oculometer with this subject showed that in many instances
10

TABLE 3. VISUAL ATTENTION FOR ALL SIX CONTROLLER SUBJECTS POOLED
Total Time R Looking At S (seconds)
K
M
U
Proportion Of R Time Looking S At (percent) K
M
U
Number Of R Glances At S
K
M
U
Mean Glance R Duration (seconds) S
K
M
U
Group Mean
726
103
44
8
18
81
11
5
1
2
76
36
25
6
9
10
3
.2
1
2
11
Standard Deviation of the Group Mean
54
45
22
5
43
18
13
8
3
20
3
0.5
0.4
1
0.6

when the task would require him to look at the strips, and in fact, his gaze left the radar and shifted in the direction of the strips, the television camera recorded a focus index between the radar and the strip bay. Subsequent checks showed that the helmet had been aligned properly. Still it was shown that the recorded focus index was often as much as 6 inches to the side of the target the subject reported himself to be scrutinizing. Movement of the indicated fixation point was considered abnormal for this subject during some of the radar category time as well. Particularly, the tracking indicator showed reduced movement equivalent to .a "staring" mode. This appears to be a situation that is influenced by the contraction of the pupillary diameter. A subject with a high degree of light sensitivity and a tendency to contract the pupil to an unusually small diameter can so restrict the path of the infrared beam entering and exiting the eye that tracking sensitivity is reduced and it appears that the eye is moving less than expected by the subject's report.
COMPARISON WITH RESULTS OBTAINED BY THE }1ANUAL METHOD.
One IS-minute radar problem conducted with a seventh controller produced dual paper records of visual performance, one from the kymograph used in manual recording of eye positions, and the other from observation of the video tape playback from Oculometer recording. The point of interest was the differences in the results as derived from the two methods. Table 4 summarizes the data.
It may be seen that there was one consistent difference between the outcomes of the two methods. For the three main fixation points of the radar console, i.e., the radar, strips, and input devices, the Oculometer recording yielded a higher number of glances than did the manual method. The total times and percentages of fixation time for the three areas were roughly similar for the two methods, with the major difference being that the strip category was scored higher by the Oculometer method. As can be seen by referring to the data on mean duration of glances, the strip glances were shorter than the radar glances by a large factor. Hence, it appears that the Oculometer recorded additional, very brief glances at the strips that were missed in the manual recording method. The experimenters were able to demonstrate to themselves that it is possible to glance toward the strips, fixate a particular strips and perceive a needed datum such as an altitude in a total elapsed time in the vicinity of 1 second. Probably, it was a glance of this sort that was missed by the manual recording. The limited data, then, seem to indicate that the Oculometer recording method produces a picture of visual performance very similar to that given by the manual method, with the major difference being a capability to record brief glances, and, as indicated before, allowing precise determination of the particular item fixated, as contrasted to obtaining only the general area of fixation as is presently possible with the manual method.
12

TABLE 4. COMPARISON OF VISUAL ATTENTION RESULTS OBTAINED WITH THE OCULOMETER AND WITH THE
Total Time Looking At (seconds)
Proportion Of Time Looking At (percent)
Number Of Glances At
Mean Glance Duration (seconds)
MANUAL
R
S
K
M
U
R
S
K
M
U
R
S
K
M
U
R
S
K
M
U
METHOD
Oculometer Data
724
.107
69
0
0
80
12
8
0
0
56
38
22
0
0
13
3
3
13
· Manual Data
763
76
61
0
0
85
8
7
0
0
43
28
19
0
0
18
3
3
Difference
39
31
8
0
0
5
4
1
0
0
13
10
3
0
0
5

SHORTCOMINGS OF THE OCULOMETER SYSTEM.
A more complete picture of the complexity of the system may be obtained by examining figure 3. The subassemblies cabled together with the main electronics panel, video playback monitor, power supply, and control boxes mounted on an equipment cart are illustrated by this figure. The length of cable limits the television camera to a range of movement of 4 feet, and this length cannot be changed without changing data processing in the electronics panel. Parallax problems prevent an accurate picture if the subject moves his head closer than 18 inches to the object being inspected.
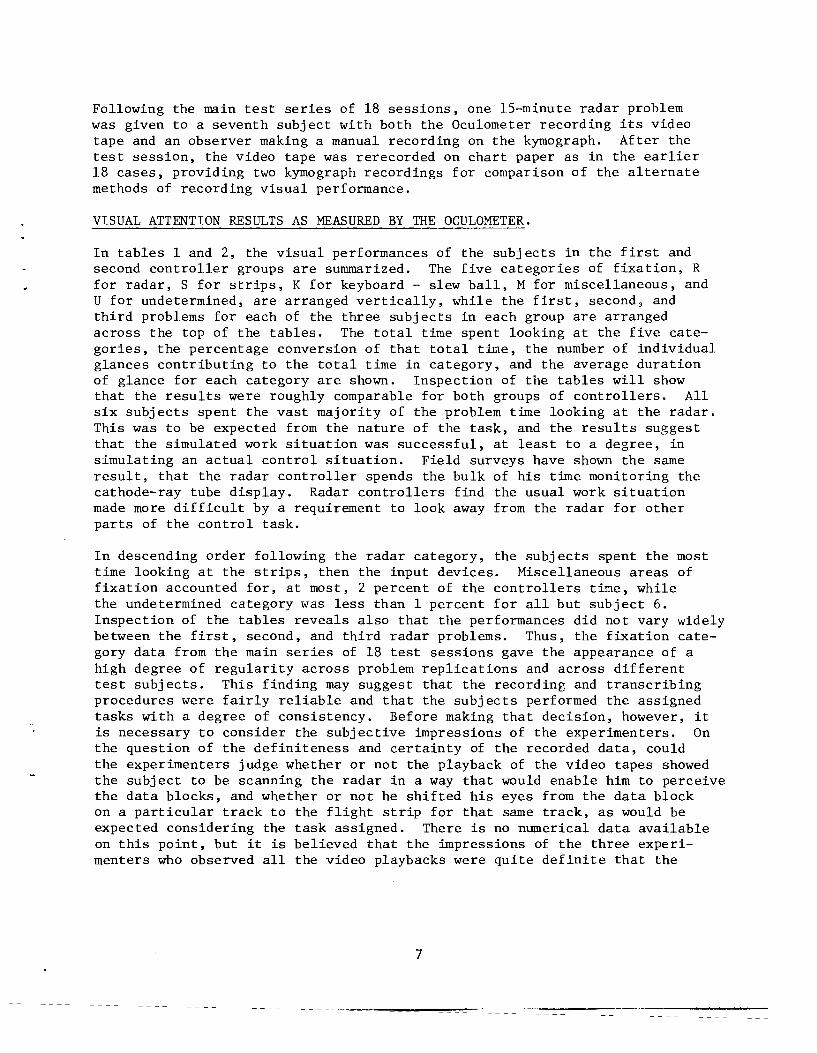
Two views of the helmet and visor are shown in figure 4. In the first of these helmet views, looking down at the top, the vidicon camera and lens assembly is on the left, while the infrared light source and folded optics are to the right. In figure 4, the masking with tape of the lower part of the plastic visor to enforce head movement when looking sharply down was necessary to preserve optical tracking when some glances downward to the keyboard and slew ball were made. The present design permits blockout of the tracking by a lowered eyelid. This may be capable of change in future versions of the Oculometer.
Calibration is required for each individual subject, but this is a relatively simple and fast task. From the experience with subject 6 in the main problem series, it would appear that in addition to the elimination of potential subjects because they wear glasses or contact lenses, an occasional candidate should be dropped because of left-eye dominance or because his tightly contracted pupil prevents accurate tracking.
The calibration controls are shown in figure 5 alongside the playback monitor and oscilloscope. The television picture shows that the subject's head is turned toward the flight progress strips, and the focus dot superimposed on the scene shows that he is actually looking at the fifth strip from the top. The circular pattern on the oscilloscope indicates the dilation of the subject's pupil and confirms that the system is tracking.
Some idea of the accuracy of the Oculometer system may be obtained from figure 6. This scene shows a subject performing in a data run. He is entering an altitude on a strip, and on the television monitor, the focus index was actually on the altitude mark.
To determine the reaction of the subjects to the experience of wearing the Oculometer helmet in the simulated ATC work situation, subjects were askek to complete a short questionnaire following completion of their three test sessions. This form appears in the appendix. A series of questions asked about the comfort of wearing the helmet, the effect of the red dot in the field of vision~ and the effect of the restriction in the field of vision. The results of the first question indicated that the subjects found the headset marginally acceptable. Two stated that it was not comfortable. They did, however, complete the task
14

. r"l
15
a. Top Vrew
FIGURE 4. HELMET AND VISOR ASSEMBLY. IN TWO VIEWS
16

. Lf)
17

18
without apparent distraction or complaint. Two others said the helmet was acceptable for short periods of wear, such as the 15-minute sessions employed in this test. The final two subjects were unwilling to call the headset either comfortable or unacceptable, but rated it fair in- comfort. Five of the six said they were not bothered by the red dot projected to the eye. The sixth said he was bothered at times. Four of the six reported the restricted field of vision was bothersome, and comments were appended pointing to a feeling of uneasy movement and wooden and mechanical movements. Two others did not object to the restricted field.
The weight and cumbersomeness of the headset, plus the discomfort produced when the visor pressed against the nose, made the subjects conscious of the apparatus. This undoubtedly is a distraction and is undesirable, although highly motivated professionals can surmount such difficulties. Four of the subjects stated, for example, that they could have worked for a longer period wearing the headset. One estimated that he could have worn the headset for 2 hours without . difficulty. No subject believed that a single l5-minute session was too long to wear the headset.
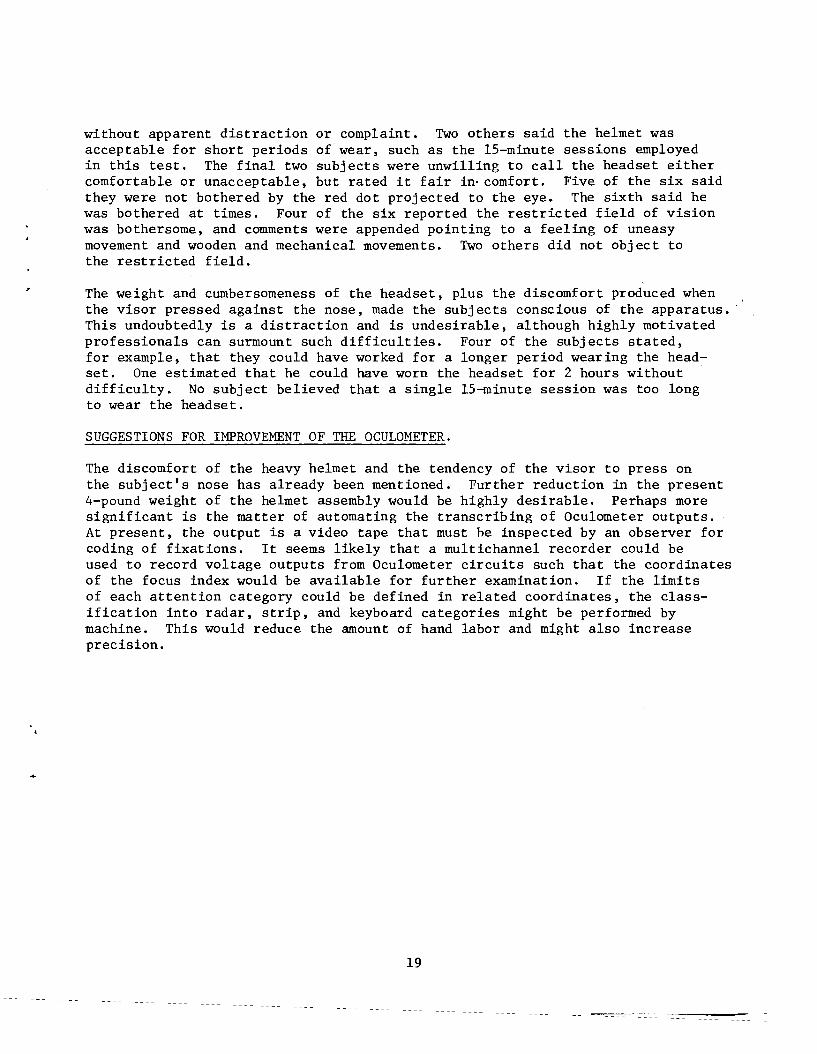
SUGGESTIONS FOR IMPROVEMENT OF THE OCULOMETER.
The discomfort of the heavy helmet and the tendency of the visor to press on the subject's nose has already been mentioned. Further reduction in the present 4-pound weight of the helmet assembly would be highly desirable. Perhaps more significant is the matter of automating the transcribing of Oculometer outputs. At present, the output is a video tape that must he inspected by an observer for coding of fixations. It seems likely that a multichannel recorder could be used to record voltage outputs from Oculometer circuits such that the coordinates of the focus index would be available for further examination. If the limits of each attention category could be defined in related coordinates, the classification into radar, strip, and keyboard categories might be performed by machine. This would reduce the amount of hand labor and might also increase precision.
19
----_._--_._._-----~

CONCLUSIONS
Based on 19 test sessions with seven different controller subjects, it is concluded that:
1. The Oculometer produces an accurate record of the visual performance of a subject working in a simulated radar control situation.
2. Because of the increased ability to detect brief glances and the increased precision in determining the exact locus of fixation, the data produced by the Oculometer system has significant advantages over that obtained with the conventional manual method.
3. The heavy and cumbersome helmet assembly and the short 4-foot electronic cable limit the field of view and the mobility of the subject and induce distraction and discomfort such that the, manual method of activity recording may be preferred unless there is a specific need for the more precise data produced by the Oculometer.
20
RECOMMENDATIONS
1. The potential usefulness of the Oculometer in civil aviation research and development studies warrants the cost that will be incurred, and for that reason, it is recommended that a continued effort be made to improve the packaging of the system, reducing the discomfort of use, and improving flexibility of application. One particular improvement of value would be a longer e~ectronic
cable from headset to control panel. This would make it more feasible to perform experimental measurements in a more realistic simulated sector.
Another possibility that might be examined would be relocation of the TV ,<
camera on top of the helmet. This would reduce parallax, making it possible to record closer fixations and might make it feasible to add vertical and horizontal mechanical adjustments to the camera mount.
2. An effort should be made to automate the categorization of glances and the measurement of duration of fixations.
21

REFERENCES
1. Operation and Maintenance Manual of the Head-Mounted Ocu1ometer Fixation Point Recording System, Honeywell Radiation Center, Lexington, Mass., July 1971.
2. Stein, Kenneth J., Avionics: Optical Device Studies Flight Displays, Aviation Week and Space Technology., 52-55, January 28, 1974.
3. Geacintov, Tamara and Peavler, Scott, W., Pupil10graphy in Industrial Fatigue Assessment, Journal of Applied Psychology, 59, 213-216, 1974.
22

APPENDIX
CONTROLLER QUESTIONNAIRE
....
-------------_.__.-.._--

lit'·

Oculometer Project Questionnaire
Subj Date _
Was the helmet comfortable?
Was the restricted field of vision particularly bothersome?
You wore the helmet for a total of 45 minutes (three 15 minute data periods).
Could you have worn it longer without any difficulty?
___________________________How long? _
Is 15 minutes too long to wear it?
Please comment on any aspect which this questionnaire might have neglected.
Reverse for more space. Thank you.
A-I

,....

I
..

r"