Embed Size (px)
Citation preview
LA-2743
(n#(XC-14 REPORT COLLECTION
REPRODUCTIONCXWY
LOS ALAMOS SCIENTIFIC LABORATORYOF THEUNIVERSITYOF CALIFORNIAo LOSALAMOS NEW MEXICO
LIFETIME OF NEUTRONS IN REFLECTORS
.. . ...
LEGAL NOTICE
Thisreportwas preparedas an accountofGovern-ment sponsoredwork. NeithertheUnitedStates,northeCommission,noranypersonactingon behalfoftheCom-mission:
A. Makesanywarrantyorrepresentation,expressedor implied,withrespecttotheaccuracy,completeness,orusefulnessoftheinformationcontainedinthisreport,orthattheuseofanyinformation,apparatus,method,or pro-cessdisclosedinthisreportmay notinfringeprivatelyownedrights;or
B. Assumes anyliabilitieswithrespecttotheuseof,or fordamagesresultingfrom theuseofanyinforma-tion,apparatus,method,or processdisclosedinthisre-port.
As usedintheabove,“personactingonbehalfof theCommission”includesany employeeor contractoroftheCommission,oremployeeofsuchcontractor,totheextentthatsuchemployeeor contractoroftheCommission,oremployeeof such contractorprepares,disseminates,orprovidesaccessto,anyinformationpursuantto hisem-ploymentorcontractwiththeCommission,orhisemploy-mentwithsuchcontractor.
PrintedinUSA. Price$ 1.75.Availablefrom the
OfficeofTechnicalServicesU. S.DepartmentofCommerceWashington25,D. C.
LA-2743PHYSICSTID-4500(18thEd.)
LOS ALAMOS SCIENTIFIC LABORATORYOF THE UNIVERSITY OF CALIFORNIA LOS ALAMOS NEW MEXICO
REPORT WRITTEN March 1946
REPORT REVISED: September1962
REVISIONDISTRIBUTED: November15,1962
LIFETIME OF NEUTRONS lN REFLECTORS
Work done by: Report written by
M. Battat Kenneth M. KupferbergW. BrightW. HaneC. JanneyT. JorgensenK. KupferbergJ. ManleyM. Sands
TMS report expresses the opinlona of the authororauthors and does not necessarily reflect the opinionsor views of the Los Alamos Scientific Laboratory.
ContractW-’74O5-ENG.36 withtheU. S.AtomicEnergyCommission
-1-

ABSTRACT
The mean lifetime of neutrons from a D-D source is
measured in U, WC, and BeO reflectors by introducing a
short burst of neutrons into the center and observing the
subsequent time distribution. The percentage of U235
fissions delayed is determined for each of these reflec-
tors, and conclusions are drawn concerning the relative
effectiveness of the three materials.
3

TABLE OF CONTENTS
ABSTRACT
I.
II.
A.
B.
c.
D.
E.
F.
G.
III.
A.
B.
c.
D.
INTRODUCTION
EXPERIMENTAL ARRANGEMENT
The D-D Neutron Source
Modulation of the Deuteron Ion Beam
Pulse-Time Distribution Equipment
Schematic Arrangement of Apparatus
Calibration of the Pulse-Time Analyzer and
Delay Lines
Neutron Detectors
Reflectors
ANALYSIS OF DATA AND RESULTS
Measurements with Bare Source
Neutron Mean-Lifetime Measurements
Growth Curve for the Neutrons in the Reflector
Effective Multiplication of the Reflectors
●
Page
3
7
8
8
9
11
13
16
19
20
21
21
25
36
40
5

s
I. INTRODUCTION
The dynamic characteristics of a fast reactor depend
upon the time behavior of neutrons returned to the core by
a surrounding reflector. The influence on transient res-
ponse is of particular interest for application to accident
analysis. Neutron lifetime in several reflector materials
(U, WC, and BeO) was measured because of limitations in the
cross-section data required for computation of such quan-
tities.
The time distribution of the reflected neutrons is
investigated by introducing a short burst of neutrons into
the center of the reflector and measuring the growth and
decay of this short pulse of neutrons with suitable fission
detectors and a fast time analyzer. The mean lifetime of
the neutrons in the system is obtained from the decay curve
after the neutron source is turned off. The measurement
of the growth and decay curve, using a fission detector
and the fast time analyzer, makes it possible to obtain an
estimate of the percentage of fissions which are delayed,
the resolving time of the apparatus used in this experiment
7
being of the order of 10-7 sec.
235A program of time measurements with U , U238, and
Np237 fission chambers has been carried out using a number
of reflector materials. The reflectors investigated were
U, WC, and BeO.
11. EXPERIMENTAL ARRANGEMENT
A. The D-D Neutron Source.
The neutrons used for the time distribution experi-
ments were obtained from the D-D reaction with 200-kv
deuteron ions impinging on a thick heavy-ice (D20) target.
The 200-kv deuterons were obtained with a linear accelera-
tor, the accelerating voltage being supplied by a Cockcroft-
Walton quadruple. The beam of deuterons emerging from the
linear accelerator is magnetically analyzed so that the
atomic beam is spatially separated from the molecular beam.
The atomic deuteron beam is then collimated by two molybde-
num diaphragms with 3/16” diameter apertures. The well-
collimated beam strikes the heavy-ice target which is on
the face of a cold Cu tube out at 45° to the incident beam.
The target was cooled with a“liquid oxygen refluxing
system. The neutron yield was monitored by counting the
protons from the alternate D-D reaction.
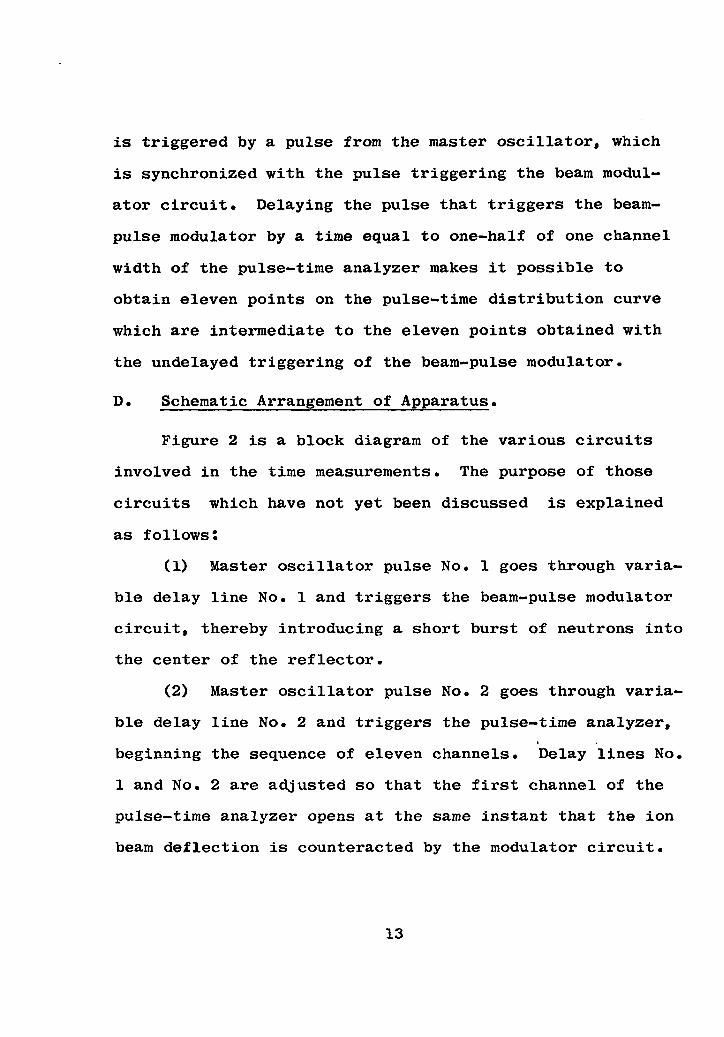
The source of D-D neutrons is located at the center of
8
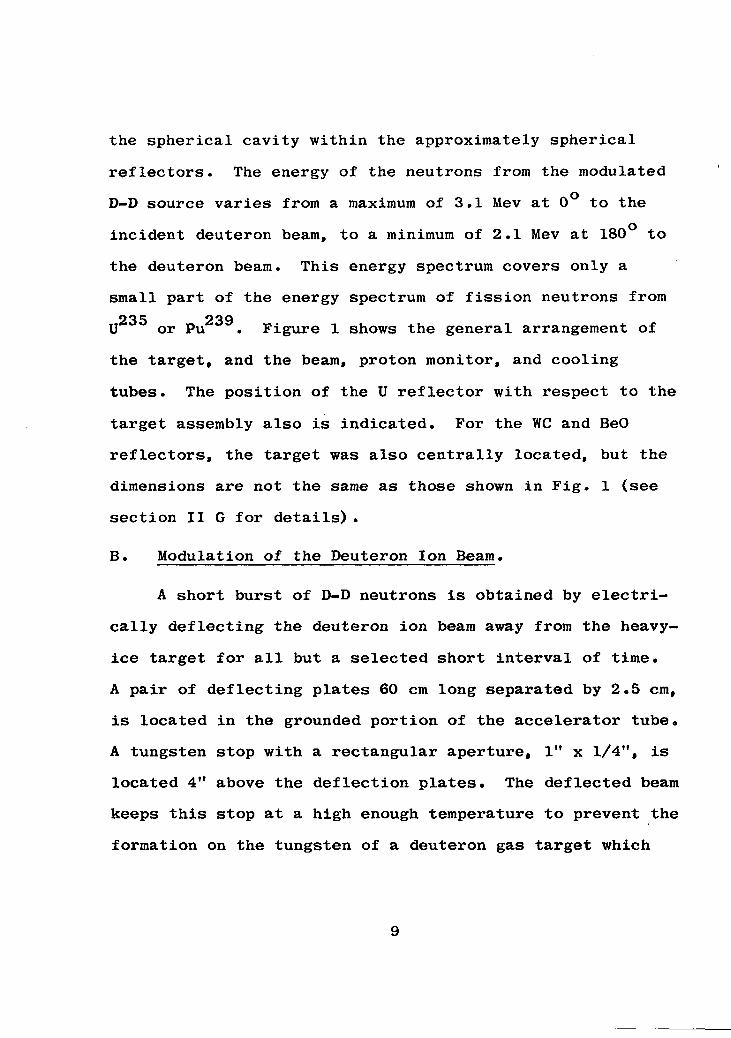
the spherical cavity within the approximately spherical
reflectors. The energy of the neutrons from the modulated
D-D source varies from a maximum of 3.1 Mev at 0° to the
incident deuteron beam, to a minimum of 2.1 Mev at 180° to
the deuteron beam. This energy spectrum covers only a
small part of the energy spectrum of fission neutrons from
~235or PU239. Figure 1 shows the general arrangement of
the target, and the beam, proton monitor, and cooling
tubes. The position of the U reflector with respect to the
target assembly also is indicated. For the WC and BeO
reflectors, the target was also centrally located, but the
dimensions are not the same as those shown in Fig. 1 (see
section II G for details) .
B. Modulation of the Deuteron Ion Beam.
A short burst of D-D neutrons is obtained by electri-
cally deflecting the deuteron ion beam away from the heavy-
ice target for all but a selected short interval of time.
A pair of deflecting plates 60 cm long separated by 2.5 cm,
is located in the grounded portion of the accelerator tube.
A tungsten stop with a rectangular aperture, 1“ x 1/4”, is
located 4“ above the deflection plates. The deflected beam
keeps this stop at a high enough temperature to prevent the
formation on the tungsten of a deuteron gas target which
9
could yield an undesirable production of neutrons. A D. C.
voltage is applied to one of the deflection plates for
alignment of the ion beam. The other deflection plate is
connected to the modulation circuit (see block diagram,
Fig. 2), which applies a potential of approximately 200
volts and at periodic intervals abruptly removes this
potential for a chosen interval of time, thus permitting
the beam to strike the heavy-ice target and produce a short
burst of neutrons. The rectangular voltage pulse generated
by the modulator circuit has a rise time of approximately
0.05 ~sec, and its duration could be varied from 0.5 to 4.0
Vsec in 0.5-psec steps. The circuit is triggered by pulses
from a master oscillator whose frequency can be continuous-
ly varied from 50 to 150 kc. The repetition rate of the
modulator voltage pulses is so selected as to
cient time for one burst of neutrons to decay
flector before another burst is introduced.
allow suffi-
in the re-
This method of modulation of the ion beam presents
much less difficulty than modulation of the beam at the
source which is at high potential (200 kv) . However, a
ion
disadvantage is the steady but small background of neutrons,
caused by two factors: (a) the entire ion beam is not
completely deflected onto the tungsten stop above the
deflection plates, and therefore can form stray deuterium
10
targets on the brass walls and defining apertures of the
beam tube (4’ long), and (b) those deuteron ions which are
not in the central part of the focused beam may manage to
strike the heavy-ice target even when the beam is deflected.
This background can be eliminated by using a larger de-
flecting potential, but it was not feasible to build a new
modulator circuit at the time of the experiment. The
steady background was always less than 1% of th~ peak of
the neutron burst and was adequately overcome by exper-
imentally determining its intensity and removing it from
the data.
c.. Pulse-Time Distribution Equipment.
The pulse-time analyzer, used to measure the time dis-
tribution of the burst of neutrons introduced into the
reflector, is an electronic circuit which creates a series
of eleven rectangular voltage pulses or gates, each of
approximately 0.45-Usec duration, which are successively
applied to eleven coincidence tubes. The amplified fis-
235,sion pulses from the U or U238 fission chamber are
applied to all eleven coincidence tubes. The first gate
makes the first coincidence tube conducting for the time
interval O to 0.45 ~sec; therefore, the first coincidence
circuit records only those fission pulses occurring in this
11
time interval. The second gate makes the second coinci-
dence tube conducting for the time interval 0.45 to 0.90
Wsec; therefore, the second coincidence circuit records
only those fission pulses occurring in this time interval;
and so on for the eleven gates. Each coincidence circuit
has a counting circuit and mechanical recorder. There
exist, therefore, eleven time intervals (commonly referred
to as channels) of approximately equal duration, covering
a 5-~sec time interval, which make it possible to simulta-
neously record the entire time distribution of the short
burst of neutrons if the growth and decay of this burst of
neutrons in the reflector takes place in less than 5 Msec.
The resolution of the pulse-time analyzer is deter-
mined by the time during which each channel records the
fission pulses. Ideally there would be a large number of
channels each of short duration compared with the duration
of the burst of neutrons in the reflector, so that the
growth and
experiment
1.0 Useco
decay could be accurately determined. For this
the duration of the modulator pulse was set at
Therefore, the pulse of neutrons spread over
only two or three channels of the pulse-time analyzer,
making it difficult to determine the shape of the neutron
burst. To overcome this difficulty, a method of experi-
mental interpolation was devised. The pulse-time analyzer
12
is triggered by a pulse from the master oscillator, which
is synchronized with the pulse triggering the beam modul-
ator circuit. Delaying the pulse that triggers the beam-
pulse modulator by a time equal to one-half of one channel
width of the pulse-time analyzer makes it possible to
obtain eleven points on the pulse-time distribution curve
which are intermediate to the eleven points obtained with
the undelayed triggering of the beam-pulse modulator.
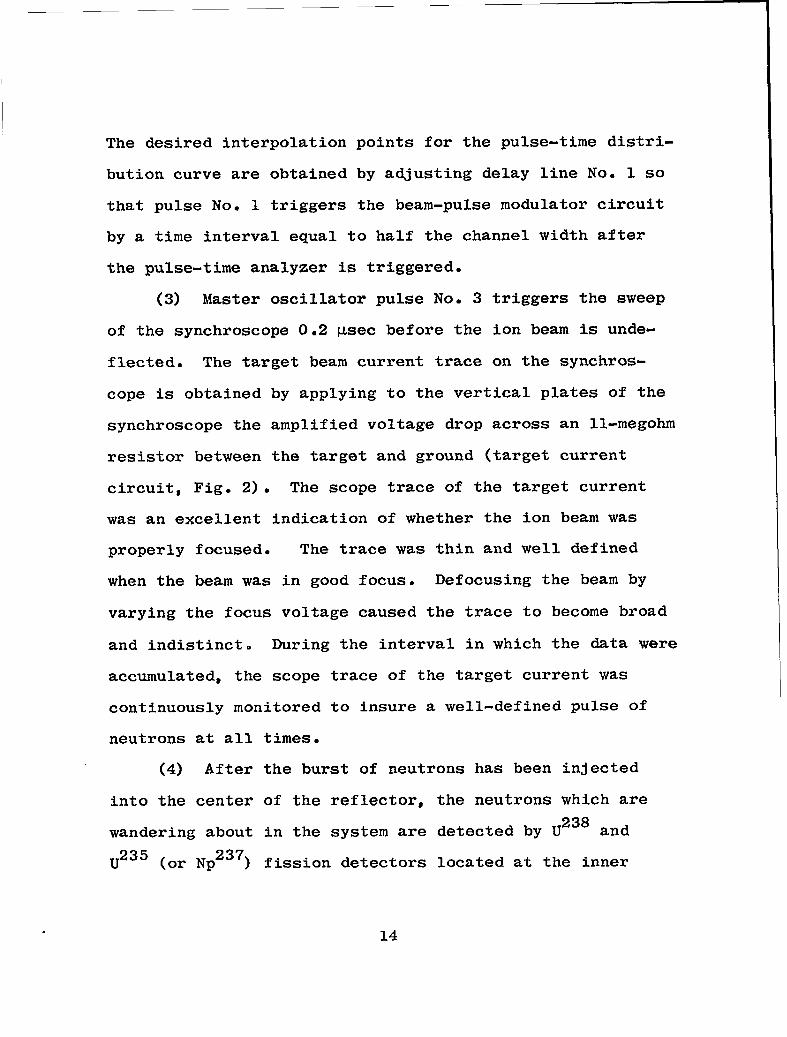
Do Schematic Arrangement of Apparatus.
Figure 2 is a block diagram of the various circuits
involved in the time
circuits which have
as follows:
measurements. The purpose of those
not yet been discussed is explained
(1) Master oscillator pulse No. 1 goes through varia-
ble delay line No. 1 and triggers the beam-pulse modulator
circuit, thereby introducing a short burst of neutrons into
the center of the reflector.
(2) Master oscillator pulse No. 2 goes through varia-
ble delay line No. 2 and triggers the pulse-time analyzer,
beginning the sequence of eleven channels. Delay ‘lines No.
1 and No. 2 are adjusted so that the first channel of the
pulse-time analyzer opens at the same instant that the ion
beam deflection is counteracted by the modulator circuit.
13
The desired interpolation points for the pulse-time distri-
bution curve are obtained by adjusting delay line No. 1 so
that pulse No. 1 triggers the beam-pulse modulator circuit
by a time interval equal to half the channel width after
the pulse-time analyzer is triggered.
(3) Master oscillator pulse No. 3 triggers the sweep
of the synchroscope 0.2 ~sec before the ion beam is unre-
flected. The target beam current trace on the synchros-
cope is obtained
synchroscope the
resistor between
circuit, Fig. 2) . The scope trace of the target current
was an excellent indication of whether the ion beam was
properly focused. The trace was thin and well defined
when the beam was in good focus. Defocusing the beam by
varying the focus voltage caused the trace to become broad
and indistinct. During the interval in which the data were
accumulated, the scope trace of the target current was
continuously monitored to insure a well-defined pulse of
neutrons at all times=
(4) After the burst of neutrons has been injected
into the center of the reflector, the neutrons which are
238wandering about in the system are detected by U and
U235 (or Np237) fission detectors located at the inner
14
by applying to the vertical plates of the
amplified voltage drop across an 11-megohm
the target and ground (target current
surface of the reflector (Fig. 1). The fission pulses from
each detector are amplified by a fast pre-amplifier and
amplifier (LASL Model 500) and fed through separate dis-
criminators which are set to eliminate the background and
alpha pulses. The U235 fission pulses are fed through
adjustable delay line No. 3 so that all these pulses are
delayed by a time interval larger than the duration of the
beam pulse.
(5) The total number of U235 and U238 fission pulses
is recorded by individual scaling circuits.
(6) The group of U238 pulses is fed to one grid of a
235mixer tube, and the group of U pulses, which are separ-
238ated in time from the U pulses, is fed to the second
grid. The U238 and U235 pulses (which are separated in
time) are sharpened by a blocking oscillator circuit. The
sharpened pulses have a rise time of less than 0.01 psec.
Mixing the two groups of pulses and keeping the groups
separated in time makes only one pulse-time analyzer cir-
cuit necessary.
(7) The sharpened U235 and U238 pulses are applied to
all eleven coincidence tubes of the pulse-time analyzer
The pulse-time analyzer records the U238
circuit. pulse-
time distribution in the first three or four channels and
the U235 pulse-time distribution in the remaining channels.
15
The repetition rate of the above sequence of events
is controlled by the frequency of the master oscillator.
The frequency is chosen so that there will be no overlap of
successive cycles; that is, one burst of neutrons will have
decayed in the system before another burst is injected.
E. Calibration of the Pulse-Time Analyzer and Delay Lines.
To determine the mean life of the neutrons in the re-
flector from the time distribution of fission pulses re-
corded by the pulse-time analyzer, it is essential to
obtain an accurate calibration of the channel widths, the
time interval during which pulses are recorded by each
channel. Two independent methods were used for the cali-
bration of the channel widths: (a) the random-count
method, and (b) the variable delay line pulser method.
The random-count method involves feeding random pulses
into the pulse-time analyzer. The channel width is calcul-
able if the counting rate of each channel, the total count-
ing rate, and the frequency of triggering of the pulse-time
analyzer are measured. The counting rate for each channel
is given by the expression:
Nr=Nt. trof
where
(1)
Nr = the counting rate of’ the rth channel
16
‘t= the total counting rate
t = the width of the rth,r channel
f = the frequency of triggering of the pulse-time
analyzer
The source of random pulses was the neutrons emitted from
a 200-mg Ra-Be source and detected by a U235 fission detec-
tor. To obtain a large random-pulse counting rate, the.
Ra-Be source and the detector were placed in a large block
of paraffin.
The only objection to the random-count method is that
it does not give an accurate time scale because there is a
finite time overlap or separation of neighboring channels.
This is because the rectangular voltage pulses or gates
which determine the channel widths do not have an infin-
itesimal rise time and cut-off time. The pulse-time
analyzer was adjusted so that there was a finite overlap of
adjacent channels. This is preferable to having gaps
between channels. To directly measure the absolute channel
widths and the overlap of adjacent channels, a calibrator
circuit was constructed. Tne calibrator is essentially a
pulser which
delay line.
triggers the
feeds pulses through a variable and tapped
Pulse No. 2 from the master oscillator
calibrator so that the pulses produced by the
calibrator are synchronized with the triggering of the
17
pulse-time analyzer, but the repetition rate of the pulses
is lowered so that the mechanical recorders for each
channel will not jam. It is possible to shift the pulses
in time continuously through the time interval of all
eleven channels by adjusting the variable and tapped delay
line. The beginning, end, and overlap of each channel is
then easily observable. The pulse from the calibrator has
a rise time of the order of 0.01 Wsec which enables the
channel widths to be determined to within [email protected] Wsec pro-
viding the variable and tapped delay lines of the calibra-
tor are determined to an accuracy of –ti.01 Wsec. The
average channel width measured was 0.45 Usec, and the over-
lap of neighboring channels was 0.04 psec. The channel
widths measured by both methods checked to within the
experimental accuracy of tio02 Usec.
The calibration of the variable and tapped delay line
for this calibrator was obtained as follows:
(1) The time standard was a Sickles circular-sweep
radar range finder which has a 100-kc crystal controlling
the sweep (one circular sweep equals 10 psec) .
(2) This standard was used to calibrate a radar sweep-
speed calibrator. The sweep-speed calibrator was adjusted
so that it produced a sine wave of 1 Mc frequency (10
cycles on the circular sweep) .
18
(3) The
calibrate the
sweep of this
(4) The
sweep-speed calibrator was used in turn to
sweep of a radar synchroscope. The fastest
scope was 0.18 wsec/in.
synchroscope was in turn used to calibrate
the variable and tapped delay line by determining the time
shift of the pulse on the scope screen after the pulse has
been
also
fed through the delay line.
Delay lines No. 1, No. 2, and No. 3 (Fig. 2) were
calibrated by feeding pulse No. 19 2,0r 3 from the
master oscillator through the delay lines and observing
the time shift of the pulse on the synchroscope screen.
F. Neutron Detectors.
Spiral fission chambers of the type designed by W. C.
Bright (LA-420) were used as neutron detectors. The spiral
foils of these detectors were coated with fissionable
U235,#38, or Np2370material,
detects those neutrons having an
Mev, the fission threshold. The
detects those neutrons having an
Mev, the fission threshold. The
The #38 fission chamber
energy greater than 1.1
Np237 fission chamber
energy greater than 0.4
U235 fission detector
covered with a thin cadmium cup (0.025” thick, density
3.6 gin/cc)detects neutrons having an energy greater than
0.22 evo
19
.
The spiral fission chambers have been made in differ-
ent sizes. The largest cylindrical chamber has outside
dimensions of 1“ diameter and 1-1/16” length, and the
smallest, outside dimensions of 3/8” diameter and 7/16”
length (Figs. 3, 6, 7, LA-420). The U238 and U235 fission
chambers used to measure the neutron time distributions
were of the largest size. The Np 237 and U238 fission
chambers used to obtain the time distribution measurements
indicated in Figs. 3 and 4 were of the smallest size.
The rise time of the fission pulses from these detec-
tors, measured with a fast sweep scope, was less than 0.1
wsec (measurement limited by the rise time of the fast
amplifier, approximately 0.05 to 0.1 ~sec) .
G. Reflectors.
The U reflector was in the form of a hollow sphere of
outside radius 9-1/2” and inside radius 3-17/32”. The WC
reflector was built of surface-ground blocks to form
roughly a pseudo-sphere of 14-7/8” diameter with a cubical
cavity 6-3/4” on a side. The BeO reflector was built of
blocks to form a pseudo-sphere of outside radius 9-1/2”
having a spherical cavity of radius 3-17/32”.
20
III. ANALYSIS OF DATA AND RESULTS
A. Measurements with Bare Source.
The time
modulated D-D
Np237
fission
target) . Two
distribution of the neutrons emitted from the
235source was investigated with U , U
238, and
detectors (no reflector surrounding the
sets of measurements were made with the U235
and U238 detectors of the largest size, and one set with
U238 237and Np detectors of the smallest size (see section
II F). The distance from the center of the target to the
front end of the fission chamber (end nearest target) was
3-17/32” for the large chambers and 1-1/2” for the small
chambers. The U235 and Np237 detectors were at 0° to the
incident deuteron beam, and the U238
detector was at 90°
to the incident beam. The finite rise time of the voltage
pulse (0.05 x 10⁻⁶ see) applied to the deflection plates,
and the finite diameter of the ion beam make it impossible
to obtain a pulse of neutrons which is rectangular (rise
time small compared with duration of pulse) .
At time t, the counting rate of the fission detector
is proportional to the neutron flux
and to the fission cross section of
f(t) = n(t) . v . CJf(v) .
through the detector
the detector nuclei.
A (2)
21
where
f(t) =
n(t) =
“v =
A=
C7f(v)=
number of detected fissions per second at time t
neutron density at the position of the detector
velocity of the neutrons
235 238effective number of detector nuclei (U , U ,
237or Np )
fission cross section of
neutrons of veloci~ty v
A channel of the pulse-time analyzer
the detector nuclei for
counts the number of
fission pulses, F(t), occurring at time t
val, At, equal to the width of a channel.
F(t) = f(t) . At
in a time inter-
(3)
The pulse-time distribution curves are plots of the number
of fissions recorded in each channel versus the time.
(Time t is chosen as the center of each channel.) The
calibration of the time scale was discussed in section II E.
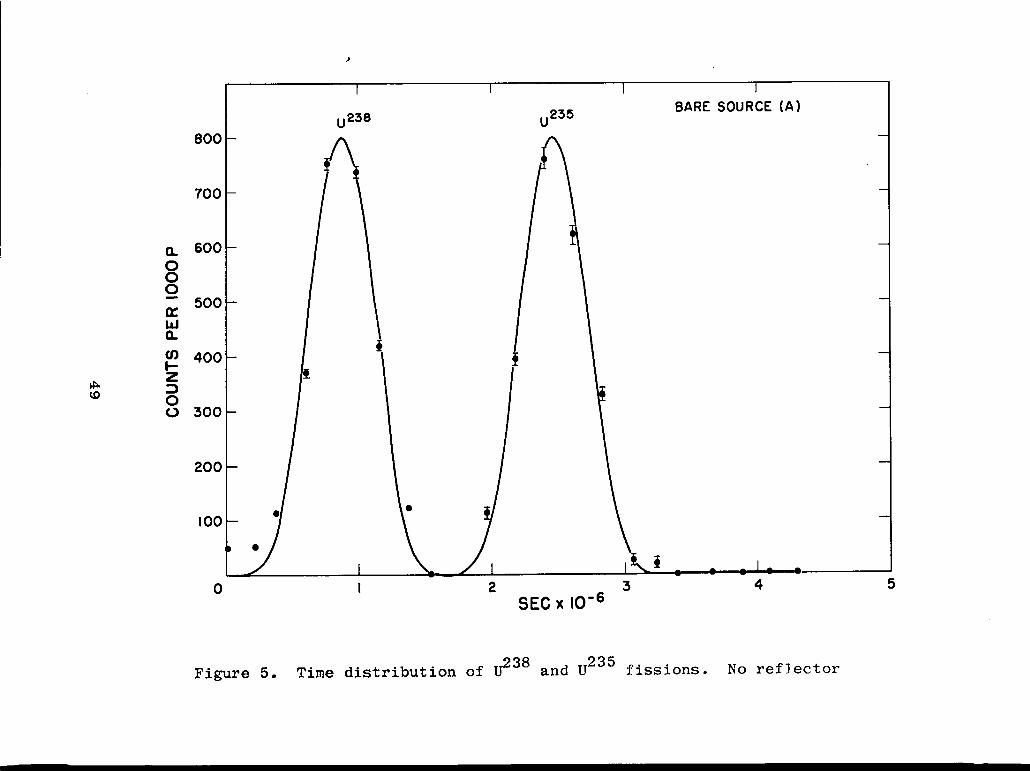
Since F(t) for the bare source is proportional to the
number of neutrons per second emitted from the source at
time t, the pulse-time distribution curve, F(t) vs t, is a
picture of the time distribution of neutrons emitted from
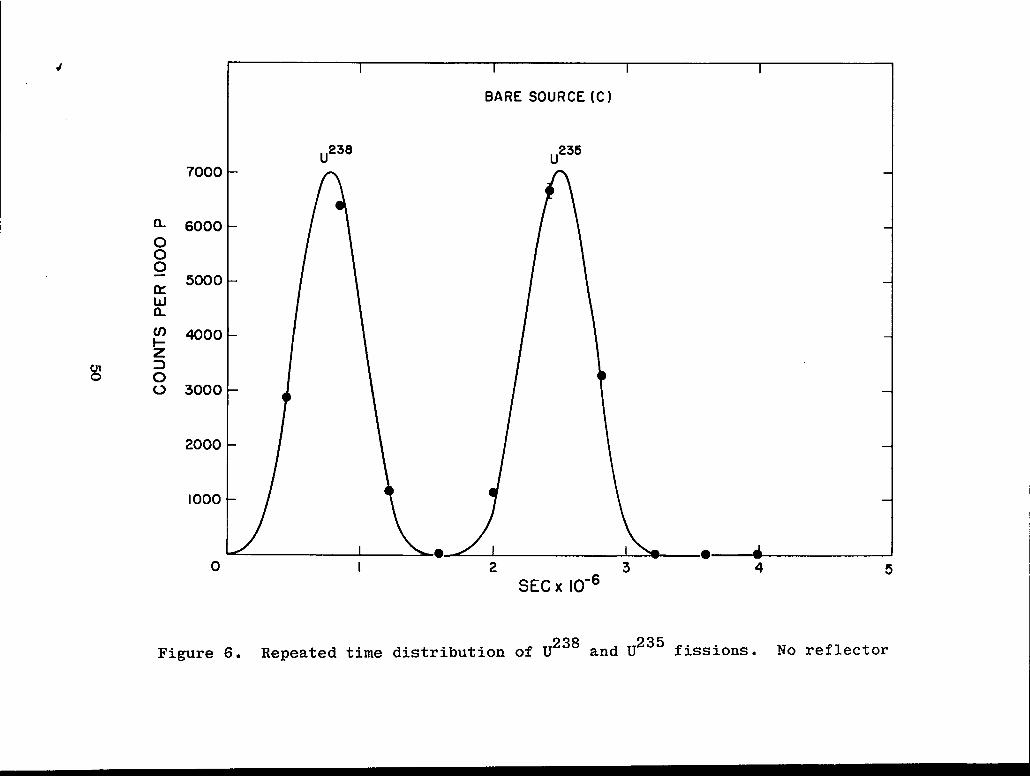
the modulated D-D source. Figures 3, 5, and 6 represent
three sets of bare source measurements, taken at regularly
spaced intervals during the course of the experiment. For
all three sets of bare source measurements, the U235 (or
22
Np237) fission pulses were delayed with respect to the U238
fission pulses by a time interval larger than the duration
of the modulated neutron source. This made it possible to
separate the two sets of data and to determine the shape
of the source function with two different fission detectors
under the same experimental conditions, using only one
pulse-time analyzer. The time distribution obtained with
the pulse-time analyzer is only a representative picture
of the burst of neutrons if the width of the channels is
small compared with the duration of the neutron burst. If
the neutron burst occurred in one channel of the pulse-time
analyzer, it would be impossible to tell whether or not the
burst of neutrons was rectangular. The duration of the
beam pulse chosen in this experiment was approximately four
times larger than the duration of one channel; therefore,
using the experimental interpolation technique described in
section II C, it was possible to obtain 8 points for the
time-distribution curve, adequate for obtaining a picture
of the neutron burst. For Figs. 3 and 5, the interpolation
method was used. The interpolation technique was not used
for Fig. 6, yet it was possible to draw a smooth curve
through the experimental points by knowing the shape of the
curves from Figs. 3 and 5. For all three bare-source
238measurements,the U data were normalized to the U235
23
(or Np 237) data by multiplying the U238 data by the ratio
of the U235to U238 (or Np237tou238) ~nt~gra~coun.~a~
recorded by the scalers (Fig. 2) .
The curve that could be fitted to the experimental
points for each set of data (U235, U238, or Np237) is of
the form
F(t) = F( ~ ) sin4 (~), O~t<T (4)—
where
T = duration of the neutron burst (sec)
F(T/2) = maximum of the bare-source function F(t) at
time t = T/2
The value of T for which F(t) best fits the experimental
data is T = 1.6 ~sec, which corresponds to a pulse of half
width (width at half height) of 0.58 Usec.
The ordinate used in all the pulse-time distribution
curves is the number of counts recorded by each channel for
1000 clicks of the proton
64,000 proton counts from
itored the neutron yield.
curves cannot be compared
monitor (scale of 64) . The
the alternate D-D reaction mon-
The ordinates of each of the
because the fission-pulse dis-
criminator biases, determining minimum pulse height of the
recorded pulses from the fission detectors, may have varied
from one reflector experiment to the next. The bias curve
24
of the fission detectors did not have a plateau, therefore
any drift or change in the discriminator settings caused
a change in the counting rate. The discriminator biases
were set well above the background level.
B. Neutron Mean-Lifetime Measurements.
When the bare source is surrounded by a reflector, the
neutron flux through the fission detector is increased by
those neutrons which are elastically and inelastically
scattered by the surrounding material. The number of fis-
sions vs time curve is not necessarily of the form given by
Eq. (4), as in the bare-source measurements, but depends on
whether the neutrons are reflected almost immediately (time
interval short compared with a resolving time of the appa-
ratus, (0.1 Usec), or whether they wander about in the
reflector for a finite (measurable) time before they are
removed by radia~ive capture or leakage out of the system.
In general, for an infinite reflector (no leakage), when
the source of neutrons is turned off, the neutrons which
are still wandering about are absorbed by radiative
capture, the probability of radiative capture per second
being
Pr = Nurv=+r
(5)
25
where
N=
v.
or =
Tar
number of capturing nuclei per unit volume
velocity of the neutrons
radiative capture cross section of the reflector
nuclei for neutrons of velocity v
mean lifetime of the neutrons in the reflector due
to radiative capture
For a finite reflector, an estimate of the leakage out of
the system can be obtained by using the one-velocity diffu-
sion theory. The probability of leakage of neutrons per
second out of a sphere of radius R is
AtrvD = diffusion constant = - = ~.
‘tr
(6)
(7)
where
Atr = transport mean free path for neutrons of velocity v
atr= transport cross section for
v = velocity of the neutrons
N = number of scattering nuclei
neutrons of velocity v
per unit volume
‘A = mean lifetime of the neutrons in the reflector
due to leakage
The diffusion theory is valid only if the probability of
scattering of the neutrons is much larger than the
26
probability of capture.
If l/~a is the probability of leakage and capture of
neutrons per sec,then
1+=7+$ (8)a r
where 7a is the mean lifetime of the neutrons due to cap-
ture and leakage.
Examination of all the U238 fission-pulse time dis-
tribution curves for the various reflectors (Figs. 4, 7-12)
indicates no essential difference from the shape of the
bare-source curve. Since the fission threshold of the U238
detector nuclei is 1.1 Mev, the inelastic scattering cross
section of the D-D neutrons to energies below 1.1 Mev can
be considered as a capture cross section as far as the U238
detector is concerned. The mean lifetime due to capture is
estimated using Eq. (5), in which ar is replaced by the sum
of the inelastic scattering and radiative capture cross
sections. Taking the average energy of the D-D neutrons
as 2.5 Mev and using the value of ain (inelastic) = 2 barns
for U and W (ain taken intermediate to tYinfor 3 Mev
neutrons which are inelastically scattered to energies
lower than 1.3 Mev and 0.75 Mev; LA-105, Table V), the
estimated value of Tr for U and W is of the order of
5 x 10⁻⁹ sec. The mean lifetime due to leakage of neutrons
27
out of BeO, W, and U reflectors can be estimated using
Eq. (6). Using the values of the transport cross sections
of 1.5 Mev neutrons in U, W, and BeO (Table IV LA-105), the
mean lifetime due to leakage from these reflectors is found
to be of the order of 10-8
sec. For BeO, Tj is of the
-8 237order of 5 x 10 sec for 0.4-Mev neutrons (Np fission
threshold) . Therefore the U238 detector time measurements
in U, WC, and BeO and the Np237 detector time measurements
in BeO should indicate no delay greater than 10-7 sec. The
resolving time of the time-measuring equipment is of the
order of 10-7 see; therefore, there should be no measurable
delay for the above mentioned cases (~ = 10-7 sec corres-
ponds to ain = 0.1 barn) . This agrees with all the exper-
imental data obtained using U238 and Np237
detectors (see
Figs. 4, 7-12). The I?38 time distribution curves for the
reflectors investigated can be used as a representative
picture of the neutron burst for comparison with the U235
time distribution curves.
The U235 fission detector, which is sensitive in the
entire energy range of interest (0.22 ev to > 3 Mev) was
used for the time measurements to determine whether or not
the neutrons of energy less than 1.1 Mev (U238 fission
threshold) have an observable decay time (greater than 0.1
Wsec) . As was pointed out, there are two processes for the
28
removal of neutrons, radiative capture and leakage. The
radiative capture cross section of neutrons for the heavy
elements such as U and W can, for a first order approxima-
tion, be considered as having a l/v dependence above 1 kev.
Therefore, the probability for capture can be considered
approximately constant throughout the energy interval 1 kev
to 1 Mev. The probability of leakage per second out of a
sphere (as given by Eq. (6)) increases with increasing velo-
city v (and atr decreases for increasing v) ; hence, the
leakage at high energies is more effective for the removal
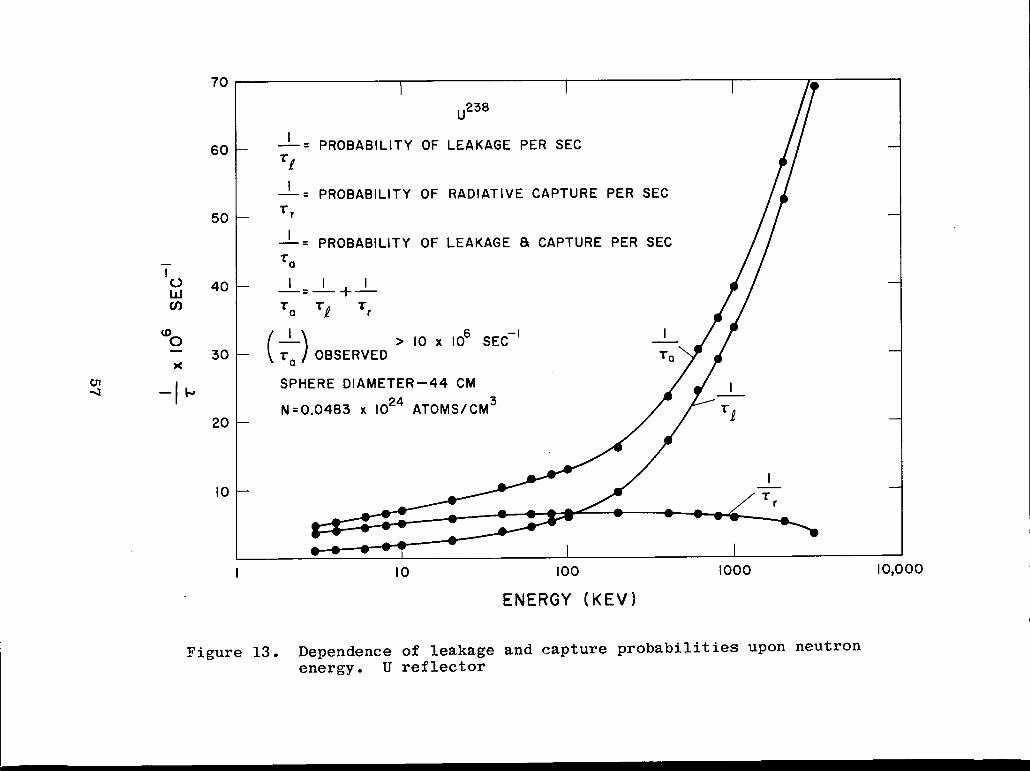
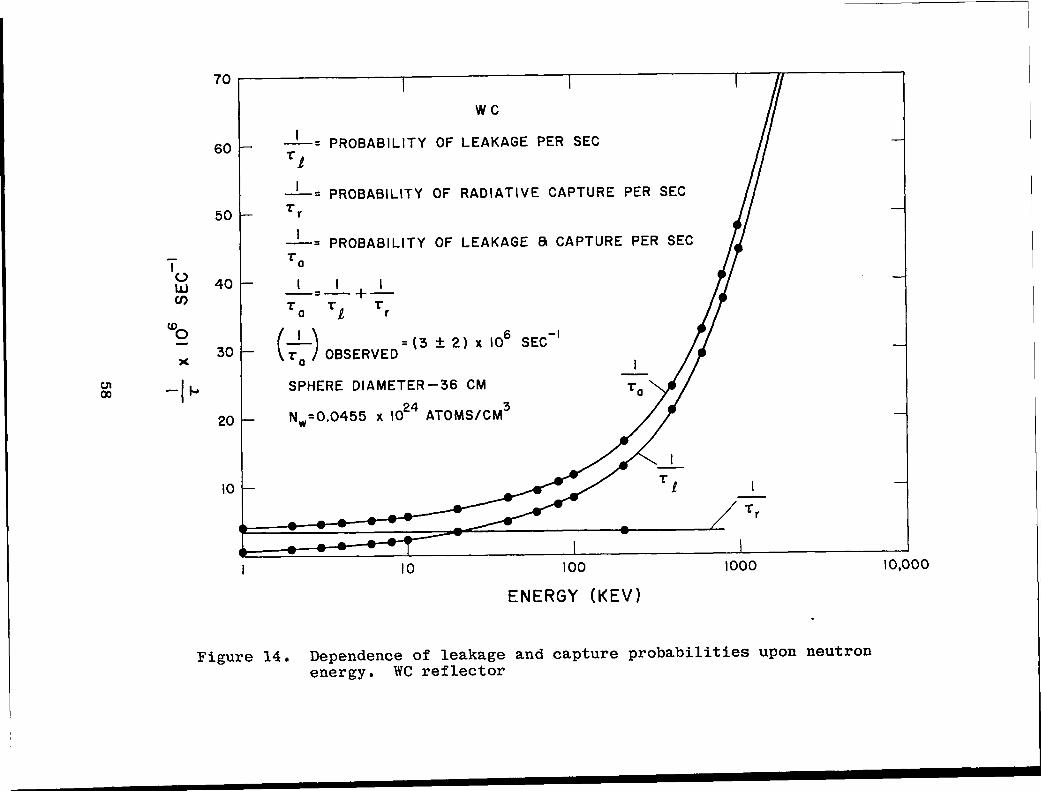
of neutrons than is the radiative capture process. Figures
13 and 14 are graphs indicating l/~J, l/Tr, and l/7a as a
function of the energy of the neutrons for spheres of U and
Wc . The probability of capture per second for U was calcu-
lated using the values of the radiative capture cross sec-
tion given in LA-179, Fig. 3. The probability of capture
per second for WC was assumed constant and was calculated
at 200 kev using the value ar = 0.12 barn (Table I, U-140
(CLASSIFIED)). The probability of leakage per second for
WC and U reflectors was calculated using Eqi (6), and it
was assumed that the systems with spherical cavities could
be considered as solid spheres, so that a first order
approximation of the leakage could be easily obtained. The
transport cross sections for U were obtained from LA-140
29
(CLASSIFIED) Fig. 19.
was obtained using the
19, and the values for
The transport cross section for WC
values for W given in LA-140, Fig.
C given in LA-256.
If the mean lifetime (Ta) of the neutrons, which are
either captured by the reflector material or leak out, is
determined, it is possible to make an estimate of the
average energy of the neutrons in the system from the
curves of l/Ta in Figs. 13 and 14. Examination of Figs.
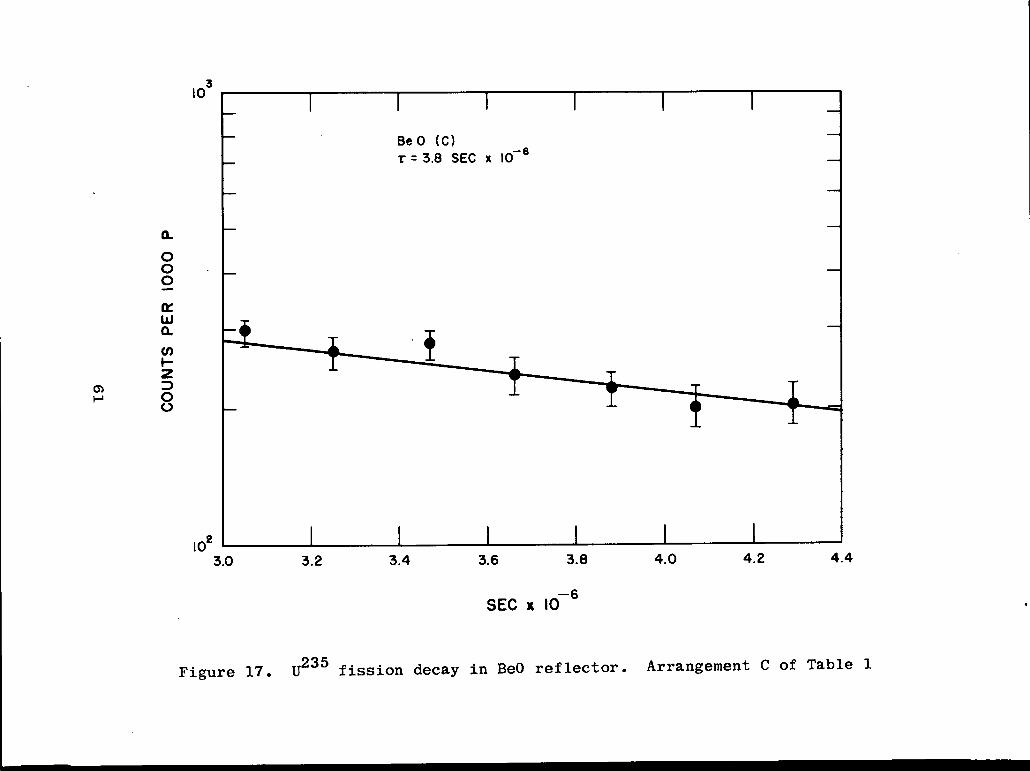
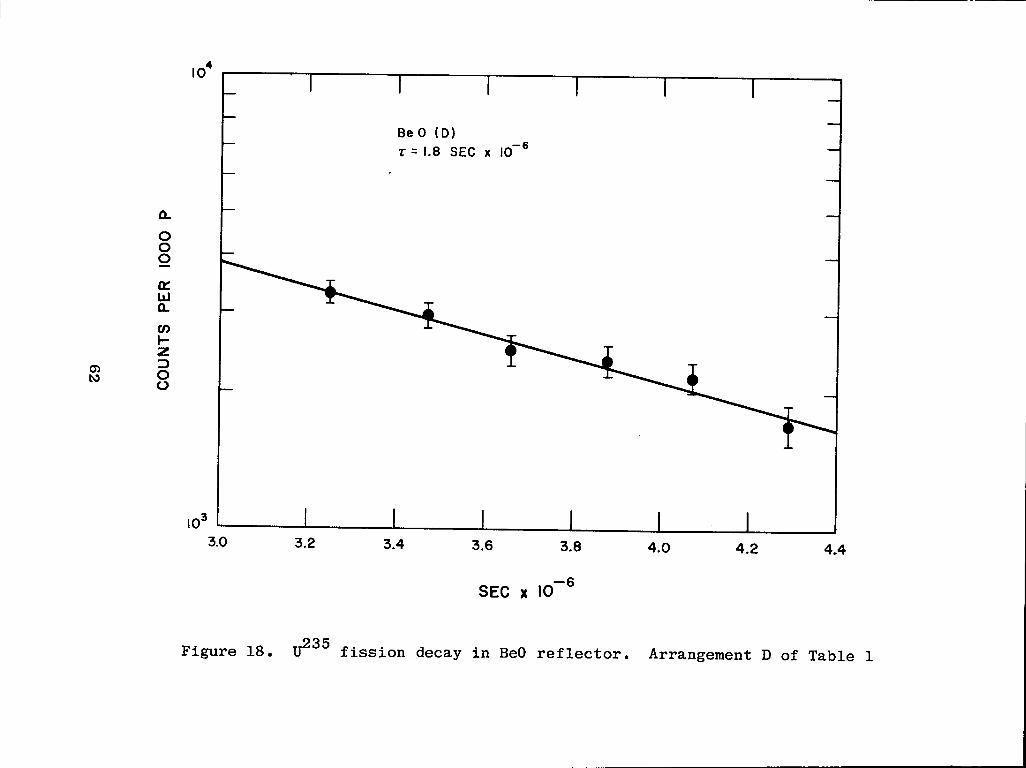
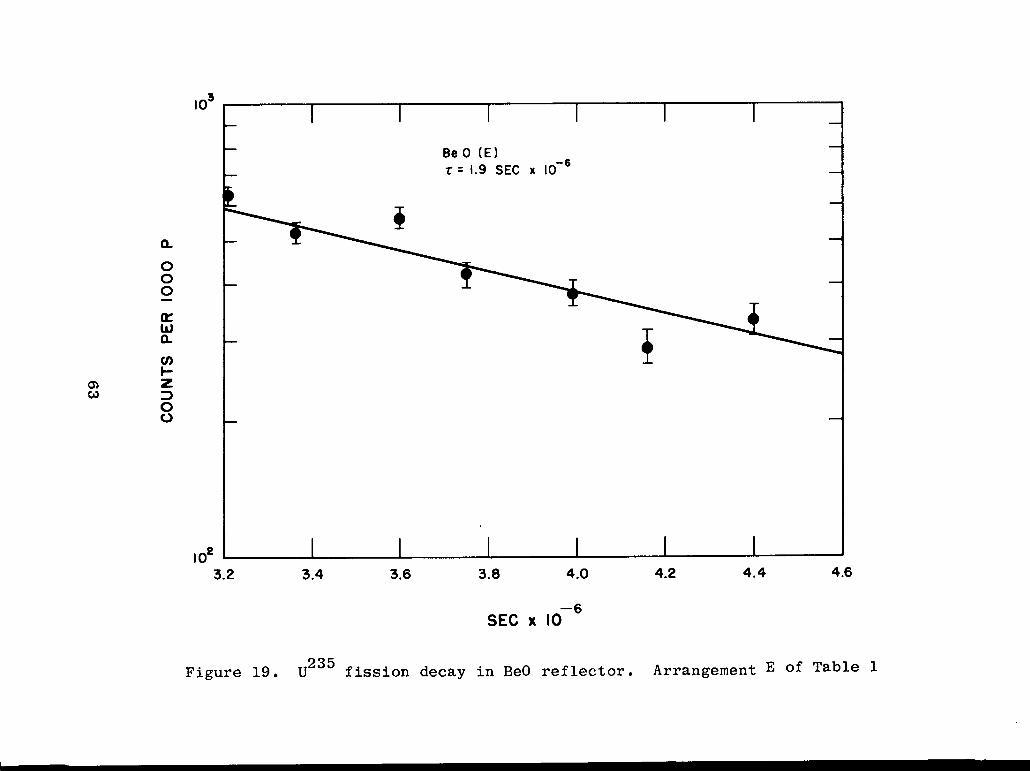
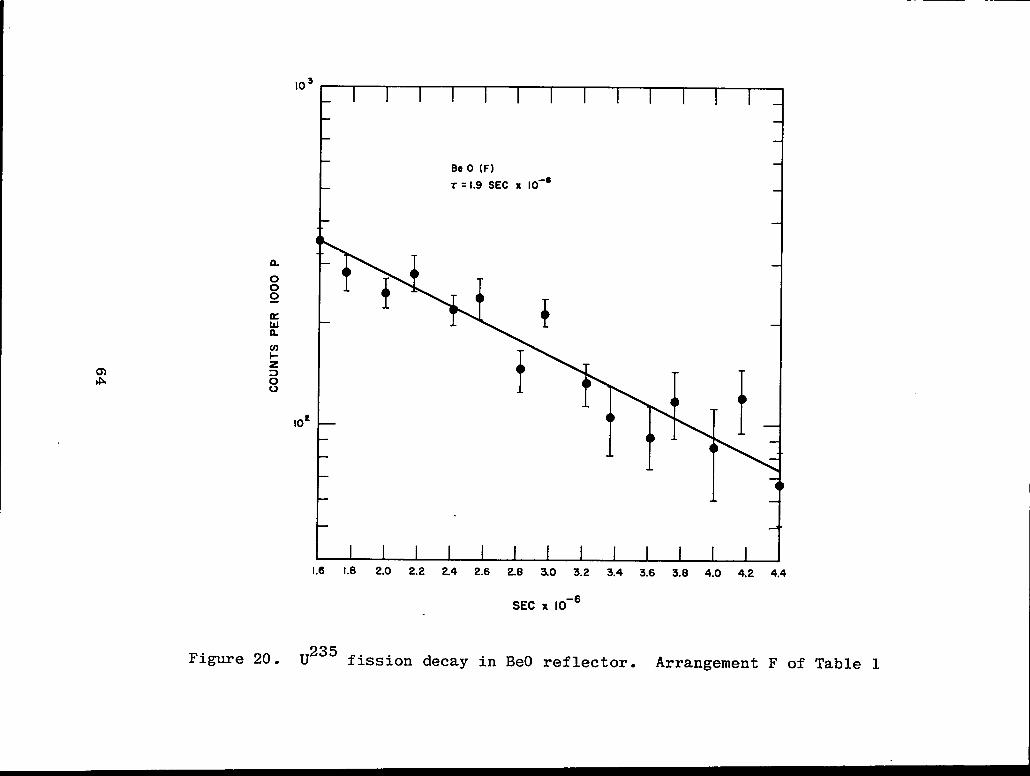
8-12 indicates that after the source of neutrons is turned
off, the U235 fissions detected decrease exponentially with
time. This exponential decrease can be represented by the
familiar decay equation
dF (t) F(t)r=-~
a
where -l/Ta is the slope
(9)
of the in F(t) vs t curve (Figs.
15-20) . F(t) is proportional to the neutron density n(t)
(Eq. (2) and (3)). Therefore, for neutrons of average
velocity ii,
If the spectrum
dn(t)= i&~
of neutrons in
( 10)
the reflector extends
over a large range of velocities, and if it is assumed that
the material is a l/v absorber and the probability of leak-
age is small compared with the probability of capture, it
can be shown that Eq. (10) is valid and does not depend on
30
the spectrum of the neutrons or the energy sensitivity of
the fission detector. Consider the spectrum of neutrons as
composed of m velocity groups vl, v2~ .... v then Eq. (2)m’
can be written as
(11)
Differentiating Eq. (11) and assuming dvi/dt = o gives
(12)
If there is only radiative capture in the material and neg-
ligible leakage,
1dni—= -
~ dt * = ‘N(ar\ ‘ii
(13)
Equation (13) is the familiar exponential decay equation.
For a l/v absorber, (ar]vi is constant for all values of i,
and Eq. (12) reduces to
[)~Fi1 di 1dn i
dt ‘~ dt= constant
~ F,
(14)
i=l ‘
which is equivalent to Eq. (10) and verifies the statement
31
made above.
When there is appreciable leakage out of the reflector
as compared with radiative capture, (l/ni)dni/dt is no
longer constant but increases with increasing energy of the
neutrons (l/Ta, Figs. 13 and 14). In this case, after the
source of neutrons is turned off, the Ta observed is a
complicated function of the neutron flux for each of the
energy groups of the neutron spectrum, and is also a func-
tion of the energy dependence of the fission cross section
of the detector nuclei and of the scattering and capture
cross sections of the reflector nuclei. Therefore, the
values of T 235a obtained from the U fission-pulse-time
curve are the representative values of the mean lifetime
of the neutrons in the reflector, only if the velocities
of the neutrons are in a narrow energy band, or if the
material is a l/v absorber for neutrons and leakage is
small compared with radiative capture.
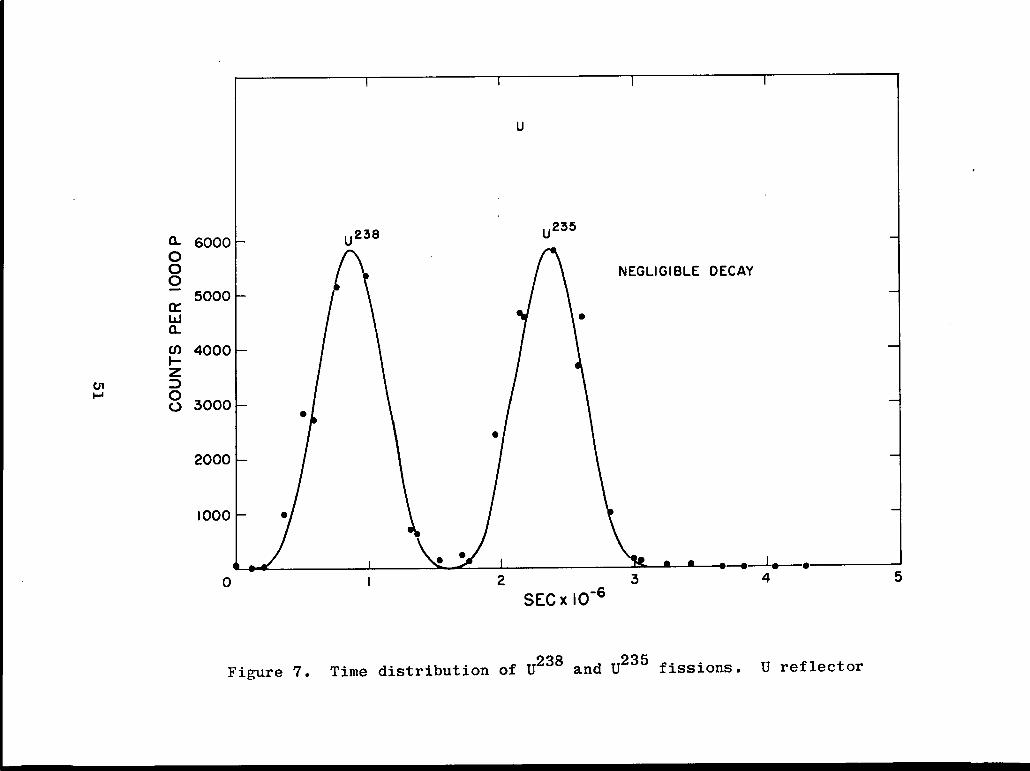
Table 1 contains the values of Ta obtained from Figs.
15-20. For the U reflector there was no measurable delay
after the neutron source was turned off (see Fig. 7);
therefore, one can estimate from the calculated curve of
l/Ta vs energy (Fig. 13), that the average energy of the
neutrons in the U reflector is greater than 50 kev if Ta
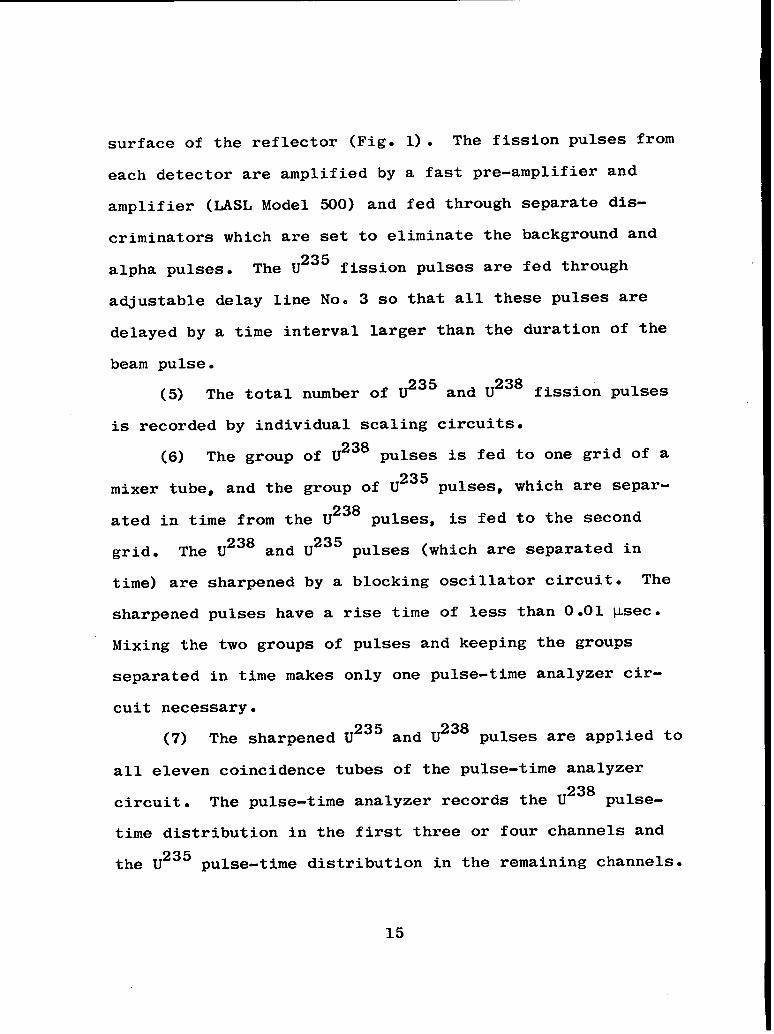
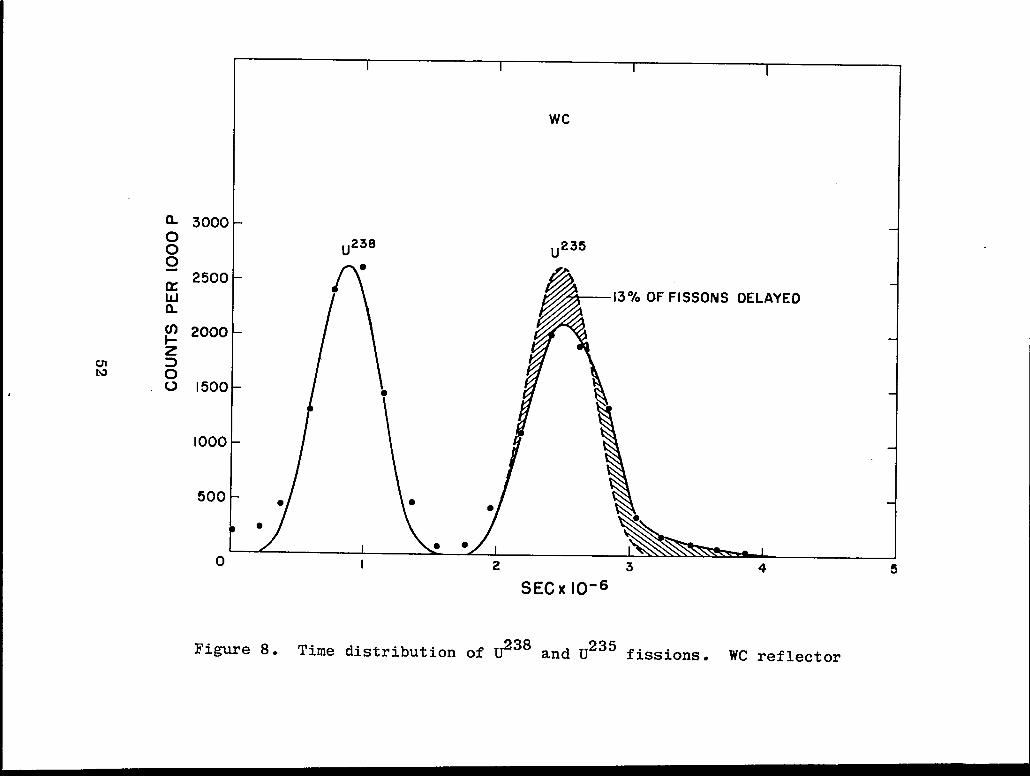
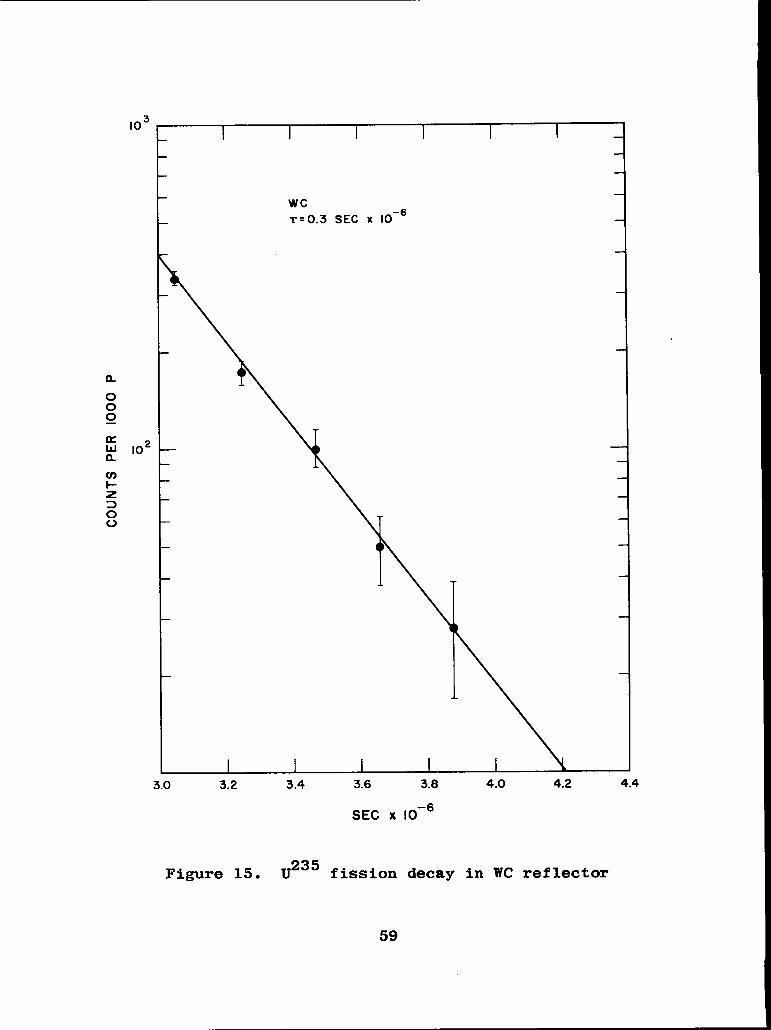
< 10-7 sec. The value of Ta = ().3 ~ 0.1 ~sec for the WC
32
●
0NA
m0)
*07
In..-l
‘mu0
InG-$w
-$
+t-@aN
c
.
33
reflector (Figs. 8, 15) indicates that the” average energy
of the delayed neutrons is of the order of 1 kev. Evidence
for such a low energy component for WC and a higher energy
for U was also found in the
trum emerging from critical
first with WC and then with
analysis of the neutron spec-
235assemblies of U reflected
U (LA-258). These transn
mission measurements (LA-258), using 95% BIO absorbers of
varying thickness, indicated that for the U reflector no
part of the emerging neutron spectrum was below 0.1 Mev,
whereas 2% of the spectrum from the WC reflector could be
attributed to 1.5-kev neutrons.
At thermal energy, the probability of capture of neu-
trons in a BeO reflector is of the order of 5% of the pro-
bability of leakage, and it is even smaller at higher
energies. Therefore one can consider the BeO reflector as
just a scattering medium for which the diffusion theory can
be applied. The mean lifetime, Ta, measured in this case
is
T2 T2 D+ “ < = ‘Kg+ “ ~ (15)
tr
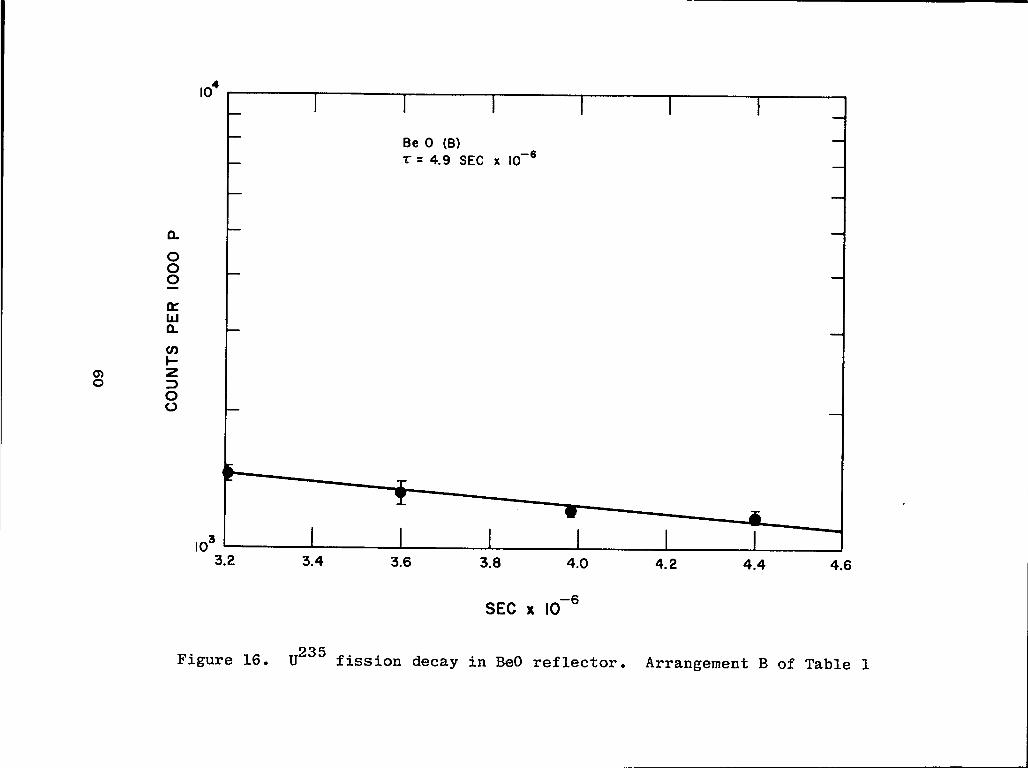
The U235 fission-pulse-time distribution for BeO was ob-
tained first with a cadmium and then with a boron cup
surrounding the U235
chamber. The boron cup was 3/8” thick
and had 0.0892 x 1024 atoms/cm3 of B (normal isotopic
34
mixture) . This cup would transmit (1/e)th of the neutrons
having an energy of 90 ev. The lifetimes were obtained
235 detector at 0°with the U and 90° to the incident beam
to investigate whether there was any angular asymmetry.
Within the experimental error, there was no observable
angular dependence of the measured mean lifetimes.
For an approximate calculation of the diffusion
constant for BeO, (density = 2.1 gm/cm3), the reflector is
considered as a solid sphere and Eq. (15) is utilized.
Using the value of Ta = 4.4 * 1.5 Wsec for the neutron
lifetime as measured with the U235 detector surrounded with
a cadmium cup, the diffusion constant D = (2.4 * 0.6)
62x 10 cm /see, which corresponds to a transport cross sec-
tion of (5.3 * 2) barns at an average energy of 45 ev. The
average energy of 45 ev was chosen because the pulse-time
distribution curves indicate that 46% of the fissions
delayed are in the energy range 0.22 to 90 ev. For the
energy range above 90 ev, the calculated diffusion constant,
using the average value of Ta = 1.9 * 0.3 Wsec, is (5.6 t
0.9) x 106 cm2/see, which corresponds to a transport cross
section of (3.2 * 0.5) barns at 90 ev. These cross sec-
tions at 45 and 90 ev are reasonable considering that the
thermal neutron scattering cross section for BeO is approx-
imately 8 barns.
35
c.
the
and
Growth Curve for the Neutrons in the Reflector.
For a rectangular source, the exponential growth of
235number of detected U fissions is
F(t) = F. (1 - e-t’T) (16)
the exponential decay of the detected fission after the
source of neutrons is turned off is
F(t) = F(T) ● e-(t - ‘)’7, /T (17)
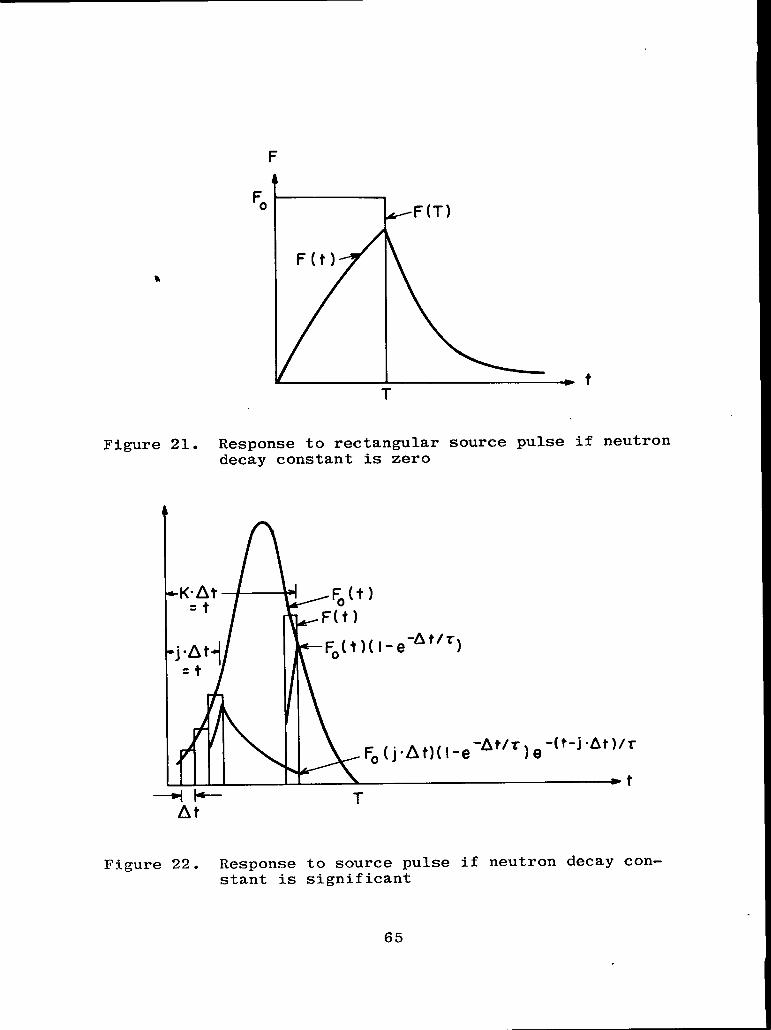
The rectangular pulse indicated in Fig. 21 would be the
shape of F(t) if 7 were infinitesimal. F. is the satur-
ation value of the detected fissions if the source were
left on for a long time instead of being turned off at time
t=T. F(T) is the number of fissions detected at time T
when the neutron source is turned off.
For the source of neutrons obtained from the modul-
ated D-D source, if there were no observable decay constant
T for the neutrons in the reflector, the fission-pulse-time
curve would have the same shape and duration as the bare
source fission-pulse-time curve given by Eq. (4). When
there is an observable neutron mean lifetime ~, the growth
of the fission-pulse curve can be calculated by considering
the source function, Fe(t),as being made up of a large
number of rectangular sources of width At (Fig. 22) . The
ordinate, F(t), of the growth curve at time t = kAt is the
36
sum of the ordinates at time t of the decay
preceding k - 1 rectangular source elements
curves of the
of width At
plus the ordinate of the growth curve of the kth
rectangu-
lar source element.
F(t) = Fo(t)(l - e[
1‘*t’T)+~-1Fo(j”At)(l - e-At’T)e-(t-j”At)’Tj+
( 18)
where T is the time constant for the exponential growth
curve. The first term in Eq. (18) is the kth
term of the
series in Eq. (18) . Therefore
F(t) = ~[ 1Fo(j OAt)(l -e-At/T)e-(t-j”At)/T
j=o
if
e-At/T . ~ _ ~y << 1,
Substituting Wq. (20) in Eq. (19)
k
[F(t) = ~ Fo(j=At)e
1
-(t-j ●At)/T. ~
j =0
Let j“At = t’ (t’ is the running variable) . Since At is
uniform, At = At’, and
F(t) = L im Z~o(t’)e-(t - “)/7. ~’]At’ —> o
or
t’=t.
[[F(t) = + dt’Fo(t’)e 1-(t-t’)/T. .
t’=o
-t/T ‘f=t
J[ 1tf/7F(t) = e ~ dt’Fo(t’)e
t?=o
(19)
(20)
(21)
37
~e+/Tis taken out of the integral since t’ is the varia-
ble) .
The differential equation of the growth curve is ob-
tained by differentiating Eq. (21)
dF(t) Fe(t) - F(t)
r“~ (22)
Proof:dF(t) + ~ . e_t/T . d(F.e
t/T, Fe(t)
dt T dt ‘~
t/T = 1t Fo(t’)
F(t)e et’/TT dt ‘
o
or-t/T t
F(t) =J
+ dt‘ ● F (t’)et’/To 0
It is interesting to note that if Fe(t) is a rectangular
function(fi)then Eq. (21) and Eq. (22) reduce to the
familiar form of
F(t) = F. (1 - e-t’T) (23)
and
all?(t) = ‘o - ‘(t)dt T (24)
The expression Fe(t) in Eq. (21) would be the fission-pulse-
time curve if T were infinitesimal, and is given by the
equation
Fe(t) = F( 4 ?rt~)sin(~) (4)
38
Equation (21) is valid for the time interval O to T
(T = duration of modulated source) . After the source is
turned off, the decay of the pulse of neutrons is given by
the exponential decay equation
F(t) = F(T)e-(t ~ T)/79 (25)
where.T/T T
F(T) = e ~J
F (t’)et’/7 dt’o0
One might, off hand, think that if the source function
is known and the value of the decay constant is measured
from the slope of the in F(t) vs t curve after the source
is turned off, one might calculate the shape of the rise
curve by the use of Eq. (21), which is easily integrable.
This would be valid if there were only one value of 7 while
the source of neutrons is on. Any arbitrary distribution
of neutrons in a reflector can be represented as a linear
combination of normal modes, analagous to the modes of
vibration of a vibrating string, (LA-29, CLASSIFIED) .
These normal modes have the property that the shapes of the
normal mode distribution do not change with time, but only
the amplitudes vary, either exponentially increasing or de-
creasing. The time behavior of this arbitrary distribution
of neutrons can be understood in terms of the exponential
rise or decay of its constituent normal modes. The
39
particular distribution of neutrons with which we are con-
cerned could be thought of as being composed of these nor-
mal modes. Each mode has its particular value of 7 for the
reflector, and after the source of neutrons is turned off,
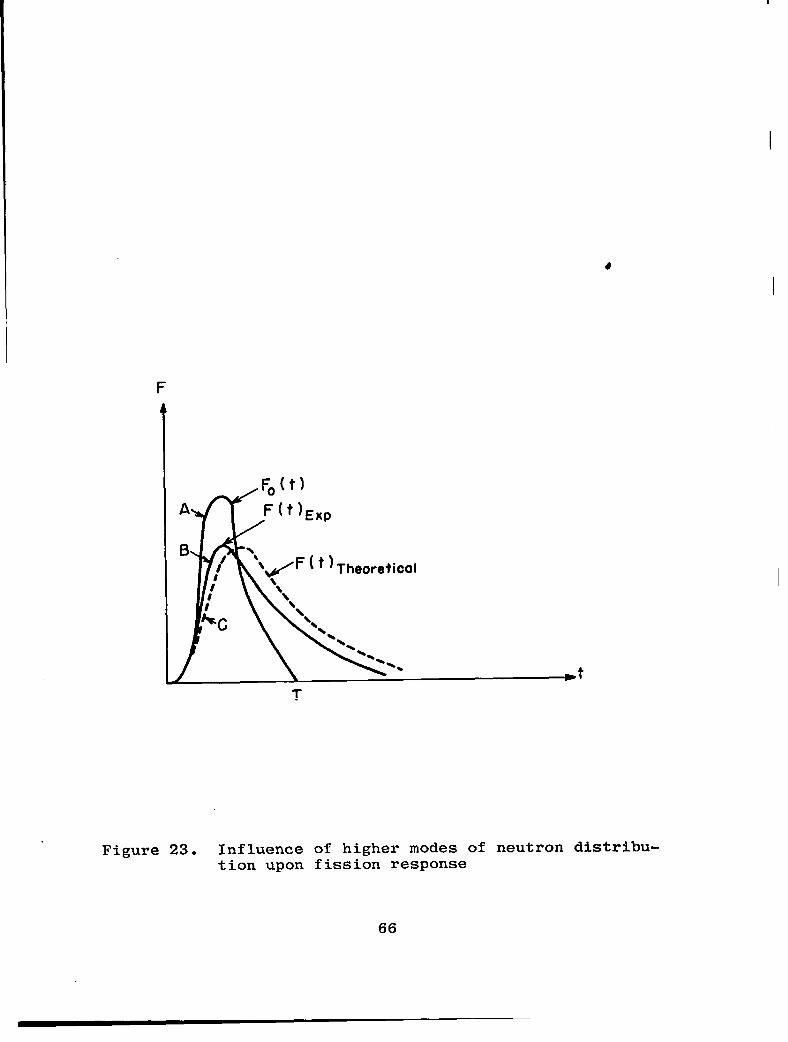
the fundamental mode (largest T) would persist, the higher●
modes dying out much more rapidly. The Ta measured by ,
investigating the exponential decay curve is the T of the
fundamental mode. This value of Ta cannot be used to pre-
dict the rise of the pulse-time distribution curve because
there are superimposed on the fundamental mode the higher
modes, which have a much shorter lifetime. Therefore the
rise of the experimental curve F(t) vs t would be faster
than that predicted using the T for the fundamental mode
(Fig. 23). This was checked and found to be the case.
D. Effective Multiplication of the Reflectors.
In addition to determining ~a, it is possible to
235measure the percentage of U fissions that are delayed,
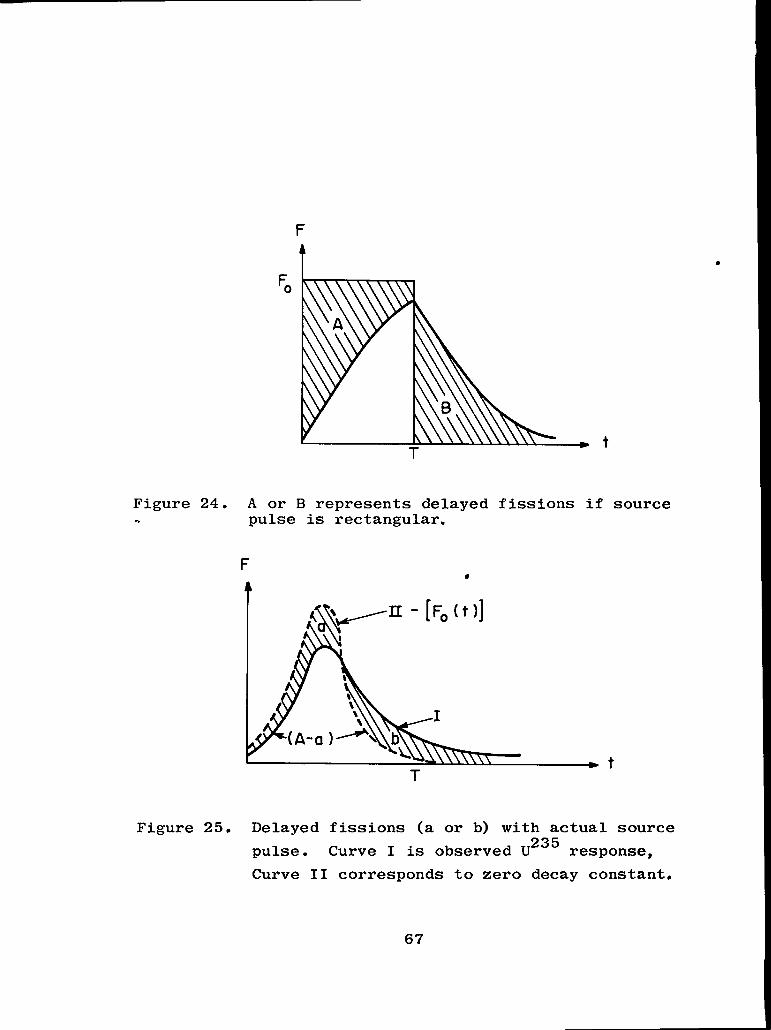
in spite of the complicated rise of curve B of Fig. 23.
For a rectangular source function, the fissions delayed
would be the shaded area A, or the shaded area B, (A = B),
of Fig. 24. For a source function which is not rectangular
in shape but of the form Fe(t) = F(T/2) sin4 (~t/T), the
fissions that are delayed are either shaded area a or b,
(a = b), in Fig. 25. Curve I of Fig. 25 is the pulse-time
40
distribution curve as measured with the U235 fission cham-
ber. Curve II of Fig. 25 would represent the pulse-time
distribution curve, if the decay constant Ta were infin-
235itesimal (i.e., if none of the U fissions are delayed
by a time greater than the resolving time of the pulse-time
-7analyzer, 10 see) . The shape and duration of curve II
238are known from the U fission-pulse-time distribution
curves obtained with the bare source and with a reflector
surrounding the source. The U235 fission-pulse-time dis-
tribution curves obtained with the bare source are also a
measure of the shape and duration of curve II, (Fe(t)) .
If the area A under curve I
maximum of the curve Fe(t))
I and II must have the same
J
TArea under Curve I = A =
o
is measured, then Fo(T/2) (the
may be determined, as curves
area underneath them.
dt “ Fo(~)sin4 (~)
or Fo(T/2) = (8/3) A/T (26)
In the evaluation of the data, the total area A under
curve I is measured with a planimeter. Fo(T/2) is then
calculated using Eq. (26), and curve II is drawn. Area a
or b is measured with the planimeter, and
U235fissions delayed, f, is calculated:
the fraction of
(27)
41
Measurements of the neutron reflection of various
materials have been carried out using a continuous source
of neutrons (LA-304-CLASSIFIED) . The multiplication, M,
defined as the ratio of the average counting rate in the
presence of a reflector to that for the bare source, was
measured at the inner surface of the reflector, the same
position at which all the modulation data was observed.
The pulse-time analyzer is useful in determining the U235
fissions that are delayed more than 10-7 sec (the resol-
ving time of the apparatus) . The unshaded area, (A-a), of
Fig. 25 is a measure of those U235 fissions which are de-
layed by less than 10-7
sec.
In view of the delayed U235 fissions, it is desirable
to define an effective multiplication, (Meff), of the re-
flector, taking into account only those U235 fissions which
are delayed by less than 10-7
sec (the resolving time of
the pulse-time analyzer) . This multiplication is defined
as the steady-state multiplication (Mst) times the factor
(1 - f), where f is the fraction of U235
fissions delayed,
Eq. (27).
M Meff = St (l-f)=”+ (28)
The effective multiplication of the various reflectors was
determined by measuring areas A and (A - a) with a
42
planimeter. Both steady-state and effective multiplication
values are included in Table 1.
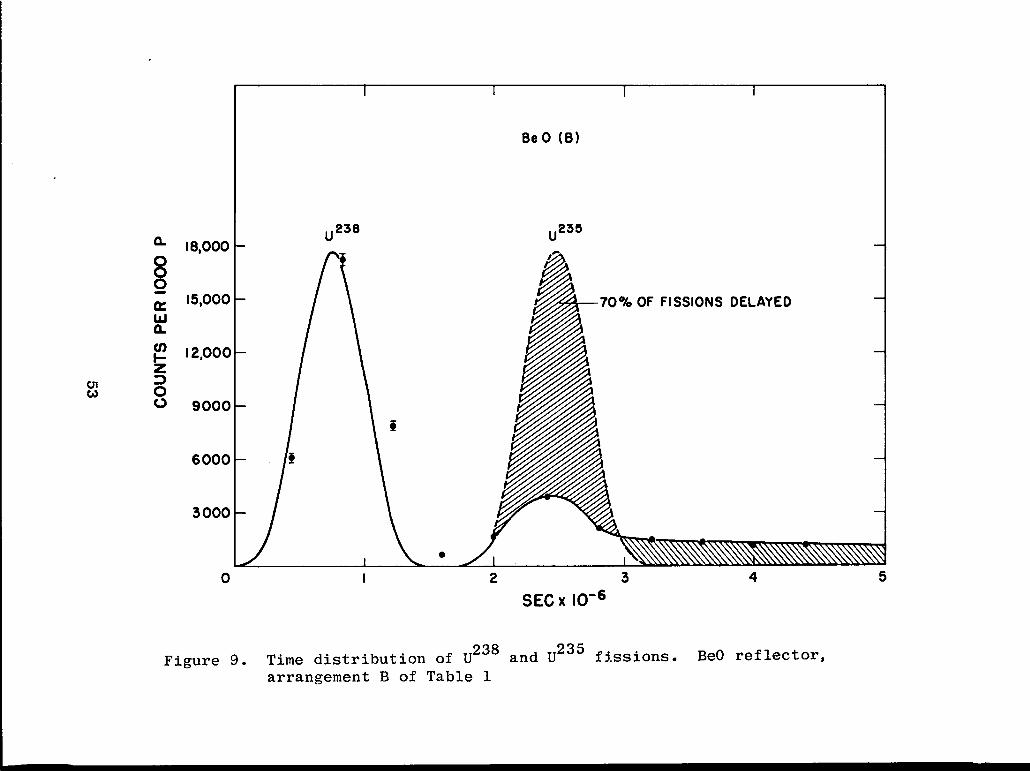
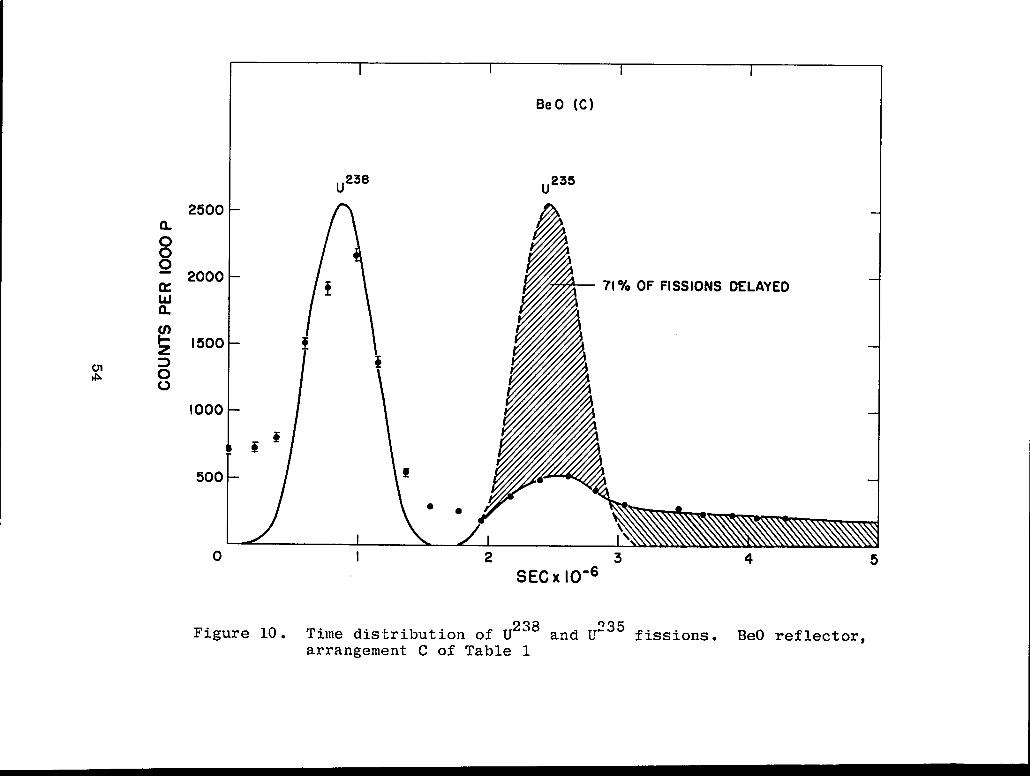
Figures 8, 10-12, (and Table 1) indicate the estimates
235of the percentage of U fissions delayed in the BeO and
WC reflectors. For all reflector and core measurements,
the U238 (or Np237) data were normalized to the U235 data
so that the
curves have
tion factor
U235and U238
the same area
was the ratio
fission-pulse-time distribution
underneath them. The normaliza-
of the integral U235
counts to
the integral U--- (or Np-””) counts which were recorded by
the scalers shown in Fig. 2. The neutron yield of the mo-
dulated source was monitored by counting the protons from
the alternate D-D reaction. As in the bare source measure-
ments, all data are taken for 1000 clicks of the proton
monitor counter (64,000 proton counts) . The ordinate on
all the time distribution curves is fission counts / 1000
proton counts.
The percentage of the U235 fissions delayed by more
than 10-7 sec for U was negligible (Fig. 7), whereas 13%
of the U235 fissions were delayed more than 10-7 sec for
WC (Fig. 8). This, in turn, 235means that the effective U
multiplication of the U reflector is approximately 30%
higher than the effective U235 multiplication of the WC
reflector (5.4 for U as compared with 4.10 for WC) .
43
The BeO reflector measurements are interesting in that
70% of the U235 fissions are delayed by more than 10-7 see,
yet the effective U235
and U238 multiplications are com-
235parable to the effective U and U238 multiplications of
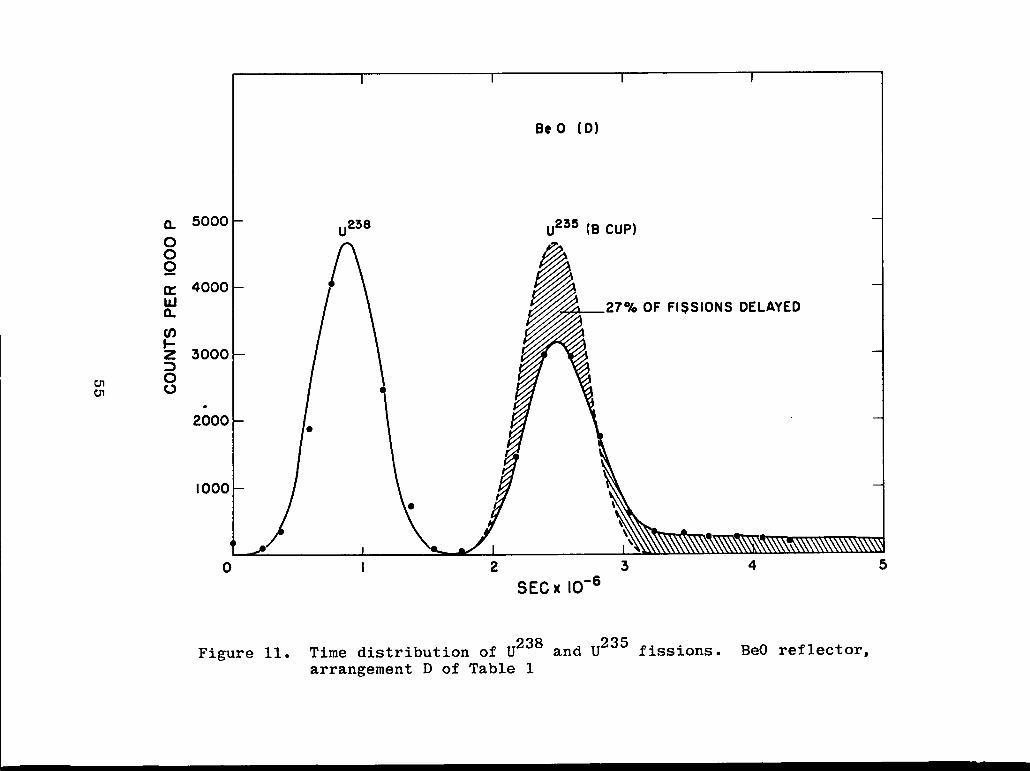
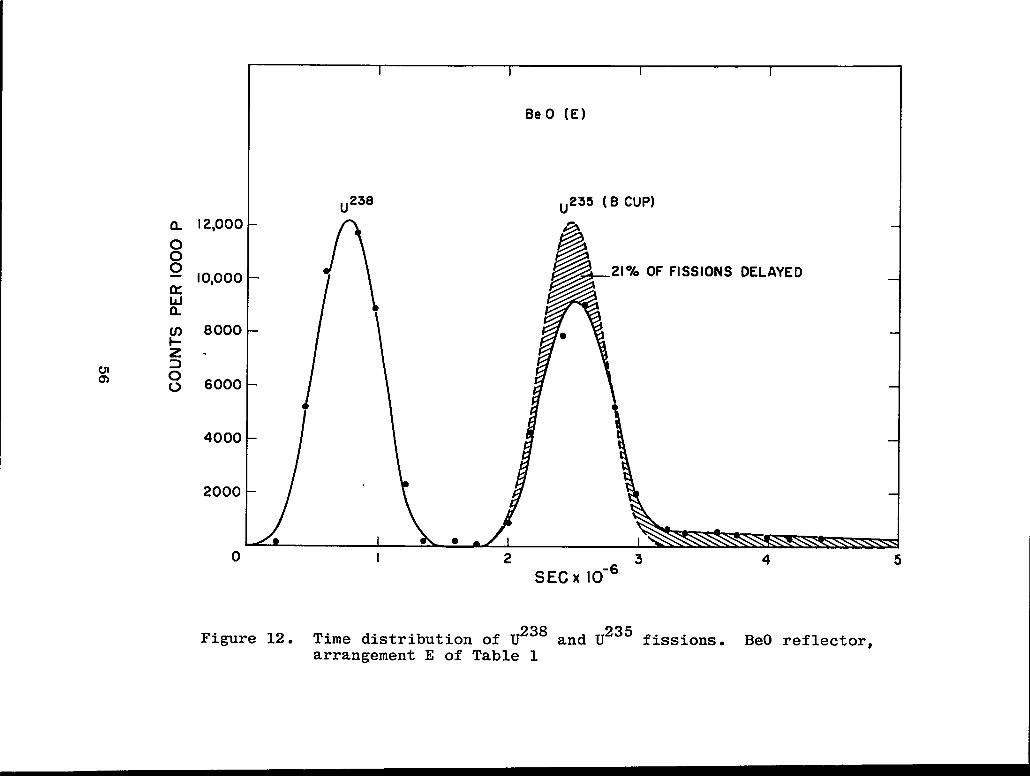
the U (Table 1). Twenty-four percent of U235 fissions are
delayed by more than 10-7 sec, as determined with a boron
cup surrounding the U235
fission detector, which indicates
that approximately 46% of the U235 fissions delayed are in
the energy range 0.22 to 90 ev (the boron cup transmits
(lth/e) of the neutrons having an energy of 90 ev).
44
O. D.- 19”
l“ DIAMETER
u
I/3/16” APERTURE
u
Figure 1. Experimental arrangement
45
1
>Ja
Awt
1
+ I-__J-/
—.—
-—.
I)
%!3w
mi
wL
zwa
1
J-E-l
46
Gi
d
●
❆✍
IoZn●
9
I1
*m
a‘o
ml
o
+:l-lf++a)AInco+$mv-l‘at%
47
Id
uo0
00
0m
lo
(2S
iw
El
8u
ml
o
●
ms!ov-l
‘u!3wo$(nV
+
‘a
48
.
o0co
t
●
o0
00
00
f-
(DIn
00
00
00
10
ml
h0.LJ
0z.
mcom%
alii+E-1
d0001
M3d
SlN
f103
49
d0001
U3d
SlN
f109
CQ
50
I.
●
u)mm
l3
●
m
(9
——
——
——
o0
0~
o0
00
0
00
0~
o0
0
Qin
om
cd
o
&o+woco
d0001
t43dS
lNf10951
II
II
II
wo
II
1I
II
om
o0
00
zo0
00
In~__
o%
Incd
wo
In
coa)
i!)v-lh
d0001
M3d
SIN
flO!)
52
IL
I% .
m
1I
II
I1
00
00
00
00
00
00
0-
00
00
0Lci-
ai
_N
m(0
m
&-
0mCrl
.riw
In
d0001
t13dS
IN(10053
la
0$v+h
o0
~o
00
mz
oU
3o
ml
ml
oIn
d0001
t13dS
lNf10954
mi
ILILo
o0
00
00
00
0~
o●O
Inm
w
o“
o0
u“o.co
Gov+mmda)&iiw
-lIA
d0001
tl~dS
INf100
55
II
II
II
m.
.u)
LLl
mN3
01%
.
v-lw
Inm
~o0
00
00
00
00
00-
0~
0cd
%n-
m=w
$N
a)$TI
h
d0001
tJ3dS
lNf109
.
II
tKa
ww
&n
...Id
Y l-”
\\
1
;–w
U5
w>
wTc>
111-1
a3
LIL
ILo
00
>>
IL
t->
1-1
-11.1
A.
11
—J-
-—-1n
iii
wa
–b’
>m
ro
+w
mm
nm
–P-o
1111
—
Il-o-
l—o-l-o
0to0
00
0In
*m
ml
1,_m
sso
lx
~
o—
333000——
>C9
wwzId
m“
d
57
awa.
c)3
Lo
11
-11-
(90x.ml
+1mII
-l-”
+-1-I-J
II
IIc-l-o-l-o
or-
0u-l
0d-0m
0N
58
.
103
102
WcT=O.3 SEC X 10-6
—
—3.0 3.2 3.4 3.6 3.8 4.0 4.Z 4.4
SEC X 10-6
Figure 15.~235
fission decay in WC reflector
59
r+
womw.2wmm
“r-l
d0001
k13dS
1N(700
E+
60
.
r-l
—
Ioxv-M
11
—l%
b
I1
I1
11
II
N*oe“fd“
2OQ
iswo
.Go.!+u)(n
d0001
N3d
SIN
f10061
GoIIb
II
II
II
II
II
1I
II
●O
**4o*mm’
Y“
Nti
l-l
n
r+
a.
‘o
II
II
II
I1
fI
@t-
—
11
1/
I1
II
*-*
2IQis.a‘i)
!’O:a)&
xo
0w;
u)Gw+
f++
m“
r+
d0001
tJ3dS
INf100
63
II
II
II
II
uI
1-1
1*
aN
tI
d
I.
i0u
.m
1m
mI
Wm“
*I
m“
al
ti
0Id
:
I.
II
II
I1.
1[
II
I1w
!0
—o
gwg
1a
i
(0IgM
VIa)
1+
9-40h.
aGvi
d0001
L13dS
lNf)0964
.
F.
/
F(t)
Figure 21. Response to rectangular source pulse if neutrondecay constant is zero
4
-+1--
,FJt)
-F(t)
+Fo(t)([-e-A+’r)
Fo(j” At)(l-e -At’r)e-(t-j”A+)’r
-tT
Figure 22. Response to source pulse if neutron decay con-stant is significant
65
I
I
F
Fe(t)
A
%
F(t)Exp
\/ ‘\./F ( t ) Theoretical
T
Figure 23. Influence of higher modes of neutron distribu-tion upon fission response
66
F
t
t
F.
Figure 24. A or B represents delayed fissions if source. pulse is rectangular.
F●
+
DtT
Figure 25. Delayed fissions (a or b) with actual source235
pulse. Curve I is observed U response,
Curve II corresponds to zero decay constant.
67

![Scalingof NonnuclearKinetic-Energy Antisatellites · Scalingof NonnuclearKinetic-Energy Antisatellites Gregoy 1-i.Canavan LosAlamosNationalLaboratory,~]~ ~[~~@)~ LosAlamos,NewMexico87545](https://img.pdfslide.us/doc/110x75/5cc7c2be88c993fb538c4757/scalingof-nonnuclearkinetic-energy-antisatellites-scalingof-nonnuclearkinetic-energy.jpg)


![OFTHEUNIVERSITYOFCALIFORNIA LOSALAMOS NEWMEXICO · A resume of the statusof suchapplicationsmaybe found in [17,Ch. 4]. Finally,there is the tradition stemmingfromvon Neumann [9],in](https://img.pdfslide.us/doc/110x75/5f4df2719da62e450a314842/oftheuniversityofcalifornia-losalamos-newmexico-a-resume-of-the-statusof-suchapplicationsmaybe.jpg)

![432thedrop.com432thedrop.com/.../06/turquoisworkhawi00hodgrich.pdf · TurquoisWorkofHawikuh,NewMexico "It [turquois]hasthevirtueofsoothingthesenseofvisionandthe mind,andofguardingagainstallexternaldangersandaccidents;it](https://img.pdfslide.us/doc/110x75/5f9620321c679465415058fb/turquoisworkofhawikuhnewmexico-it-turquoishasthevirtueofsoothingthesenseofvisionandthe.jpg)