Embed Size (px)
Citation preview

Journal of Economic Perspectives—Volume 25, Number 2—Spring 2011—Pages 111–132
A merican manufacturing experienced a tumultuous decade even before the Great Recession, leading to a dispute over whether the sector has been “hollowed out” by imports, or whether it has developed into a leaner, more
efficient industrial sector. It turns out that this dispute has much to teach about how the substitution of imported for domestically produced goods and services—often known as offshoring—can lead to overestimates of U.S. productivity growth and value added.
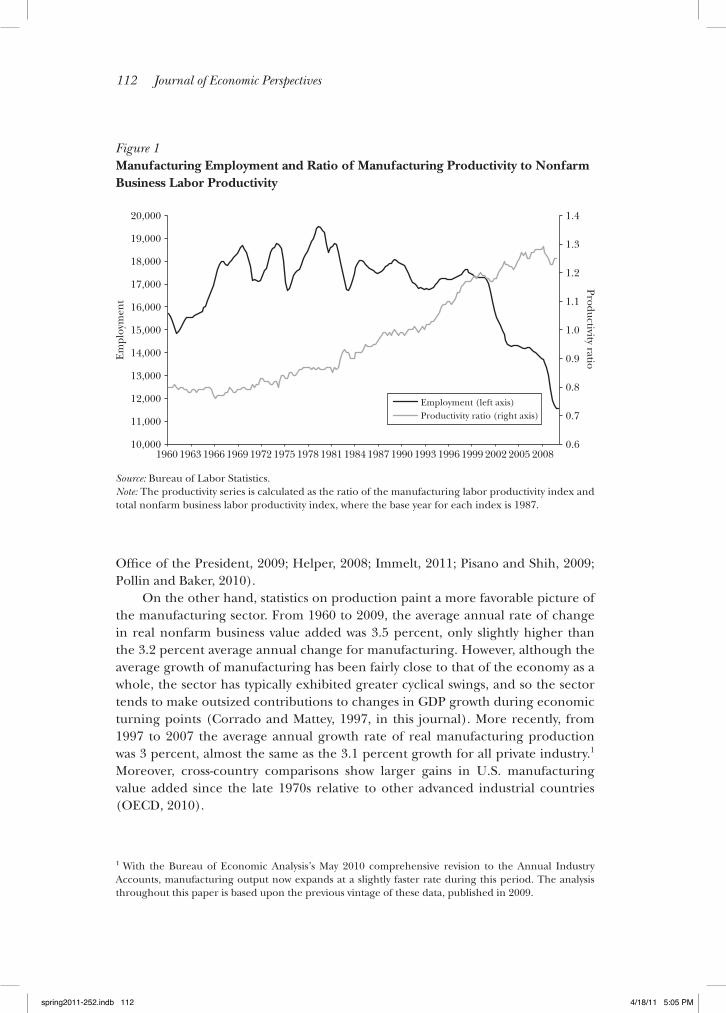
On the one hand, dramatic drops in employment are often taken to portray a manufacturing sector in decline. The precipitous decline in manufacturing employ-ment since the late 1990s is evident in Figure 1. Manufacturing employment never rebounded after the 2001–2002 recession as it had following previous downturns. Indeed, from 1997–2007—that is, in the decade before the 2007–2009 recession—manufacturing employment declined by 20 percent, or roughly 3.4 million jobs. Reflecting plant closures that accompanied the employment declines, the net number of manufacturing establishments fell by 8 percent from 1997 to 2007. The nominal share of manufacturing value added in GDP fell from 15.4 percent in 1997 to 11.7 percent in 2007. These facts have prompted a recent spate of government and private sector proposals to revitalize manufacturing (for example, Executive
F1
Offshoring Bias in U.S. Manufacturing
■ Susan Houseman is Senior Economist, Upjohn Institute for Employment Research, Kalamazoo, Michigan. Christopher Kurz and Paul Lengermann are economists in the Division of Research and Statistics, and Benjamin Mandel is an economist in the Divi-sion of International Finance, all at the Board of Governors of the Federal Reserve System, Washington, D.C. Their e-mail addresses are ⟨[email protected]⟩, ⟨christopher.j.kurz @frb.gov⟩, ⟨[email protected]⟩, and ⟨[email protected]⟩.doi=10.1257/jep.25.2.111
Susan Houseman, Christopher Kurz, Paul Lengermann, and Benjamin Mandel
spring2011-252.indb 111 4/18/11 5:05 PM
112 Journal of Economic Perspectives
Office of the President, 2009; Helper, 2008; Immelt, 2011; Pisano and Shih, 2009; Pollin and Baker, 2010).
On the other hand, statistics on production paint a more favorable picture of the manufacturing sector. From 1960 to 2009, the average annual rate of change in real nonfarm business value added was 3.5 percent, only slightly higher than the 3.2 percent average annual change for manufacturing. However, although the average growth of manufacturing has been fairly close to that of the economy as a whole, the sector has typically exhibited greater cyclical swings, and so the sector tends to make outsized contributions to changes in GDP growth during economic turning points (Corrado and Mattey, 1997, in this journal). More recently, from 1997 to 2007 the average annual growth rate of real manufacturing production was 3 percent, almost the same as the 3.1 percent growth for all private industry.1 Moreover, cross-country comparisons show larger gains in U.S. manufacturing value added since the late 1970s relative to other advanced industrial countries (OECD, 2010).
1 With the Bureau of Economic Analysis’s May 2010 comprehensive revision to the Annual Industry Accounts, manufacturing output now expands at a slightly faster rate during this period. The analysis throughout this paper is based upon the previous vintage of these data, published in 2009.
Figure 1 Manufacturing Employment and Ratio of Manufacturing Productivity to Nonfarm Business Labor Productivity
Source: Bureau of Labor Statistics.Note: The productivity series is calculated as the ratio of the manufacturing labor productivity index and total nonfarm business labor productivity index, where the base year for each index is 1987.
0.6
0.7
0.8
0.9
1.0
1.1
1.2
1.3
1.4
10,000
11,000
12,000
13,000
14,000
15,000
16,000
17,000
18,000
19,000
20,000
1960 1963 1966 1969 1972 1975 1978 1981 1984 1987 1990 1993 1996 1999 2002 2005 2008
Employment (left axis)Productivity ratio (right axis)
Em
ploy
men
tProductivity ratio
spring2011-252.indb 112 4/18/11 5:05 PM

Susan Houseman, Christopher Kurz, Paul Lengermann, and Benjamin Mandel 113
These disparate trends in the manufacturing data—steep employment declines and strong output growth—are commonly reconciled by referring to high produc-tivity growth in the manufacturing sector (for example, Reich, 2009). The steadily increasing series displayed in Figure 1 shows the ratio of the Bureau of Labor Statistics labor productivity index for manufacturing to the BLS labor productivity index for all nonfarm business since 1960; the series indicates that labor productivity grew considerably faster in manufacturing throughout the period. This happened while the share of manufacturing employment in the economy fell. Indeed, the average annual growth rate of labor productivity in manufacturing from 1997 to 2007 was 4.1 percent, compared to 2.7 percent for all nonfarm business. Manufacturing labor productivity also grew substantially faster in the United States than in most other industrialized countries during that decade (U.S. Department of Labor, Bureau of Labor Statistics, 2009a). The rapid growth in labor productivity has more than offset the declines in labor input and has permitted firms to sustain robust growth in real value added.2
Some studies have pointed to the robust output and productivity growth to argue that the manufacturing sector is relatively healthy (for example, Executive Office of the President, 2009). Our work, however, suggests the story is more complex. The aggregate numbers are unrepresentative of the trends in most manufacturing industries. Moreover, in this paper we will delve into the issues of measuring produc-tivity and value added growth in manufacturing and discuss reasons to qualify this optimistic conclusion.
As a starting point, the robust output and productivity growth in manufacturing is largely attributable to one industry: computer and electronic products manufac-turing. Although computer and electronics products account for only about a tenth of manufacturing value added, the sector contributed two-thirds of overall manu-facturing growth in real value added from 1997 to 2007. As a result, the aggregate numbers on manufacturing production do not accurately characterize trends in much of the sector.
But the central theme of this article will be to explore how the measurement of productivity and value added in manufacturing has been affected by the dramatic rise in imports of manufactured goods, which more than doubled from 1997 to 2007. In particular, we focus on imports of intermediate goods into the manufac-turing sector. Although government surveys do not explicitly track the destination of imports to final and intermediate uses, the Bureau of Economic Analysis uses what is called the “import comparability” or the “proportionality” assumption, which assumes the import share of a particular commodity is the same in all indus-tries using that input and equals that commodity’s import share in the economy as a whole. Using this method, the Bureau of Economic Analysis estimates that the import share of intermediate material inputs used by manufacturers increased from
2 In addition, the relatively faster gains in manufacturing productivity have resulted in lower goods prices relative to nonmanufactured goods and services, which, in combination with inelastic demand for goods (on average), have contributed to a decline in manufacturing’s share of nominal output.
spring2011-252.indb 113 4/18/11 5:05 PM

114 Journal of Economic Perspectives
under 17 percent in 1997 to 25 percent in 2007. This dramatic shift in sourcing of intermediate goods from domestic to foreign suppliers is plotted in Figure 2.
Figure 2 also classifies the imported intermediate materials by type of source country: developing, intermediate, and advanced. We label countries with less than 20 percent of U.S. per capita GDP in 2008 as developing, and with a few exceptions that are mainly Middle Eastern oil producers, we label countries with per capita GDP equal to or exceeding two-thirds that of that in the United States as advanced. The remaining countries are classified as intermediate. Developing countries accounted for half of the growth in foreign materials inputs, with much of that growth coming from China. Indeed, China has become the largest exporter to the United States, accounting for about a third of the growth in commodity imports over the 1997 to 2007 period. Intermediate countries, such as Mexico, accounted for about a third of the growth.
We begin our analysis in this paper by using a growth accounting framework to examine the contributions from the inputs to production and from multifactor productivity to the growth in real (constant price) domestic shipments in manufac-turing. We find substantial evidence of offshoring. The contribution from imported materials to the growth in real manufacturing shipments was larger than that of any other factor input and was more than twice the contribution from capital. At the same time, contributions from domestic materials and labor were negative.
Multifactor productivity is computed as a residual from a growth accounting calculation: that is, whatever cannot be attributed to a specific input is referred
F2
Figure 2 The Import Share of Material Inputs Used by U.S. Manufacturers
Source: Bureau of Economic Analysis (BEA) Annual Industry Accounts and import microdata.Note: Imported intermediate goods are divided according to type of country of origin (developing country, intermediate country, or advanced country), and their portion of the share of imported intermediate goods in total materials use by the U.S. manufacturing sector is plotted.
0
0.05
0.10
0.15
0.20
0.25
1997 1998 1999 2000 2001 2002 2003 2004 2005 2006 2007
Advanced countries
Intermediate countries
Developing countries
0
0.05
0.10
0.15
0.20
0.25
spring2011-252.indb 114 4/18/11 5:05 PM

Offshoring Bias in U.S. Manufacturing 115
to as productivity growth. Thus, the accuracy of multifactor productivity estimates depends on the accuracy of input measures. We will argue that the price declines associated with the shift to low-cost foreign suppliers generally are not captured in existing price indexes. The problem is analogous to the widely discussed problem of outlet substitution bias in the literature on the Consumer Price Index. Just as the CPI fails to capture fully the lower prices for consumers due to the entry and expan-sion of big-box retailers like Wal-Mart, import price indexes and the intermediate input price indexes based on them do not capture the price drops associated with a shift to new low-cost suppliers in China and other developing countries.
As a result of this price index problem, the real growth of imported inputs has been understated. Furthermore, if input growth is understated, it follows that the growth in multifactor productivity and real value added in the manufacturing sector have been overstated. We estimate that average annual multifactor productivity growth in manufacturing was overstated by 0.1 to 0.2 percentage points and real value added growth by 0.2 to 0.5 percentage points from 1997 to 2007. Moreover, this bias may have accounted for a fifth to a half of the growth in real value added in manufacturing output excluding the computer and electronics industry.
In the conclusion, we suggest some directions for future research in this area. Our work only examines biases to manufacturing statistics from the offshoring of material inputs, but the issues involved likely affect the economy in other ways as well. Additional biases to manufacturing may arise from the offshoring of other inputs, including capital and services. The offshoring of intermediate inputs as well as final consumer goods may bias measures of real GDP growth. These biases have implications that go beyond the accuracy of industry and aggregate statistics. Because the growth of imports has been understated in real terms, offshoring has, at least to some degree, manifested itself as mismeasured productivity gains. As a result, studies that endeavor to assess the impact of low-cost imports for the American economy and its workers may well understate its effects.
A Growth Accounting Framework: Evidence of Offshoring by Manufacturers
We utilize a standard growth accounting framework in which output is defined as manufacturing shipments adjusted for price changes: real gross output. We decom-pose the growth of real gross output into the parts resulting from the growth of inputs to production and from multifactor productivity growth, which is computed as a residual. In our calculation, the inputs are a weighted average of the growth rate of labor, capital, energy, services, domestic materials, and foreign materials. A novel feature of our analysis is that we use unpublished Bureau of Economic Analysis data on the value of imports and imported input prices at a detailed commodity level to distinguish between the growth of domestic and imported materials inputs. The weights on each input represent the input’s share of total costs. The real quantity of each input is determined by taking nominal spending on that input each year, and
spring2011-252.indb 115 4/18/11 5:05 PM

116 Journal of Economic Perspectives
then deflating that spending by the relevant price index. In this framework, multi-factor productivity growth is the part of output growth that cannot be accounted for by the growth of factor inputs, and therefore represents the returns to all factors of production.3 Any error in the measurement of input growth—including errors that result from biased price indexes used to deflate the inputs—will directly result in an error in the measurement of productivity growth.
Table 1 provides the results of this decomposition for manufacturing and selected industry breakouts from 1997 to 2007. The figures in column 1, which represent the average annual real output growth rate over the period, equal the sum of the figures in columns 2 through 8, which represent the contributions to output growth from multifactor productivity and from the growth of the factors of production.
Several striking findings emerge from this table. Multifactor productivity growth appears very strong. Indeed, the contribution to real output growth from
3 See Jorgenson, Gollop, and Fraumeni (1987) and Hulten (2009) for more on the growth accounting methodology, its early development, and current applications. The industry-level data for output, mate-rials, energy, and services come from the GDP-by-industry accounts of the Bureau of Economic Analysis. Capital services inputs are derived from the Bureau of Economic Analysis’s Fixed Asset Accounts. The labor input is based on industry-level hours worked from the National Income and Product Accounts, adjusted for changes in the worker composition effects using wage data from the Census Bureau’s County Business Patterns.
T1
Table 1 Sources of Growth for U.S. Manufacturing Industries, 1997–2007
Average annual
percentage Δin gross output
(1)
Contribution (in percentage points)
MFP(2)
Capital(3)
Labor(4)
Energy(5)
Purchasedservices
(6)
Purchased material
Domestic(7)
Foreign(8)
Manufacturing 1.18 1.30 0.13 –0.53 –0.05 0.22 –0.19 0.28
Manufacturing excluding computers and electronic products
0.46 0.69 0.11 –0.47 –0.05 0.13 –0.23 0.28
Durable goods: 2.00 2.02 0.17 –0.66 –0.05 0.30 –0.15 0.37 Computers and electronic products
7.35 6.82 0.25 –1.11 –0.05 1.05 0.04 0.35
Durable goods excluding computers and electronic products
0.77 0.95 0.15 –0.57 –0.05 0.12 –0.22 0.38
Nondurable goods 0.16 0.45 0.07 –0.37 –0.04 0.14 –0.25 0.17
Source: Authors’ calculations using published and unpublished Bureau of Economic Analaysis data.Notes: Column 1 shows the average annual percentage change in gross output. Columns 2 through 8 show the contributions of multifactor productivity (MFP) and of the indicated inputs to the average annual growth rate in gross output. Columns 2 through 8 are in percentage points that sum to gross output in column 1. Capital includes non-IT equipment, IT capital (computers and peripheral equipment, software, and communication equipment), structures, and inventories.
spring2011-252.indb 116 4/18/11 5:05 PM
Susan Houseman, Christopher Kurz, Paul Lengermann, and Benjamin Mandel 117
multifactor productivity growth actually exceeds real gross output growth. Capital, purchased services, and materials all play important, albeit more modest, roles, while the contribution of labor is negative and large, reflecting the steep employ-ment declines during the period.4
Columns 7 and 8 in Table 1 provide a perspective on the rapid pace of structural change in U.S. manufacturing. During the 1997–2007 period, the contribution of domestically supplied materials inputs fell, while that of imported materials inputs greatly expanded, reflecting the substitution of foreign for domestic intermediate inputs. The growth of imported intermediate inputs, to some degree, will also reflect the direct substitution of imported goods for domestic labor and capital. To see this, consider the case in which a firm previously produced an intermediate input and final product internally but now sources that input from a foreign supplier. In this instance, gross output will not change, but imported materials inputs will rise and the labor and capital previously used to produce the input will fall.
For manufacturing as a whole, the contribution of imported materials inputs to output growth was greater than that of any other factor of production and was more than double the contribution from capital. For manufacturing excluding the computer industry, imported materials account for 60 percent of the growth during this period, while multifactor productivity accounts for more than 100 percent, owing to negative contributions from labor, energy, and domestic materials.
Eldridge and Harper (2010) also document the important role of imported intermediate inputs during this period in their study of the sources of growth for manufacturing labor productivity, defined as the growth in output per hour worked. Unlike the gross output measure used in our analysis, the Bureau of Labor Statistics defines manufacturing output as the value of production shipped to purchasers outside of the sector: it does not include the shipments of domestic parts producers but does embody the contribution of inputs sourced from abroad (Gullickson, 1995). As a result, the substitution of imported for domestic intermediate inputs can lead to a mechanical increase in measured labor productivity: all else the same, the sector’s output will remain unchanged while its labor input will fall. Using this measure, Eldridge and Harper find that from 1997 to 2006, imported intermediates explain 23 percent of the growth in labor productivity while multifactor productivity growth explains 45 percent.5
Another striking result in Table 1 is that computer and electronic products manufacturing—which includes computers, semiconductors, and telecommuni-cations equipment—accounts for most of the output and productivity growth in
4 The growth accounting results in Table 1 reflect the authors’ calculations and rely on a different meth-odology than what is used by the Bureau of Labor Statistics. However, these salient features of the data are also observed in the BLS estimates. A full reconciliation of the two approaches appears in our paper Houseman, Kurz, Lengermann, and Mandel (2010).5 Using a value added measure of output, which nets out both domestic and imported intermediates, would not lower the measured rate of manufacturing labor productivity growth during this period. In fact, manufacturing value added growth was higher than that of gross or sector manufacturing output owing to the rapid growth of multifactor productivity.
spring2011-252.indb 117 4/18/11 5:05 PM

118 Journal of Economic Perspectives
manufacturing over the period.6 Output and productivity growth in the computer industry averaged 7.4 and 6.8 percent per year, respectively, compared to 0.77 percent and 0.95 percent for output growth and multifactor productivity growth in noncom-puter durable goods, and even lower rates for nondurable goods. The extraordinary productivity and real gross output growth in computers reflects, to a large degree, technological improvements of the products produced and output price deflators that, when properly adjusted for product improvements, are often falling rapidly.7 This fact underscores the important role that price indexes play in the computation of real growth measures. Indeed, in spite of growth in real output and produc-tivity in computers and electronic products manufacturing during the decade, the trade deficit within this product group greatly widened, and substantial offshoring of components of the industry occurred (Brown and Linden, 2005; Dedrick and Kraemer, 2009), suggesting that for the industry as a whole, domestic output did not keep pace with demand.
Throughout the 1997–2007 period, the computer industry’s share of manu-facturing value added remained relatively constant at around 10 percent. Because manufacturing output and productivity statistics are strongly affected by the computer industry, which represents such a small share of the sector, researchers should be cautious in drawing general inferences about manufacturing from the aggregate numbers.
Although Table 1 documents the substantial growth in offshoring from 1997–2007, it nevertheless likely understates the true magnitude of the phenomenon. Our focus below concerns the systematic upward bias in the price indexes used to deflate intermediate materials. We could not account for the measurement of two additional factors which likely also impart an upward bias: (i) imported capital inputs, such as computers and machinery, have exhibited substantial gains in import penetration; and (ii) imported services inputs have accelerated in recent years, albeit from a very low level. For further discussion of the contribution from imported capital, see Cavallo and Landry (2010), and for estimates of services offshoring, see Yuskavage, Strassner, and Medeiros (2008).
Bias to Price Indexes from Offshoring
Understanding why offshoring likely results in biases to the price indexes used to deflate inputs requires some background on the relevant price programs. In addition to the Consumer Price Index, the Bureau of Labor Statistics constructs separate price indexes for imports, exports, and domestically produced goods.
6 Similar findings have been reported in other studies. See, for example, Oliner and Sichel (2000) and Jorgenson, Ho, and Stiroh (2008) in this journal. See also Oliner, Sichel, and Stiroh (2007) and Syverson (forthcoming) for more in-depth reviews of recent research on U.S. productivity.7 The Bureau of Labor Statistics uses hedonic methods to adjust prices in the computer industry. For a review of these, see Wasshausen and Moulton (2006).
spring2011-252.indb 118 4/18/11 5:05 PM

Offshoring Bias in U.S. Manufacturing 119
Just as the Bureau of Labor Statistics constructs the Consumer Price Index to measure the rate of price change of goods and services purchased by consumers, the Bureau of Economic Analysis constructs input price indexes to measure the rate of price change of inputs to production purchased by businesses. These industry-specific input price indexes use the import and domestic price indexes in conjunction with information on each industry’s input structure from the input-output tables.
The import price data come from the International Price Program at the Bureau of Labor Statistics, which surveys importing establishments on the prices paid for imports of a detailed product. For domestic materials prices, the Bureau of Economic Analysis primarily uses the Producer Prices Index in which the Bureau of Labor Statistics surveys domestic producers on the prices they receive for a sample of products. For more information on the BLS price index computa-tions, see Chapters 14 and 15 in BLS Handbook of Methods (U.S. Department of Labor, Bureau of Labor Statistics, 2009b).
Each observation used in the construction of a particular price index represents the period-to-period price change of an item as defined by very specific attributes and reported by a specific establishment. In this way, the Bureau of Labor Statistics ensures that it is pricing the same item over time and thus that price indexes are based on “apples-to-apples” comparisons. These methods mean, however, that price indexes generally will not capture the price changes associated with the entry and market share expansion of a low-cost supplier. When an item is rotated into the sample, the price change of this specific good provided by this specific supplier will be missing initially. Hicks (1940) first demonstrated that the appropriate price change of a newly available good is its current price less its reservation price, defined as the price at which demand would have been zero in the previous period. The way price data are collected, however, the Bureau of Labor Statistics does not observe price differences for a particular product across suppliers, and when a new supplier enters the market, implicitly it is assumed that any price differences between its products and incumbent suppliers’ products may be attributed to quality differ-ences. As mentioned, this problem has been studied extensively in the Consumer Price Index literature, where it has been dubbed “outlet substitution bias” (as discussed in this journal in Diewert, 1998; Hausman, 2003).
In the case of offshoring, the appropriate price change of a newly imported item is the difference between its price and the price of the domestic item for which it substitutes, adjusted for any quality differences. The import price index does not capture this price drop nor does the input price index, which, in essence, is a weighted average of period-to-period changes measured in the import price index and the Producer Price Index. Our main focus here is on the substitution of imported for domestic inputs, but a bias would also occur with the entry of a major new low-cost domestic supplier.
Although the price change of an item will necessarily be missing in the first period it is sampled, typically a new item’s market share will be small initially and so too will its weight in the price index and any resulting bias to that index. A new
spring2011-252.indb 119 4/18/11 5:05 PM

120 Journal of Economic Perspectives
low-cost supplier’s market share often expands rapidly in the year or so following entry, but the lag between the time when a new supplier enters the U.S. market and when its products are picked up in the appropriate prices sample can be consider-able. Therefore, a common suggestion for addressing such biases in price statistics is more rapid rotation of new items into the sampling frame. This argument, however, implies that purchasers adjust immediately—or at least in the time between the monthly or quarterly price samples—to their desired quantities of the new, low-cost good and that any subsequent gain in the new low-cost supplier’s market share occurs simply because its price rises more slowly than incumbent suppliers’ prices. If instead, it takes some time for suppliers to introduce a good and for purchasers to learn about its qualities and change suppliers, then “the theoretical prescription ‘introduce [the new item into the price index] early and you will minimize the problem’ may be all wrong” (Griliches and Cockburn, 1994).
Table 2 provides a hypothetical numerical example of how offshoring can impart a bias to the input price index. Suppose that pharmaceutical companies purchase a common chemical compound, “obtanium,” from a domestic supplier at $10 per ounce. A Chinese supplier enters the market at time t + 1 and sells obtanium for $6 per ounce. The implied price drop of $4 is not observed in the import price data. As the new, lower-cost source becomes known, its reliability is established, and contracts with the domestic supplier expire, U.S. pharmaceutical companies begin shifting their purchases to the Chinese supplier. For simplicity, we assume that the domestic and foreign dollar prices of obtanium remain the same throughout the period. Because prices are often contractually set for periods of time, this simplifying assumption of price stickiness is not unrealistic. Nakamura and Steinsson (2009) document that 40 percent of prices on imported items never change for the entire duration they are in the Bureau of Labor Statistics sample.
T2
Table 2 Hypothetical Offshoring of Obtanium
t t + 1 t + 2 t + 3
Domestic supplier price $10.00 $10.00 $10.00 $10.00Domestic quantity sold 100 90 80 70
Chinese supplier price — $6.00 $6.00 $6.00Chinese quantity sold 0 10 20 30
Average price paid for obtanium $10.00 $9.60 $9.20 $8.80
Domestic input price index 100 100 100 100Import input price index — 100 100 100Input index, as computed 100 100 100 100
True input price index 100 96 92 88
Source: Authors’ calculations.
spring2011-252.indb 120 4/18/11 5:05 PM

Susan Houseman, Christopher Kurz, Paul Lengermann, and Benjamin Mandel 121
The input price index, as computed by the statistical agencies, is a weighted average of the domestic and import index, and, in our example, does not change. The correct index, however, would capture the period-to-period change of the average price that U.S. companies pay for obtanium and falls by 12 percent. More rapid introduction of Chinese obtanium into the import prices sample will not miti-gate the bias to the input price index; persistent price differences between Chinese and domestic obtanium during the transition to a new equilibrium—not period-to-period declines in the relative price of Chinese obtanium—underlie the growth in the Chinese market share. Moreover, even if markets adjust instantaneously such that all U.S. producers switch to the low-cost Chinese supplier as soon as it becomes available and the Bureau of Labor Statistics picks up the Chinese obtanium in its import prices sample without a lag, import and input price indexes will not capture the price drop enjoyed by drug manufacturers at the time of the switch.
The bias to the price index arises in large part because the U.S. importer does not report the price drop that buyers experience when they shift their purchases from domestic to foreign suppliers. To address this problem, the Bureau of Labor Statistics has proposed that an input index be constructed based on a survey of purchasers (Alterman, 2009). The proposed input price index is still at the concept and design stage, but in theory, buyers could accurately report the period-to-period changes in the price they pay for specific inputs, irrespective of source.
Diewert and Nakamura (2010) characterize the bias to the input price index resulting from a shift in input suppliers. In their formulation, the upward bias (B ) to the rate of inflation in the input price index (1 + i ) is proportional to the physical share captured by the low-cost supplier over the period (s ) and the percentage difference in the prices of the low- versus the high-cost supplier—or discount—(d ):
B = (1 + i)sd.
Returning to our obtanium example, over the period there is no measured infla-tion (i equals zero), the low-cost supplier captures a 30 percent market share, and the discount from the low-cost supplier is 40 percent. Whereas the measured rate of price change is zero, the true rate of price change for that input is –0.12, or negative 12 percent. The characterization of the bias to the input price index in the above equation is identical to the characterization of the bias to the Consumer Price Index in this journal in Diewert (1998). It is the same problem manifested in a different index.8
Figure 3 provides evidence of this problem in the price indexes used by the Bureau of Economic Analysis to construct deflators for manufacturing interme-diate materials inputs. The figure plots the domestic and the imported materials input price indexes, which exclude energy, for manufacturing from 1997 to 2007,
8 Although the goods in the Deiwert and Namkamura (2010) model are treated as homogeneous, Diewert (1998) in this journal provides an extension to where the goods are different qualities. In this case, the discount represents the price differential adjusted for quality.
F3
spring2011-252.indb 121 4/18/11 5:05 PM

122 Journal of Economic Perspectives
a period during which materials imports from emerging economies were rapidly gaining market share. It is widely believed that the growth of import share, driven by lower prices, dampened inflation in the United States (Feenstra et al., 2010). Because presumably import prices are generally falling relative to domestic prices, we would expect the import price index to rise more slowly than the domestic price index, pulling down the rate of inflation in intermediate inputs used in manufac-turing. Instead, the foreign price deflator for intermediate materials rose somewhat faster than the domestic deflator. The differential between foreign and domestic materials price deflators is especially apparent beginning in 2002, coincident with the rapid rise of imports from China. Moreover, Reinsdorf and Yuskavage (2009) report a similar pattern in an examination of import and domestic prices indexes for consumer goods.
Although this anomalous pattern could result from differences in the composi-tion of the domestic and foreign products that comprise the two input indexes, it is consistent with a significant bias to price indexes from offshoring. The pattern in Figure 3 might also be observed if import price changes of new, low-cost entrants are missing or if markets do not adjust instantaneously to the availability of low-cost imported products. The large-scale shifts in sourcing that marked this economic period were accompanied by the entry of many new foreign suppliers and their products and likely by adjustment periods during which persistently lower prices
Figure 3 Baseline Input Price Indexes for the Manufacturing Sector
Source: Authors’ calculations using published and unpublished Bureau of Economic Analysis data.Note: The total materials deflator is from the BEA’s Annual Industry Accounts, while the imported materials is an aggregate of confidential commodity price data. Domestic materials is the chain stripped residual of imported from total materials.
0.8
0.9
1.0
1.1
1.2
1.3
1.4
1.5
1997 1998 1999 2000 2001 2002 2003 2004 2005 2006 2007
Imported materialsTotal materialsDomestic materials
spring2011-252.indb 122 4/18/11 5:05 PM

Offshoring Bias in U.S. Manufacturing 123
offered by foreign suppliers drove gains in import market share. As illustrated in Table 2, even when the products of these new suppliers are rotated into the import prices sample, the implied price decline of the imports vis-à-vis their domestic competitors generally will not be captured in the import and input price indexes.
Evidence of Cost Savings from Offshoring
No comprehensive evidence exists on the magnitude of the cost savings from shifts in sourcing—that is, on the discount, d, in the Diewert and Nakamura (2010) formulation of the size of the bias. A few case studies, however, provide some evidence for selected products and industries. Byrne, Kovak, and Michaels (2010) find sizable cross-country differences in the prices of semiconductor wafers with identical specifications. They find that, compared to prices of semiconductor wafers produced in U.S. foundries, prices were on average about 40 percent lower in China and about 25 percent lower in Singapore. Klier and Rubenstein (2009) find that offshoring aluminum wheel production to Mexico lowered overall costs by 19 percent and processing costs by 36 percent.
The different samples in the International Price Program and Producer Price Index do not permit a direct comparison of prices for domestic and imported items. However, such a comparison is possible among imported products originating in different countries. Products from intermediate and, especially, developing countries were gaining market share not only vis-à-vis the United States but also other advanced countries. On the grounds that production cost structures are likely to be more similar between the United States and other advanced countries, systematic import price differentials between products from advanced versus developing and intermediate countries may be informative about the size of the discount relative to U.S. goods.
Figure 4 shows the average percentage differences between imported products from developing and advanced countries, and between intermediate and advanced countries, as recorded in the Bureau of Labor Statistics microdata underlying the International Price Program. Each data point corresponds to that difference for a single North American Industry Classification System (NAICS) four-digit category in manufacturing, and the value along the horizontal axis is the gain in U.S. market share for developing and intermediate countries within each category. In almost all cases, the offshoring discounts are negative, indicating lower prices in devel-oping and intermediate countries compared to advanced countries. In many cases, these discounts appear to be quite sizable. Further, the size of a given discount is negatively correlated with a gain in U.S. market share, indicating the larger the foreign source country’s price differential, the greater the U.S. market share captured. Underlying this pattern is a substantial amount of heterogeneity in the size of offshoring discounts across broad industry groups. Items like food, bever-ages, textiles and apparel are characterized by smaller discounts and share gains. Products such as machinery, electronics, semiconductors, and transportation are characterized by larger discounts and share gains.
F4
spring2011-252.indb 123 4/18/11 5:05 PM

124 Journal of Economic Perspectives
An important caveat to this figure is that even within very detailed product codes there may be considerable heterogeneity that may explain at least some of the price differentials. Returning again to our example in the previous section, if obta-nium is a differentiated product and the Chinese version is of a lower quality than that from Japan, then Chinese obtanium should trade at a discount relative to the higher-quality Japanese variety. We adopted various methods to control for possible heterogeneity. In particular, one method restricts the import price sample to cases in which there is a newly observed price for an incumbent importing firm within the same detailed product code. In this way, we are able to narrow the sample to instances in which an importer appears to be switching sources of a specific product from a supplier in an advanced country to one in a developing or intermediate country. The observed price differentials are somewhat smaller but still sizable when we limit our sample in this way.9 In short, it is unlikely that product differentiation accounts for the large, persistent price differences across countries.
9 In Houseman, Kurz, Lengermann, and Mandel (2010), we describe this approach in greater detail. We also attempt to account for unobserved differences in product characteristics using an econometric
Figure 4 Estimated Offshoring Discounts
Source: Author’s calculations using the Bureau of Labor Statistics’ International Price Program import price microdata and the Bureau of Economic Analysis’s industry-level estimates of domestic and imported materials.Notes: Figure 4 shows the average percentage differences between imported products from developing and advanced countries, and between intermediate and advanced countries, as recorded in the Bureau of Labor Statistics microdata underlying the International Price Program. Each data point corresponds to that difference for a single North American Industry Classification System (NAICS) four-digit category in manufacturing, and the value along the horizontal axis is the gain in U.S. market share for developing and intermediate countries within each category.
–100
–80
–60
–40
–20
0
20
40
60
80
100
0.0001 0.001 0.01 0.1 1
Dis
coun
t (pe
rcen
t)
Change in the share of U.S. manufacturing input
DevelopingIntermediate
spring2011-252.indb 124 4/18/11 5:05 PM

Susan Houseman, Christopher Kurz, Paul Lengermann, and Benjamin Mandel 125
The evidence from case studies and from comparisons of import prices is consistent with reports of large discounts in the business literature. For example, in 2004, Business Week reported that prices of imported goods from China typically were 30 to 50 percent lower than the prices for comparable products produced in the United States, and that the discounts were sometimes higher (Engardio and Roberts, 2004). Similarly, a McKinsey (2006) study cited cost savings from produc-tion of electronic equipment in China of between 20 and 60 percent. Estimates of the savings from offshoring auto parts production to Mexico are generally in the range of 20 to 30 percent (Kinsman, 2004). In sum, although no systematic data exist, a variety of evidence points to large cost savings from offshoring.
The above-mentioned price differentials could be the result of numerous factors, such as labor costs, industrial policy, or disequilibrium in exchange rate markets. For instance, the Manufacturers Alliance of the National Association of Manufactures provides estimates of manufacturing labor costs, adjusted for produc-tivity, for major U.S. trading partners as compared to the United States. Their estimates of large labor cost savings—between 58 to 72 percent lower in China and 22 to 62 percent in Mexico from 2002 and 2009—are consistent with the large product discounts reported in research and in the business press (Leonard, 2008). Also consistent with the evidence of cost savings from offshoring are estimates that the Chinese renminbi may be significantly undervalued relative to the dollar, perhaps by as much as 40 percent (Cline and Williamson, 2010; Bergsten, 2010).
Bias to Productivity and Value Added from Offshoring
We implement the bias correction to input prices developed by Diewert and Nakamura (2010) and simulate the effects of the bias on multifactor productivity and value added growth. For all manufacturing, if the true import discounts match those derived from the import price microdata shown in Figure 4, then the 20 percent increase in prices between 1997 and 2007 estimated by the Bureau of Economic Analysis overstates the inflation rate by a full 9 percentage points. Thus, once we account for the bias from offshoring, the materials costs faced by U.S. manufacturers would only have risen at half the rate reported in official estimates. This, in turn, would imply that the real use of materials by U.S. manufacturers rose twice as fast as reported. With more production being generated by purchased mate-rials, value added would be diminished and productivity estimates would be lower.
By how much might the productivity statistics be overstated from failing to account for offshoring? The top panel of Table 3 presents alternative estimates of multifactor productivity growth based upon different assumptions about the import discount. The first column restates our baseline productivity results from Table 1.
model informed by estimates of product-level quality from Mandel (2010). We find that the price disper-sion across source countries decreases but remains substantial.
T3
spring2011-252.indb 125 4/18/11 5:05 PM

126 Journal of Economic Perspectives
The second column presents estimates in which all commodities—both domestic and imported—have been deflated with domestic deflators provided to us by the Bureau of Economic Analysis. This column shows what multifactor produc-tivity would be if the rate of price inflation for imported commodities was the same as for their domestic counterparts. This allows us to see how the difference in price levels between imported and domestic commodities affects measured multifactor productivity. For the entire manufacturing sector, deflating imported materials with domestic prices reduces multifactor productivity growth by a bit less than
Table 3 Foreign Offshoring and the Bias to U.S. Multifactor Productivity and Value Added, 1997–2007
Micro evidence
Baseline IPP=PPIFull
sample SwitchersDev50, Int30
Dev30, Int15
Simulation: (1) (2) (3) (4) (5) (6)
Multifactor productivity (average annual percentage change):Manufacturing 1.30 1.23 1.05 1.12 1.08 1.16Manufacturing excluding computers and electronic products
0.69 0.67 0.52 0.58 0.54 0.61
Durable goods: 2.02 1.87 1.64 1.73 1.67 1.77 Computers and electronic products
6.82 6.33 5.91 6.13 6.05 6.18
Durable goods excluding computers and electronic products
0.95 0.89 0.70 0.76 0.71 0.81
Nondurable goods 0.45 0.45 0.36 0.40 0.38 0.42
Value added (average annual percentage change):Manufacturing 3.04 2.82 2.31 2.50 2.39 2.61Manufacturing excluding computers and electronic products
0.94 0.86 0.44 0.59 0.48 0.68
Durable goods: 5.25 4.86 4.19 4.44 4.27 4.57 Computers and electronic products
22.68 21.12 19.73 20.44 20.17 20.61
Durable goods excluding computers and electronic products
1.74 1.58 1.05 1.22 1.07 1.34
Nondurable goods 0.07 0.08 –0.23 –0.10 –0.15 –0.03
Source: Authors’ calculations using published and unpublished Bureau of Economic Analysis data.Notes: For “IPP=PPI” (International Price Program = Producer Price Index), imported materials are deflated with domestic deflators. For “Full sample,” estimates are adjusted with product-level discounts from the entire IPP microdata sample. For “Switchers,” the import discount is based on a sample where importers appeared to shift from suppliers in advanced countries to ones in developing or intermediate countries. “Dev50, Int30” assumes discounts of 50 percent for developing countries and 30 percent for intermediate countries, while “Dev30/Int15” assumes discounts of 30 percent and 15 percent respectively.
spring2011-252.indb 126 4/18/11 5:05 PM

Offshoring Bias in U.S. Manufacturing 127
0.1 percentage point, from 1.30 percent in our baseline scenario, to 1.23 percent. Almost all of this change owes to differences in the price deflators used for imported and domestic semiconductors. In other words, prices for imported semiconductors—a product used heavily by the computer and electronic products industry—fell less rapidly than their domestic counterparts. The discrepancies are especially evident in the early years of our data and appear to be the result of inconsistent adjust-ment of imported and domestic semiconductor prices for quality improvements. Although not the focus of our paper, the drop in multifactor productivity between columns 1 and 2 likely represents an additional modest bias.10
The third and fourth columns present multifactor productivity estimates that have been adjusted for the real amount of offshoring using our micro evidence on the import discount. We report estimates using product-level discounts based on the entire microdata sample (“full sample”) and on a sample limited to instances where importers appear to shift from suppliers in advanced countries to ones in developing or intermediate countries (“switchers”).
In the last two columns, we estimate multifactor productivity using import discounts informed by the business press and available case study evidence, applying these discounts uniformly across commodities. The column labeled “Dev50, Int30” assumes discounts of 50 percent for developing countries and 30 percent for inter-mediate countries, whereas the column labeled “Dev30, Int15” assumes discounts of 30 percent for developing countries and 15 percent for intermediate countries. These represent discounts on the high and low end, respectively, of those found in the case study and business literature.
On balance, for the entire manufacturing sector, we find that adjusting the price indexes (relative to column 2) to use more accurate estimates of the real amount of offshoring lowers multifactor productivity growth by an additional 0.1 to 0.2 percentage point, which implies average annual productivity growth is reduced between 6 and 14 percent. These numbers are fairly significant, as a 0.1 percent average annual growth rate for multifactor productivity roughly equals the average annual contribution of the capital stock to manufacturing growth during this period.
If we exclude the contribution of the computer and electronic products industry, correcting for offshoring results in similar percentage point adjustments to multifactor productivity: from 0.67 percent (in column 2) to between 0.52 percent (column 3) and 0.58 percent (column 4). However, the adjustment represents a relatively larger share of multifactor productivity growth; the gap between measured and adjusted multifactor productivity growth in manufacturing excluding computers is as much as 22 percent. The results for the case study scenarios shown in the last two columns are quite consistent with our results based on International Price Program microdata.
10 Because of the high import penetration in semiconductors and other high-tech products, consistently adjusting domestic and import prices for product improvements is important for the accuracy of industry and national income statistics, though difficult owing to lack of product detail, particularly for imports. Addressing this problem has resulted in substantial revisions to the national accounts statistics in the past (Grimm, 1998).
spring2011-252.indb 127 4/18/11 5:05 PM

128 Journal of Economic Perspectives
What about the likely range of the bias to value added in manufacturing? Calculations of value added, of course, subtract intermediate inputs from an indus-try’s shipments and therefore represent the additional product produced in an industry. If the actual amount of intermediate materials used by U.S. manufac-turers has been larger than what is contained in the official statistics, then real value added has been overstated as well. As a result, domestic manufacturing ship-ments are contributing less value added to the overall economy.
Real value added is the difference between real gross output and real interme-diate inputs. Using our adjusted measures of real purchased materials, we replicate the “double-deflation” procedure used by the Bureau of Economic Analysis to compute industry-level value added indexes. We therefore derive the implied value of real value added associated with published measures of gross output, energy, and services and our adjusted measures of purchased materials inputs.
The bottom panel of Table 3 presents alternative estimates for value added based on our different assumptions. The unadjusted average growth rate in value added for all manufacturing is about 3 percent, while the annual growth rate for manufacturing excluding the computer sector is less than one-third of this size at about 0.9 percent and that for the computer industry exceeds 20 percent. As shown in columns 3 through 6, our simulations indicate that value added growth for all manufacturing was overstated by 0.2 to 0.5 percentage point, or about 7 to 18 percent of the growth. A 0.1 percentage point increase in the annual growth rate of real value added, when cumulated over a decade, will add a little over 1 percent to the level of value added. Thus, an overstatement of manufacturing growth from 1997 to 2007 at the middle of our range of estimates—0.35 percentage point—would imply that the level of manufacturing value added in 2007 was overstated by about $60 billion.
Excluding computers, real value added growth for manufacturing is biased by 0.2 to 0.4 percentage point, which accounts for 21 to 49 percent of the growth.11 The annual growth rate of real value added for manufacturing excluding computers falls under a half percent per year in some of our adjusted estimates, while that for non- durable goods turns negative for all of our adjusted estimates. This range of estimates of the bias reflects various assumptions about the size of the discount from offshoring that are on the high and low side of those found in the literature. The actual discounts are not observed, however, and so the true bias could be larger or smaller.
Implications for Data and Research
The discussion in this paper has focused on manufacturing and on how mismeasured price indexes lead to biases in estimates of productivity and real value
11 In addition to the “switchers” estimates, in other estimates (not displayed here) we attempted to adjust for unobserved differences within detailed product codes using econometric techniques. These estimates do not alter the qualitative results of our analysis, and imply bias adjustments to multifactor productivity and value added roughly in line with the “Dev30, Int15” estimates in Table 3.
spring2011-252.indb 128 4/18/11 5:05 PM

Susan Houseman, Christopher Kurz, Paul Lengermann, and Benjamin Mandel 129
added growth in the manufacturing sector. The biases stem from the substitution of lower-cost imports for domestic materials inputs. Such biases, however, may also arise from the offshoring of other inputs and of consumer goods and affect statistics for other sectors and for the aggregate economy.
As an example, sizable import penetration by developing countries occurred in computers and machinery products in the 2000s. These goods are largely treated as capital inputs in the industry accounts. Price drops accompanying the substitution of imported for domestic capital equipment would not be captured in capital price deflators, possibly leading to an understatement of the growth of capital services and an overstatement of growth in multifactor productivity and real value added in industry statistics. The same problem arises from the offshoring of services, which includes business services, the most rapidly expanding category of services trade. Collecting accurate price information on services trade is complicated by the fact that the level of detail in services sector data is quite limited (Sturgeon, Levy, Brown, Jensen, and Weil, 2006; Norwood, Carson, Deese, Johnson, Reeder, and Rolph, 2006; Jensen, 2009) and that the International Price Program at the Bureau of Labor Statistics does not cover business services imports and exports. If services offshoring expands rapidly in the near future, as some predict, the absence of accurate price deflators could impart significant biases in official statistics.
In the above examples, the real growth of imported inputs is understated, resulting in biases to real value added and productivity statistics for industries using those inputs. When low-cost imported consumer goods substitute for domestically-produced goods, the implied price drop generally will not be captured in the import price index either, resulting in biased measures of the growth of final goods imports. Reinsdorf and Yuskavage (2009) examine price indexes of domestic and imported indexes for selected consumer goods and provide preliminary evidence of biases to import price indexes that may have resulted in an understatement of the real growth of imported items for final consumption in recent years.
The offshoring of intermediate inputs and final goods and services also may bias estimates of real GDP growth. In the United States, GDP is computed using the expendi-ture approach: GDP is the sum of final consumption, business investment, government expenditures, and net exports (exports minus imports). To assess real GDP growth, expenditure, export, and import values must all be properly deflated. Biases to import price deflators that result in an understatement of the real growth of imported goods and services will result in an overstatement of real GDP growth, all else being the same. Implications of biases to price indexes from shifts in sourcing for GDP growth have been covered in the business press (Mandel, 2007, 2009) and are discussed in Houseman (2011). Feenstra, Mandel, Reinsdorf, and Slaughter (2009) examine additional biases to import prices and estimate their effects on real GDP growth. That said, the measure-ment of GDP is subject to a wide range of problems that can bias the statistics up or down, and many other factors may work in opposite directions, thus leaving open the degree—or even the direction—of the overall bias in the official statistics.
More generally, the Schumpeterian dynamic by which low-cost producers enter and capture market share from incumbents is an important mechanism by which
spring2011-252.indb 129 4/18/11 5:05 PM

130 Journal of Economic Perspectives
prices change, but it is a dynamic largely missed in price indexes. Although we have focused on the substitution of low-cost foreign for domestic inputs because of the recent empirical importance of offshoring, the entrance and market share expan-sion of low-cost domestic suppliers is an important aspect of firm dynamics in the United States (for example, Foster, Haltiwager, and Syverson, 2008; Griliches and Cockburn, 1994). Shifts in sourcing from high- to low-cost domestic suppliers would also impart biases to price indexes. As mentioned above, a proposal to construct an input price index based on a survey of purchasers holds promise to address the biases to the industry statistics from all shifts in sourcing (Alterman, 2009).
The growth of low-cost imports has spurred numerous studies to assess their effects on the U.S. economy and its workers. Biases to price indexes that arise from offshoring tend to understate the effects of import growth in real terms and, to some degree, offshoring will manifest itself as false productivity gains. The pace of globalization is unlikely to abate in the near future, underscoring the need for reliable economic statistics to understand its effects and formulate policy responses. The biases to price indexes discussed in this paper are emblematic of a broader set of measurement problems that arise from the growth of globalization (Feenstra and Lipsey, 2010; Houseman and Ryder, 2010). Understanding the effects of globaliza-tion requires better data, including, quite critically, better price deflators.
■ This research was supported with funding from the Bureau of Economic Analysis and the Alfred P. Sloan Foundation and was conducted with restricted access to Bureau of Labor Statistics (BLS) import price data as well as unpublished detail on imported materials provided to us by the Bureau of Economic Analysis (BEA). The analysis and conclusions set forth are those of the authors and do not indicate concurrence by other members of the research staff of the Board of Governors of the Federal Reserve System, the Bureau of Labor Statistics, or the Bureau of Economic Analysis. We thank Jonathan Collins and Lillian Vesic-Petrovic for research assistance and participants of the conference on Measurement Issues Arising from the Growth of Globalization, Washington, D.C., November 2009, and seminar participants at the National Bureau of Economic Research, the Bureau of Labor Statistics, the European Central Bank, the East-West Center, and the Washington Area Trade Symposium for comments and suggestions. We are especially grateful to Bill Alterman, David Autor, Erwin Diewert, Dieter Ernest, Mike Harper, Michael Horrigan, Michael Mandel, Nicole Mayerhauser, Emi Nakamura, Alice Nakamura, Marshall Reinsdorf, Erich Strassner, and Rozi Ulics for their invaluable feedback and assistance on this project, and to Timothy Taylor for editorial assistance.
References
Alterman, William. 2009. “Producing an Input Price Index.” Paper prepared for the conference on “Measurement Issues Arising from the Growth of Globalization,” Nov. 6–7, 2009, Washington, DC.
Bergsten, C. Fred. 2010. “Beijing Is Key to
Creating More U.S. Jobs.” Foreignpolicy.com. April 14. http://www.foreignpolicy.com/articles/2010 /04/14/china_the_job_killer?print=yes&hide comments=yes&page=full.
Brown, Clair, and Greg Linden. 2005.
spring2011-252.indb 130 4/18/11 5:05 PM

Offshoring Bias in U.S. Manufacturing 131
“Offshoring in the Semiconductor Industry: A Historical Perspective.” In Brookings Trade Forum: 2005: Offshoring White-Collar Work, ed. Lael Brainard and Susan M. Collins, 279–333. Wash-ington, DC: Brookings Institution Press.
Byrne, David, Brian Kovak, and Ryan Michaels. 2010. “Offshoring and Price Measurement in the Semiconductor Industry.” http://www .andrew.cmu.edu/user/bkovak/BKM_semicon.pdf. (Paper prepared for the conference on “Measurement Issues Arising from the Growth of Globalization,” Nov. 6–7, 2009, Washington, DC.)
Cavallo, Michele, and Anthony Landry. 2010. “The Quantitative Role of Capital Goods Imports in US Growth.” American Economic Review, 100(2): 78–82.
Cline, William R., and John Williamson. 2010. “Notes on Equilibrium Exchange Rates: January 2010.” Policy Brief 10-2, Peterson Institute for International Economics.
Corrado, Carol, and Joe Mattey. 1997. “Capacity Utilization.” Journal of Economic Perspectives, 11(1): 151–67.
Dedrick, Jason, and Kenneth L. Kraemer. 2009. “Offshoring and Outsourcing in the PC Industry: A Historical Perspective.” In Information Systems Outsourcing, ed. R. Hirschheim, A. Heinzl, and J. Dibbern, 281–303. Berlin: Springer.
Diewert, Walter Erwin. 1998. “Index Number Issues in the Consumer Price Index.” Journal of Economic Perspectives, 12(1): 47–58.
Diewert, Walter Erwin, and Alice O. Nakamura. 2010. “Bias Due to Input Source Substitutions: Can It Be Measured?” UBC Departmental Archives 2010–15, UBC Department of Economics. Revised July 13.
Eldridge, Lucy P., and Michael J. Harper. 2010. “Effects of Imported Intermediate Inputs on Productivity.”Monthly Labor Review, June, pp. 3–15.
Engardio, Pete, and Dexter Roberts. 2004. “The China Price.” Business Week, December 6. http://www.businessweek.com/magazine/content/04 _49/b3911401.htm.
Executive Office of the President of the United States. 2009. “A Framework for Revitalizing American Manufacturing.” Washington, DC: U.S. Government Printing Office.
Feenstra, Robert, Benjamin R. Mandel, Marshall Reinsdorf, and Matthew Slaughter. 2009. “Effects of Terms of Trade Gains and Tariff Changes on the Measurement of U.S. Productivity Growth.” NBER Working Paper 15592.
Feenstra, Robert, et al. 2010. Report on the State of Available Data for the Study of International Trade and Investment. Report prepared for the Committee on Economics Statistics of the
American Economic Association. NBER Working Paper 16254.
Foster, Lucia, John Haltiwanger, and Chad Syverson. 2008. “Reallocation, Firm Turnover and Efficiency: Selection on Productivity or Profit-ability?” American Economic Review, 98(1): 394–425.
Griliches, Zvi, and Iain Cockburn. 1994. “Generics and New Goods in Pharmaceutical Price Indexes.” American Economic Review, 84(5): 1213–32.
Grimm, Bruce T. 1998. “Price Indexes for Selected Semiconductors.” Survey of Current Busi-ness, 78(2): 8–24.
Gullickson, William. 1995. “Measurement of Productivity Growth in U.S. Manufacturing.” Monthly Labor Review, July, pp. 13–28.
Hausman, Jerry. 2003. “Sources of Bias and Solutions to Bias in the Consumer Price Index.” Journal of Economic Perspectives, 17(1): 23–44.
Helper, Susan. 2008. “Renewing U.S. Manu-facturing: Promoting a High-Road Strategy.” EPI Briefing Paper 212. Washington, DC: Economic Policy Institute.
Hicks, J. R. 1940. “The Valuation of the Social Income.” Economica, 7(26), 105–124.
Houseman, Susan N. 2011. “Offshoring and Import Price Measurement.” Survey of Current Business, February.
Houseman, Susan, Christopher Kurz, Paul Lengermann, and Benjamin Mandel. 2010. “Offshoring Bias in U.S. Manufacturing: Implica-tions for Productivity and Value Added.” Board of Governors of the Federal Reserve System, Interna-tional Finance Discussion Papers, Number 1007.
Houseman, Susan, and Kenneth Ryder. 2010. “Measurement Issues Arising from the Growth of Globalization.” Report prepared for the U.S. Bureau of Economic Affairs.
Hulten, Charles R. 2009. “Growth Accounting.” NBER Working Paper 15341.
Immelt, Jeffrey R. 2011. “A Blueprint for Keeping America Competitive.” Washington Post, January 21. http://www.washingtonpost.com/wp -dyn/content/article/2011/01/20/AR2011 012007089.html.
Jensen, J. Bradford. 2009. “Measuring the Impact of Trade in Services: Prospects and Chal-lenges.” Paper prepared for the conference on “Measurement Issues Arising from the Growth of Globalization,” Nov. 6–7, 2009, Washington, DC.
Jorgenson, Dale W., Frank M. Gollop, and Barbara M. Fraumeni. 1987. Productivity and U.S. Economic Growth. Cambridge, MA: Harvard University Press.
Jorgenson, Dale W., Mun S. Ho, and Kevin J. Stiroh. 2008. “A Retrospective Look at the U.S. Productivity Growth Resurgence.” Journal of Economic Perspectives, 22(1): 3–24.
spring2011-252.indb 131 4/18/11 5:05 PM

132 Journal of Economic Perspectives
Kinsman, Michael. 2004. “Exporting Work: Outsourcing that Once Sent Low-Skill Jobs to Mexico Is Now Sending Some of San Diego’s High-Skilled, High-Wage Jobs to India, China and Elsewhere.” San Diego Tribune, April 4. http:// 64.9.213.241/files/old/news/articles/san_diego_tribune_4_4_04.pdf (accessed June 9, 2010).
Klier, Thomas H., and James M. Rubenstein. 2009. “Imports of Intermediate Parts in the Auto Industry—A Case Study.” Paper prepared for the conference on “Measurement Issues Arising from the Growth of Globalization.” Nov. 6–7, 2009, Washington, DC.
Leonard, Jeremy A. 2008. “The Tide is Turning: An Update on Structural Cost Pressures Facing U.S. Manufacturers.” Published jointly by the Manufacturers Alliance/MAPI and the Manufac-turing Institute. http://institute.nam.org/view /2001005065073451188/info.
Mandel, Benjamin R. 2010. “Heterogeneous Firms and Import Quality: Evidence from Transaction-Level Prices.” Board of Governors of the Federal Reserve System, International Finance Discussion Papers, Number 991.
Mandel, Michael. 2007. “The Real Costs of Offshoring,” Business Week, June 18, http://www .businessweek.com/magazine/content/07_25 /b4039001.htm.
Mandel, Michael. 2009. “Growth: Why the Stats Are Misleading.”Business Week, June 3. http://www .businessweek.com/magazine/content/09_24 /b4135000594984.htm.
McKinsey & Company. 2006. “Consensor Results.” Presentation made at “China and India as Global Supply Points: A Business Opportu-nity!” conference at Pudong Shangri-La Hotel, Shanghai, May 22–24.
Nakamura, Emi, and Jón Steinsson. 2009. “Lost in Transit: Product Replacement Bias and Pricing to Market.” http://www.columbia.edu/~en2198 /papers/ippsubs.pdf.
Norwood, Janet L., Carol Carson, Manuel Deese, Norman J. Johnson, Franklin S. Reeder, and John E. Rolph. 2006. Offshoring: How Big Is It? Report of the Panel of the National Academy of Public Administration for the U.S. Congress and the Bureau of Economic Analysis. Washington, DC: National Academy of Public Administration.
OECD. 2010. STAN Industry 2008, STAN: OECD Structural Analysis Statistics. A database.
Oliner, Stephen D., and Daniel E. Sichel. 2000. “The Resurgence of Growth in the Late 1990s: Is Information Technology the Story?” The Journal of Economic Perspectives, 14(4): 3–22.
Oliner, Stephen D., Kevin J. Stiroh, and Daniel E. Sichel. 2007. “Explaining a Productive Decade.”
Brookings Papers on Economic Activity, no. 1, pp. 81–137.
Pisano, Gary P., and Willy C. Shih. 2009. “Restoring American Competitiveness.” Harvard Business Review, July–August, pp. 114–25.
Pollin, Robert, and Dean Baker. 2010. “Rein-dustrializing America: A Proposal for Reviving U.S. Manufacturing and Creating Millions of Good Jobs.” New Labor Forum, 19(2): 17–34.
Reich, Robert B. 2009. “Made in America: Manufacturing Jobs Are Never Coming Back.” Forbes.com, May, 28. http://www.forbes .com/2009/05/28/robert-reich-manufacturing -business-economy.html.
Reinsdorf, Marshall. 1993. “The Effect of Outlet Price Differentials in the U.S. Consumer Price Index.” In Price Measurements and Their Use, ed. M. F. Foss, M. E. Manser, and A. H. Young, 227–54. Chicago: University of Chicago Press.
Reinsdorf, Marshall, and Robert Yuskavage. 2009. “Are There Unmeasured Declines in Prices of Imported Final Consumption Goods?” Paper prepared for the conference on “Measurement Issues Arising from the Growth of Globalization,” Nov. 6–7, 2009, Washington, DC.
Sturgeon, Timothy J., Frank Levy, Clair Brown, J. Bradford Jensen, and David Weil. 2006. “Why We Can’t Measure the Economic Effects of Services Offshoring: The Data Gaps and How to Fill Them.” Services Offshoring Working Group Final Report. Cambridge, MA: Massachusetts Institute of Technology, Industrial Performance Center. http://web.mit.edu/ipc/publications /pdf/IPC_Offshoring_Report.pdf.
Syverson, Chad. Forthcoming. “What Deter-mines Productivity?” Journal of Economic Literature.
U.S. Department of Labor, Bureau of Labor Statistics. 2009a. “International Comparisons of Manufacturing Productivity and Unit Labor Cost Trends, 2008.” News Release. http://www.bls.gov /news.release/pdf/prod4.pdf.
U.S. Department of Labor, Bureau of Labor Statistics. 2009b. “Handbook of Methods.” http://www.bls.gov/opub/hom/.
Wasshausen, David B., and Brent R. Moulton. 2006. “The Role of Hedonic Methods in Measuring Real GDP in the United States.” Prepared for the 31st CEIES Seminar “Are We Measuring Produc-tivity Correctly?”
Yuskavage, Robert E., Erich H. Strassner, and Gabriel W. Medeiros. 2008. “Outsourcing and Imported Services in BEA’s Industry Accounts.” In International Flows of Invisibles: Trade in Services and Intangibles in the Era of Globalization, ed. M. Reins-dorf and M. Slaughter, 247–88. Chicago: University of Chicago Press.
spring2011-252.indb 132 4/18/11 5:05 PM