Embed Size (px)
Citation preview

Offshore Wind Turbine Reliability
Peter Tavner
Professor of New & Renewable Energy
Energy Group
Supergen Wind Training
Manchester1

Overview
• Brief update on UK offshore wind power
• What we know about wind turbine availability and
reliability, onshore
• More detail on reliability of components
• Conclusions and future challenges
2
Supergen Wind Training
Manchester

UK Offshore
Rounds 1 & 2
3
Supergen Wind Training
Manchester

European Offshore Wind Farms
4
Supergen Wind Training
Manchester
Wind farmMW
CapacityCountry WT No. Maker Type Rating
Commissio
ned
Thanet 300United
Kingdom100 Vestas V90 3 MW 2010
Horns Rev II 209 Denmark 91 SiemensSWT-2,3-
932.3 MW 2009
Rødsand II 207 Denmark 90 SiemensSWT-2,3-
932.3 MW 2010
Lynn and Inner
Dowsing194
United
Kingdom54 Siemens
SWT-3.6-
1073.6 MW 2009
Walney Phase I 184United
Kingdom51 Siemens
SWT-3.6-
1073.6 MW 2011
Robin Rigg 180United
Kingdom60 Vestas V90 3 MW 2010
Gunfleet Sands 173United
Kingdom48 Siemens
SWT-3.6-
1073.6 MW 2010
Nysted I 166 Denmark 72 SiemensSWT-2,3-
822.3 MW 2003
Horns Rev I 160 Denmark 80 Vestas V80 2 MW 2002
Princess
Amalia120 Netherlands 60 Vestas V80 2 MW 2008
Lillgrund 110 Sweden 48 Siemens SWT-2.3- 2.3 MW 2007
Egmond aan
Zee108 Netherlands 36 Vestas V90 3 MW 2007
TOTAL 2111 MW 790
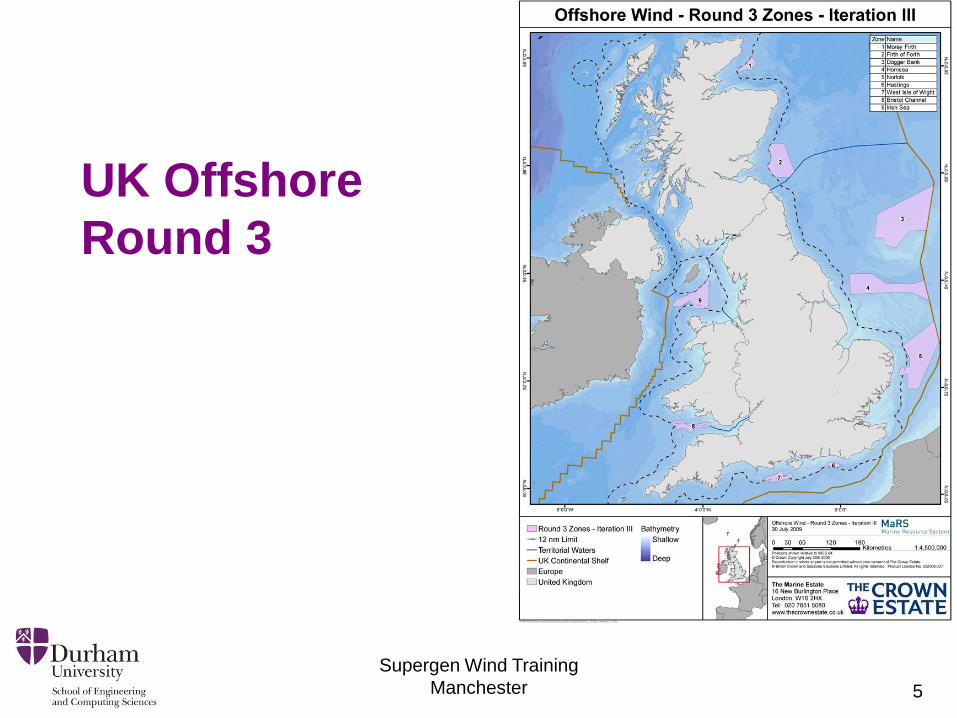
UK Offshore
Round 3
5
Supergen Wind Training
Manchester

UK Onshore & Offshore in Context
6
Supergen Wind Training
Manchester
Operational wind farms
Onshore MW
Capacity
England 103 812.09
Northern
Ireland
27 309.73
Scotland 111 2,364.18
Wales 33 382.55
274 3,868.55
MW
Offshore Round 1 & 2
England 10 1,181.20
Scotland 1 10.00
Wales 2 150.00
TOTAL 13 1,341.20
MW
Offshore Round 3 Wind Zones
Wind farm Region MW
Capacity Developer (owner)
Bristol Channel South West 1500 RWE Npower Renewables
Dogger Bank North Sea 9000
Forewind Consortia (SSE
Renewables, RWE Npower
Renewables, Statoil and
Statkraft)
Firth of Forth Scotland 3500 SeaGreen Wind energy Ltd
(SSE Renewables, Fluor)
Hastings South 600 E.On Climate and
Renewables
Hornsea North Sea 4000
Mainstream Renewable
Power, Siemens Project
Ventures
Irish Sea Irish Sea 4200 Centrica
Moray Firth Scotland 1300 EDP Renovaveis, Seaenergy
Renewables
Norfolk Bank Southern
North Sea 7200
East Anglia Offshore Wind Ltd
(Scottish Power Renewables
and Vattenfall)
West of Isle of
WightSouth 900 Eneco New Energy
TOTAL 32,200
MW

Reliability and Size , EU Onshore
7
Small, group I Medium, group II Large, group III
Supergen Wind Training
Manchester

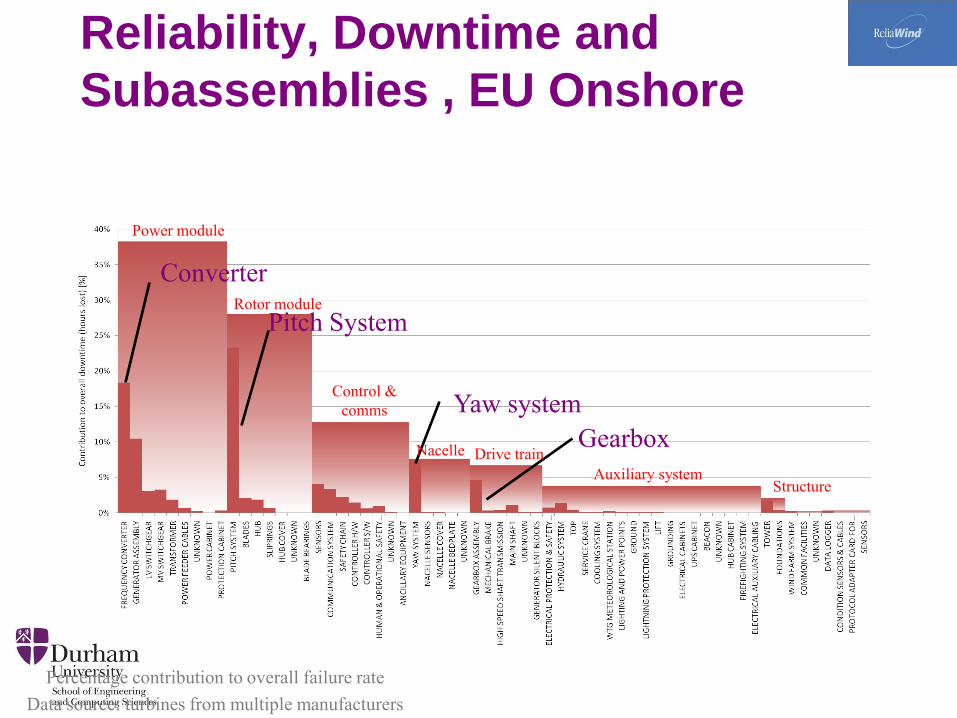
Reliability, Downtime and
Subassemblies, EU Onshore
8
Drive Train
Generator
Gearbox
Rotor Blades
Mechanical Brake
Rotor Hub
Yaw System
Hydraulic System
Other
Electrical Control
Electrical SystemLWK Failure Rate, approx 5800 Turbine Years
WMEP Failure Rate, approx 15400 Turbine Years
LWK Downtime, approx 5800 Turbine Years
WMEP Downtime, approx 15400 Turbine Years
1 0.75 0.5 0.25 0 2 4 6 8 10 12 14
Failure/turbine/year Downtime per failure (days)
Failure/turbine/year and Downtime from 2 Large Surveys of European Onshore Wind Turbines over 13 years
Supergen Wind Training
Manchester
75% of failures cause 5% downtime
25% of failures cause 95% of downtime

Converter
Yaw system
Pitch System
Gearbox
Percentage contribution to overall failure rate
Data source: turbines from multiple manufacturers
Power module
sub-system
Power
converter
assembly
Power module
Rotor module
Control &
comms
Nacelle
Drive trainAuxiliary system
Structure
Reliability, Downtime and
Subassemblies, EU Onshore
Converter
Yaw system
Pitch System
Gearbox
Percentage contribution to overall failure rate
Data source: turbines from multiple manufacturers
Power module
Rotor module
Control &
comms
Nacelle Drive train
Auxiliary systemStructure
Reliability, Downtime and
Subassemblies , EU Onshore

Capacity Factor & Availability
Energy generated in a year = C x Turbine rating x 8760
Capacity Factor, C
8760: number of hours in a year
Therefore:
C = Energy generated in a year / Turbine rating x 8760
C incorporates the Availability, A
Availability, A=1-MTTR/MTBF, where MTBF=1/l
Capacity Factor, C Availability, A
Typical UK values
Onshore 27.3% 97%
Early offshore 29.5% 80%
Typical EU values
Offshore 36% 90%
11

Cost of Energy, COE
• COE, £/kWh=
(ICC×FCR + O&M)/AEP
– ICC=Initial Capital Cost, £
– FCR=Fixed Charge Rate, interest, %
– O&M=Annual Cost of Operations & Maintenance, £
– AEP=Annualised Energy Production, kWh
• COE , £/kWh =
(ICC×FCR + O&M(1/l, 1/MTTR))/AEP(A(1/l, 1/MTTR)}
• Reduce failure rate l, Reliability MTBF 1/l improve and Availability Aimprove, O&M cost reduces;
• Reduce Downtime MTTR, Availability A improve, O&M cost reduces;
• Therefore COE, reduces
12
of

Offshore Capacity Factor and
Wind Speed, UK
13
V90
V80
V80
V90
Monthly capacity factor against wind speed for the offshore wind farms
V80
V90
Supergen Wind Training
Manchester

Offshore Availability and Wind
Speed, UK
14
Supergen Wind Training
Manchester

Onshore Availability and Wind
Speed, World
15
40%
energy
produced
at wind
speeds
>11m/s
Supergen Wind Training
Manchester

Wind Turbine Reliability Analysis
16
Root Causes
Failure Modes
And Effects
Analysis,
FMEA
Failure Location
Condition
Monitoring
Signals
SCADA
Signal
Analysis
Results of
survey data WP1
Wind condition
Weather
Faulty design
Faulty materials
Poor maintenance
Results of
WP3 analysis
Results of
WP2 analysis
How?
SCADA Analysis
& Diagnosis
Why?
Root Cause Analysis
Supergen Wind Training
Manchester

Conclusions
• WT reliability is improving
• WT concepts have different reliabilities
• Larger WTs have higher failure rates
• Generally failure rates are constant & subassemblies
with high failure rates are consistent
• Downtime or MTTR and Cost of Energy are also
important
• Failure rates of subassemblies can improve with time
• Offshore availability Ai is worse than onshore
• Offshore availability reduces with wind speed
17
Supergen Wind Training
Manchester

What is the Value of this
Information
• It gives us baselines for WT and subassembly λ
(1/MTBF) and MTTR
• It makes clear the difference between onshore and
offshore
• It shows us that we need to use standardised
Availability and Reliability definitions
• It shows us that we need to standardise subassembly
definitions if we are to interpret results
18
Supergen Wind Training
Manchester

What is the Value of this
Information
• It shows us that there is a lot to learn about Root
Causes and valid Detection Methods by interpreting
this information
• It shows us that there is a lot we can do to improve
our Wind Turbines but that we need hard data to do it
• However data from turbines is useless if we cannot
relate it to failures and repairs
19
Supergen Wind Training
Manchester

20
P.J. Tavner, C. Edwards, A. Brinkman, and F. Spinato, “Infuence of wind speed on wind turbine reliability,” Wind Engineering, vol. 30, no. 1, pp. 55–72, 2006.
P.J. Tavner, J.P. Xiang, and F. Spinato. “Reliability analysis for wind turbines,” Wind Energy; vol. 10, no. 1, pp 1–18, 2007.
F. Spinato, P.J. Tavner, and G.J.W. van Bussel, “Reliability-growth analysis of wind turbines from field data,” Proceedings of AR2TS conference, Loughborough, 2007.
P. J. Tavner, G.J.W. van Bussel, and F. Spinato, “Machine and converter reliabilities in WTs,” Proceedings of IEE PEMD Conference, Dublin, April 2006.
A.D. Hansen, and L.H. Hansen, “Wind turbine concept market penetration over 10 years (1995–2004),” Wind Energy, vol. 10, pp. 81–97, 2007.
J. Ribrant, and L.M. Bertling, “Survey of failures in wind power systems with focus on Swedish wind power plants during 1997–2005,” IEEE Trans Energy Conversion, vol. EC22, no. 1, pp. 167–173, 2007.
E. Wolfgang. Examples for failures in power electronics systems, in EPE Tutorial „Reliability of Power Electronic Systems‟, April 2007.
P. Beckendahl, “Skiip, an intelligent power module for wind turbine inverters,” EPE Wind Chapter Mtg, Stockholm, May 2009.
Y. Feng, P.J. Tavner, and H. Long. “Early experiences with UK round 1 offshore wind farms,” Accepted by Proceedings of the Institution of Civil Engineers, Energy, 2010.
E. Echavarria, T. Tomiyama, G.J.W. van Bussel, and B. Hahn, “How has reliability of technology developed through time?” EWEC, Milano, 2007.
Thank you
Supergen Wind Training
Manchester