Embed Size (px)
Citation preview
Offshore wind power: big challenge, big opportunityMaximising the environmental, economic and security benefits

Preface 01
Executive summary 02
1 Implications of the 2020 EU Renewable Energy Targets 10
The EU 2020 Renewable Energy Targets 10
Implications for the UK 12
Conclusion 15
2 Offshore wind farm sites 16
The history of offshore wind farm sites 16
Round 3 – 25GW of new sites 18
Location, location, location –
why it’s crucial for offshore wind farms 19
Delivering on the cost savings 25
3 Grid and planning 26
Introduction 26
Why the lights won’t go out on a still day
– balancing and backup myths 26
Avoiding excess supply – curtailment 29
Grid connections required but transmission
network reinforcement not necessary 29
Implementing grid regulation reform
to minimise costs and delays 31
Interconnection to minimise costs and fully
exploit the UK’s wind resource 33
Planning regulations that deliver 34
4 Technology 36
Overview 36
The challenge for technology development 38
Opportunities for technology development 40
Cost reduction through learning 48
The future impact of commodity
and material price fluctuations 49
Achieving cost competitiveness 49
Innovation programme and associated
RD&D investment required 52
5 Supply chain 56
Introduction 56
Developers – investing up to £65bn
in offshore wind generation 58
Turbine manufacturers –
how offshore wind complements
a booming onshore market 61
Component manufacturing –
a strategic focus for the future 65
Installation – from a nascent to
a growth industry 69
Operation and Maintenance –
innovation in the supply chain 71
Maximising the UK economic benefit 72
6 Incentive mechanism 77
Introduction 77
Performance of the planned
banded RO mechanism 78
Options to drive offshore wind
development 78
Evaluation of different options
at central electricity prices 79
The new paradigm of high
electricity prices 83
Conclusion 84
7 Cost/Benefit 88
The cost of offshore wind 88
The impacts of a possible new paradigm
of high gas prices 90
The benefits of offshore wind 90
Conclusion 95
8 Recommendations 96
Action required by the UK Government 96
Action required by industry
and other stakeholders 104
Appendix I 106
Table of Contents
01Offshore wind power
Preface
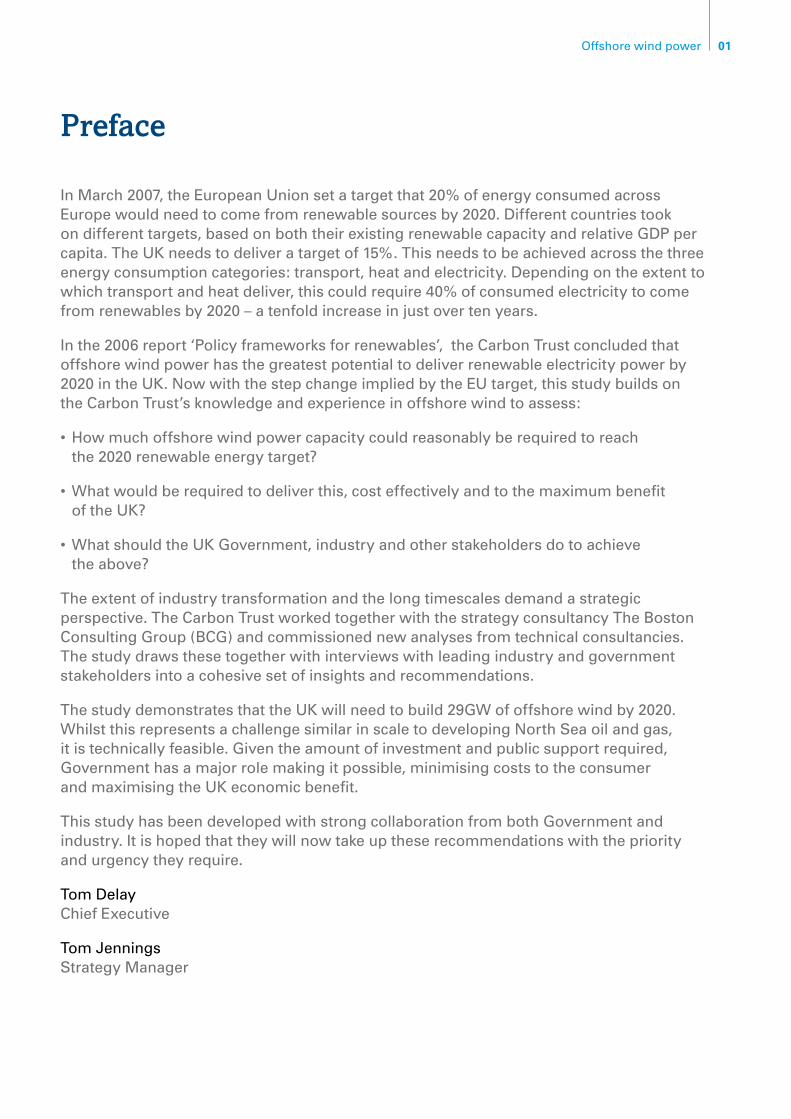
In March 2007, the European Union set a target that 20% of energy consumed across Europe would need to come from renewable sources by 2020. Different countries took on different targets, based on both their existing renewable capacity and relative GDP per capita. The UK needs to deliver a target of 15%. This needs to be achieved across the three energy consumption categories: transport, heat and electricity. Depending on the extent to which transport and heat deliver, this could require 40% of consumed electricity to come from renewables by 2020 – a tenfold increase in just over ten years.
In the 2006 report ‘Policy frameworks for renewables’, the Carbon Trust concluded that offshore wind power has the greatest potential to deliver renewable electricity power by 2020 in the UK. Now with the step change implied by the EU target, this study builds on the Carbon Trust’s knowledge and experience in offshore wind to assess:
• Howmuchoffshorewindpowercapacitycouldreasonablyberequiredtoreach the 2020 renewable energy target?
• Whatwouldberequiredtodeliverthis,costeffectivelyandtothemaximumbenefit of the UK?
• WhatshouldtheUKGovernment,industryandotherstakeholdersdotoachieve the above?
The extent of industry transformation and the long timescales demand a strategic perspective. The Carbon Trust worked together with the strategy consultancy The Boston Consulting Group (BCG) and commissioned new analyses from technical consultancies. The study draws these together with interviews with leading industry and government stakeholders into a cohesive set of insights and recommendations.
The study demonstrates that the UK will need to build 29GW of offshore wind by 2020. Whilst this represents a challenge similar in scale to developing North Sea oil and gas, it is technically feasible. Given the amount of investment and public support required, Government has a major role making it possible, minimising costs to the consumer and maximising the UK economic benefit.
This study has been developed with strong collaboration from both Government and industry. It is hoped that they will now take up these recommendations with the priority and urgency they require.
Tom Delay Chief Executive
Tom Jennings Strategy Manager
02 The Carbon Trust
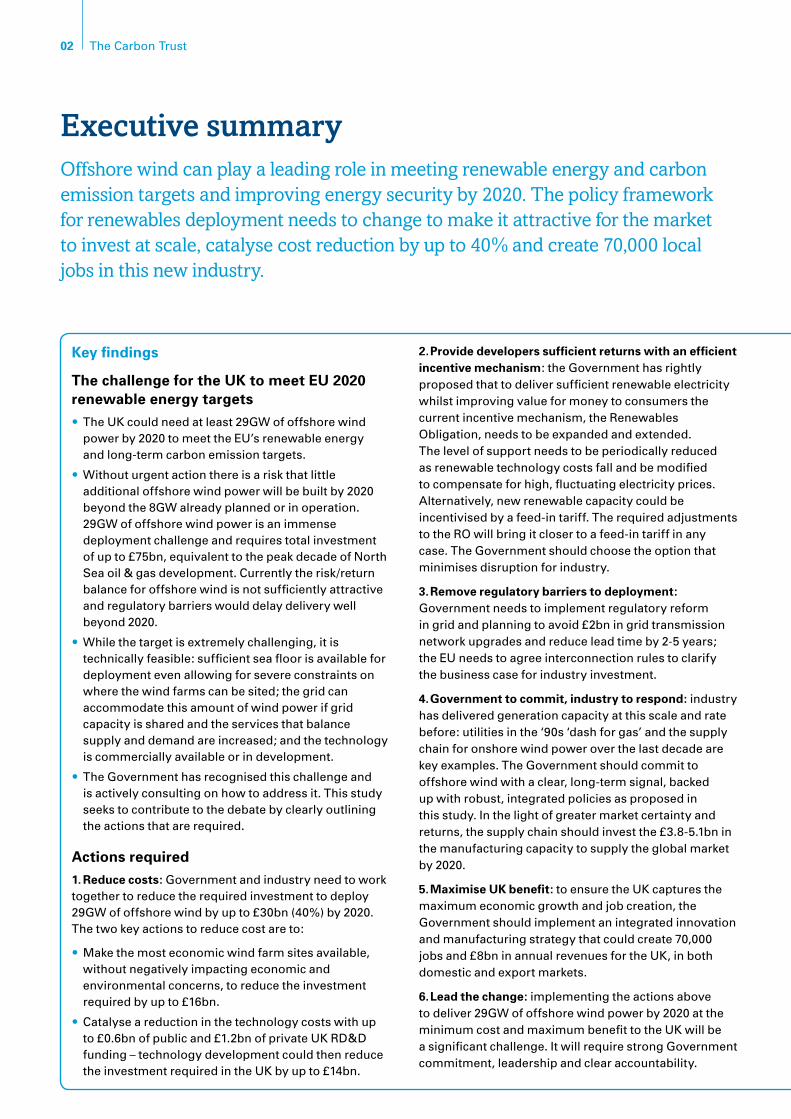
Executive summaryOffshore wind can play a leading role in meeting renewable energy and carbon emission targets and improving energy security by 2020. The policy framework for renewables deployment needs to change to make it attractive for the market to invest at scale, catalyse cost reduction by up to 40% and create 70,000 local jobs in this new industry.
Key findings
The challenge for the UK to meet EU 2020 renewable energy targets
The UK could need at least 29GW of offshore wind •power by 2020 to meet the EU’s renewable energy and long-term carbon emission targets.
Without urgent action there is a risk that little •additional offshore wind power will be built by 2020 beyond the 8GW already planned or in operation. 29GW of offshore wind power is an immense deployment challenge and requires total investment of up to £75bn, equivalent to the peak decade of North Sea oil & gas development. Currently the risk/return balance for offshore wind is not sufficiently attractive and regulatory barriers would delay delivery well beyond 2020.
While the target is extremely challenging, it is •technically feasible: sufficient sea floor is available for deployment even allowing for severe constraints on where the wind farms can be sited; the grid can accommodate this amount of wind power if grid capacity is shared and the services that balance supply and demand are increased; and the technology is commercially available or in development.
The Government has recognised this challenge and •is actively consulting on how to address it. This study seeks to contribute to the debate by clearly outlining the actions that are required.
Actions required1. Reduce costs: Government and industry need to work together to reduce the required investment to deploy 29GW of offshore wind by up to £30bn (40%) by 2020. The two key actions to reduce cost are to:
Make the most economic wind farm sites available, •without negatively impacting economic and environmental concerns, to reduce the investment required by up to £16bn.
Catalyse a reduction in the technology costs with up •to £0.6bn of public and £1.2bn of private UK RD&D funding – technology development could then reduce the investment required in the UK by up to £14bn.
2. Provide developers sufficient returns with an efficient incentive mechanism: the Government has rightly proposed that to deliver sufficient renewable electricity whilst improving value for money to consumers the current incentive mechanism, the Renewables Obligation, needs to be expanded and extended. The level of support needs to be periodically reduced as renewable technology costs fall and be modified to compensate for high, fluctuating electricity prices. Alternatively, new renewable capacity could be incentivised by a feed-in tariff. The required adjustments to the RO will bring it closer to a feed-in tariff in any case. The Government should choose the option that minimises disruption for industry.
3. Remove regulatory barriers to deployment: Government needs to implement regulatory reform in grid and planning to avoid £2bn in grid transmission network upgrades and reduce lead time by 2-5 years; the EU needs to agree interconnection rules to clarify the business case for industry investment.
4. Government to commit, industry to respond: industry has delivered generation capacity at this scale and rate before: utilities in the ‘90s ‘dash for gas’ and the supply chain for onshore wind power over the last decade are key examples. The Government should commit to offshore wind with a clear, long-term signal, backed up with robust, integrated policies as proposed in this study. In the light of greater market certainty and returns, the supply chain should invest the £3.8-5.1bn in the manufacturing capacity to supply the global market by 2020.
5. Maximise UK benefit: to ensure the UK captures the maximum economic growth and job creation, the Government should implement an integrated innovation and manufacturing strategy that could create 70,000 jobs and £8bn in annual revenues for the UK, in both domestic and export markets.
6. Lead the change: implementing the actions above to deliver 29GW of offshore wind power by 2020 at the minimum cost and maximum benefit to the UK will be a significant challenge. It will require strong Government commitment, leadership and clear accountability.
03Offshore wind power
Cost/benefit
The onshore and offshore wind power required to •meet the EU renewable energy target could result in a net addition of 8% to retail electricity prices and less than 20% to wholesale electricity prices1 by 2020. The actions in this report could reduce the net addition to 1% on retail electricity prices and 3% on wholesale
electricity prices. Indeed if gas prices remain above 90p/therm then wind power could reduce electricity prices. In addition offshore and onshore wind deployment at scale will make the UK less reliant on imported gas, reduce its carbon emissions by 14%2 and will allow the UK to become a leader in a growing global market for offshore wind.
1 With wholesale electricity prices at £45/MWh – BERR’s central long-term electricity price scenario2 From 2006
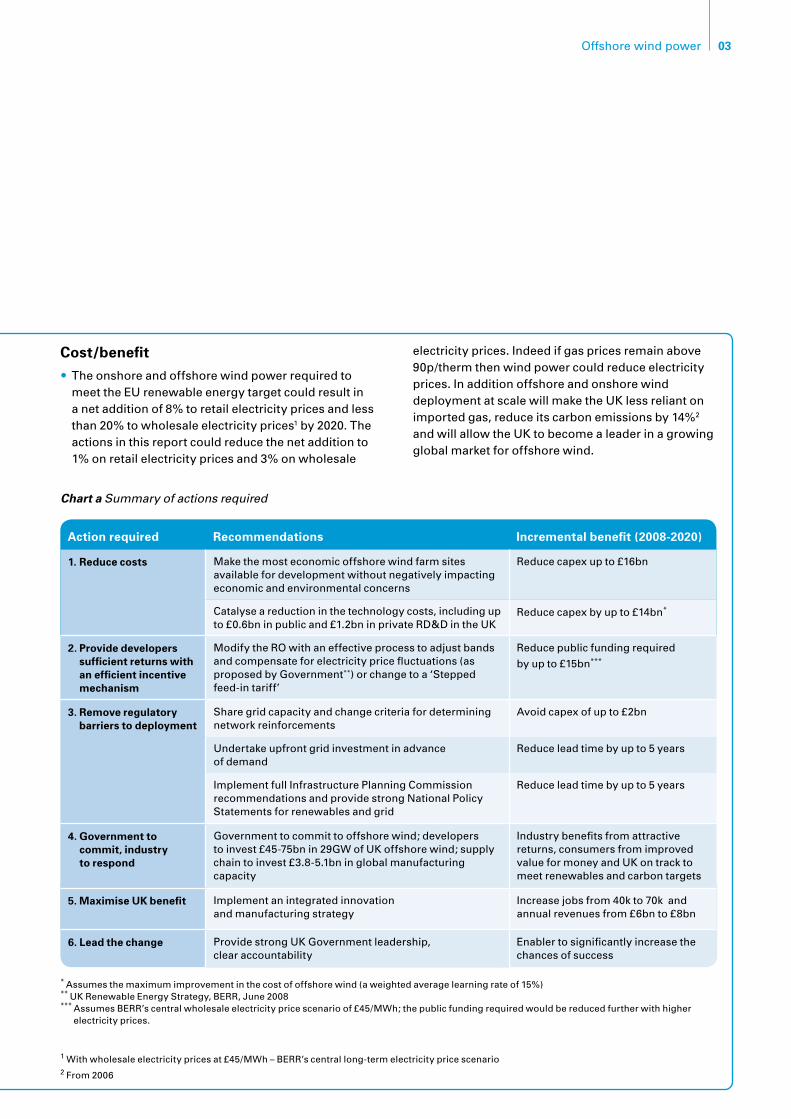
Chart a Summary of actions required
Action required Recommendations Incremental benefit (2008-2020)
1. Reduce costs Make the most economic offshore wind farm sites available for development without negatively impacting economic and environmental concerns
Reduce capex up to £16bn
Catalyse a reduction in the technology costs, including up to £0.6bn in public and £1.2bn in private RD&D in the UK
Reduce capex by up to £14bn*
2. Provide developers sufficient returns with an efficient incentive mechanism
Modify the RO with an effective process to adjust bands and compensate for electricity price fluctuations (as proposed by Government**) or change to a ‘Stepped feed-in tariff’
Reduce public funding required
by up to £15bn***
3. Remove regulatory barriers to deployment
Share grid capacity and change criteria for determining network reinforcements
Avoid capex of up to £2bn
Undertake upfront grid investment in advance of demand
Reduce lead time by up to 5 years
Implement full Infrastructure Planning Commission recommendations and provide strong National Policy Statements for renewables and grid
Reduce lead time by up to 5 years
4. Government to commit, industry to respond
Government to commit to offshore wind; developers to invest £45-75bn in 29GW of UK offshore wind; supply chain to invest £3.8-5.1bn in global manufacturing capacity
Industry benefits from attractive returns, consumers from improved value for money and UK on track to meet renewables and carbon targets
5. Maximise UK benefit Implement an integrated innovation and manufacturing strategy
Increase jobs from 40k to 70k and annual revenues from £6bn to £8bn
6. Lead the change Provide strong UK Government leadership, clear accountability
Enabler to significantly increase the chances of success
* Assumes the maximum improvement in the cost of offshore wind (a weighted average learning rate of 15%)** UK Renewable Energy Strategy, BERR, June 2008 *** Assumes BERR’s central wholesale electricity price scenario of £45/MWh; the public funding required would be reduced further with higher
electricity prices.
04 The Carbon Trust
The challenge for the UK to meet EU 2020 targets29GW of offshore wind required by 2020
The EU has set an ambitious target that 20% of the energy consumed in Europe should come from renewables by 2020. The UK share of this target, at 15%, implies a significant change in the way we generate and use energy in transportation, heat and electricity. Assuming that the UK meets the EU’s 10% renewable transport target and that renewable heat technologies also deliver 10%, then the UK would need renewables to provide 40% of its electricity to meet the overall EU renewable energy target – a ten-fold increase over the next decade.
The UK has a significant advantage – it has some of Europe’s best wind, wave and tidal resources. Of these, wind power has the greatest potential to deliver by 2020. Onshore wind sites are likely to continue to be constrained by planning issues and we estimate that onshore wind power could deliver 6% of the UK’s electricity (11GW). Under a reasonable set of assumptions, other renewable sources would deliver 9% and therefore offshore wind power would need to deliver 25% to meet the EU 2020 targets. 25% of UK electricity equates to 29GW of offshore wind power capacity.
Without urgent action the UK will not deliver deployment at scale
Delivering 29GW of offshore wind power generation in just over a decade is an immense challenge. It is equivalent in scale to the ‘90s ‘dash for gas’ and could require up to £75bn in investment from industry, on a similar scale to that invested in North Sea oil & gas in the peak decade of its development.
On the current track, the balance of risks and returns of offshore wind development will not be attractive enough for the industry to repeat this level of deployment. Capital costs have more than doubled over the last five years and the sites currently available for new offshore wind farms would provide even less attractive risks and returns than those of today. Given this, the current level and duration of the Renewable Obligation incentive mechanism3 is not sufficient to stimulate the scale of investment required.
Furthermore, even if returns were sufficient, current grid and planning regulations would delay delivery well beyond 2020. With this level of uncertainty, the supply chain is unlikely to invest in the Research, Development & Demonstration (RD&D) and manufacturing capacity required. Unless action is taken to address these issues, almost no additional offshore wind will be built on the current track beyond the 8GW already planned or in operation.
Technically feasible
While the target is extremely challenging, it is technically feasible:
29GW of offshore wind farms only need 0.5% of total •UK sea floor, a combined space the size of the county of Somerset. There is sufficient room in UK waters, even with all the current constraints on where offshore wind farms can be located.
3 Including the planned 1.5 Renewable Obligation Certificate (ROC) banding

05Offshore wind power
The UK’s electricity system can incorporate 40GW •of offshore and onshore wind power without compromising security of supply; both the long-term need to meet peaks in demand, and the short-term requirement to balance supply and demand at all times:
– The wind does not always blow so we cannot count on the full 40GW of wind power being available all of thetime.However,windpowerwillcontributetothelong-term reliability of the network, reducing the need for conventional capacity by 6GW, whilst maintaining current levels of certainty that available capacity (both conventional and wind) will be able to meet peak demand. Of course, on average over the year wind will generate much more than the equivalent of 6GW of capacity and the thermal generation that remains on the system will not need to generate as much energy – reducing its load factor. The ‘net load factor cost’ is equivalent to increasing the cost of wind power by 8%.
– In the short-term, the electricity system needs to ensure that supply and demand are always in balance. The additional variability in wind power output can be accommodated by increasing the existing generation capacity that provides ‘balancing services’ that keep supply and demand in balance at all times – increasing the cost of wind power by 7%.
Offshore wind technology has been operating •commercially since 2002. Additional technology developments will be required to increase reliability and enable development of sites that are further from shore and in deeper water. The engineering challenge to operate in the marine environment should not be underestimated, but most developments will be able to leverage existing tried and tested technologies from the onshore wind, electrical power and oil & gas sectors.
Offshore wind power will need to become a more attractive investment for industry to deploy it at scale. A change in the policy framework is required to reduce offshore wind power costs and to provide developers sufficient returns with an efficient incentive mechanism. Changes also need to be made to remove the regulatory barriers to deploying 29GW of offshore wind (and 11GW of onshore wind) by 2020. The following section summarises the set of actions required.
Actions required1. Reduce costs
The investment required to deliver 29GW of offshore wind can be reduced by 40% – from £75bn to £45bn. The UK Government can stimulate these savings by making the best sites available and catalysing technology down the cost curve.
Make the most economic wind farm sites available to reduce required investment by up to £16bn
The potential constraints on where new offshore wind farms can be located would limit development to deep waters far out in the North Sea, north of an area known as Dogger Bank4. The capital investment required to develop these sites would be up to 40% higher than today’s UK offshore wind farm developments. Returns from these sites would be poor with increased costs outweighing increased electricity generation from higher winds. Risks would also be higher due to the new technology developments required to build this far from shore and in deep waters4.
If none of these potential site constraints are relaxed, 29GW of offshore wind power will require investment of around £75bn. The study’s base case assumes some constraints are relaxed, reducing this investment to £65bn. Further sensible relaxation of constraints, which does not negatively impact environmental or economic concerns, would reduce investment by up to a further £6bn and make sites available that will provide returns that are at least as attractive as today’s UK offshore wind farm developments.
4 This area is more than 60nm from shore, with depths of over 40m
06 The Carbon Trust
To relax site constraints to the extent outlined in this report, the Government urgently needs to provide leadership in negotiations across multiple Government departments and stakeholders through its planned consultation on this issue in January 2009. Negotiations need to be successfully completed in time for the Secretary of State’s decision on the level of acceptable impact of offshore wind which will, in effect, define where and how much development can occur. This decision will then dovetail into the Crown Estate’s awards of lease options in Q1 2009.
Catalyse technology down its cost curve with £0.1-0.6bn of public UK RD&D funding – global technology development and economies of scale could reduce required investment by £14bn
The offshore wind technology required to deliver 29GW of generation in the UK is commercially available or already in development. The cost of offshore wind technology will reduce over time due to technology developments and economies of scale. Current offshore wind technology is based on tried-and-tested technology from onshore wind and other markets and can be further optimised for installation and operation at sea. Key opportunities include reducing the need for turbine maintenance and repairs, minimising turbine and foundation material costs and developing high volume installation techniques.
Significant investment in RD&D will be required to unlock this cost reduction. The private sector will need to invest £3.0-4.3bn globally, 20-30% of which could be invested in the UK. Where paybacks are too long or there is a risk of intellectual property ‘leakage’, private sector RD&D will need to be matched by UK Government funded RD&D of up to £0.6bn. Increased collaboration within industry could also help deliver this cost reduction.
This investment will help catalyse technology development which could reduce UK capital deployment costs by up to £14bn.
2. Provide sufficient returns with an efficient incentive mechanism
Extend the lifetime of the incentive mechanism but increase efficiency by tracking the cost curve and modifying the incentive mechanism to compensate for high, fluctuating electricity prices
An incentive is required to bridge the gap between the wholesale electricity price and the cost of renewable technologies – making deployment economically attractive which in turn unlocks economies of scale and reduces costs.
1 EnergyQuote, 27 June 20082 BERR central case energy price scenario3 Present value of cumulative public funding of the incentive mechanism to 20324 As proposed by Government in UK Renewable Energy Consultation, June 20085 Assumes that no offshore wind farms need to be built beyond 30 nautical miles from shore (including no development near the Dogger Bank) and that
a medium technology learning rate is achieved (weighted average of 13%) – see Section 4, subsection ‘Cost reduction opportunities’.
Source: Oxera, BCG analysis
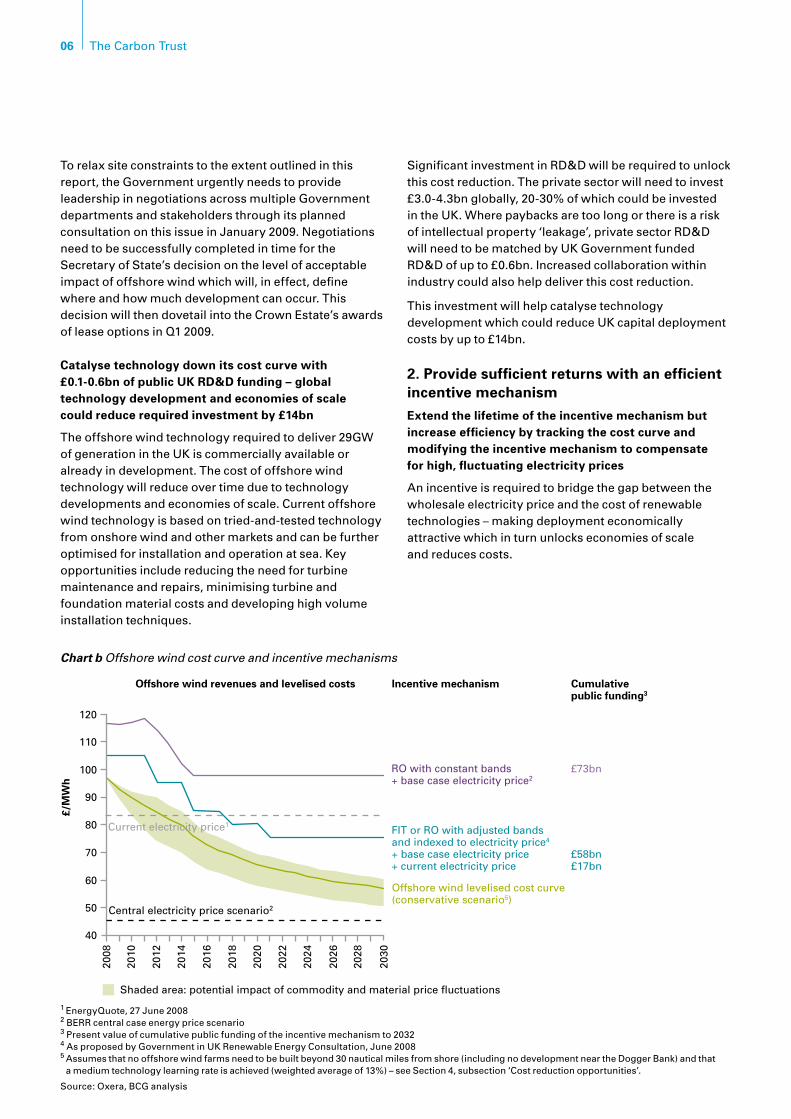
Chart b Offshore wind cost curve and incentive mechanisms
90
70
80
120
100
110
50
60
40
2008
2010
2012
2014
2016
2018
2020
2022
2024
2026
2028
2030
Central electricity price scenario2
£/M
Wh
RO with constant bands + base case electricity price2
£73bn
£58bn£17bn
Offshore wind levelised cost curve(conservative scenario5)
Cumulative public funding3
Incentive mechanismOffshore wind revenues and levelised costs
Current electricity price1FIT or RO with adjusted bandsand indexed to electricity price4
+ base case electricity price+ current electricity price
Shaded area: potential impact of commodity and material price fluctuations
07Offshore wind power
Central electricity price scenario
If the maximum cost reduction from the actions above were achieved, offshore wind power would almost be cost competitive with a central long-term electricity price scenario of £45/MWh by 2020. Chart b shows the offshore wind cost curve for a more conservative scenario5 where around half of this cost reduction is achieved. The gap between the cost curve and the central electricity price scenario narrows considerably, but offshore wind power does not become cost competitive by 2020.
The current incentive mechanism, the Renewable Obligation (RO), is set to deliver a maximum of 20% renewable electricity. With up to 40% renewable electricity required to meet the EU 2020 target, the Government will need to expand and extend the RO or introduce a new mechanism, such as a feed-in tariff (FIT) which provides renewable generators with a fixed level of tariff.
Whichever incentive mechanism the Government chooses, it will need to track offshore wind power down its cost curve to be efficient. The level of support under the RO automatically increases or decreases depending on the amount of renewable deployment. As shown in Chart b, this market mechanism is forecast to be reasonably effective up to 2015 at which point the level of support under the RO reaches its minimum level, the ‘buy-out’ price. Without further manual adjustment, public funding through the RO would significantly exceed the level of support required. The Government is therefore consulting on a process to manually adjust the RO to more closely track the cost curve. The RO would then become more like a feed-in tariff and under this scenario reduce the required public funding to£58bn, a £15bn saving, as long as the future costs of offshore wind power are forecast with reasonable accuracy.
High electricity price scenarios
It is possible that the UK has entered a new paradigm of high electricity prices and as such offshore wind power could become cost competitive before 2020. Wholesale electricity prices over the summer of 2008 were around £80/MWh6, nearly twice the Government’s central scenario of £45/MWh. Current forward prices are significantly higher7. If electricity prices were to remain above £80/MWh over the lifetime of the offshore wind farms no incentive would be required potentially from as early as 2010 to 2015.
The RO was not designed for this paradigm of high electricity prices. The incentive from the RO is additional to the electricity price and the RO cannot currently compensate for large electricity price fluctuations. The RO would therefore need to be significantly modified, for instance by being indexed to reduce when electricity prices rise and vice versa. Alternatively the Government could transfer to a feed-in tariff, which provides a fixed level of overall support no matter the electricity price. If offshore wind power were to become cost competitive by 2012, a successfully modified RO or a feed-in tariff would require only £17bn in cumulative public funding if current electricity prices were to persist.
It is critical that any change from the current RO does not undermine investor confidence and the short-term delivery of the 8GW of offshore wind farms already planned for construction. Developing these wind farms will put the supply chain on the right trajectory to ramp up to the full 29GW and, through technology developments and economies of scale help push offshore wind power down the cost curve.
An option could be to delay any change to the incentive mechanism until the new (round 3) offshore wind farms areinstalledfrom2015.However,atcurrentelectricityprices this delay would more than double public funding beyond the level required.
In summary, the incentive mechanism needs an effective process to track the cost curve to reduce public funding by up to £15bn and to compensate for a potential paradigm of high electricity prices under which far less funding would be required. This can be achieved either by modifying the RO or transferring to a feed-in tariff. A feed-in tariff would be simpler than applying additional modifications to the RO, which is already a complicated mechanism. In addition it provides greater certainty to investors by reducing market and political risk. Nevertheless the Government should choose the most pragmatic option, based in part on industry feedback, that will minimise disruption to the short-term delivery of offshore wind power and ensure cost effective support towards achieving deployment at scale.
In either case, setting the appropriate level of funding requires a deep understanding of the underlying costs and risks of the renewable energy generation technologies and therefore the required levels of return and support levels. This capability should be created either within Government or an independent body, such as Ofgem.
5 Assumes that no offshore wind farms need to be built beyond 30 nautical miles from shore (including no development near the Dogger Bank) and that a medium technology learning rate is achieved (weighted average of 13%) – see Section 4, subsection ‘Cost reduction opportunities’.
6 Spot price of £83/MWh as at 27 June 2008, source: EnergyQuote7 Forward price for November 2008 of £133/MWh, source: EnergyQuote
08 The Carbon Trust
3. Remove regulatory barriers to deployment
Implement grid and planning regulatory reform to avoid £2bn in grid transmission network upgrades and reduce lead time by 2-5 years
Regulatory grid and planning barriers could be addressed by recent proposed Government legislation, but the challenge will be in the implementation. The Government will need to successfully negotiate with stakeholders if it is to minimise costs and deliver the required 29GW by 2020.
With a new mechanism to share grid capacity, the core grid transmission network need not be reinforced, beyond existing plans, even with 40GW of new wind power being added. Avoiding grid upgrades in this way could save up to £2bn. The Government’s Transmission Access Review proposes an appropriate sharing mechanism.However,itwillrequireGovernmentleadership to negotiate with legacy power generators, many of whom argue that they currently have the valuable right to supply into the grid at any time.
Whilst additional reinforcement to the core grid transmission network to accommodate offshore wind can be avoided, around 150 km of onshore grid connections will be required. The UK Government’s proposed Infrastructure Planning Commission (IPC) and National Policy Statements (NPS) are essential to ensure that offshore wind farms and associated grid connections can be constructed by 2020. The Government will need to retain the effectiveness of these policies as they are put on the statute book and will then need to demonstrate strong leadership and stakeholder management in implementing them.
As outlined above, variability in wind power output leads to a reduction in the load factors of thermal generation and increases the need for balancing services. Both effects and their associated costs can be significantly reduced by increasing interconnection with neighbouring countries which would spread the variability in wind power output across a larger system. Interconnection will also unlock wind capacity beyond 40GW in the longer term, exploiting the UK’s resource and the opportunity to exportitselectricity.Highlevelestimatessuggestthebusiness case for interconnection is strong though a more detailed analysis is required. The EU needs to develop standard pan-European interconnection rules to clarify cost and revenue sharing and therefore remove existing uncertainty in the business case for industry investment in interconnectors.
4. Industry to respond
With sufficiently attractive returns, the industry has delivered at this scale and rate before and can do so again
There are significant concerns that the current short-term bottlenecks in the offshore wind supply chain will hinder the delivery of significant offshore wind capacity by 2020. These bottlenecks are a symptom of a supply/demand imbalance across all the markets the supply chain delivers to (onshore wind, mining, infrastructure) and offshore wind being deprioritised given uncertain/lower returns. At the moment, offshore wind represents a maximum of 5% of revenues for the supply chain and therefore is not a strategic priority.
29GW in the UK and 59GW across Europe by 2020 will represent more than 10% of revenues for the supply chain. With sufficiently attractive returns, the industry can respond and build additional capacity in these timescales. The wind power supply chain can grow at the rate required – it has done so historically in onshore wind. Additional manufacturing capacity is required by 2020, up to the equivalent of eight factories for each component of the supply chain, 28-36 in all. This is deliverable in this timescale and the companies involved have the capability to deploy the required total investment of £3.8-5.1bn.
5. Government to maximise UK benefit
Ensuring the UK captures the maximum economic growth and job creation requires an integrated innovation and manufacturing strategy that could create up to 70,000 jobs and £8bn in annual revenues
Whilst the supply chain can grow at a sufficient rate, only a small proportion of this growth will naturally be located in the UK under a business-as-usual scenario. The Government should implement an integrated innovation and manufacturing strategy that combines the £0.6bn in RD&D funding discussed earlier with testing and demonstration facilities, support for new manufacturing capacity and port facilities, focused in appropriate geographic centres of excellence. This approach could increase the number of jobs created in the UK from 40,000 to 70,000, equating to £8bn in annual revenues by 2020.
09Offshore wind power
6. Lead the change
To deliver all the above, the UK Government needs a coordinated approach to meet the EU 2020 renewable targets and to deliver further renewables to reach 2050 carbon reduction goals. The creation of the Office for Renewable Energy Deployment is a move in the right direction.However,evenwiththecreationoftheDepartment of Energy and Climate Change, significant pan-departmental agreement will be required, necessitating strong leadership and clear accountability.
In addition, no matter whether RO banding or feed-in tariff levels are used to deliver against the goals, the appropriate level of incentive will need to be set, requiring a thorough understanding of the deliverability and underlying cost trends of different renewable technologies. This capability should be created either within Government or an independent body, such as Ofgem.
Cost/benefit – is it worth it?Incorporating 29GW of offshore wind and 11GW of onshore wind into the UK’s electricity system would result in a net addition of 8% to retail electricity prices and less than 20% to wholesale electricity prices by 2020 in our base case scenario. Successfully achieving the cost reductions outlined in this study would reduce these to a net addition of 1% to retail electricity prices and 3% to wholesale electricity prices by 2020. If gas prices remain above 90p/therm, offshore wind power could reduce electricity prices.
Offshore and onshore wind deployment at scale by 2020 would reduce the UK’s reliance on gas imports, replace nearly half of the demand/supply gap created by decommissioning conventional plant and reduce UK carbon emissions by 14%, as part of a wider portfolio of measures required to reduce emissions by 60-80% by 2050.
In addition, offshore wind will provide the UK with up to 70,000 jobs and £8bn in annual revenues if delivered with a proactive UK Government manufacturing strategy.
ConclusionThe UK could need at least 29GW of offshore wind power by 2020 to meet the EU’s renewable energy and long-term carbon emission targets. Delivering this amount of offshore wind capacity in this timeframe is a bigchallenge.However,thisstudyshowsthatnotonlycan it be achieved, but that delivery can be made more likely by reducing the level of required investment by up to £30bn. In addition, ensuring the incentive mechanism tracks the cost curve can reduce the required public funding by up to £15bn. Compensating for high electricity prices could lead to further reductions in the public funding required.
To achieve the above, the UK Government needs to urgently make the best offshore wind farm sites available, implement proposed grid and planning regulations, catalyse RD&D with up to £0.6bn of public funding and modify the incentive mechanism. In addition, these actions need to be backed up by leadership and clear accountability to deliver results. In the light of much greater certainty for the offshore wind market, combined with prospects of attractive returns, developers are likely to invest the £45-75bn required and the supply chain the £3.8-5.1bn in new manufacturing capacity required.
At a cost of 1-8% on retail electricity prices and 3-20% on wholesale electricity prices, and at no additional cost if current high gas prices continue, the UK will be set on the road to meeting EU 2020 renewable energy and longer term carbon emission reduction targets. The UK will also benefit from increased security of supply and gain up to £8bn in annual revenues and 70,000 jobs by 2020. Offshore wind could be a big opportunity for the UK.
10 The Carbon Trust
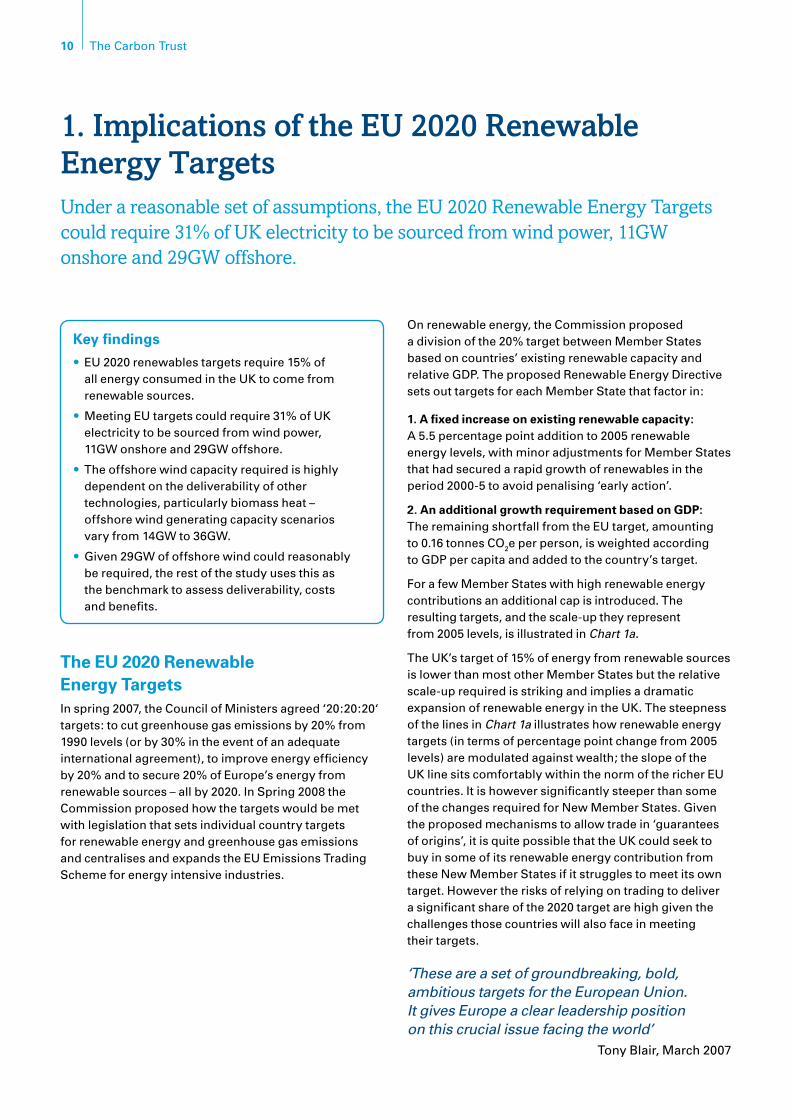
Under a reasonable set of assumptions, the EU 2020 Renewable Energy Targets could require 31% of UK electricity to be sourced from wind power, 11GW onshore and 29GW offshore.
1. Implications of the EU 2020 Renewable Energy Targets
On renewable energy, the Commission proposed a division of the 20% target between Member States based on countries’ existing renewable capacity and relative GDP. The proposed Renewable Energy Directive sets out targets for each Member State that factor in:
1. A fixed increase on existing renewable capacity: A 5.5 percentage point addition to 2005 renewable energy levels, with minor adjustments for Member States that had secured a rapid growth of renewables in the period 2000-5 to avoid penalising ‘early action’.
2. An additional growth requirement based on GDP: The remaining shortfall from the EU target, amounting to 0.16 tonnes CO2e per person, is weighted according to GDP per capita and added to the country’s target.
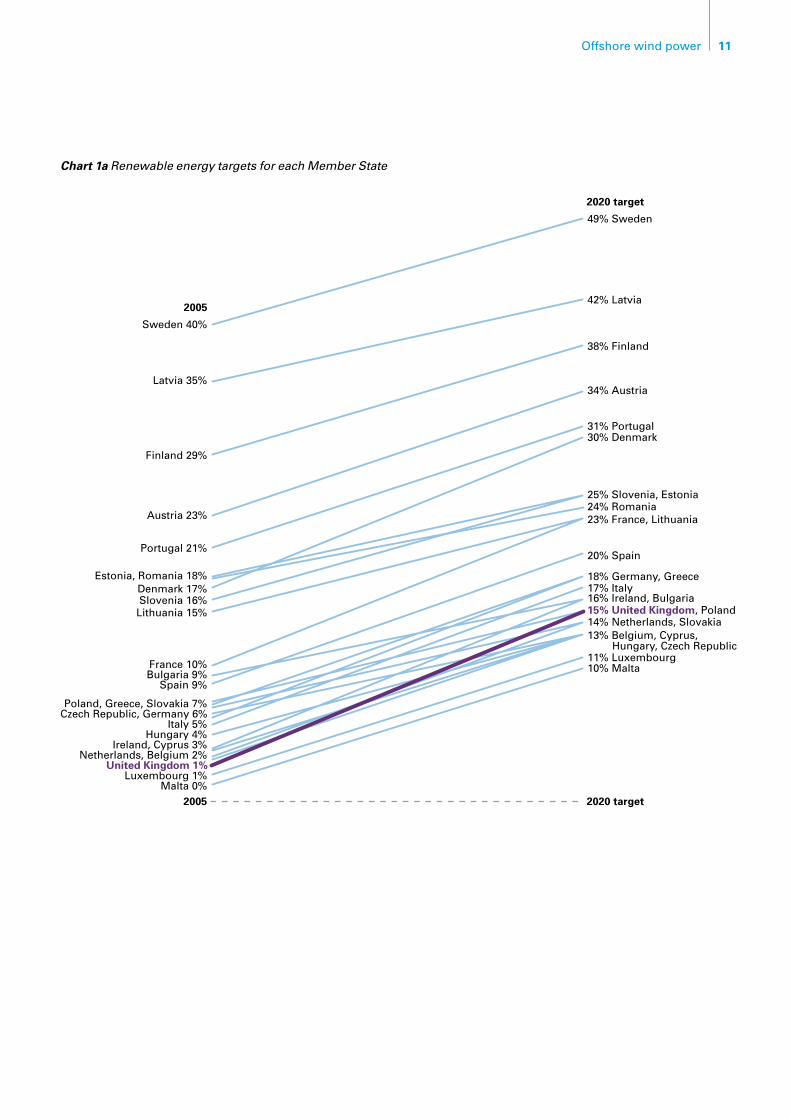
For a few Member States with high renewable energy contributions an additional cap is introduced. The resulting targets, and the scale-up they represent from 2005 levels, is illustrated in Chart 1a.
The UK’s target of 15% of energy from renewable sources is lower than most other Member States but the relative scale-up required is striking and implies a dramatic expansion of renewable energy in the UK. The steepness of the lines in Chart 1a illustrates how renewable energy targets (in terms of percentage point change from 2005 levels) are modulated against wealth; the slope of the UK line sits comfortably within the norm of the richer EU countries. It is however significantly steeper than some of the changes required for New Member States. Given the proposed mechanisms to allow trade in ‘guarantees of origins’, it is quite possible that the UK could seek to buy in some of its renewable energy contribution from these New Member States if it struggles to meet its own target.Howevertherisksofrelyingontradingtodelivera significant share of the 2020 target are high given the challenges those countries will also face in meeting their targets.
‘These are a set of groundbreaking, bold, ambitious targets for the European Union. It gives Europe a clear leadership position on this crucial issue facing the world’
Tony Blair, March 2007
The EU 2020 Renewable Energy TargetsIn spring 2007, the Council of Ministers agreed ‘20:20:20‘ targets: to cut greenhouse gas emissions by 20% from 1990 levels (or by 30% in the event of an adequate international agreement), to improve energy efficiency by 20% and to secure 20% of Europe’s energy from renewable sources – all by 2020. In Spring 2008 the Commission proposed how the targets would be met with legislation that sets individual country targets for renewable energy and greenhouse gas emissions and centralises and expands the EU Emissions Trading Scheme for energy intensive industries.
Key findings
EU 2020 renewables targets require 15% of •all energy consumed in the UK to come from renewable sources.
Meeting EU targets could require 31% of UK •electricity to be sourced from wind power, 11GW onshore and 29GW offshore.
The offshore wind capacity required is highly •dependent on the deliverability of other technologies, particularly biomass heat – offshore wind generating capacity scenarios vary from 14GW to 36GW.
Given 29GW of offshore wind could reasonably •be required, the rest of the study uses this as the benchmark to assess deliverability, costs and benefits.
11Offshore wind power
2005
Sweden 40%
2020 target
2005 2020 target
49% Sweden
42% Latvia
38% Finland
34% Austria
31% Portugal 30% Denmark
25% Slovenia, Estonia24% Romania23% France, Lithuania
20% Spain
18% Germany, Greece17% Italy16% Ireland, Bulgaria15% United Kingdom, Poland14% Netherlands, Slovakia13% Belgium, Cyprus, Hungary, Czech Republic11% Luxembourg10% Malta
Latvia 35%
Finland 29%
Austria 23%
Portugal 21%
Estonia, Romania 18%Denmark 17%Slovenia 16%Lithuania 15%
France 10%Bulgaria 9%
Spain 9%
Poland, Greece, Slovakia 7%Czech Republic, Germany 6%
Italy 5%Hungary 4%
Ireland, Cyprus 3%Netherlands, Belgium 2%
United Kingdom 1%Luxembourg 1%
Malta 0%
Chart 1a Renewable energy targets for each Member State
12 The Carbon Trust
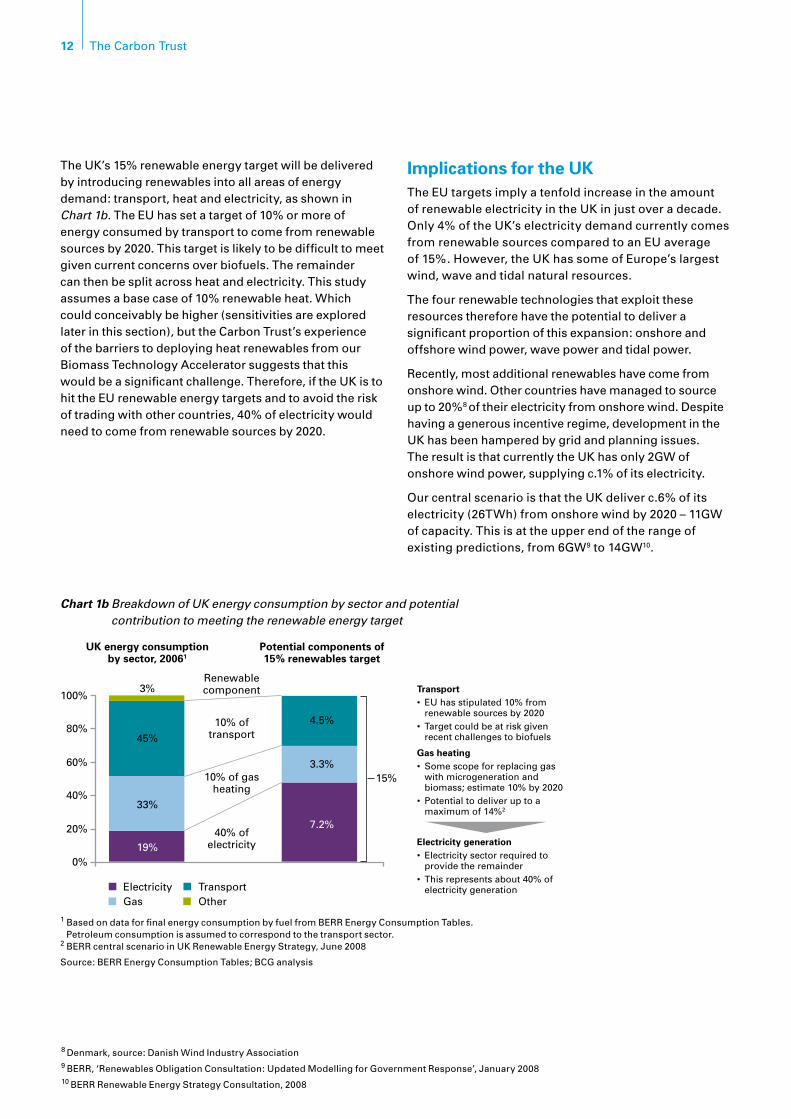
The UK’s 15% renewable energy target will be delivered by introducing renewables into all areas of energy demand: transport, heat and electricity, as shown in Chart 1b. The EU has set a target of 10% or more of energy consumed by transport to come from renewable sources by 2020. This target is likely to be difficult to meet given current concerns over biofuels. The remainder can then be split across heat and electricity. This study assumes a base case of 10% renewable heat. Which could conceivably be higher (sensitivities are explored later in this section), but the Carbon Trust’s experience of the barriers to deploying heat renewables from our Biomass Technology Accelerator suggests that this would be a significant challenge. Therefore, if the UK is to hit the EU renewable energy targets and to avoid the risk of trading with other countries, 40% of electricity would need to come from renewable sources by 2020.
Implications for the UKThe EU targets imply a tenfold increase in the amount of renewable electricity in the UK in just over a decade. Only 4% of the UK’s electricity demand currently comes from renewable sources compared to an EU average of15%.However,theUKhassomeofEurope’slargestwind, wave and tidal natural resources.
The four renewable technologies that exploit these resources therefore have the potential to deliver a significant proportion of this expansion: onshore and offshore wind power, wave power and tidal power.
Recently, most additional renewables have come from onshore wind. Other countries have managed to source up to 20%8 of their electricity from onshore wind. Despite having a generous incentive regime, development in the UK has been hampered by grid and planning issues. The result is that currently the UK has only 2GW of onshore wind power, supplying c.1% of its electricity.
Our central scenario is that the UK deliver c.6% of its electricity (26TWh) from onshore wind by 2020 – 11GW of capacity. This is at the upper end of the range of existing predictions, from 6GW9 to 14GW10.
8 Denmark, source: Danish Wind Industry Association 9 BERR, ‘Renewables Obligation Consultation: Updated Modelling for Government Response’, January 200810 BERR Renewable Energy Strategy Consultation, 2008
Chart 1b Breakdown of UK energy consumption by sector and potential contribution to meeting the renewable energy target
1 Based on data for final energy consumption by fuel from BERR Energy Consumption Tables. Petroleum consumption is assumed to correspond to the transport sector.
2 BERR central scenario in UK Renewable Energy Strategy, June 2008
Source: BERR Energy Consumption Tables; BCG analysis
100%
80%
60%
40%
20%
0%
Renewablecomponent Transport
• EU has stipulated 10% from renewable sources by 2020• Target could be at risk given recent challenges to biofuels
Gas heating• Some scope for replacing gas with microgeneration and biomass; estimate 10% by 2020• Potential to deliver up to a maximum of 14%2
Electricity generation• Electricity sector required to provide the remainder• This represents about 40% of electricity generation
3%
UK energy consumptionby sector, 20061
33%
19%
45%
4.5%
Potential components of15% renewables target
3.3%
7.2%
15%
40% ofelectricity
10% of gasheating
10% oftransport
ElectricityGas
TransportOther

13Offshore wind power
11GW equates to the total existing capacity (2GW) plus the amount currently in the pipeline: 3GW under construction or consented and a further 6GW in the planning process. The expansion of onshore wind has been constrained by planning permission refusals and long lead times for access to grid connections, particularly in Scotland. It is therefore reasonable to assume that not all projects in the pipeline will be approvedandconstructedby2020.However,newprojects will also continue to enter the pipeline.
The Severn Barrage has the potential to contribute up to 8GW of capacity by 2020 if the scheme is implemented to itsmaximumproposedcapacity.However,thereisahighdegree of uncertainty regarding the appetite for making available the required investment and concerns about the environmental impact of the full barrage, and therefore it has not been included in our central scenario, in line with several other forecasts11. With the assumption that cost and environmental barriers can be overcome by less ambitious projects, we have included the smaller Severn Shoots Barrage proposal (approx. 1GW) plus some additional tidal and wave energy projects in our central 2020 scenario. The total assumed contribution from marine energy by 2020 is 1.5% of total electricity supply (5.5TWh; approx 2GW). Both tidal and wave power are still immature emerging technologies and would be expected to make more significant contributions post 202012.
Outside wind and marine power, the range of other renewable technologies available could contribute up to 7% of electricity supply. A steady increase in electricity production from waste and sewage gas is assumed to more than compensate for a decrease in energy from landfill gas due to the Landfill Gas Directive, resulting in 5% of total supply from these three sources by 2020. Biomass electricity generation is projected to grow, with 2GW of capacity by 2020. Various factors are likely to limit the contribution from biomass technologies, including the availability of feedstock supplies. Generation from hydroelectricity is not expected to increase significantly due to limitations on suitable sites, and is forecast to generate 6TWh or just over 1% of total electricity supply, up from 5TWh in 2007. The future contribution from solar will be limited by the availability of cost-competitive and scalable technology solutions, and in the central scenario contributes just 0.5% of total electricity supply, or 2TWh.
In order for the projected renewable electricity generation target to be met, offshore wind will be required to fill the gap between what can be delivered from all the technologies listed above and the 40% goal. In our central scenario this requires 91TWh of generation, equivalent to 29GW13.
11 The Renewables Advisory Board called the Severn barrage ‘one of the more challenging options‘ to meet the EU target (2020VISION–HowtheUKcanmeetitstargetof15%renewableenergy,April2008).
12 See Carbon Trust publication Future Marine Energy, 200613 At an average load factor of 36.6%, estimated based on forecast mix of near-shore and far-shore sites. Source: BCG
14 The Carbon Trust
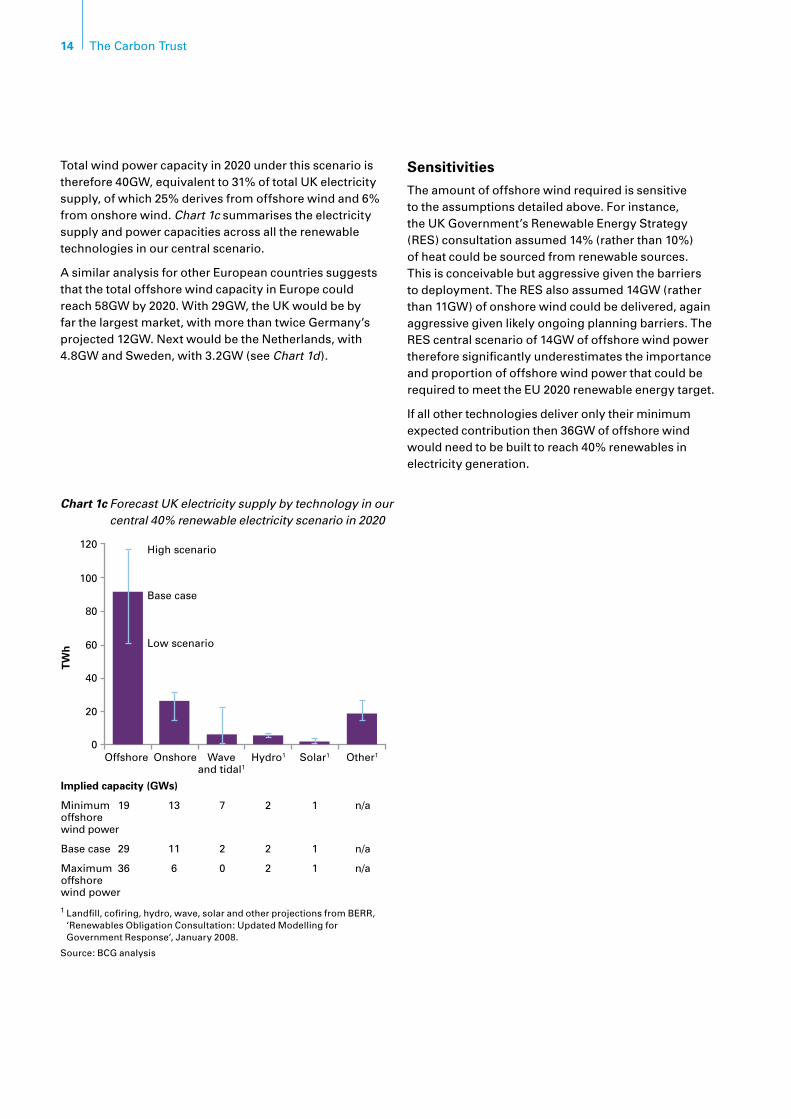
Total wind power capacity in 2020 under this scenario is therefore 40GW, equivalent to 31% of total UK electricity supply, of which 25% derives from offshore wind and 6% from onshore wind. Chart 1c summarises the electricity supply and power capacities across all the renewable technologies in our central scenario.
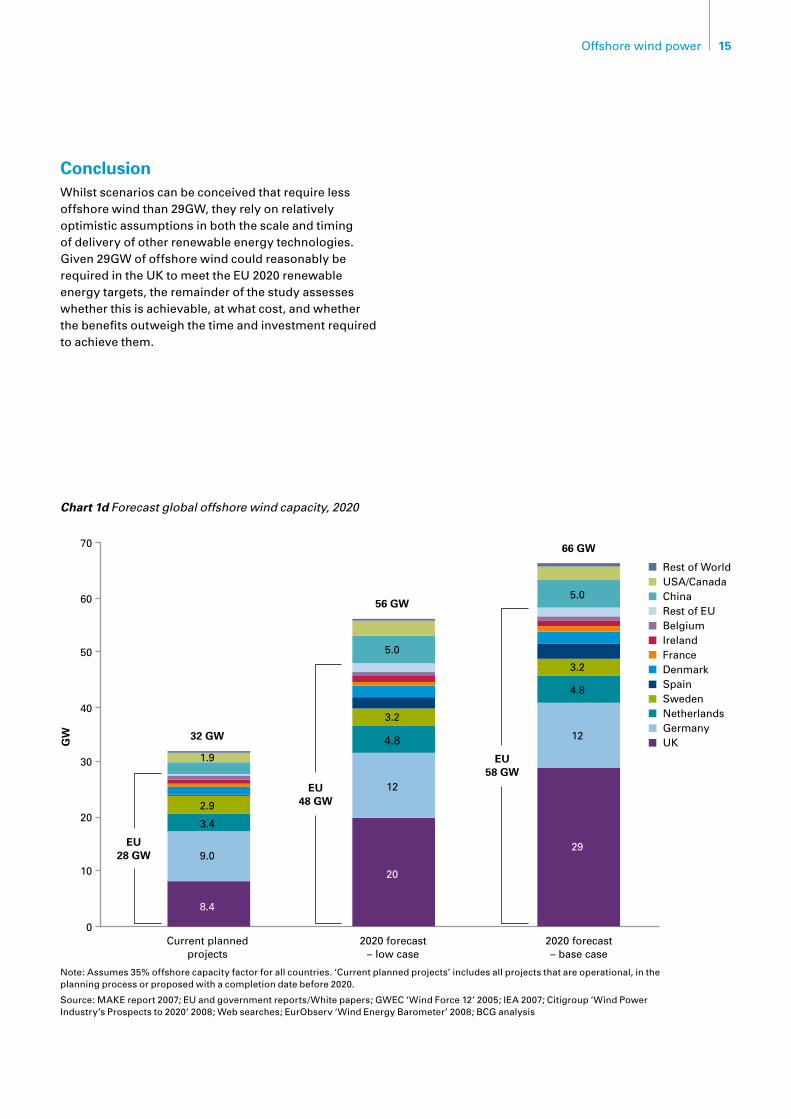
A similar analysis for other European countries suggests that the total offshore wind capacity in Europe could reach 58GW by 2020. With 29GW, the UK would be by far the largest market, with more than twice Germany’s projected 12GW. Next would be the Netherlands, with 4.8GW and Sweden, with 3.2GW (see Chart 1d).
Sensitivities
The amount of offshore wind required is sensitive to the assumptions detailed above. For instance, the UK Government’s Renewable Energy Strategy (RES) consultation assumed 14% (rather than 10%) of heat could be sourced from renewable sources. This is conceivable but aggressive given the barriers to deployment. The RES also assumed 14GW (rather than 11GW) of onshore wind could be delivered, again aggressive given likely ongoing planning barriers. The RES central scenario of 14GW of offshore wind power therefore significantly underestimates the importance and proportion of offshore wind power that could be required to meet the EU 2020 renewable energy target.
If all other technologies deliver only their minimum expected contribution then 36GW of offshore wind would need to be built to reach 40% renewables in electricity generation.
Chart 1c Forecast UK electricity supply by technology in our central 40% renewable electricity scenario in 2020
100
80
120
60
40
20
0
TW
h
Implied capacity (GWs)
Minimum 19 13 7 2 1 n/aoffshore wind power
Base case 29 11 2 2 1 n/a
Maximum 36 6 0 2 1 n/aoffshore wind power
Offshore Onshore
Base case
High scenario
Low scenario
Hydro1 Solar1 Other1Waveand tidal1
1 Landfill, cofiring, hydro, wave, solar and other projections from BERR, ‘Renewables Obligation Consultation: Updated Modelling for Government Response’, January 2008.
Source: BCG analysis
15Offshore wind power
Chart 1d Forecast global offshore wind capacity, 2020
60
50
70
40
30
10
20
0
GW
Current plannedprojects
1.9
32 GW
EU28 GW
EU48 GW
EU58 GW
5.0
56 GW5.0
66 GW
3.2
4.8
12
29
3.2
4.8
12
20
2.9
3.4
9.0
8.4
2020 forecast– low case
2020 forecast– base case
Rest of WorldUSA/CanadaChinaRest of EUBelgiumIrelandFranceDenmarkSpainSwedenNetherlandsGermanyUK
NOTE: THIS IS ALSO 7B
Note: Assumes 35% offshore capacity factor for all countries. ‘Current planned projects’ includes all projects that are operational, in the planning process or proposed with a completion date before 2020.
Source: MAKE report 2007; EU and government reports/White papers; GWEC ‘Wind Force 12’ 2005; IEA 2007; Citigroup ‘Wind Power Industry’s Prospects to 2020’ 2008; Web searches; EurObserv ‘Wind Energy Barometer’ 2008; BCG analysis
ConclusionWhilst scenarios can be conceived that require less offshore wind than 29GW, they rely on relatively optimistic assumptions in both the scale and timing of delivery of other renewable energy technologies. Given 29GW of offshore wind could reasonably be required in the UK to meet the EU 2020 renewable energy targets, the remainder of the study assesses whether this is achievable, at what cost, and whether the benefits outweigh the time and investment required to achieve them.
16 The Carbon Trust
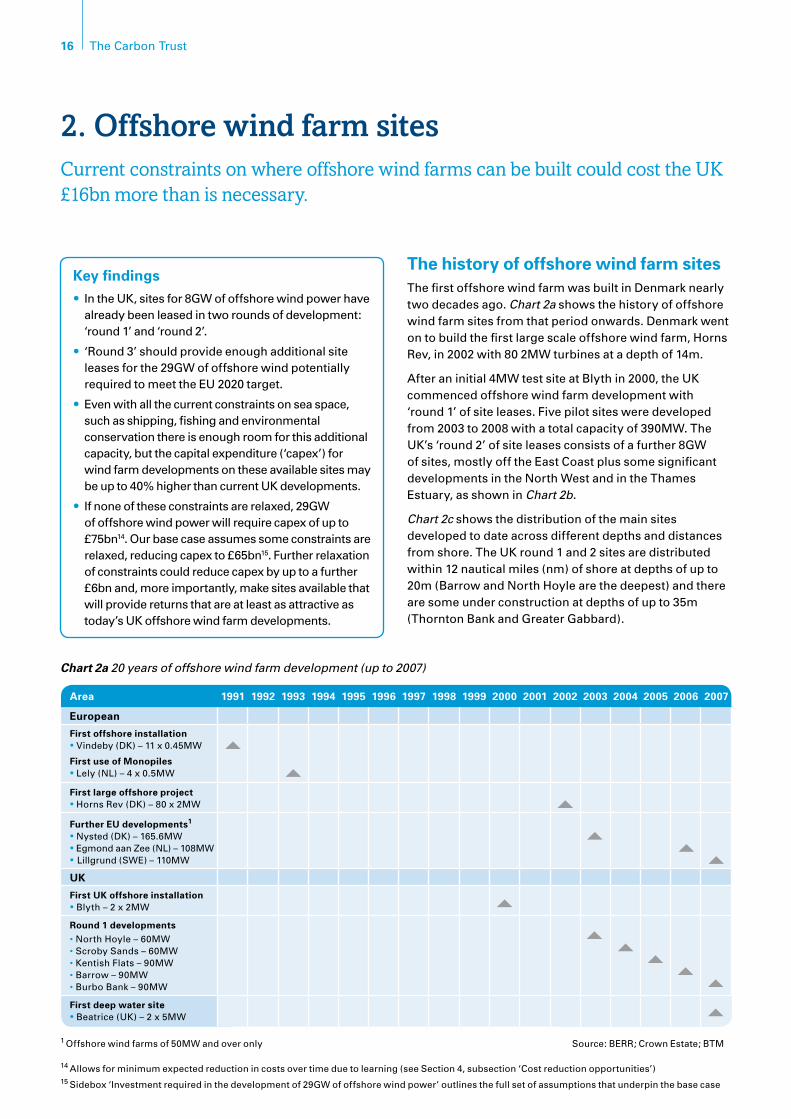
The history of offshore wind farm sitesThe first offshore wind farm was built in Denmark nearly two decades ago. Chart 2a shows the history of offshore wind farm sites from that period onwards. Denmark went ontobuildthefirstlargescaleoffshorewindfarm,HornsRev, in 2002 with 80 2MW turbines at a depth of 14m.
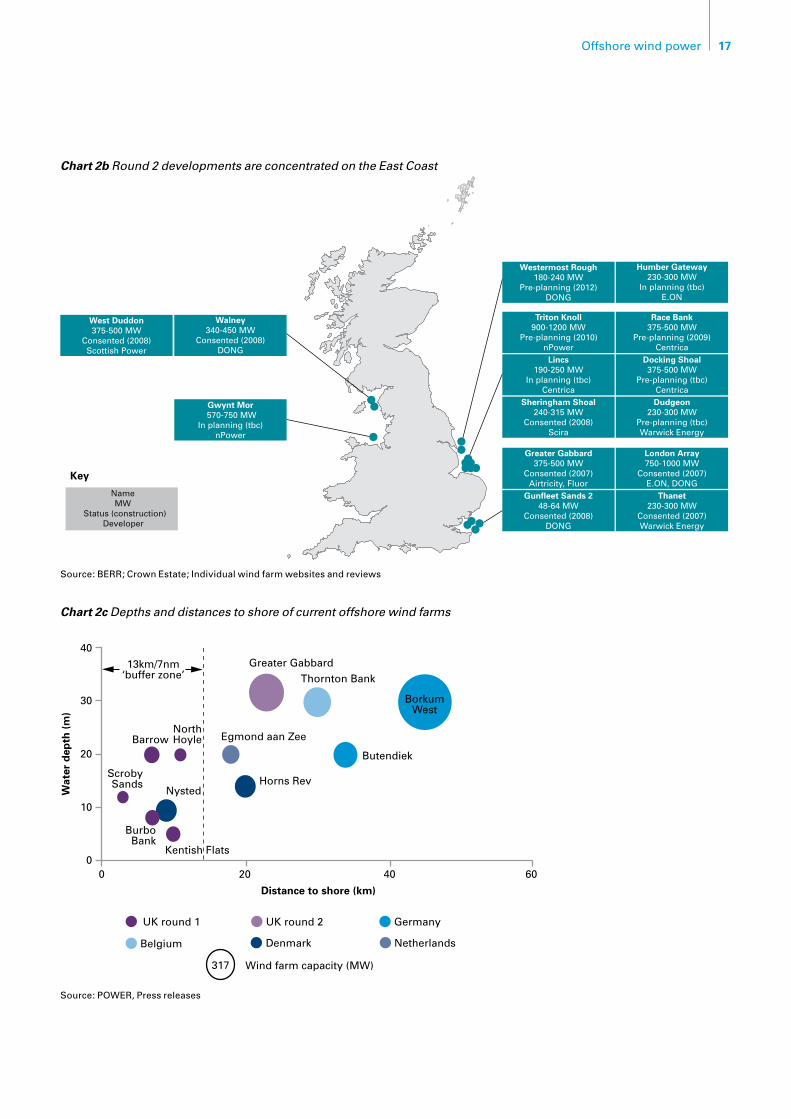
After an initial 4MW test site at Blyth in 2000, the UK commenced offshore wind farm development with ‘round 1’ of site leases. Five pilot sites were developed from 2003 to 2008 with a total capacity of 390MW. The UK’s ‘round 2’ of site leases consists of a further 8GW of sites, mostly off the East Coast plus some significant developments in the North West and in the Thames Estuary, as shown in Chart 2b.
Chart 2c shows the distribution of the main sites developed to date across different depths and distances from shore. The UK round 1 and 2 sites are distributed within 12 nautical miles (nm) of shore at depths of up to 20m(BarrowandNorthHoylearethedeepest)andthereare some under construction at depths of up to 35m (Thornton Bank and Greater Gabbard).
Current constraints on where offshore wind farms can be built could cost the UK £16bn more than is necessary.
2. Offshore wind farm sites
Key findingsIn the UK, sites for 8GW of offshore wind power have •already been leased in two rounds of development: ‘round 1’ and ‘round 2’.
‘Round 3’ should provide enough additional site •leases for the 29GW of offshore wind potentially required to meet the EU 2020 target.
Even with all the current constraints on sea space, •such as shipping, fishing and environmental conservation there is enough room for this additional capacity, but the capital expenditure (‘capex’) for wind farm developments on these available sites may be up to 40% higher than current UK developments.
If none of these constraints are relaxed, 29GW •of offshore wind power will require capex of up to £75bn14. Our base case assumes some constraints are relaxed, reducing capex to £65bn15. Further relaxation of constraints could reduce capex by up to a further £6bn and, more importantly, make sites available that will provide returns that are at least as attractive as today’s UK offshore wind farm developments.
Chart 2a 20 years of offshore wind farm development (up to 2007)
Area 1991 1992 1993 1994 1995 1996 1997 1998 1999 2000 2001 2002 2003 2004 2005 2006 2007
European
First offshore installation• Vindeby (DK) – 11 x 0.45MW
First use of Monopiles • Lely (NL) – 4 x 0.5MW
First large offshore project • HornsRev(DK)–80x2MW
Further EU developments1 • Nysted (DK) – 165.6MW• Egmond aan Zee (NL) – 108MW• Lillgrund (SWE) – 110MW
UK
First UK offshore installation • Blyth – 2 x 2MW
Round 1 developments •NorthHoyle–60MW •Scroby Sands – 60MW •Kentish Flats – 90MW •Barrow – 90MW •Burbo Bank – 90MW
First deep water site • Beatrice (UK) – 2 x 5MW
1 Offshore wind farms of 50MW and over only Source: BERR; Crown Estate; BTM
14 Allows for minimum expected reduction in costs over time due to learning (see Section 4, subsection ‘Cost reduction opportunities’) 15 Sidebox ‘Investment required in the development of 29GW of offshore wind power’ outlines the full set of assumptions that underpin the base case
17Offshore wind power
20
30
UK round 1 UK round 2 Germany
Belgium Denmark
Wind farm capacity (MW)317
Netherlands
40
20
ScrobySands
Barrow
Kentish Flats
NystedHorns Rev
Butendiek
BorkumWest
Thornton Bank13km/7nm
‘buffer zone’
Egmond aan Zee
Greater Gabbard
BurboBank
NorthHoyle
040 60
10
0
Wat
er d
epth
(m
)
Distance to shore (km)
Key
Westermost Rough180-240 MW
Pre-planning (2012)DONG
Triton Knoll900-1200 MW
Pre-planning (2010)nPower
Lincs190-250 MW
In planning (tbc)Centrica
Sheringham Shoal240-315 MW
Consented (2008)Scira
Greater Gabbard375-500 MW
Consented (2007)Airtricity, Fluor
Gunfleet Sands 248-64 MW
Consented (2008)DONG
Humber Gateway230-300 MW
In planning (tbc)E.ON
Race Bank375-500 MW
Pre-planning (2009)Centrica
Docking Shoal375-500 MW
Pre-planning (tbc)CentricaDudgeon
230-300 MWPre-planning (tbc)Warwick Energy
London Array750-1000 MW
Consented (2007)E.ON, DONG
Thanet230-300 MW
Consented (2007)Warwick Energy
West Duddon375-500 MW
Consented (2008)Scottish Power
Walney340-450 MW
Consented (2008)DONG
Gwynt Mor 570-750 MW
In planning (tbc)nPower
NameMW
Status (construction)Developer
Chart 2c Depths and distances to shore of current offshore wind farms
Source: POWER, Press releases
Chart 2b Round 2 developments are concentrated on the East Coast
Source: BERR; Crown Estate; Individual wind farm websites and reviews
18 The Carbon Trust
Round 3 – 25GW of new sitesIn December 2007, the UK Secretary of State for Business, Enterprise&RegulatoryReform(BERR),JohnHutton,announced a Strategic Environmental Assessment (SEA) of the UK’s marine estate16 to review whether enough seabed can be made available for a total of 33GW of offshore wind power capacity, more than enough for the 29GW potentially required to meet the EU 2020 renewable energy targets. In June 2008, the Crown Estate announced a ‘round 3’ leasing process to provide the additional 25GW beyond the currently planned rounds 1 and 2 of 8GW.
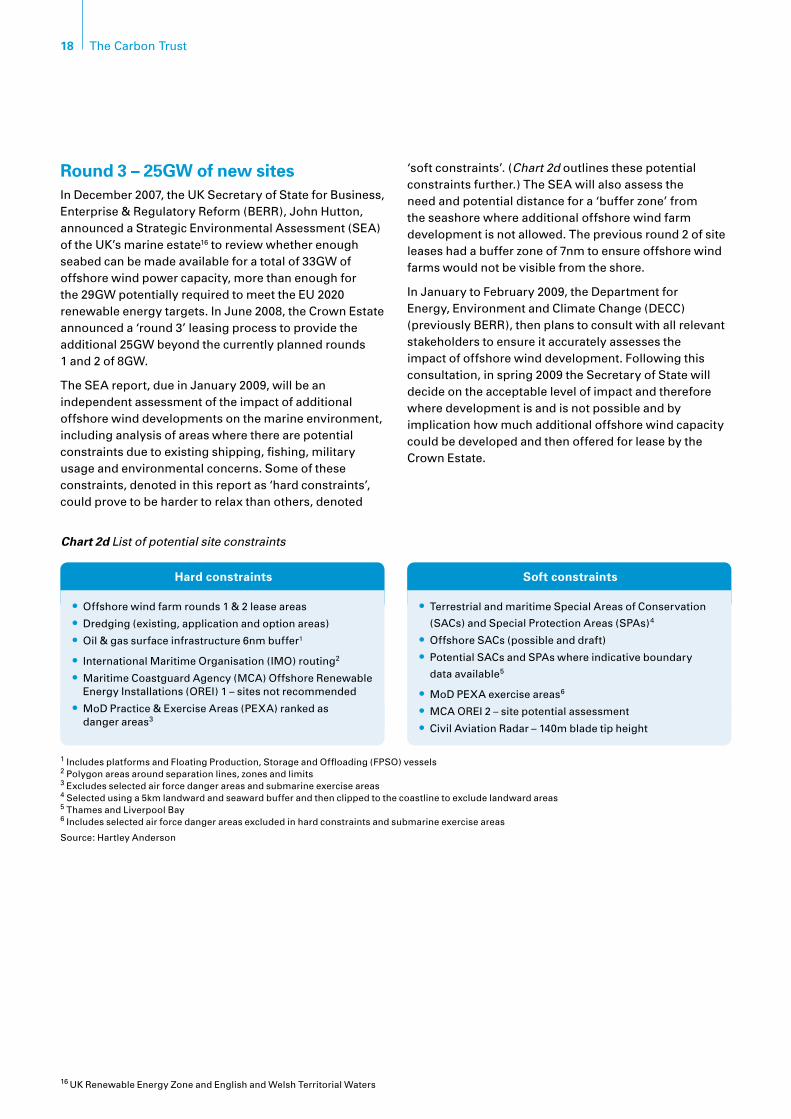
The SEA report, due in January 2009, will be an independent assessment of the impact of additional offshore wind developments on the marine environment, including analysis of areas where there are potential constraints due to existing shipping, fishing, military usage and environmental concerns. Some of these constraints, denoted in this report as ‘hard constraints’, could prove to be harder to relax than others, denoted
‘soft constraints’. (Chart 2d outlines these potential constraints further.) The SEA will also assess the need and potential distance for a ‘buffer zone’ from the seashore where additional offshore wind farm development is not allowed. The previous round 2 of site leases had a buffer zone of 7nm to ensure offshore wind farms would not be visible from the shore.
In January to February 2009, the Department for Energy, Environment and Climate Change (DECC) (previously BERR), then plans to consult with all relevant stakeholders to ensure it accurately assesses the impact of offshore wind development. Following this consultation, in spring 2009 the Secretary of State will decide on the acceptable level of impact and therefore where development is and is not possible and by implication how much additional offshore wind capacity could be developed and then offered for lease by the Crown Estate.
Chart 2d List of potential site constraints
Hard constraints
Offshore wind farm rounds 1 & 2 lease areas• Dredging (existing, application and option areas)•Oil & gas surface infrastructure 6nm buffer• 1
International Maritime Organisation (IMO) routing• 2
Maritime Coastguard Agency (MCA) Offshore Renewable •Energy Installations (OREI) 1 – sites not recommended
MoD Practice & Exercise Areas (PEXA) ranked as •danger areas3
Soft constraints
Terrestrial and maritime Special Areas of Conservation •(SACs) and Special Protection Areas (SPAs)4
Offshore SACs (possible and draft)• Potential SACs and SPAs where indicative boundary •data available5
MoD PEXA exercise areas• 6
MCA OREI 2 – site potential assessment•Civil Aviation Radar – 140m blade tip height•
1 Includes platforms and Floating Production, Storage and Offloading (FPSO) vessels 2 Polygon areas around separation lines, zones and limits3 Excludes selected air force danger areas and submarine exercise areas 4 Selected using a 5km landward and seaward buffer and then clipped to the coastline to exclude landward areas 5 Thames and Liverpool Bay 6 Includes selected air force danger areas excluded in hard constraints and submarine exercise areas
Source:HartleyAnderson
16 UK Renewable Energy Zone and English and Welsh Territorial Waters
19Offshore wind power
Location, location, location – why it’s crucial for offshore wind farmsAll the additional 21GW of offshore wind farms required to get to 29GW of installed offshore wind capacity could fit within an area of sea floor equivalent to the county of Somerset (4,200km2), representing just 0.5% of total UK sea floor17, or just under 2.5% of all sea floor at a water depth of 60m or less.
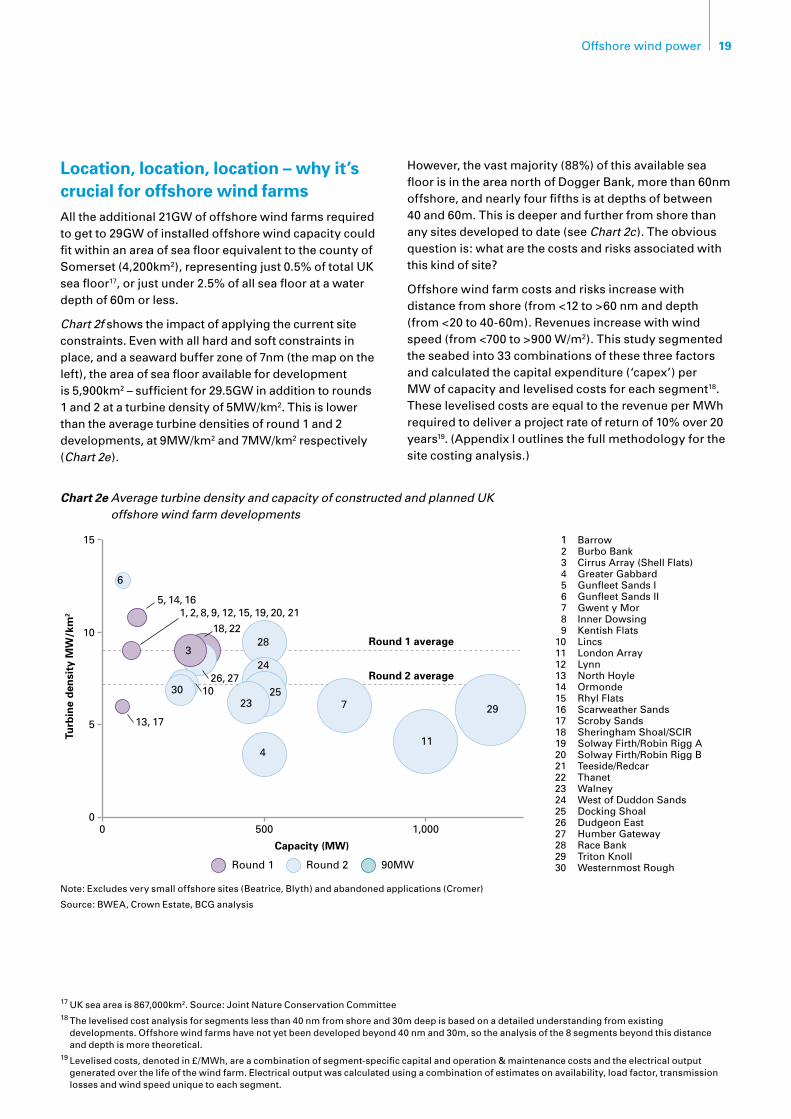
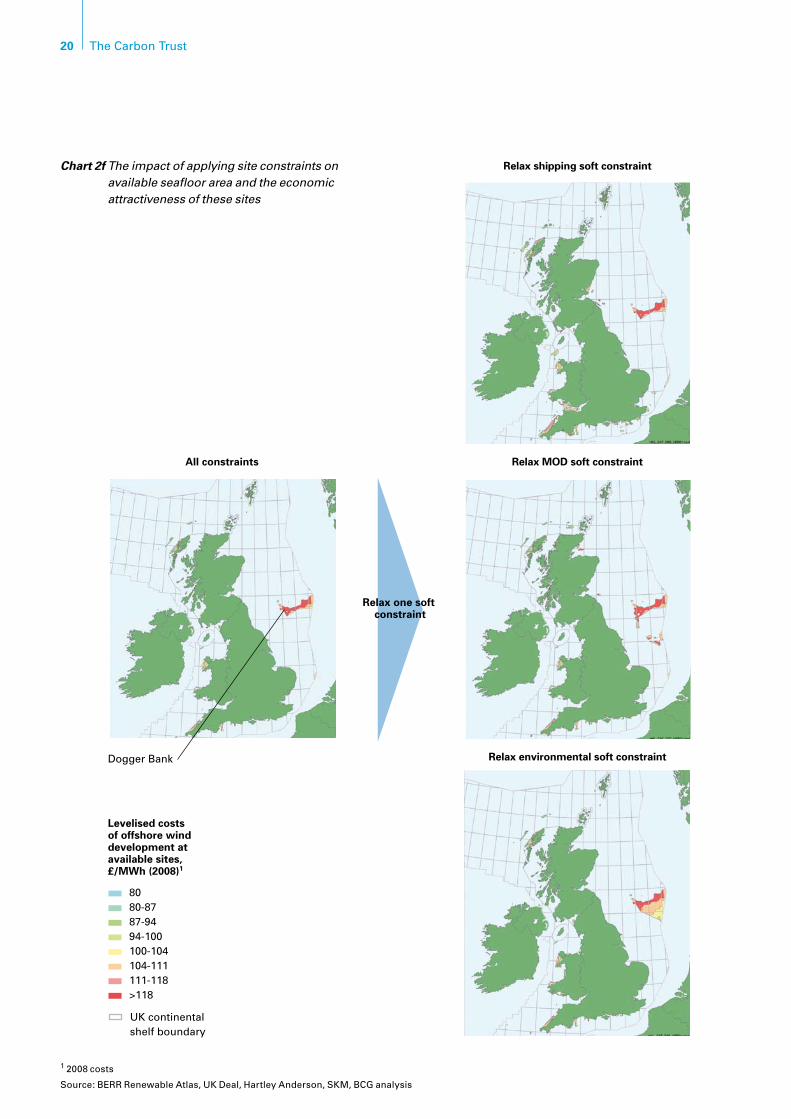
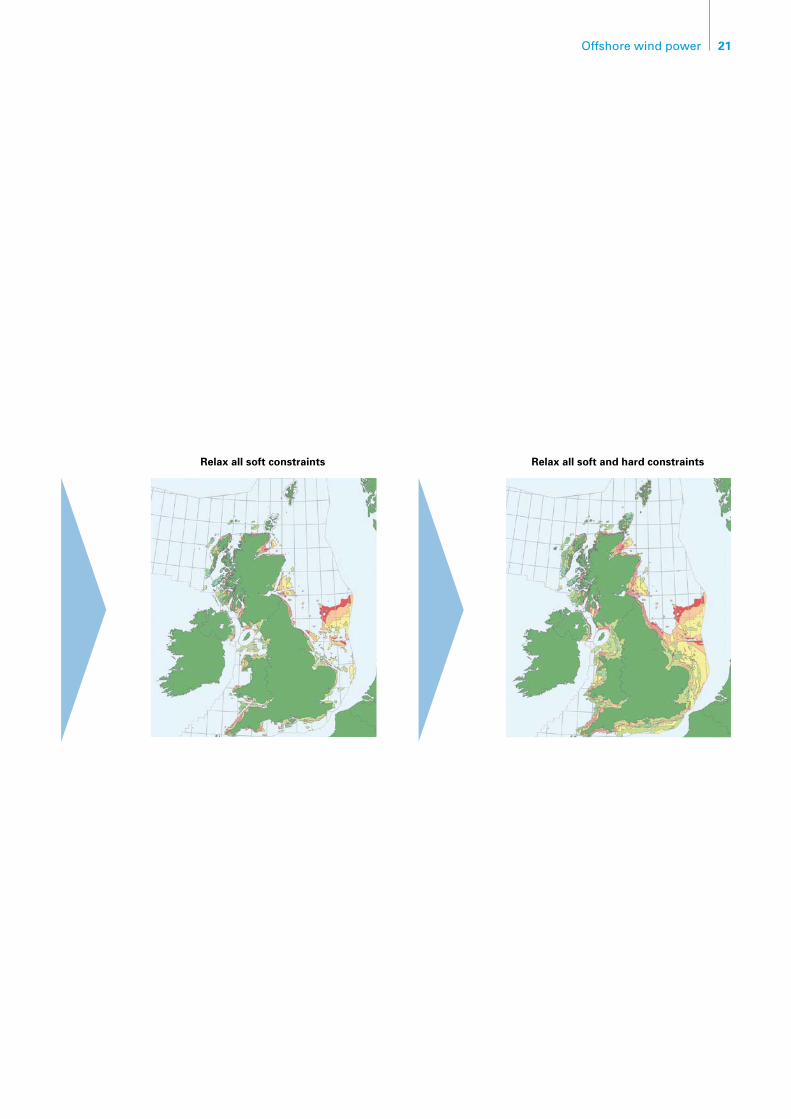
Chart 2f shows the impact of applying the current site constraints. Even with all hard and soft constraints in place, and a seaward buffer zone of 7nm (the map on the left), the area of sea floor available for development is 5,900km2 – sufficient for 29.5GW in addition to rounds 1 and 2 at a turbine density of 5MW/km2. This is lower than the average turbine densities of round 1 and 2 developments, at 9MW/km2 and 7MW/km2 respectively (Chart 2e).
However,thevastmajority(88%)ofthisavailableseafloor is in the area north of Dogger Bank, more than 60nm offshore, and nearly four fifths is at depths of between 40 and 60m. This is deeper and further from shore than any sites developed to date (see Chart 2c). The obvious question is: what are the costs and risks associated with this kind of site?
Offshore wind farm costs and risks increase with distance from shore (from <12 to >60 nm and depth (from <20 to 40-60m). Revenues increase with wind speed (from <700 to >900 W/m2). This study segmented the seabed into 33 combinations of these three factors and calculated the capital expenditure (‘capex’) per MW of capacity and levelised costs for each segment18. These levelised costs are equal to the revenue per MWh required to deliver a project rate of return of 10% over 20 years19. (Appendix I outlines the full methodology for the site costing analysis.)
17 UK sea area is 867,000km2. Source: Joint Nature Conservation Committee18 The levelised cost analysis for segments less than 40 nm from shore and 30m deep is based on a detailed understanding from existing
developments. Offshore wind farms have not yet been developed beyond 40 nm and 30m, so the analysis of the 8 segments beyond this distance and depth is more theoretical.
19 Levelised costs, denoted in £/MWh, are a combination of segment-specific capital and operation & maintenance costs and the electrical output generated over the life of the wind farm. Electrical output was calculated using a combination of estimates on availability, load factor, transmission losses and wind speed unique to each segment.
Chart 2e Average turbine density and capacity of constructed and planned UK offshore wind farm developments
15
10
5
00 500
Round 1 Round 2 90MW
6
5, 14, 161, 2, 8, 9, 12, 15, 19, 20, 21
13, 17
3
30
28
24
2523
4
7
11
29
1,000
Capacity (MW)
Round 1 average
Round 2 average
10.1
Turb
ine
den
sity
MW
/km
2
1 Barrow 2 Burbo Bank 3 Cirrus Array (Shell Flats) 4 Greater Gabbard 5 Gunfleet Sands I 6 Gunfleet Sands II 7 Gwent y Mor 8 Inner Dowsing 9 Kentish Flats10 Lincs11 London Array12 Lynn13 North Hoyle14 Ormonde15 Rhyl Flats16 Scarweather Sands17 Scroby Sands18 Sheringham Shoal/SCIR19 Solway Firth/Robin Rigg A20 Solway Firth/Robin Rigg B21 Teeside/Redcar22 Thanet23 Walney24 West of Duddon Sands25 Docking Shoal26 Dudgeon East27 Humber Gateway28 Race Bank29 Triton Knoll30 Westernmost Rough
18, 22
26, 2710
Note: Excludes very small offshore sites (Beatrice, Blyth) and abandoned applications (Cromer)
Source: BWEA, Crown Estate, BCG analysis
20 The Carbon Trust
All constraints
Relax shipping soft constraint
Relax MOD soft constraint
Relax environmental soft constraint
Relax all soft and hard constraintsRelax all soft constraints
Relax one soft constraint
Dogger Bank
8080-8787-9494-100100-104104-111111-118>118
UK continentalshelf boundary
Levelised costs of offshore wind development at available sites, £/MWh (2008)1
Chart 2f The impact of applying site constraints on available seafloor area and the economic attractiveness of these sites
1 2008 costs
Source:BERRRenewableAtlas,UKDeal,HartleyAnderson,SKM,BCGanalysis
21Offshore wind power
All constraints
Relax shipping soft constraint
Relax MOD soft constraint
Relax environmental soft constraint
Relax all soft and hard constraintsRelax all soft constraints
Relax one soft constraint
Dogger Bank
8080-8787-9494-100100-104104-111111-118>118
UK continentalshelf boundary
Levelised costs of offshore wind development at available sites, £/MWh (2008)1
22 The Carbon Trust
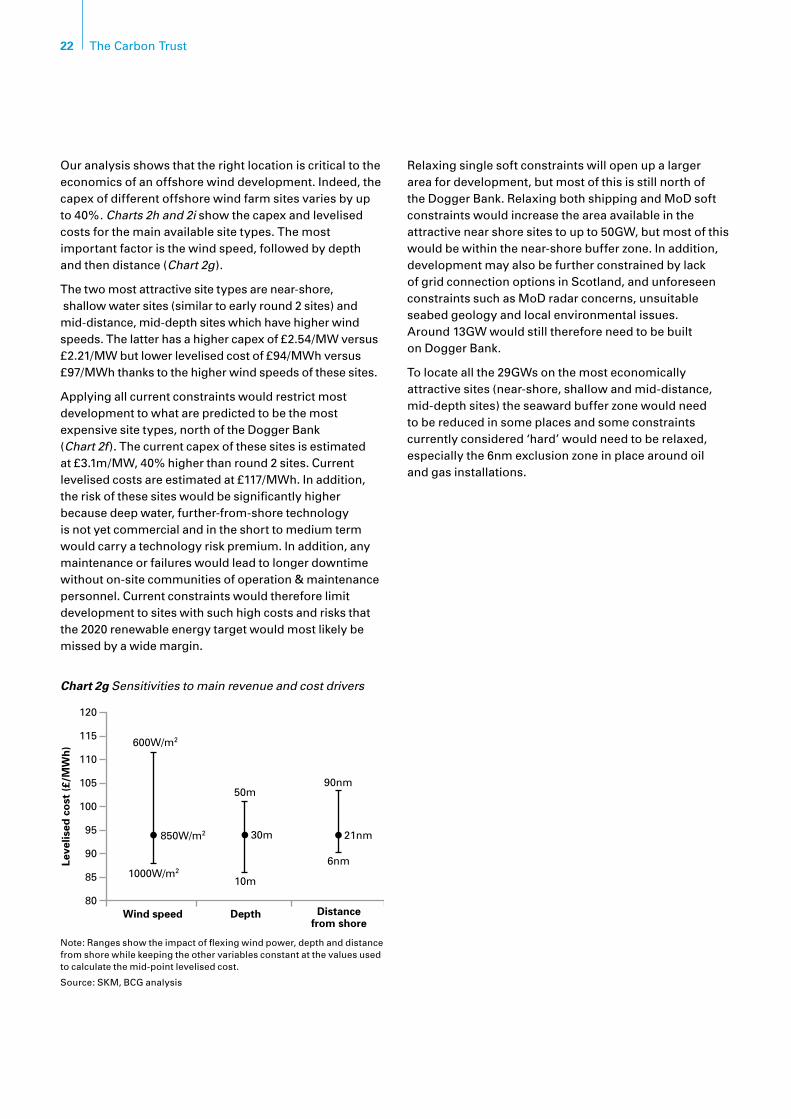
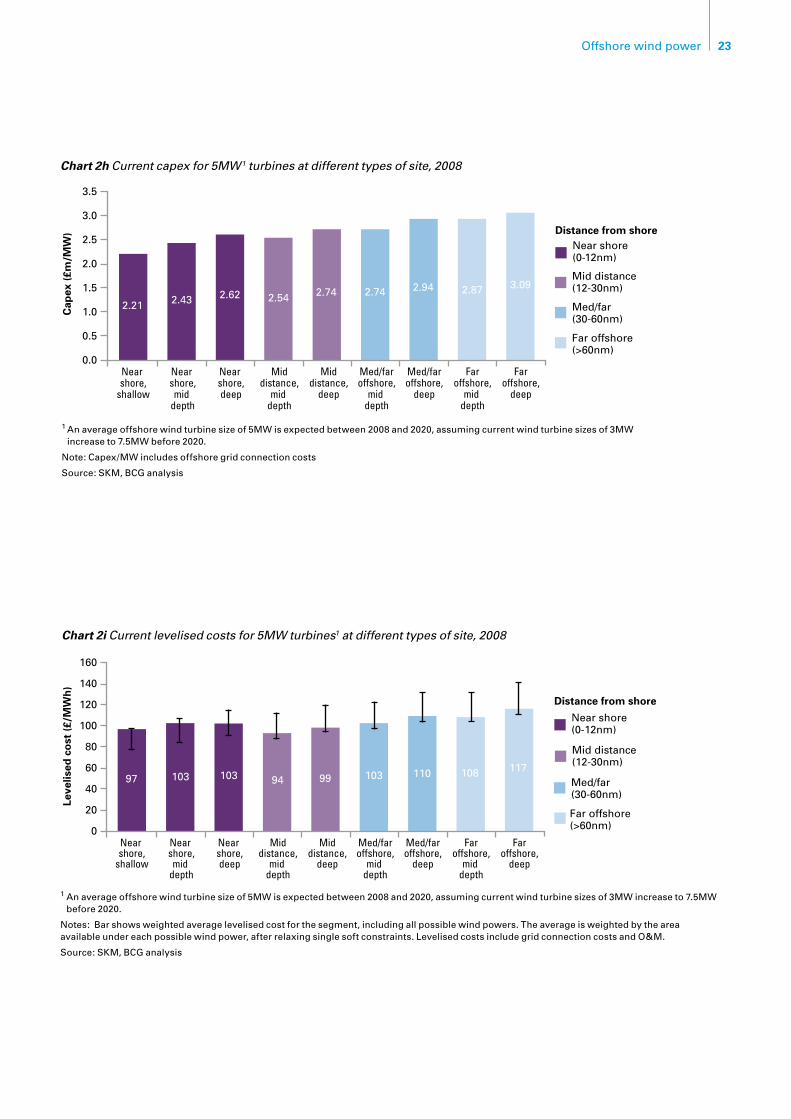
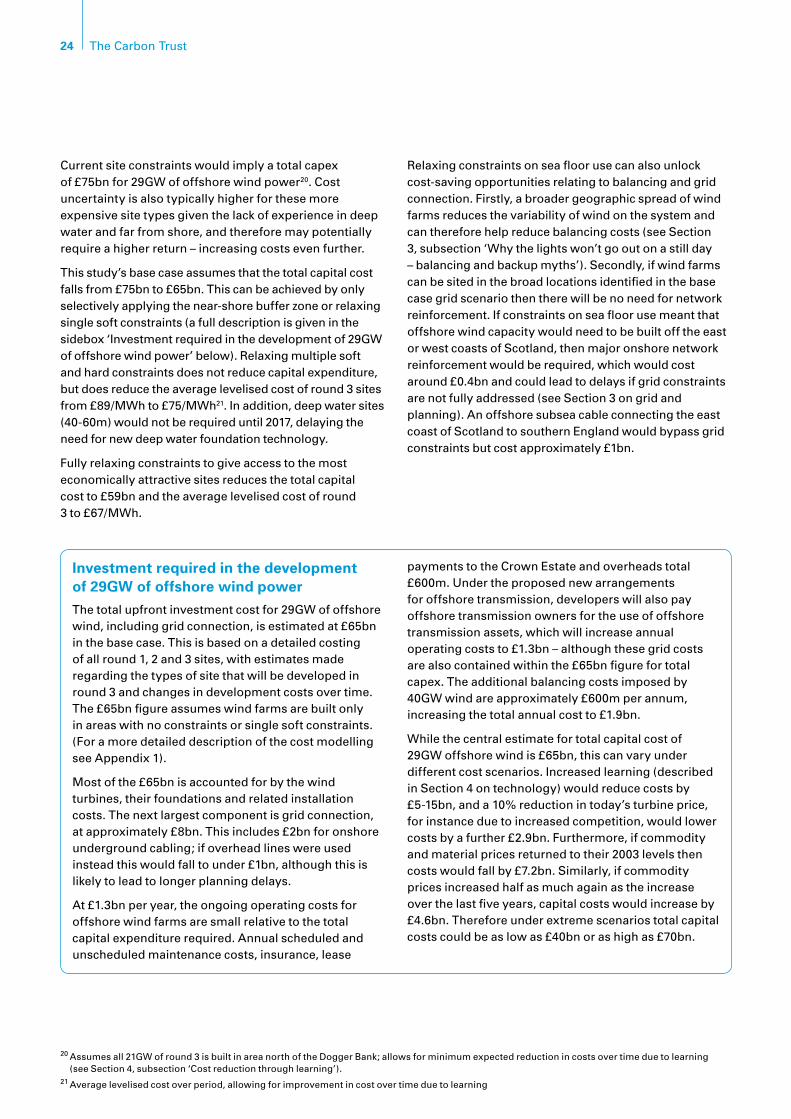
Our analysis shows that the right location is critical to the economics of an offshore wind development. Indeed, the capex of different offshore wind farm sites varies by up to 40%. Charts 2h and 2i show the capex and levelised costs for the main available site types. The most important factor is the wind speed, followed by depth and then distance (Chart 2g).
The two most attractive site types are near-shore, shallow water sites (similar to early round 2 sites) and mid-distance, mid-depth sites which have higher wind speeds. The latter has a higher capex of £2.54/MW versus £2.21/MW but lower levelised cost of £94/MWh versus £97/MWh thanks to the higher wind speeds of these sites.
Applying all current constraints would restrict most development to what are predicted to be the most expensive site types, north of the Dogger Bank (Chart 2f). The current capex of these sites is estimated at £3.1m/MW, 40% higher than round 2 sites. Current levelised costs are estimated at £117/MWh. In addition, the risk of these sites would be significantly higher because deep water, further-from-shore technology is not yet commercial and in the short to medium term would carry a technology risk premium. In addition, any maintenance or failures would lead to longer downtime without on-site communities of operation & maintenance personnel. Current constraints would therefore limit development to sites with such high costs and risks that the 2020 renewable energy target would most likely be missed by a wide margin.
Relaxing single soft constraints will open up a larger area for development, but most of this is still north of the Dogger Bank. Relaxing both shipping and MoD soft constraints would increase the area available in the attractive near shore sites to up to 50GW, but most of this would be within the near-shore buffer zone. In addition, development may also be further constrained by lack of grid connection options in Scotland, and unforeseen constraints such as MoD radar concerns, unsuitable seabed geology and local environmental issues. Around 13GW would still therefore need to be built on Dogger Bank.
To locate all the 29GWs on the most economically attractive sites (near-shore, shallow and mid-distance, mid-depth sites) the seaward buffer zone would need to be reduced in some places and some constraints currently considered ‘hard’ would need to be relaxed, especially the 6nm exclusion zone in place around oil and gas installations.
Chart 2g Sensitivities to main revenue and cost drivers
115
100
105
110
120
600W/m2
50m90nm
6nm
21nm30m
10m
850W/m2
1000W/m285
90
95
80
Leve
lised
co
st (
£/M
Wh
)
Wind speed Depth Distancefrom shore
Note: Ranges show the impact of flexing wind power, depth and distance from shore while keeping the other variables constant at the values used to calculate the mid-point levelised cost.
Source: SKM, BCG analysis
23Offshore wind power
3.0
2.0
2.5
2.21 2.43 2.62 2.54 2.74 2.74 2.94 2.87 3.09
3.5
0.5
1.0
1.5
0.0
Cap
ex (
£m/M
W)
Near shore,
shallow
Near shore,mid
depth
Near shore,deep
Middistance,
mid depth
Middistance,
deep
Med/faroffshore,
mid depth
Med/faroffshore,
deep
Faroffshore,
mid depth
Faroffshore,
deep
Distance from shore
Far offshore(>60nm)
Med/far(30-60nm)
Mid distance(12-30nm)
Near shore(0-12nm)
Chart 2h Current capex for 5MW1 turbines at different types of site, 2008
1 An average offshore wind turbine size of 5MW is expected between 2008 and 2020, assuming current wind turbine sizes of 3MW increase to 7.5MW before 2020.
Note: Capex/MW includes offshore grid connection costs
Source: SKM, BCG analysis
140
100
120
97 103 103 94 99 103 110 108 117
160
20
40
60
80
0
Leve
lised
co
st (
£/M
Wh
)
Near shore,
shallow
Near shore,mid
depth
Near shore,deep
Middistance,
mid depth
Middistance,
deep
Med/faroffshore,
mid depth
Med/faroffshore,
deep
Faroffshore,
mid depth
Faroffshore,
deep
Distance from shore
Far offshore(>60nm)
Med/far(30-60nm)
Mid distance(12-30nm)
Near shore(0-12nm)
Chart 2i Current levelised costs for 5MW turbines1 at different types of site, 2008
1 An average offshore wind turbine size of 5MW is expected between 2008 and 2020, assuming current wind turbine sizes of 3MW increase to 7.5MW before 2020.
Notes: Bar shows weighted average levelised cost for the segment, including all possible wind powers. The average is weighted by the area available under each possible wind power, after relaxing single soft constraints. Levelised costs include grid connection costs and O&M.
Source: SKM, BCG analysis
24 The Carbon Trust
Current site constraints would imply a total capex of £75bn for 29GW of offshore wind power20. Cost uncertainty is also typically higher for these more expensive site types given the lack of experience in deep water and far from shore, and therefore may potentially require a higher return – increasing costs even further.
This study’s base case assumes that the total capital cost falls from £75bn to £65bn. This can be achieved by only selectively applying the near-shore buffer zone or relaxing single soft constraints (a full description is given in the sidebox ‘Investment required in the development of 29GW of offshore wind power’ below). Relaxing multiple soft and hard constraints does not reduce capital expenditure, but does reduce the average levelised cost of round 3 sites from £89/MWh to £75/MWh21. In addition, deep water sites (40-60m) would not be required until 2017, delaying the need for new deep water foundation technology.
Fully relaxing constraints to give access to the most economically attractive sites reduces the total capital cost to £59bn and the average levelised cost of round 3 to £67/MWh.
Relaxing constraints on sea floor use can also unlock cost-saving opportunities relating to balancing and grid connection. Firstly, a broader geographic spread of wind farms reduces the variability of wind on the system and can therefore help reduce balancing costs (see Section 3, subsection ‘Why the lights won’t go out on a still day – balancing and backup myths’). Secondly, if wind farms can be sited in the broad locations identified in the base case grid scenario then there will be no need for network reinforcement. If constraints on sea floor use meant that offshore wind capacity would need to be built off the east or west coasts of Scotland, then major onshore network reinforcement would be required, which would cost around £0.4bn and could lead to delays if grid constraints are not fully addressed (see Section 3 on grid and planning). An offshore subsea cable connecting the east coast of Scotland to southern England would bypass grid constraints but cost approximately £1bn.
20 Assumes all 21GW of round 3 is built in area north of the Dogger Bank; allows for minimum expected reduction in costs over time due to learning (see Section 4, subsection ‘Cost reduction through learning’).
21 Average levelised cost over period, allowing for improvement in cost over time due to learning
Investment required in the development of 29GW of offshore wind power
The total upfront investment cost for 29GW of offshore wind, including grid connection, is estimated at £65bn in the base case. This is based on a detailed costing of all round 1, 2 and 3 sites, with estimates made regarding the types of site that will be developed in round 3 and changes in development costs over time. The £65bn figure assumes wind farms are built only in areas with no constraints or single soft constraints. (For a more detailed description of the cost modelling see Appendix 1).
Most of the £65bn is accounted for by the wind turbines, their foundations and related installation costs. The next largest component is grid connection, at approximately £8bn. This includes £2bn for onshore underground cabling; if overhead lines were used instead this would fall to under £1bn, although this is likely to lead to longer planning delays.
At £1.3bn per year, the ongoing operating costs for offshore wind farms are small relative to the total capital expenditure required. Annual scheduled and unscheduled maintenance costs, insurance, lease
payments to the Crown Estate and overheads total £600m. Under the proposed new arrangements for offshore transmission, developers will also pay offshore transmission owners for the use of offshore transmission assets, which will increase annual operating costs to £1.3bn – although these grid costs are also contained within the £65bn figure for total capex. The additional balancing costs imposed by 40GW wind are approximately £600m per annum, increasing the total annual cost to £1.9bn.
While the central estimate for total capital cost of 29GW offshore wind is £65bn, this can vary under different cost scenarios. Increased learning (described in Section 4 on technology) would reduce costs by £5-15bn, and a 10% reduction in today’s turbine price, for instance due to increased competition, would lower costs by a further £2.9bn. Furthermore, if commodity and material prices returned to their 2003 levels then costs would fall by £7.2bn. Similarly, if commodity prices increased half as much again as the increase over the last five years, capital costs would increase by £4.6bn. Therefore under extreme scenarios total capital costs could be as low as £40bn or as high as £70bn.
25Offshore wind power
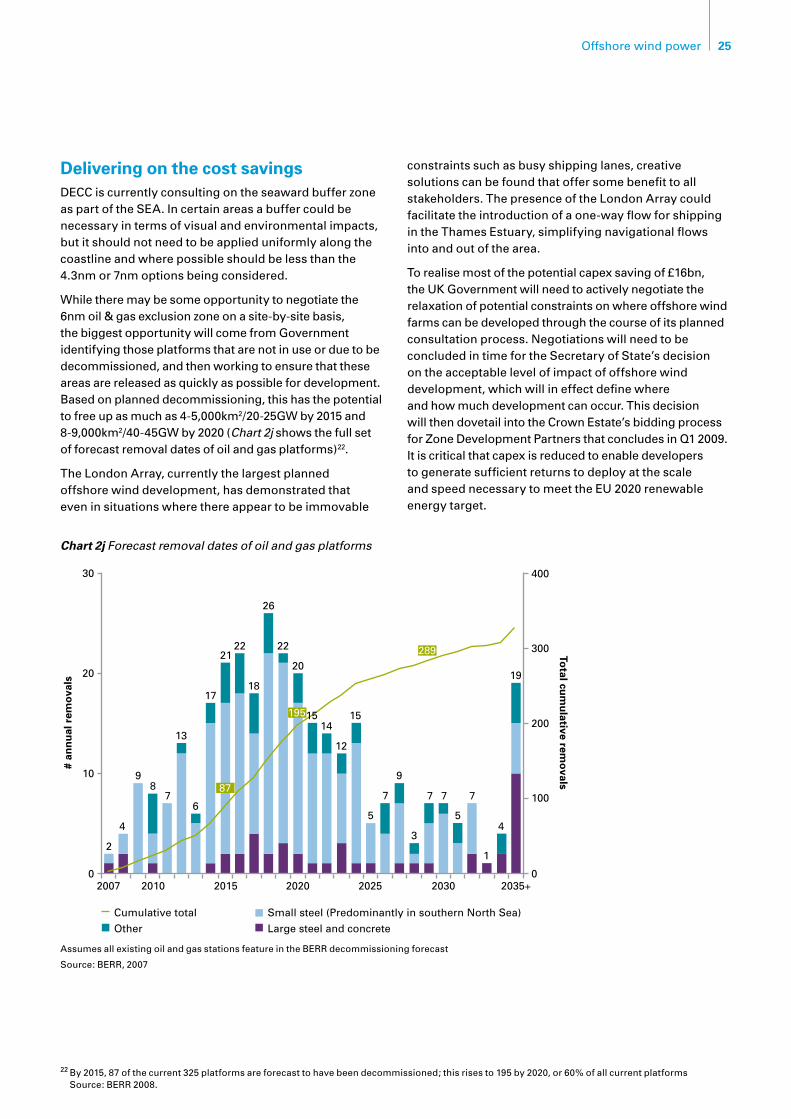
22 By 2015, 87 of the current 325 platforms are forecast to have been decommissioned; this rises to 195 by 2020, or 60% of all current platforms Source: BERR 2008.
Delivering on the cost savingsDECC is currently consulting on the seaward buffer zone as part of the SEA. In certain areas a buffer could be necessary in terms of visual and environmental impacts, but it should not need to be applied uniformly along the coastline and where possible should be less than the 4.3nm or 7nm options being considered.
While there may be some opportunity to negotiate the 6nm oil & gas exclusion zone on a site-by-site basis, the biggest opportunity will come from Government identifying those platforms that are not in use or due to be decommissioned, and then working to ensure that these areas are released as quickly as possible for development. Based on planned decommissioning, this has the potential to free up as much as 4-5,000km2/20-25GW by 2015 and 8-9,000km2/40-45GW by 2020 (Chart 2j shows the full set of forecast removal dates of oil and gas platforms)22.
The London Array, currently the largest planned offshore wind development, has demonstrated that even in situations where there appear to be immovable
constraints such as busy shipping lanes, creative solutions can be found that offer some benefit to all stakeholders. The presence of the London Array could facilitate the introduction of a one-way flow for shipping in the Thames Estuary, simplifying navigational flows into and out of the area.
To realise most of the potential capex saving of £16bn, the UK Government will need to actively negotiate the relaxation of potential constraints on where offshore wind farms can be developed through the course of its planned consultation process. Negotiations will need to be concluded in time for the Secretary of State’s decision on the acceptable level of impact of offshore wind development, which will in effect define where and how much development can occur. This decision will then dovetail into the Crown Estate’s bidding process for Zone Development Partners that concludes in Q1 2009. It is critical that capex is reduced to enable developers to generate sufficient returns to deploy at the scale and speed necessary to meet the EU 2020 renewable energy target.
2015 2020 2025 2030 2035+2010
2
4 4
9 98
7 7 7 7 76
13
17
2122 22
2019
15 15
5
3
1
5
14
12
26
18
2007
20
10
0 0
100
200
300
40030
# an
nu
al r
emo
vals
Total cu
mu
lative remo
vals
Cumulative total
Other
Small steel (Predominantly in southern North Sea)
Large steel and concrete
195
87
289
Chart 2j Forecast removal dates of oil and gas platforms
Assumes all existing oil and gas stations feature in the BERR decommissioning forecast
Source: BERR, 2007
26 The Carbon Trust
IntroductionThe UK’s total electricity capacity is currently 80GW23, so it is not surprising that adding up to 40GW of wind capacity will require significant changes to grid regulations. Improved planning regulations will also be required to enable this new capacity to be delivered with theminimumofdelay.However,thisstudyshowsthatincorporating this amount of additional wind capacity implies neither a security of supply issue nor a significant upgrade to the underlying grid transmission network, if changes are robustly implemented to regulation.
Why the lights won’t go out on a still day – balancing and backup mythsThere is a myth that, because it is not always windy, electricity systems cannot accommodate significant amounts of wind power. This is not the case. Wind power operates in a different way to conventional generation, but 40GW of wind power can be incorporated into the UK’s electricity system without compromising security of supply.
Security of supply is important over both the short- and long-term. Over the long-term, an electricity power system needs sufficient capacity to meet demand reliably, including peak demand periods. In the shorter term, the system needs to ensure that demand and supply are balanced at all times.
The UK electricity system can accommodate 40GW of on- and offshore wind and costs and delays can be minimised, but only if planned regulations are robustly implemented.
3. Grid and planning
Key findings
The lights will not go out – 29GW of offshore and •11GW of onshore wind can be incorporated into the UK’s electricity system without compromising security of supply.
The system will operate with a reduced load factor •of conventional generation and increased need for balancing services increasing the cost of wind power by 8% and 7% respectively.
Significant offshore and onshore connections •to grid access points will be necessary, with a required investment of around £8bn.
Unless grid capacity is shared, reinforcement of •the UK grid transmission network will be required, costing up to £2bn and delaying deployment by up to 5 years.
The Government is therefore correct in proposing •shared grid capacity, but it could face significant resistance from existing generators.
To avoid delays of up to 5 years and enable 29GW •of offshore wind power to be installed by 2020, the UK Government’s proposed planning regulations will also need to be robustly implemented.
23 Including French interconnector; source: SKM
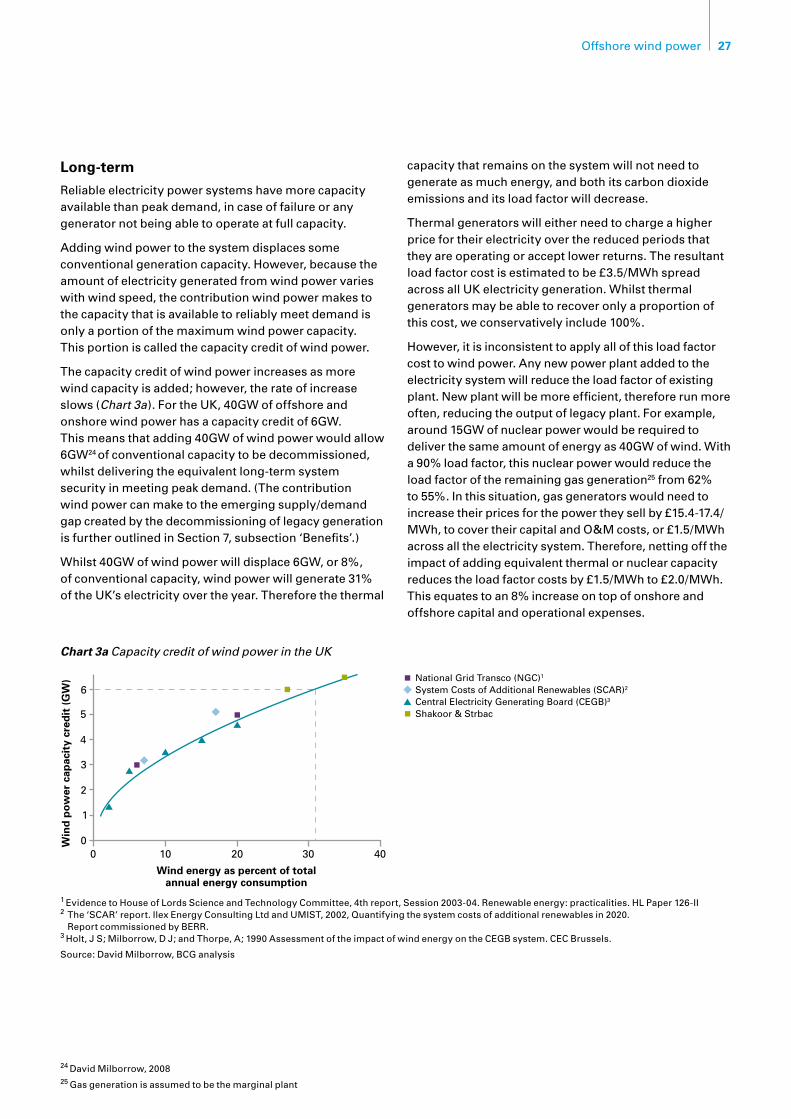
27Offshore wind power
Long-term
Reliable electricity power systems have more capacity available than peak demand, in case of failure or any generator not being able to operate at full capacity.
Adding wind power to the system displaces some conventionalgenerationcapacity.However,becausetheamount of electricity generated from wind power varies with wind speed, the contribution wind power makes to the capacity that is available to reliably meet demand is only a portion of the maximum wind power capacity. This portion is called the capacity credit of wind power.
The capacity credit of wind power increases as more wind capacity is added; however, the rate of increase slows (Chart 3a). For the UK, 40GW of offshore and onshore wind power has a capacity credit of 6GW. This means that adding 40GW of wind power would allow 6GW24 of conventional capacity to be decommissioned, whilst delivering the equivalent long-term system security in meeting peak demand. (The contribution wind power can make to the emerging supply/demand gap created by the decommissioning of legacy generation is further outlined in Section 7, subsection ‘Benefits’.)
Whilst 40GW of wind power will displace 6GW, or 8%, of conventional capacity, wind power will generate 31% of the UK’s electricity over the year. Therefore the thermal
capacity that remains on the system will not need to generate as much energy, and both its carbon dioxide emissions and its load factor will decrease.
Thermal generators will either need to charge a higher price for their electricity over the reduced periods that they are operating or accept lower returns. The resultant load factor cost is estimated to be £3.5/MWh spread across all UK electricity generation. Whilst thermal generators may be able to recover only a proportion of this cost, we conservatively include 100%.
However,itisinconsistenttoapplyallofthisloadfactorcost to wind power. Any new power plant added to the electricity system will reduce the load factor of existing plant. New plant will be more efficient, therefore run more often, reducing the output of legacy plant. For example, around 15GW of nuclear power would be required to deliver the same amount of energy as 40GW of wind. With a 90% load factor, this nuclear power would reduce the load factor of the remaining gas generation25 from 62% to 55%. In this situation, gas generators would need to increase their prices for the power they sell by £15.4-17.4/MWh, to cover their capital and O&M costs, or £1.5/MWh across all the electricity system. Therefore, netting off the impact of adding equivalent thermal or nuclear capacity reduces the load factor costs by £1.5/MWh to £2.0/MWh. This equates to an 8% increase on top of onshore and offshore capital and operational expenses.
1 EvidencetoHouseofLordsScienceandTechnologyCommittee,4threport,Session2003-04.Renewableenergy:practicalities.HLPaper126-II2 The ‘SCAR’ report. Ilex Energy Consulting Ltd and UMIST, 2002, Quantifying the system costs of additional renewables in 2020.
Report commissioned by BERR.3 Holt,JS;Milborrow,DJ;andThorpe,A;1990AssessmentoftheimpactofwindenergyontheCEGBsystem.CECBrussels.
Source: David Milborrow, BCG analysis
Chart 3a Capacity credit of wind power in the UK
5
3
4
6
1
0 10 20 30 40
2
0Win
d p
ow
er c
apac
ity
cred
it (
GW
)
Wind energy as percent of totalannual energy consumption
National Grid Transco (NGC)1
System Costs of Additional Renewables (SCAR)2
Central Electricity Generating Board (CEGB)3
Shakoor & Strbac
24 David Milborrow, 2008 25 Gas generation is assumed to be the marginal plant
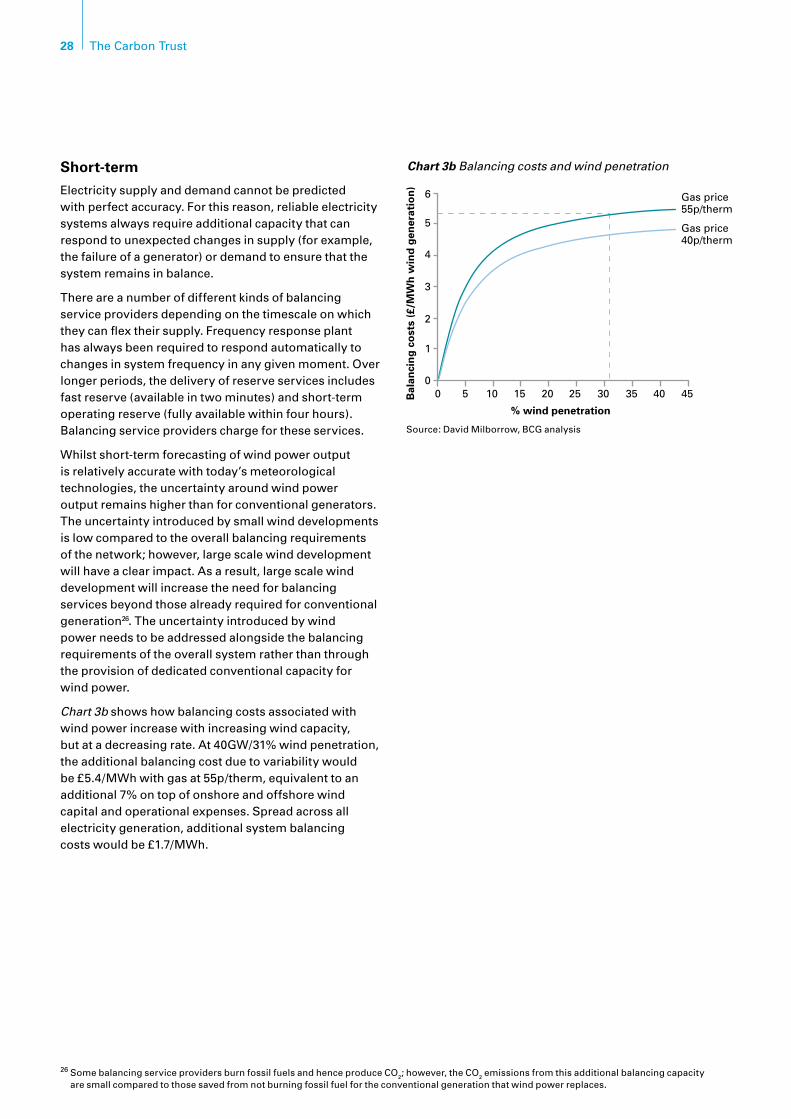
28 The Carbon Trust
Short-term
Electricity supply and demand cannot be predicted with perfect accuracy. For this reason, reliable electricity systems always require additional capacity that can respond to unexpected changes in supply (for example, the failure of a generator) or demand to ensure that the system remains in balance.
There are a number of different kinds of balancing service providers depending on the timescale on which they can flex their supply. Frequency response plant has always been required to respond automatically to changes in system frequency in any given moment. Over longer periods, the delivery of reserve services includes fast reserve (available in two minutes) and short-term operating reserve (fully available within four hours).Balancing service providers charge for these services.
Whilst short-term forecasting of wind power output is relatively accurate with today’s meteorological technologies, the uncertainty around wind power output remains higher than for conventional generators. The uncertainty introduced by small wind developments is low compared to the overall balancing requirements of the network; however, large scale wind development will have a clear impact. As a result, large scale wind development will increase the need for balancing services beyond those already required for conventional generation26. The uncertainty introduced by wind power needs to be addressed alongside the balancing requirements of the overall system rather than through the provision of dedicated conventional capacity for wind power.
Chart 3b shows how balancing costs associated with wind power increase with increasing wind capacity, but at a decreasing rate. At 40GW/31% wind penetration, the additional balancing cost due to variability would be £5.4/MWh with gas at 55p/therm, equivalent to an additional 7% on top of onshore and offshore wind capital and operational expenses. Spread across all electricity generation, additional system balancing costs would be £1.7/MWh.
26 Some balancing service providers burn fossil fuels and hence produce CO2; however, the CO2 emissions from this additional balancing capacity are small compared to those saved from not burning fossil fuel for the conventional generation that wind power replaces.
Source: David Milborrow, BCG analysis
5
3
4
6
1
0 5 10 15
% wind penetration
Gas price55p/therm
Gas price40p/therm
20 25 30 35 40 45
2
0
Bal
anci
ng
co
sts
(£/M
Wh
win
d g
ener
atio
n)
Chart 3b Balancing costs and wind penetration
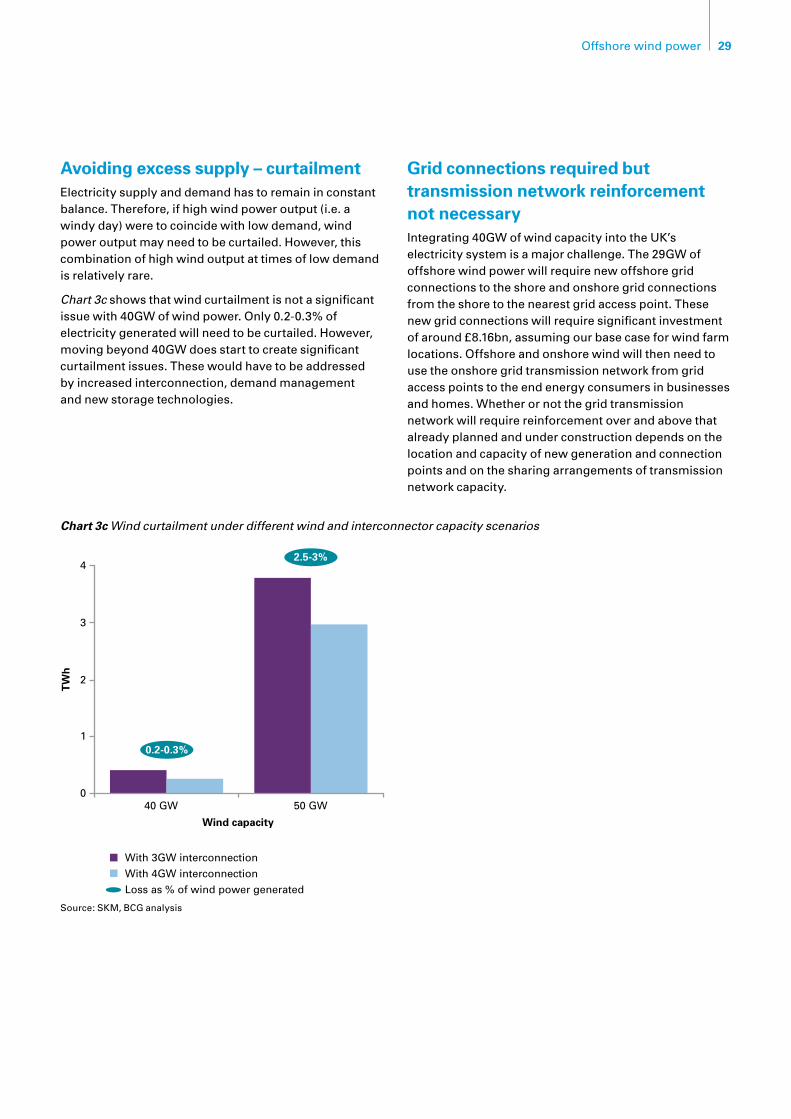
29Offshore wind power
Avoiding excess supply – curtailmentElectricity supply and demand has to remain in constant balance. Therefore, if high wind power output (i.e. a windy day) were to coincide with low demand, wind poweroutputmayneedtobecurtailed.However,thiscombination of high wind output at times of low demand is relatively rare.
Chart 3c shows that wind curtailment is not a significant issue with 40GW of wind power. Only 0.2-0.3% of electricitygeneratedwillneedtobecurtailed.However,moving beyond 40GW does start to create significant curtailment issues. These would have to be addressed by increased interconnection, demand management and new storage technologies.
Grid connections required but transmission network reinforcement not necessaryIntegrating 40GW of wind capacity into the UK’s electricity system is a major challenge. The 29GW of offshore wind power will require new offshore grid connections to the shore and onshore grid connections from the shore to the nearest grid access point. These new grid connections will require significant investment of around £8.16bn, assuming our base case for wind farm locations. Offshore and onshore wind will then need to use the onshore grid transmission network from grid access points to the end energy consumers in businesses and homes. Whether or not the grid transmission network will require reinforcement over and above that already planned and under construction depends on the location and capacity of new generation and connection points and on the sharing arrangements of transmission network capacity.
Chart 3c Wind curtailment under different wind and interconnector capacity scenarios
4
2
3
40 GW
Wind capacity
50 GW
1
0
TW
h
0.2-0.3%
2.5-3%
With 3GW interconnection
With 4GW interconnection
Loss as % of wind power generated
Source: SKM, BCG analysis
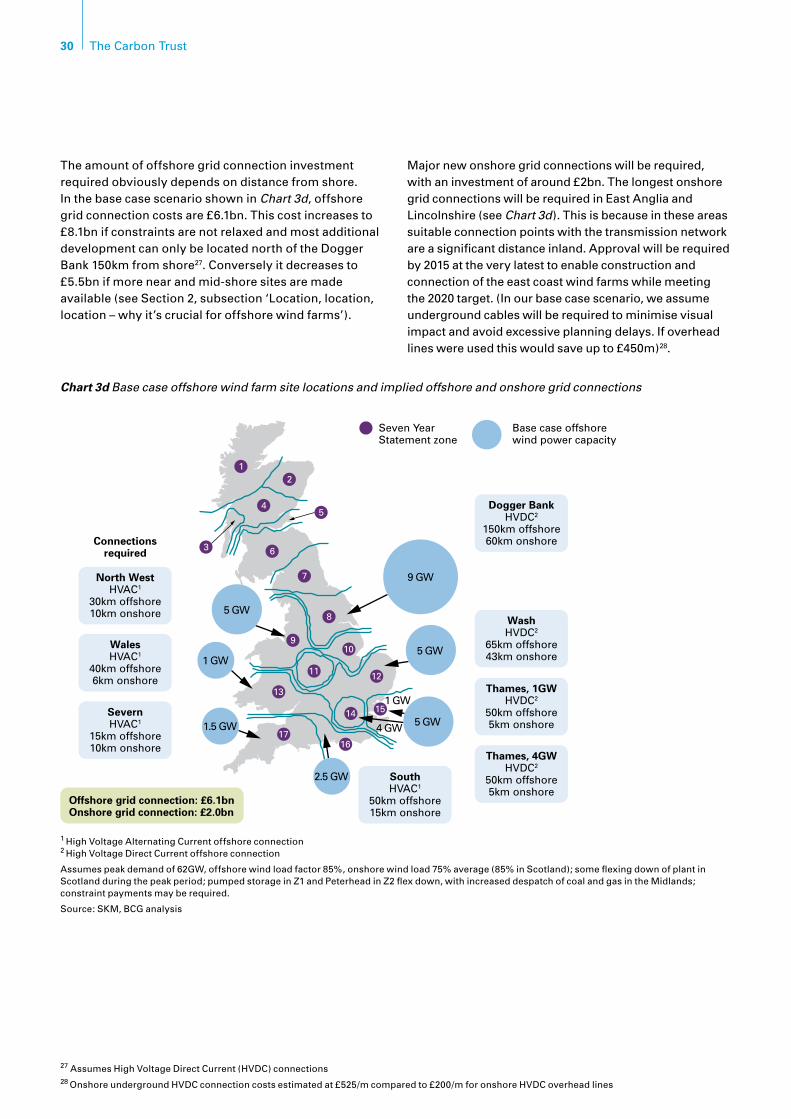
30 The Carbon Trust
The amount of offshore grid connection investment required obviously depends on distance from shore. In the base case scenario shown in Chart 3d, offshore grid connection costs are £6.1bn. This cost increases to £8.1bn if constraints are not relaxed and most additional development can only be located north of the Dogger Bank 150km from shore27. Conversely it decreases to £5.5bn if more near and mid-shore sites are made available (see Section 2, subsection ‘Location, location, location – why it’s crucial for offshore wind farms’).
Major new onshore grid connections will be required, with an investment of around £2bn. The longest onshore grid connections will be required in East Anglia and Lincolnshire (see Chart 3d). This is because in these areas suitable connection points with the transmission network are a significant distance inland. Approval will be required by 2015 at the very latest to enable construction and connection of the east coast wind farms while meeting the 2020 target. (In our base case scenario, we assume underground cables will be required to minimise visual impact and avoid excessive planning delays. If overhead lines were used this would save up to £450m)28.
27AssumesHighVoltageDirectCurrent(HVDC)connections28 OnshoreundergroundHVDCconnectioncostsestimatedat£525/mcomparedto£200/mforonshoreHVDCoverheadlines
5
3 6
7
8
910
12
1514
1716
11
13
4
21
5 GW
1 GW
1.5 GW
2.5 GW
5 GW
1 GW
4 GW
5 GW
9 GW
Connectionsrequired
North WestHVAC1
30km offshore10km onshore
WalesHVAC1
40km offshore6km onshore
SevernHVAC1
15km offshore10km onshore
Dogger BankHVDC2
150km offshore60km onshore
WashHVDC2
65km offshore43km onshore
Thames, 1GWHVDC2
50km offshore5km onshore
Thames, 4GWHVDC2
50km offshore5km onshore
SouthHVAC1
50km offshore15km onshore
Offshore grid connection: £6.1bnOnshore grid connection: £2.0bn
Base case offshore wind power capacity
Seven Year Statement zone
1 HighVoltageAlternatingCurrentoffshoreconnection2 HighVoltageDirectCurrentoffshoreconnection
Assumes peak demand of 62GW, offshore wind load factor 85%, onshore wind load 75% average (85% in Scotland); some flexing down of plant in Scotland during the peak period; pumped storage in Z1 and Peterhead in Z2 flex down, with increased despatch of coal and gas in the Midlands; constraint payments may be required.
Source: SKM, BCG analysis
Chart 3d Base case offshore wind farm site locations and implied offshore and onshore grid connections

31Offshore wind power
Whether or not the onshore grid transmission network will require large scale reinforcement is largely dependent on whether existing generators will share the grid capacity. Modelling a ‘worst case’ transmission scenario for the grid (i.e. peak electricity29 demand and high generation from wind30) and assuming no sharing of grid capacity suggests that the proposed grid in 202031 will not be sufficient. Because of the long lead times involved in transmission network upgrades this means that the 9GW of offshore capacity connecting in Lincolnshire will either not be able to connect by 2020, or else that submarine connections will be required to the south of England at an additional cost of up to £2bn.
With grid capacity sharing there would be no need to reinforce the existing onshore transmission network. This assumes that offshore wind farms are built in locations around the shores of England and Wales broadly in line with the amount of sea floor available and that none are built off the Scottish coast. Scotland has offshore wind farm sites that are economically attractive, so if grid reinforcement issues are addressed, these should be utilised. But in our base case we assume that upgrades to the Scottish transmission network are prioritised for the significant additional onshore wind capacity that will likely be required in Scotland.
Implementing grid regulation reform to minimise costs and delaysSharing of grid capacity by generators will avoid upgrade costs of up to £2bn and reduce the risk of missing the EU renewable energy targets by up to 5 years.
The current rules defining how generators secure access to the transmission network, and the method for determining grid investment requirements, evolved before the connection of large amounts of variable capacity was a realistic possibility. These rules now need to be modified to reflect the increasing levels of wind generation that will be added to the UK network.
29 Modelled based on actual historical patterns of demand across UK30 85% offshore wind load factor, average 75% onshore wind load factor with 85% in Scotland31 As described in National Grid’s 2007 Seven Year Statement
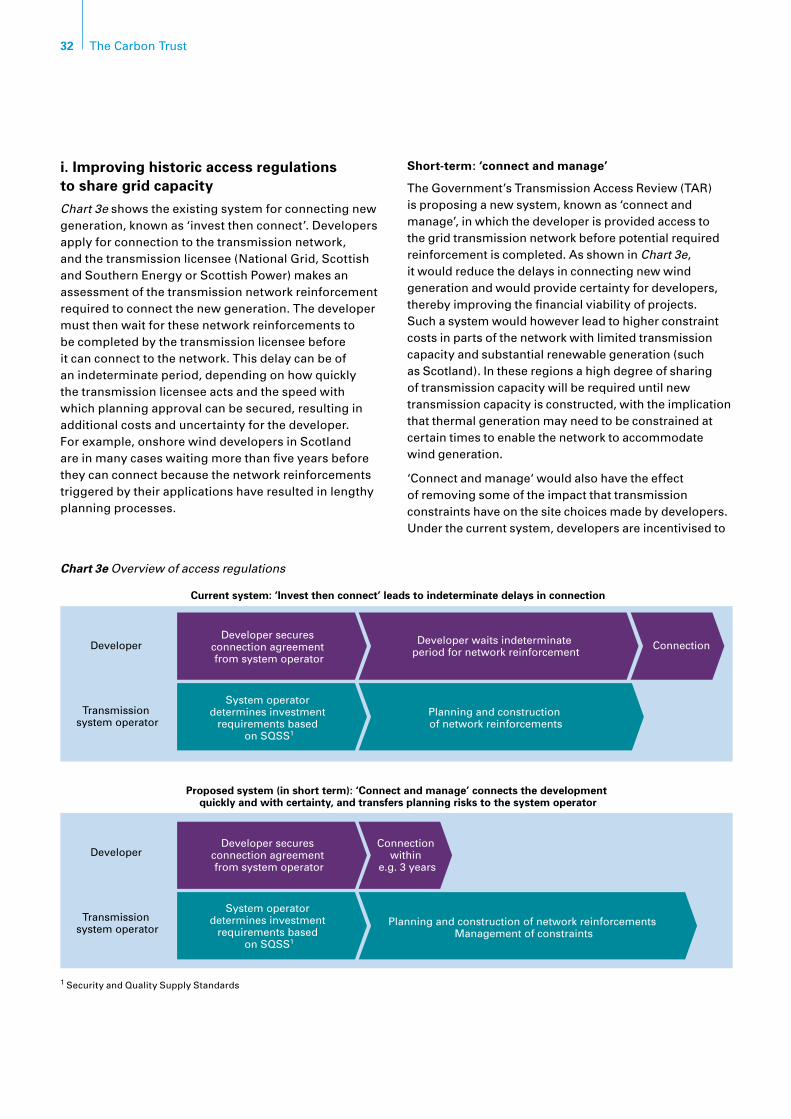
32 The Carbon Trust
i. Improving historic access regulations to share grid capacity
Chart 3e shows the existing system for connecting new generation, known as ‘invest then connect’. Developers apply for connection to the transmission network, and the transmission licensee (National Grid, Scottish and Southern Energy or Scottish Power) makes an assessment of the transmission network reinforcement required to connect the new generation. The developer must then wait for these network reinforcements to be completed by the transmission licensee before it can connect to the network. This delay can be of an indeterminate period, depending on how quickly the transmission licensee acts and the speed with which planning approval can be secured, resulting in additional costs and uncertainty for the developer. For example, onshore wind developers in Scotland are in many cases waiting more than five years before they can connect because the network reinforcements triggered by their applications have resulted in lengthy planning processes.
Short-term: ‘connect and manage’
The Government’s Transmission Access Review (TAR) is proposing a new system, known as ‘connect and manage’, in which the developer is provided access to the grid transmission network before potential required reinforcement is completed. As shown in Chart 3e, it would reduce the delays in connecting new wind generation and would provide certainty for developers, thereby improving the financial viability of projects. Such a system would however lead to higher constraint costs in parts of the network with limited transmission capacity and substantial renewable generation (such as Scotland). In these regions a high degree of sharing of transmission capacity will be required until new transmission capacity is constructed, with the implication that thermal generation may need to be constrained at certain times to enable the network to accommodate wind generation.
‘Connect and manage‘ would also have the effect of removing some of the impact that transmission constraints have on the site choices made by developers. Under the current system, developers are incentivised to
Chart 3e Overview of access regulations
Current system: ‘Invest then connect’ leads to indeterminate delays in connection
Proposed system (in short term): ‘Connect and manage’ connects the development quickly and with certainty, and transfers planning risks to the system operator
DeveloperDeveloper secures
connection agreement from system operator
Developer waits indeterminate period for network reinforcement
System operator determines investment
requirements based on SQSS1
Developer secures connection agreement from system operator
Connection within
e.g. 3 years
System operator determines investment
requirements based on SQSS1
Planning and construction of network reinforcements Management of constraints
Planning and construction of network reinforcements
Connection
Transmission system operator
Developer
Transmission system operator
1 Security and Quality Supply Standards
33Offshore wind power
build in regions where grid constraints are low so as to ensure faster grid connection, which may not be the most efficient locations for generation.
Medium term: implement a more efficient form of capacity sharing
Over time ‘connect and manage’ should be augmented or replaced by more efficient methods of allocating transmission capacity, and of assigning the value of this capacity to generators. Two possible options are auctioning of transmission access rights, and secondary tradingofshort-andlong-termrights.Howeverdevelopment and implementation of such a mechanism will take a number of years, and in the interim ‘connect and manage’ is the most effective means of connecting new wind generation to the network without incurring significant delays.
Implementing ‘connect and manage‘ as set out in the TAR could be a significant challenge for the Government. Some existing generators could potentially face increased costs and might therefore strongly resist these proposals. The Government will need to show strong leadership in its ongoing negotiations with stakeholders.
ii. Changing the criteria for determining network reinforcements to better reflect the characteristics of wind generation
To date the transmission licensees have generally assumed a wind load factor of around 60% when determining whether new onshore wind capacity necessitated network reinforcement32. The ongoing review of planning and security standards should reduce this where appropriate to reflect the results of cost-benefit studies that recognise the impact of seasonal and geographic diversity.
Assuming a lower wind load factor would reduce the transmission licensee’s assessment of the amount of network reinforcement required, leading to less planning and construction of new lines, and therefore fasterconnectionfornewwindcapacity.However,therewill need to be a different kind of network management system, which will lead to constraints on conventional generation.
Implementing a process to enforce this constraint could be a significant challenge, but compensating the constrained conventional generator may well be more economically efficient than the construction of new transmission capacity.
iii. Undertake network investment in anticipation of demand from wind generators
In order to minimize the risk of investing in stranded assets, the transmission licensees at present require financial guarantees from generators before they take steps to make any network reinforcements required to connect those generators. Investment in the network is not undertaken pre-emptively in anticipation of demand. This contributes to the delays and uncertainty faced by wind developers, because potentially lengthy and uncertain planning processes do not begin until the developer makes a financial commitment. The potential for delays and uncertainty may themselves deter developers from bringing forward proposals and making the required financial commitments. Furthermore, the current approach may in the long run lead to less efficient investment decisions than would be achieved by a more strategic approach.
Interconnection to minimise costs and fully exploit the UK’s wind resourceThe additional system costs imposed by 40GW of wind power could potentially be reduced through greater interconnection between the UK’s and other countries’ electricity networks. If the UK was interconnected with an electricity system with lower wind penetration, the wind penetration of the combined system would be lower than that in the UK alone. In addition, wind regimes would differ between the two countries. These factors would reduce the balancing and load factor costs of conventional generation. Interconnection will also unlock wind capacity beyond 40GW in the longer term, exploiting the UK’s resource and the opportunity to export its electricity.
The benefits of interconnection to the UK need to be weighed against the costs of building and maintaining the interconnectors. Preliminary analysis suggests that at 40GW of wind power the benefits to the UK of greater interconnection could outweigh the costs, although a more detailed costing would be required to confirm this.
In order to maximise interconnector benefits between countries the EU needs to develop standard pan-European rules for their use. Ideally this would provide a consistent framework for all agreements, thereby reducing the complexity and costs associated with connecting two countries’ electrical grids and result in greater savings for the end consumer.
32 Source: GB SQSS Consultation Document, January 2008, National Grid/Scottish and Southern Energy/Scottish Power
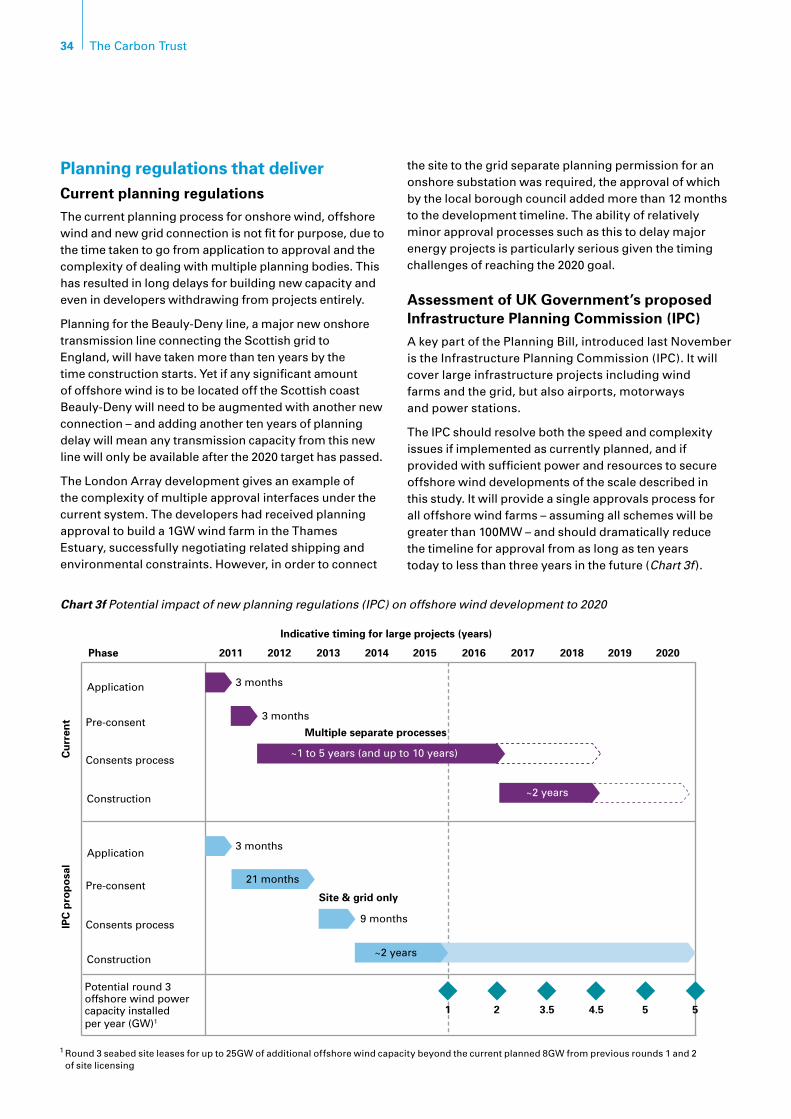
34 The Carbon Trust
Planning regulations that deliverCurrent planning regulations
The current planning process for onshore wind, offshore wind and new grid connection is not fit for purpose, due to the time taken to go from application to approval and the complexity of dealing with multiple planning bodies. This has resulted in long delays for building new capacity and even in developers withdrawing from projects entirely.
Planning for the Beauly-Deny line, a major new onshore transmission line connecting the Scottish grid to England, will have taken more than ten years by the time construction starts. Yet if any significant amount of offshore wind is to be located off the Scottish coast Beauly-Deny will need to be augmented with another new connection – and adding another ten years of planning delay will mean any transmission capacity from this new line will only be available after the 2020 target has passed.
The London Array development gives an example of the complexity of multiple approval interfaces under the current system. The developers had received planning approval to build a 1GW wind farm in the Thames Estuary, successfully negotiating related shipping and environmentalconstraints.However,inordertoconnect
the site to the grid separate planning permission for an onshore substation was required, the approval of which by the local borough council added more than 12 months to the development timeline. The ability of relatively minor approval processes such as this to delay major energy projects is particularly serious given the timing challenges of reaching the 2020 goal.
Assessment of UK Government’s proposed Infrastructure Planning Commission (IPC)
A key part of the Planning Bill, introduced last November is the Infrastructure Planning Commission (IPC). It will cover large infrastructure projects including wind farms and the grid, but also airports, motorways and power stations.
The IPC should resolve both the speed and complexity issues if implemented as currently planned, and if provided with sufficient power and resources to secure offshore wind developments of the scale described in this study. It will provide a single approvals process for all offshore wind farms – assuming all schemes will be greater than 100MW – and should dramatically reduce the timeline for approval from as long as ten years today to less than three years in the future (Chart 3f ).
Chart 3f Potential impact of new planning regulations (IPC) on offshore wind development to 2020
IPC
pro
po
sal
Cu
rren
t
Connection
Application
Phase
Indicative timing for large projects (years)
Multiple separate processes
Site & grid only
1 2 3.5 4.5 5 5
2011 2012 2013 2014 2015 2016 2017 2018 2019 2020
Pre-consent
3 months
3 months
9 months
~2 years
~2 years
21 months
3 months
~1 to 5 years (and up to 10 years)Consents process
Construction
Application
Pre-consent
Consents process
Construction
Potential round 3 offshore wind power capacity installed per year (GW)1
1 Round 3 seabed site leases for up to 25GW of additional offshore wind capacity beyond the current planned 8GW from previous rounds 1 and 2 of site licensing
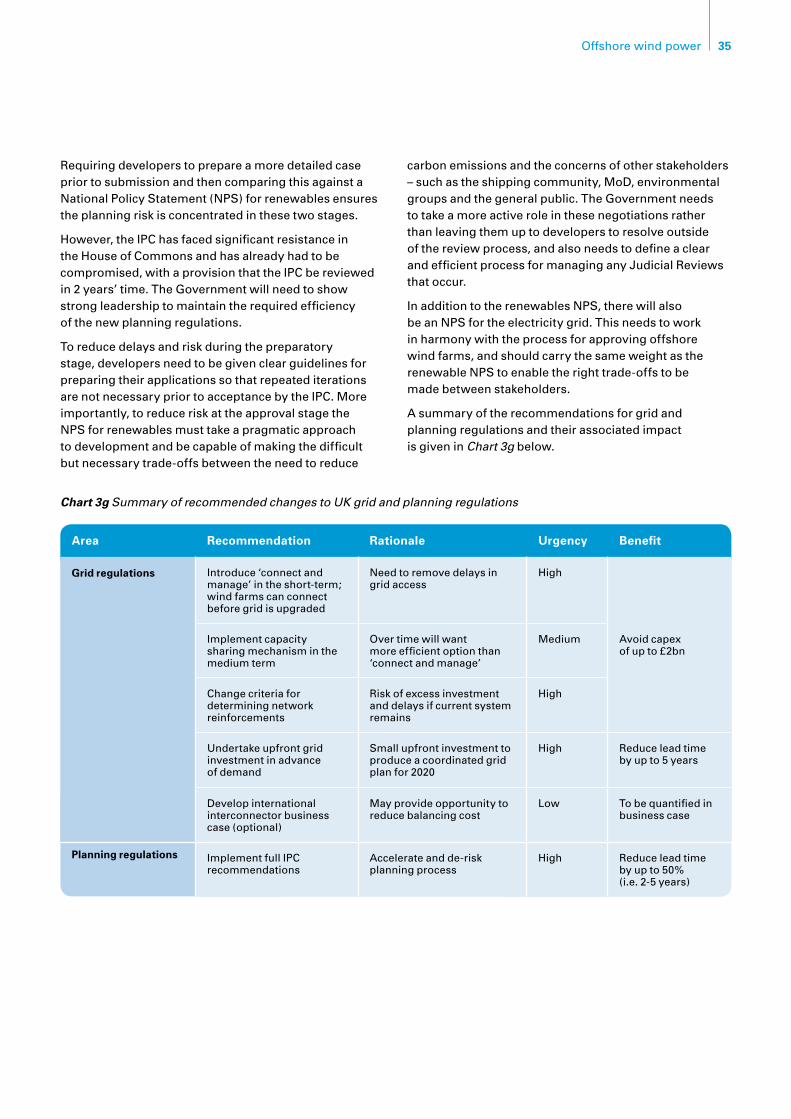
35Offshore wind power
Chart 3g Summary of recommended changes to UK grid and planning regulations
Requiring developers to prepare a more detailed case prior to submission and then comparing this against a National Policy Statement (NPS) for renewables ensures the planning risk is concentrated in these two stages.
However,theIPChasfacedsignificantresistanceintheHouseofCommonsandhasalreadyhadtobecompromised, with a provision that the IPC be reviewed in 2 years’ time. The Government will need to show strong leadership to maintain the required efficiency of the new planning regulations.
To reduce delays and risk during the preparatory stage, developers need to be given clear guidelines for preparing their applications so that repeated iterations are not necessary prior to acceptance by the IPC. More importantly, to reduce risk at the approval stage the NPS for renewables must take a pragmatic approach to development and be capable of making the difficult but necessary trade-offs between the need to reduce
carbon emissions and the concerns of other stakeholders – such as the shipping community, MoD, environmental groups and the general public. The Government needs to take a more active role in these negotiations rather than leaving them up to developers to resolve outside of the review process, and also needs to define a clear and efficient process for managing any Judicial Reviews that occur.
In addition to the renewables NPS, there will also be an NPS for the electricity grid. This needs to work in harmony with the process for approving offshore wind farms, and should carry the same weight as the renewable NPS to enable the right trade-offs to be made between stakeholders.
A summary of the recommendations for grid and planning regulations and their associated impact is given in Chart 3g below.
Area Recommendation Rationale Urgency Benefit
Grid regulations Introduce ‘connect and manage’ in the short-term; wind farms can connect before grid is upgraded
Need to remove delays in grid access
High
Avoid capex of up to £2bn
Implement capacity sharing mechanism in the medium term
Over time will want more efficient option than ‘connect and manage’
Medium
Change criteria for determining network reinforcements
Risk of excess investment and delays if current system remains
High
Undertake upfront grid investment in advance of demand
Small upfront investment to produce a coordinated grid plan for 2020
High Reduce lead time by up to 5 years
Develop international interconnector business case (optional)
May provide opportunity to reduce balancing cost
Low To be quantified in business case
Planning regulations Implement full IPC recommendations
Accelerate and de-risk planning process
High Reduce lead time by up to 50% (i.e. 2-5 years)
36 The Carbon Trust
OverviewOffshore wind technology has been operating commercially since 2002, when Denmark developed the HornsRevsitewith802MWwindturbines(seeChart 2a). Looking ahead, additional technology improvements and economies of scale are required to increase offshore wind farm reliability, to enable development of sites that are further from shore and in deep water and to deliver cost reduction. The engineering challenge should not be underestimated, but most developments will be able to leverage existing tried and tested technologies from onshore wind, electrical cable laying and oil & gas industries. This section indicates some of the main technology development opportunities and outlines how they can be delivered across the main aspects of an offshore wind farm: the wind turbine, foundation, connection, installation and operation & maintenance (O&M).
Based on this detailed analysis of the opportunities for technology development and economies of scale, the potential reduction in costs over time is quantified. In addition, whilst little can be done to influence commodity and material costs, the maximum and minimum impact of future fluctuations can be estimated.
Finally, the RD&D funding required from both industry and government is quantified. An optimum public-private innovation partnership is then outlined to deliver on the technology opportunity.
The technology needed to build offshore wind farms exists but needs to be optimised and further proven to reduce costs and risks. This will require more RD&D investment, testing facilities and demonstration sites.
4. Technology
Key findings
The technology to deliver 29GW by 2020 will be •based on tried and tested onshore wind, electrical power and oil & gas technologies.
Technology developments can be expected to •further improve reliability, reduce costs and enable sites to be developed in deeper waters, further from shore.
Costs are likely to reduce by a minimum of 20% •by 2020 through technology developments and economies of scale and would reduce a further 11% if commodity and material prices returned to 2003 levels.
Maximising technology improvements and •economies of scale could reduce the capex of 29GW of offshore wind by £5-15bn below our base case estimate of £65bn.
If gas prices continue to remain higher than •central scenarios, offshore wind power could be cost effective with conventional generation before 2020.
The Government needs to invest £0.1-0.6bn •in public RD&D funding to catalyse £0.6-£1.2bn in private UK RD&D investment and maximise technology development in a small number of regional offshore wind technology clusters. The Government’s innovation programme should integrate with the manufacturing and supply chain strategy.
Public RD&D funding should focus on early stage •R&D, demonstration and deployment. Funding is required for turbines, connection, installation and O&M technologies, and in particular for foundation technologies.
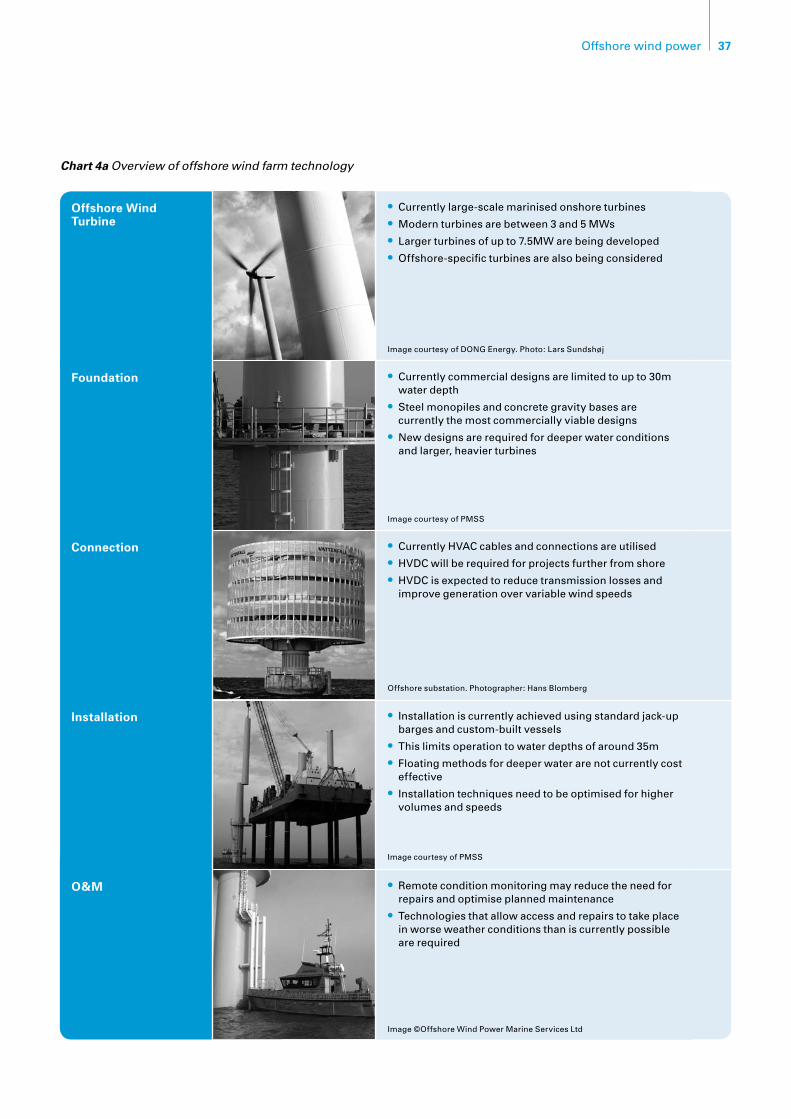
37Offshore wind power
Chart 4a Overview of offshore wind farm technology
Offshore Wind Turbine
Currently large-scale marinised onshore turbines•Modern turbines are between 3 and 5 MWs•Larger turbines of up to 7.5MW are being developed•Offshore-specific turbines are also being considered•
Foundation Currently commercial designs are limited to up to 30m •water depth
Steel monopiles and concrete gravity bases are •currently the most commercially viable designs
New designs are required for deeper water conditions •and larger, heavier turbines
Connection CurrentlyHVACcablesandconnectionsareutilised•HVDCwillberequiredforprojectsfurtherfromshore•HVDCisexpectedtoreducetransmissionlossesand•improve generation over variable wind speeds
Installation Installation is currently achieved using standard jack-up •barges and custom-built vessels
This limits operation to water depths of around 35m•Floating methods for deeper water are not currently cost •effective
Installation techniques need to be optimised for higher •volumes and speeds
O&M Remote condition monitoring may reduce the need for •repairs and optimise planned maintenance
Technologies that allow access and repairs to take place •in worse weather conditions than is currently possible are required
Image courtesy of PMSS
Image courtesy of DONG Energy. Photo: Lars Sundshøj
Image courtesy of PMSS
Offshoresubstation.Photographer:HansBlomberg
Image ©Offshore Wind Power Marine Services Ltd
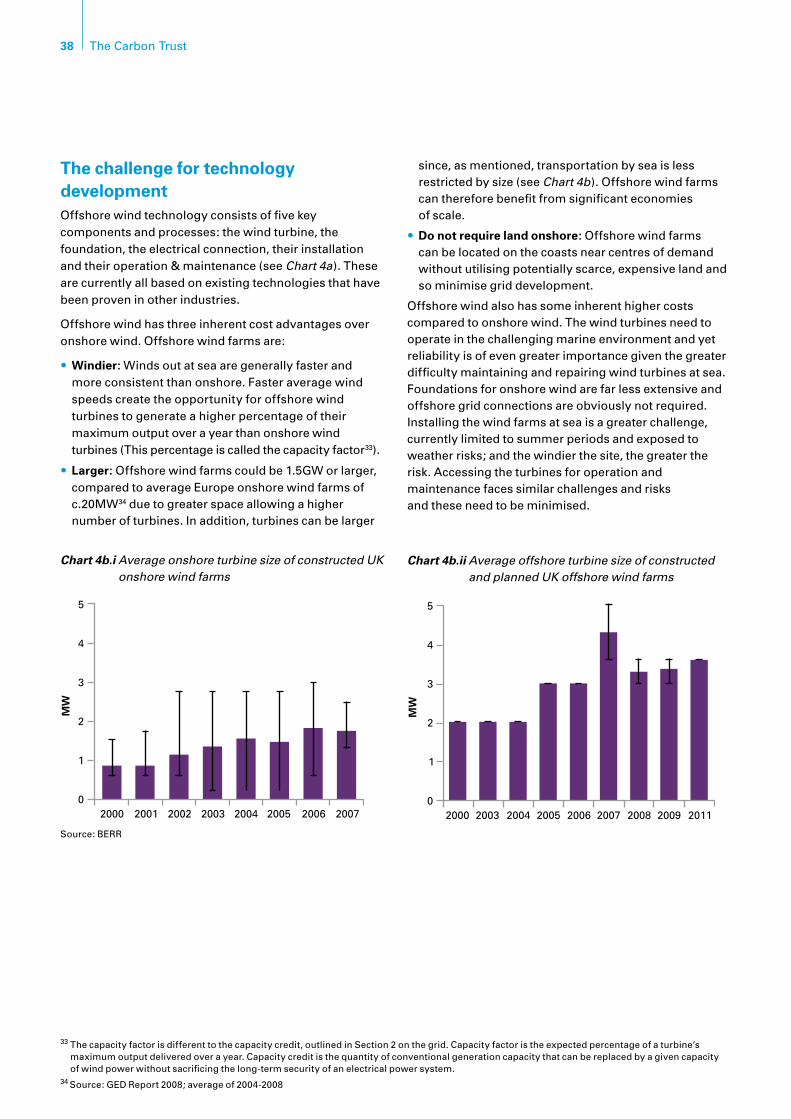
38 The Carbon Trust
The challenge for technology developmentOffshore wind technology consists of five key components and processes: the wind turbine, the foundation, the electrical connection, their installation and their operation & maintenance (see Chart 4a). These are currently all based on existing technologies that have been proven in other industries.
Offshore wind has three inherent cost advantages over onshore wind. Offshore wind farms are:
Windier:• Winds out at sea are generally faster and more consistent than onshore. Faster average wind speeds create the opportunity for offshore wind turbines to generate a higher percentage of their maximum output over a year than onshore wind turbines (This percentage is called the capacity factor33).
Larger:• Offshore wind farms could be 1.5GW or larger, compared to average Europe onshore wind farms of c.20MW34 due to greater space allowing a higher number of turbines. In addition, turbines can be larger
since, as mentioned, transportation by sea is less restricted by size (see Chart 4b). Offshore wind farms can therefore benefit from significant economies of scale.
Do not require land onshore:• Offshore wind farms can be located on the coasts near centres of demand without utilising potentially scarce, expensive land and so minimise grid development.
Offshore wind also has some inherent higher costs compared to onshore wind. The wind turbines need to operate in the challenging marine environment and yet reliability is of even greater importance given the greater difficulty maintaining and repairing wind turbines at sea. Foundations for onshore wind are far less extensive and offshore grid connections are obviously not required. Installing the wind farms at sea is a greater challenge, currently limited to summer periods and exposed to weather risks; and the windier the site, the greater the risk. Accessing the turbines for operation and maintenance faces similar challenges and risks and these need to be minimised.
33 The capacity factor is different to the capacity credit, outlined in Section 2 on the grid. Capacity factor is the expected percentage of a turbine’s maximum output delivered over a year. Capacity credit is the quantity of conventional generation capacity that can be replaced by a given capacity of wind power without sacrificing the long-term security of an electrical power system.
34 Source: GED Report 2008; average of 2004-2008
Chart 4b.ii Average offshore turbine size of constructed and planned UK offshore wind farms
4
3
5
1
2
02000 2003 20052004 2006 2007 2008 2009 2011
MW
Chart 4b.i Average onshore turbine size of constructed UK onshore wind farms
4
3
5
1
2
02000 2001 2002 2003 2004 2005 2006 2007
MW
Source: BERR
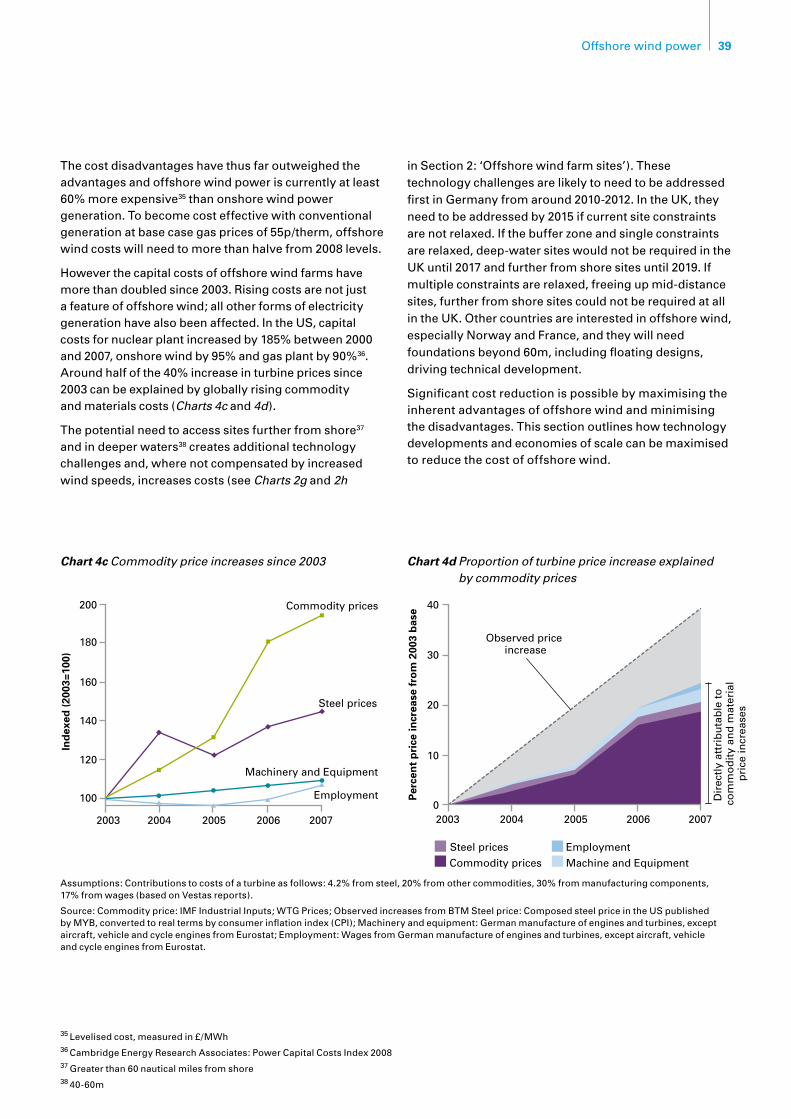
39Offshore wind power
Chart 4c Commodity price increases since 2003 Chart 4d Proportion of turbine price increase explained by commodity prices
180
160
200 Commodity prices
Steel prices
Employment
120
140
100
2003 20052004 2006 2007
Ind
exed
(20
03=1
00)
Machinery and Equipment
30
20
40
10
02003 20052004
Steel prices
Observed price increase
Employment
Commodity prices Machine and Equipment
2006 2007
Per
cen
t p
rice
incr
ease
fro
m 2
003
bas
e
Dir
ectl
y at
trib
uta
ble
to
co
mm
od
ity
and
mat
eria
lp
rice
incr
ease
s
Assumptions: Contributions to costs of a turbine as follows: 4.2% from steel, 20% from other commodities, 30% from manufacturing components, 17% from wages (based on Vestas reports).
Source: Commodity price: IMF Industrial Inputs; WTG Prices; Observed increases from BTM Steel price: Composed steel price in the US published by MYB, converted to real terms by consumer inflation index (CPI); Machinery and equipment: German manufacture of engines and turbines, except aircraft, vehicle and cycle engines from Eurostat; Employment: Wages from German manufacture of engines and turbines, except aircraft, vehicle and cycle engines from Eurostat.
The cost disadvantages have thus far outweighed the advantages and offshore wind power is currently at least 60% more expensive35 than onshore wind power generation. To become cost effective with conventional generation at base case gas prices of 55p/therm, offshore wind costs will need to more than halve from 2008 levels.
Howeverthecapitalcostsofoffshorewindfarmshavemore than doubled since 2003. Rising costs are not just a feature of offshore wind; all other forms of electricity generation have also been affected. In the US, capital costs for nuclear plant increased by 185% between 2000 and 2007, onshore wind by 95% and gas plant by 90%36. Around half of the 40% increase in turbine prices since 2003 can be explained by globally rising commodity and materials costs (Charts 4c and 4d).
The potential need to access sites further from shore37 and in deeper waters38 creates additional technology challenges and, where not compensated by increased wind speeds, increases costs (see Charts 2g and 2h
in Section 2: ‘Offshore wind farm sites’). These technology challenges are likely to need to be addressed first in Germany from around 2010-2012. In the UK, they need to be addressed by 2015 if current site constraints are not relaxed. If the buffer zone and single constraints are relaxed, deep-water sites would not be required in the UK until 2017 and further from shore sites until 2019. If multiple constraints are relaxed, freeing up mid-distance sites, further from shore sites could not be required at all in the UK. Other countries are interested in offshore wind, especially Norway and France, and they will need foundations beyond 60m, including floating designs, driving technical development.
Significant cost reduction is possible by maximising the inherent advantages of offshore wind and minimising the disadvantages. This section outlines how technology developments and economies of scale can be maximised to reduce the cost of offshore wind.
35 Levelised cost, measured in £/MWh36 Cambridge Energy Research Associates: Power Capital Costs Index 200837 Greater than 60 nautical miles from shore38 40-60m

40 The Carbon Trust
Opportunities for technology developmentThe implications of accessing further from shore and deeper water sites, and the opportunities to increase cost effectiveness are different for each key component of the offshore wind farm, and are explored in turn.
Wind turbines
Offshore wind turbines are, to date, largely marinised versions of the largest onshore wind designs that are designed to be suitable for high capacity factors. The engineering and quality control challenge required to operate in the marine environment is considerable. Some of the early turbines, such as the V90 turbines from Vestas, have experienced multiple failures, particularly in gearboxes. Vestas temporarily ceased further sales of the V90 to the offshore wind market and prioritised increasing the quality and reliability of the turbine39. A year later they have now reportedly addressed these issues and have resumed sales of the improved V90.
Failures contributed to the poor availability at Kentish Flats, as well as at Scroby Sands, which were as low as 63-65% compared to the expected availability, achieved
atNorthHoyle,of90-95%(Chart 4e). Poor availability at some wind farm sites has been the main driver of lower than expected load factors, reducing the amount of electricity generated and therefore the offshore wind farms’ revenues (Chart 4f ).
If further from shore sites are necessary, improvements in reliability will be even more critical given the long travel distances and greater potential for weather to disrupt maintenance operations.
Given the time to design, develop and build investor confidence in radical new technology, offshore wind turbines are likely to remain fundamentally based on the three-blade, upwind design until 2020 (see the side box: ‘the three-bladed turbine is here to stay for now’).
‘Radical new designs are not feasible by 2020 and are unlikely to deliver as much as is sometimes believed’
Interview with turbine manufacturer, 2008
Nevertheless, there are significant incremental improvements possible both to increase reliability further and to drive cost reduction.
Chart 4e Offshore wind farm availability
Scroby SandsNorth Hoyle Kentish Flats
80%
40%
60%
93 92
6374
8776
6575
100%
20%
0%2005
90-95% = Expected availability1
2006 2007
Ava
ilab
ility
30%
20%36 36
2529
3430
2529
40%
10%
0%2005
36% = Expected load factor2
2006 2007
Load
fac
tor
1 SKM estimates for an efficient wind farm
2 Expected load factor at Kentish Flats site Note: Assumes that wind speeds and efficiency losses of farms are as planned, thus the reduction in load factor is a direct result of lower availability
Source:SKM;KentishFlats;ScrobySands;NorthHoyle
Chart 4f Average load factors have been 30%
39 Source: Vestas public statements

41Offshore wind power
The three-bladed turbine is here to stay for now
Offshore wind turbines have, to date, largely been marinised versions of the largest onshore wind designs that are designed to be more suitable for high capacity factors. Offshore turbines face fewer constraints than onshore turbines in terms of visual impact and noise (particularly in regard to planning), but there are greater costs associated with reliability and servicing. For this reason a change in design could present several benefits. For instance turbines with fewer blades have reduced material costs (Chart 4g). Manufacturers are wary of investing in any of these new technologies in the medium term due to the increased risks and costs associated with designing a completely new turbine.
Chart 4g Examples of future prototypes for wind turbine design
Horizontal axis wind turbines
Riva Calzoni
Italian Company•One blade reduces material •costs
Hastoberunfasterto•capture the same energy, reducing the stress on the gearbox but increasing noise
Less stable•Not visually pleasing•
Delta Wind
Swedish Company•Dual blade design• Compromise between •benefits of one and three blades
Flexible tower for rapid •rotations
Potential offshore if stability and reliability improved
Source: Press reports March 2008

42 The Carbon Trust
Technology is already being developed for direct-drive, gearless nacelles, improved generators (e.g. fixed magnets, increased generator coils) and to increase condition monitoring (Charts 4h and 4l). Further development will be required in these areas, as well as maximising blade reliability.
Turbines are also getting larger (see Chart 4b.ii): Bard, Multibrid and REpower all have 5MW turbines in production, and Clipper is developing a 7.5 MW turbine – a prototype of which was purchased by the Crown Estate in April 2008 for deployment around 2010. The key benefit of increasing the size of turbines is to gain more power; power output is proportional to the square of the blade length. Larger turbines also offer economies of scale in manufacturing, installation and maintenance; these costs are mostly driven by the number of turbines rather than the turbine size and so large turbines allow the same amount of electricity to be produced at a lower cost. Nevertheless, wind turbine size is unlikely to continue to increase indefinitely.
‘Up to 2003, turbine size doubled every year. Now we will only see larger turbines being used offshore; logistics onshore prevent the use of super sized turbines’
Turbine manufacturer, 2008
Manufacturers are also making technology advances in reducing mass per installed generating capacity (mass/MW) which could be critical to reducing foundation and installation costs for these bigger machines. (Further details are given in the ‘alternative materials’ column in Chart 4h). In addition, offshore wind turbines can be expected to become more efficient. Technology advances include improved blade design and generator technologies, including potentially using superconducting generators in the longer term (see Chart 4h).
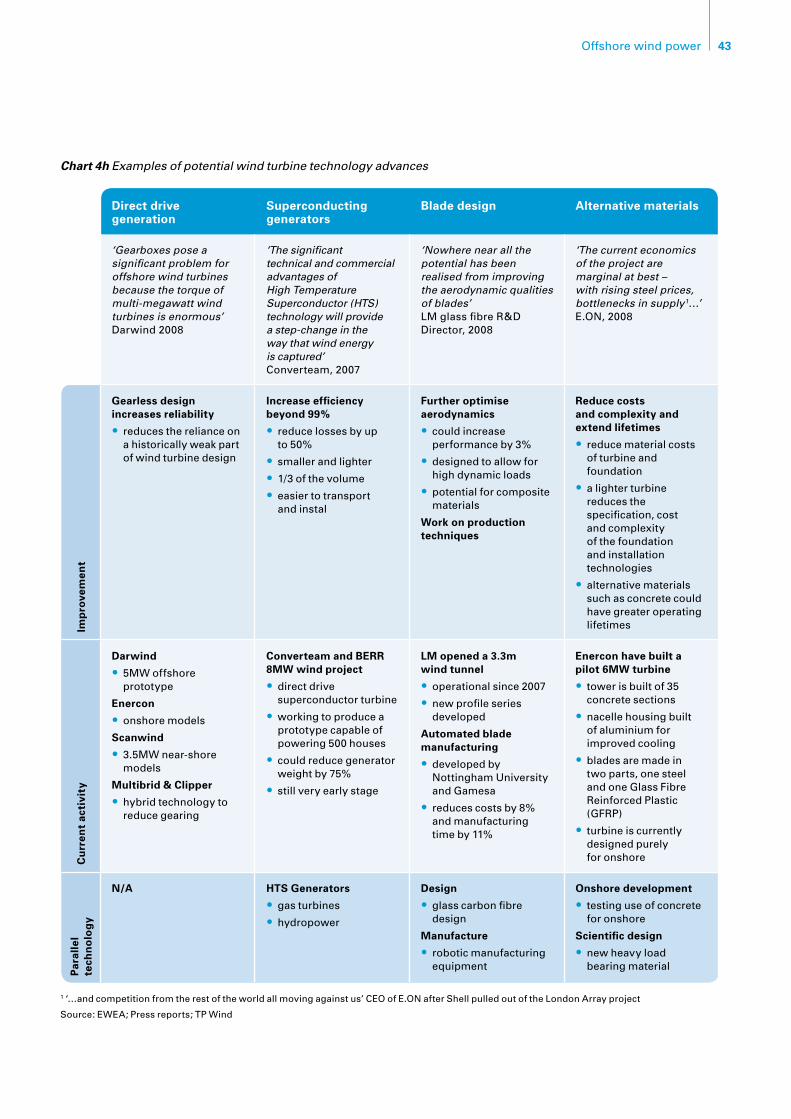
43Offshore wind power
Chart 4h Examples of potential wind turbine technology advances
Direct drive generation
Superconducting generators
Blade design Alternative materials
‘Gearboxes pose a significant problem for offshore wind turbines because the torque of multi-megawatt wind turbines is enormous’Darwind 2008
‘The significant technical and commercial advantages of High Temperature Superconductor (HTS) technology will provide a step-change in the way that wind energy is captured’Converteam, 2007
‘Nowhere near all the potential has been realised from improving the aerodynamic qualities of blades’LM glass fibre R&D Director, 2008
‘The current economics of the project are marginal at best – with rising steel prices, bottlenecks in supply1…’E.ON, 2008
Imp
rove
men
t
Gearless design increases reliability
reduces the reliance on •a historically weak part of wind turbine design
Increase efficiency beyond 99%
reduce losses by up •to 50%
smaller and lighter•1/3 of the volume• easier to transport •and instal
Further optimise aerodynamics
could increase •performance by 3%
designed to allow for •high dynamic loads
potential for composite •materials
Work on production techniques
Reduce costs and complexity and extend lifetimes
reduce material costs •of turbine and foundation
a lighter turbine •reduces the specification, cost and complexity of the foundation and installation technologies
alternative materials •such as concrete could have greater operating lifetimes
Cu
rren
t ac
tivi
ty
Darwind
5MW offshore •prototype
Enercon
onshore models•Scanwind
3.5MW near-shore •models
Multibrid & Clipper
hybrid technology to •reduce gearing
Converteam and BERR 8MW wind project
direct drive •superconductor turbine
working to produce a •prototype capable of powering 500 houses
could reduce generator •weight by 75%
still very early stage•
LM opened a 3.3m wind tunnel
operational since 2007• new profile series •developed
Automated blade manufacturing
developed by •Nottingham University and Gamesa
reduces costs by 8% •and manufacturing time by 11%
Enercon have built a pilot 6MW turbine
tower is built of 35 •concrete sections
nacelle housing built •of aluminium for improved cooling
blades are made in •two parts, one steel and one Glass Fibre Reinforced Plastic (GFRP)
turbine is currently •designed purely for onshore
Par
alle
l te
chn
olo
gy
N/A HTS Generators
gas turbines•hydropower •
Design
glass carbon fibre •design
Manufacture
robotic manufacturing •equipment
Onshore development
testing use of concrete •for onshore
Scientific design
new heavy load •bearing material
1 ‘…and competition from the rest of the world all moving against us’ CEO of E.ON after Shell pulled out of the London Array project
Source: EWEA; Press reports; TP Wind

44 The Carbon Trust
Foundations
Almost all operational or consented offshore wind farms in the UK use monopile foundations. These are a tried and tested technology used in marine construction. Essentially they are simple steel tubes, hammered into the seabed.
However,monopilefoundationscannotcurrentlybeusedbeyond 30m water depths with 3MW or heavier turbines. Furthermore, monopile diameters are limited to 5-6m and therefore are not economical for larger 5MW turbines beyond 20m water depths, unless their mass/MW can be significantly reduced.
‘The biggest benefits the industry could award itself would be the ability to build economic foundations at a water depth of more than 30 metres’
Turbine manufacturer, 2008
The industry is therefore considering the use of concrete gravity based structures, adaptations of monopiles (tripods and tripiles) and jacket structures (as used for oil and gas platforms). For depths beyond 60m, floating foundations are being developed. Chart 4i gives an overview of these different foundation designs.
There are also significant opportunities to reduce foundation costs through economies of scale and reduced materials costs. The new foundation designs, such as jackets, have lower mass/MW (see Chart 4j) or lower materials costs e.g. concrete gravity bases. Whilst they are currently relatively expensive, high-volume production and installation techniques could significantly reduce costs.
Connection
OffshorewindfarmscurrentlyusestandardHighVoltageAlternatingCurrent(HVAC)subseacablesandconnections, used in the telecommunications and power industries.Forfaroffshoresites,HighVoltageDirectCurrent(HVDC)transmissionislikelytobeanecessity.HVDCisalreadyplannedforsomeoffshorewindfarms(e.g. Borkum 2), and has an extensive track record in other long distance transmission applications both on land and subsea.ThecostofHVDCtechnologyiscurrentlyhighbutcan be reduced in the medium to long-term.
AmovetoHVDCcablesandconnectorsnotonlyincreases possible distances from shore, but also reduces transmission losses, improves generation over variable wind speeds and enables one converter to potentially be used for the whole wind farm.
‘HVDC is not a completely new idea, what we are doing is taking a technology that is proven and applying it to the wind industry’
Cable manufacturer, 2008
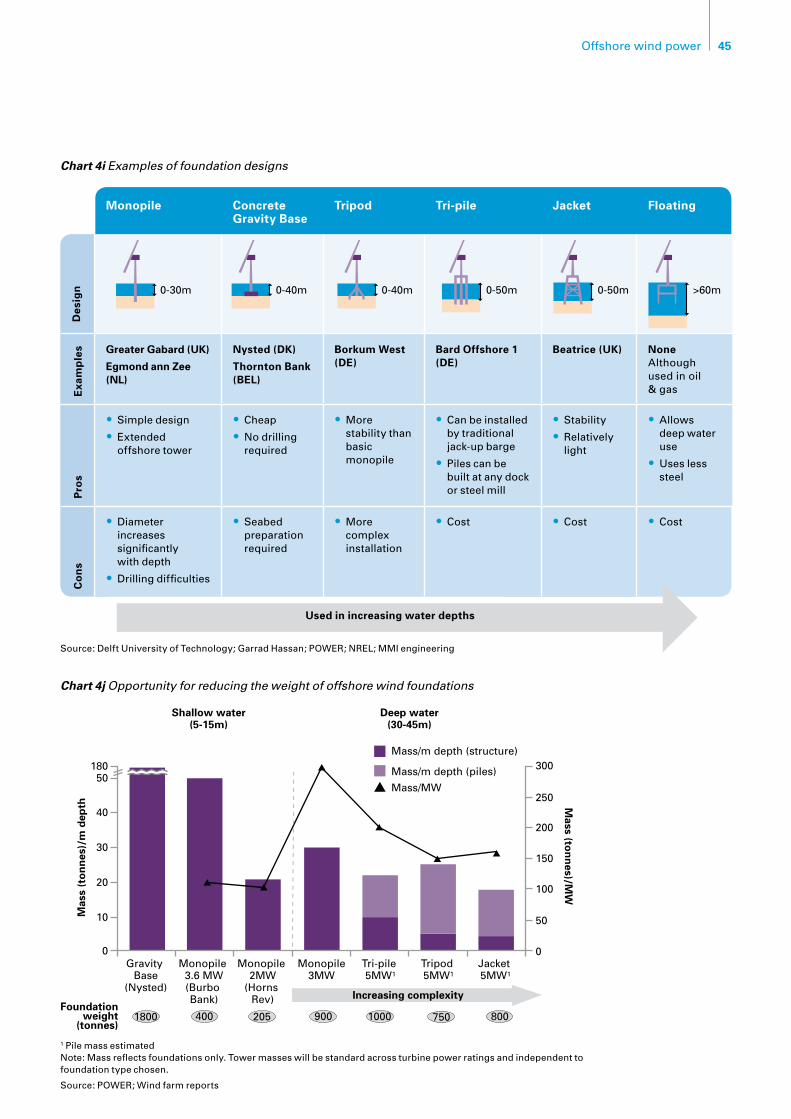
45Offshore wind power
Chart 4j Opportunity for reducing the weight of offshore wind foundations
1 Pile mass estimatedNote: Mass reflects foundations only. Tower masses will be standard across turbine power ratings and independent to foundation type chosen.
Source: POWER; Wind farm reports
- -
- -
- -
- -
- -
- -
- -
- -
- -
- -
- -
40
50
20
30
180 300
250
200
150
100
50
0
10
Gravity Base
(Nysted)
Shallow water(5-15m)
Deep water(30-45m)
Monopile 3.6 MW(Burbo Bank)
Monopile 2MW
(Horns Rev)
Monopile3MW
Tri-pile 5MW1
Tripod 5MW1
Jacket 5MW1
0
Mas
s (t
on
nes
)/m
dep
th
Mass (to
nn
es)/MW
Mass/m depth (structure)
Mass/m depth (piles)
Mass/MW
Increasing complexity
1800 400 205 900 1000 750 800Foundation
weight(tonnes)
Monopile Concrete Gravity Base
Tripod Tri-pile Jacket Floating
Des
ign
Exa
mp
les Greater Gabard (UK)
Egmond ann Zee (NL)
Nysted (DK)
Thornton Bank (BEL)
Borkum West (DE)
Bard Offshore 1 (DE)
Beatrice (UK) None Although used in oil & gas
Pro
s
Simple design•Extended •offshore tower
Cheap •No drilling •required
More •stability than basic monopile
Can be installed •by traditional jack-up barge
Piles can be •built at any dock or steel mill
Stability•Relatively •light
Allows •deep water use
Uses less •steel
Co
ns
Diameter •increases significantly with depth
Drilling difficulties•
Seabed •preparation required
More •complex installation
Cost• Cost• Cost•
Chart 4i Examples of foundation designs
Source:DelftUniversityofTechnology;GarradHassan;POWER;NREL;MMIengineering
>60m0-50m0-50m0-40m0-40m0-30m
Used in increasing water depths
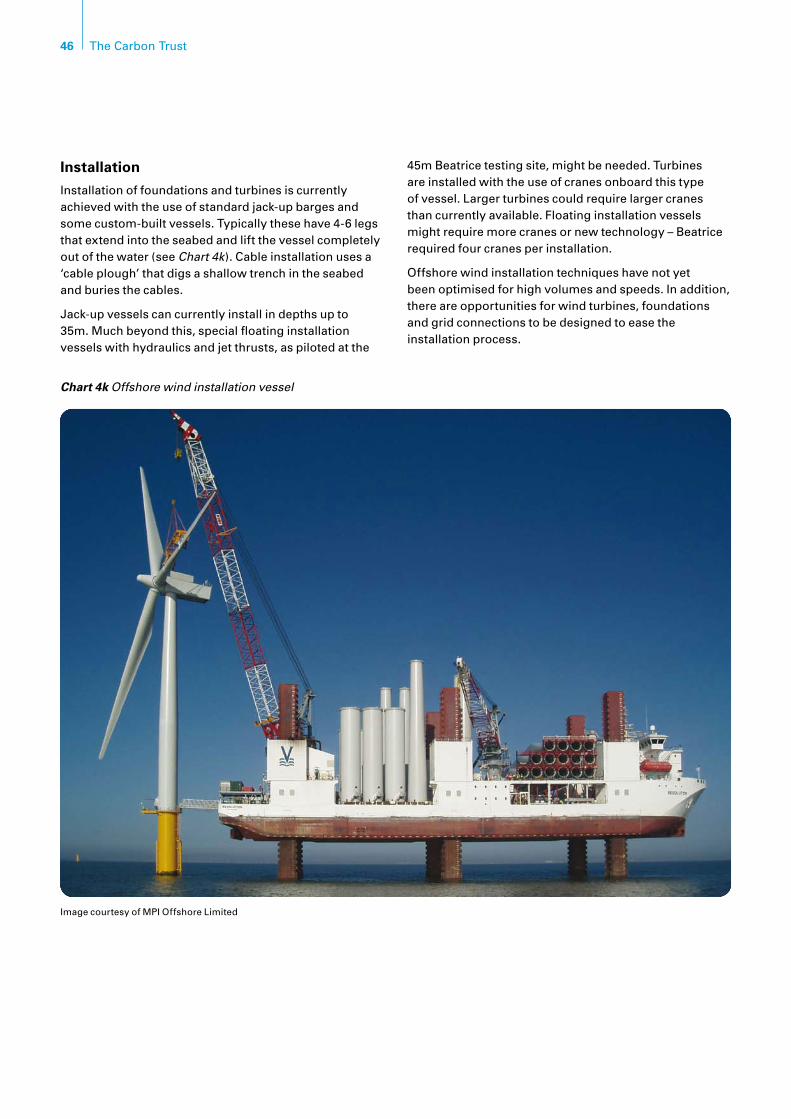
46 The Carbon Trust
Installation
Installation of foundations and turbines is currently achieved with the use of standard jack-up barges and some custom-built vessels. Typically these have 4-6 legs that extend into the seabed and lift the vessel completely out of the water (see Chart 4k). Cable installation uses a ‘cable plough’ that digs a shallow trench in the seabed and buries the cables.
Jack-up vessels can currently install in depths up to 35m. Much beyond this, special floating installation vessels with hydraulics and jet thrusts, as piloted at the
45m Beatrice testing site, might be needed. Turbines are installed with the use of cranes onboard this type of vessel. Larger turbines could require larger cranes than currently available. Floating installation vessels might require more cranes or new technology – Beatrice required four cranes per installation.
Offshore wind installation techniques have not yet been optimised for high volumes and speeds. In addition, there are opportunities for wind turbines, foundations and grid connections to be designed to ease the installation process.
Chart 4k Offshore wind installation vessel
Image courtesy of MPI Offshore Limited
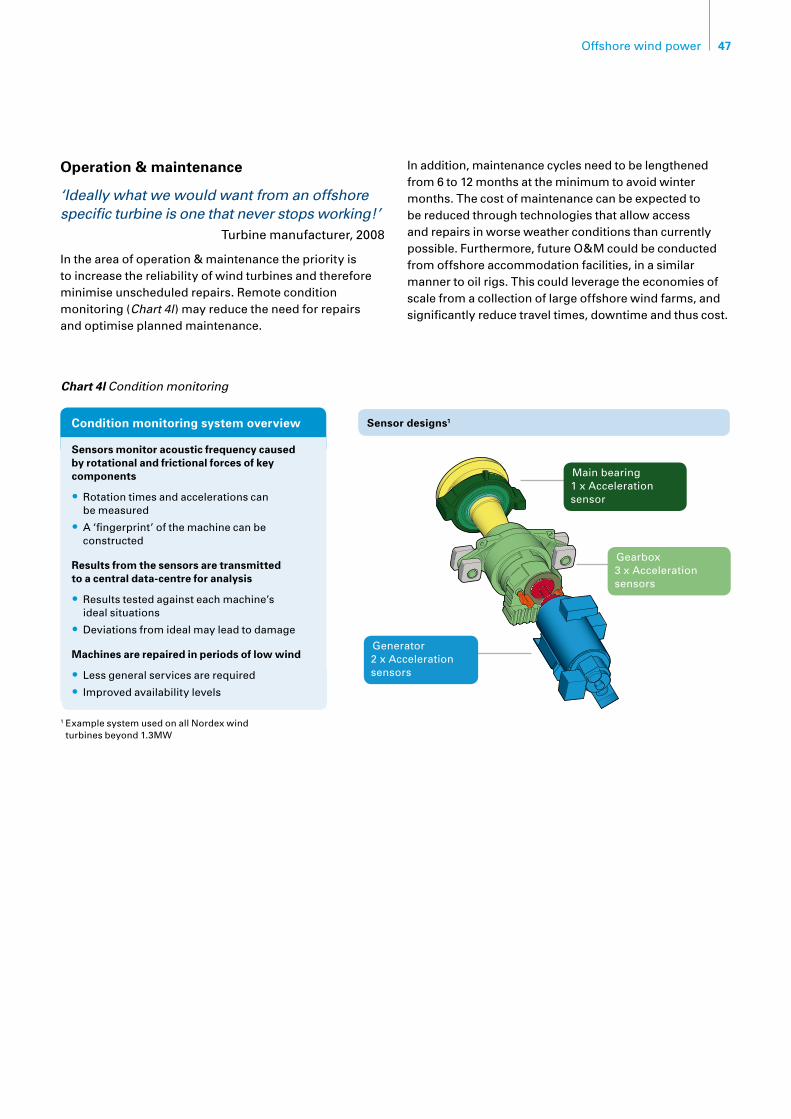
47Offshore wind power
Operation & maintenance
‘Ideally what we would want from an offshore specific turbine is one that never stops working!’
Turbine manufacturer, 2008
In the area of operation & maintenance the priority is to increase the reliability of wind turbines and therefore minimise unscheduled repairs. Remote condition monitoring (Chart 4l) may reduce the need for repairs and optimise planned maintenance.
In addition, maintenance cycles need to be lengthened from 6 to 12 months at the minimum to avoid winter months. The cost of maintenance can be expected to be reduced through technologies that allow access and repairs in worse weather conditions than currently possible. Furthermore, future O&M could be conducted from offshore accommodation facilities, in a similar manner to oil rigs. This could leverage the economies of scale from a collection of large offshore wind farms, and significantly reduce travel times, downtime and thus cost.
Chart 4l Condition monitoring
1 Example system used on all Nordex wind turbines beyond 1.3MW
Sensor designs1
Main bearing 1 x Acceleration sensor
Gearbox 3 x Acceleration sensors
Generator 2 x Acceleration sensors
Condition monitoring system overview
Sensors monitor acoustic frequency caused by rotational and frictional forces of key components
Rotation times and accelerations can •be measured
A ‘fingerprint’ of the machine can be •constructed
Results from the sensors are transmitted to a central data-centre for analysis
Results tested against each machine’s •ideal situations
Deviations from ideal may lead to damage•Machines are repaired in periods of low wind
Less general services are required •Improved availability levels•

48 The Carbon Trust
Cost reduction through learningLearning curve analysis is the principal approach for forecasting cost reduction over long time periods due to technology developments and economies of scale. Learning rates – the percentage cost reduction every time installed capacity doubles – are calculated retrospectively and then used to make indicative forecasts. Different technologies demonstrate a wide range of learning rates, from 5% to 50%40.
Excluding commodity and material price fluctuations, each key component of offshore wind technology is likely to demonstrate a learning rate similar to that achieved in analogous industries. Chart 4o on page 50 outlines the technology developments and economies of scale for each key component and reference learning rates.
Given the uncertainty in forecasting future costs, we developed three scenarios. The base case/low scenario is highly conservative, with each component of offshore wind demonstrating the lower end of learning estimates of the underlying industries it is based on. Furthermore, offshore wind turbines, representing more than half the cost, are assumed to continue to be fundamentally based on onshore wind turbine technology, and therefore only experience the learning effect for every doubling of the overall wind market, and not the much faster growth of just the offshore wind market.
The middle and high scenarios see the supply chain strategically prioritise offshore wind and hence increase RD&D and maximise economies of scale, hence fulfilling potential technology cost reduction. The offshore wind turbine demonstrates a learning rate of 15%, at the higher range of onshore learning rates41. The foundations and installation components exhibit learning effects of 10-20% as they leverage the large opportunity from economiesofscale.GridconnectionsusemoreHVDCcables and converters and so benefit from the high learning effects of this new high tech market of up to 20%. In the high scenario, offshore wind turbines experience the learning effect for every doubling of the offshore wind market as opposed to the overall wind market.
The average learning rate for offshore wind power generation (weighted by the cost of each key component) is then calculated to be 9% in the base case, 13% in the middle case and 15% in the maximum case. Excluding commodity and material price fluctuations, the costs of offshore wind power generation are therefore forecast to reduce by between 19-44% by 2020, as shown in Chart 4m.
Our base case of £65bn of investment required to deliver 29GW of offshore wind power by 2020 assumes the base/low learning rate. Without any learning, the investment required would increase by £9bn. Achieving middle and high learning rates would reduce the investment required by £5bn and £15bn from the base case respectively.
Avg. learning rate
Levelised cost reduction1
by 2015 by 2020
Base/low 9% 13-14% 19-21%
Middle 13% 19-21% 29-30%
High 15% 35-37% 42-44%
1 Variance due to different site types having different weights across cost components and therefore different weighted average cost reductions
Chart 4m Summary of learning rates and cost reduction
40 Source: BCG41 Source: Jungigner and Faaij (2004), Neuhoff and Coulomb (2006), Lako (2002), BCG analysis
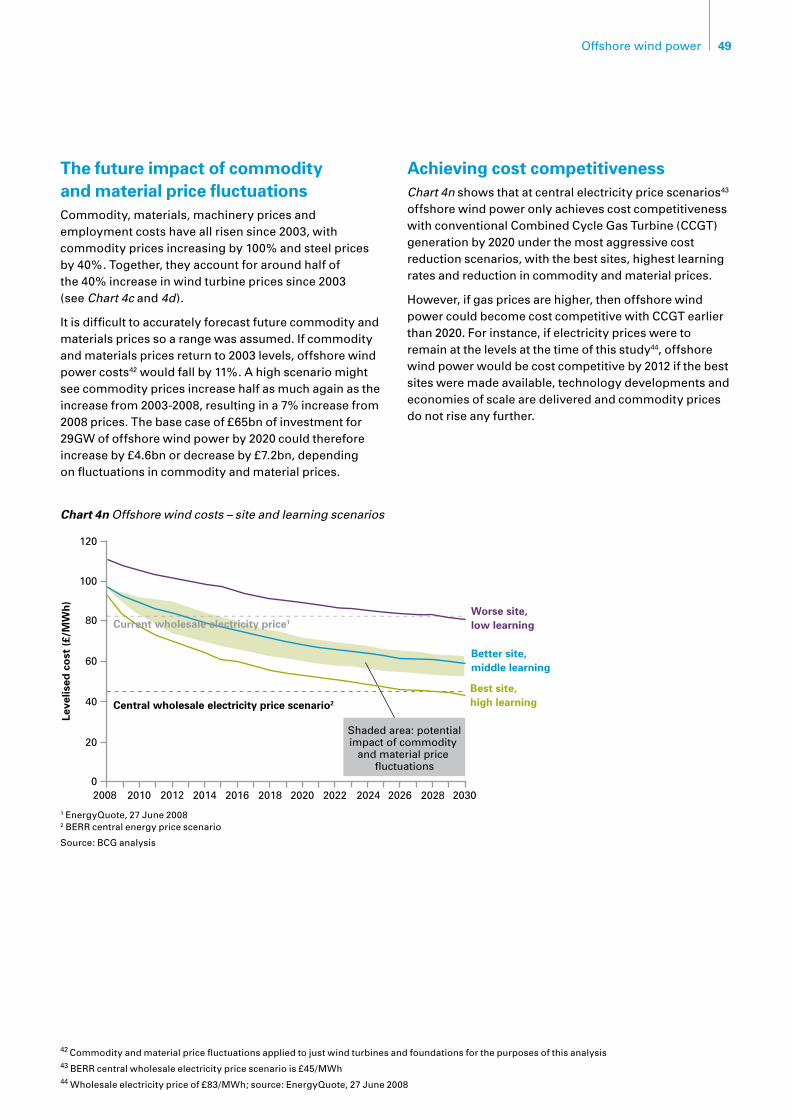
49Offshore wind power
The future impact of commodity and material price fluctuationsCommodity, materials, machinery prices and employment costs have all risen since 2003, with commodity prices increasing by 100% and steel prices by 40%. Together, they account for around half of the 40% increase in wind turbine prices since 2003 (see Chart 4c and 4d).
It is difficult to accurately forecast future commodity and materials prices so a range was assumed. If commodity and materials prices return to 2003 levels, offshore wind power costs42 would fall by 11%. A high scenario might see commodity prices increase half as much again as the increase from 2003-2008, resulting in a 7% increase from 2008 prices. The base case of £65bn of investment for 29GW of offshore wind power by 2020 could therefore increase by £4.6bn or decrease by £7.2bn, depending on fluctuations in commodity and material prices.
Achieving cost competitivenessChart 4n shows that at central electricity price scenarios43 offshore wind power only achieves cost competitiveness with conventional Combined Cycle Gas Turbine (CCGT) generation by 2020 under the most aggressive cost reduction scenarios, with the best sites, highest learning rates and reduction in commodity and material prices.
However,ifgaspricesarehigher,thenoffshorewindpower could become cost competitive with CCGT earlier than 2020. For instance, if electricity prices were to remain at the levels at the time of this study44, offshore wind power would be cost competitive by 2012 if the best sites were made available, technology developments and economies of scale are delivered and commodity prices do not rise any further.
42 Commodity and material price fluctuations applied to just wind turbines and foundations for the purposes of this analysis43 BERR central wholesale electricity price scenario is £45/MWh44 Wholesale electricity price of £83/MWh; source: EnergyQuote, 27 June 2008
1 EnergyQuote, 27 June 20082 BERR central energy price scenario
Source: BCG analysis
Chart 4n Offshore wind costs – site and learning scenarios
60
02008 20122010 2018 2022 2024 2026
20
20162014 2020 20302028
Worse site,low learning
Better site,middle learning
Best site,high learning
40
80
100
120
Central wholesale electricity price scenario2
- - - - - - - - - - - - - - - - - - - - - - - - - - - - - - - - - - - - - - - - - - - - - -
- - - - - - - - - - - - - - - - - - - - - - - - - - - - - - - - - - - - - - - - - - - - - -
Shaded area: potentialimpact of commodity
and material price fluctuations
Leve
lised
co
st (
£/M
Wh
)
Current wholesale electricity price1
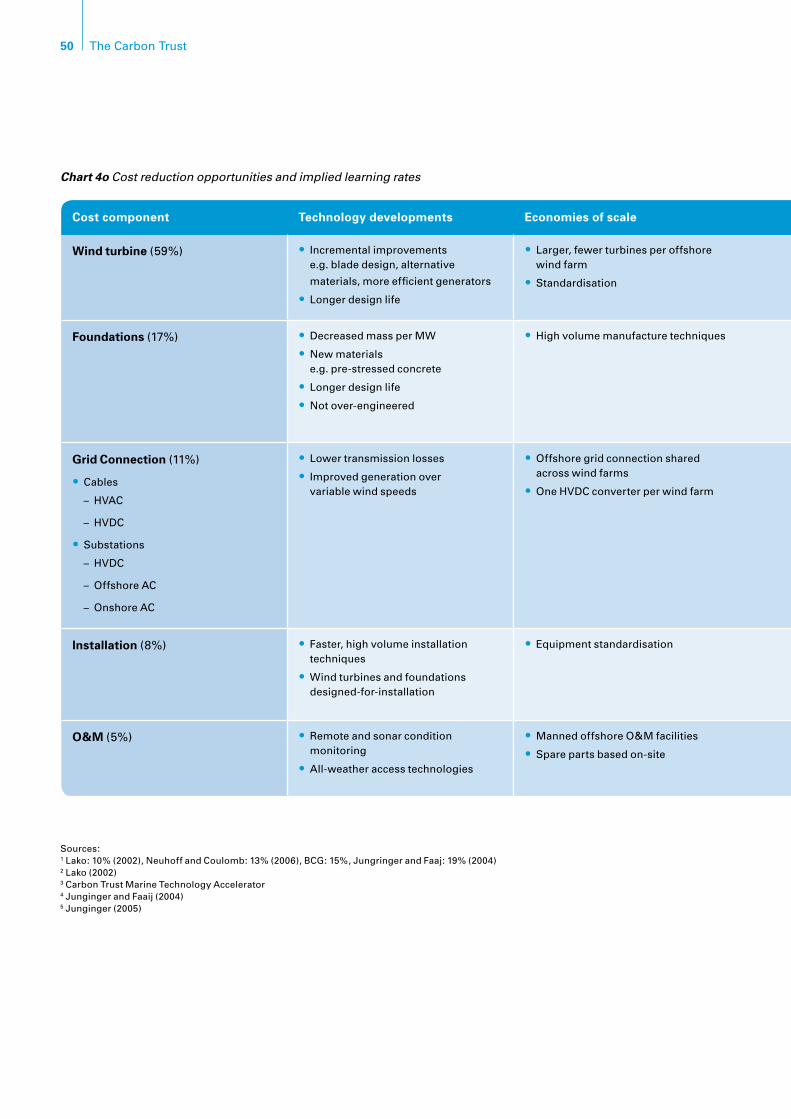
50 The Carbon Trust
Sources:1 Lako: 10% (2002), Neuhoff and Coulomb: 13% (2006), BCG: 15%, Jungringer and Faaj: 19% (2004)2 Lako (2002) 3 Carbon Trust Marine Technology Accelerator 4 Junginger and Faaij (2004) 5 Junginger (2005)
Learning rate scenarios
Cost component Technology developments Economies of scale Reference learning rates Base/low Mid High
Wind turbine (59%) Incremental improvements •e.g. blade design, alternative
materials, more efficient generators
Longer design life•
Larger, fewer turbines per offshore •wind farm
Standardisation•
Assume onshore turbine rates at a minimum, •with higher rates likely: – Onshore turbine: 10-19%1
10% 15% 15%
Foundations (17%) Decreased mass per MW•New materials •e.g. pre-stressed concrete
Longer design life•Not over-engineered•
Highvolumemanufacturetechniques• Assume higher rates than Construction industry •and on-par with marine renewables: – Construction: 5-8%2 – Marine renewables: 10-15%3
5% 10% 15%
Grid Connection (11%)
Cables • –HVAC
–HVDC
Substations • –HVDC
– Offshore AC
– Onshore AC
Lower transmission losses•Improved generation over •variable wind speeds
Offshore grid connection shared •across wind farms
OneHVDCconverterperwindfarm•
UseHVDClearningratesfor25% •of installations from 2015: –HVDCcables:32%4
–HVDCconverters:29%4 5%
5%
10%
5%
5%
5%
10%
10%
10%
5%
5%
15%
20%
10%
5%
Installation (8%) Faster, high volume installation •techniques
Wind turbines and foundations •designed-for-installation
Equipment standardisation• Global capacity: 19%• 5
National capacity: 9%• 5
10% 15% 20%
O&M (5%) Remote and sonar condition •monitoring
All-weather access technologies•
Manned offshore O&M facilities•Spare parts based on-site•
Large repetition benefit• 10% 15% 15%
Weighted average learning rate: 9% 13% 15%
Chart 4o Cost reduction opportunities and implied learning rates
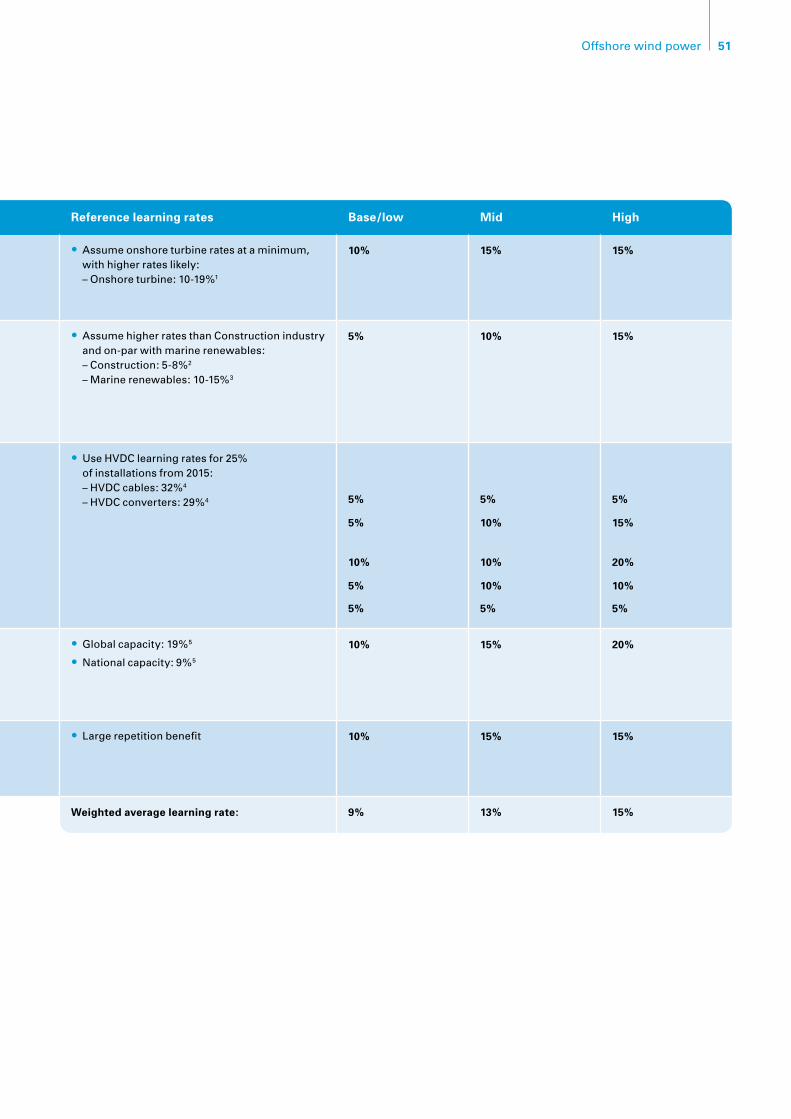
51Offshore wind power
Learning rate scenarios
Cost component Technology developments Economies of scale Reference learning rates Base/low Mid High
Wind turbine (59%) Incremental improvements •e.g. blade design, alternative
materials, more efficient generators
Longer design life•
Larger, fewer turbines per offshore •wind farm
Standardisation•
Assume onshore turbine rates at a minimum, •with higher rates likely: – Onshore turbine: 10-19%1
10% 15% 15%
Foundations (17%) Decreased mass per MW•New materials •e.g. pre-stressed concrete
Longer design life•Not over-engineered•
Highvolumemanufacturetechniques• Assume higher rates than Construction industry •and on-par with marine renewables: – Construction: 5-8%2 – Marine renewables: 10-15%3
5% 10% 15%
Grid Connection (11%)
Cables • –HVAC
–HVDC
Substations • –HVDC
– Offshore AC
– Onshore AC
Lower transmission losses•Improved generation over •variable wind speeds
Offshore grid connection shared •across wind farms
OneHVDCconverterperwindfarm•
UseHVDClearningratesfor25% •of installations from 2015: –HVDCcables:32%4
–HVDCconverters:29%4 5%
5%
10%
5%
5%
5%
10%
10%
10%
5%
5%
15%
20%
10%
5%
Installation (8%) Faster, high volume installation •techniques
Wind turbines and foundations •designed-for-installation
Equipment standardisation• Global capacity: 19%• 5
National capacity: 9%• 5
10% 15% 20%
O&M (5%) Remote and sonar condition •monitoring
All-weather access technologies•
Manned offshore O&M facilities•Spare parts based on-site•
Large repetition benefit• 10% 15% 15%
Weighted average learning rate: 9% 13% 15%
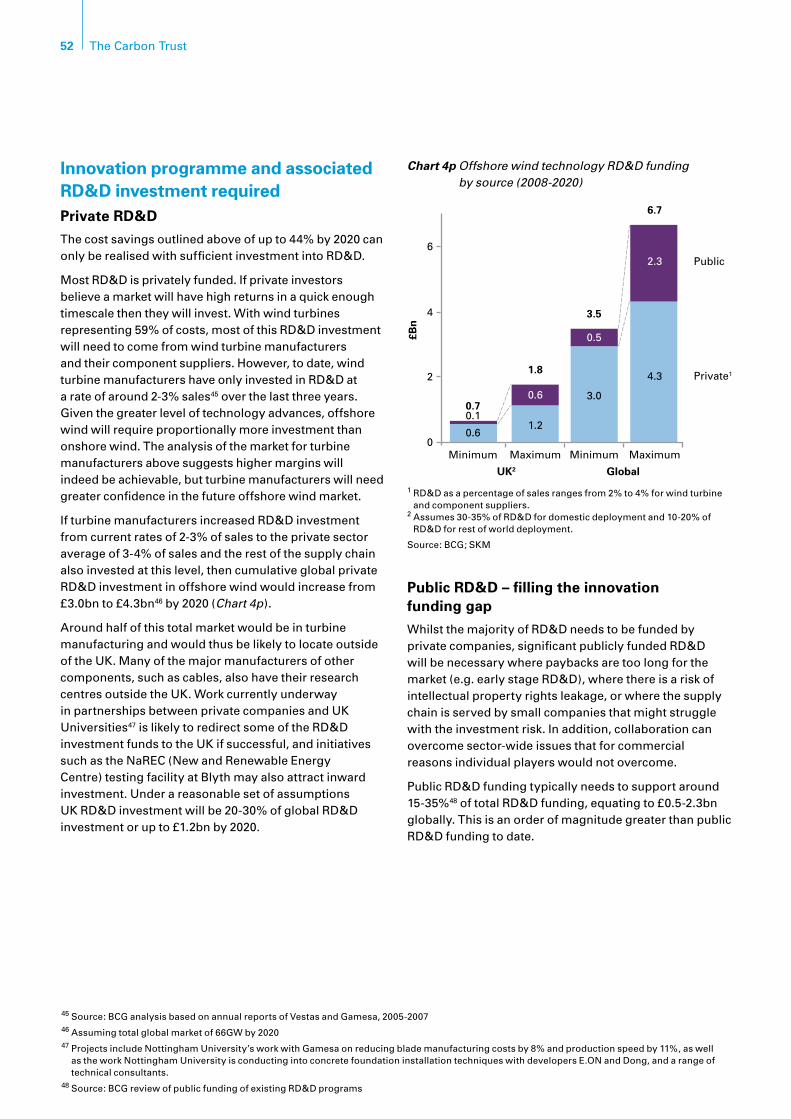
52 The Carbon Trust
Innovation programme and associated RD&D investment requiredPrivate RD&D
The cost savings outlined above of up to 44% by 2020 can only be realised with sufficient investment into RD&D.
Most RD&D is privately funded. If private investors believe a market will have high returns in a quick enough timescale then they will invest. With wind turbines representing 59% of costs, most of this RD&D investment will need to come from wind turbine manufacturers andtheircomponentsuppliers.However,todate,windturbine manufacturers have only invested in RD&D at a rate of around 2-3% sales45 over the last three years. Given the greater level of technology advances, offshore wind will require proportionally more investment than onshore wind. The analysis of the market for turbine manufacturers above suggests higher margins will indeed be achievable, but turbine manufacturers will need greater confidence in the future offshore wind market.
If turbine manufacturers increased RD&D investment from current rates of 2-3% of sales to the private sector average of 3-4% of sales and the rest of the supply chain also invested at this level, then cumulative global private RD&D investment in offshore wind would increase from £3.0bn to £4.3bn46 by 2020 (Chart 4p).
Around half of this total market would be in turbine manufacturing and would thus be likely to locate outside of the UK. Many of the major manufacturers of other components, such as cables, also have their research centres outside the UK. Work currently underway in partnerships between private companies and UK Universities47 is likely to redirect some of the RD&D investment funds to the UK if successful, and initiatives such as the NaREC (New and Renewable Energy Centre) testing facility at Blyth may also attract inward investment. Under a reasonable set of assumptions UK RD&D investment will be 20-30% of global RD&D investment or up to £1.2bn by 2020.
Public RD&D – filling the innovation funding gap
Whilst the majority of RD&D needs to be funded by private companies, significant publicly funded RD&D will be necessary where paybacks are too long for the market (e.g. early stage RD&D), where there is a risk of intellectual property rights leakage, or where the supply chain is served by small companies that might struggle with the investment risk. In addition, collaboration can overcome sector-wide issues that for commercial reasons individual players would not overcome.
Public RD&D funding typically needs to support around 15-35%48 of total RD&D funding, equating to £0.5-2.3bn globally. This is an order of magnitude greater than public RD&D funding to date.
1 RD&D as a percentage of sales ranges from 2% to 4% for wind turbine and component suppliers.
2 Assumes 30-35% of RD&D for domestic deployment and 10-20% of RD&D for rest of world deployment.
Source: BCG; SKM
Chart 4p Offshore wind technology RD&D funding by source (2008-2020)
4
6
Minimum Maximum Minimum Maximum
0.61.2
3.0
4.3
0.7
1.8
3.5
6.7
0.1
0.6
0.5
2.3
GlobalUK2
2
0
£Bn
Public
Private1
45 Source: BCG analysis based on annual reports of Vestas and Gamesa, 2005-200746 Assuming total global market of 66GW by 202047 Projects include Nottingham University’s work with Gamesa on reducing blade manufacturing costs by 8% and production speed by 11%, as well
as the work Nottingham University is conducting into concrete foundation installation techniques with developers E.ON and Dong, and a range of technical consultants.
48 Source: BCG review of public funding of existing RD&D programs
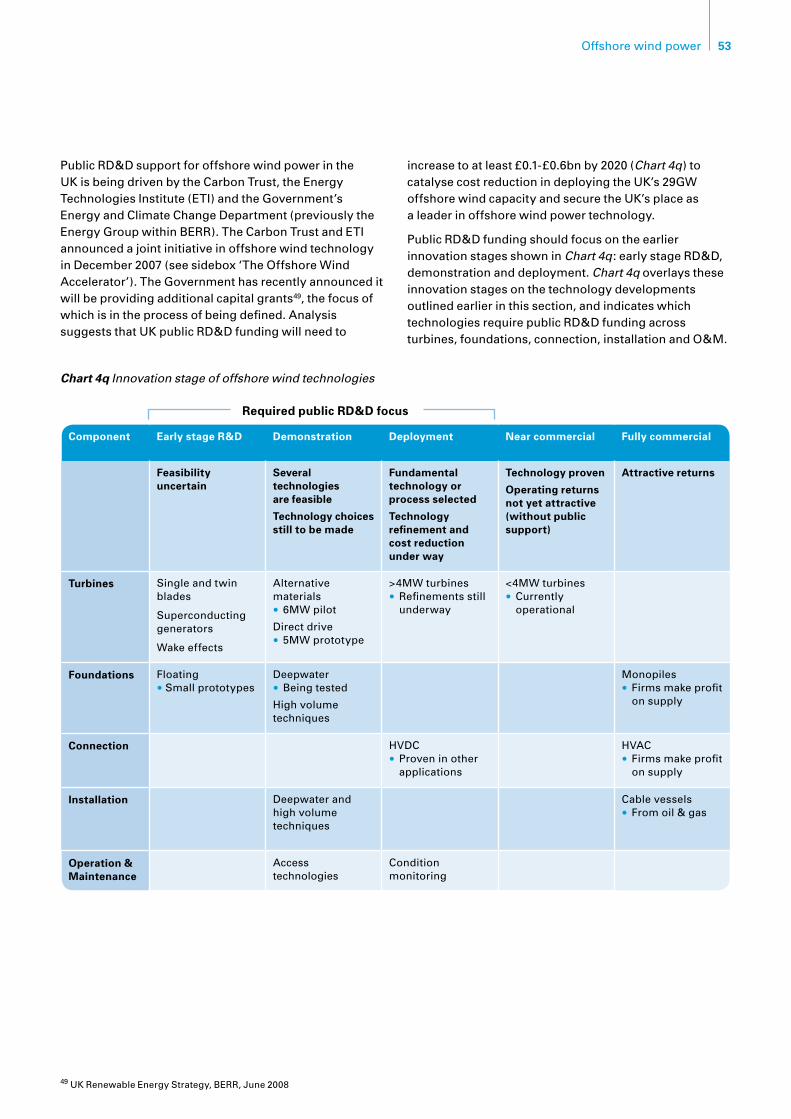
53Offshore wind power
Required public RD&D focus
Component Early stage R&D Demonstration Deployment Near commercial Fully commercial
Feasibility uncertain
Several technologies are feasible
Technology choices still to be made
Fundamental technology or process selected
Technology refinement and cost reduction under way
Technology proven
Operating returns not yet attractive (without public support)
Attractive returns
Turbines Single and twin blades
Superconducting generators
Wake effects
Alternative materials •6MW pilot
Direct drive •5MW prototype
>4MW turbines • Refinements still
underway
<4MW turbines • Currently
operational
Foundations Floating • Small prototypes
Deepwater •Being tested
Highvolumetechniques
Monopiles • Firms make profit
on supply
Connection HVDC •Proven in other
applications
HVAC • Firms make profit
on supply
Installation Deepwater and high volume techniques
Cable vessels •From oil & gas
Operation & Maintenance
Access technologies
Condition monitoring
49 UK Renewable Energy Strategy, BERR, June 2008
Chart 4q Innovation stage of offshore wind technologies
Public RD&D support for offshore wind power in the UK is being driven by the Carbon Trust, the Energy Technologies Institute (ETI) and the Government’s Energy and Climate Change Department (previously the Energy Group within BERR). The Carbon Trust and ETI announced a joint initiative in offshore wind technology in December 2007 (see sidebox ‘The Offshore Wind Accelerator’). The Government has recently announced it will be providing additional capital grants49, the focus of which is in the process of being defined. Analysis suggests that UK public RD&D funding will need to
increase to at least £0.1-£0.6bn by 2020 (Chart 4q) to catalyse cost reduction in deploying the UK’s 29GW offshore wind capacity and secure the UK’s place as a leader in offshore wind power technology.
Public RD&D funding should focus on the earlier innovation stages shown in Chart 4q: early stage RD&D, demonstration and deployment. Chart 4q overlays these innovation stages on the technology developments outlined earlier in this section, and indicates which technologies require public RD&D funding across turbines, foundations, connection, installation and O&M.

54 The Carbon Trust
Of these, foundations should be a key priority for public innovation funding. As outlined in this section, technology advances in foundations are necessary for installation in depths above 30m, for supporting larger and potentially heavier turbines and for realising the second largest opportunity for cost reduction after the turbine. Furthermore, as outlined later in Section 5 under ‘Component manufacturing – a strategic focus for the future’ there is a gap in the foundation supply chain. Large steel fabrication suppliers do not see offshore wind as a core part of their business and small specialist manufacturers could struggle to take on the level of risk and investment required. Global cumulative RD&D funding into foundations will need to range from £550m to £730m by 2020, 2-4 times the amount spent to date. In the UK, public funding of up to £230m should be provided50 for foundation RD&D.
The types of foundation technology that the UK should focus its RD&D funding on largely depends on the extent to which offshore wind site constraints are released. If constraints are not released, the UK will need deep water (>30m) foundations in 2015, soon after they are needed in Germanyin2010-2012.However,ifconstraintsonshallow and mid-depth sites are released, then the UK could not need deep water foundations until around 2017, 5-7 years after Germany. Experience from the onshore wind market suggests that in this case, a ‘fast-follower strategy’ in deep water foundations could be one approach, where the UK piggybacks off the innovation for the German market. Alternatively, given the extent and importance of the innovation required, an ‘option play’ could be appropriate where the UK also develops deep water foundations in case the innovation for the Germany market is not sufficient. Whether the UK develops mid-depth or deeper foundations, it should also focus on developing and demonstrating foundations that have reduced material costs, longer design lives and that can be standardised, mass manufactured and rapidly installed without the need for specialist equipment.
In addition to financial support, suitable test facilities and demonstration sites are critical to enable companies to make the transition from prototype design to deployment. As outlined in the supply chain analysis in Section 5, catalysing market entry will increase competition, encourage innovation and therefore reduce costs.
As mentioned, the UK has the NaREC test facility in Blyth. The UK also has one small demonstration site for foundations and larger turbines, the Beatrice site off the north coast of Scotland owned by the Talisman Oil Company, which completed installation in 2007. This consists of two 5MW REpower turbines installed at a depth of 45m on jacket foundations.
Going forward, the UK needs to bridge the gap between small-scale demonstration and large-scale deployment. The German Government are starting to do this by funding the new Alpha Ventus demonstration site. Multibrid and REpower will each have six 5MW turbines, at a depth of 30m and 43km from shore. It is receiving funding of €225 million, of which €50 million is from the German Government over five years.
These large scale demonstration and deployment projects should be focused in a small number of regional offshore wind technology clusters. Alpha Ventus is located in Bremerhaven, an offshore wind cluster that combines technology RD&D support with local manufacturing support and strong infrastructure, including port facilities. Maximum impact can therefore be achieved by coordinating the UK’s innovation strategy for offshore wind with its manufacturing and supply chain strategy. The synergies between the two are explored in further detail in the next section on the supply chain.
50 50-80% of RD&D for domestic deployment and 20-40% of RD&D for rest of world deployment assumed to be located in the UK. Assumes 15-35% of RD&D funding is publicly funded, based on observations of selected offshore RD&D programmes assumed to be located in the UK.

55Offshore wind power
The Offshore Wind Accelerator
The Offshore Wind Accelerator is structured as a collaboration between the Carbon Trust and five major offshore wind project developers, with each organisation providing funding and helping define and steer the work. Provisionally, the total budget is £30m, towards which the Carbon Trust intends to contribute up to £10m. For the developers, the project is attractive because it helps them share costs and risks in solving common technical problems; for the Carbon Trust, the collaboration allows its public funding to go further and also helps ensure the results of the project are picked up rapidly.
The project’s main objective is to reduce costs. The vision is to reduce the costs of offshore wind energy by at least 10%, through a combination of cost reductions and performance improvements to increase the amount of electricity delivered.
The project will comprise a set of research, development and demonstration (RD&D) activities in the following areas:
Offshore foundations – developing novel forms •of wind turbine foundation with potential for lower capital and installation costs than designs currently in use, including consideration of deep water sites.
Wake effects – consolidating knowledge about •wake effects in large arrays to improve the accuracy of yield assessment processes, allowing wind farm layouts to be optimised and financing costs to be reduced.
Access, logistics and transportation – developing •access systems for wind farm construction and operation that are both economic and safe, to maximise turbine availability and therefore wind farm yields.
Electrical systems – assessing opportunities •to maximise the efficiency of offshore wind farm electrical systems, minimising losses in both the intra-farm array and transmission to shore in order to maximise delivered electricity.
This project is due to commence in late 2008 with feasibility studies in each of the above areas. These are likely to take 12-18 months to complete and, where appropriate, will be followed by large-scale demonstration activities, which are expected to take a further 24-36 months.
www.carbontrust.co.uk/offshorewind
56 The Carbon Trust
IntroductionThe EU 2020 targets imply 29GW of offshore wind in the UK, at a base case capital cost of £65bn over a decade (see Section 2, sidebox ‘Investment required in the development of 29GW of offshore wind power’). This is a challenge and higher than many other commentatorshavesaidispossible.However,theprivatesector has delivered this level of offshore infrastructure before. In the peak development phase of UK North Sea oil & gas the private sector spent the equivalent of £80bn51 on capital expenditure from 1975-1985.
The private sector, the supply chain and investment community has a great capacity to respond to attractive market opportunities. Will this be the case for offshore wind power?
To date, offshore wind power has been a nascent industry. The supply chain in Chart 5a illustrates the extent to which offshore wind currently piggy backs off the onshore wind turbine supply chain and general offshore industries. This is because, with less than 1.1GW of offshore wind power delivered, for most companies in this supply chain offshore wind power has represented a maximum of 10% of sales revenue.
If national governments fully commit to the EU’s renewable energy targets, the offshore wind market will be double the size of the presently planned projects in Europe, and more than an order of magnitude larger than today’s market, with a base case of 58GW of offshore wind power (see Section 1, Chart 1d). This equates to a peak annual installation rate of 10GW, across 10-20 wind farms and associated grid connections, and around 1,300-2000 turbines52 and foundations.
The supply chain’s likely response to this step change can therefore not be addressed by simple extrapolation. So whilst it is important to understand today’s supply chain and its ability to deliver in the short-term, it is even more important to understand the likely supply chain by 2020.
The supply chain has delivered this much before and can deliver this much again – but it needs Government commitment, the right incentives and targeted support.
5. Supply chain
51 At 2007 prices 52 Dependingonthesizeoftheturbine.Hereassumedtobe5-7.5MWby2020
Key findings
The supply chain has delivered this amount of •capacity before both in the case of utilities in the ‘dash for gas’ in the ‘90s and turbine manufacturers in onshore wind over the last decade.
Project developers will need to invest £20bn •per annum by 2020 – risks will need to be reduced to make this attractive.
Offshore wind is currently a niche market – •but has the potential to become strategically important enough for most of the supply chain to warrant the £3.8-5.1bn of investment in new factories required to overcome bottlenecks in the medium term.
Lack of manufacturing scale in foundations •is the largest potential exception.
The market will be also helped by new, credible •players entering in the offshore wind market particularly turbine manufacturers.
An integrated innovation and manufacturing •strategy could create up to 70,000 jobs and £8bn in annual revenues in the UK by 2020.
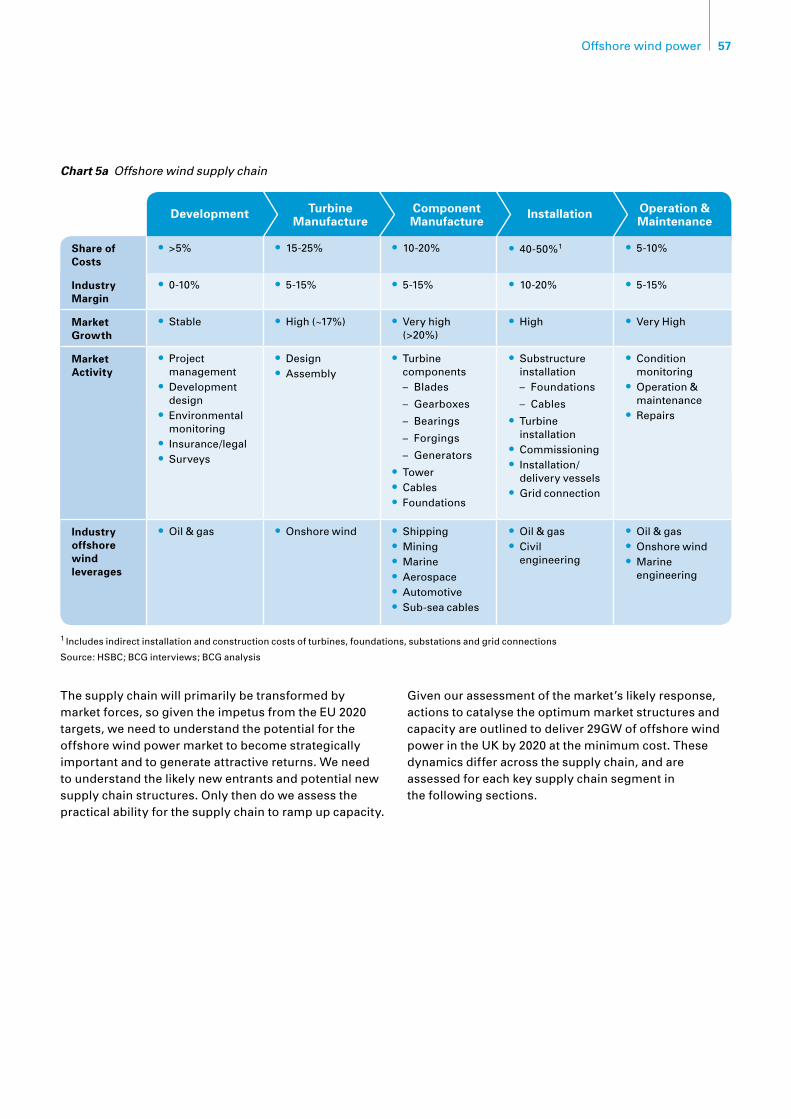
57Offshore wind power
The supply chain will primarily be transformed by market forces, so given the impetus from the EU 2020 targets, we need to understand the potential for the offshore wind power market to become strategically important and to generate attractive returns. We need to understand the likely new entrants and potential new supply chain structures. Only then do we assess the practical ability for the supply chain to ramp up capacity.
Given our assessment of the market’s likely response, actions to catalyse the optimum market structures and capacity are outlined to deliver 29GW of offshore wind power in the UK by 2020 at the minimum cost. These dynamics differ across the supply chain, and are assessed for each key supply chain segment in the following sections.
55Dependingonthesizeoftheturbine.Hereassumetobe5-7.5MWby2020
Chart 5a Offshore wind supply chain
1 Includes indirect installation and construction costs of turbines, foundations, substations and grid connections
Source:HSBC;BCGinterviews;BCGanalysis
Turbine Manufacture
Component Manufacture
Operation & Maintenance
Development Installation
Share of Costs
>5%• 15-25%• 10-20%• 40-50%• 1 5-10%•
Industry Margin
0-10%• 5-15% • 5-15%• 10-20%• 5-15%•
Market Growth
Stable• High(~17%)• Very high •(>20%)
High• VeryHigh•
Market Activity
Project •management Development •design Environmental •monitoringInsurance/legal•Surveys•
Design•Assembly•
Turbine •components
– Blades
– Gearboxes
– Bearings
– Forgings
– Generators
Tower•Cables•Foundations•
Substructure •installation
– Foundations
– Cables
Turbine •installationCommissioning• Installation/ •delivery vesselsGrid connection•
Condition •monitoring Operation & •maintenanceRepairs•
Industry offshore wind leverages
Oil & gas• Onshore wind• Shipping•Mining•Marine•Aerospace•Automotive•Sub-sea cables•
Oil & gas• Civil •engineering
Oil & gas•Onshore wind• Marine •engineering
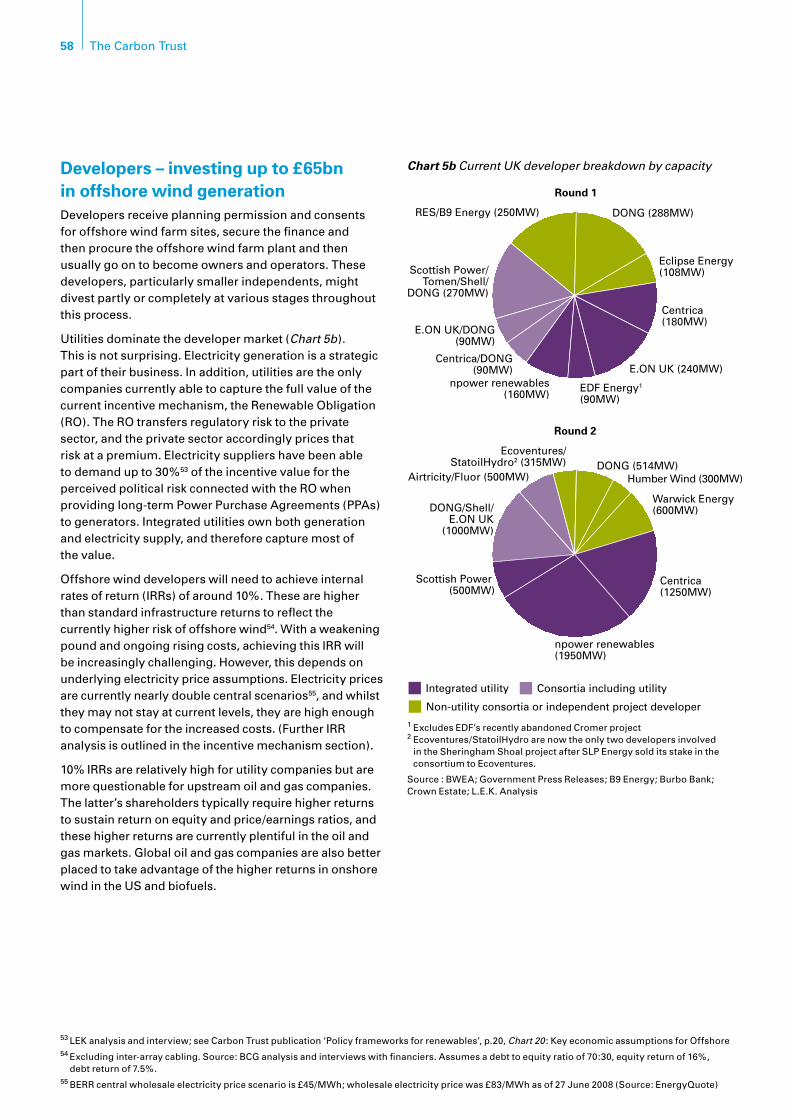
58 The Carbon Trust
Developers – investing up to £65bn in offshore wind generationDevelopers receive planning permission and consents for offshore wind farm sites, secure the finance and then procure the offshore wind farm plant and then usually go on to become owners and operators. These developers, particularly smaller independents, might divest partly or completely at various stages throughout this process.
Utilities dominate the developer market (Chart 5b). This is not surprising. Electricity generation is a strategic part of their business. In addition, utilities are the only companies currently able to capture the full value of the current incentive mechanism, the Renewable Obligation (RO). The RO transfers regulatory risk to the private sector, and the private sector accordingly prices that risk at a premium. Electricity suppliers have been able to demand up to 30%53 of the incentive value for the perceived political risk connected with the RO when providing long-term Power Purchase Agreements (PPAs) to generators. Integrated utilities own both generation and electricity supply, and therefore capture most of the value.
Offshore wind developers will need to achieve internal rates of return (IRRs) of around 10%. These are higher than standard infrastructure returns to reflect the currently higher risk of offshore wind54. With a weakening pound and ongoing rising costs, achieving this IRR will beincreasinglychallenging.However,thisdependsonunderlying electricity price assumptions. Electricity prices are currently nearly double central scenarios55, and whilst they may not stay at current levels, they are high enough to compensate for the increased costs. (Further IRR analysis is outlined in the incentive mechanism section).
10% IRRs are relatively high for utility companies but are more questionable for upstream oil and gas companies. The latter’s shareholders typically require higher returns to sustain return on equity and price/earnings ratios, and these higher returns are currently plentiful in the oil and gas markets. Global oil and gas companies are also better placed to take advantage of the higher returns in onshore wind in the US and biofuels.
53 LEK analysis and interview; see Carbon Trust publication ‘Policy frameworks for renewables’, p.20, Chart 20 : Key economic assumptions for Offshore54 Excluding inter-array cabling. Source: BCG analysis and interviews with financiers. Assumes a debt to equity ratio of 70:30, equity return of 16%,
debt return of 7.5%.55 BERR central wholesale electricity price scenario is £45/MWh; wholesale electricity price was £83/MWh as of 27 June 2008 (Source: EnergyQuote)
Chart 5b Current UK developer breakdown by capacity
1 Excludes EDF’s recently abandoned Cromer project 2Ecoventures/StatoilHydroarenowtheonlytwodevelopersinvolved
in the Sheringham Shoal project after SLP Energy sold its stake in the consortium to Ecoventures.
Source : BWEA; Government Press Releases; B9 Energy; Burbo Bank; Crown Estate; L.E.K. Analysis
Round 1
DONG (288MW)
Eclipse Energy (108MW)
Centrica(180MW)
E.ON UK (240MW)
EDF Energy1 (90MW)
npower renewables(160MW)
Centrica/DONG(90MW)
E.ON UK/DONG(90MW)
Scottish Power/Tomen/Shell/
DONG (270MW)
RES/B9 Energy (250MW)
Round 2
DONG (514MW)Humber Wind (300MW)
Warwick Energy(600MW)
Centrica(1250MW)
npower renewables (1950MW)
Scottish Power (500MW)
DONG/Shell/E.ON UK
(1000MW)
Airtricity/Fluor (500MW)
Ecoventures/StatoilHydro2 (315MW)
Integrated utility Consortia including utility
Non-utility consortia or independent project developer
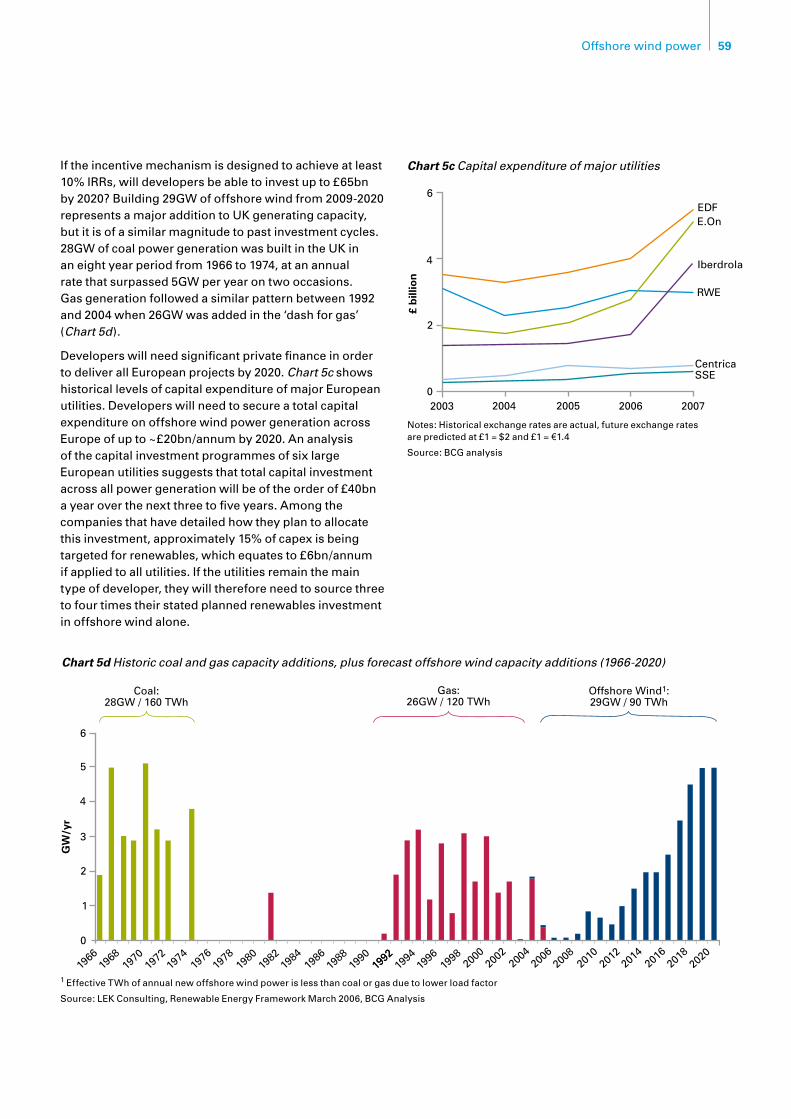
59Offshore wind power
If the incentive mechanism is designed to achieve at least 10% IRRs, will developers be able to invest up to £65bn by 2020? Building 29GW of offshore wind from 2009-2020 represents a major addition to UK generating capacity, but it is of a similar magnitude to past investment cycles. 28GW of coal power generation was built in the UK in an eight year period from 1966 to 1974, at an annual rate that surpassed 5GW per year on two occasions. Gas generation followed a similar pattern between 1992 and 2004 when 26GW was added in the ‘dash for gas’ (Chart 5d).
Developers will need significant private finance in order to deliver all European projects by 2020. Chart 5c shows historical levels of capital expenditure of major European utilities. Developers will need to secure a total capital expenditure on offshore wind power generation across Europeofupto~£20bn/annumby2020.Ananalysisof the capital investment programmes of six large European utilities suggests that total capital investment across all power generation will be of the order of £40bn a year over the next three to five years. Among the companies that have detailed how they plan to allocate this investment, approximately 15% of capex is being targeted for renewables, which equates to £6bn/annum if applied to all utilities. If the utilities remain the main type of developer, they will therefore need to source three to four times their stated planned renewables investment in offshore wind alone.
Chart 5c Capital expenditure of major utilities
Notes:Historicalexchangeratesareactual,futureexchangeratesare predicted at £1 = $2 and £1 = ¤1.4
Source: BCG analysis
4
2003 2004 2005
2
02006 2007
6
£ b
illio
n
EDFE.On
Iberdrola
RWE
CentricaSSE
Chart 5d Historic coal and gas capacity additions, plus forecast offshore wind capacity additions (1966-2020)
1 Effective TWh of annual new offshore wind power is less than coal or gas due to lower load factor
Source: LEK Consulting, Renewable Energy Framework March 2006, BCG Analysis
6
5
3
Coal:28GW / 160 TWh
4
2
1
0
GW
/yr
Gas:26GW / 120 TWh
Offshore Wind1:29GW / 90 TWh
1966
1968
1970
1972
1974
1976
1978
1980
1982
1984
1986
1988
1990
1992
1992
1994
1996
1998
2000
2002
2004
2006
2008
2010
2012
2014
2016
2018
2020

60 The Carbon Trust
As mentioned earlier, there is a precedent for this level of investment in offshore infrastructure; in the peak development phase of UK North Sea oil & gas the private sector spent the equivalent of £80bn (at 2007 prices) on capital expenditure over ten years (1975-1985).
Utilities have less experience of delivering higher risk projects. In addition, financiers will require higher interest rates at the current risk premium of offshore wind. Nevertheless, even if equity returns increased and if debt funding reached equity levels of return56, the IRR required would remain below 12.5%.
Implications for project development
Development risks need to be reduced to match utilities’ risk/return profile and to reduce the cost of finance to ensure IRRs of 10% are sufficient. Risks can be reduced by delivering the recommendations throughout this report, especially improving wind turbine reliability (see technology section), removing the regulatory site, grid and planning barriers (see offshore wind site and grid and planning sections) and the basis of financial support (see Section 6, ‘Performance of the planned banded RO mechanism’).
‘Lowering risk can allow developers to take a lower rate of return… this could be as much as 1-2% lower’
Developer
Development risk can also be addressed through development consortia. The Crown Estate’s proposals for the round 3 of offshore wind farm leases incorporate this mechanism, with consortia bidding for large zones of multiple sites. Furthermore, the Crown Estates is itself taking on some of the development risk up to the point of site consent. This process will also maximise economies of scale, with environmental assessments.
Given the large amount of private finance required, developers will need to actively engage with the finance community. In particular, they will need to demonstrate lower risks than are currently perceived, through delivering round 2 and supporting demonstration projects for future technologies.
56 Source: BCG interviews with financiers. Assume a debt to equity ratio of 70:30, equity return of 19.5%, debt return of 9.5%
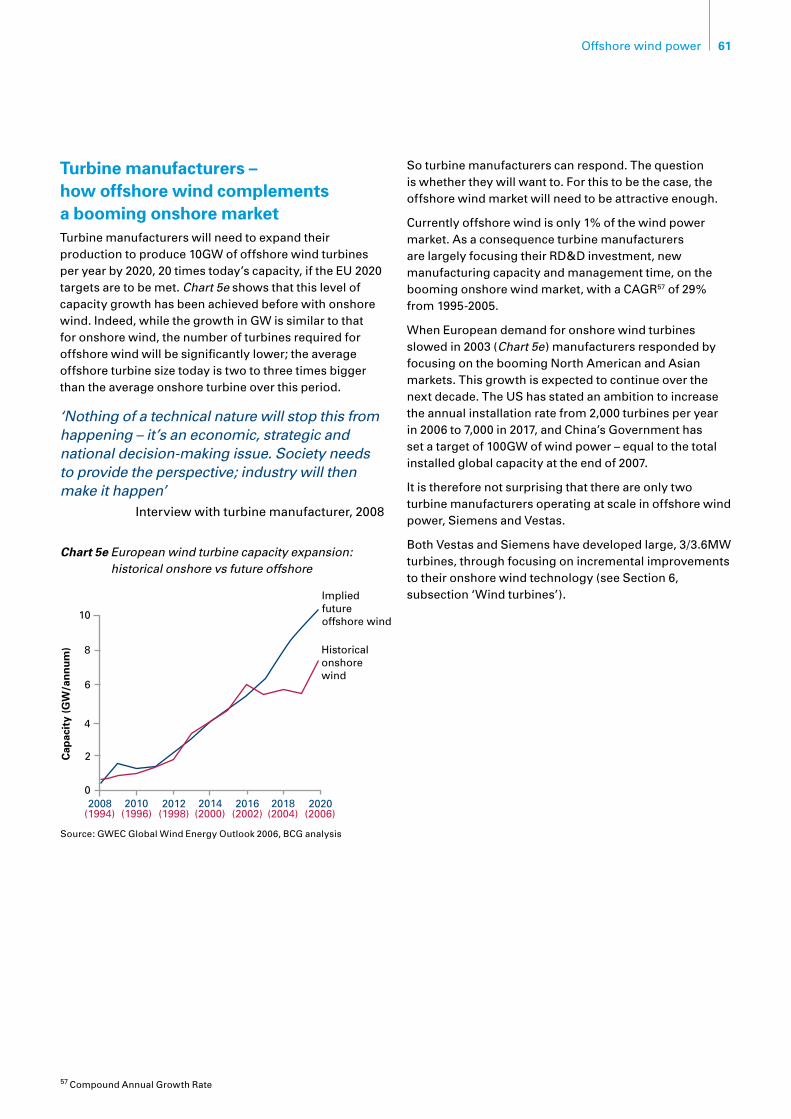
61Offshore wind power
Turbine manufacturers – how offshore wind complements a booming onshore marketTurbine manufacturers will need to expand their production to produce 10GW of offshore wind turbines per year by 2020, 20 times today’s capacity, if the EU 2020 targets are to be met. Chart 5e shows that this level of capacity growth has been achieved before with onshore wind. Indeed, while the growth in GW is similar to that for onshore wind, the number of turbines required for offshore wind will be significantly lower; the average offshore turbine size today is two to three times bigger than the average onshore turbine over this period.
‘Nothing of a technical nature will stop this from happening – it’s an economic, strategic and national decision-making issue. Society needs to provide the perspective; industry will then make it happen’
Interview with turbine manufacturer, 2008
So turbine manufacturers can respond. The question is whether they will want to. For this to be the case, the offshore wind market will need to be attractive enough.
Currently offshore wind is only 1% of the wind power market. As a consequence turbine manufacturers are largely focusing their RD&D investment, new manufacturing capacity and management time, on the booming onshore wind market, with a CAGR57 of 29% from 1995-2005.
When European demand for onshore wind turbines slowed in 2003 (Chart 5e) manufacturers responded by focusing on the booming North American and Asian markets. This growth is expected to continue over the next decade. The US has stated an ambition to increase the annual installation rate from 2,000 turbines per year in 2006 to 7,000 in 2017, and China’s Government has set a target of 100GW of wind power – equal to the total installed global capacity at the end of 2007.
It is therefore not surprising that there are only two turbine manufacturers operating at scale in offshore wind power, Siemens and Vestas.
Both Vestas and Siemens have developed large, 3/3.6MW turbines, through focusing on incremental improvements to their onshore wind technology (see Section 6, subsection ‘Wind turbines’).
Chart 5e European wind turbine capacity expansion: historical onshore vs future offshore
Source: GWEC Global Wind Energy Outlook 2006, BCG analysis
4
2008
2
0
6
Cap
acit
y (G
W/a
nn
um
)
Impliedfutureoffshore wind
Historicalonshorewind
8
10
(1994)2010
(1996)2012
(1998)2014
(2000)2016
(2002)2018
(2004)2020
(2006)
57 Compound Annual Growth Rate
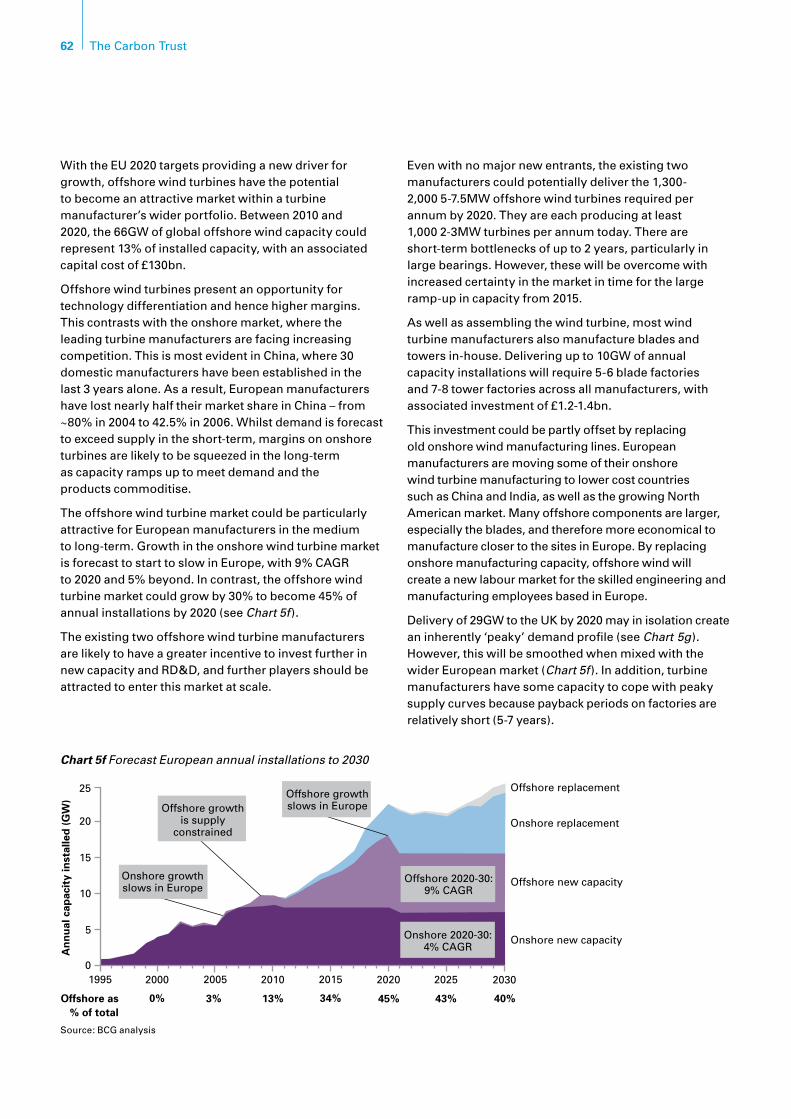
62 The Carbon Trust
With the EU 2020 targets providing a new driver for growth, offshore wind turbines have the potential to become an attractive market within a turbine manufacturer’s wider portfolio. Between 2010 and 2020, the 66GW of global offshore wind capacity could represent 13% of installed capacity, with an associated capital cost of £130bn.
Offshore wind turbines present an opportunity for technology differentiation and hence higher margins. This contrasts with the onshore market, where the leading turbine manufacturers are facing increasing competition. This is most evident in China, where 30 domestic manufacturers have been established in the last 3 years alone. As a result, European manufacturers have lost nearly half their market share in China – from ~80%in2004to42.5%in2006.Whilstdemandisforecastto exceed supply in the short-term, margins on onshore turbines are likely to be squeezed in the long-term as capacity ramps up to meet demand and the products commoditise.
The offshore wind turbine market could be particularly attractive for European manufacturers in the medium to long-term. Growth in the onshore wind turbine market is forecast to start to slow in Europe, with 9% CAGR to 2020 and 5% beyond. In contrast, the offshore wind turbine market could grow by 30% to become 45% of annual installations by 2020 (see Chart 5f ).
The existing two offshore wind turbine manufacturers are likely to have a greater incentive to invest further in new capacity and RD&D, and further players should be attracted to enter this market at scale.
Even with no major new entrants, the existing two manufacturers could potentially deliver the 1,300-2,000 5-7.5MW offshore wind turbines required per annum by 2020. They are each producing at least 1,000 2-3MW turbines per annum today. There are short-term bottlenecks of up to 2 years, particularly in largebearings.However,thesewillbeovercomewithincreased certainty in the market in time for the large ramp-up in capacity from 2015.
As well as assembling the wind turbine, most wind turbine manufacturers also manufacture blades and towers in-house. Delivering up to 10GW of annual capacity installations will require 5-6 blade factories and 7-8 tower factories across all manufacturers, with associated investment of £1.2-1.4bn.
This investment could be partly offset by replacing old onshore wind manufacturing lines. European manufacturers are moving some of their onshore wind turbine manufacturing to lower cost countries such as China and India, as well as the growing North American market. Many offshore components are larger, especially the blades, and therefore more economical to manufacture closer to the sites in Europe. By replacing onshore manufacturing capacity, offshore wind will create a new labour market for the skilled engineering and manufacturing employees based in Europe.
Delivery of 29GW to the UK by 2020 may in isolation create an inherently ‘peaky’ demand profile (see Chart 5g). However,thiswillbesmoothedwhenmixedwiththewider European market (Chart 5f ). In addition, turbine manufacturers have some capacity to cope with peaky supply curves because payback periods on factories are relatively short (5-7 years).
Source: BCG analysis
Chart 5f Forecast European annual installations to 2030
Offshore replacement
Onshore replacement
Offshore new capacity
Onshore new capacity
20
5
01995 20052000 2010 2015
Offshore as% of total
2020 2025 2030
0% 3% 13% 34% 45% 43% 40%
10
An
nu
al c
apac
ity
inst
alle
d (
GW
)
15
25
Offshore 2020-30:9% CAGR
Onshore 2020-30:4% CAGR
Offshore growthslows in EuropeOffshore growth
is supplyconstrained
Onshore growthslows in Europe
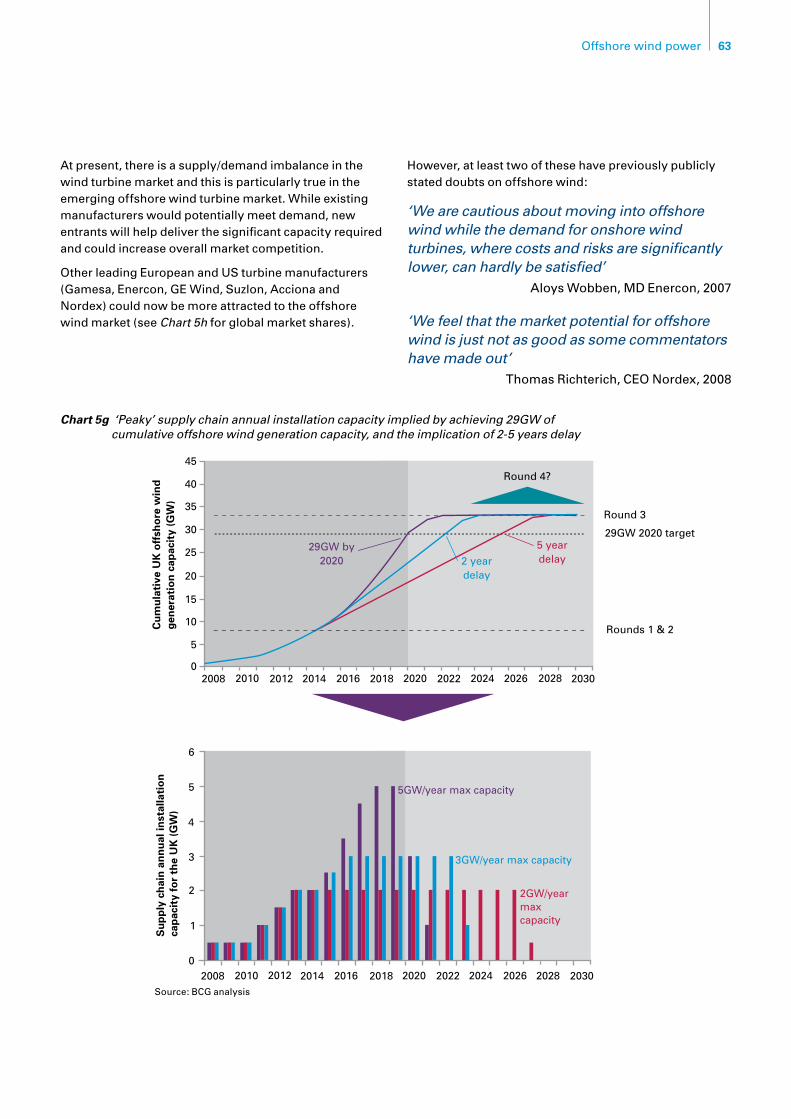
63Offshore wind power
At present, there is a supply/demand imbalance in the wind turbine market and this is particularly true in the emerging offshore wind turbine market. While existing manufacturers would potentially meet demand, new entrants will help deliver the significant capacity required and could increase overall market competition.
Other leading European and US turbine manufacturers (Gamesa, Enercon, GE Wind, Suzlon, Acciona and Nordex) could now be more attracted to the offshore wind market (see Chart 5h for global market shares).
However,atleasttwoofthesehavepreviouslypubliclystated doubts on offshore wind:
‘We are cautious about moving into offshore wind while the demand for onshore wind turbines, where costs and risks are significantly lower, can hardly be satisfied’
Aloys Wobben, MD Enercon, 2007
‘We feel that the market potential for offshore wind is just not as good as some commentators have made out’
Thomas Richterich, CEO Nordex, 2008
Chart 5g ‘Peaky’ supply chain annual installation capacity implied by achieving 29GW of cumulative offshore wind generation capacity, and the implication of 2-5 years delay
1
02008 20122010 2014 2018 2024 2026 2030
Su
pp
ly c
hai
n a
nn
ual
inst
alla
tio
n
cap
acit
y fo
r th
e U
K (
GW
)
2
3
4
5
6
5GW/year max capacity
3GW/year max capacity
2GW/yearmax capacity
2016 2020 2022 2028
Round 4?
Round 3
Rounds 1 & 2
20
5
02008 20122010 2014 2018 2024 2026 2030
10Cu
mu
lati
ve U
K o
ffsh
ore
win
dg
ener
atio
n c
apac
ity
(GW
)
15
29GW 2020 target
25
30
35
40
45
29GW by2020 2 year
delay
5 yeardelay
- - - - - - - - - - - - - - - - - - - - - - - - - - - - - - - - - - - - - - - - - - - - - -
- - - - - - - - - - - - - - - - - - - - - - - - - - - - - - - - - - - - - - - - - - - - - -
................................................................................................
2016 2020 2022 2028
Source: BCG analysis
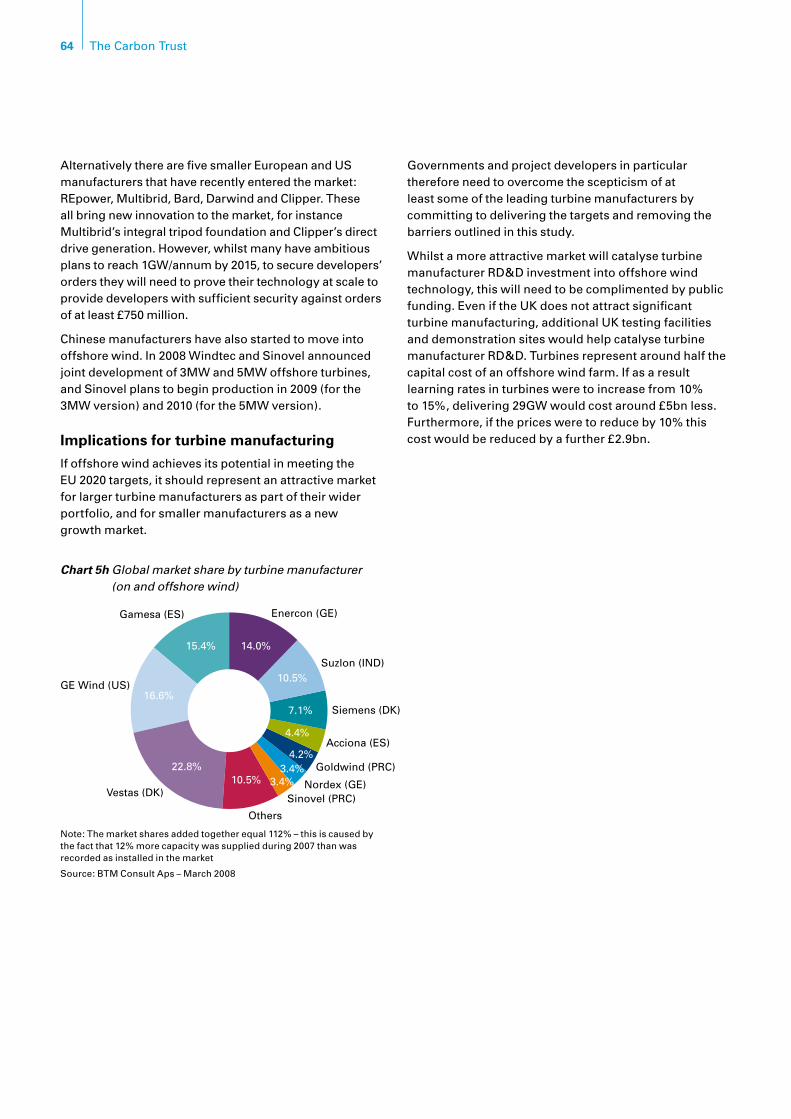
64 The Carbon Trust
Alternatively there are five smaller European and US manufacturers that have recently entered the market: REpower, Multibrid, Bard, Darwind and Clipper. These all bring new innovation to the market, for instance Multibrid’s integral tripod foundation and Clipper’s direct drivegeneration.However,whilstmanyhaveambitiousplans to reach 1GW/annum by 2015, to secure developers’ orders they will need to prove their technology at scale to provide developers with sufficient security against orders of at least £750 million.
Chinese manufacturers have also started to move into offshore wind. In 2008 Windtec and Sinovel announced joint development of 3MW and 5MW offshore turbines, and Sinovel plans to begin production in 2009 (for the 3MW version) and 2010 (for the 5MW version).
Implications for turbine manufacturing
If offshore wind achieves its potential in meeting the EU 2020 targets, it should represent an attractive market for larger turbine manufacturers as part of their wider portfolio, and for smaller manufacturers as a new growth market.
Governments and project developers in particular therefore need to overcome the scepticism of at least some of the leading turbine manufacturers by committing to delivering the targets and removing the barriers outlined in this study.
Whilst a more attractive market will catalyse turbine manufacturer RD&D investment into offshore wind technology, this will need to be complimented by public funding. Even if the UK does not attract significant turbine manufacturing, additional UK testing facilities and demonstration sites would help catalyse turbine manufacturer RD&D. Turbines represent around half the capital cost of an offshore wind farm. If as a result learning rates in turbines were to increase from 10% to 15%, delivering 29GW would cost around £5bn less. Furthermore, if the prices were to reduce by 10% this cost would be reduced by a further £2.9bn.
Note: The market shares added together equal 112% – this is caused by the fact that 12% more capacity was supplied during 2007 than was recorded as installed in the market
Source: BTM Consult Aps – March 2008
Acciona (ES)
Siemens (DK)
Suzlon (IND)
Enercon (GE)
Others
Sinovel (PRC)Nordex (GE)
Goldwind (PRC)
Gamesa (ES)
GE Wind (US)
Vestas (DK)
14.0%
10.5%
7.1%
4.4%
4.2%3.4%
3.4%10.5%22.8%
16.6%
15.4%
Chart 5h Global market share by turbine manufacturer (on and offshore wind)

65Offshore wind power
Component manufacturing – a strategic focus for the futureWith the exception of blades, the majority of a wind turbine’s components are sourced from specialist manufacturers, mostly based in Europe (see Chart 5i for an overview of key component manufacturers). As well as tendering for the turbines, developers usually directly tender for cables, substations and foundations, each again being manufactured by different companies.
There are currently bottlenecks in some parts of this supply chain, in particular: gearboxes, bearings, forgings, cables, substations/transformers and vessels. These have led to lead times of up to 3 years for some components.
Turbine manufacturers have responded by vertically integrating with gearbox and generator manufacturers. For instance, Siemens took over Winergy in 2005 and SuzlonacquiredHansenin2006;windturbinesrepresents100% and 70% of revenues of these acquired companies.
For most of the manufacturers in the supply chain, wind turbines have been a relatively unimportant market. They constitute only 5-10% of their revenues, compared to larger, more stable markets in mining, marine, traditional power generation, construction, heavy industry, automotive and oil and gas.
Many of these other markets have been at peaks in their cycles, for instance heavy industry, shipping and oil & gas. Manufacturers have historically been reluctant to invest in new capacity until cycles move off these peaks. In the short-term, supply constraints are likely to remain.
In the medium- to long-term, the share of component manufacturers’ markets in wind is expected to double to 10-20%, which is strategically large enough to invest in new capacity.
If turbines become much bigger then fewer component manufacturers, in what are already concentrated markets, will be able to supply the larger scale components, e.g. large bearings and forgings.
Chart 5j illustrates that to satisfy the European growth implied by the EU 2020 targets, only about 30 factories need to be constructed across all these industries, with each industry requiring between 1 and 8 new factories/extensions by 2020.
A small number of factories would need to be built or extended immediately to relieve supply constraints although in the medium term most existing companies can cope with the implied growth in capacity. The requirement for new factories does not start to build again until 2011, and only becomes significant for the start of round 3 in 2015. New factories/extensions have build times of 1-2 years and so can be built in time. Whilst UK demand would be ‘peaky’ if 29GW were supplied by 2020, payback times on the new factories would be short, potential further global growth and repowering of existing capacity from 2020 would offset the reduction in demand and otherwise factories could be converted to manufacture for other markets.
Most components manufacturers will be able to raise the finance required. These 30 factories would require an investment of £3.8-5.1bn. Most of the manufacturers in the supply chain are large-cap companies or subsidiaries thereof.
Offshore wind foundation manufacturing on the other hand is either a relatively small niche for large-cap companies such as Corus or carried out by small manufacturers. Conversely, foundations require the greatest increase in new factories (7-8), new technologies to support larger turbines in mid-depth and deep water and new, higher volume manufacturing techniques to deliver economies of scale. Representing 15% of capital costs,itiscriticalthesearerealised.However,itisnotclear whether offshore wind will be a large enough market for the existing large-scale manufacturers or whether the smaller manufacturers will be able to invest in the required RD&D and manufacturing capabilities.
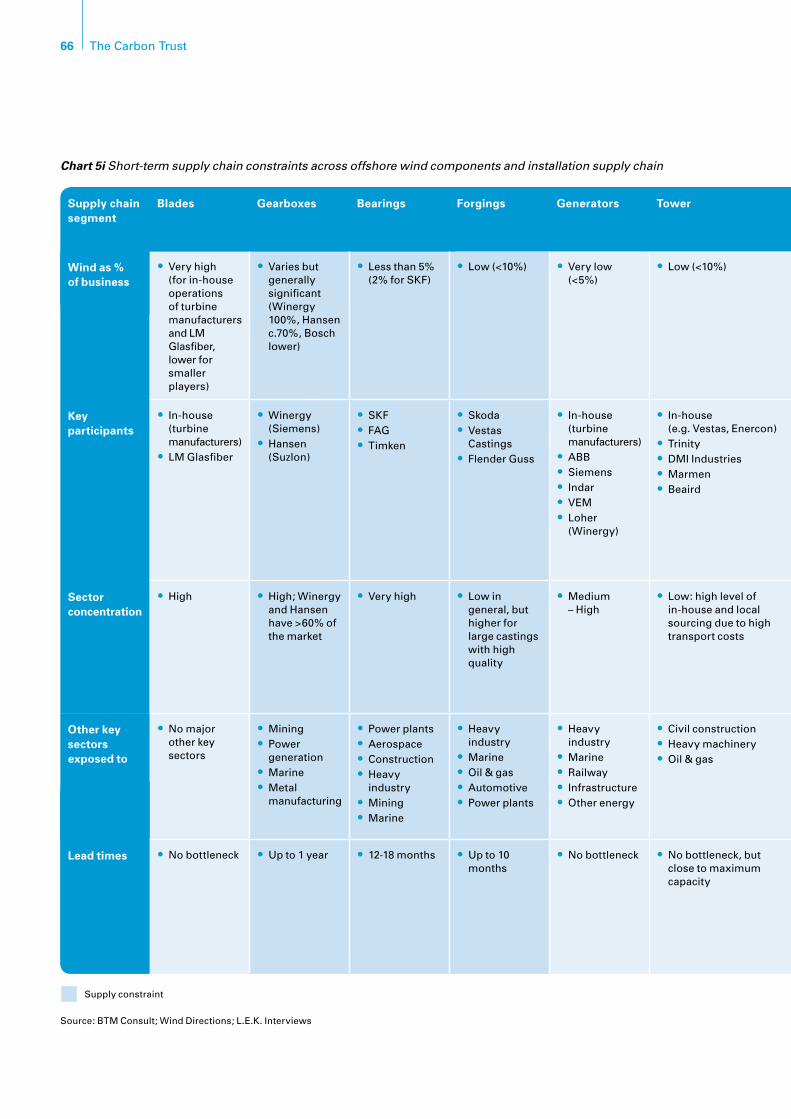
66 The Carbon Trust
Chart 5i Short-term supply chain constraints across offshore wind components and installation supply chain
Supply chain segment
Blades Gearboxes Bearings Forgings Generators Tower Foundations Cables Offshore cable laying and installation
Substations Substructure installation
Turbine installation
Wind as % of business
Very high •(for in-house operations of turbine manufacturers and LM Glasfiber, lower for smaller players)
Varies but •generally significant (Winergy 100%,Hansenc.70%, Bosch lower)
Less than 5% •(2% for SKF)
Low (<10%)• Very low •(<5%)
Low (<10%)• Low (<10%)• Low (<10%)• Medium• Low •(10% for Areva)
c.20%• c.30%•
Key participants
In-house •(turbine manufacturers)LM Glasfiber•
Winergy •(Siemens)Hansen•(Suzlon)
SKF•FAG•Timken•
Skoda•Vestas •CastingsFlender Guss•
In-house •(turbine manufacturers)ABB•Siemens•Indar•VEM•Loher •(Winergy)
In-house •(e.g. Vestas, Enercon)Trinity•DMI Industries•Marmen•Beaird•
Hojgaard•Corus•
ABB•Prysmian•Nexans•
ABB•Prysmian•Nexans•Marine Projects •International (MPI)Ocean Team•Global Marine •Systems
Areva•ABB•Siemens•
Ballast Nedam•A2SEA•Marine •Projects International – MPISeacore•
A2SEA•Marine •Projects International – MPISeacore•
Sector concentration
High• High;Winergy•andHansenhave >60% of the market
Very high• Low in •general, but higher for large castings with high quality
Medium •–High
Low: high level of •in-house and local sourcing due to high transport costs
High• Very high• Medium-High• Very high; •regulatory relationships mean little competition
High• High•
Other key sectors exposed to
No major •other key sectors
Mining•Power •generationMarine•Metal •manufacturing
Power plants•Aerospace•Construction•Heavy•industryMining•Marine•
Heavy•industryMarine•Oil & gas•Automotive•Power plants•
Heavy•industryMarine•Railway•Infrastructure•Other energy•
Civil construction•Heavymachinery•Oil & gas•
Construction•Heavy•machineryOil & gas•Marine•Automotive•
Oil & gas•International power •transmissionOnshore wind•National grids•Telecommunication•
Oil & gas•Power networks•Telecommunication•Civil •construction
National Grid•Utilities•Power stations•Onshore wind•Offshore oil •& gas
Oil & gas•Civil engineering•
Lead times No bottleneck• Up to 1 year• 12-18 months• Up to 10 •months
No bottleneck• No bottleneck, but •close to maximum capacity
No bottleneck• Backlogs of up to 2 •years
Expected shortage •of installation vessels if additional projects go ahead
Transformer •components have a 2-2.5 year lead timeLead time of 2-4 •years to get connected to the grid
Seasonal and cyclical•Currently short•
Supply constraint
Source: BTM Consult; Wind Directions; L.E.K. Interviews
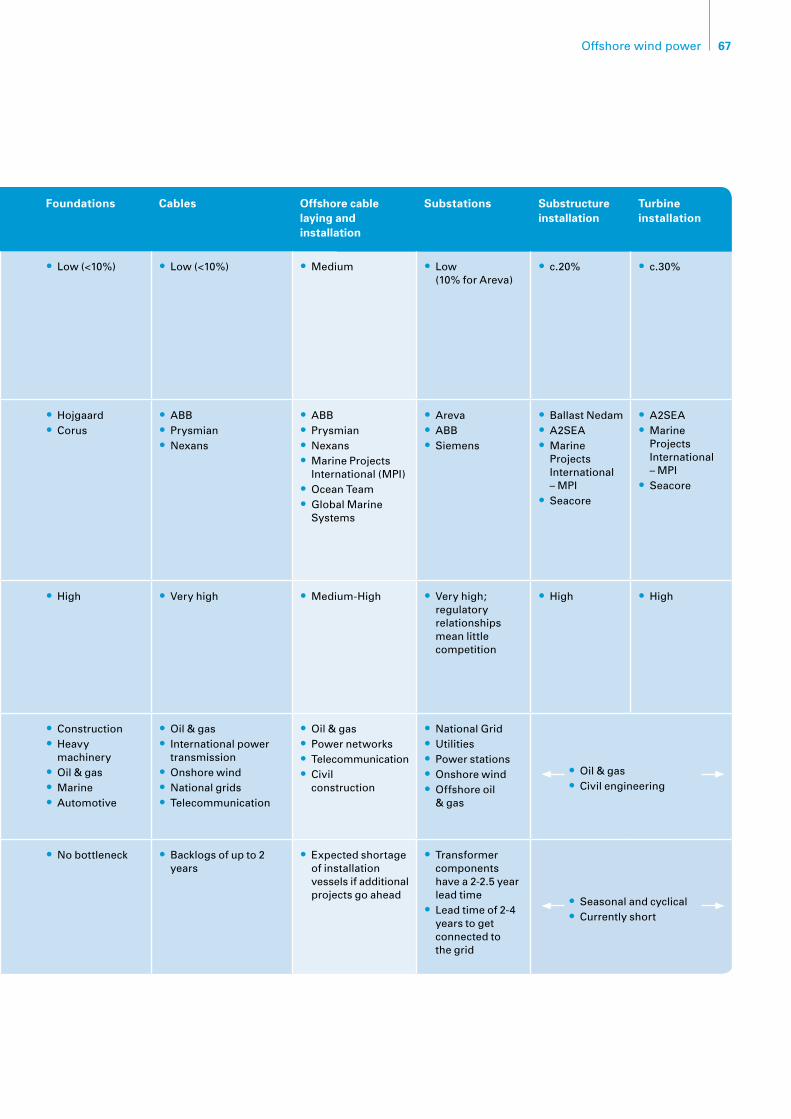
67Offshore wind power
Supply chain segment
Blades Gearboxes Bearings Forgings Generators Tower Foundations Cables Offshore cable laying and installation
Substations Substructure installation
Turbine installation
Wind as % of business
Very high •(for in-house operations of turbine manufacturers and LM Glasfiber, lower for smaller players)
Varies but •generally significant (Winergy 100%,Hansenc.70%, Bosch lower)
Less than 5% •(2% for SKF)
Low (<10%)• Very low •(<5%)
Low (<10%)• Low (<10%)• Low (<10%)• Medium• Low •(10% for Areva)
c.20%• c.30%•
Key participants
In-house •(turbine manufacturers)LM Glasfiber•
Winergy •(Siemens)Hansen•(Suzlon)
SKF•FAG•Timken•
Skoda•Vestas •CastingsFlender Guss•
In-house •(turbine manufacturers)ABB•Siemens•Indar•VEM•Loher •(Winergy)
In-house •(e.g. Vestas, Enercon)Trinity•DMI Industries•Marmen•Beaird•
Hojgaard•Corus•
ABB•Prysmian•Nexans•
ABB•Prysmian•Nexans•Marine Projects •International (MPI)Ocean Team•Global Marine •Systems
Areva•ABB•Siemens•
Ballast Nedam•A2SEA•Marine •Projects International – MPISeacore•
A2SEA•Marine •Projects International – MPISeacore•
Sector concentration
High• High;Winergy•andHansenhave >60% of the market
Very high• Low in •general, but higher for large castings with high quality
Medium •–High
Low: high level of •in-house and local sourcing due to high transport costs
High• Very high• Medium-High• Very high; •regulatory relationships mean little competition
High• High•
Other key sectors exposed to
No major •other key sectors
Mining•Power •generationMarine•Metal •manufacturing
Power plants•Aerospace•Construction•Heavy•industryMining•Marine•
Heavy•industryMarine•Oil & gas•Automotive•Power plants•
Heavy•industryMarine•Railway•Infrastructure•Other energy•
Civil construction•Heavymachinery•Oil & gas•
Construction•Heavy•machineryOil & gas•Marine•Automotive•
Oil & gas•International power •transmissionOnshore wind•National grids•Telecommunication•
Oil & gas•Power networks•Telecommunication•Civil •construction
National Grid•Utilities•Power stations•Onshore wind•Offshore oil •& gas
Oil & gas•Civil engineering•
Lead times No bottleneck• Up to 1 year• 12-18 months• Up to 10 •months
No bottleneck• No bottleneck, but •close to maximum capacity
No bottleneck• Backlogs of up to 2 •years
Expected shortage •of installation vessels if additional projects go ahead
Transformer •components have a 2-2.5 year lead timeLead time of 2-4 •years to get connected to the grid
Seasonal and cyclical•Currently short•
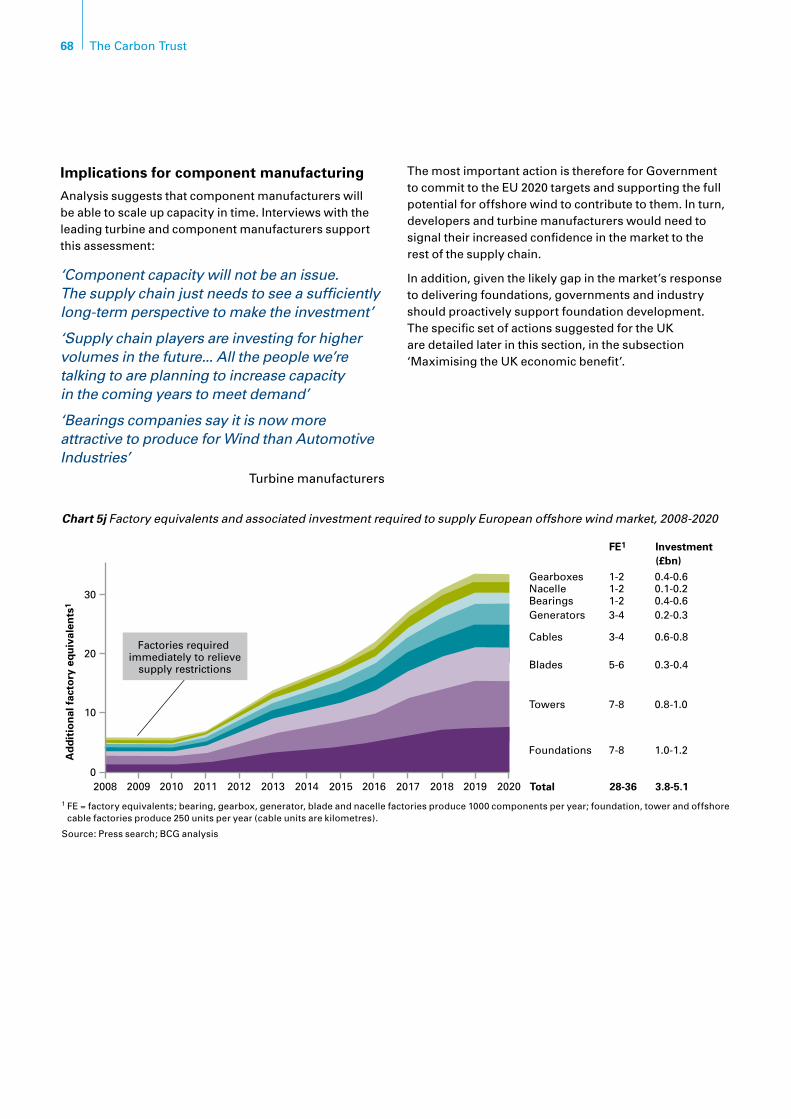
68 The Carbon Trust
Implications for component manufacturing
Analysis suggests that component manufacturers will be able to scale up capacity in time. Interviews with the leading turbine and component manufacturers support this assessment:
‘Component capacity will not be an issue. The supply chain just needs to see a sufficiently long-term perspective to make the investment’
‘Supply chain players are investing for higher volumes in the future... All the people we’re talking to are planning to increase capacity in the coming years to meet demand’
‘Bearings companies say it is now more attractive to produce for Wind than Automotive Industries’
Turbine manufacturers
The most important action is therefore for Government to commit to the EU 2020 targets and supporting the full potential for offshore wind to contribute to them. In turn, developers and turbine manufacturers would need to signal their increased confidence in the market to the rest of the supply chain.
In addition, given the likely gap in the market’s response to delivering foundations, governments and industry should proactively support foundation development. The specific set of actions suggested for the UK are detailed later in this section, in the subsection ‘Maximising the UK economic benefit’.
Total 28-36 3.8-5.1
20
02008 20102009 2013 2015 2016 2017 2020
10
Ad
dit
ion
al f
acto
ry e
qu
ival
ents
1
30
Factories required immediately to relieve
supply restrictions
20122011 2014 20192018
Gearboxes 1-2 0.4-0.6Nacelle 1-2 0.1-0.2Bearings 1-2 0.4-0.6Generators 3-4 0.2-0.3
Cables 3-4 0.6-0.8
Blades 5-6 0.3-0.4
Towers 7-8 0.8-1.0
Foundations 7-8 1.0-1.2
FE1 Investment (£bn)
Chart 5j Factory equivalents and associated investment required to supply European offshore wind market, 2008-2020
1 FE = factory equivalents; bearing, gearbox, generator, blade and nacelle factories produce 1000 components per year; foundation, tower and offshore cable factories produce 250 units per year (cable units are kilometres).
Source: Press search; BCG analysis

69Offshore wind power
Installation – from a nascent to a growth industryInstallation companies own and operate the vessels that install the offshore wind foundations, wind turbines and inter-array and grid connection cables. These vessels are described in Section 4, subsection ‘Installation’ and shown in Chart 4k.
The installation market represents around 5-10% of the total offshore wind power market (by revenues). To date, it has been dominated by relatively small companies, with revenues up to the tens of millions of pounds (see Chart 5i). For instance, the market leader of turbine installation, A2Sea, has installed more than 75% of all turbines with three vessels.
In the past, the offshore wind market has been a poor alternative to more lucrative oil & gas and other civil engineering markets. Indeed, with expected installations delayed by planning and other complications, the companies Mayflower, Marine Projects International and Mammoet Van Oord all faced difficulties, the former going bankrupt, the latter having to sell its Jumping Jack barge to A2Sea.
‘…While supplying components is straightforward, installation is more difficult and involves risks outside the supplier’s control e.g. weather risk, seabed risk…’
Cable Manufacturer and Installer
Now, however, vessels are tied up with full order books and long-term contracts (LTCs). A2Sea has a two-year wait time. Oceanteam has ordered four new vessels, which already have LTCs. MVO has chartered back the Jumping Jack it sold to complete its orders.
‘Installation vessels absolutely are the supply chain limit before turbines’
Turbine manufacturer, 2007
With such a small pool of specialised vehicles, any complication has a knock-on impact on other developments. Difficulties have occurred on some projects (e.g. E.ON had to lease the Resolution from Centrica when the Sea Jack collapsed and a leg of the Lisa A sank into the seabed) and the need to find alternative vessels has resulted in significant delays.
To meet the EU 2020 target, the global annual installation capacity will need to increase more than tenfold, from 0.4-1GW p.a. to 10GW per annum. In the UK alone, by 2019/2020 an average of five turbines would need to be installed per day58.
Whilst many existing vessels can be converted to install today’s monopile foundations and 3MW turbines, there are few vessels that are able to install 5MW and larger turbines or in depths beyond 30m.
Nevertheless, sufficient vessels can be built to meet demand in the medium term. Chart 5k shows that to deliver the EU 2020 targets across Europe requires 17-33 vessels. 5MW turbines and deep water installations are not likely to be the norm until 2016 or later. There is therefore sufficient time, given a 3-4 year period to get a new boat on the market.
The ‘peaky demand’ implied by 29GW in the UK by 2020 would create an issue were it not to be balanced by growth in the remaining global market. Vessels have a 8-10 year payback period, longer than factories. In this scenario, non-specialist vessels could sell to other markets, but specialist vessels, potentially required for installation of larger 5MW turbines in deep waters could face more volatile returns.
58 Assuming that the weather conditions are suitable for 200 days of the year
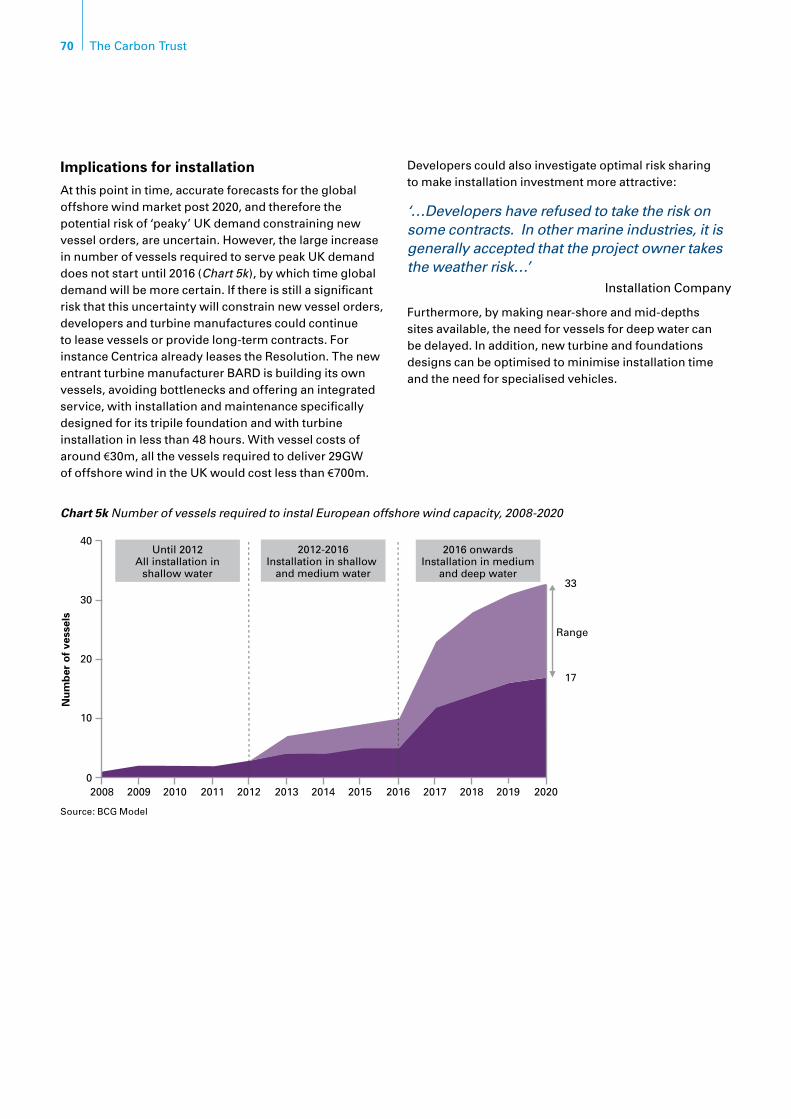
70 The Carbon Trust
Implications for installation
At this point in time, accurate forecasts for the global offshore wind market post 2020, and therefore the potential risk of ‘peaky’ UK demand constraining new vesselorders,areuncertain.However,thelargeincreasein number of vessels required to serve peak UK demand does not start until 2016 (Chart 5k), by which time global demand will be more certain. If there is still a significant risk that this uncertainty will constrain new vessel orders, developers and turbine manufactures could continue to lease vessels or provide long-term contracts. For instance Centrica already leases the Resolution. The new entrant turbine manufacturer BARD is building its own vessels, avoiding bottlenecks and offering an integrated service, with installation and maintenance specifically designed for its tripile foundation and with turbine installation in less than 48 hours. With vessel costs of around €30m, all the vessels required to deliver 29GW of offshore wind in the UK would cost less than €700m.
Developers could also investigate optimal risk sharing to make installation investment more attractive:
‘…Developers have refused to take the risk on some contracts. In other marine industries, it is generally accepted that the project owner takes the weather risk…’
Installation Company
Furthermore, by making near-shore and mid-depths sites available, the need for vessels for deep water can be delayed. In addition, new turbine and foundations designs can be optimised to minimise installation time and the need for specialised vehicles.
20
02008 20102009 2013 2015 2016 2017 2020
10
Nu
mb
er o
f ve
ssel
s
30
Until 2012All installation in
shallow water
20122011 2014 20192018
2012-2016Installation in shallow
and medium water
2016 onwardsInstallation in medium
and deep water
17
33
Range
- - -
- - -
- - -
- - -
- - -
- - -
- - -
- - -
- - -
- - -
- - -
- - -
- - -
- - -
- - -
-
- - -
- - -
- - -
- - -
- - -
- - -
- - -
- - -
- - -
- - -
- - -
- - -
- - -
- - -
- - -
- 40
Chart 5k Number of vessels required to instal European offshore wind capacity, 2008-2020
Source: BCG Model
71Offshore wind power
Operation and maintenance – innovation in the supply chainSpecialist vessels and access systems are also required for planned service, maintenance and minor repairs. These are currently much smaller vessels operated by small companies/operations out of the nearest UK port (some turbine manufacturers offer service contracts). Major maintenance and repairs require the installation companies above.
The new technologies for monitoring, accessing and maintaining turbines in the future could all be provided by new entrants which over time consolidate into integrated, larger operation and maintenance companies based out of the major ports. In the long-term, if offshore wind farms are further out to sea, it is not inconceivable that these companies would base their employees on large, on-site platforms similar to the oil rig communities for oil and gas. These in turn would leverage the similar skill sets and resources required to service these communities.
‘…There is also a need for better access to turbines. Remote monitoring, turbine design for maintenance phase (e.g. onboard crane), and a fleet of different O&M vessels are necessary developments…’
Project Manager
Implications across the supply chain
Until now, the offshore wind market has not been attractive enough for most companies in the supply chain to warrant the required level of investment. Developers’ margins have been hit by rising costs, turbine manufacturers have focused on the booming onshore wind market and offshore wind has represented less than 5% of sales for much of the rest of the supply chain.
Short-term bottlenecks are therefore a symptom of a supply/demand imbalance across all the markets the supply chain delivers to (onshore wind, mining, infrastructure) and the offshore wind market not being a strategic priority for most of the supply chain.
With the EU targets implying 58GW of installed capacity by 2020 and a significant further global market, offshore wind could become a strategic priority. Whilst bottlenecks are likely to remain in the short-term, they can be overcome by the time growth in capacity really needs to accelerate in 2015.
Nevertheless, there are three key areas that will require government focus to prevent market failure:
1. Reduce risks and increase returns for developers: Developers will need to invest up to £20bn/annum across Europe in offshore wind. If utilities continue to dominate this market, which seems likely – they will need to divert investment funds to offshore wind and invest three to four times their total planned renewable investment in offshore wind alone. To make this investment attractive enough will require risks to be reduced and returns increased, the former principally through regulatory reform in grid and planning (Section 3) and technology developments (Section 4) and the latter through releasing site constraints to reduce costs and in ensuring the incentive regime delivers (covered further in the next section).
2. Facilitate turbine RD&D improvements and deployment: Government will need to support existing and new manufacturers to develop, test and deploy robust and lower cost turbines at scale. Policies should include coordinating partnerships and providing integrated packages of RD&D, testing facilities and demonstration sites.
3. Provide targeted support to mitigate potential supply chain failure: It is unclear whether the offshore wind foundation market will be important enough for the large companies (Fluor, Corus) and whether the smaller companies have the capabilities to transform the manufacturing process from batch production to mass manufacturing. It is therefore likely that governments will need to support RD&D, demonstration and manufacturing in this market.
72 The Carbon Trust
Maximising the UK economic benefitIntroduction
The UK Government will most likely need to support the 29GW of offshore wind as it progresses down the cost curve, primarily in the form of the incentive mechanism but also through RD&D and demonstration grants. It might therefore want to capture the maximum amount of economic benefit, in the form of economic activity, taxes and jobs, from both the UK’s 29GW and from exports for the remaining 37GW of global capacity by 2020. In addition, local manufacturing acts as a natural hedge against exchange rate fluctuations; at present UK developers receive their revenues in sterling but the majority of their costs are denominated in Euros.
66GW of global offshore wind power capacity by 2020 will create between 150-200,000 jobs59 and £23bn of annual revenues in 2020. This is comparable to the 150,000 people currently employed in the EU onshore wind market. The UK’s 29GW of offshore wind will create 80,000 to 100,000 jobs and £12.5bn of annual revenues in 2020.
Most of these revenues and jobs will be in manufacturing and installation (54%), followed by the service sector (25%), operations and maintenance (O&M) (12%) and lastly RD&D, engineering and design (9%).
However,onlytheO&MindustryfortheUK’s29GWofcapacity will naturally be located in the UK due to the need for proximity to the wind farms. The other parts of the supply do not necessarily need to be located locally.
The opportunity and rationale for capturing a greater share of economic value and jobs varies for each part of the supply chain. These are therefore assessed in turn.
RD&D, Engineering and Design
In Section 4’s ‘Innovation programme and associated RD&D investment required’ subsection, we outlined that global private RD&D in offshore wind power could be as much as £4.3bn up to 2020. Around half of this would be in turbine manufacturing and would thus be likely to locate outside of the UK. Many of the major manufacturers of other components, such as cables, alsohavetheirresearchcentresoutsidetheUK.However,investing up to £0.1-0.6bn in public RD&D funding and delivering the innovation program outlined in Section 4, building on existing partnerships between private companies and UK Universities60 and initiatives such as the NaREC61 testing facility at Blyth, all focused in a small number of offshore wind technology clusters, could catalyse up to £1.2bn in private RD&D in the UK. This would in turn create 2,500-3,500 RD&D, engineering and design jobs.
Turbine and component manufacturing
In recent years European wind power manufacturing has been concentrated in Germany, Denmark and Spain. In 2004 Germany had 50,000 jobs in its wind industry62; of these 40,000 were in production-related roles and 10,000 were in services. This translated into €4.0bn of salaries and benefit payments63, equal to 38% of the global total. However,ofthe50,000jobsonly29%werefocusedonthe domestic market; the remaining 71% were providing goods and services for export. This focus on exports looks set to continue, with many of the new offshore start up companies choosing Germany for their base (e.g. BARD, Multibrid, REpower). As the home of Vestas and Siemens Wind Power, Denmark will also continue to be a major exporter of wind technology. The existence of a strong export market will aid in delivering on the UK’s ambitious growth trajectory, but it could also result in much of the job creation occurring in other markets.
59 Source: BCG analysis60 Projects include Nottingham University’s work with Gamesa on reducing blade manufacturing costs by 8% and production timescales by 11%, as
well as the work Nottingham University is conducting into concrete foundation installation techniques with developers E.ON and Dong, as well as a range of technical consultants.
61 New and Renewable Energy Centre62 Most recent data available63 VDMA presentation to the Canadian Chamber of Commerce from 2005
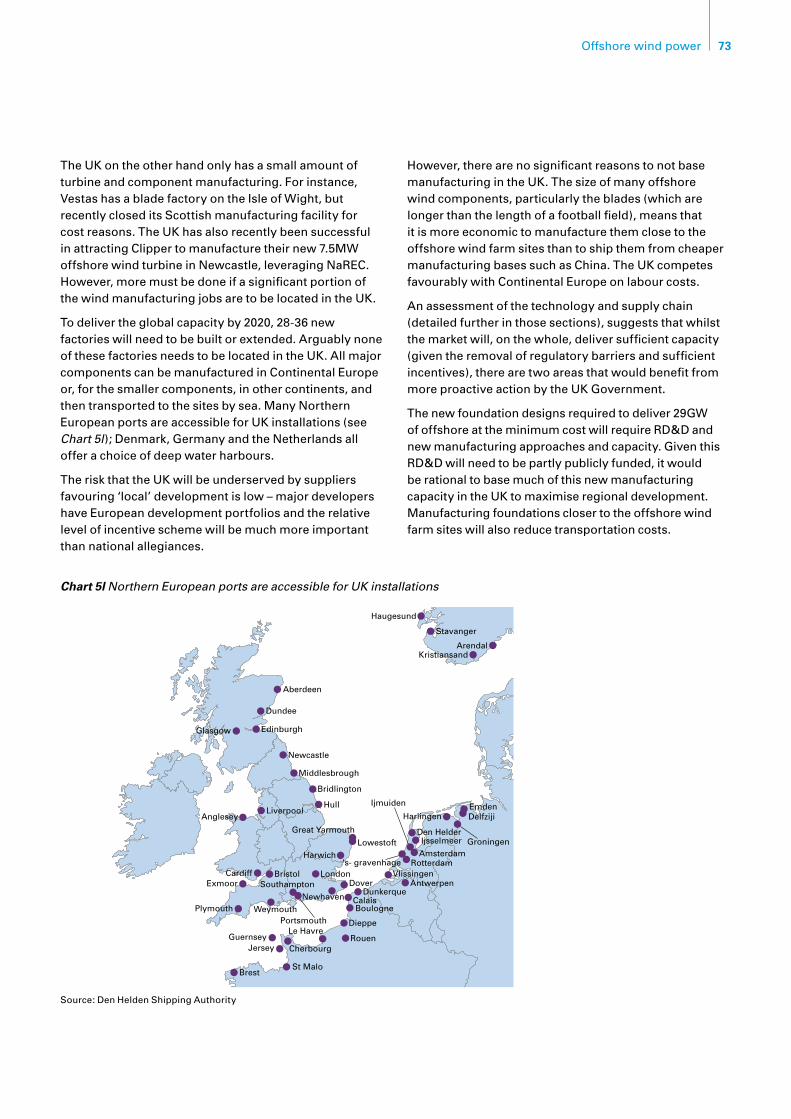
73Offshore wind power
Aberdeen
Dundee
EdinburghGlasgow
Newcastle
Middlesbrough
Bridlington
HullLiverpool
Anglesey
Great Yarmouth
LowestoftHarwich
London's- gravenhage
Dover
Newhaven
Southampton
PortsmouthWeymouthPlymouth
BristolCardiffExmoor
Brest
GuernseyJersey
St Malo
Cherbourg
Le HavreRouen
Dieppe
BoulogneCalais
DunkerqueAntwerpen
VlissingenRotterdam
Amsterdam
Ijmuiden
IjsselmeerDen Helder
Harlingen
Groningen
DelfzijiEmden
Haugesund
Stavanger
KristiansandArendal
Chart 5l Northern European ports are accessible for UK installations
Source:DenHeldenShippingAuthority
The UK on the other hand only has a small amount of turbine and component manufacturing. For instance, Vestas has a blade factory on the Isle of Wight, but recently closed its Scottish manufacturing facility for cost reasons. The UK has also recently been successful in attracting Clipper to manufacture their new 7.5MW offshore wind turbine in Newcastle, leveraging NaREC. However,moremustbedoneifasignificantportionofthe wind manufacturing jobs are to be located in the UK.
To deliver the global capacity by 2020, 28-36 new factories will need to be built or extended. Arguably none of these factories needs to be located in the UK. All major components can be manufactured in Continental Europe or, for the smaller components, in other continents, and then transported to the sites by sea. Many Northern European ports are accessible for UK installations (see Chart 5l); Denmark, Germany and the Netherlands all offer a choice of deep water harbours.
The risk that the UK will be underserved by suppliers favouring ‘local’ development is low – major developers have European development portfolios and the relative level of incentive scheme will be much more important than national allegiances.
However,therearenosignificantreasonstonotbasemanufacturing in the UK. The size of many offshore wind components, particularly the blades (which are longer than the length of a football field), means that it is more economic to manufacture them close to the offshore wind farm sites than to ship them from cheaper manufacturing bases such as China. The UK competes favourably with Continental Europe on labour costs.
An assessment of the technology and supply chain (detailed further in those sections), suggests that whilst the market will, on the whole, deliver sufficient capacity (given the removal of regulatory barriers and sufficient incentives), there are two areas that would benefit from more proactive action by the UK Government.
The new foundation designs required to deliver 29GW of offshore at the minimum cost will require RD&D and new manufacturing approaches and capacity. Given this RD&D will need to be partly publicly funded, it would be rational to base much of this new manufacturing capacity in the UK to maximise regional development. Manufacturing foundations closer to the offshore wind farm sites will also reduce transportation costs.
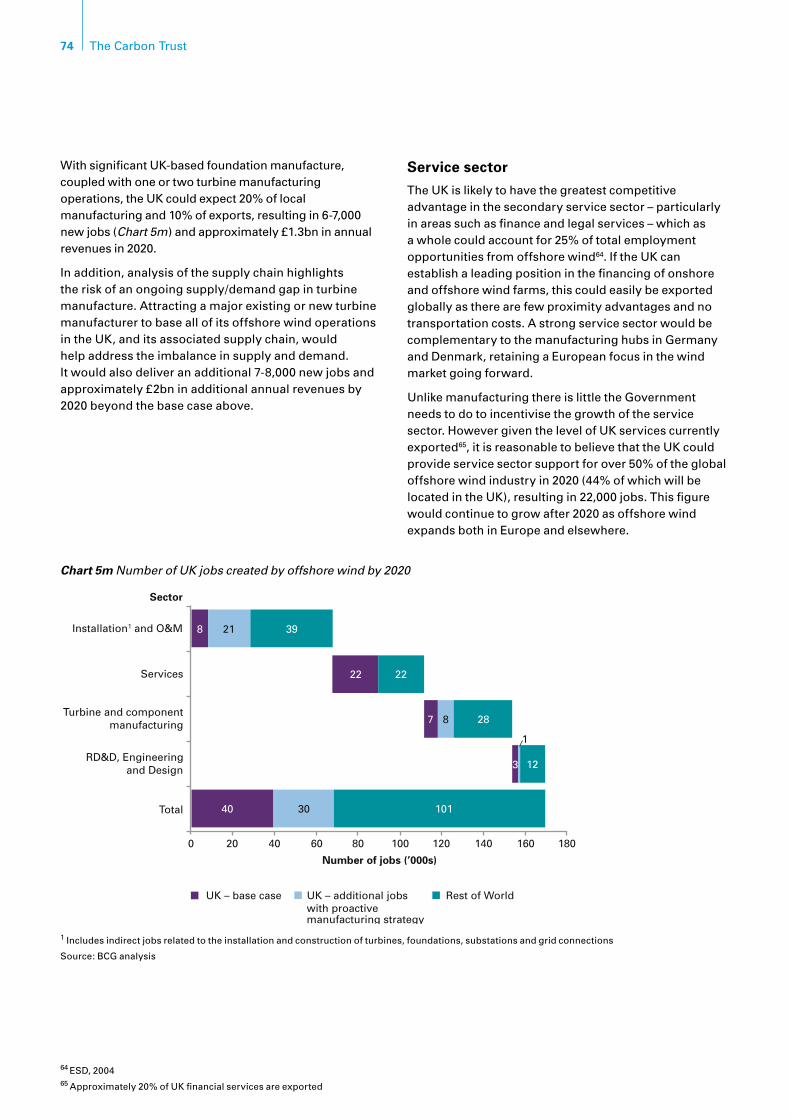
74 The Carbon Trust
With significant UK-based foundation manufacture, coupled with one or two turbine manufacturing operations, the UK could expect 20% of local manufacturing and 10% of exports, resulting in 6-7,000 new jobs (Chart 5m) and approximately £1.3bn in annual revenues in 2020.
In addition, analysis of the supply chain highlights the risk of an ongoing supply/demand gap in turbine manufacture. Attracting a major existing or new turbine manufacturer to base all of its offshore wind operations in the UK, and its associated supply chain, would help address the imbalance in supply and demand. It would also deliver an additional 7-8,000 new jobs and approximately £2bn in additional annual revenues by 2020 beyond the base case above.
Service sector
The UK is likely to have the greatest competitive advantage in the secondary service sector – particularly in areas such as finance and legal services – which as a whole could account for 25% of total employment opportunities from offshore wind64. If the UK can establish a leading position in the financing of onshore and offshore wind farms, this could easily be exported globally as there are few proximity advantages and no transportation costs. A strong service sector would be complementary to the manufacturing hubs in Germany and Denmark, retaining a European focus in the wind market going forward.
Unlike manufacturing there is little the Government needs to do to incentivise the growth of the service sector.HowevergiventhelevelofUKservicescurrentlyexported65, it is reasonable to believe that the UK could provide service sector support for over 50% of the global offshore wind industry in 2020 (44% of which will be located in the UK), resulting in 22,000 jobs. This figure would continue to grow after 2020 as offshore wind expands both in Europe and elsewhere.
64 ESD, 200465 Approximately 20% of UK financial services are exported
Chart 5m Number of UK jobs created by offshore wind by 2020
40 60 80 100 140 160 180200
RD&D, Engineeringand Design
Turbine and componentmanufacturing
Installation1 and O&M
Services
Total
8 21 39
22 22
3
1
12
7 8 28
40 30 101
Number of jobs (’000s)
120
Sector
UK – base case UK – additional jobs with proactive
Rest of World
manufacturing strategy
>60m0-50m0-40m 0-50m
Concrete Monopile Tripod Tri-pile Jacket Floating
0-40m 0-30m
chart 7n
chart 6l
1 Includes indirect jobs related to the installation and construction of turbines, foundations, substations and grid connections
Source: BCG analysis
75Offshore wind power
Installation, Operations and Maintenance (O&M)
The UK will naturally accrue O&M jobs and associated revenues because these services need to be located near the offshore wind farm sites. This allows for reductions in transport time and outage periods, thereby reducing costs and maximising revenues. Even without any Government intervention the UK is likely to secure 80-100% of the O&M industry required to support 29GW of offshore wind, resulting in 7,000-9,000 new jobs with associated annual revenue of £0.7bn in 2020. These jobs will be more ‘sticky’ than manufacturing employment as they are driven by installed capacity rather than annual capacity additions.
The UK could also deliver a significant proportion of the installation if it were to leverage the similar skills sets in its North Sea oil and gas industry. 15% of oil and gas jobs are mechanical/electrical/marine construction – an available workforce of around 40,000. As North Sea oil and gas production decreases, these employees could transfer their skills to offshore wind power installation and O&M.
Given this, 55-60% of UK installation should be readily achievable. Combined with O&M, a total 25,000-30,000 jobs could be created and around £4bn in annual revenues by 2020, i.e. create a market for more than half the current North Sea oil & gas employees with these skill sets.
However,tohavesuchalargeinstallationandO&Mindustry in the UK, will require sufficient port resources.
Port development
To capitalise on the economic opportunities above, particularly those in installation and O&M, the UK will need to develop its port infrastructure. Current levels of port capacity in the UK are too low to support the growth of the offshore wind supply chain, particularly in areas likely to be development hubs such as the east coast of England and the North West. Many existing ports offer insufficient access for large vessels, quaysides that cannot support the weight of large turbine components, a lack of space for new manufacturing, operations and lay-down facilities, or some combination of all three factors.
Historically,portshavebeenunwillingtoinvest.Offshorewind has represented a small proportion (less than 5%) of their business, and the booming oil and gas market has been a more attractive alternative to the historically uncertain demand of offshore wind installation and O&M.
A combination of public and private funding will continue to be required to support UK port development. Regional Development Agencies and councils will need to provide the bulk of the public funding. The East of England Development Agency (EEDA) is leading the way with £8.7 million funding66 for the £50 million new outer harbour at Great Yarmouth (Eastport), estimated to be completed by 2009. The Port Company is expecting around 1550 offshore support vessel entries totalling nearly 3 million gross tons each year.
‘We have in the past handled offshore wind farm business through Lowestoft and we are looking to do more of that in the future’
Lowestoft Port Manager, 2008
Port development should be just one component in regional ‘centres of excellence’. The UK should follow a similar model to that in Bremerhaven in Germany, which provides port facilities close to its Alpha Ventus turbine and foundation testing and demonstration facility and local manufacturers.
66 Financial support to Great Yarmouth (Eastport) also provided by Norfolk county council, Great Yarmouth Borough Council and the European Regional Development Fund

76 The Carbon Trust
Skills development
Skill shortages are already being cited as a concern by supply chain players, a situation that will get worse as the industry expands. Greater investment in training and skills development is urgently required to ensure that the UK delivers a skilled workforce capable of building the UK supply chain, particularly given the long lead times associated with education. Training centres of excellence similar to those supporting the nuclear industry need to be established, ideally in regions where skills and experience in offshore oil and gas can be utilised to accelerate the learning process for offshore wind.
Conclusion
Without any action by the Government, UK industry will naturally benefit from the growth in the offshore wind industry, particularly the service sector and the installation and O&M market. This should lead to up to 40,000 jobs by 2020.
However,proactivegovernmentsupportcould increase this to up to 70,000 jobs and £8bn in annual revenues by 2020 from both delivering 29GW of offshore wind capacity in the UK and serving the export market. The most effective approach is an integrated RD&D, innovation and manufacturing strategy. The Government should provide a package of RD&D funding, testing and demonstration facilities, land and funding for new factories and port infrastructure, focused around centres of excellence. It should focus these on the gaps in the supply chain identified in the previous section, especially in turbines and foundations.
77Offshore wind power
IntroductionThe main pillar of the current renewable energy policy framework is the Renewables Obligation (RO), which obligates electricity suppliers to source a certain percentage of their electricity from renewable power generators or pay a buy-out price. Generators receive Renewable Obligation Certificates (ROCs) for each MWh they produce (see the side box ‘Renewables Obligation’ at the end of this section). The value of ROCs varies depending on the gap between that year’s target and the actual level of renewable power generation. At the momentROCscost~£50/MWh70.
Currently all renewable technologies receive one ROC for each megawatt hour of electricity generated. Under this single level of support, the more mature, lower cost technologies have sufficient financial incentive to invest, however the financial case for offshore wind and other less mature technologies has been less attractive. In 2006 the Carbon Trust’s ‘Policy Frameworks for Renewables’ study analysed a number of alternative mechanisms to overcome this issue, including a stepped feed-in tariff option and banded RO option. Whilst the former was demonstrated to be the most efficient, policy makers chose the banded RO option to minimise potential uncertainty and deployment disruption.
Under the banded RO proposal, from 2009 onshore wind continues to receive one ROC for each MWh of electricity generated, offshore wind receives 1.5 ROCs and emerging technologies, including marine, will receive 2 ROCs. In Scotland tidal energy will receive 3 ROCs and wave energy 5 ROCs.
Currently suppliers spread the cost of ROCs across all UK electricity consumers, corresponding to an increaseof~2%toadomesticenergybill.
Changes to the incentive mechanism are required to deliver more than twice previous renewable electricity generation targets and cope with a potential new paradigm of high electricity prices. Care should be taken to minimise disruption to short-term delivery.
6. Incentive mechanism
67 BERR’s central case wholesale electricity price scenario is £45/MWh68 Wholesale electricity price of £83/MWh as at 27 June 2008, Source: EnergyQuote69 Assumes relaxation of some of the UK buffer zone, relaxation of multiple hard and soft offshore wind farm constraints and a medium technology
learning rate (weighted average of 13%).70 Source: Oxera
Key findings
The amount of incentive required is dependent •on offshore wind power costs and wholesale electricity prices.
At central electricity price scenarios• 67 the incentive will need to be extended – plans for a banded RO will only support 11-12GW of offshore wind.
The incentive mechanism needs to follow offshore •wind power down its cost curve to reduce the amount of public funding required to deliver renewable electricity generation – either through periodic adjustment to the RO (as proposed by the Government) or moving to a feed-in tariff. This will reduce public funding over the lifetime of the incentive mechanism by up to £15bn in present value terms.
If electricity prices continue to remain much higher •than central electricity scenarios68, much less incentive would be required – offshore wind power could potentially become cost competitive before 202069 if electricity prices remain at current levels. To cope with short-term fluctuation in electricity prices implies a need to index the RO to electricity prices or a move to a feed-in tariff, whichever option will minimise short-term disruption to the industry.
78 The Carbon Trust
71 Source: Oxera, BCG analysis72 UKRenewable Energy Strategy Consultation, June 2008
Performance of the planned banded RO mechanismThe current end date and target for the banded RO would not deliver sufficient renewables, including offshore wind, to meet the UK’s share of the EU 2020 targets. The obligation is capped to deliver a maximum of 20% of electricity from renewables by 2020, and has an end date of 2027. As a result the RO would incentivise a maximum of 12GW of offshore wind and 7GW of onshore wind by 2020, with total public funding over the lifetime of the incentive mechanism of £31.5bn71 in present value terms.
In addition, if offshore wind power capital costs continue to increase, at central electricity price scenarios the RO might not be sufficient to deliver even Round 2’s 8GW of offshore wind capacity.
The Government is therefore considering a number of options for the optimum incentive mechanism to deliver the EU 2020 renewable energy targets72.
Options to drive offshore wind developmentIn considering alternative policy frameworks to the banded RO regime, this study reviewed the following four options consistent with meeting the 2020 renewable energy target:
1. Increased RO – with constant bands: the mechanics of the banded RO are maintained but its lifetime is extended, its obligation target increased to 32% and capped at 40%. ROC bands are kept constant.
2. Increased RO – with adjusted bands: as option 1 above, but the ROC bands are periodically changed over time, as proposed by the Government.
3. Stepped feed-in tariff (FIT): replacing the RO with a fixed tariff tailored for each renewable technology. Tariffs are independent of electricity price and are ‘stepped’ down periodically for future projects with expected cost reduction.
4. Transition to FIT for round 3: transition onshore and offshore wind developments to a stepped feed-in tariff from the start of round 3 (2015).
Details of these options are set out in the side box ‘Alternative policies to drive offshore wind development’ at the end of this section.
These options are first evaluated at central electricity prices; the impact of a possible new paradigm of high electricity prices is then considered later on in this section.
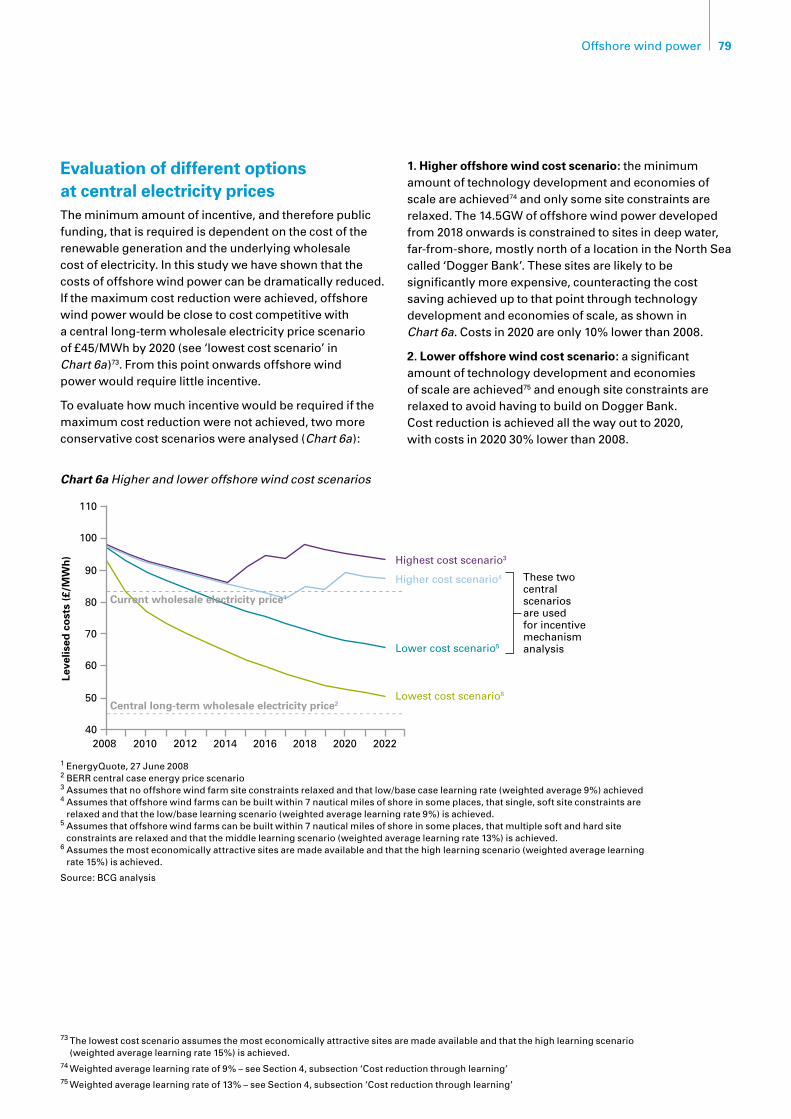
79Offshore wind power
Evaluation of different options at central electricity pricesThe minimum amount of incentive, and therefore public funding, that is required is dependent on the cost of the renewable generation and the underlying wholesale cost of electricity. In this study we have shown that the costs of offshore wind power can be dramatically reduced. If the maximum cost reduction were achieved, offshore wind power would be close to cost competitive with a central long-term wholesale electricity price scenario of £45/MWh by 2020 (see ‘lowest cost scenario’ in Chart 6a)73. From this point onwards offshore wind power would require little incentive.
To evaluate how much incentive would be required if the maximum cost reduction were not achieved, two more conservative cost scenarios were analysed (Chart 6a):
1. Higher offshore wind cost scenario: the minimum amount of technology development and economies of scale are achieved74 and only some site constraints are relaxed. The 14.5GW of offshore wind power developed from 2018 onwards is constrained to sites in deep water, far-from-shore, mostly north of a location in the North Sea called ‘Dogger Bank’. These sites are likely to be significantly more expensive, counteracting the cost saving achieved up to that point through technology development and economies of scale, as shown in Chart 6a. Costs in 2020 are only 10% lower than 2008.
2. Lower offshore wind cost scenario: a significant amount of technology development and economies of scale are achieved75 and enough site constraints are relaxed to avoid having to build on Dogger Bank. Cost reduction is achieved all the way out to 2020, with costs in 2020 30% lower than 2008.
73 The lowest cost scenario assumes the most economically attractive sites are made available and that the high learning scenario (weighted average learning rate 15%) is achieved.
74 Weighted average learning rate of 9% – see Section 4, subsection ‘Cost reduction through learning’75 Weighted average learning rate of 13% – see Section 4, subsection ‘Cost reduction through learning’
Chart 6a Higher and lower offshore wind cost scenarios
1 EnergyQuote, 27 June 20082 BERR central case energy price scenario3 Assumes that no offshore wind farm site constraints relaxed and that low/base case learning rate (weighted average 9%) achieved4 Assumes that offshore wind farms can be built within 7 nautical miles of shore in some places, that single, soft site constraints are
relaxed and that the low/base learning scenario (weighted average learning rate 9%) is achieved.5 Assumes that offshore wind farms can be built within 7 nautical miles of shore in some places, that multiple soft and hard site
constraints are relaxed and that the middle learning scenario (weighted average learning rate 13%) is achieved.6 Assumes the most economically attractive sites are made available and that the high learning scenario (weighted average learning
rate 15%) is achieved.
Source: BCG analysis
- - - - - - - - - - - - - - - - - - - - - - - - - - - - - - - - - - - - - - - - - - - - - -
- - - - - - - - - - - - - - - - - - - - - - - - - - - - - - - - - - - - - - - - - - - - - -
80
402008 20122010 2018 2022
50
20162014 2020
70
90
110
Leve
lised
co
sts
(£/M
Wh
)
100
60
Highest cost scenario3
Higher cost scenario4 These twocentralscenarios are used for incentivemechanismanalysisLower cost scenario5
Lowest cost scenario6
Current wholesale electricity price1
Central long-term wholesale electricity price2

80 The Carbon Trust
The incentive mechanism options have been quantitatively evaluated against these two offshore wind cost scenarios (in terms of potential capacity additions, additional cost and efficiency) and then all options have also been evaluated qualitatively (to assess matters such as the level of disruption to the RO, its effect on different wind constituencies, and the simplicity and ability to implement the scheme).
The output from the quantitative analysis is set out in Chart 6b, while a broader assessment for each option is outlined below.
Option 1: Increased RO with constant bands
Increasing the amount of RO support, by extending the RO by five years and increasing the obligation to a maximum cap of 40%, is sufficient to stimulate 29GW of offshore wind power in the lower cost scenario but is 1GW short in the higher cost scenario.
The cumulative public funding required for the RO over and above the electricity price is £47/MWh76 for both offshore wind power cost scenarios. This is the least efficient of the incentive mechanism options analysed. This inefficiency is due to the perceived ‘regulatory risk’ of the RO and because bands are not periodically adjusted.
The regulatory risk associated with the RO is due to unpredictable variation in the ROC value. The ROC value is driven by the amount of renewables deployed, which is in turn subject to market risk (principally the cost of deploying the renewable capacity) and political risk (for instance the rate at which renewables are given planning permission).
Regulatory risk increases inefficiency, either in the form of a higher cost of capital when financing projects (to account for revenue uncertainty), or in utilities requiring a discount in price from independent generators when negotiatingPPAstotakeaccountofthisrisk.Historicallyas little as 70%77 of the ROC value has passed through to generators.
However,therearetworeasonsthat,goingforward,regulatory risk will be less of an issue under the RO. First is the introduction of a ‘guaranteed headroom’ from 2009. Under the headroom mechanism, once the RO target has been reached, it is continually readjusted to stay a set level above capacity until a cap is reached. Once this headroom mechanism is activated, the ROC value becomes fixed for any given level of banding. The RO then acts more like a feed-in tariff. (An explanation of the impact of the ‘guaranteed headroom’ is given in the sidebox ‘Renewables Obligation’ at the end of this section). The second reason is that many future major developments will include utilities, reducing the likelihood of leakage of the ROC value away from the generator through the negotiated PPA. Analysis suggests that around 90% of the ROC value would pass through to generators78.
The extent of the inefficiency from not adjusting the ROC bands depends on the amount of cost reduction achieved. In the higher offshore wind power cost scenario, costs in 2020 are only around 10% lower than in 2008, mainly due to having to build north of the Dogger Bank. Under this scenario 1.5 ROCs for offshore wind power remains an appropriate level of support.
In the lower offshore wind power cost scenario, costs in2020are30%lowerthanin2008.Howeverthetotalcumulative public funding provided per MWh remains at £47/MWh (see Chart 6b). This is because of the way the RO is structured, the total amount of UK public funding through the RO only depends on the level of banding, the buy-out price and the obligation target. None of these factors have been changed in the lower cost scenario and thus the total public funding remains around the same level. To reduce the level of public funding to reflect the reduction in offshore wind costs, the ROC band for offshore wind power would need to be reduced.
76 The public funding cost per MWh is calculated by dividing cumulative public funding of the renewable incentive mechanism to 2020 by cumulative renewable generation delivered up to 2020
77 Source: interviews with industry by LEK, 200678 Source: Oxera
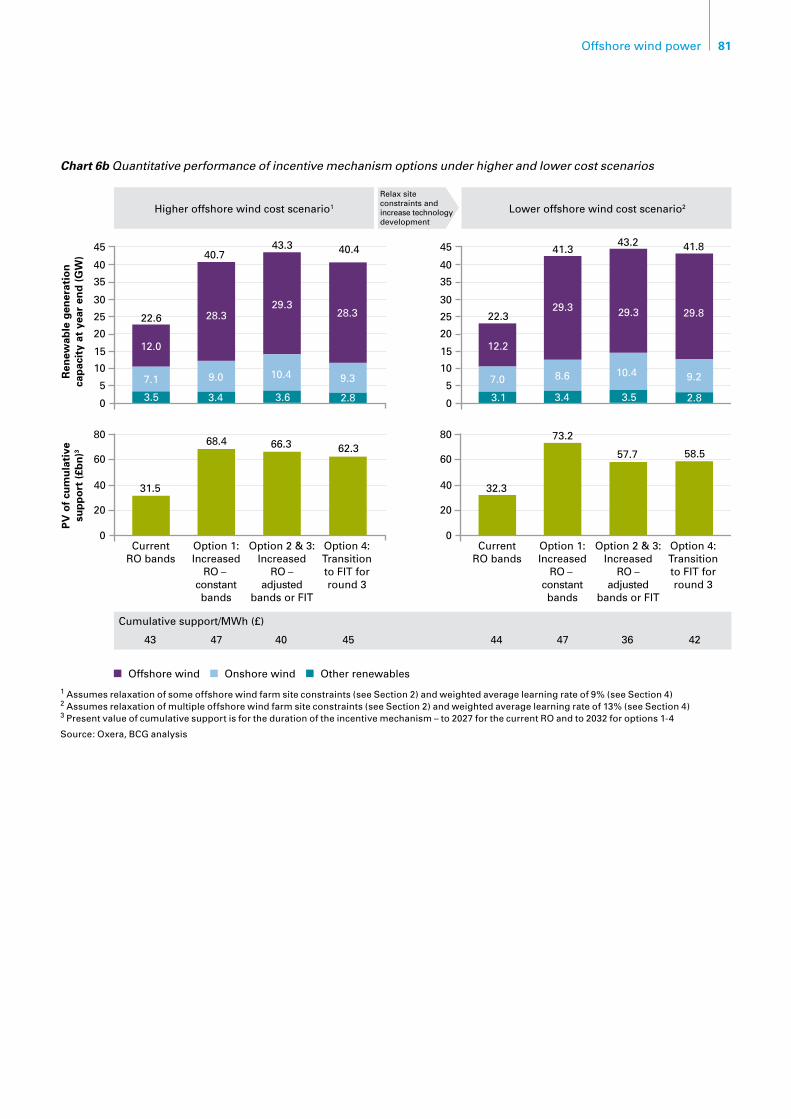
81Offshore wind power
45
35
20
30
25
5
15
10
0
Ren
ewab
le g
ener
atio
nca
pac
ity
at y
ear
end
(G
W)
40
CurrentRO bands
Higher offshore wind cost scenario1 Lower offshore wind cost scenario2
Relax siteconstraints andincrease technology development
Option 1:Increased
RO – constantbands
Option 4:Transitionto FIT forround 3
Option 2 & 3:Increased
RO –adjusted
bands or FIT
60
80
40
20
0
PV
of
cum
ula
tive
sup
po
rt (
£bn
)3
CurrentRO bands
Option 1:Increased
RO – constantbands
Option 4:Transitionto FIT forround 3
Option 2 & 3:Increased
RO –adjusted
bands or FIT
Cumulative support/MWh (£)
43 47 40 45 44 47 36 42
Offshore wind Onshore wind Other renewables
40.7
22.6
12.0
7.1
3.5
28.3
9.0
3.4
40.443.3
29.3
10.4
3.6
28.3
9.3
2.8
41.843.241.3
22.3
12.2
7.0
3.1
29.3
8.6
3.4
29.3
10.4
3.5
29.8
9.2
2.8
31.5
68.4 66.3 62.3
32.3
73.2
57.7 58.560
80
40
20
0
45
35
20
30
25
5
15
10
0
40
Chart 6b Quantitative performance of incentive mechanism options under higher and lower cost scenarios
1 Assumes relaxation of some offshore wind farm site constraints (see Section 2) and weighted average learning rate of 9% (see Section 4)2 Assumes relaxation of multiple offshore wind farm site constraints (see Section 2) and weighted average learning rate of 13% (see Section 4)3 Present value of cumulative support is for the duration of the incentive mechanism – to 2027 for the current RO and to 2032 for options 1-4
Source: Oxera, BCG analysis

82 The Carbon Trust
Option 2: Increased RO with adjusted bands
Given the issues with Option 1, the Government is therefore consulting on a process to periodically adjust the ROC bands. As explained, once the headroom mechanism is activated, the ROC price becomes almost constant. Adjusting the ROC bands from this point onwards would yield similar results to the stepped feed-in tariff, outlined below.
Option 3: Stepped feed-in tariff
The stepped feed-in tariff option stimulates 29GW of offshore and nearly 11GW of onshore wind in both higher and lower cost scenarios. It is a more efficient mechanism than option 1 because it has less regulatory risk caused by uncertainty in the future value of the incentive due to market and political risk, because the level of incentive is ‘grandfathered’ i.e. maintained for the lifetime of the renewable development. A stepped feed-in tariff is also more efficient than option 1 because the level of incentive is periodically ‘stepped down’ to follow the underlying cost curve. Option 2 – increased RO with adjusted bands (as proposed by the Government), would deliver a similar effect although some regulatory risk would still be present.
The major advantage of moving to a stepped feed-in tariff or of adjusting the bands in the RO is apparent in the lower cost scenario. In the lower cost scenario, offshore wind power costs continue to decrease until they are 30% lower than 2020 levels. The feed-in tariff (or adjustable ROC bands) can therefore be more aggressively stepped down, maintaining developers’ returns but reducing the required cumulative public funding to £36/MWh. This is equivalent to a 15bn reduction in cumulative public funding over the lifetime of the incentive mechanism in present value terms compared to the RO where the bands are not adjusted.
Ensuring that the tariff (or RO banding) is set at an appropriate level will require a thorough understanding of the underlying technology costs and risks. A system to pay the feed-in tariff to the renewable electricity generators would also be required that integrates with the UK’s market-based electricity network. This is a significant change, but has been achieved in Germany and other European countries (see Chart 6c).
The principal rationale against moving away from the RO is the potential disruption to short-term delivery. Any significant change away from the RO could create uncertainty for investors in the short-term, slowing the delivery of round 2 and preparation for round 3 wind developments.
It is critical that round 2 developments are delivered on time. This will put the supply curve on the right trajectory to deliver 29GW by 2020 and, through learning, reduce offshore wind power costs by the start of round 3. In addition, developers need to demonstrate the technology’s performance in the near-term, so that by the time third party financiers are required at scale, their improved appraisal of the technology risk will minimise financing costs.
It could therefore be a significant challenge to immediatelymovetoasteppedfeed-intariff.However,an alternative might be to delay this transfer, as incorporated in option 4 below.
83Offshore wind power
Option 4: Transition to FIT for round 3
With the hybrid RO/FIT scenario defined here, wind does not move to a FIT mechanism until 2015, the start of round 3 leasing of offshore wind farm sites. All previous wind generation would be grandfathered under the RO and for the purposes of this modelling all non-wind renewable technologies would continue to be supported by the RO. Delaying the transfer to a FIT until 2015 should give developers and financiers sufficient time to factor the new incentive into their business models and adjust for any knock-on impacts.
As might be expected, transitioning to the FIT for round 3 implies public funding in between option 1 and options 2/3. Under the higher offshore wind cost scenario, total public funding is at £45/MWh. Under the lower offshore wind cost scenario, transitioning to the FIT for round 3 delivers much more of the underlying resource saving to the consumer, the public funding required decreasing to £42/MWh and cumulative total support decreasing to £58.5bn.
The new paradigm of high electricity pricesElectricity prices over the summer of 200879 have been almost double BERR’s central long-term wholesale electricity price scenario of £45/MWh and have been increasingly volatile. This is due to volatility in underlying gas prices and a short-term demand/supply imbalance, and provides a further reason for considering a more fundamental change in the support mechanism.
As can been seen in Chart 6a, if electricity prices were to remain at the levels experienced over the summer of 200879, under the higher offshore wind power cost scenario modelled offshore wind power would require little incentive to bridge the gap between the electricity price and offshore wind costs. Under the lower offshore wind cost scenario, offshore wind power would be cost competitive after 2012 and 29GW of offshore wind power would only require c.£17bn in cumulative public funding over the lifetime of the incentive mechanism in present value terms.
Whilst electricity prices may not stay at this level, they may also not reduce back down to the central electricity price scenario, and therefore the amount of incentive required could be considerably less than in the central electricity price analysis above.
Given that high electricity prices are already causing fuel poverty concerns in the UK, any opportunity to maximise the efficiency of the renewable incentive mechanism by reducing the additional support to take account of high, fluctuating electricity prices is therefore highly desirable.
However,theROwasnotdesignedwiththislevelofelectricity price fluctuation in mind. Whilst ROC bands can be changed periodically, the ROC price cannot respond quickly enough to short-term fluctuations and whilst the ROC price reduces in the longer-term, it cannot decrease below the value of the buy-out price of around £34/MWh.
79 Wholesale electricity price of £83/MWh. Source: EnergyQuote, 27 June 2008
84 The Carbon Trust
The majority of wind power costs are upfront capital expenses, so any increase or decrease to revenues directly leads to increased or decreased returns.
Under the RO, wind generators receive the wholesale electricity price in addition to the value of the ROCs. These generators could earn high returns if wholesale electricity prices rise in between the periodic review of ROC bands; equally they are exposed to a downside risk if wholesale electricity prices fall.
Under a feed-in tariff, renewables generators receive a fixed tariff, independent of the wholesale electricity price. Their returns are therefore not exposed to electricity price fluctuations.
If moving wholeheartedly to a stepped feed-in tariff would delay deployment of round 2, then the second best alternative would be to modify the RO to reduce in line with higher electricity wholesale prices. Coupled with the other changes outlined in the modified RO option, the modified incentive would, in effect, operate as a fixed feed-in tariff and therefore cost a similar amount to the steppedfeed-intariff.However,whilstitsimpactwouldbemore predictable, its mechanics would be more complex, and further investigation is required to ensure this would not have any unexpected consequences. Furthermore, it is not clear how modifying the RO in this way would cause less disruption than a move to a simpler steeped feed-in tariff option.
ConclusionThe incentive mechanism needs an effective process to track reductions in the cost curve. This could reduce public funding of renewable generation over and above the cost of wholesale electricity from £47/MWh to £36/MWh. This equates to a reduced cost over the lifetime of the incentive mechanism of £15bn in present value terms. This ongoing alignment of support to the reduction in the costs of offshore wind power over time can be achieved either by adjusting ROC bands (as proposed by the Government) or by transferring to a new incentive mechanism, such as the stepped feed-in tariff.
In either case, bands or tariffs will need to be actively managed to match reductions in cost and to ensure that developer returns stay in appropriate ranges. This requires a deep understanding of the underlying costs and risks of the renewable energy generation technologies and therefore the required IRRs and support levels. This capability should be created either in Government or an independent body, such as Ofgem.
A cause for greater and more urgent modification in the incentive mechanism is the potential new paradigm of high electricity prices. If electricity prices were to remain at the levels they were over summer 200880, offshore wind would not need an incentive at all after 2012. The cumulative level of public funding in this scenario would need to be only c.£17bn. This saving under the circumstance of high electricity prices could be realised either by modifying the RO or transferring to a feed-in tariff. A feed-in tariff would be simpler than applying additional modifications to the RO, which is already a complicated mechanism. Nevertheless the Government should choose the most pragmatic option that ensures investor confidence and the short-term delivery of offshore wind power is not undermined.
80 Wholesale electricity price of £83/MWh. Source: EnergyQuote, 27 June 2008

85Offshore wind power
Renewables Obligation
The main pillar of the current renewable energy policy framework is the Renewables Obligation, which places a requirement on UK electricity suppliers to source a growing percentage of electricity from eligible renewable generation capacity. This ‘obligation target’ increases each year, and will reach 15.1% by 2015. Support under the current RO mechanism will continue until 2027.
Suppliers are required to produce evidence of their compliance with this obligation to the Office of Gas and Electricity Markets (Ofgem). Evidence is via certificates, referred to as Renewables Obligation Certificates (ROCs). Each ROC represents one MWh of electricity generated from eligible sources. To the extent that suppliers do not provide the sufficient quantity of certificates, they are required to pay a buyout price of £34/MWh* for the shortfall. This money is paid into a buyout fund which is then ‘recycled’ by redistributing it to the holders of ROCs, with the intention of providing a continuing incentive to invest in renewable energy. The effect of the recycle premium means that ROC prices in 2008 are around £50/MWh.
The RO was originally designed to pull through the lowest cost technologies sequentially, with each renewable energy technology receiving the same level of support per MWh generated (despite less mature technologies having higher costs). This has the effect of limiting the amount of investment into less mature technologies. To compensate for this, from 2009 the RO will be ‘banded’, with offshore wind receiving 1.5 ROCs per MWh and other renewable technologies up to 2 ROCs per MWh. Also to be implemented from
2009 is a ‘guaranteed headroom’. As the obligation target is approached, the ‘headroom mechanism’ becomes active and the target is automatically raised to a fixed proportion above the anticipated number of ROCs. This continues until the maximum obligation cap of the RO is reached, currently set at 20%. Once the headroom mechanism is activated, the ROC price effectively becomes constant because the short-fall between the deployed and obligated target capacity remains fixed.
The RO represents a significant public investment in renewable technologies – on the basis of existing electricity demand forecasts, it will cost consumers in total £31.5bn over its lifetime from 2008 to 2027 (in present value terms**).
In addition to funding received through the RO, generators of renewable energy presently receive a levy exemption certificate (LEC) from the Climate Change Levy for each MWh of renewable energy produced, which provides an additional, but smaller, revenue stream. LECs attract a payment of £4.3/MWh (although the amount received by the generator is subject to a supplier margin and is therefore generally lower than this).
This support applies to all eligible renewable technologies; there is also some technology specific support in the form of capital grants, RD&D grants and additional revenue support. For example, for offshore wind, £117m has been committed by way of capital grants for round 1 projects; for marine, additional support is provided under the Marine Renewables Deployment Fund (MRDF).
* 2007/8 value – the buyout price increases over time with inflation** Discounted at the UK gilts rate (2.25% in real terms as of
March 2006)
86 The Carbon Trust
81 Weighted average learning rate of 9% – see Section 6, subsection ‘Cost reduction through learning’82 Weighted average learning rate of 13% – see Section 6, subsection ‘Cost reduction through learning’
Alternative policies to drive offshore wind developmentIncreased RO – with constant bands
RO support is increased by adjusting the obligation target and cap, and extending the lifetime of the RO beyond 2027 by five years. The target and cap are set to incentivise sufficient renewable electricity, capping capacity at the maximum amount required. The minimum renewable electricity required to meet the EU 2020 targets is 32% and 40% the maximum, depending on the deliverability of renewable heat (see Section 1, subsection ‘Sensitivities’). Increasing the target from today’s 15% to 32% therefore sets the level of the obligation in line with this minimum forecast, whilst capping it at 40% minimises the unlikely chance that an excess of renewables would be delivered.
For the purposes of the analysis, ROC bands were maintained at current proposed levels, with offshore wind receiving 1.5 ROCs, onshore wind 1 ROC and other renewable technologies also receiving their respective bands outlined in the UK’s 2007 Energy White Paper. If RO bands were reduced, the level of RO support would reduce.
Increased RO – with adjusted bands
Relatively little would need to be done to the RO to make it a predictable, controllable fixed premium on top of the electricity price. Once the headroom mechanism is activated, the level of incentive is relatively predictable. This level could be changed by reducing or increasing the amount of headroom, and through changing the RO bands.
Stepped feed-in tariff (FIT)
Fixed support mechanisms can take various forms and have been employed in various European countries, including Spain and Germany, see Chart 6c. The basis of the Stepped FIT is that tariffs for each renewable energy technology are set at levels appropriate for investment at a given stage of the technology’s maturity. A fixed rate per MWh of electricity generated applies for the life of a given project, and is not subject to change.
In this policy option, the tariff constitutes the total revenue received by the generator i.e. is independent of the market electricity price. This is possible for renewable technologies like offshore wind where 94% of costs are upfront capital costs and are therefore independent of the gas and oil prices that cause the fluctuation in the costs of traditional generation technologies.
Were a stepped FIT to be implemented, existing renewables projects would be grandfathered under the RO. The fixed level of support for newly installed projects defined at the outset of the project would be set so that the support that future projects receive decreases with expected cost reduction, with targeted returns (IRRs) for developers also potentially decreasing as the technical risks reduce. Therefore, while an individual project’s public funding is set for the life of that project, support per MWh is reduced for later projects (which use technology further down the cost curve) as the economics of new wind projects in time become more competitive with other major forms of generation.
The stepped FIT level for each technology would need to be maintained for at least three years to allow developers to plan and to attract finance for future projects. Given that costs cannot be predicted with total accuracy and that they might increase over this time period, for the purposes of this analysis FIT levels were set at least 10% higher than the predicted levelised cost curve.
Two scenarios of the Stepped FIT tariff profiles were analysed. The higher offshore wind cost scenario assumes that offshore wind farms can be built within 7 nautical miles (nm) of shore in some places, that single, soft, site constraints are relaxed and that the low/base learning scenario81 is achieved. The lower offshore wind cost scenario assumes more economic sites are available with additional relaxation of soft and some hard constraints; and that the middle learning rate is achieved82. In the higher cost scenario, the stepped FIT initially provides £105/MWh of support, reducing to £100/MWh in 2012, and £95/MWh from 2015. In the lower scenario, initial support is £105/MWh, then £95/MWh from 2012, £85/MWh from 2015, £80/MWh from 2018 and £75/MWh thereafter.
For simplicity and to clearly see the impact on offshore wind, the other renewables were given a constant level of tariff, with onshore and other renewables receiving £80/MWh.
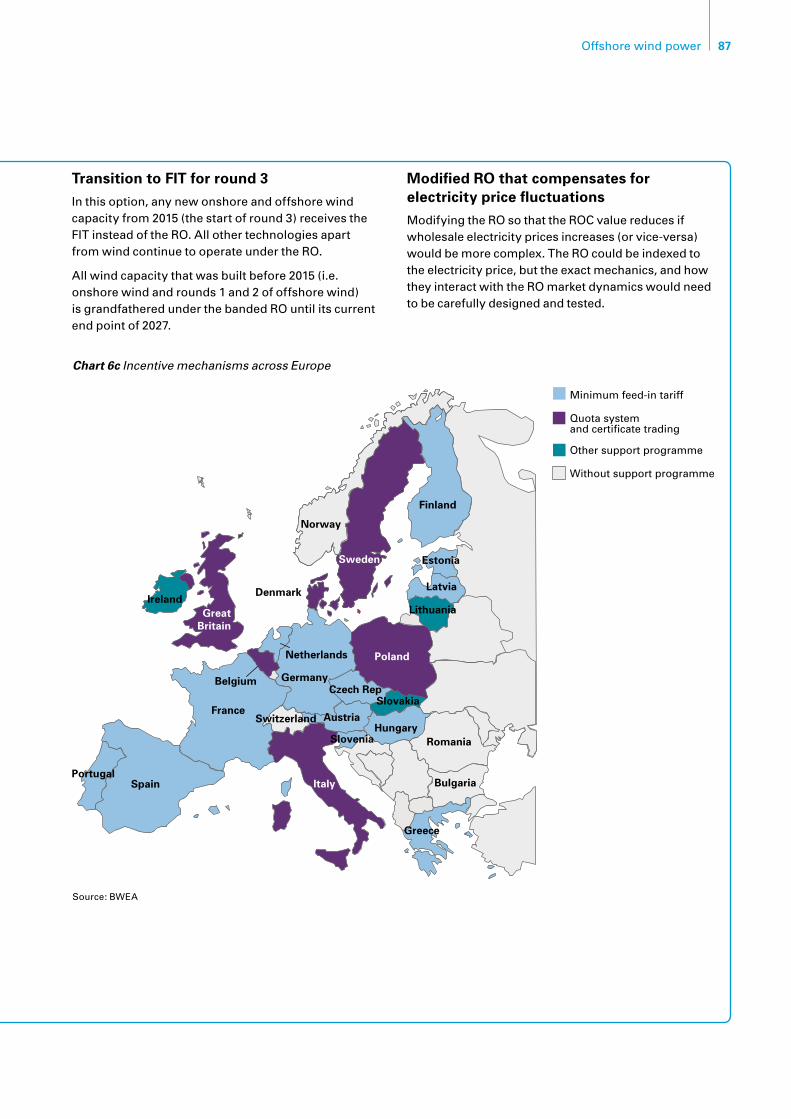
87Offshore wind power
Transition to FIT for round 3
In this option, any new onshore and offshore wind capacity from 2015 (the start of round 3) receives the FIT instead of the RO. All other technologies apart from wind continue to operate under the RO.
All wind capacity that was built before 2015 (i.e. onshore wind and rounds 1 and 2 of offshore wind) is grandfathered under the banded RO until its current end point of 2027.
Modified RO that compensates for electricity price fluctuations
Modifying the RO so that the ROC value reduces if wholesale electricity prices increases (or vice-versa) would be more complex. The RO could be indexed to the electricity price, but the exact mechanics, and how they interact with the RO market dynamics would need to be carefully designed and tested.
Minimum feed-in tariff
Quota system and certificate trading
Other support programme
Without support programme
PortugalSpain Italy
Ireland
Switzerland
GreatBritain
Belgium
France
Germany
Netherlands
Austria
SloveniaHungary
Czech RepSlovakia
Denmark
Poland
Romania
Bulgaria
Greece
Lithuania
Latvia
Estonia
Finland
Sweden
Norway
Chart 6c Incentive mechanisms across Europe
Source: BWEA
88 The Carbon Trust
The cost of offshore windImpact on electricity prices
Under our base case scenario of offshore wind power costs, the net impact of incorporating 40GW of wind power85 into the UK’s electricity system is to add 8% to retail electricity prices and less than 20% to wholesale electricity prices83. (See the sidebox ‘A breakdown of the base case incremental cost of incorporating 40GW of wind power into the UK’s electricity system’). The base case scenario for offshore wind power costs assumes that offshore wind farms are not given the best sites and only achieve a minimal amount of technology development and economies of scale86.
This study outlines the significant potential for offshore wind power cost reductions. If all of these were achieved87, 1% and 3% would be added to retail and wholesale electricity prices respectively. A scenario where a significant amount of cost reduction is achieved88
would result in additions of 4% and 10% to retail and wholesale electricity prices respectively.
The cost reductions in this study would reduce the cost of 40GW of wind from an 8% increase on retail electricity bills to as low as 1%. At higher gas prices, retail electricity bills would be reduced. Wind power will also provide energy security, reduce CO2 emissions and replace decommissioned plant, in addition to stimulating economic activity and jobs in the UK.
7. Cost/Benefit
83 Based on a retail electricity price of £110/MWh and BERR’s central long-term wholesale electricity price of £45/MWh84 Source: EnergyQuote, 29th August 200885 29GW of offshore wind and 11GW of onshore wind86 The base case scenario implies £65bn of capital costs to deliver 29GW of offshore wind power by 2020. It assumes that offshore wind farms can be
located within 7 nautical miles of the shore in some places (but no relaxation of soft and hard site constraints as defined in Section 2) and a minimum learning rate is achieved (weighted average of 9%).
87 Equivalent to the ‘lowest cost scenario’ in Section 6, subsection ‘Evaluation of different options at central electricity prices’. Assumes that the most economic offshore wind farm sites are made available and that a high technology learning rate is achieved (weighted average of 15%)– see Section 4, subsection ‘Cost reduction opportunities’.
88 Equivalent to the ‘lower cost scenario’ in Section 6, subsection ‘Evaluation of different options at central electricity prices’. Assumes that no offshore wind farms need to be built beyond 30 nautical miles from shore (including no development near the Dogger Bank) and that a medium technology learning rate is achieved (weighted average of 13%) achieved – see Section 4, subsection ‘Cost reduction opportunities’.
Key findings
At a central long-term gas price scenario of •55p/therm, 40GW of wind power adds 1-8% to retail electricity prices and 3-20% to wholesale electricity prices83, depending on how much of the offshore wind cost reductions outlined in this study are achieved.
If recent high gas prices were to continue (2009 •forward prices have been around 90p/therm84) 40GW of wind power would not increase 2020 electricity prices.
Moreover, 40GW of wind power reduces •reliance on gas imports, delivers a 43% reduction in CO2 emissions from electricity generation and fills half of the energy supply gap caused by decommissioning plant by 2020.
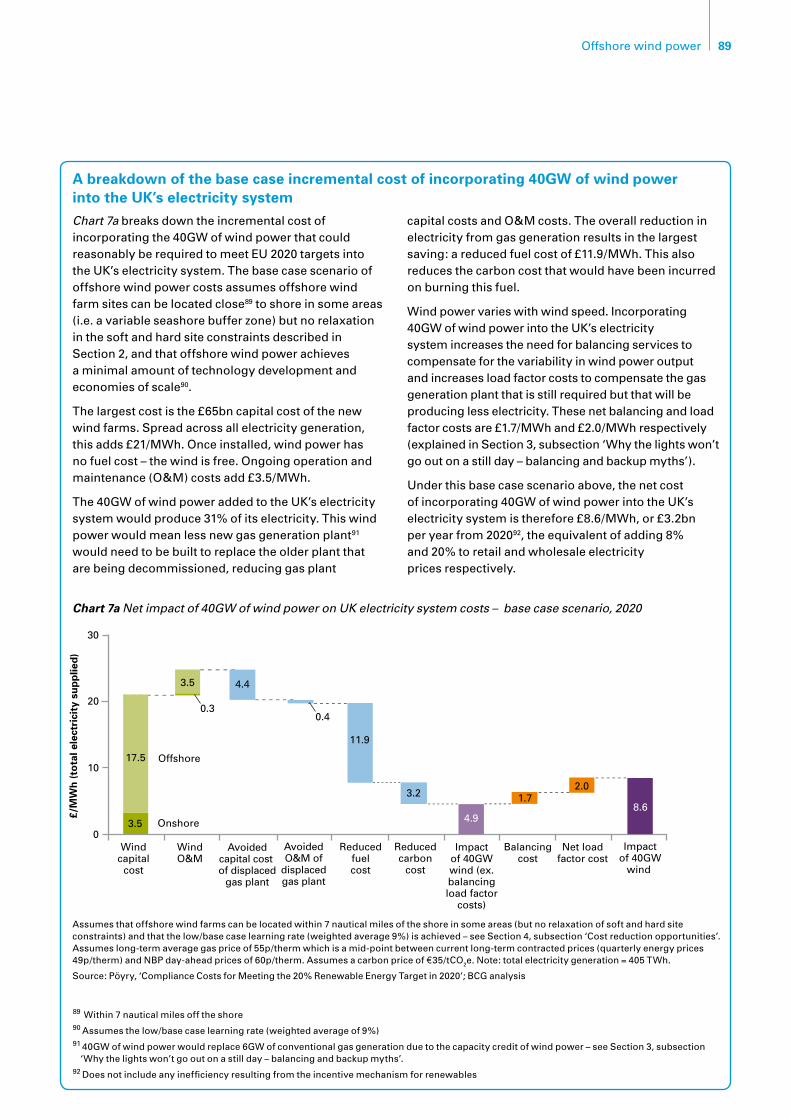
89Offshore wind power
Chart 7a breaks down the incremental cost of incorporating the 40GW of wind power that could reasonably be required to meet EU 2020 targets into the UK’s electricity system. The base case scenario of offshore wind power costs assumes offshore wind farm sites can be located close89 to shore in some areas (i.e. a variable seashore buffer zone) but no relaxation in the soft and hard site constraints described in Section 2, and that offshore wind power achieves a minimal amount of technology development and economies of scale90.
The largest cost is the £65bn capital cost of the new wind farms. Spread across all electricity generation, this adds £21/MWh. Once installed, wind power has no fuel cost – the wind is free. Ongoing operation and maintenance (O&M) costs add £3.5/MWh.
The 40GW of wind power added to the UK’s electricity system would produce 31% of its electricity. This wind power would mean less new gas generation plant91 would need to be built to replace the older plant that are being decommissioned, reducing gas plant
capital costs and O&M costs. The overall reduction in electricity from gas generation results in the largest saving: a reduced fuel cost of £11.9/MWh. This also reduces the carbon cost that would have been incurred on burning this fuel.
Wind power varies with wind speed. Incorporating 40GW of wind power into the UK’s electricity system increases the need for balancing services to compensate for the variability in wind power output and increases load factor costs to compensate the gas generation plant that is still required but that will be producing less electricity. These net balancing and load factor costs are £1.7/MWh and £2.0/MWh respectively (explained in Section 3, subsection ‘Why the lights won’t go out on a still day – balancing and backup myths’).
Under this base case scenario above, the net cost of incorporating 40GW of wind power into the UK’s electricity system is therefore £8.6/MWh, or £3.2bn per year from 202092, the equivalent of adding 8% and 20% to retail and wholesale electricity prices respectively.
A breakdown of the base case incremental cost of incorporating 40GW of wind power into the UK’s electricity system
- - - - - - - - - - - - -
- - - - -
20
0
30
£/M
Wh
(to
tal e
lect
rici
ty s
up
plie
d)
10
Impactof 40GW
wind
Windcapital
cost
WindO&M
Avoidedcapital cost of displaced
gas plant
AvoidedO&M of
displacedgas plant
Reducedfuelcost
Reducedcarbon
cost
Impactof 40GWwind (ex.balancingload factor
costs)
Balancingcost
Net loadfactor cost
- - - - - - -
- - - - - - -
- - - - - - - - - - - - - - - - - - -
- - - - - -
17.5
3.5
3.5
0.3
11.9
3.2
4.9
1.72.0
8.6
Offshore
Onshore
0.4
4.4
Chart 7a Net impact of 40GW of wind power on UK electricity system costs – base case scenario, 2020
Assumes that offshore wind farms can be located within 7 nautical miles of the shore in some areas (but no relaxation of soft and hard site constraints) and that the low/base case learning rate (weighted average 9%) is achieved – see Section 4, subsection ‘Cost reduction opportunities’. Assumes long-term average gas price of 55p/therm which is a mid-point between current long-term contracted prices (quarterly energy prices 49p/therm) and NBP day-ahead prices of 60p/therm. Assumes a carbon price of ¤35/tCO2e. Note: total electricity generation = 405 TWh.
Source: Pöyry, ‘Compliance Costs for Meeting the 20% Renewable Energy Target in 2020’; BCG analysis
89 Within 7 nautical miles off the shore90 Assumes the low/base case learning rate (weighted average of 9%)91 40GW of wind power would replace 6GW of conventional gas generation due to the capacity credit of wind power – see Section 3, subsection
‘Why the lights won’t go out on a still day – balancing and backup myths’.92 Does not include any inefficiency resulting from the incentive mechanism for renewables
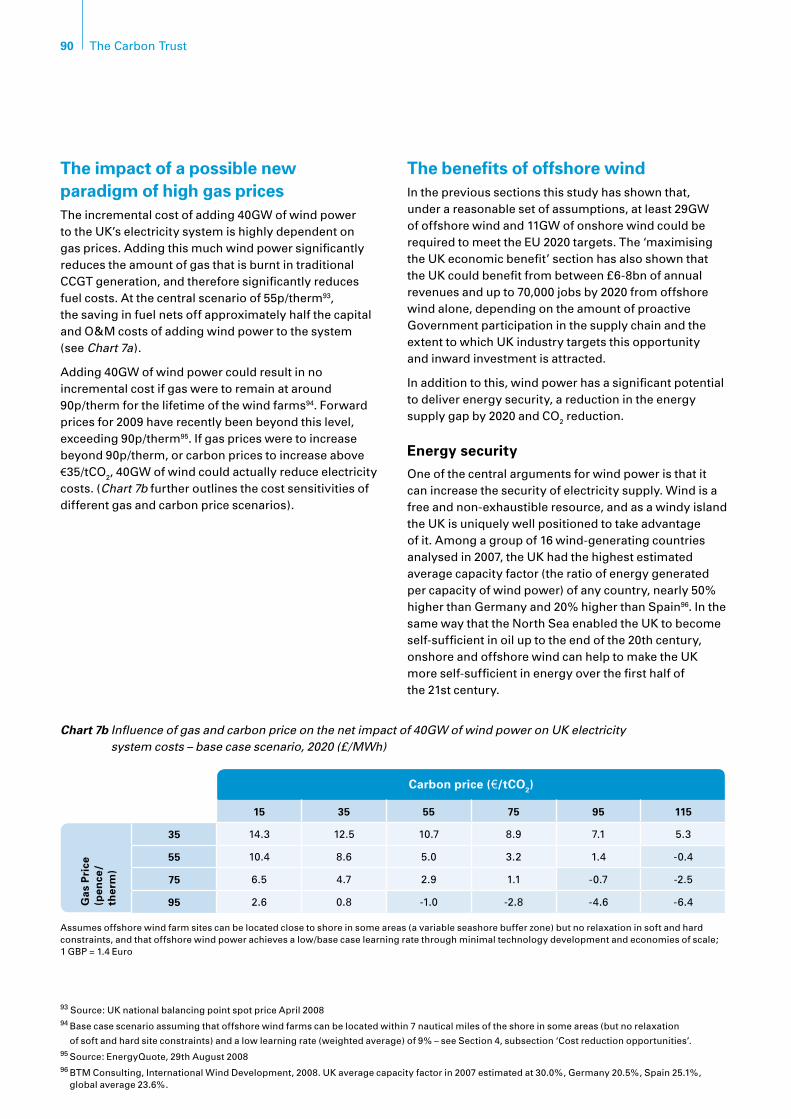
90 The Carbon Trust
The impact of a possible new paradigm of high gas pricesThe incremental cost of adding 40GW of wind power to the UK’s electricity system is highly dependent on gas prices. Adding this much wind power significantly reduces the amount of gas that is burnt in traditional CCGT generation, and therefore significantly reduces fuel costs. At the central scenario of 55p/therm93, the saving in fuel nets off approximately half the capital and O&M costs of adding wind power to the system (see Chart 7a).
Adding 40GW of wind power could result in no incremental cost if gas were to remain at around 90p/therm for the lifetime of the wind farms94. Forward prices for 2009 have recently been beyond this level, exceeding 90p/therm95. If gas prices were to increase beyond 90p/therm, or carbon prices to increase above €35/tCO2, 40GW of wind could actually reduce electricity costs. (Chart 7b further outlines the cost sensitivities of different gas and carbon price scenarios).
The benefits of offshore windIn the previous sections this study has shown that, under a reasonable set of assumptions, at least 29GW of offshore wind and 11GW of onshore wind could be required to meet the EU 2020 targets. The ‘maximising the UK economic benefit’ section has also shown that the UK could benefit from between £6-8bn of annual revenues and up to 70,000 jobs by 2020 from offshore wind alone, depending on the amount of proactive Government participation in the supply chain and the extent to which UK industry targets this opportunity and inward investment is attracted.
In addition to this, wind power has a significant potential to deliver energy security, a reduction in the energy supply gap by 2020 and CO2 reduction.
Energy security
One of the central arguments for wind power is that it can increase the security of electricity supply. Wind is a free and non-exhaustible resource, and as a windy island the UK is uniquely well positioned to take advantage of it. Among a group of 16 wind-generating countries analysed in 2007, the UK had the highest estimated average capacity factor (the ratio of energy generated per capacity of wind power) of any country, nearly 50% higher than Germany and 20% higher than Spain96. In the same way that the North Sea enabled the UK to become self-sufficient in oil up to the end of the 20th century, onshore and offshore wind can help to make the UK more self-sufficient in energy over the first half of the 21st century.
93 Source: UK national balancing point spot price April 200894 Base case scenario assuming that offshore wind farms can be located within 7 nautical miles of the shore in some areas (but no relaxation
of soft and hard site constraints) and a low learning rate (weighted average) of 9% – see Section 4, subsection ‘Cost reduction opportunities’.95 Source: EnergyQuote, 29th August 200896 BTM Consulting, International Wind Development, 2008. UK average capacity factor in 2007 estimated at 30.0%, Germany 20.5%, Spain 25.1%,
global average 23.6%.
Chart 7b Influence of gas and carbon price on the net impact of 40GW of wind power on UK electricity system costs – base case scenario, 2020 (£/MWh)
Assumes offshore wind farm sites can be located close to shore in some areas (a variable seashore buffer zone) but no relaxation in soft and hard constraints, and that offshore wind power achieves a low/base case learning rate through minimal technology development and economies of scale; 1 GBP = 1.4 Euro
Carbon price (¤/tCO2)
15 35 55 75 95 115
35 14.3 12.5 10.7 8.9 7.1 5.3
55 10.4 8.6 5.0 3.2 1.4 -0.4
75 6.5 4.7 2.9 1.1 -0.7 -2.5
95 2.6 0.8 -1.0 -2.8 -4.6 -6.4Gas
Pri
ce
(pen
ce/
ther
m)
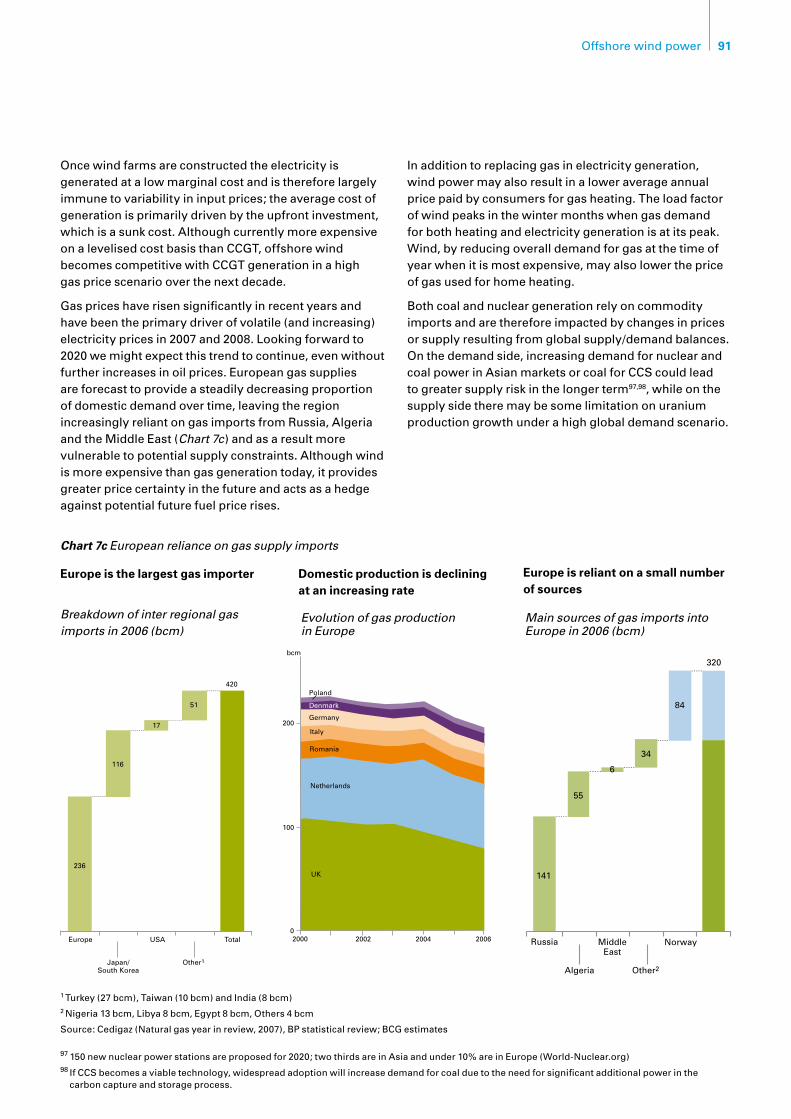
91Offshore wind power
Once wind farms are constructed the electricity is generated at a low marginal cost and is therefore largely immune to variability in input prices; the average cost of generation is primarily driven by the upfront investment, which is a sunk cost. Although currently more expensive on a levelised cost basis than CCGT, offshore wind becomes competitive with CCGT generation in a high gas price scenario over the next decade.
Gas prices have risen significantly in recent years and have been the primary driver of volatile (and increasing) electricity prices in 2007 and 2008. Looking forward to 2020 we might expect this trend to continue, even without further increases in oil prices. European gas supplies are forecast to provide a steadily decreasing proportion of domestic demand over time, leaving the region increasingly reliant on gas imports from Russia, Algeria and the Middle East (Chart 7c) and as a result more vulnerable to potential supply constraints. Although wind is more expensive than gas generation today, it provides greater price certainty in the future and acts as a hedge against potential future fuel price rises.
In addition to replacing gas in electricity generation, wind power may also result in a lower average annual price paid by consumers for gas heating. The load factor of wind peaks in the winter months when gas demand for both heating and electricity generation is at its peak. Wind, by reducing overall demand for gas at the time of year when it is most expensive, may also lower the price of gas used for home heating.
Both coal and nuclear generation rely on commodity imports and are therefore impacted by changes in prices or supply resulting from global supply/demand balances. On the demand side, increasing demand for nuclear and coal power in Asian markets or coal for CCS could lead to greater supply risk in the longer term97,98, while on the supply side there may be some limitation on uranium production growth under a high global demand scenario.
Chart 7c European reliance on gas supply imports
Europe is the largest gas importer
Breakdown of inter regional gas imports in 2006 (bcm)
Evolution of gas production in Europe
Main sources of gas imports into Europe in 2006 (bcm)
Domestic production is declining at an increasing rate
Europe is reliant on a small number of sources
1 Turkey (27 bcm), Taiwan (10 bcm) and India (8 bcm) 2 Nigeria 13 bcm, Libya 8 bcm, Egypt 8 bcm, Others 4 bcm
Source: Cedigaz (Natural gas year in review, 2007), BP statistical review; BCG estimates
100
02000
200
bcm
Poland
Denmark
Germany
Italy
Romania
Netherlands
UK
2002 2004 2006
97 150 new nuclear power stations are proposed for 2020; two thirds are in Asia and under 10% are in Europe (World-Nuclear.org)98 If CCS becomes a viable technology, widespread adoption will increase demand for coal due to the need for significant additional power in the
carbon capture and storage process.
Europe
Japan/South Korea
USA Total
Other1
420
51
17
116
236
- - - - - - -
- - - - - - - - - - - - - -
- - - - - - -
Russia
Algeria
Norway
Other2
34
6
55
141
- - - - -
- - - - -
- - - - -
MiddleEast
320
84
- - - - -
- - - - -
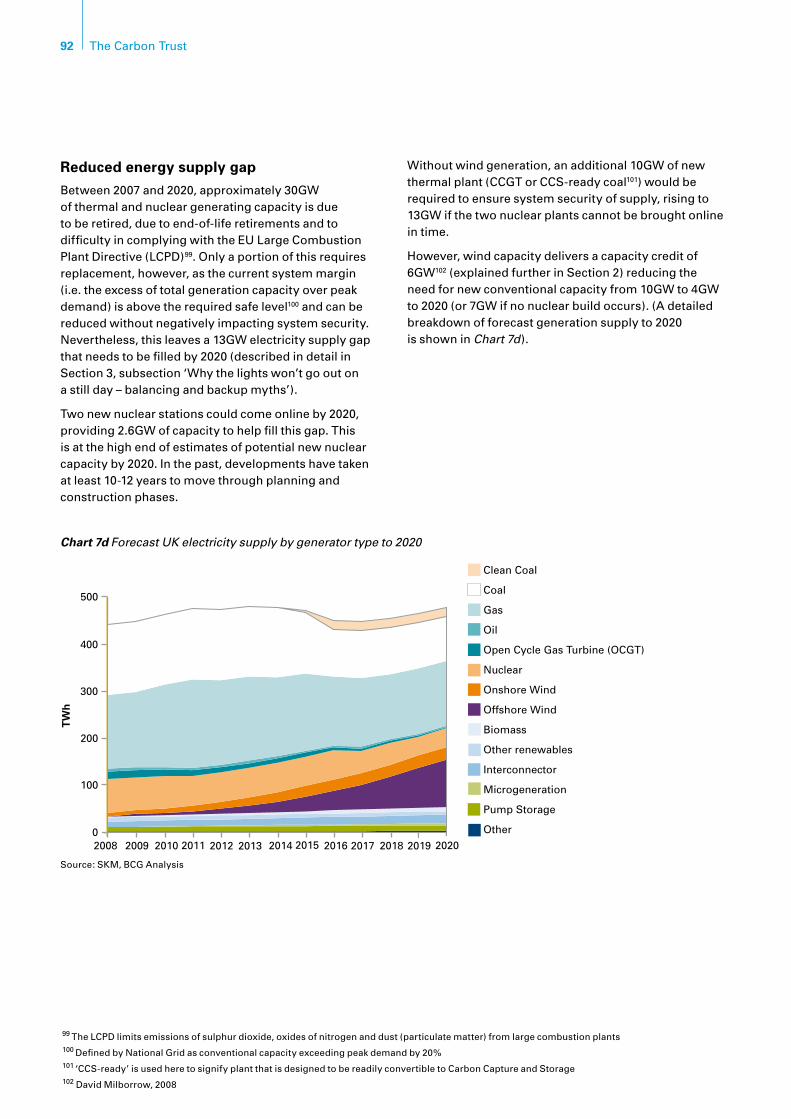
92 The Carbon Trust
99 The LCPD limits emissions of sulphur dioxide, oxides of nitrogen and dust (particulate matter) from large combustion plants100 Defined by National Grid as conventional capacity exceeding peak demand by 20%101 ‘CCS-ready’ is used here to signify plant that is designed to be readily convertible to Carbon Capture and Storage102 David Milborrow, 2008
Chart 7d Forecast UK electricity supply by generator type to 2020
02008 2009 2016 2017 2019
100
TW
h
20132010 2014
Clean Coal
Coal
Gas
Oil
Open Cycle Gas Turbine (OCGT)
Nuclear
Onshore Wind
Offshore Wind
Biomass
Other renewables
Interconnector
Microgeneration
Pump Storage
Other
400
500
300
200
2011 2012 2015 2018 2020
Source: SKM, BCG Analysis
Reduced energy supply gap
Between 2007 and 2020, approximately 30GW of thermal and nuclear generating capacity is due to be retired, due to end-of-life retirements and to difficulty in complying with the EU Large Combustion Plant Directive (LCPD)99. Only a portion of this requires replacement, however, as the current system margin (i.e. the excess of total generation capacity over peak demand) is above the required safe level100 and can be reduced without negatively impacting system security. Nevertheless, this leaves a 13GW electricity supply gap that needs to be filled by 2020 (described in detail in Section 3, subsection ‘Why the lights won’t go out on a still day – balancing and backup myths’).
Two new nuclear stations could come online by 2020, providing 2.6GW of capacity to help fill this gap. This is at the high end of estimates of potential new nuclear capacity by 2020. In the past, developments have taken at least 10-12 years to move through planning and construction phases.
Without wind generation, an additional 10GW of new thermal plant (CCGT or CCS-ready coal101) would be required to ensure system security of supply, rising to 13GW if the two nuclear plants cannot be brought online in time.
However,windcapacitydeliversacapacitycreditof6GW102 (explained further in Section 2) reducing the need for new conventional capacity from 10GW to 4GW to 2020 (or 7GW if no nuclear build occurs). (A detailed breakdown of forecast generation supply to 2020 is shown in Chart 7d).
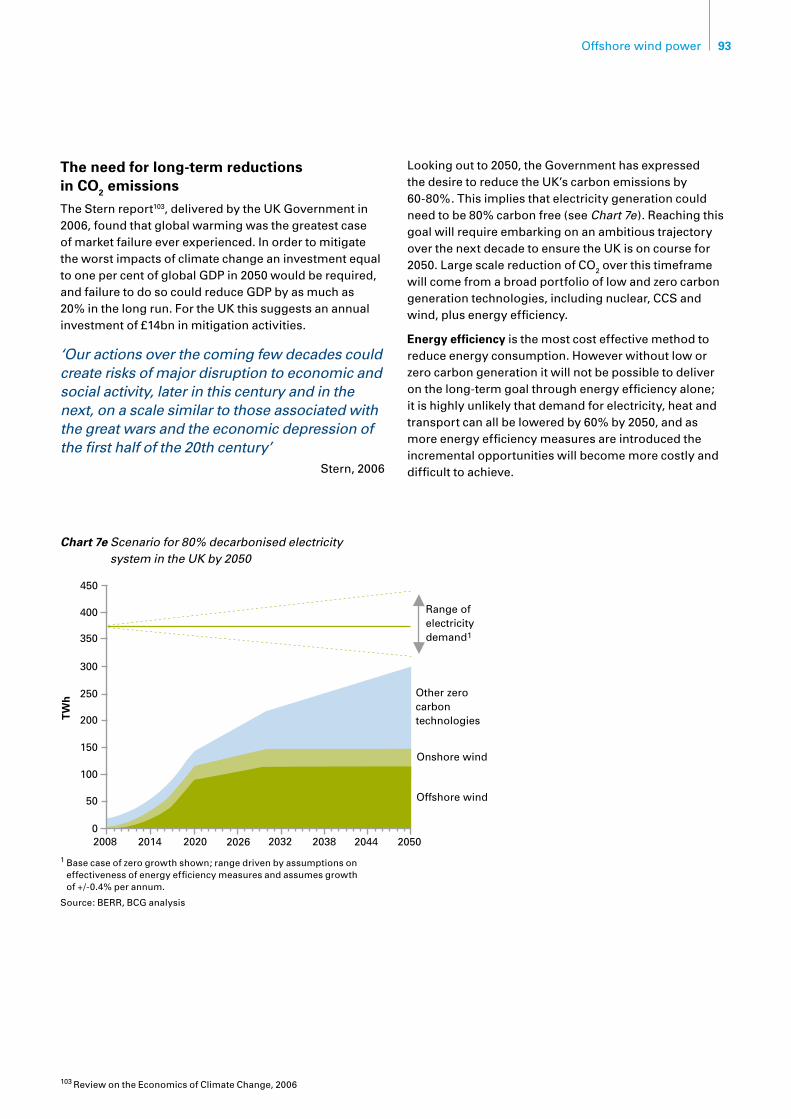
93Offshore wind power
The need for long-term reductions in CO2 emissions
The Stern report103, delivered by the UK Government in 2006, found that global warming was the greatest case of market failure ever experienced. In order to mitigate the worst impacts of climate change an investment equal to one per cent of global GDP in 2050 would be required, and failure to do so could reduce GDP by as much as 20% in the long run. For the UK this suggests an annual investment of £14bn in mitigation activities.
‘Our actions over the coming few decades could create risks of major disruption to economic and social activity, later in this century and in the next, on a scale similar to those associated with the great wars and the economic depression of the first half of the 20th century’
Stern, 2006
Looking out to 2050, the Government has expressed the desire to reduce the UK’s carbon emissions by 60-80%. This implies that electricity generation could need to be 80% carbon free (see Chart 7e). Reaching this goal will require embarking on an ambitious trajectory over the next decade to ensure the UK is on course for 2050. Large scale reduction of CO2 over this timeframe will come from a broad portfolio of low and zero carbon generation technologies, including nuclear, CCS and wind, plus energy efficiency.
Energy efficiency is the most cost effective method to reduceenergyconsumption.Howeverwithoutloworzero carbon generation it will not be possible to deliver on the long-term goal through energy efficiency alone; it is highly unlikely that demand for electricity, heat and transport can all be lowered by 60% by 2050, and as more energy efficiency measures are introduced the incremental opportunities will become more costly and difficult to achieve.
103 Review on the Economics of Climate Change, 2006
Chart 7e Scenario for 80% decarbonised electricity system in the UK by 2050
1 Base case of zero growth shown; range driven by assumptions on effectiveness of energy efficiency measures and assumes growth of +/-0.4% per annum.
Source: BERR, BCG analysis
250
02008 2014 2038 2044 2050
100
TW
h
350
20262020 2032
Range ofelectricitydemand1
Other zerocarbon technologies
Onshore wind
Offshore wind
400
450
300
200
150
50
- - - - - - - - - - - - - - - - - - - - - - - - - - - - - - - - - - - - - - - - - - - - - - - - - - - - - - - - - - - - - - - - - -
- - - - - - - - - - - - - - - - - - - - - - - - - - - - - - - - - - - - - - - - - - - - - - - - - - - - - - - - - - - - - - - - - -
94 The Carbon Trust
Nuclear power is unlikely to produce a net incremental CO2 reduction prior to 2020 due to the long lead time to build new plants and the number of existing plants due to come offline by that date: current nuclear capacity is 11GW, of which 7GW is scheduled to retire by 2020. To meet the 2050 goal solely from nuclear would require building at a rate of one new nuclear plant every 18 months between 2020 and 2050. Of these 19 new plants, seven would be likely to require development of greenfield sites – sites which could be limited to England given the opposition to new nuclear power stations in the Welsh Assembly and Scottish Executive. While nuclear can make a significant contribution to meeting the 2050 goal, it will need the support of additional technologies.
CCS has the potential to be a major part of a low carbon portfolio, but the technology and resulting cost effectiveness are uncertain at this time. The economics of CO2 reduction make it likely that the majority of CCS plants will be coal fired; this is because the fuel is relatively cheap and the carbon emissions are high relative to other forms of thermal generation, resulting in greater CO2 savings. Due to the long lifetime of coal plants(~45years)anynewcoalgenerationthatisnotconverted to CCS at a later date would jeopardise the 2050 goal and increase UK exposure to rising carbon prices.
Gas power generation has lower CO2 emissions than coal and could therefore contribute to the 2050 target if it replaced existing coal plant. Expanding gas generation significantly beyond current levels would require a major investment in gas supply infrastructure and would produce more CO2 than nuclear, CCS or wind. Given falling domestic production of gas, it also raises (difficult) questions regarding long-term gas fuel supplies.
Onshore wind power is currently at least half the cost of offshore wind power; however, the maximum UK capacity will be limited by the availability of suitable sites in the long-term. Although the UK has the theoretical potential for over 400GW of onshore wind, the maximum practical resource has been estimated at around 20GW104 due to technical constraints (e.g. low wind speeds, unsuitable terrain) and practical constraints (e.g. planning, grid, environmental).
Wave and tidal power has the potential to contribute the equivalent of 15-20% of current UK electricity demand in the long-term – leveraging some of Europe’s greatest natural wave and tidal resources. This technology is currently in its pilot phase, and it is reasonable to assume (as we have in this analysis) that 2GW might be possible by 2020.
Other renewables such as micro-generation and biomass electricity generation could technically deliver asignificantamountofcapacity.However,theyareonlylikely to be cost-competitive and deployable in niche markets. For instance, small-scale wind generation is only cost competitive in rural installations105 and biomass electricity will be limited by the availability of viable feedstock.However,astepchangeintechnologyinthelonger term could provide cost-competitive solutions, for instance advanced photovoltaic technologies.
Therefore offshore wind investments are unlikely to be wasted; there is no single solution to reducing carbon emissions in the long run, and the UK will need to utilise every lever available. Offshore wind is a technology that is accessible now and at a scale that can have a significant impact. The combination of 29GW of offshore wind and 11GW of onshore wind would result in a 43% reduction in carbon emissions from power generation by 2020, and a 14% reduction in total UK carbon emissions
relative to 2007.
104 Sustainable Development Commission, Wind Power in the UK, 2005105 ‘Small scale wind energy – Policy insights and practical guidance’, Carbon Trust, 2008

95Offshore wind power
ConclusionIf gas prices were to remain at the current forward rates predicted106, then adding 40GW of wind energy would be cost effective or even be cheaper than conventional thermal generation and should be given the highest priority.
If gas prices returned to previous long-term forecasts107, 40GW of wind capacity will add between 1-8% to retail electricity prices. Whilst significant, this is still a fraction of the greater than 30% rise in electricity prices UK consumers have experienced in 2008 from fluctuations in underlying fuel prices.
It is possible that a cheaper form of renewable energy source could deliver more than expected. The alternative with the greatest potential to do so is biomass, which could conceivably deliver more than the 10% of heat energy assumed in this study, particularly with growth in industrial heat applications. Were this to happen, only 19GW of wind would be required, at a system cost of £3.8-£5.3/MWh, equating to 3.5-5.0% on retail electricity prices,plustheincreasedcostofheatenergy.However,biomass also has significant barriers to delivery.
It is equally possible that other renewable energy sources under-deliver. The study’s base case of 29GW of offshore wind relies on 11GW of onshore wind, 2GW of wave and tidal and 1GW of solar, all of which have greater deployment barriers than offshore wind.
It is therefore necessary to develop the option of achieving at least 29GW of offshore wind by 2020.
Furthermore, in practise the actions required today to deliver 29GW by 2020 are the same as those required to deliver 19GW. Both of these levels of capacity are an order of magnitude larger than today. They require similar levels of significant leadership and action from both Government and industry.
106 94p/therm, EnergyQuote 29 August 2008107 55p/therm
96 The Carbon Trust
Action required by the UK Government
1. Site allocation: save up to £16bn by relaxing offshore wind farm site constraints
The UK Government holds the biggest lever to immediately reduce the cost of the 21GW of offshore wind power required to meet the EU 2020 targets beyond the 8GW already planned. Negotiating the relaxation of potential site constraints as part of its Strategic Environment Assessment (SEA) could reduce the investment cost of delivering 29GW of offshore wind power capacity by up to £16bn.
With access to the most economic sites, offshore wind power costs would continue to reduce all the way to 2020 (see Chart 6a in the incentive section). No sites would need to be located more than 30 nautical miles from shore (i.e. no sites would need to be built near the Dogger Bank – more than 60 nautical miles out into the North Sea). Deep water sites would not be required until 2017, potentially up to 7 years after deep water technology will have first been deployed in Germany, allowing ample time for RD&D to improve the cost effectiveness of using these sites. The broader geographic spread of wind farm sites would minimise the need for additional grid balancing.
To deliver this scenario, some offshore wind farms would need to be located within the buffer zone that is being considered. Any seaward buffer zone would need to be flexible rather than a fixed distance from the coastline. In addition, a mixture of hard constraints (such as the 6 nautical miles exclusion zones around oil and gas installations) and soft constraints (such as shipping usage, environmental constraints, military exercise areas) would need to be relaxed.
In order to ensure that these sea floor constraints are relaxed in an efficient and effective way, the Government needs to take a much more active role in managing the relevant stakeholders than it has done in the previous offshore wind farm site leasing processes (rounds 1 and 2). There needs to be a co-ordinated and well-defined process for bringing developers and other relevant parties together in a way that ensures the right trade-offs are negotiated, and at a regional or national level rather than on a site-by-site basis. Two events in June 2008 suggest that this could be achieved in the very near future; the BWEA signed a Memorandum of Understanding with BERR, the MoD and CAA to address radar issues, and the Crown Estate announced plans to co-invest in planning applications for round 3.
These negotiations need to be successfully completed over the next few months, in time for the Secretary of State’s decision in Spring 2009 on the acceptable level of impact of offshore wind development and to dovetail into the Crown Estate’s decisions on bids for Zone Development Partners by the first quarter of 2009.
8. RecommendationsThrough strong leadership, the UK Government can remove the key barriers to delivering 40GW of on- and offshore wind by 2020 and significantly cut costs. In return, the industry will need to respond to these clear signals by investing at scale, increasing capacity and RD&D and coordinating more to share learning.

97Offshore wind power
2. Grid & planning regulations: avoid c.£2bn in cost and remove barriers to deployment by 2020 by implementing grid and planning regulatory reform
Adding 40GW of onshore and offshore wind will require grid network transmission upgrade costs of c.£2bn unless the current capacity is shared. The Government’s proposed ‘connect & manage’ approach in its Transmission Access Review (TAR) would address theseissues.However,somegeneratorshaveavestedinterested in the status quo. The Government will need to show strong leadership in implementing its proposed policies.
To deliver the grid connections for 40GW of onshore and offshore wind by 2020 will also require significant improvements to grid regulations. As well as ‘connect and manage’, network criteria for reinforcement will need to be updated and the transmission licensees will need to be allowed to undertake network investment in anticipation of demand from wind generators.
The biggest regulatory barrier to delivery by 2020 is the current planning regulations, which have historically created delays of 7-10 years and which would result in the UK missing its 2020 renewable energy targets by a wide margin. The proposed Infrastructure Planning Commission (IPC) and associated National Policy Statements (NPS) processes will theoretically cut this time to under 3 years (including application, pre-consents andconsents).However,strongleadershipwillagainbe required from the Government to implement these recommendations without compromising the underlying efficiency of their proposals.
3. Incentive mechanism: modify the incentive mechanism to deliver 40% renewable electricity whilst minimising the cost to the consumer
The incentive mechanism needs to provide developers with sufficient returns and incentive to deliver the 29GW of offshore wind by 2020. At the same time, the level of incentive needs to reduce over time to pass cost reductions in the underlying renewable energy technologies to consumers. The Government has rightly proposed that the existing incentive mechanism, the Renewable Obligation (RO), can deliver against these criteria if its lifetime and targets are extended and the banded level of support for each technology periodically adjusted.
We also support the Government’s conclusion that the incentive mechanism will need to be able to compensate for high, fluctuating electricity prices if it is not to provide excessive pubic funding to renewable generation. Periodic adjustment of the RO will not address these short-term fluctuations. The Government is therefore also proposing to index the level of the RO to electricity prices. Alternatively, incentivising new renewable electricity generation with a feed-in tariff would avoid an additional modification to the already complex workings of the RO.
However,thebenefitsofmovingtoasimplermechanismneed to be weighed against any delay it might cause to delivering the 8GW of offshore wind power already planned in rounds 1 and 2 of offshore wind development.
Whether the RO is modified or changed to a feed-in tariff, active management of bands or tariffs to match reductions in cost and to ensure developer returns stay in appropriate ranges is needed. This requires a deep understanding of the underlying costs and risks of the renewable energy generation technologies and therefore the required IRRs and support levels. This capability should be created either in Government or an independent body, such as Ofgem.
98 The Carbon Trust
4. Technology & supply chain: deliver an integrated innovation and manufacturing strategy
Offshore wind is currently a small market for most turbine and component manufacturers and therefore has not been astrategicpriorityforRD&Dinvestment.However,ithasthe potential to generate 13% of global turbine sales and over 10% of revenues for other component manufacturers by 2020. The offshore wind market should therefore become enough of a strategic priority for manufacturers to ramp up capacity in the required timelines. With the right level of commitment and incentives, the market will on the whole deliver the capacity and associated technology developments required.
If turbine manufacturers increased RD&D spending from current rates of 2-3%108 of sales to the private sector average of 3-4% of sales as the industry expands and the rest of the supply chain did likewise, then total global private RD&D investment in offshore wind to 2020 would increase by £1.3bn to £4.3bn109. This will in turn catalyse technology advances in improved reliability and cost reduction. Combined with economies of scale, this could reduce the cost of delivering 29GW of offshore wind power in the UK by up to £15bn.
Government will need to support existing and new manufacturers to develop, test and deploy robust and lower cost turbines at scale. In addition, there are a number of potential market failures that would benefit from proactive Government funding and coordination to ensure these cost reductions are achieved. A number of components are currently developed and manufactured either by large manufacturers, who do not see offshore wind as a core business, or by small specialist manufacturers that could struggle to take on the level of risk and investment required.
The development, manufacture and installation of offshore wind foundations is the largest potential market failure. New foundations need to be developed and manufactured to access deeper offshore sites (>40m) and to support 5MW and larger turbines. Foundations are up to 17% of costs, and these need to be reduced through new designs that reduce the amount of material required, use alternative materials and/or can be constructed and installed using high volume techniques.
In addition, there are currently only two major suppliers of offshore wind turbines. Whilst the larger market implied by the EU 2020 targets should attract other large competitors, there is a risk that they will continue to focus on the growing U.S. and Asian onshore wind markets. This risk can be mitigated by reducing the barriers to new entrants. The key barrier new entrants face is proving the reliability of their products.
The most effective strategy of addressing these potential market failures requires an integrated approach across RD&D, testing and demonstration, and manufacturing strategy.
108 Source: BCG analysis based on annual reports of Vestas and Gamesa, 2005-2007109 Assuming total global market of 66GW by 2020 – see Section 1

99Offshore wind power
Invest up to £600m in public RD&D funding for offshore wind
Public RD&D funding will need to support around 15-35% of total RD&D funding, equating to up to £2.3bn globally, if the cost reductions outlined in this study are to be achieved. This is an order of magnitude greater than public RD&D funding to date. Under a reasonable set of assumptions the UK could attract 20-30% of global RD&D, requiring investment of up to £600m in public RD&D funding up to 2020 in the UK.
Section 4 discusses where this funding should be focused in detail, including the greatest opportunities in turbine, foundations, connections, installation and operation and maintenance technologies and processes. Of these, innovation in foundations should be a key priority for the UK, requiring public funding of up to £230m.
The type of foundation technology that the UK should focus its RD&D funding on largely depends on the extent to which offshore wind site constraints are released. If constraints are not released, the UK will need deep water (>30m) foundations in 2015, soon after they are needed inGermanyin2010-2012.However,ifconstraintsforshallow and mid-depth sites are released, then the UK will not need deep water foundations till around 2017, 5-7 years after Germany. Experience from the onshore wind market suggests that in this case, a ‘fast-follower strategy’ in deep water foundations could be one approach, where the UK piggybacks off the innovation for the German market. Alternatively, given the extent and importance of the innovation required, an ‘option play’ could be appropriate where the UK also develops deep water foundations in case the innovation for the German market is not sufficient.
Provide test facilities and demonstration sites
In addition to funding, the UK Government, the Crown Estate, developers and manufacturers should make test facilities and demonstrations sites available for developing new offshore wind technology, particularly new foundation designs and advances in turbine technology such as direct drive generators and new blade designs.
These testing facilities and demonstration sites will be particularly useful to new market entrants, who will need to prove their technology’s reliability if they are to be able to scale up to mass-deployment.
Develop port infrastructure
Whilst offshore wind farms could conceivably be installed from continental ports, UK ports will be required for O&M. Improved port facilities would catalyse UK-based installation companies, who could gain a competitive advantage by developing lower-cost, faster installation techniques to complement new foundation designs.
A combination of public and private funding will be required to support UK port development, similar to the East of England Development Agency’s £8.7 million funding for the £50 million new outer harbour at Great Yarmouth (Eastport).
Catalysing the installation and O&M market in the UK could create 25,000-30,000 jobs and £4bn in revenues (equal to half the current North Sea oil and gas employment).

100 The Carbon Trust
Skills development
Skill shortages are a key barrier to capacity growth according to our interviews. The UK should invest in training and skills to complement the employment opportunities created in RD&D, manufacturing, installation and O&M.
Attract manufacturers with an integrated package from RD&D and development to large-scale market deployment
RD&D funding, test sites, port facilities and availability of subsidised training schemes should be bundled into an integrated package to attract local manufacturing and installation. Additional support for building new factories, including subsidised land, planning permission and RDA funding could be added to this bundle where appropriate.
In addition, the UK Government should proactively target manufacturers that can fill potential capacity gaps in the supply chain, such as foundation manufacturing, and catalyse a competitive market to minimise costs.
The equivalent capacity of 7-8 new foundation factories will be required to deliver sufficient offshore wind capacity across Europe to meet the EU 2020 targets. These will attract an associated investment of £1.0-1.2bn. The Government should strive to enable a significant share of this capacity to be situated in the UK.
With significant UK based foundation manufacturing, coupled with one or two turbine manufacturing operations, the UK could expect 20% of local manufacturing and 10% of exports, resulting in 6-7,000 new jobs and approximately £1.3bn in annual revenues in 2020.
If the UK were able to attract a major new or existing turbine manufacturer to base most of its offshore wind operations in the UK, it would deliver an additional 7-8,000 new jobs.
Across the whole supply chain, an integrated RD&D and manufacturing strategy would increase jobs from 40,000 to 70,000 and revenues from £6bn to £8bn.
5. Accountability: commit to delivering offshore wind through strong leadership and clear accountability
All the recommendations above need to be in place by 2013 at the very latest. If one or more recommendation is not delivered in full and on time then 29GW of offshore wind will not by delivered by 2020. As a result it is strongly recommended that the Government publicly commit to offshore wind as the largest single contributor to meeting the EU 2020 renewable energy target in the UK.
In addition, strong Government leadership and coordination is required to deliver the recommendations. The creation of the new Department for Energy and Climate Change and the recently announced plans for a new Office for Renewable Energy Deployment are significant steps in the right direction. Chart 8a shows the extent to which pan-departmental agreement, as well as coordination with broader stakeholders, is required. The new Department for Energy and Climate Change will need to negotiate difficult trade-offs between competing stakeholders. To achieve an ambitious goal for offshore wind requires an ambitious approach from Government; without this we will see more flagship offshore wind projects suffering from delays, cost overruns and ultimately the departure of major investors – and the UK will fail to get on a path to large scale carbon reduction.
The Government also needs to be cognisant of the potential for negative public perception to disrupt plans for offshore wind. This has had a large negative impact on the growth of onshore wind, and although offshore wind is likely to provoke fewer ‘nimby’ concerns, especially given the proposed seaward buffer zone, there is still a small but significant risk that negative perception may act as a barrier to growth. Visual impact, the need for environmental trade-offs and the high costs of offshore wind may all be used as arguments against offshore wind. The Government should tackle this proactively rather than reactively, ensuring that communities see the benefits of offshore wind at a local level and communicating to the public the trade-offs that have been made.
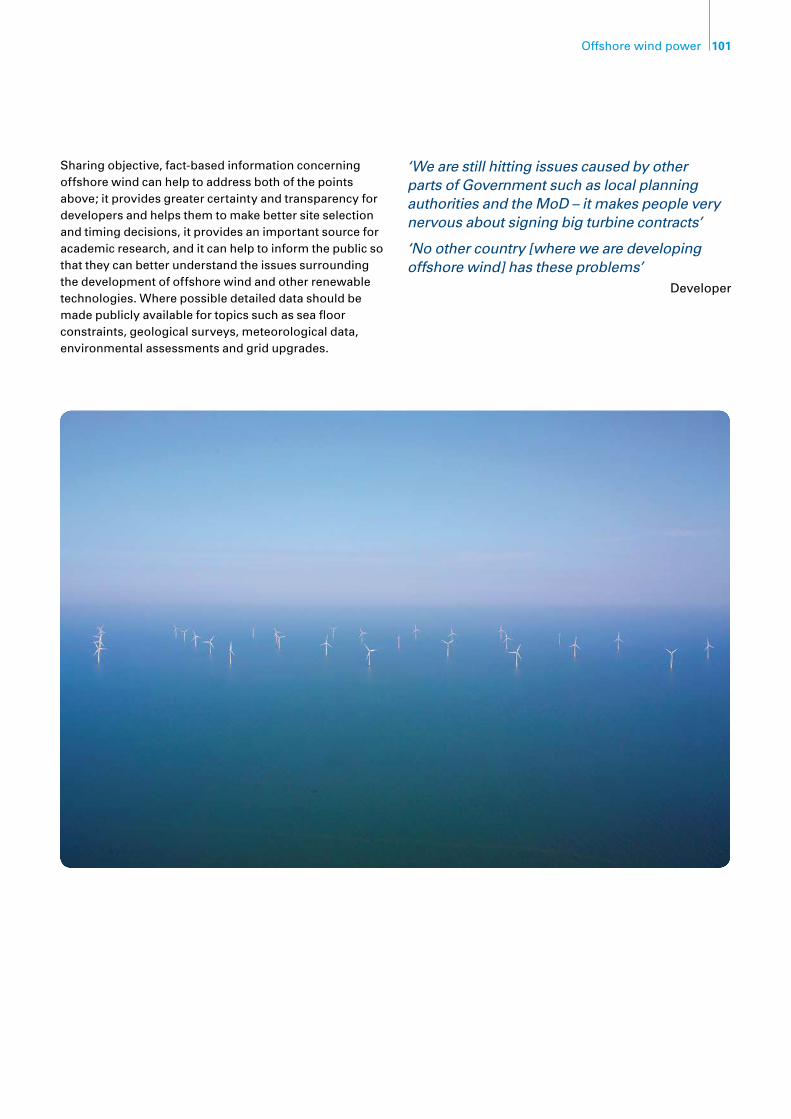
101Offshore wind power
Sharing objective, fact-based information concerning offshore wind can help to address both of the points above; it provides greater certainty and transparency for developers and helps them to make better site selection and timing decisions, it provides an important source for academic research, and it can help to inform the public so that they can better understand the issues surrounding the development of offshore wind and other renewable technologies. Where possible detailed data should be made publicly available for topics such as sea floor constraints, geological surveys, meteorological data, environmental assessments and grid upgrades.
‘We are still hitting issues caused by other parts of Government such as local planning authorities and the MoD – it makes people very nervous about signing big turbine contracts’
‘No other country [where we are developing offshore wind] has these problems’
Developer
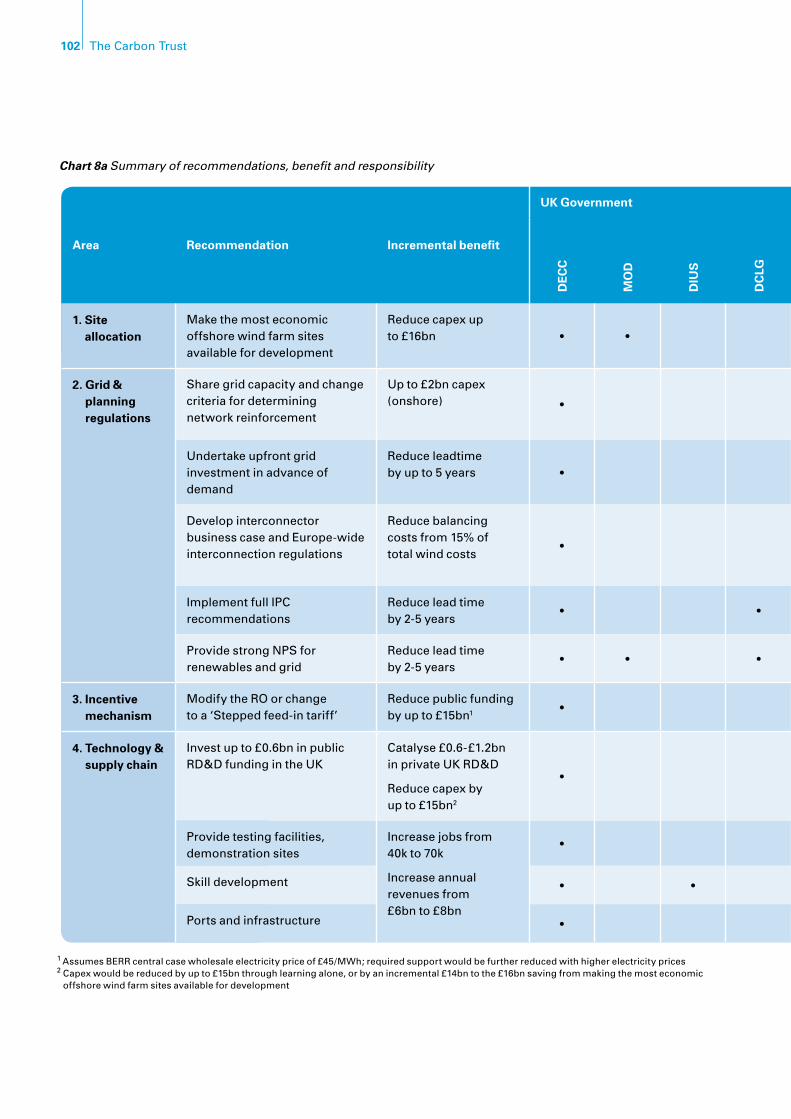
102 The Carbon Trust
Chart 8a Summary of recommendations, benefit and responsibility
Area Recommendation Incremental benefit
UK Government
Cro
wn
Est
ate
Dev
elo
per
s
Su
pp
ly C
hai
n
Oth
er
Sta
keh
old
ers
Ofg
em
DEC
C
MO
D
DIU
S
DC
LG
Tran
spo
rt
Trea
sury
Nu
mb
er 1
0
Sco
ttis
h
Exe
c.
RD
As
1. Site allocation
Make the most economic offshore wind farm sites available for development
Reduce capex up to £16bn • • • • • • • • • •
2. Grid & planning regulations
Share grid capacity and change criteria for determining network reinforcement
Up to £2bn capex (onshore) • • • • • •
Undertake upfront grid investment in advance of demand
Reduce leadtime by up to 5 years • • • • •
Develop interconnector business case and Europe-wide interconnection regulations
Reduce balancing costs from 15% of total wind costs • • • • • • •
Implement full IPC recommendations
Reduce lead time by 2-5 years • • • • •
Provide strong NPS for renewables and grid
Reduce lead time by 2-5 years • • • • • • • • • • •
3. Incentive mechanism
Modify the RO or change to a ‘Stepped feed-in tariff’
Reduce public funding by up to £15bn1 • • • • • • • •
4. Technology & supply chain
Invest up to £0.6bn in public RD&D funding in the UK
Catalyse £0.6-£1.2bn in private UK RD&D
Reduce capex by up to £15bn2
• • • • • • •
Provide testing facilities, demonstration sites
Increase jobs from 40k to 70k
Increase annual revenues from £6bn to £8bn
• • • • • •
Skill development • • • • • • •
Ports and infrastructure • • • • • • •
1 Assumes BERR central case wholesale electricity price of £45/MWh; required support would be further reduced with higher electricity prices2 Capex would be reduced by up to £15bn through learning alone, or by an incremental £14bn to the £16bn saving from making the most economic
offshore wind farm sites available for development

103Offshore wind power
Area Recommendation Incremental benefit
UK Government
Cro
wn
Est
ate
Dev
elo
per
s
Su
pp
ly C
hai
n
Oth
er
Sta
keh
old
ers
Ofg
em
DEC
C
MO
D
DIU
S
DC
LG
Tran
spo
rt
Trea
sury
Nu
mb
er 1
0
Sco
ttis
h
Exe
c.
RD
As
1. Site allocation
Make the most economic offshore wind farm sites available for development
Reduce capex up to £16bn • • • • • • • • • •
2. Grid & planning regulations
Share grid capacity and change criteria for determining network reinforcement
Up to £2bn capex (onshore) • • • • • •
Undertake upfront grid investment in advance of demand
Reduce leadtime by up to 5 years • • • • •
Develop interconnector business case and Europe-wide interconnection regulations
Reduce balancing costs from 15% of total wind costs • • • • • • •
Implement full IPC recommendations
Reduce lead time by 2-5 years • • • • •
Provide strong NPS for renewables and grid
Reduce lead time by 2-5 years • • • • • • • • • • •
3. Incentive mechanism
Modify the RO or change to a ‘Stepped feed-in tariff’
Reduce public funding by up to £15bn1 • • • • • • • •
4. Technology & supply chain
Invest up to £0.6bn in public RD&D funding in the UK
Catalyse £0.6-£1.2bn in private UK RD&D
Reduce capex by up to £15bn2
• • • • • • •
Provide testing facilities, demonstration sites
Increase jobs from 40k to 70k
Increase annual revenues from £6bn to £8bn
• • • • • •
Skill development • • • • • • •
Ports and infrastructure • • • • • • •
104 The Carbon Trust
Action required by industry and other stakeholders1. Developers to sign up to delivering round 3, subject to the UK Government delivering the recommendations above
This study suggests that round 3 offshore wind farm developments should offer attractive returns, subject to the Government providing sufficient financial incentive, relaxing offshore wind farm sites and reducing development risk, particularly through grid and planning reforms and stimulating technology improvements. This is particularly the case if electricity prices continue to be much higher than previous central scenarios.
If developers concur, they should publicly voice their enthusiasm for the development of offshore wind farms and bid for round 3 leases, thereby increasing market certainty further down the supply chain.
2. Utilities to leverage connections with the oil & gas industry to negotiate relaxation of the 6nm exclusion zone around oil & gas installations
Apart from the buffer zone from the seashore, the constraint with the greatest potential to free up attractive offshore wind farm sites is the 6nm exclusion zone around oil and gas installations. Parts of the development consortia for round 3 will have strong relationships with this industry, and should leverage these for the overall benefit of the offshore wind industry.
3. Utilities to support network sharing
Major grid upgrades will only be avoided if utilities agree that legacy generation must share network capacity with new renewable generation, such as offshore wind power. Given many utilities are offshore wind farm developers, they should collaborate in rapidly implementing these recommendations.
4. Developers to engage with the investment community to overcome the perception that offshore wind is a high risk technology
Developers will need to attract significant funding from the investment community. This will be a large departure from current developments, most of which are financed ‘on balance sheet’.
The finance community will need to be assured that offshore wind power represents a minimal risk beyond other infrastructure investments if finance costs are to be minimised.
5. Utilities to reappraise the urgency of changing the incentive mechanism to increase efficiency in a new paradigm of high electricity prices
Developers are understandably concerned that any change to the incentive mechanism might disrupt delivery of round 2 of offshore wind and other renewables.
However,anewparadigmofhighelectricitypriceshaspotentially been entered. If these levels persist, offshore wind will need significantly less incentive, particularly by the start of round 3, whilst still offering the prospect of sufficient returns.
At the least, the RO, an already complex mechanism, will need to undergo additional, significant modification. Alternatively, it may be simpler to move to a stepped feed-in tariff. The industry needs to be open to re-engage in this debate.

105Offshore wind power
6. Development consortia to accelerate purchase orders and long-term contracts to provide the supply chain with the confidence to build factory capacity and vessels
The supply chain will not have complete confidence to invest in new factory capacity and vessels until they have purchase orders. Given the lead time to build this capacity, development consortia should accelerate purchase orders or provide an equivalent level of commitment for suppliers.
Investors in vessels have an additional barrier. The ‘peaky demand’ implied by 29GW of offshore wind power by 2020 could create an investment risk given vessel payback periods of 8-10 years. A proportion of these vessels will be able to transfer to other markets, but the remainder might require reduced market risk from the development consortia, for instance, through long-term contracts or leases.
7. EU to coordinate development of European interconnection, including rules for grid and incentive mechanism cost and revenue sharing
Increasing grid interconnection, particularly across the Irish and North Seas would unlock development of more than 40GW of wind power generation.
Interconnection will need clear rules for sharing the cost of development and associated revenues between countries. In addition, each country has different incentive mechanisms. Who would benefit and by how much would need to be clarified. The responsibility for leading development and achieving agreement between countries will lie with the EU.
8. The Crown Estate to allocate round 4 if more interconnectors are likely
Additional capacity beyond round 3 will increase the market attractiveness of offshore wind, particularly by reducing the potential ‘peaky demand’ implied by 29GW by 2020. Additional capacity is likely to be dependent on more interconnectors with the UK’s neighbouring countries. Once it is known whether more interconnectors are likely (see grid section), the Crown Estate should announce a round 4 of additional offshore wind sites.
However, the most important industry action should happen in response to the Government committing to the offshore wind market and demonstrating strong leadership in implementing its actions above. With a significantly larger, more attractive offshore wind market, developers will invest the £65bn of offshore wind farm capital expense, new players will enter the market at scale and the supply chain will invest up to £4bn in global RD&D and £3.8-5.1bn in global manufacturing capacity equivalent to 30 new factories and 17-33 new vessels.
106 The Carbon Trust
The cost estimates in this paper are based on detailed modelling of the cost of offshore wind farms in different site types. Site types were characterized along three dimensions: distance from shore, water depth and wind power. Distance from shore was broken down into four segments: 0-12 nautical miles (nm) from shore, 12-30nm, 30-60nm and greater than 60nm from shore. Water depth was divided into three segments: 0-20 metres deep, 20-40m and 40-60m. Average wind power was divided into four segments: up to 700 Watts per square metre (W/m2), 700-800W/m2, 800-900W/m2 and greater than 900W/m2, all estimated at 80m above sea level. The combination of these three dimensions results in a total of 48 possible site types110.Howeverthereisalmostno sea floor with the characteristics of 15 of these 48 combinations leaving 33 viable segments (Chart A1). 5MW turbine size, a 500MW wind farm size and a 20-year wind farm lifetime were assumed for all sites.
The average wind power assumption was used to determine the revenues generated from the wind farms in different site types. From the average wind power assumption a distribution of wind speeds was derived, using a Weibull distribution with a shape factor of 2.2. The power curve for the 5MW turbine assumes no generation at wind speeds below 5m/s or above 25m/s, with maximum power output between 13m/s and 25m/s. This power curve was then combined with an estimated wind speed distribution to calculate gross electricity generation. This gross generation was then converted to net generation using estimates for array losses, electrical losses within the wind farm, offshore transmission losses, other efficiency losses and availability. Wind farm availability is assumed to fall with distance from shore (reflecting the challenges of repairing faulty equipment far offshore) and over the lifetime of a wind farm. The resulting net capacity factor for the different site types ranges from 34% for far from shore, low wind speed sites to 45% for near shore, high wind speed sites.
Costs were also modelled for a 7.5MW turbine to estimate the impact of further advances in turbine technology on the cost of building round 3. Due to reductions in installation time, maintenance visits and foundations, and a slight increase in performance, the 7.5MW turbine can reduce the cost of building round 3 by approximately 6%.
Apart from turbine costs, which were assumed to be constant across all site types, all other cost components were modelled using assumptions reflecting the unique characteristics of each site type. Some of the key cost components behave as follows:
Grid connection for the sites more than 60nm from •shoreisbyHVDCconnection;totalgridconnectioncosts for these sites are 200% higher than for the sites less than 12nm from shore (see below).
Foundation costs for sites in 40-60m deep water are •160% greater than for sites in 0-20m deep water.
Installation costs increase with both distance from •shore and water depth; costs for sites more than 60nm from shore and in 40-60m deep water are 230% higher than for sites less than 12nm from shore and in 0-20m deep water.
Operation and maintenance costs vary with the •expected replacement cycles of all the major components and as a result increase over the lifetime of the wind farm, and also increase with distance from shore.
Where an offshore wind farm is a long distance from a connection point to the transmission network, high voltagedirectcurrent(HVDC)connectioncanbemoreeconomicthanhighvoltagealternatingcurrent(HVAC)connection.AlthoughthecostofHVDCsubstationsishigherthanforHVAC,thecostperunitofHVDCcablecapacityislowerthanthatforHVAC.Inaddition,HVACtransmission losses increase significantly with cable lengthwhereasHVDChasamuchlowerlossrate.Takingthesefactorsintoaccount,HVDCgridconnectionbecomesmore economic at distances greater than 50km111.
Appendix I – modelling the capital costs and levelised costs of offshore wind
110 Less than 100km2 of sea floor in a single site type111 ThemodelassumesgridconnectioncostsforHVDCareminimizedbylocatingfaroffshorewindfarmsinthesamearea;theoptimumsizefarm
fora450kVHVDCconnectionis1.2GW,whereasfor132kVHVACtheoptimumsizeis200MWandfor220kVHVACitis300MW.

107Offshore wind power
The Government is in the process of introducing a new regulatory regime for offshore transmission. Under the new regime, owners of offshore transmission assets will require a licence and will recover the costs of building and operating these assets from offshore wind developers via National Grid’s charging methodology. For offshore wind developers this will result in a regular charge to use offshore transmission assets, rather than having to undertake capital investment and retaining ownership of the offshore transmission assets. The model assumes that this regime is introduced and that the cost of using offshore grid assets is based on a regulated return of 6.5%. Therefore the modelled offshore transmission costs form part of the operating cost for the developer rather than being an upfront investment.
To model the development of costs over time, learning rates were applied separately to each cost component of the wind farm. This analysis is outlined in further detail in Section 4, subsection ‘Cost reduction opportunities’.
The level of capacity that the incentive mechanism would support and the associated public funding required was then modelled for offshore wind, onshore wind and other renewables by Oxera consulting, using their Renewable Market Model (RMM).
For offshore wind power, two cost scenarios were used (as outlined in Section 6) with different levels of relaxation of site constraints and learning rates:
1. Higher offshore wind cost scenario: assumed that only some site constraints are relaxed (that offshore wind farms can be built within 7nm of shore in some places and that single, soft constraints are relaxed) and that the low/base learning scenario (weighted average 9%) is achieved.
2. Lower offshore wind cost scenario: assumed that in addition to the relaxation of site constraints above, multiple soft and some hard constraints are relaxed and that the middle learning scenario (weighted average 13%) is achieved.
Offshore wind supply curves were created for each offshore wind cost scenario. The same total annual installation capacity was used for both cost scenarios with annual installation capacity increasing up to 5GW/year by 2020 (Section 5, Chart 5g). Supply curves were created for each offshore wind cost scenario by assuming that the site types with the lowest levelised costs, given the site constraints of that cost scenario, would be developed in turn but with a maximum of 2GW installed per annum in site types less than 12nm from shore and 3GW per annum in any other single site type to reflect practical deployment constraints.
The supply curves for the two offshore wind cost scenarios were appended to Oxera’s set of supply curves for onshore wind power (with separate supply curves for large high wind, large low wind and small sites) and other forms of renewable energy.
Oxera’s Renewable Market Model analysed how much capacity the incentive mechanism options (outlined in Section 6) would support in each year. Where generators’ revenues per MWh were greater than each type of renewables’ supply curve, the incentive mechanism was assumed to support that amount of capacity.
For the Renewable Obligation incentive mechanism options, generators’ revenues are the wholesale electricity price, Levy Exception Certificate (LEC) and 90% of the ROC value (multiplied by the band for each renewable technology) minus balancing costs. Only 90% of the ROC value was assumed to pass onto the generators due to ‘regulatory risk’ (see Section 6, ‘Option 1: Increased RO with constant bands’). For the feed-in tariff (FIT) options, generators’ revenue is the FIT tariff level. Balancing costs are not deducted from the FIT tariff level but are added to the public funding required.
Balancing costs were estimated at 10% of wholesale electricity price and LEC, an approximation of the £5.4/MWh balancing cost reached by 2020 (see Section 3, subsection ‘Short-term’). Load factor costs are born by the overall system rather than the new renewable generation capacity and so are not incorporated into the incentive mechanism analysis. (Load factor costs are incorporated into the net additional system cost analysis – see Section 7: ‘The cost of offshore wind’.)
An unlevered, pre-tax project rate of return of 10% is used in all calculations unless otherwise stated; this assumes a cost of debt of 7-8%, and required equity returns of 15-17%. The euro/sterling exchange rate remains constant at 1.4.
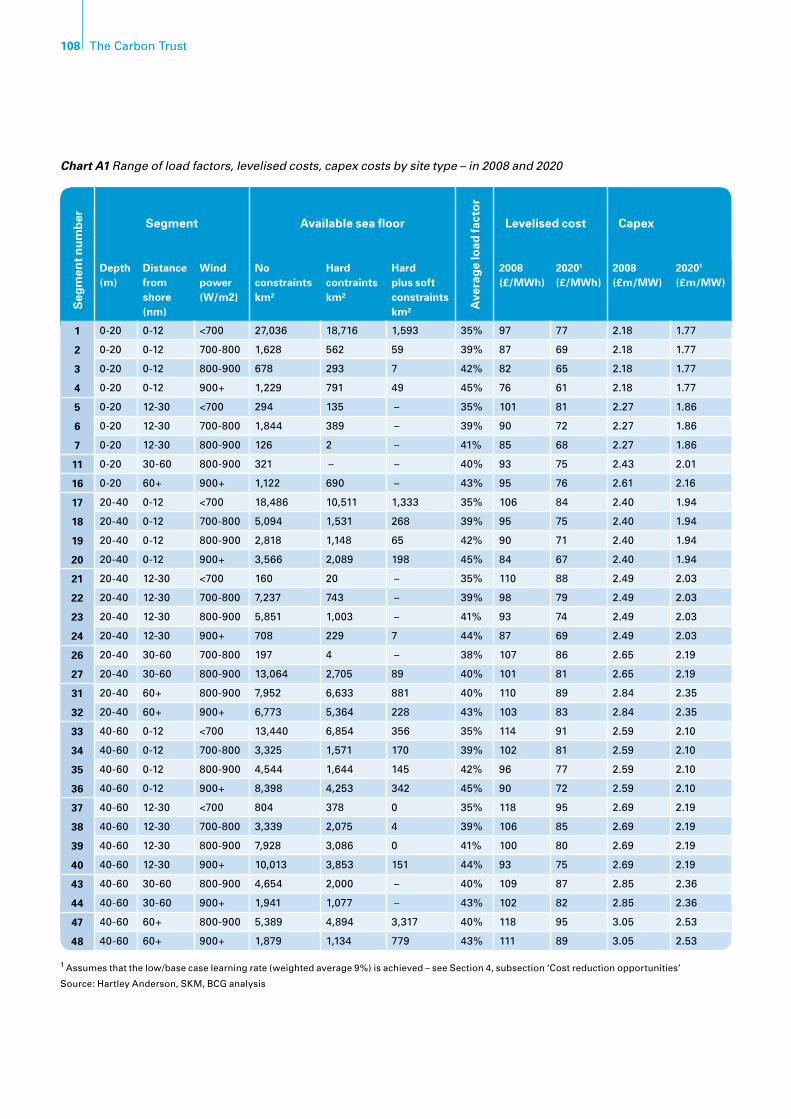
108 The Carbon Trust
Chart A1 Range of load factors, levelised costs, capex costs by site type – in 2008 and 2020
Seg
men
t nu
mb
er Segment Available sea floor
Ave
rag
e lo
ad fa
cto
r
Levelised cost Capex
Depth (m)
Distance from shore (nm)
Wind power (W/m2)
No constraints km²
Hard contraints km²
Hard plus soft constraints km²
2008 (£/MWh)
20201 (£/MWh)
2008 (£m/MW)
20201 (£m/MW)
1 0-20 0-12 <700 27,036 18,716 1,593 35% 97 77 2.18 1.77
2 0-20 0-12 700-800 1,628 562 59 39% 87 69 2.18 1.77
3 0-20 0-12 800-900 678 293 7 42% 82 65 2.18 1.77
4 0-20 0-12 900+ 1,229 791 49 45% 76 61 2.18 1.77
5 0-20 12-30 <700 294 135 – 35% 101 81 2.27 1.86
6 0-20 12-30 700-800 1,844 389 – 39% 90 72 2.27 1.86
7 0-20 12-30 800-900 126 2 – 41% 85 68 2.27 1.86
11 0-20 30-60 800-900 321 – – 40% 93 75 2.43 2.01
16 0-20 60+ 900+ 1,122 690 – 43% 95 76 2.61 2.16
17 20-40 0-12 <700 18,486 10,511 1,333 35% 106 84 2.40 1.94
18 20-40 0-12 700-800 5,094 1,531 268 39% 95 75 2.40 1.94
19 20-40 0-12 800-900 2,818 1,148 65 42% 90 71 2.40 1.94
20 20-40 0-12 900+ 3,566 2,089 198 45% 84 67 2.40 1.94
21 20-40 12-30 <700 160 20 – 35% 110 88 2.49 2.03
22 20-40 12-30 700-800 7,237 743 – 39% 98 79 2.49 2.03
23 20-40 12-30 800-900 5,851 1,003 – 41% 93 74 2.49 2.03
24 20-40 12-30 900+ 708 229 7 44% 87 69 2.49 2.03
26 20-40 30-60 700-800 197 4 – 38% 107 86 2.65 2.19
27 20-40 30-60 800-900 13,064 2,705 89 40% 101 81 2.65 2.19
31 20-40 60+ 800-900 7,952 6,633 881 40% 110 89 2.84 2.35
32 20-40 60+ 900+ 6,773 5,364 228 43% 103 83 2.84 2.35
33 40-60 0-12 <700 13,440 6,854 356 35% 114 91 2.59 2.10
34 40-60 0-12 700-800 3,325 1,571 170 39% 102 81 2.59 2.10
35 40-60 0-12 800-900 4,544 1,644 145 42% 96 77 2.59 2.10
36 40-60 0-12 900+ 8,398 4,253 342 45% 90 72 2.59 2.10
37 40-60 12-30 <700 804 378 0 35% 118 95 2.69 2.19
38 40-60 12-30 700-800 3,339 2,075 4 39% 106 85 2.69 2.19
39 40-60 12-30 800-900 7,928 3,086 0 41% 100 80 2.69 2.19
40 40-60 12-30 900+ 10,013 3,853 151 44% 93 75 2.69 2.19
43 40-60 30-60 800-900 4,654 2,000 – 40% 109 87 2.85 2.36
44 40-60 30-60 900+ 1,941 1,077 – 43% 102 82 2.85 2.36
47 40-60 60+ 800-900 5,389 4,894 3,317 40% 118 95 3.05 2.53
48 40-60 60+ 900+ 1,879 1,134 779 43% 111 89 3.05 2.53
1 Assumes that the low/base case learning rate (weighted average 9%) is achieved – see Section 4, subsection ‘Cost reduction opportunities’
Source:HartleyAnderson,SKM,BCGanalysis

www.carbontrust.co.uk
Neither the Carbon Trust nor its consultants involved in the development of this report accept any liability for the information contained in the report. The report is being made available to you as part
of the Carbon Trust’s general activity of promoting deployment of, and investment in, low carbon technology. The report is for guidance purposes only. Use of the report does not constitute advice and
you must take your own view on the merits of, and the risks attached to, any decision you may make. You may wish to obtain professional advice.

The Carbon Trust was set up by the United Kingdom Government in 2001 as an independent company.
Our mission is to accelerate the move to a low carbon economy by working with organisations to reduce carbon emissions and develop commercial low carbon technologies.
We do this through five complementary business areas:
Insights – explains the opportunities surrounding climate change Solutions – delivers carbon reduction solutions Innovations – develops low carbon technologies Enterprises – creates low carbon businesses Investments – finances clean energy businesses.
www.carbontrust.co.uk
The Carbon Trust is funded by the Department for Environment, Food and Rural Affairs (Defra), the Department for Business, Enterprise and Regulatory Reform, the Scottish Government, the Welsh Assembly Government and Invest Northern Ireland.
Whilst reasonable steps have been taken to ensure that the information in this publication is correct, neither the Carbon Trust nor any of BCG, its agents, contractors and sub-contractors give any warranty or make any representations as to its accuracy, nor do they accept any liability for any errors or omissions. The study should not be used or relied upon by anyone without independent investigation and analysis and neither the Carbon Trust nor BCG, its agents, contractors or sub-contractors assume any liability for any such use or reliance by third parties or for any loss arising therefrom. Any trademarks, service marks or logos used in this publication, and copyright in it, are the property of the Carbon Trust. Nothing in this publication shall be construed as granting any licence or right to use or reproduce any of the trademarks, service marks, logos, copyright or any proprietary information in any way without the Carbon Trust’s prior written permission. The Carbon Trust enforces infringements of its intellectual property rights to the full extent permitted by law.
The Carbon Trust is a company limited by guarantee and registered in England and Wales under Company number 4190230 with its Registered Office at: 8th Floor, 3 Clement’s Inn, London WC2A 2AZ.
Printed on paper containing a minimum of 75% recycled, de-inked post-consumer waste.
Published in the UK: October 2008.
© The Carbon Trust 2008. All rights reserved. CTC743
ACT ON CO2 is the Government’s initiative to help individuals understand and reduce their carbon footprint. Visit http://actonco2.direct.gov.uk for more information.