Embed Size (px)
Citation preview

Offshore Wind for America
The promise and potential of clean energy off our coasts

Written by:
Bryn Huxley-Reicher, Frontier Group
Hannah Read, Environment America Research & Policy Center
Offshore Wind for AmericaThe promise and potential of clean energy off our coasts
March 2021
Acknowledgments
The authors thank Nathanael Greene, Senior Renewable Energy Advocate, Climate and Clean Energy Program, Natural Resources Defense Council; Val Stori, Project Director, Clean Energy Group/Clean Energy States Alliance; Amber Hewett, Senior Campaign Manager for Offshore Wind Energy, National Wildlife Federation; Eileen Woll, Offshore Energy Program Director, Virginia Chapter Sierra Club; Bill O’Hearn, Executive VP for External Affairs, Offshore Power LLC; Matthew Greller, Principal, Matthew Greller Esq. LLC; and the American Clean Power Asso-ciation for their review of drafts of this document, as well as their insights and suggestions. Thanks also to Gideon Weissman, Tony Dutzik and Susan Rakov of Frontier Group for editorial support. Some content in this report was previously published in Wind Power to Spare: The Enormous Energy Potential of Atlantic Offshore Wind by Gideon Weiss-man and R.J. Cross of Frontier Group and Rob Sargent of Environment America Research & Policy Center.
Environment America Research & Policy Center thanks the Bydale Foundation, the Energy Foundation and the Fund for New Jersey for making this report possible. The recommendations are those of Environment America Research & Policy Center. The authors bear responsibility for any factual errors. The views expressed in this report are those of the authors and do not necessarily reflect the views of our funders or those who provided review.
2021 Environment America Research & Policy Center. Some Rights Reserved. This work is licensed under a Creative Commons Attribution Non-Commercial No Derivatives 3.0 Unported License. To view the terms of this license, visit creativecommons.org/licenses/by-nc-nd/3.0.
Environment America Research & Policy Center is a 501(c)(3) organization. We are dedicated to protecting our air, water and open spaces. We investigate problems, craft solutions, educate the public and decision-makers, and help the public make their voices heard in local, state and national debates over the quality of our environment and our lives. For more information about Environment America Research & Policy Center or for additional copies of this report, please visit www.environmentamericacenter.org.
Frontier Group provides information and ideas to build a healthier, more sustainable America. We focus on prob-lems that arise from our nation’s material and technological wealth – the problems of abundance. We deliver timely research and analysis that is accessible to the public, applying insights gleaned from diverse fields of knowledge to arrive at new paths forward. For more information about Frontier Group, please visit www.frontiergroup.org.
Layout: Alec Meltzer/meltzerdesign.net
Cover photo: A turbine in the Block Island wind farm, Rhode Island. Photo credit: Gary Norton/NREL
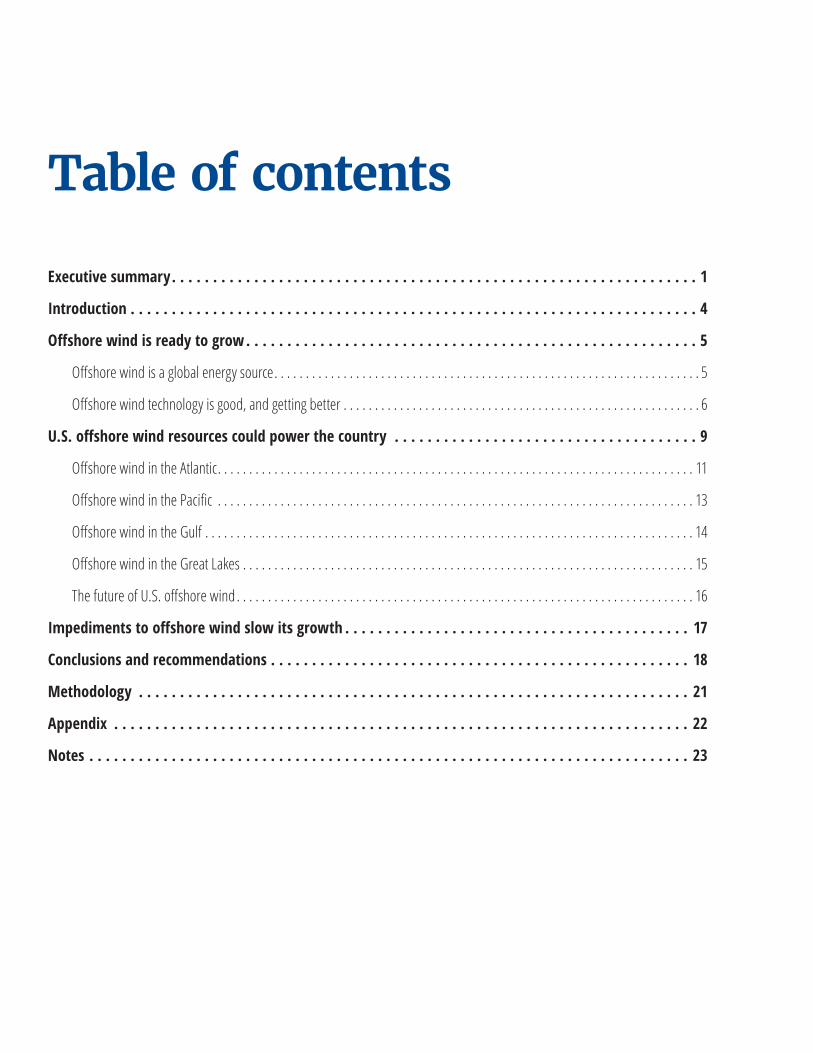
Table of contents
Executive summary . . . . . . . . . . . . . . . . . . . . . . . . . . . . . . . . . . . . . . . . . . . . . . . . . . . . . . . . . . . . . . . . 1
Introduction . . . . . . . . . . . . . . . . . . . . . . . . . . . . . . . . . . . . . . . . . . . . . . . . . . . . . . . . . . . . . . . . . . . . . 4
Offshore wind is ready to grow . . . . . . . . . . . . . . . . . . . . . . . . . . . . . . . . . . . . . . . . . . . . . . . . . . . . . . . 5
Offshore wind is a global energy source . . . . . . . . . . . . . . . . . . . . . . . . . . . . . . . . . . . . . . . . . . . . . . . . . . . . . . . . . . . . . . . . . . . . 5
Offshore wind technology is good, and getting better . . . . . . . . . . . . . . . . . . . . . . . . . . . . . . . . . . . . . . . . . . . . . . . . . . . . . . . . . 6
U.S. offshore wind resources could power the country . . . . . . . . . . . . . . . . . . . . . . . . . . . . . . . . . . . . . 9
Offshore wind in the Atlantic . . . . . . . . . . . . . . . . . . . . . . . . . . . . . . . . . . . . . . . . . . . . . . . . . . . . . . . . . . . . . . . . . . . . . . . . . . . . 11
Offshore wind in the Pacific . . . . . . . . . . . . . . . . . . . . . . . . . . . . . . . . . . . . . . . . . . . . . . . . . . . . . . . . . . . . . . . . . . . . . . . . . . . . 13
Offshore wind in the Gulf . . . . . . . . . . . . . . . . . . . . . . . . . . . . . . . . . . . . . . . . . . . . . . . . . . . . . . . . . . . . . . . . . . . . . . . . . . . . . . 14
Offshore wind in the Great Lakes . . . . . . . . . . . . . . . . . . . . . . . . . . . . . . . . . . . . . . . . . . . . . . . . . . . . . . . . . . . . . . . . . . . . . . . . 15
The future of U .S . offshore wind . . . . . . . . . . . . . . . . . . . . . . . . . . . . . . . . . . . . . . . . . . . . . . . . . . . . . . . . . . . . . . . . . . . . . . . . . 16
Impediments to offshore wind slow its growth . . . . . . . . . . . . . . . . . . . . . . . . . . . . . . . . . . . . . . . . . . 17
Conclusions and recommendations . . . . . . . . . . . . . . . . . . . . . . . . . . . . . . . . . . . . . . . . . . . . . . . . . . . 18
Methodology . . . . . . . . . . . . . . . . . . . . . . . . . . . . . . . . . . . . . . . . . . . . . . . . . . . . . . . . . . . . . . . . . . . 21
Appendix . . . . . . . . . . . . . . . . . . . . . . . . . . . . . . . . . . . . . . . . . . . . . . . . . . . . . . . . . . . . . . . . . . . . . . 22
Notes . . . . . . . . . . . . . . . . . . . . . . . . . . . . . . . . . . . . . . . . . . . . . . . . . . . . . . . . . . . . . . . . . . . . . . . . . 23

1 Offshore Wind for America
Executive summary
The United States currently relies heavily on fos-sil fuels to heat our homes, fuel our cars, power our machines and produce electricity, harming
our health and our climate.1
Across the country, however, America is beginning to embrace the promise of clean, renewable energy. Today, the U.S. gets about 11.5% of our electricity from wind, solar and geothermal sources, up from about 0.6% two decades ago.2 America’s abundant renewable energy resources, coupled with energy efficiency measures and technological advances that make renewable energy cheaper and better than ever, open the possibility of transitioning our entire economy to run on 100% renewable energy.
To get there, we must take advantage of a massive and underutilized energy resource just off our coasts: offshore wind. That will require policymakers to remove the barriers slowing down the growth of the offshore wind industry, and instead support and hasten that growth to provide clean energy where it’s needed most.
Offshore wind has the technical capacity to power the country with clean energy. The United States has the technical potential to produce more than 7,200 terawatt-hours (TWh) of electricity from offshore wind, which is almost two times the amount of electricity the U.S. consumed in 2019 and about 90% of the amount of electricity the nation would consume in 2050 if we electrified our buildings, transportation system and industry and transitioned them to run on electricity instead of fossil fuels.3
Nineteen of the 29 states with offshore wind potential have the technical capacity to produce more electricity from offshore wind than they used in 2019. And 11 of them have the technical capacity to produce more electricity than they would use in 2050 if the country electrified homes and commercial buildings, transpor-tation and industry. While the U.S. neither will, nor should, develop all of its technical potential for offshore wind energy, the sheer size of the resource illustrates the critical contribution that offshore wind can make toward an energy system powered by 100% renewable energy.
0
2,000
4,000
6,000
8,000
U.S. offshore windtechnical potential
2050 U.S.electricity usage
with fullelectrification
2019 U.S.electricity usage
Tera
watt-
hour
s (TW
h)
7203
3811
7930
Figure ES-1: U.S. offshore wind technical potential and electricity usage (electrification scenario based on research by National Renew-able Energy Laboratory)
Executive summary 2
Every coastal region of the United States has offshore wind potential, though opportunities and obstacles to offshore wind development vary by region.
• The Atlantic region – from Maine to Florida – has the technical potential to produce almost 4,600 TWh of electricity each year, more than four times as much power as those states used in 2019, and almost twice as much as they would use in 2050 if the country underwent maximal electrification, based on estimates from the National Renewable Energy Laboratory. The Atlantic region, especially the Northeast, has strong, consistent wind and a wide, shallow continental shelf, making deployment of offshore wind relatively straightforward using existing technology.
• The Pacific region – including Hawaii but exclud-ing Alaska – has the technical potential to pro-duce almost 869 TWh of electricity each year from offshore wind, more than twice as much as it used in 2019, and almost 90% of what it is projected to use in 2050, assuming maximum elec-trification. The Pacific region has a very narrow
continental shelf, resulting in much of the wind resource being in deep water and necessitating the use of floating turbines.
• The Gulf region – Texas, Louisiana, Mississippi and Alabama – has the technical potential to produce more than 1,400 TWh of electricity each year from offshore wind generation, more than twice the amount of electricity the region used in 2019 and over 20% more electricity than the region would use in 2050 assuming the country undergoes maximum possible electrification. The Gulf region’s low wind speeds and many conflicting uses reduce the area available for offshore wind development.
• The Great Lakes region – Illinois, Indiana, Michi-gan, Minnesota, Pennsylvania, Ohio and Wisconsin – has the technical potential to produce 344 TWh of electricity each year from offshore wind gener-ation, almost half as much as it used in 2019 and about one fifth as much as it is projected to use in 2050 after maximal electrification. The Great Lakes region is limited in usable area and hampered by winter ice floes that could damage floating turbines.5
Tera
watt-
hour
s (TW
h)
0
1,000
2,000
3,000
4,000
5,000
Great LakesGulf of MexicoPacificAtlantic
Offshore wind technical potential
2050 electricity usage with full electrification
2019 electricity usage
344
1115
2351
4574
401
1014 869660
11581416
772
1769
Figure ES-2: Regional offshore wind technical potential and electricity usage

3 Offshore Wind for America
Out of every state in the U.S., Massachusetts has the largest potential offshore wind generation capacity, while Maine has the highest ratio of potential genera-tion capacity to electricity usage.
Offshore wind technology is advanced and proven, widely deployed in Europe and Asia, and continues to improve.
• There are more than 5,500 offshore turbines cur-rently deployed around the world, and more than 27 gigawatts (GW) of installed generating capacity – enough to power 7.3 million U.S. homes.6
• The average capacity of the turbines currently installed is more than 12 times larger than that of the turbines in the first offshore wind farm built in 1991, and today’s turbines are hundreds of feet taller and more efficient even than turbines installed in 2010.7 They are being installed in much deeper water, and tens of miles farther from shore.8
• Turbines that will be available in the next few years promise a new level of efficiency and generation capacity and could help reduce the costs of offshore wind while helping it power more of our energy needs.9
The United States already has many projects in the development pipeline. In addition to the two opera-tional pilot projects, there are 34 proposals for offshore wind development, which includes 27 projects in various stages of planning and development.10 Together, they total more than 26 GW of site capacity.11 The U.S. is
set to see huge growth in offshore wind, which will help mature the industry and continue to drive down costs.
Offshore wind can help repower the U.S. with clean energy – but taking advantage of the opportunity will require support from policymakers and regulatory bodies. To help the industry grow, and to hasten the transition to renewable energy, governments and regula-tory agencies at all levels should:
• Provide market certainty for offshore wind, as Con-necticut, Maryland, Massachusetts, New Jersey, New York and Virginia have done by setting enforceable targets for offshore wind deployment.
• Support domestic supply chain development.
• Set national standards to ensure the environmental integrity of offshore wind projects and to avoid, minimize and mitigate impacts to marine ecosys-tems and wildlife.
• Direct the Bureau of Ocean Energy Management and relevant state agencies to accelerate the offshore wind leasing and permitting process while ensuring transparency and environmental responsibility.
• Increase and extend tax credits for offshore wind power.
• Plan for regional offshore wind development, includ-ing transmission infrastructure.
• Support research and development of new offshore wind technologies.

Introduction 4
Introduction
Building a world powered by 100% renewable energy will make us both healthier and safer. To get there, we need to make simultaneous use of
every source of renewable energy because each has its unique advantages and complements the others.
For the United States, offshore wind energy is a largely untapped resource with many benefits – a key element of a future energy system powered by renewable energy.
Offshore wind energy is abundant. As is discussed in this report, the U.S. has the technical capacity to meet its 2019 electricity demand almost twice over with power from offshore wind. Even if we electrified homes and businesses, transportation and industry – replacing fossil fuel-powered appliances, vehicles and machinery with electricity-powered alternatives – by 2050, offshore wind could theoretically meet nearly all of that electricity demand. While using the entirety of the U.S. offshore wind resource is unlikely, impractical and would have far too high an environmental impact, we will need to take advantage of the enormous benefits of offshore wind to transition to a 100% renewable energy system.
Offshore wind is also conveniently located near major sources of electricity demand. About 40% of the Amer-ican population lives in counties on the coast of an
ocean or Great Lake.12 That means power generated by offshore wind does not have to travel far to get where it is needed, reducing the difficulty of transitioning to 100% renewable power.
And finally, offshore wind is reliable. Because wind on the water tends to be strong and consistent, offshore wind turbines can have very high capacity factors, meaning they turn wind into electricity consistently.13 Offshore wind is also strongest – and therefore gen-erates the most power – when we will need it after transitioning our buildings, vehicles and industry to run on electricity: during the winter months, when the East Coast will be heating buildings; and during the afternoon and evening, when electricity demand is at its peak.14
These characteristics – abundance, convenience and reliability – make offshore wind an integral piece of a 100% renewable energy system, complementing other sources of energy like solar and geothermal. It fits our needs and can help make us, and the climate, healthier. To take advantage of offshore wind’s immense potential, however, policymakers need to act quickly to remove barriers to offshore wind development while ensuring and accelerating its growth.

5 Offshore Wind for America
Offshore wind is ready to grow
Offshore wind is a large and growing source of energy around the world, and is poised for rapid growth in the U.S. The technology has
improved dramatically, with larger turbines generating much more power and turbines successfully being put much farther from shore and in much deeper water. New announcements promise still better designs, opening up even more area for possible deployment of offshore wind turbines. This section explores the cur-rent state of offshore wind technology and its presence around the world.
Offshore wind is a global energy sourceOffshore wind is widely used in Europe and China and is being adopted elsewhere in the world. Global offshore wind capacity topped 27 GW by early 2020, though the U.S. represents less than two-tenths of 1% of that.15
Globally, 6.1 GW of installed capacity was added in 2019, almost 40% of it by China and almost all of the rest by Germany, Denmark, the United Kingdom and Belgium.16 Those five countries are also those with the largest total installed offshore wind capacity, accounting for the vast majority of the world’s offshore wind production.17
Capa
city o
f new
insta
llatio
ns (G
W)
0
1
2
3
4
5
6
20192018201720162015201420132012201120102009200820072006
0 .1 0 .2 0 .5 0 .61 1
1 .31 .7 1 .7
3 .4
2 .2
4 .5 4 .3
6 .1
Figure 1: Global offshore wind installations by year18
Offshore wind is ready to grow 6
As of 2019, there were more than 5,500 offshore wind turbines powering the grid in 17 countries around the world.19 That capacity is set to expand rapidly, with about 150 projects in 19 countries – including all over Asia, Oceania, Europe and the U.S. – in the pipeline.20 According to NREL’s 2019 Offshore Wind Technology Data Update, that global pipeline represents more than 200 GW of capacity coming online in the near future.21
The rest of the world is setting big goals, too. The Euro-pean Union, for instance, recently set a goal to expand its offshore wind capacity from 12 GW to 60 GW by 2030, and 300 GW by 2050.22
The U.S. is currently far behind the leaders in offshore wind. But, with the projects in the pipeline and the upcoming growth in the domestic supply chain, the U.S. could soon become a major producer of offshore wind turbines and of power from offshore wind.
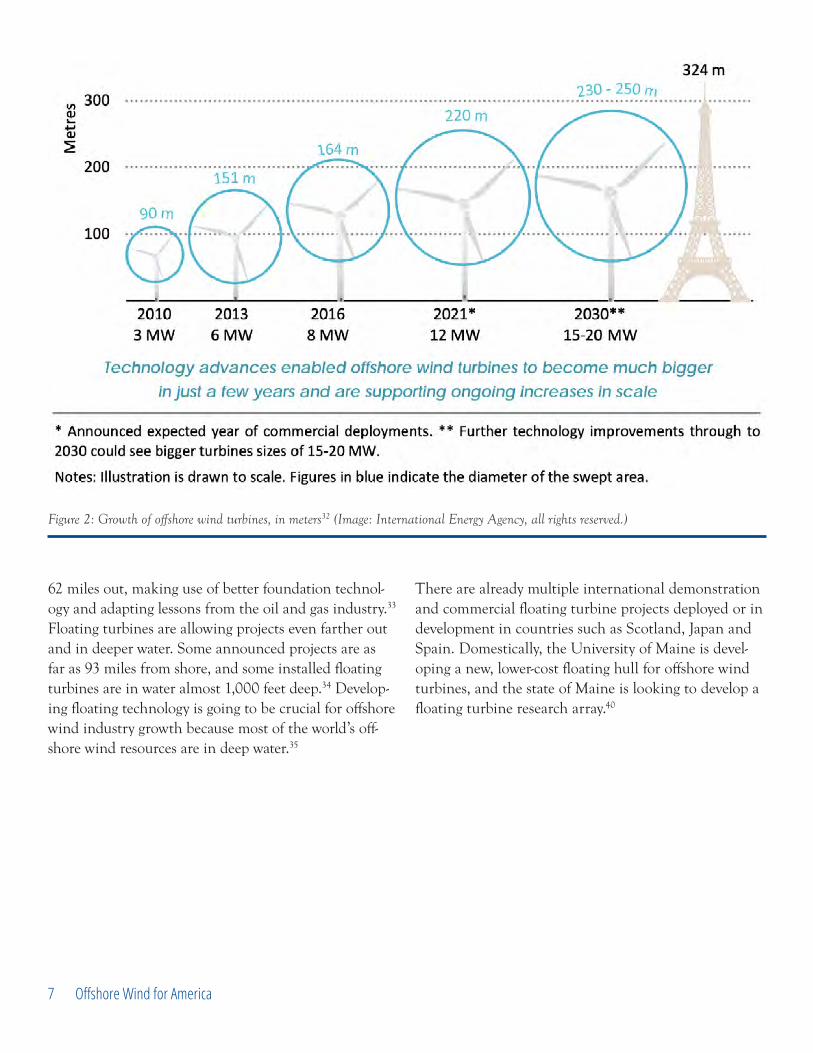
Offshore wind technology is good, and getting betterOffshore wind technology has advanced dramatically in recent decades, enabling offshore wind farms to pro-duce more energy more efficiently than ever before.
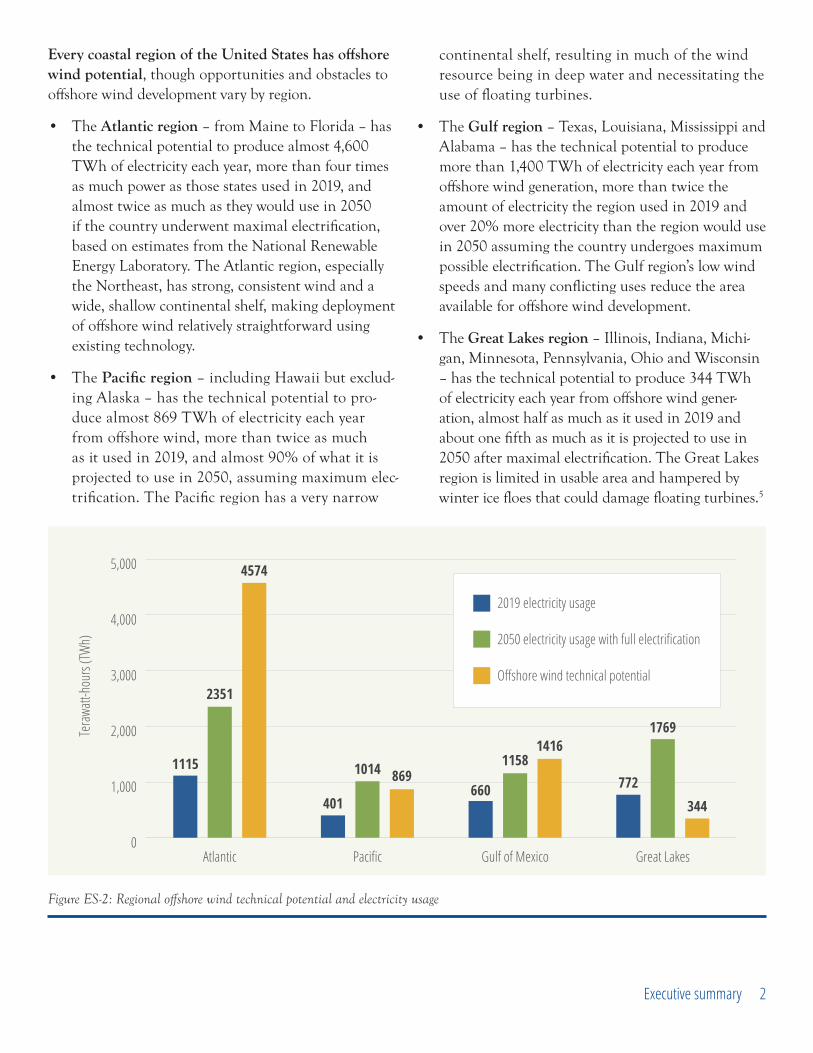
Denmark’s Vindeby, the first offshore wind farm in the world, installed in 1991, had 11 turbines, each with a capacity under half a megawatt (MW), and used onshore turbines placed on concrete foundations in shallow water.23 In 2019, by contrast, the average capac-ity of installed offshore wind turbines around the world was over 6 MW, with the average capacity per turbine for projects coming online in 2025 anticipated to reach 11 MW worldwide – a roughly 20-fold improvement over the first generation of turbines.24
A big piece of the growth in capacity of offshore wind turbines has been the increase in height and rotor diameter. In 2010, the tip of a 3 MW turbine – the larg-est turbine commercially available that year – reached about 330 feet high, just a bit taller than the Statue of Liberty.25 Just six years later, an 8 MW turbine had a tip height of almost 660 feet.26 As the turbines increase in size, they are also able to capture more energy from the wind, and the average capacity factor of installed
turbines – the percentage of their technical capacity for generating power that is actually realized – increased from 38% in 2010 to 43% in 2018.27
Two recently announced turbines – which are taller and have bigger rotors, have higher efficiency, and can generate more power – are promising to push the indus-try even further. Siemens Gamesa, the largest turbine supplier in the world, has announced a 15 MW turbine with a 730-foot diameter rotor, which will be available in 2024.28 General Electric’s Haliade-X turbine, the first prototype of which was installed in the Netherlands, promises capacity of between 12 MW and 14 MW capacity, an 850-foot height and 720-foot rotor diame-ter, and a 60%-64% capacity factor.29
This new generation of turbines could be deployed in the U.S. to enormous effect: At full power, the Hali-ade-X turbine can generate enough power in under seven seconds to serve an average American home for a day.30 And developers of U.S. projects are taking notice: Vineyard Wind recently announced that it will use Hali-ade-X turbines in the 800 MW wind farm planned off the coast of Martha’s Vineyard in Massachusetts.31
Offshore wind projects are also moving farther from shore. While older projects were mostly within 31 miles of land, new projects being commissioned are more than
Wind turbines at the Vindeby wind farm. Photo credit: Siemens AG/NREL
7 Offshore Wind for America
62 miles out, making use of better foundation technol-ogy and adapting lessons from the oil and gas industry.33 Floating turbines are allowing projects even farther out and in deeper water. Some announced projects are as far as 93 miles from shore, and some installed floating turbines are in water almost 1,000 feet deep.34 Develop-ing floating technology is going to be crucial for offshore wind industry growth because most of the world’s off-shore wind resources are in deep water.35
There are already multiple international demonstration and commercial floating turbine projects deployed or in development in countries such as Scotland, Japan and Spain. Domestically, the University of Maine is devel-oping a new, lower-cost floating hull for offshore wind turbines, and the state of Maine is looking to develop a floating turbine research array.40
Figure 2: Growth of offshore wind turbines, in meters32 (Image: International Energy Agency, all rights reserved.)

Offshore wind is ready to grow 8
Fixed-bottom vs. floating turbines: what’s the difference? Fixed-bottom turbines use piles driven or drilled into the sea floor; large-diameter shallow cylinders slightly embedded in the sea floor; or wide, heavy bases that rest on the sea floor to stabilize rigid tow-ers and support the turbine.36 Types of foundations include monopiles, jacket foundations, tripods, jack-up foundations, suction buckets and gravity foundations, which work best in different depths and with different sea floor conditions.37
Floating turbines use buoyant hulls and steel struc-tures that float or ride under the surface of the water
to support and provide stability to the turbine, and are anchored to the sea floor with cables.38 Types of floating turbines include spars, semi-submersible hulls and tension leg platforms, as well as some second-generation hybrid designs, which all work in much deeper water than fixed-bottom foundations, possibly at depths greater than 3,000 feet.39
Both fixed-bottom and floating platforms are being improved as companies look to lower costs, reduce impacts, support larger turbines and access new areas for offshore wind development.
From left to right: a monopile, jacket, twisted tripod, floating semi-submersible, floating tension leg platform and floating spar. Image: Josh Bauer/NREL-Department of Energy41

9 Offshore Wind for America
U.S. offshore wind resources could power the country
As the U.S. looks to transition away from fossil fuels and towards renewable energy, offshore wind stands out as an abundant energy source
and a powerful solution for delivering clean electricity to major population centers.42 While Europe and Asia have large and fast-growing offshore wind industries, the U.S. has very little installed capacity, and no domestic supply chain. What the country does have, however, is enor-mous potential for offshore wind generation, and the beginnings of a large, reliable offshore generation sector in the Atlantic, Pacific, Gulf of Mexico and Great Lakes.
There are 29 coastal and Great Lakes states with the potential for offshore wind generation, not counting Alaska.43 According to the National Renewable Energy Laboratory (NREL), those states have the technical potential to produce 7,200 terawatt-hours (TWh) of electricity annually. This is almost twice as much as the 3,800 TWh of electricity the entire nation used in 2019, and about 90% of the approximately 7,900 TWh the country might use in 2050 if we electrified as much of our energy use in buildings, transportation and indus-try as possible.
The trend of increasing capacity factors in current and future turbines means that technical potential for off-shore wind could be even higher than the figures used in this report.
More specifically, 19 of the 29 states with offshore wind potential have the technical potential to produce more power in a year from offshore wind than they used in their entire economies in 2019. And 11 of them have the technical potential to produce more power than they would use in 2050, even if our country electri-fied buildings, transportation and industry as much as possible. But there are significant variations among regions and individual states in offshore wind potential, and in the opportunities and hurdles facing offshore wind development. The following sections explore the offshore wind resources and requirements in the four regions of the country that have such resources: the Atlantic states, the Pacific states, the Gulf states and the Great Lakes states.
0
2,000
4,000
6,000
8,000
U.S. offshore windtechnical potential
2050 U.S.electricity usage
with fullelectrification
2019 U.S.electricity usage
Tera
watt-
hour
s (TW
h)
7203
3811
7930
Figure 3: U.S. offshore wind technical potential and electricity use

U .S . offshore wind resources could power the country 10
What is technical potential? “Technical potential” as used in this report rep-resents the potential generating capacity after geographic, conflicting use and technological limitations have been taken into consideration. NREL defines such potential as the “subset of [total] resource potential that can be considered recover-able using available technology within reasonable limits,” and considers “nominal land-use and envi-ronmental siting constraints… system performance and loss criteria, conflicting use and environmental constraints, and technology limits” in calculating state-by-state technical potential.44
New turbines are larger and have higher capacity factors than those used in NREL’s modeling of tech-nical potential, and the turbines that will become
available in the next few years continue those trends. Actual technical potential using currently available technology or technology available in the near future, therefore, could be even higher than the figures used in this report.
The technical potential of offshore wind is the theoretical maximum for a technology that can play an important role in building a 100% renew-able energy system for the U.S. Offshore wind’s impact on that transition to renewable energy can be large even if only a fraction of its technical potential is deployed. That fact is crucial, because developing offshore wind to its technical potential is unnecessary and could have damaging environ-mental impacts.
Figure 4: Offshore wind speed at 100m height45

11 Offshore Wind for America
Offshore wind in the AtlanticStates: Connecticut, Delaware, Florida, Georgia, Maine, Maryland, Massachusetts, New Hampshire, New Jersey, New York, North Carolina, Rhode Island, South Carolina and Virginia46
States on the Atlantic coast of the United States accounted for almost 30% of the nation’s 2019 electric-ity consumption and used more electricity in 2019 than any nation in the world besides China, India and the United States did in 2018.47 The population of Atlantic states in 2019 was almost 106 million, representing nearly a third of the total U.S. population.48
The Atlantic coast has the largest offshore wind poten-tial of any region of the country. With 29,369 miles of coastline and a shallow continental shelf that allows for fixed turbines far from shore, there is a tremendous amount of area along the eastern U.S. that could pro-duce energy.49
In fact, as a region, the Atlantic states have the technical potential to produce almost 4,600 TWh of electricity, more than four times as much electricity as those states consumed in 2019, and almost twice as much as they would use in 2050 if the country underwent maximal electrification of transportation, buildings and industry.
Of the 14 states along the Atlantic seaboard, 12 have the technical potential to produce more electricity from offshore wind than they used in 2019, and seven have the potential to produce more than they would use in 2050 if the country electrified as much as possible.
Massachusetts has far and away the highest technical potential for offshore generation at more than 1,000 TWh, followed by Florida, the Carolinas and Maine. But, because of how little electricity it uses, Maine has by far the highest ratio of technical potential for off-shore generation to electricity use in 2019 or projected electricity use in 2050, as shown in Table 1.
TABLE 1: OFFSHORE WIND RESOURCES IN THE ATLANTIC50
State Total 2019 retail
electricity sales (TWh)
2050 electricity usage with full electrification
(TWh)
Annual offshore wind generation
technical potential (TWh)
Offshore potential as percentage of
2019 electricity use
Offshore potential as percentage of 2050
electricity use with full electrification
Connecticut 27 .9 70 .3 6 .7 24% 10%
Delaware 11 .5 22 .4 20 .6 180% 92%
Florida 240 .3 470 .7 780 .3 325% 166%
Georgia 139 .3 269 .7 156 .5 112% 58%
Maine 11 .7 30 .7 411 .2 3,505% 1,338%
Maryland 60 .7 155 .2 96 .3 159% 62%
Massachusetts 51 .3 129 .4 1,053 .2 2,052% 814%
New Hampshire 10 .7 28 .4 5 .0 47% 18%
New Jersey 73 .9 167 .4 280 .2 379% 167%
New York 145 .6 361 .4 295 .2 203% 82%
North Carolina 136 .4 274 .7 634 .2 465% 231%
Rhode Island 7 .3 18 .6 60 .4 821% 325%
South Carolina 80 .2 129 .9 612 .6 764% 472%
Virginia 118 .4 222 .2 161 .8 137% 73%

U .S . offshore wind resources could power the country 12
Because of its huge offshore potential and shallow waters, the Atlantic region also has the most and the largest offshore wind projects in the planning stage. According to NREL, as of October 2020 the Atlantic
region had two operational projects and 28 proposals for offshore wind development – including 26 projects in various stages of planning and development – with a combined total of more than 26 GW of site capacity.51
TABLE 2: ATLANTIC REGION OFFSHORE WIND PIPELINE52
Project name Status Location Announced project capacity (MW) Total site capacity (MW)Block Island Wind Farm Operating RI 30 30
Coastal Virginia Offshore Wind Operating VA 12 12
Skipjack Permitting DE 120 120
Park City Wind Permitting MA 804 804
Vineyard Wind Permitting MA 800 1,221
Mayflower Wind Permitting MA 804 1,551
Sunrise Wind Permitting MA 880 880
MarWin Permitting MD 248 966
New England Aqua Ventus I Permitting ME 12 12
Ocean Wind Permitting NJ 1,100 1,947
Empire Wind Permitting NY 816 2,400
Revolution Wind Permitting RI 704 704
South Fork Permitting RI 130 130
Garden State Offshore Energy Site control DE 1,050
Bay State Wind Site control MA 2,277
Beacon Wind Site control MA 1,564
Liberty Wind Site control MA 1,607
Kitty Hawk Site control NC 1,485
Atlantic Shores Offshore Wind Site control NJ 2,500
Dominion Site control VA 2,640
Fairways North Call Area Planning NY
Fairways South Call Area Planning NY
Hudson North Call Area Planning NY
Hudson South Call Area Planning NY
Grand Strand Call Area Planning SC
Winyah Call Area Planning SC
Cape Romain Call Area Planning SC
Charleston Call Area Planning SC
Wilmington West Call Area Unleased NC 627
Wilmington East Call Area Unleased NC 1,623

13 Offshore Wind for America
Offshore wind in the PacificStates: California, Hawaii, Oregon and Washington
Deploying offshore wind off the western continental United States and around Hawaii is more challenging than it is off the East Coast. In the Pacific region, the water deepens rapidly with distance from shore.56 This makes using traditional fixed-bottom turbines, which generally require depths less than 200 feet, impossible in the areas where much of the resource lies.57 Luckily, floating systems have been designed that can support and stabilize turbines, and have been proposed for use at depths up to almost 3,300 feet.58 If successful, these designs would greatly expand the area usable for offshore wind, including in the United States’ Pacific region.
The floating turbine projects already installed around the world are helping to prove the technology and pro-vide baseline costs for future deployment.59
All four states in the Pacific region have the technical potential to produce more power from offshore wind than they used in 2019, and all but California have the techni-cal potential to produce more power than they would use in 2050 after maximum electrification of the country.
As a region, the Pacific states have the technical poten-tial to produce almost 869 TWh of electricity, more than twice as much as the 401 TWh of electricity they used in 2019, and almost 90% of the 1,014 TWh they would use in 2050 with full electrification of buildings, transportation and industry.
California, with its huge coastline, has the highest abso-lute technical potential for offshore wind generation, followed by Oregon, Washington and then Hawaii. However, because of its low electricity usage, Hawaii has the highest ratio of technical offshore wind genera-tion potential to electricity usage – it has the technical potential to produce more than 10.5 times its 2019 electricity use and almost 4.5 times its 2050 electricity use with full electrification.
The Pacific region has five proposals for offshore wind development, three in California and two in Hawaii, all of which are call areas open to applications from developers.60
Understanding the steps in the offshore wind pipeline The National Renewable Energy Laboratory includes in 2019 Offshore Wind Technology Data Update the status of U.S. offshore wind area leases and proposed offshore wind power proj-ects. NREL defines the stages of the process – included in the tables of regional offshore wind pipelines in this section of the report – as follows:
• Planning: begins with the initiation of the formal site control process and ends when a developer receives control of the site.
• Site control: begins when the developer obtains site control and ends when they file major permit applications.
• Permitting: begins when the developer files permit applications and ends when the relevant regulatory entities authorize the project for construction and certify its offtake agreement.
• Operating: begins when all turbines are installed and feeding power to the grid.53
The Wilmington call areas listed as “unleased” have been identified by BOEM as sites for offshore wind development but have not been opened to applications from developers.54 The call areas listed in the Pacific offshore wind pipeline table are described as “open to project proposals” because BOEM requested project nominations for those areas.55

U .S . offshore wind resources could power the country 14
Offshore wind in the Gulf States: Alabama, Louisiana, Mississippi and Texas62
Offshore wind in the Gulf of Mexico faces two main challenges: wind speed and conflicting uses. Water in the Gulf is shallow enough to allow fixed-bottom tur-bines far from shore, and in particular Texas and Loui-siana have a large area of the Gulf suitable for offshore wind development.63 However, low average windspeed means lower capacity factors and less power that can be produced than in other regions.64
In addition to low wind speed, the Gulf of Mexico also has extensive conflicting uses, including shipping and oil and gas operations, which reduce the area usable for offshore wind generation.65 While not all of these conflicting uses exclude deployment of offshore wind generation, they do present a logistical challenge and will prevent development in certain areas of the Gulf.66
Still, offshore wind can make an important contri-bution of renewable energy to the Gulf states. Both Louisiana and Texas have the technical potential to produce more electricity from offshore wind generation than they used in 2019, and Louisiana has the technical potential to produce more electricity than it is projected to use in 2050 after nationwide maximal electrification. Texas has the largest potential generation capacity, closely followed by Louisiana, but Louisiana has by far the highest ratio of potential generation capacity to electricity use in the Gulf.
As a region, the Gulf states have the technical potential to produce more than 1,400 TWh of electricity from offshore wind generation, more than twice the 660 TWh of electricity the region used in 2019 and over 20% more electricity than the region is projected to use in 2050 assuming the country undergoes maximum possible electrification.
TABLE 3: OFFSHORE WIND RESOURCES IN THE PACIFIC
State Total 2019 retail
electricity sales (TWh)
2050 electricity usage with full electrification
(TWh)
Annual offshore wind generation
technical potential (TWh)
Offshore potential as percentage of
2019 electricity use
Offshore potential as percentage of 2050
electricity use with full electrification
California 250 .4 761 .1 391 .9 157% 52%
Hawaii 9 .5 22 .7 99 .9 1,057% 441%
Oregon 50 .4 89 .9 230 .2 457% 256%
Washington 91 .1 139 .9 146 .6 161% 105%
TABLE 4: PACIFIC REGION OFFSHORE WIND PIPELINE61
Project name Status Location Announced project capacity (MW)
Total site capacity (MW)
Diablo Canyon Call Area Open to project proposals CA
Morro Bay Call Area Open to project proposals CA
Humboldt Call Area Open to project proposals CA
Oahu South Call Area Open to project proposals HI
Oahu North Call Area Open to project proposals HI

15 Offshore Wind for America
Offshore wind in the Great LakesStates: Illinois, Indiana, Michigan, Minnesota, Ohio, Pennsylvania and Wisconsin67
Offshore wind resources are more limited in the Great Lakes region than in the other regions. Because of the smaller total area and the fact that current floating turbine technology cannot withstand freshwater ice floes, both the area that could be developed for offshore wind gener-ation and the technical potential for generation are much smaller in the Great Lakes than on the coasts of the U.S.68
Despite these limitations, Michigan has the technical potential to produce more power from offshore wind generation than the state consumed in 2019. No Great Lakes states have the technical potential to produce as
much electricity as they are projected to use in 2050 after nationwide electrification, but Michigan could produce 72% of that amount. Michigan has the highest generation potential and the highest ratio of potential to electricity use, followed by Ohio and Wisconsin.
As a region, the Great Lakes states have the technical potential to produce 344 TWh of electricity from off-shore wind generation; almost half as much as the 772 TWh of electricity they used in 2019 and about one fifth as much as the 1,769 TWh they are projected to use in 2050 assuming complete electrification of the nation.
The Great Lakes region has one project in the pipeline: Ohio’s Icebreaker, which is a 21 MW project in the per-mitting phase scheduled to be completed in 2023.69
TABLE 5: OFFSHORE WIND RESOURCES IN THE GULF OF MEXICO
State Total 2019 retail
electricity sales (TWh)
2050 electricity usage with full electrification
(TWh)
Annual offshore wind generation
technical potential (TWh)
Offshore potential as percentage of
2019 electricity use
Offshore potential as percentage of 2050
electricity use with full electrification
Alabama 88 .1 150 .6 52 .8 60% 35%
Louisiana 93 .1 134 .3 641 .6 689% 478%
Mississippi 49 .0 86 .3 9 .7 20% 11%
Texas 429 .3 786 .5 712 .0 166% 91%
TABLE 6: OFFSHORE WIND RESOURCES IN THE GREAT LAKES
State Total 2019 retail
electricity sales (TWh)
2050 electricity usage with full electrification
(TWh)
Annual offshore wind generation
technical potential (TWh)
Offshore potential as percentage of
2019 electricity use
Offshore potential as percentage of 2050
electricity use with full electrification
Illinois 138 .3 359 .4 16 .8 12% 5%
Indiana 102 .1 204 .3 3 .4 3% 2%
Michigan 101 .2 276 .1 199 .4 197% 72%
Minnesota 67 .0 158 .1 0 .4 1% 0%
Ohio 148 .5 331 .5 62 .7 42% 19%
Pennsylvania 145 .6 257 .8 12 .8 9% 5%
Wisconsin 69 .2 181 .9 48 .6 70% 27%

U .S . offshore wind resources could power the country 16
The future of U.S. offshore windAlthough the U.S. currently has only seven active off-shore wind turbines in two locations – five at the first offshore wind farm in the U.S., the Block Island Wind Farm in Rhode Island, and two at the first wind farm in federal waters, the Coastal Virginia Offshore Wind pilot – there are many projects in development that could come online throughout the next decade.70
Today, in addition to the two operational offshore wind farms, the U.S. has 34 proposals for offshore wind development – including 27 projects in various stages of planning and development – with a combined total of about 26.1 GW of site capacity.71 Most of the projects are along the East Coast, and the remainder are off of California and Hawaii.72 Most of the projects are in the site control and permitting phases, which means the developer has signed a lease or in some way been given control of the site, and the planning for the project has begun but has not yet been fully approved.73
Even with the chaos of the COVID-19 pandemic, 2020 was a surprisingly good year for offshore wind. Accord-ing to NREL, the amount of offshore wind capacity with a signed offtake agreement – meaning some entity had signed an agreement to purchase the power – had more than tripled from March 2019 to March 2020, to a total of almost 6.5 GW.74 Other developments also pointed to future success of the industry. Vineyard Wind, which has been delayed repeatedly but is still scheduled to be one of the first U.S. projects to come
online, recently restarted its permitting process. A Bureau of Ocean Energy Management (BOEM) report about Vineyard Wind – one of the many delays in the project’s development – detailed manageable environ-mental impacts and many benefits from developing offshore wind.75 The year also saw lower-than-expected prices for new offshore wind, signaling strong econom-ics for new projects.76 Additionally, Maryland, Virginia and North Carolina entered into an agreement to work together on offshore wind development, a formal recog-nition of the importance of regional cooperation.77
New projects are in the development process along the East Coast, from Maine to North Carolina.78 On the West Coast, California is starting to plan for offshore wind to help the state reach 100% renewable energy.79 Investment is beginning to flow as well: Siemens Gamesa – one of the largest turbine suppliers in the world – is considering a U.S. manufacturing facility and states and companies are putting money into offshore wind infrastructure and equipment.80 New Jersey has announced that it will develop the New Jersey Wind Port for staging, assembly and manufacturing, and that two offshore wind companies have invested $250 mil-lion in a monopile manufacturing facility in the state.81
With planned projects set to go online in the next few years, prices continuing to drop, and a domestic supply chain emerging, the offshore wind industry has lots of potential, but federal policies and practices have slowed its growth.

17 Offshore Wind for America
Impediments to offshore wind slow its growth
There are two major impediments to the growth of offshore wind in the U.S. Both are federal practices that slow development and make the
transition to 100% renewable energy harder.
Short-term and unpredictable tax credits: The U.S. currently has both a production tax credit (PTC) and an investment tax credit (ITC) for offshore wind.82 In December 2020, congressional action extended the PTC at 60% of its per-kilowatt value for one year (until 2022), and created the ITC set at 30% of the cost of projects that begin construction before 2026.83 These tax credits reduce the cost of offshore wind develop-ment and the power wind turbines produce, helping to jump-start deployment and grow the industry to the point where it is competitive without the credit.
However, Congress’ pattern of extending tax credits for short periods of time, as opposed to making a consis-tent commitment to supporting offshore wind, makes it hard for developers to plan and commit to projects. As the Union of Concerned Scientists showed, this short-term cycle of tax credit extension and expiration, which has happened many times since the implementa-tion of the renewable energy PTC in 1992, has led to a “boom-bust cycle” in which development slows signifi-cantly when the credits expire and then pick up when the credit is renewed.84 Short-term extensions like those enacted in December 2020 – while necessary to prevent
a drop-off of financial support for renewables – serve to introduce uncertain incentives for offshore wind, rather than allowing long-term and consistent growth.
Lack of action and delays by the Bureau of Ocean Energy Management (BOEM): BOEM has not leased a new area for offshore wind development since Febru-ary 2019.85 This means two years without new projects getting to start planning and design, despite plenty of interest.86
Additionally, the BOEM process for permitting and approval is very slow and is currently delaying U.S. off-shore wind development. This is abundantly clear in the case of Vineyard Wind; the Massachusetts wind farm off of Martha’s Vineyard that is set to be America’s first major utility-scale operation.87 Vineyard Wind has faced multiple delays in the federal permitting process – sep-arate from the state and local processes that themselves are not smooth – which threatened to scuttle the entire project.88 These repeated delays have forced the project’s operational timeline back at least one year, and involved reviews of multiple proposed projects along the Atlantic coast all at once.89
President Joe Biden has signaled an interest in boosting U.S. offshore wind development, which could cause BOEM to speed up the processes for leasing, environ-mental impact studies and permitting.90

Conclusions and recommendations 18
Conclusions and recommendations
The United States can take on some of its biggest environmental challenges by taking advantage of one the most underutilized energy resources
in the country: offshore wind.
America has sufficient offshore wind potential to power nearly the entire country even after a nationwide transi-tion away from fossil fuels to electricity. Moreover, much of that potential is close to the biggest population cen-ters and largest sources of electricity demand in the U.S.
While deploying offshore wind in the U.S. to its full technical potential would both be impractical and have negative environmental impacts, even using a frac-tion of the abundant energy off our shores would add another source of clean and reliable energy to rapidly growing onshore wind and solar energy. Deploying offshore wind strategically also allows mitigation of environmental impacts and is a crucial step in the path to 100% renewable energy for the United States.
Figure 5: Levelized cost of energy estimates for fixed-bottom offshore wind development92 (Image: National Renewable Energy Laboratory)
19 Offshore Wind for America
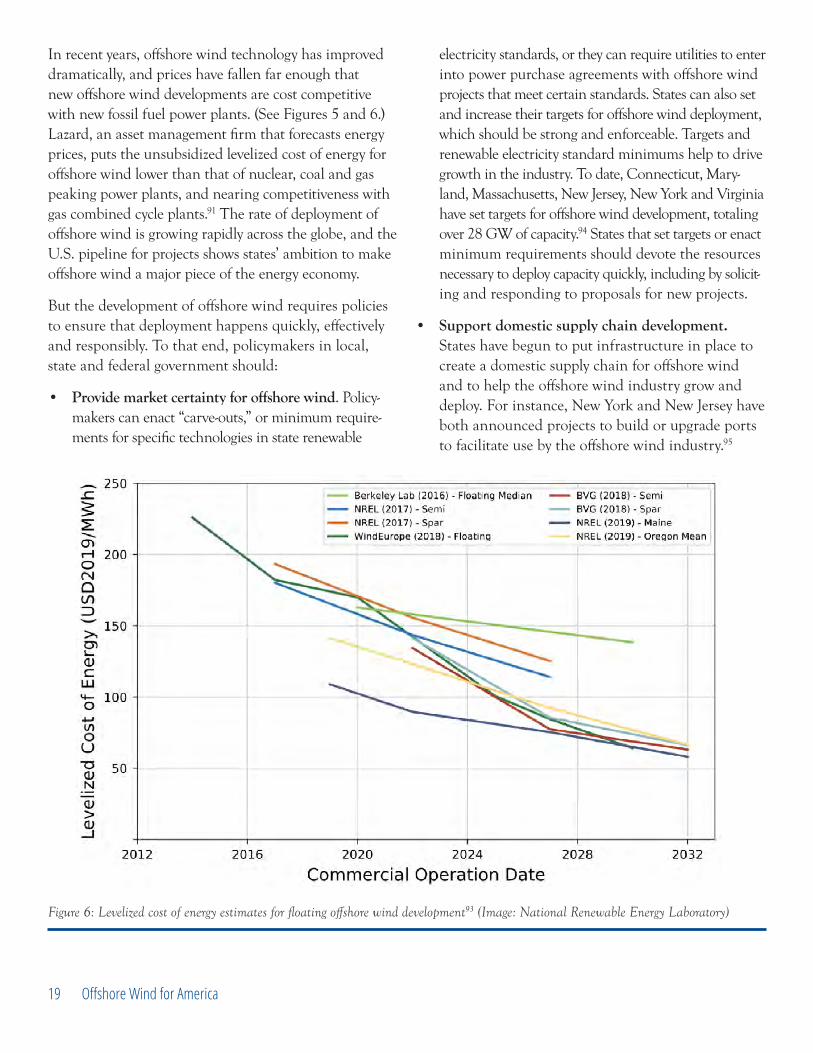
In recent years, offshore wind technology has improved dramatically, and prices have fallen far enough that new offshore wind developments are cost competitive with new fossil fuel power plants. (See Figures 5 and 6.) Lazard, an asset management firm that forecasts energy prices, puts the unsubsidized levelized cost of energy for offshore wind lower than that of nuclear, coal and gas peaking power plants, and nearing competitiveness with gas combined cycle plants.91 The rate of deployment of offshore wind is growing rapidly across the globe, and the U.S. pipeline for projects shows states’ ambition to make offshore wind a major piece of the energy economy.
But the development of offshore wind requires policies to ensure that deployment happens quickly, effectively and responsibly. To that end, policymakers in local, state and federal government should:
• Provide market certainty for offshore wind. Policy-makers can enact “carve-outs,” or minimum require-ments for specific technologies in state renewable
electricity standards, or they can require utilities to enter into power purchase agreements with offshore wind projects that meet certain standards. States can also set and increase their targets for offshore wind deployment, which should be strong and enforceable. Targets and renewable electricity standard minimums help to drive growth in the industry. To date, Connecticut, Mary-land, Massachusetts, New Jersey, New York and Virginia have set targets for offshore wind development, totaling over 28 GW of capacity.94 States that set targets or enact minimum requirements should devote the resources necessary to deploy capacity quickly, including by solicit-ing and responding to proposals for new projects.
• Support domestic supply chain development. States have begun to put infrastructure in place to create a domestic supply chain for offshore wind and to help the offshore wind industry grow and deploy. For instance, New York and New Jersey have both announced projects to build or upgrade ports to facilitate use by the offshore wind industry.95
Figure 6: Levelized cost of energy estimates for floating offshore wind development93 (Image: National Renewable Energy Laboratory)
Conclusions and recommendations 20
Encouraging companies to build factories in the U.S., as states are encouraging Siemens Gamesa to do, could also help grow the industry in the U.S.96 Domestic construction of the vessels needed to build and repair turbines will be required under the Jones Act, and having a U.S. based fleet would speed up construction of new offshore wind farms.97
• Set national standards to ensure the environmental integrity of offshore wind projects and to avoid, minimize and mitigate impacts to marine ecosys-tems and wildlife. Although they can become new habitat for marine life, offshore wind turbines can also negatively impact birds and marine life both during construction and during operation.98 Noise and habitat destruction from pile driving during construction, disruption to habitats or migration routes, and even direct collisions with turbines can all be harmful.99 These impacts can threaten import-ant struggling and endangered species, including the critically endangered North Atlantic Right Whale.100 There are, however, best management practices that can reduce the impact of deployment, and can make sure offshore wind farms don’t harm wildlife. State and federal agencies must work together to make sure offshore wind development happens in an environ-mentally responsible way, and proven methods and best practices should be mandated for all projects.101 All projects should be required to incorporate a research and monitoring plan for mitigating environ-mental impacts and relevant agencies should develop an industry-wide impact assessment for the North Atlantic Right Whale, including required coordina-tion and best practices to mitigate harm to the species.
• Direct the Bureau of Ocean Energy Management and relevant state agencies to accelerate the offshore wind leasing and permitting process while ensuring trans-parency and environmental responsibility. BOEM and state permitting authorities need to streamline and accelerate the permitting and review processes to allow new projects into the pipeline and to help deployment happen quickly and responsibly, while protecting local communities and ecosystems. BOEM also needs to coordinate with state and local permitting authorities where appropriate to further the same goals. In partic-
ular, BOEM should prioritize issuance of final Records of Decision for projects in the review process and Notices of Intent to Prepare an Environmental Impact Statement for those projects that already have con-tracts for their power. It should also begin auctioning new Wind Energy Areas as soon as possible. Finally, the transparency of the development process should include community engagement with relevant stake-holders, including the fishing industry, local communi-ties and environmental advocates and experts.
• Extend offshore wind tax credits. Both the produc-tion tax credit and the investment tax credit for off-shore wind should be extended for a long enough time period to encourage new projects to enter the pipeline and to allow the industry to grow and mature.
• Plan for regional offshore wind development, including transmission infrastructure. While states should set their own goals and requirements for offshore wind development, projects should be developed with a long-term plan for integra-tion across state boundaries. The Federal Energy Regulatory Commission should require planning around these efforts. Regional partnerships, like that of Maryland, Virginia and North Carolina, can encourage this method of planning. Regional integration will help maximize economic potential and lower overall costs for offshore wind projects. Regional cooperation and planning are particu-larly important for the transmission infrastructure needed to integrate power from offshore wind farms into the wider power system.102 A coordi-nated, planned approach can reduce transmission needs, costs, risks and environmental impacts while encouraging increased participation of offshore wind and transmission developers in the process.103
• Support research and development of new offshore wind technologies, including floating platforms, deeper water non-floating structures, taller turbines, larger rotors, more efficient designs, better transmis-sion technology, better materials, turbine designs that can better withstand hurricanes and ice floes, and recycling procedures to reduce waste from end-of-life decommissioning of turbines.

21 Offshore Wind for America
Methodology
Nationwide and state 2019 electricity usage data was obtained from the U.S. Energy Information Administration’s State Elec-
tricity Profiles, archived at https://web.archive.org/web/20210109111454/https://www.eia.gov/electricity/state/#nav-learn.
Estimates of state and national electricity use in 2050 after electrification are derived from data produced for the National Renewable Energy Laboratory’s (NREL) Electrification Futures Study. This NREL report examines estimates of energy use in 2050 in several scenarios, including an electrification technical potential scenario in which all possible electrification of transportation, buildings and industry occurs as fast as possible, which formed the basis of this analysis. The Electrification Futures Study does not assume improvements in energy efficiency beyond those projected under business as
usual conditions by the Department of Energy and may therefore overestimate the electricity demand after elec-trification.104 Detailed state-by-state data were obtained from the NREL, Electrification Futures Study Technology Data, accessed 2 October 2019 and available at https://data.nrel.gov/submissions/92. Data were filtered by year, scenario, and energy type to arrive at the estimates presented here.
Offshore wind generation potential data was obtained from NREL’s 2016 Offshore Wind Energy Resource Assess-ment for the United States report in Appendix I, archived at https://web.archive.org/web/20201206044939/https://www.nrel.gov/docs/fy16osti/66599.pdf.
Electricity usage and offshore wind generation potential were converted to TWh for comparison, and ratios calcu-lated for each state and region and the nation as a whole.

Appendix 22
AppendixTABLE A1: OFFSHORE WIND RESOURCES IN THE UNITED STATES105
State Total 2019 retail electricity
sales (TWh)
2050 electricity usage with full
electrification (TWh)
Annual offshore wind generation technical
potential (TWh)
Offshore potential as percentage of 2019
electricity use
Offshore potential as percentage of 2050
electricity useAlabama 88 .1 150 .6 52 .8 60% 35%California 250 .4 761 .1 391 .9 157% 52%Connecticut 27 .9 70 .3 6 .7 24% 10%Delaware 11 .5 22 .4 20 .6 180% 92%Florida 240 .3 470 .7 780 .3 325% 166%Georgia 139 .3 269 .7 156 .5 112% 58%Hawaii 9 .5 22 .7 99 .9 1,057% 441%Illinois 138 .3 359 .4 16 .8 12% 5%Indiana 102 .1 204 .3 3 .4 3% 2%Louisiana 93 .1 134 .3 641 .6 689% 478%Maine 11 .7 30 .7 411 .2 3,505% 1,338%Maryland 60 .7 155 .2 96 .3 159% 62%Massachusetts 51 .3 129 .4 1,053 .2 2,052% 814%Michigan 101 .2 276 .1 199 .4 197% 72%Minnesota 67 .0 158 .1 0 .4 1% 0%Mississippi 49 .0 86 .3 9 .7 20% 11%New Hampshire 10 .7 28 .4 5 .0 47% 18%New Jersey 73 .9 167 .4 280 .2 379% 167%New York 145 .6 361 .4 295 .2 203% 82%North Carolina 136 .4 274 .7 634 .2 465% 231%Ohio 148 .5 331 .5 62 .7 42% 19%Oregon 50 .4 89 .9 230 .2 457% 256%Pennsylvania 145 .6 257 .8 12 .8 9% 5%Rhode Island 7 .3 18 .6 60 .4 821% 325%South Carolina 80 .2 129 .9 612 .6 764% 472%Texas 429 .3 786 .5 712 .0 166% 91%Virginia 118 .4 222 .2 161 .8 137% 73%Washington 91 .1 139 .9 146 .6 161% 105%Wisconsin 69 .2 181 .9 48 .6 70% 27%

23 Offshore Wind for America
Notes
1 U.S. Energy Information Administration, U.S. Energy
Facts Explained, 7 May 2020, archived at http://web.archive.org/
web/20210116015521/https://www.eia.gov/energyexplained/
us-energy-facts/.
2 Using 2020 11-Month Total and 2001 data: Energy
Information Administration, Monthly Energy Review, February
2021, Table 7.2b Electricity Net Generation: Electric Power Sec-
tor, 23 February 2021, archived at https://web.archive.org/
web/20210223172509/https://www.eia.gov/totalenergy/data/
monthly/pdf/sec7_6.pdf.
3 See Methodology.
4 Electrification refers to replacement of fossil fuel-pow-
ered appliances, vehicles and machinery with alternatives that run
on electricity. See Methodology.
5 Developable area on p. 46-47 and the problems with ice on
p. 5: Walter Musial, et al., 2016 Offshore Wind Energy Resource Assessment
for the United States, National Renewable Energy Laboratory, Septem-
ber 2016, archived at https://web.archive.org/web/20201206044939/
https://www.nrel.gov/docs/fy16osti/66599.pdf.
6 5,500 turbines: International Energy Agency, Offshore
Wind Outlook 2019: World Energy Outlook Special Report, Novem-
ber 2019, p. 15, downloaded from https://www.iea.org/reports/
offshore-wind-outlook-2019; Global capacity: Walter Musial, et al.,
2019 Offshore Wind Technology Data Update, National Renewable
Energy Lab, October 2020, p. 27, archived at http://web.archive.
org/web/20210110172118/https://www.nrel.gov/docs/fy21o-
sti/77411.pdf; 7.3 million homes calculated by multiplying 27 GW
of capacity by the number of hours in a year and by a 33% capacity
factor to find 78,236.6 GWh of energy generated annually and
then dividing by 0.01065 GWh average annual use by U.S. homes;
Capacity factor from International Energy Agency, Offshore Wind
Outlook 2019: World Energy Outlook Special Report, November
2019, p. 20, downloaded from https://www.iea.org/reports/off-
shore-wind-outlook-2019; Average annual electricity use in U.S.
homes from U.S. Energy Information Administration, How Much
Electricity Does an American Home Use?, 9 October 2020, archived
at http://web.archive.org/web/20201111194406/https://www.eia.
gov/tools/faqs/faq.php?id=97.
7 Ørsted, “1991-2001: The first offshore wind farms,” June
2019, archived at http://web.archive.org/web/20201219231246/
https://orsted.com/en/about-us/whitepapers/making-green-ener-
gy-affordable/1991-to-2001-the-first-offshore-wind-farms; Walter
Musial, et al., 2019 Offshore Wind Technology Data Update, National
Renewable Energy Lab, October 2020, p. 52, archived at http://
web.archive.org/web/20210110172118/https://www.nrel.gov/docs/
fy21osti/77411.pdf; Turbine heights: International Energy Agency,
Offshore Wind Outlook 2019: World Energy Outlook Special Report,
November 2019, p. 19-20, downloaded from https://www.iea.org/
reports/offshore-wind-outlook-2019.
Notes 24
8 Current distance from shore, converted to miles:
International Energy Agency, Offshore Wind Outlook 2019: World
Energy Outlook Special Report, November 2019, p. 22, downloaded
from https://www.iea.org/reports/offshore-wind-outlook-2019;
Announced projects distance from shore on p. 50, installed
projects depths on p. 45: Walter Musial, et al., 2019 Offshore Wind
Technology Data Update, National Renewable Energy Lab, October
2020, archived at http://web.archive.org/web/20210110172118/
https://www.nrel.gov/docs/fy21osti/77411.pdf.
9 Siemens Gamesa, SG 14-222 DD Offshore Wind Tur-
bine, archived 17 December 2020 at http://web.archive.org/
web/20201217181504/https://www.siemensgamesa.com/en-int/
products-and-services/offshore/wind-turbine-sg-14-222-dd; GE
Renewable Energy, Haliade-X Offshore Wind Turbine, archived 16
January 2021 at http://web.archive.org/web/20210116152132/
https://www.ge.com/renewableenergy/wind-energy/off-
shore-wind/haliade-x-offshore-turbine.
10 Two operational pilot projects: Karl-Erik Stromsta, “Sec-
ond U.S. offshore wind project finishes construction off Virginia,”
Greentech Media, 29 June 2020, archived at http://web.archive.org/
web/20201214193655/https://www.greentechmedia.com/articles/
read/second-us-offshore-wind-farm-finishes-construction-off-vir-
ginia; Projects in planning and development: Walter Musial, et al.,
2019 Offshore Wind Technology Data Update, National Renewable
Energy Lab, October 2020, p. 8, 13 and 16, archived at http://
web.archive.org/web/20210110172118/https://www.nrel.gov/docs/
fy21osti/77411.pdf.
11 Does not include the unsolicited project applications,
which have been superseded by call areas. Site capacity refers
to the technical potential of the site: Walter Musial, et al., 2019
Offshore Wind Technology Data Update, National Renewable Energy
Lab, October 2020, p. 8 and 16, archived at http://web.archive.
org/web/20210110172118/https://www.nrel.gov/docs/fy21o-
sti/77411.pdf.
12 Office for Coastal Management, Economics and Demo-
graphics, archived 19 January 2021 at http://web.archive.org/
web/20210119120053/https://coast.noaa.gov/states/fast-facts/eco-
nomics-and-demographics.html.
13 International Energy Agency, Offshore Wind Outlook
2019: World Energy Outlook Special Report, November 2019, p. 12,
downloaded from https://www.iea.org/reports/offshore-wind-out-
look-2019.
14 Offshore wind strong in the winter: see note 13; East
Coast will be heating buildings in the winter: Trieu Mai, et al.,
Electrification Futures Study: Scenarios of Electric Technology Adop-
tion and Power Consumption for the United States, p. xv, archived at
http://web.archive.org/web/20201102110202/https://www.nrel.
gov/docs/fy18osti/71500.pdf; Afternoon and evening (especially
on the East Coast): Environment and Energy Study Institute,
Fact Sheet – Offshore Wind: Can the United States Catch Up with
Europe?, 4 January 2016, archived at https://web.archive.org/
web/20201125023227/https://www.eesi.org/papers/view/fact-
sheet-offshore-wind-2016.
15 U.S. total installed capacity is 42 MW: American
Wind Energy Association, U.S. Offshore Wind Industry Status
Update – November 2020, archived at http://web.archive.org/
web/20201219231244/https://www.awea.org/Awea/media/
Resources/Fact%20Sheets/Offshore-Fact-Sheet.pdf; Global
capacity: Walter Musial, et al., 2019 Offshore Wind Technology Data
Update, National Renewable Energy Lab, October 2020, p. 27,
archived at http://web.archive.org/web/20210110172118/https://
www.nrel.gov/docs/fy21osti/77411.pdf.
16 International Energy Agency, Offshore Wind Net Capac-
ity Additions by Country or Region, 2016-2022, 18 January 2021,
accessed 10 February at https://www.iea.org/data-and-statistics/
charts/offshore-wind-net-capacity-additions-by-country-or-re-
gion-2016-2022.
17 Walter Musial, et al., 2019 Offshore Wind Technology Data
Update, National Renewable Energy Lab, October 2020, p. 29,
archived at http://web.archive.org/web/20210110172118/https://
www.nrel.gov/docs/fy21osti/77411.pdf.
18 Global Wind Energy Council, Global Offshore Wind
Report 2020, accessed 19 January 2021 at https://gwec.net/global-
offshore-wind-report-2020/#key-findings.
19 International Energy Agency, Offshore Wind Outlook
2019: World Energy Outlook Special Report, November 2019, p. 15,
downloaded from https://www.iea.org/reports/offshore-wind-out-
look-2019.

25 Offshore Wind for America
20 International Energy Agency, Offshore Wind Outlook
2019: World Energy Outlook Special Report, November 2019, p. 16,
downloaded from https://www.iea.org/reports/offshore-wind-out-
look-2019; Walter Musial, et al., 2019 Offshore Wind Technology
Data Update, National Renewable Energy Lab, October 2020,
p. 30, archived at http://web.archive.org/web/20210110172118/
https://www.nrel.gov/docs/fy21osti/77411.pdf.
21 Walter Musial, et al., 2019 Offshore Wind Technology Data
Update, National Renewable Energy Lab, October 2020, p. 30,
archived at http://web.archive.org/web/20210110172118/https://
www.nrel.gov/docs/fy21osti/77411.pdf.
22 Ewa Krukowska, “Europe seeks $940 billion boost for
giant offshore wind farms,” Bloomberg Green, 18 November 2020,
archived at https://web.archive.org/web/20201121185054/https://
www.bloomberg.com/news/articles/2020-11-18/europe-plans-940-
billion-offshore-wind-push-to-meet-green-goal?sref=qm26bHqj.
23 Ørsted, “1991-2001: The first offshore wind farms,” June
2019, archived at http://web.archive.org/web/20201219231246/
https://orsted.com/en/about-us/whitepapers/making-green-ener-
gy-affordable/1991-to-2001-the-first-offshore-wind-farms.
24 Walter Musial, et al., 2019 Offshore Wind Technology Data
Update, National Renewable Energy Lab, October 2020, p. 52,
archived at http://web.archive.org/web/20210110172118/https://
www.nrel.gov/docs/fy21osti/77411.pdf.
25 Converted meters to feet. 330 feet: International Energy
Agency, Offshore Wind Outlook 2019: World Energy Outlook Special
Report, November 2019, p. 19-20, downloaded from https://www.
iea.org/reports/offshore-wind-outlook-2019; Statue of Liberty: U.S.
National Park Service, Statue of Liberty, 8 August 2015, archived at
http://web.archive.org/web/20210110093011/https://www.nps.
gov/stli/learn/historyculture/statue-statistics.htm.
26 Converted meters to feet. 660 feet: International Energy
Agency, Offshore Wind Outlook 2019: World Energy Outlook Special
Report, November 2019, p. 19-20, downloaded from https://www.
iea.org/reports/offshore-wind-outlook-2019.
27 International Energy Agency, Offshore Wind Outlook
2019: World Energy Outlook Special Report, November 2019, p. 20,
downloaded from https://www.iea.org/reports/offshore-wind-out-
look-2019.
28 Converted meters to feet. Siemens Gamesa, SG 14-222
DD Offshore Wind Turbine, archived at http://web.archive.org/
web/20201217181504/https://www.siemensgamesa.com/en-int/
products-and-services/offshore/wind-turbine-sg-14-222-dd; Siemens
Gamesa is the largest supplier: Walter Musial, et al., 2019 Off-
shore Wind Technology Data Update, National Renewable Energy
Lab, October 2020, p. 54, archived at http://web.archive.org/
web/20210110172118/https://www.nrel.gov/docs/fy21osti/77411.
pdf.
29 Converted meters to feet. GE Renewable Energy,
Haliade-X Offshore Wind Turbine, archived at http://web.archive.
org/web/20210116152132/https://www.ge.com/renewableenergy/
wind-energy/offshore-wind/haliade-x-offshore-turbine.
30 John Rogers, “New turbine can power a home for a day
in just 7 seconds,” Union of Concerned Scientists, 3 December 2020,
archived at http://web.archive.org/web/20210106173023/https://
blog.ucsusa.org/john-rogers/new-wind-turbine-power-home-for-day-
in-7-seconds.
31 Vineyard Wind, Vineyard Wind Selects GE Renewable
Energy As Preferred Turbine Supplier For America’s First Utility Scale
Offshore Wind Project (press release), 1 December 2020, archived
at http://web.archive.org/web/20201216132910/https://www.
vineyardwind.com/press-releases/2020/12/1/vineyard-wind-se-
lects-ge-renewable-energy-as-preferred-turbine-supplier.
32 See note 27, all rights reserved.
33 International Energy Agency, Offshore Wind Outlook
2019: World Energy Outlook Special Report, November 2019, p. 22,
downloaded from https://www.iea.org/reports/offshore-wind-out-
look-2019.
34 Converted meters to feet and kilometers to miles.
Announced projects distance from shore on p. 50, installed
projects depths on p. 45: Walter Musial, et al., 2019 Offshore Wind
Technology Data Update, National Renewable Energy Lab, October
2020, archived at http://web.archive.org/web/20210110172118/
https://www.nrel.gov/docs/fy21osti/77411.pdf.
35 National Renewable Energy Laboratory, “Floating
wind turbines on the rise,” 2 April 2020, archived at http://web.
archive.org/web/20201025133226/https://www.nrel.gov/news/
program/2020/floating-offshore-wind-rises.html.

Notes 26
36 Sarah Horwath et al., Comparison of Environmental Effects
from Different Offshore Wind Turbine Foundations, Bureau of Ocean
Energy Management, August 2020, p. 4-13, archived at https://
web.archive.org/web/20210119161926/https://www.boem.gov/
sites/default/files/documents/environment/Wind-Turbine-Foun-
dations-White%20Paper-Final-White-Paper.pdf.
37 Sarah Horwath et al., Comparison of Environmental Effects
from Different Offshore Wind Turbine Foundations, Bureau of Ocean
Energy Management, August 2020, p. ES-2, archived at https://
web.archive.org/web/20210119161926/https://www.boem.gov/
sites/default/files/documents/environment/Wind-Turbine-Foun-
dations-White%20Paper-Final-White-Paper.pdf.
38 Sarah Horwath et al., Comparison of Environmental Effects
from Different Offshore Wind Turbine Foundations, Bureau of Ocean
Energy Management, August 2020, p. 15, archived at https://web.
archive.org/web/20210119161926/https://www.boem.gov/sites/
default/files/documents/environment/Wind-Turbine-Founda-
tions-White%20Paper-Final-White-Paper.pdf.
39 Spars, semi-submersible hulls and tension leg platforms:
see note 38; Hybrid designs: Walter Musial et al., 2018 Offshore Wind
Technologies Market Report, U.S. Department of Energy, September
2019, p. 5, archived at http://web.archive.org/web/20201016205647/
https://www.energy.gov/sites/prod/files/2019/09/f66/2018%20Off-
shore%20Wind%20Technologies%20Market%20Report.pdf; 3,000
feet converted from meters: Walter Musial, et al., 2016 Offshore Wind
Energy Resource Assessment for the United States, National Renewable
Energy Laboratory, September 2016, p. 26, archived at https://web.
archive.org/web/20201206044939/https://www.nrel.gov/docs/
fy16osti/66599.pdf.
40 International projects: International Energy Agency,
Offshore Wind Outlook 2019: World Energy Outlook Special Report,
November 2019, p. 23, downloaded from https://www.iea.org/
reports/offshore-wind-outlook-2019; University of Maine’s project:
Maine Aqua Ventus, “Diamond Offshore Wind, RWE Renew-
ables join the University of Maine to lead development of Maine
floating offshore wind demonstration project,” archived at http://
web.archive.org/web/20210111122358/https://maineaquaventus.
com/; Maine research array: State of Maine Governor’s Energy
Office, Gulf of Maine Floating Offshore Wind Research Array, archived
at http://web.archive.org/web/20210125215413/https://www.
maine.gov/energy/initiatives/offshorewind/researcharray.
41 Sarah Horwath et al., Comparison of Environmental Effects
from Different Offshore Wind Turbine Foundations, Bureau of Ocean
Energy Management, August 2020, p. 3, archived at https://web.
archive.org/web/20210119161926/https://www.boem.gov/sites/
default/files/documents/environment/Wind-Turbine-Founda-
tions-White%20Paper-Final-White-Paper.pdf.
42 See Methodology for details of the data sources and
calculations presented in this report.
43 Alaska is excluded because NREL does not include
Alaska in its model of offshore wind resources in the U.S. See: Wal-
ter Musial, et al., 2016 Offshore Wind Energy Resource Assessment for
the United States, National Renewable Energy Laboratory, September
2016, archived at https://web.archive.org/web/20201206044939/
https://www.nrel.gov/docs/fy16osti/66599.pdf.
44 Walter Musial, et al., 2016 Offshore Wind Energy Resource
Assessment for the United States, National Renewable Energy Labora-
tory, September 2016, p. 26, archived at https://web.archive.org/
web/20201206044939/https://www.nrel.gov/docs/fy16osti/66599.pdf.
45 Map provided by NREL, AWS Truepower and Vais-
ala/3TIER. Walter Musial, et al., 2016 Offshore Wind Energy
Resource Assessment for the United States, National Renewable
Energy Laboratory, September 2016, p. 9, archived at https://web.
archive.org/web/20201206044939/https://www.nrel.gov/docs/
fy16osti/66599.pdf.
46 Offshore wind potential from New York’s Great Lakes
waters and Florida’s Gulf of Mexico waters are included in the Atlan-
tic region due to limitations of the NREL data and the difference in
resources on its two coasts. See Walter Musial, et al., 2016 Offshore
Wind Energy Resource Assessment for the United States, National Renew-
able Energy Laboratory, September 2016, p. 25, p. 28 and p. 33,
archived at https://web.archive.org/web/20201206044939/https://
www.nrel.gov/docs/fy16osti/66599.pdf.
47 Atlantic states’ proportion of U.S. energy consumption:
see Methodology; World energy use: U.S. Energy Information
Administration, International Electricity, Consumption, accessed 15
January 2021 at https://www.eia.gov/international/data/world/
electricity/electricity-consumption.
27 Offshore Wind for America
48 Excluding Puerto Rico. U.S. Census Bureau, Annual Esti-
mates of the Resident Population for the United States, Regions, States,
and Puerto Rico: April 1, 2010 to July 1, 2019, downloaded 15 Jan-
uary 2021 from https://www.census.gov/data/tables/time-series/
demo/popest/2010s-state-total.html#par_textimage_1574439295.
49 Length of coastline: National Oceanic and Atmospheric
Administration, Shoreline Mileage of the United States, archived at
http://web.archive.org/web/20201230221736/https://coast.noaa.
gov/data/docs/states/shorelines.pdf; The relatively shallow water
farther from shore can be seen in Figure 5 on p. 12, and the impli-
cations for fixed-bottom turbines interpreted from p. 15: Walter
Musial, et al., 2016 Offshore Wind Energy Resource Assessment for the
United States, National Renewable Energy Laboratory, September
2016, archived at https://web.archive.org/web/20201206044939/
https://www.nrel.gov/docs/fy16osti/66599.pdf; Area that can
produce energy: Walter Musial, et al., 2016 Offshore Wind Energy
Resource Assessment for the United States, National Renewable
Energy Laboratory, September 2016, p. 46-47, archived at https://
web.archive.org/web/20201206044939/https://www.nrel.gov/
docs/fy16osti/66599.pdf.
50 See Methodology for data sources and methods. The
technical potential for New York state includes some potential in
Lake Ontario in addition to the potential in the Atlantic.
51 Walter Musial, et al., 2019 Offshore Wind Technology
Data Update, National Renewable Energy Lab, October 2020,
p. 13, archived at http://web.archive.org/web/20210110172118/
https://www.nrel.gov/docs/fy21osti/77411.pdf; Coastal Virginia
Offshore Wind listed as operational: Dominion Energy, Coastal
Virginia Offshore Wind, archived at http://web.archive.org/
web/20210115115005/https://coastalvawind.com/about-offshore-
wind.aspx.
52 This includes unleased call areas: places that BOEM has
made available to site offshore wind projects but for which it has
not yet finalized any leases; total pipeline capacity includes the
potential capacity of the leased area as well as announced capacity
of planned projects; location is the state closest to the site of the
project. Projects on p. 13 and details on status classifications on
p. 6: Walter Musial, et al., 2019 Offshore Wind Technology Data
Update, National Renewable Energy Lab, October 2020, archived
at http://web.archive.org/web/20210110172118/https://www.nrel.
gov/docs/fy21osti/77411.pdf; Coastal Virginia Offshore Wind
listed as operational: Dominion Energy, Coastal Virginia Offshore
Wind, archived at http://web.archive.org/web/20210115115005/
https://coastalvawind.com/about-offshore-wind.aspx.
53 Walter Musial, et al., 2019 Offshore Wind Technology Data
Update, National Renewable Energy Lab, October 2020, p. 6,
archived at http://web.archive.org/web/20210110172118/https://
www.nrel.gov/docs/fy21osti/77411.pdf.
54 Bureau of Ocean Energy Management, Commercial Wind
Leasing Offshore North Carolina, archived at https://web.archive.org/
web/20201112002242/https://www.boem.gov/renewable-energy/
state-activities/commercial-wind-leasing-offshore-north-carolina.
55 Bureau of Ocean Energy Management, California Activ-
ities, archived at https://web.archive.org/web/20210124012455/
https://www.boem.gov/california; Bureau of Ocean Energy Man-
agement, Hawaii Activities, archived at https://www.boem.gov/
renewable-energy/state-activities/hawaii-activities.
56 Marc Schwartz et al., Assessment of Offshore Wind Energy
Resources for the United States, National Renewable Energy Lab-
oratory, June 2010, p. 9, archived at http://web.archive.org/
web/20201017011017/https://www.nrel.gov/docs/fy10osti/45889.pdf.
57 Meters converted to feet. Maximum depth for fixed-bot-
tom turbines: see note 35.
58 Existence and advancements of floating turbines: see
note 35; Meters converted to feet for maximum depth for floating
turbines: Walter Musial, et al., 2016 Offshore Wind Energy Resource
Assessment for the United States, National Renewable Energy Labo-
ratory, September 2016, p. 15, archived at https://web.archive.org/
web/20201206044939/https://www.nrel.gov/docs/fy16osti/66599.pdf.
Notes 28
59 International projects: International Energy Agency,
Offshore Wind Outlook 2019: World Energy Outlook Special Report,
November 2019, p. 23, downloaded from https://www.iea.org/
reports/offshore-wind-outlook-2019.
60 Walter Musial, et al., 2019 Offshore Wind Technology Data
Update, National Renewable Energy Lab, October 2020, p. 16,
archived at http://web.archive.org/web/20210110172118/https://
www.nrel.gov/docs/fy21osti/77411.pdf.
61 This includes unleased call areas: places that BOEM has
made available to site offshore wind projects but for which it has
not yet finalized any leases; total pipeline capacity includes the
potential capacity of the leased area as well as announced capacity
of planned projects; location is the state closest to the site of the
project. See note 59.
62 Technical potential and energy usage for the Gulf of
Mexico region does not include Florida’s Gulf coast due to limita-
tions in the data and because Florida’s Atlantic coast has greater
potential.
63 Shallow depth: see note 55; Area that can produce
energy: Walter Musial, et al., 2016 Offshore Wind Energy Resource
Assessment for the United States, National Renewable Energy Labora-
tory, September 2016, p. 46-47, archived at https://web.archive.
org/web/20201206044939/https://www.nrel.gov/docs/fy16o-
sti/66599.pdf.
64 Walter Musial, et al., 2016 Offshore Wind Energy Resource
Assessment for the United States, National Renewable Energy Labora-
tory, September 2016, p. 34 and Figure 17 on p. 28, archived at
https://web.archive.org/web/20201206044939/https://www.nrel.
gov/docs/fy16osti/66599.pdf.
65 Walter Musial et al., Offshore Wind in the US Gulf of
Mexico: Regional Economic Modeling and Site-Specific Analyses, Bureau
of Ocean Energy Management, February 2020, p. 8, archived at
http://web.archive.org/web/20210118182038/https://tethys.pnnl.
gov/sites/default/files/publications/BOEM_2020-018.pdf.
66 See note 65.
67 New York’s technical potential from the Great Lakes is
included in the Atlantic region due to limitations in the data and
because the Great Lakes potential is comparatively small.
68 See note 5.
69 Walter Musial, et al., 2019 Offshore Wind Technology Data
Update, National Renewable Energy Lab, October 2020, p. 13,
archived at http://web.archive.org/web/20210110172118/https://
www.nrel.gov/docs/fy21osti/77411.pdf.
70 John Flalka, “U.S. has 7 ocean turbines. Companies see
hundreds soon,” E&E News, 30 July 2020, archived at http://web.
archive.org/web/20201030014539/https://www.eenews.net/sto-
ries/1063653141; American Wind Energy Association, U.S. Offshore
Wind Industry Status Update – November 2020, archived at http://web.
archive.org/web/20201219231244/https://www.awea.org/Awea/
media/Resources/Fact%20Sheets/Offshore-Fact-Sheet.pdf.
71 Walter Musial, et al., 2019 Offshore Wind Technology Data
Update, National Renewable Energy Lab, October 2020, p. 8, 13
and 16, archived at http://web.archive.org/web/20210110172118/
https://www.nrel.gov/docs/fy21osti/77411.pdf; Dominion Energy,
Coastal Virginia Offshore Wind, archived at http://web.archive.org/
web/20210115115005/https://coastalvawind.com/about-offshore-
wind.aspx.
72 Walter Musial, et al., 2019 Offshore Wind Technology Data
Update, National Renewable Energy Lab, October 2020, p. 13
and 16, archived at http://web.archive.org/web/20210110172118/
https://www.nrel.gov/docs/fy21osti/77411.pdf.
73 Walter Musial, et al., 2019 Offshore Wind Technology Data
Update, National Renewable Energy Lab, October 2020, p. 6, 13
and 16, archived at http://web.archive.org/web/20210110172118/
https://www.nrel.gov/docs/fy21osti/77411.pdf.
74 Walter Musial, et al., 2019 Offshore Wind Technology Data
Update, National Renewable Energy Lab, October 2020, p. 25,
archived at http://web.archive.org/web/20210110172118/https://
www.nrel.gov/docs/fy21osti/77411.pdf.
75 Karl-Erik Stromsta, “Why 2020 has been a surprisingly
good year for US offshore wind,” Greentech Media, 25 September
2020, http://web.archive.org/web/20201214193611/https://www.
greentechmedia.com/articles/read/why-2020-has-been-a-surpris-
ingly-good-year-for-us-offshore-wind; Vineyard Wind restarted per-
mitting process: Bureau of Ocean Energy Management, Vineyard
Wind, archived at http://web.archive.org/web/20210209163944/
https://www.boem.gov/vineyard-wind.

29 Offshore Wind for America
76 Karl-Erik Stromsta, “Why 2020 has been a surprisingly
good year for US offshore wind,” Greentech Media, 25 September
2020, http://web.archive.org/web/20201214193611/https://www.
greentechmedia.com/articles/read/why-2020-has-been-a-surpris-
ingly-good-year-for-us-offshore-wind.
77 Southeastern Wind Coalition, Offshore Wind MOU
Between Maryland, Virginia, and North Carolina Released Today (press
release), 29 October 2020, archived at http://web.archive.org/
web/20201101021411/https://www.sewind.org/news/entry/sewc-
press-release-offshore-wind-mou-between-maryland-virginia-and-
north-ca.
78 See note 69.
79 See, for example, p. 86 of California Energy Commis-
sion, et al., Draft 2021 SB 100 Joint Agency Report, December 2020,
accessed 18 February 2021 at https://efiling.energy.ca.gov/getdocu-
ment.aspx?tn=235848.
80 See note 76.
81 State of New Jersey, Governor Murphy Announces $250
Million Total Investment in State-of-the-Art Manufacturing Facility to
Build Wind Turbine Components to Serve Entire U.S. Offshore Wind
Industry (press release), 21 December 2020, archived at http://web.
archive.org/web/20210114180036/https://www.nj.gov/governor/
news/news/562020/20201222a.shtml.
82 WPED Staff, “PTC extended by one year, new offshore
wind tax credit inserted in Congress bill,” Windpower Engineering
& Development, 22 December 2020, archived at http://web.archive.
org/web/20210105093720/https://www.windpowerengineering.
com/ptc-extended-by-one-year-new-offshore-wind-tax-credit-insert-
ed-in-congress-bill/.
83 Ibid.
84 Union of Concerned Scientists, Production Tax Credit for
Renewable Energy, 9 February 2015, archived at http://web.archive.
org/web/20201209015445/https://www.ucsusa.org/resources/
production-tax-credit-renewable-energy.
85 U.S. Bureau of Ocean Energy Management, Renewable
Energy Lease and Grant Information, archived at https://web.archive.
org/web/20210105223956/https://www.boem.gov/renewable-en-
ergy/lease-and-grant-information.
86 Interest in development: Iulia Gheorghiu, “Interior
Department to streamline offshore wind permitting, nix unso-
licited leasing,” Utility Dive, 6 July 2020, archived at http://web.
archive.org/web/20201028223930/https://www.utilitydive.com/
news/interior-department-to-streamline-offshore-wind-permit-
ting-nix-unsolicited/581035/.
87 Noah Asimow, “Vineyard Wind sees more permitting
delays,” Vineyard Gazette, 23 November 2020, archived at http://
web.archive.org/web/20210116181726/https://vineyardgazette.
com/news/2020/11/23/vineyard-wind-sees-more-delays-stays-track-
be-first-race-build-offshore-wind-farm.
88 Multiple delays: see note 86; Delays could have
forced a project cancellation: Colin A. Young, “Vineyard
Wind announces new delay in offshore wind project,” WBUR
Earthwhile, 11 February 2020, archived at http://web.archive.
org/web/20210115014619/https://www.wbur.org/earth-
while/2020/02/11/vineyard-wind-delay-boem-eis.
89 Jeff St. John, “Vineyard Wind switches to GE turbines,
delays permitting process,” Greentech Media, 2 December 2020,
archived at http://web.archive.org/web/20201214194034/https://
www.greentechmedia.com/articles/read/vineyard-wind-switch-
es-to-ge-offshore-wind-turbines-delays-permitting-application.
90 President Biden’s interest in offshore wind: The White
House, FACT SHEET: President Biden Takes Executive Actions to
Tackle the Climate Crisis at Home and Abroad, Create Jobs, and Restore
Scientific Integrity Across Federal Government, 27 January 2021, archived
at https://web.archive.org/web/20210207190518/https://www.
whitehouse.gov/briefing-room/statements-releases/2021/01/27/
fact-sheet-president-biden-takes-executive-actions-to-tackle-the-climate-
crisis-at-home-and-abroad-create-jobs-and-restore-scientific-integrity-a-
cross-federal-government/.
91 Lazard, Lazard’s Levelized Cost of Energy Analysis – Version
14.0, October 2020, p. 2, archived at http://web.archive.org/
web/20201119055526/https://www.lazard.com/media/451419/
lazards-levelized-cost-of-energy-version-140.pdf.
92 Walter Musial, et al., 2019 Offshore Wind Technology Data
Update, National Renewable Energy Lab, October 2020, p. 65,
archived at http://web.archive.org/web/20210110172118/https://
www.nrel.gov/docs/fy21osti/77411.pdf.

Notes 30
93 Walter Musial, et al., 2019 Offshore Wind Technology Data
Update, National Renewable Energy Lab, October 2020, p. 68,
archived at http://web.archive.org/web/20210110172118/https://
www.nrel.gov/docs/fy21osti/77411.pdf.
94 American Wind Energy Association, U.S. Offshore Wind
Industry Status Update – November 2020, archived at http://web.
archive.org/web/20201219231244/https://www.awea.org/Awea/
media/Resources/Fact%20Sheets/Offshore-Fact-Sheet.pdf.
95 See note 76.
96 Ibid.
97 Jones Act applies to offshore wind: Michael Harowski,
“Congress confirms that Jones Act applies to offshore wind farm
activities,” International Law Office, 20 January 2021, accessed 10
February 2021 at https://www.internationallawoffice.com/News-
letters/Shipping-Transport/USA/Wilson-Elser/Congress-con-
firms-that-Jones-Act-applies-to-offshore-wind-farm-activities.
98 New habitat: International Energy Agency, Offshore
Wind Outlook 2019: World Energy Outlook Special Report, Novem-
ber 2019, p. 58, downloaded from https://www.iea.org/reports/
offshore-wind-outlook-2019; Negative impacts: Tara Lohan,
“Offshore wind power is ready to boom. Here’s what that means
for wildlife,” The Revelator, 15 January 2021, archived at http://
web.archive.org/web/20210115130258/https://therevelator.org/
offshore-wind-wildlife/.
99 Tara Lohan, “Offshore wind power is ready to boom.
Here’s what that means for wildlife,” The Revelator, 15 January
2021, archived at http://web.archive.org/web/20210115130258/
https://therevelator.org/offshore-wind-wildlife/.
100 Ibid.
101 New York State Environmental Technical Working
Group, archived at http://web.archive.org/web/20201126114153/
https://www.nyetwg.com/; U.S. Bureau of Ocean Energy Man-
agement, Renewable Energy, archived at https://web.archive.org/
web/20210119215545/https://www.boem.gov/renewable-energy.
102 Transmission infrastructure is not in place: Walter
Musial et al., 2018 Offshore Wind Technologies Market Report, U.S.
Department of Energy, September 2019, p. 5, archived at http://
web.archive.org/web/20201016205647/https://www.energy.gov/
sites/prod/files/2019/09/f66/2018%20Offshore%20Wind%20
Technologies%20Market%20Report.pdf.
103 Johannes Pfeifenberger, et al., Offshore Wind Transmission:
An Analysis of Planning in New England and New York, The Brattle
Group, 23 October 2020, archived at https://web.archive.org/
web/20210208224042/https://brattlefiles.blob.core.windows.net/
files/20360_offshore_wind_transmission_-_an_analysis_of_plan-
ning_in_new_england_and_new_york.pdf.
104 Electrification Futures Study uses only those energy effi-
ciency improvements modeled by the Energy Information Admin-
istration in Annual Energy Outlook assumptions: Trieu Mai, Senior
Energy Analyst, National Renewable Energy Laboratory, Personal
Communication, 15 February 2021; The Annual Energy Outlook
does not model rapid and concerted energy efficiency improve-
ments, e.g. widespread weatherization, and uses current efficiency
standards and policies. See, for example: Energy Information
Administration, Annual Energy Outlook 2021 with Projections to
2050, February 2021, p. 10, archived at https://web.archive.org/
web/20210205044911/https://www.eia.gov/outlooks/aeo/pdf/
AEO_Narrative_2021.pdf.
105 See Methodology.