Embed Size (px)
Citation preview
Offshore Wind Cost ReductionPathways Study

This study would not have been possible without the input,opinion and review of the offshore wind renewable industry.Content discussed and analysed in this report is as a directresult of industry input and data provision. The Crown Estatewould like to thank the participants who took part in one-to-one meetings, workshops, debates and discussionsand who were involved in compiling and validating theinformation which forms the basis of this study.
For a full list of acknowledgements, please see theacknowledgements section in this report.

For the UK, offshore wind is a story of many successes.
We have the world’s biggest offshore wind market, the world’s most attractive investment environment, and an unparalleled record of deployment. Five of the ten largest offshore wind farms – including the top two – are in British seas.
These successes are fitting: ours is an island nation, blessed with copious wind and shallow seas. If we are to match our cleanenergy ambitions, we must take full advantage of this potent natural resource.
We believe that the offshore wind industry can and must evolve to be more competitive and forward looking. That in turn will boost the security of our energy supplies, create jobs, and attract further inward investment.
Realising offshore wind’s potential is crucial to meeting our 2020 renewable energy targets. But we have a responsibility to deliver a low-carbon future at the lowest cost to consumers.
That is why we welcome the Offshore Wind Cost Reduction Pathways Study, which identifies and quantifies cost reductionopportunities for the offshore wind industry.
An evidence-based study, it enriches the reader’s understanding of the drivers and dependencies of offshore wind costs. Through consultation with industry, the study provides a platform for the government, project developers, the supply industry and operators to align future activities and maximise cost reductions.
Opportunities for savings across the finance, technology and supply chain sectors have been identified and quantified, thus allowing a significant reduction in the cost of offshore wind. Overall, it gives us confidence that significant cost-savingopportunities are available and achievable by 2020.
We believe that the Offshore Wind Cost Reduction Pathways Study represents an authoritative and credible way forward. We would like to invite the DECC Cost Reduction Taskforce to apply The Crown Estate’s evidence, findings and conclusionsto their thinking and in the formulation of an action plan.
Rt Hon Edward Davey MP Alison Nimmo
Secretary of State for Energy and Climate Change Chief Executive, The Crown Estate
i
Foreword

AcknowledgementsThe Crown Estate would like to thank:
The following companies who participated in this study by providing their perspectives and insights on potential future offshore wind cost reduction, together with supportive data and information:
A2Sea Eksport Kredit Fonden Mitsubishi SeaRoc
AbleUK Eneco Moody’s Seaway Heavy Lifting
Alstom Energy Technologies Institute MOOG Siemens
Ambau E.ON MPI Offshore Sinovel
AON Fluor MT Hojgaard SLP Energy
Areva Forewind Natural Power SMart Wind
Atkins Fugro Nexans Smulders Projects
Ballast Nedam GE Energy NSW GmbH SSE Renewables
BiFab GE Energy, Power Conversion OGN Group Statoil
Borealis Geosea Owec Tower Strabag
Bladt Industries Global Marine Systems PD Ports Subsea7
BMT Nigel Gee Gravitas Offshore Limited Peel Ports Tata Steel
BPA GustoMSC Petrofac Technip
Carbon Trust Harland and Wolff Pinsent Masons University of Strathclyde
Centrica HSBC Prysmian Van Oord
Cosalt Wind Energy IWES Ramboll Vattenfall
CT Offshore JDR Cables Repsol Vestas
CTC Marine KBR Repower Systems SE VINCI Construction UK
David Brown Gears KCI RES Offshore Visser & Smit
DONG Energy KfW Ricardo Wesserwind
DTU Wind Energy Legal & General RWE Npower Renewables Willis
E.I.B Lloyds Saipem ZF Wind Power Antwerpen
EDPR Mainstream Renewable Power Scottish Power Renewables
ii
Offshore wind cost reduction pathways study
The Project Advisory Board who played a key role in guidingthe study. The members were:
• Duarte Figueira DECC
• Allan Taylor DECC
• Mark Thomas InfrastructureUK
• Thomas Arensbach Gamesa (until March 2012)
• Ron Cookson Technip
• Gordon Edge RenewableUK
• Michael Rolls Siemens
• Richard Sandford RWE
• Christian Skakkebaek DONG Energy
• Ian Temperton Climate Change Capital
The team that prepared this report including Paul Arwas,David Charlesworth, Duncan Clark, Richard Clay, Gareth Craft,Ian Donaldson, Andy Dunlop, Adrian Fox, Richard Howard,Chris Lloyd, Alan Marshall and Fay Wiles
The team that prepared this report including Paul Arwas,David Charlesworth, Duncan Clark, Richard Clay, Gareth Craft,Ian Donaldson, Andy Dunlop, Adrian Fox, Richard Howard,Chris Lloyd, Clare Lovett, Alan Marshall and Fay Wiles
The following organisations and interested parties who kindlygave their time:
• BIS
• CBI
• Committee on Climate Change
• Professor Dieter Helm (University of Oxford)
• Energy Bank
• Energy Research Partnership
• EWEA
• Garrad Hassan
• Narec
• Northern Ireland Executive
• Poyry
• Red Point
• Dr Robert Gross (Imperial College London)
• Scottish Government
• Scottish Renewables
• Technology Strategy Board
• Welsh Government
• WWF
iii
Executive summary
Chapter 1: Introduction Page 1
Chapter 2: How we conducted the study Page 3
Chapter 3: Cost reduction opportunities Page 13
Chapter 4: Cost pathways to 2020 and beyond Page 38
Chapter 5: Prerequisites for cost reduction Page 53
Chapter 6: Health and safety Page 61
Chapter 7: Conclusions Page 63
Glossary of terms Page 65
Appendices
A. Recent analyses of offshore wind costs Page 67
B. Key assumptions Page 69
C. Project Advisory Panel terms of reference Page 73
Specifically commissioned reports CD Insert
• BVG Associates, Offshore wind cost reduction pathways – Technology work stream, April 2012
• E C Harris, Offshore wind cost reduction pathways – Supply Chain work stream, April 2012
• PMSS, Offshore wind cost reduction pathways – Health & Safety Review, April 2012
• PricewaterhouseCoopers, Offshore wind cost reduction pathways project – Finance work stream, April 2012
• RenewableUK, Potential for offshore transmission cost reductions, February 2012
v
Table of contents
Printed: May 2012
Offshore wind cost reduction pathways study
The costs of offshore wind in the UK have increasedsubstantially since the first commercial scale wind farms weredeployed in the early 2000s, driven both by underlying costincreases (commodity prices rises, currency fluctuations) andby more specific factors such as supply chain bottlenecks, sub-optimal reliability and the move to deeper water sites.Recent wind farm projects have indicated that costs havestabilised at around £140 per MWh (for projects at FinalInvestment Decision in 2011). At the same time, Government and industry are facingimportant decisions regarding the size of the offshore windindustry and investment in new technologies and facilities.Future costs will be critical in determining the future size ofthe industry in the UK.
This study has produced a rigorous and validated assessmentof the potential for offshore wind power cost reduction. It is based on unprecedented engagement with and challengefrom around 120 companies and organisations and individualsfrom the offshore wind industry, insurance, academic andfinance communities over a period of six months.
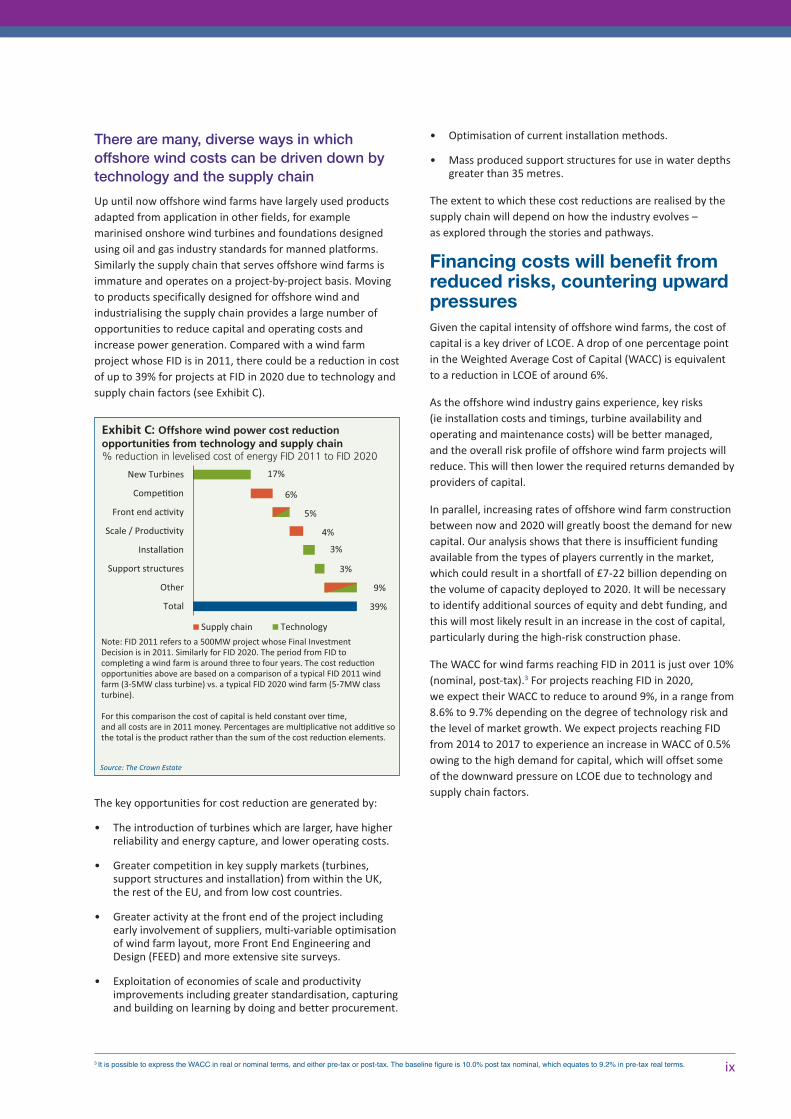
Reducing the cost of offshorewind to £100/MWh by 2020 is achievable DECC has put forward a challenge that offshore wind shouldreach a Levelised Cost of Energy (LCOE) of £100/MWh by2020, in order to maximise the size of the industry. Drawing on input from project participants, we have definedfour industry ‘stories’ reflecting different ways in whichoffshore wind could develop. These have been used as thebasis to develop cost reduction ‘pathways’, in order to test theachievability of the £100/MWh ambition. Our cost reductionpathways explore the impact on LCOE of the key uncertaintiesfacing the offshore wind industry:
• the rate of offshore wind capacity build
• the pace of technological change
• the maturity of the supply chains serving offshore wind developers
• the depth of financial markets investing in offshore wind.
In three of the pathways, offshore wind reaches a LevelisedCost of Energy at or below £100/MWh for projects reachingFinal Investment Decision (FID) in 2020, and is well on its wayto meeting this benchmark by FID 2017 (see Exhibit A). The exception to this is the Slow Progression story, where costreduction is held back by the relatively small market andinsufficient intervention by government and industry, and theLCOE remains relatively high.
vii
Executive summary
3. ‘Supply Chain Efficiency’• 36GW in Europe by 2020 (17GW in UK)• Incremental technology evolu�on (e.g. steady progress to 5-7MW turbines)• Greater compe��on, investment, project collabora�on and be�er risk management• Deeper financial markets, lower risk/lower cost of capital
High innova�on
High innova�on
Incrementalimprovement
Incrementalimprovement
Finance &Supply Chain
Technology
4. ‘Rapid Growth’• 43GW in Europe by 2020 (23GW in UK)• High levels of technology evolu�on across all wind farm elements (e.g. turbines progress rapidly to 5-7MW+)• Greater compe��on, investment, project collabora�on and be�er risk management• Challenging volume of finance required
1. ‘Slow Progression’ • 31GW in Europe by 2020 (12GW in UK)• Incremental technology evolu�on, progress limited by market size• Limited compe��on/economies of scale• Modest developments in financing solu�ons, reduced in risk/cost of capital
2. ‘Technology Accelera�on’• 36GW in Europe by 2020 (17GW in UK)• High levels of technology evolu�on across all wind farm elements (e.g. turbines progress rapidly to 5-7MW+)• Fragmented supply chain with some improvement in collabora�on• Limited improvement in cost of capital due to ongoing changes in technology
Exhibit A: Industry Stories
What do we mean by the Levelised Cost of Energy (LCOE)?In simple terms, LCOE can be seen as the lifetime cost of the project, per unit of energy generated.
It is defined as the sum of discounted lifetime generation costs (£) divided by the sum of discounted lifetime electricity output (MWh). Generation costs include all capital, operating, and decommissioning costs incurred by the generator/developer over the lifetime of the project, including transmission costs. It does not necessarily correspond to the level of revenue (or ‘strike price’) that would be required to support the project –it is an expression of cost rather than revenue. The discount rate is the Weighted Average Cost of Capital (WACC) over the lifetime of the project; as determined by the capital structure and financing costs. LCOE is calculated on a post-tax basis and expressed in real 2011 prices for all years.

The cost pathways related to our four industry stories can besummarised as follows.
• The Slow Progression story assumes slow market growth and limited supply chain maturation andtechnology development. In these unfavourablecircumstances, the LCOE of offshore wind power only falls to £115/MWh by FID 2020, and close to £134/MWhby FID 2017.
• The Technology Acceleration story envisages a worldwhere new products evolve rapidly, leading to a diverserange of turbines, foundations, cabling, installationmethods, and other solutions available in the market. The supply chain remains fragmented in this story, andtechnology risks, and therefore the cost of capital, remain slightly higher than in other stories. As a result,LCOE falls to £100/MWh in FID 2020, and around£118/MWh by FID 2017.
• In the Supply Chain Efficiency story, industry standardiseson 4MW class and 6MW class turbines1 and related keycomponents; invests in new, larger-scale facilities andworking methods; and operates in a highly competitive setof markets. The increased supply chain savings andbenefits to the cost of capital, coupled with a fair degreeof technology progress, leads to a similar set of costs asthe Technology Acceleration story (£96/MWh by 2020,£121/MWh by 2017).
• The Rapid Growth story assumes a very favourable set ofcircumstances, including the avoidance of supply chainbottlenecks, and indicates the limit of how far the industrymight go in achieving costs reductions. In this story theLCOE falls to £89/MWh by FID 2020, and around£115/MWh by FID 2017.
• The LCOE values represent the ‘average’ cost for projectsreaching FID in a particular year, blended across anassumed mix of sites and technologies used in that year. In reality, no two projects will have exactly the same costs,and we estimate that by 2020, the variability around thesecentral costs will be up to +/- £14/MWh.
Based on the four generic site types we have used in ourmodelling, there is a relatively balanced LCOE trade-offbetween shallow water, close to shore sites with lower windspeed, and deeper water and /or further from shore sites withhigher wind speed. In other words, the move to deeper waterand/or further from shore sites in Round 3 and ScottishTerritorial Waters is not likely to result in a material LCOEpenalty once the greater energy production due to higherwind speed is taken into account. This presents a morepositive view of the viability of projects on these sitescompared with the finding of previous reports.
Analysis has shown that our results are sensitive to theassumptions made on exchange rates, commodity prices (steeland copper in particular), the operating life of the wind farm,and interest rates. The cost pathways above are based on fixedexternal factors (eg commodity prices and exchange rates fixedat average 2011 levels in real terms). Changes in these externalfactors will also impact the costs of other forms of low carbongeneration such as nuclear and onshore wind.
Beyond 2020, we foresee further cost reduction opportunitiesfrom both technology and the supply chain. The toptechnology innovations we have identified2 are expected tohave achieved less than 50% of their potential by 2020, leaving considerable room for further improvements. In addition, there is the potential for a step change in LCOEthrough the introduction of radically new technologies beyond2020. We also expect that competition and collaboration inoperations and maintenance will start to generate materialcost savings post-2020.
viii 1 4MW class turbines refers to turbines in the range of 3-5MW, 6MW class turbines refers to turbines in the range of 5-7MW2 For a 6MW-Class Turbine
Offshore wind cost reduction pathways study
0
20
40
60
80
100
120
140
160
FID 2011 FID 2014 FID 2017 FID 2020
Leve
lised
Cos
t of
Ene
rgy
(£/M
Wh)
1 - Slow Progression 2 - Technology Accelera�on
3 - Supply Chain Efficiency 4 - Rapid Progression
Exhibit B: Offshore wind levelised cost of energy by story
Source: The Crown Estate
There are many, diverse ways in whichoffshore wind costs can be driven down bytechnology and the supply chain
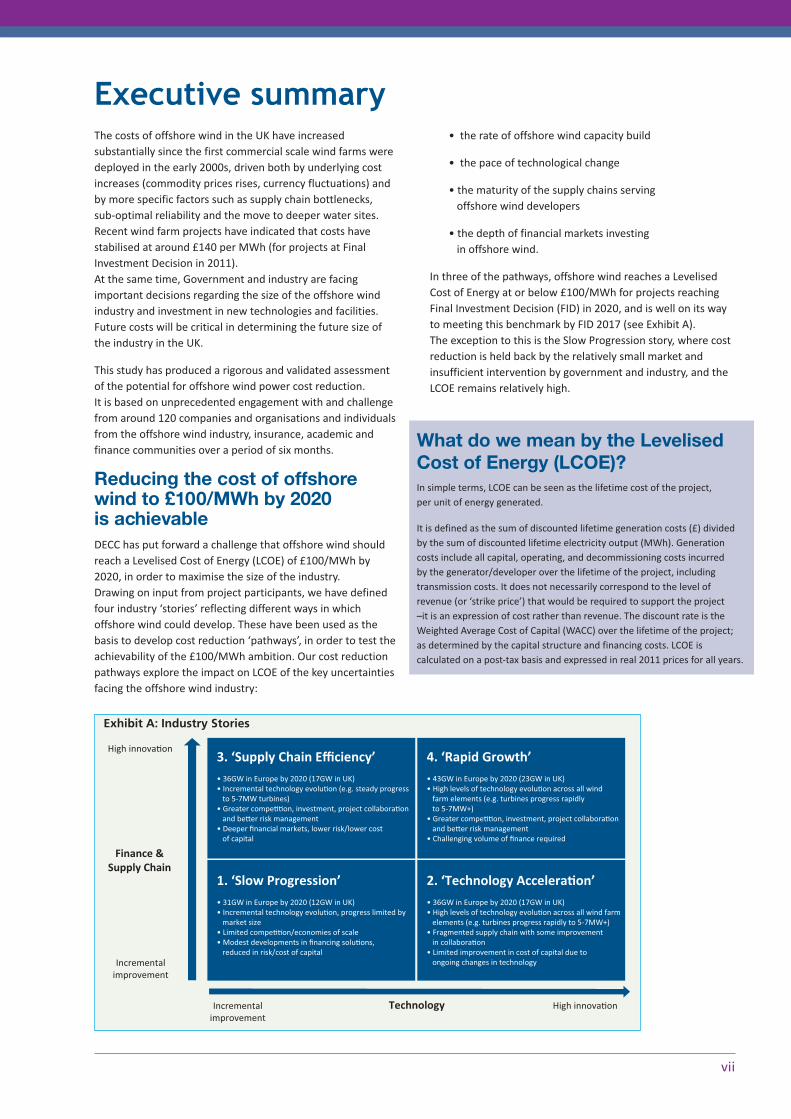
Up until now offshore wind farms have largely used productsadapted from application in other fields, for examplemarinised onshore wind turbines and foundations designedusing oil and gas industry standards for manned platforms.Similarly the supply chain that serves offshore wind farms isimmature and operates on a project-by-project basis. Movingto products specifically designed for offshore wind andindustrialising the supply chain provides a large number ofopportunities to reduce capital and operating costs andincrease power generation. Compared with a wind farmproject whose FID is in 2011, there could be a reduction in costof up to 39% for projects at FID in 2020 due to technology andsupply chain factors (see Exhibit C).
The key opportunities for cost reduction are generated by:
• The introduction of turbines which are larger, have higherreliability and energy capture, and lower operating costs.
• Greater competition in key supply markets (turbines,support structures and installation) from within the UK,the rest of the EU, and from low cost countries.
• Greater activity at the front end of the project includingearly involvement of suppliers, multi-variable optimisationof wind farm layout, more Front End Engineering andDesign (FEED) and more extensive site surveys.
• Exploitation of economies of scale and productivityimprovements including greater standardisation, capturingand building on learning by doing and better procurement.
• Optimisation of current installation methods.
• Mass produced support structures for use in water depthsgreater than 35 metres.
The extent to which these cost reductions are realised by thesupply chain will depend on how the industry evolves – as explored through the stories and pathways.
Financing costs will benefit fromreduced risks, countering upwardpressuresGiven the capital intensity of offshore wind farms, the cost ofcapital is a key driver of LCOE. A drop of one percentage pointin the Weighted Average Cost of Capital (WACC) is equivalentto a reduction in LCOE of around 6%.
As the offshore wind industry gains experience, key risks (ie installation costs and timings, turbine availability andoperating and maintenance costs) will be better managed, and the overall risk profile of offshore wind farm projects willreduce. This will then lower the required returns demanded byproviders of capital.
In parallel, increasing rates of offshore wind farm constructionbetween now and 2020 will greatly boost the demand for newcapital. Our analysis shows that there is insufficient fundingavailable from the types of players currently in the market,which could result in a shortfall of £7-22 billion depending onthe volume of capacity deployed to 2020. It will be necessaryto identify additional sources of equity and debt funding, andthis will most likely result in an increase in the cost of capital,particularly during the high-risk construction phase.
The WACC for wind farms reaching FID in 2011 is just over 10%(nominal, post-tax).3 For projects reaching FID in 2020, we expect their WACC to reduce to around 9%, in a range from8.6% to 9.7% depending on the degree of technology risk andthe level of market growth. We expect projects reaching FIDfrom 2014 to 2017 to experience an increase in WACC of 0.5%owing to the high demand for capital, which will offset someof the downward pressure on LCOE due to technology andsupply chain factors.
ix3 It is possible to express the WACC in real or nominal terms, and either pre-tax or post-tax. The baseline figure is 10.0% post tax nominal, which equates to 9.2% in pre-tax real terms.
3%
4%
6%
3%
5%
17%
9%
39%Total
Other
Support structures
Installa�on
Scale / Produc�vity
Front end ac�vity
Compe��on
New Turbines
Supply chain Technology
Exhibit C: Offshore wind power cost reductionopportunities from technology and supply chain% reduction in levelised cost of energy FID 2011 to FID 2020
Source: The Crown Estate
Note: FID 2011 refers to a 500MW project whose Final Investment Decision is in 2011. Similarly for FID 2020. The period from FID to comple�ng a wind farm is around three to four years. The cost reduc�onopportuni�es above are based on a comparison of a typical FID 2011 windfarm (3-5MW class turbine) vs. a typical FID 2020 wind farm (5-7MW classturbine).
For this comparison the cost of capital is held constant over �me, and all costs are in 2011 money. Percentages are mul�plica�ve not addi�ve sothe total is the product rather than the sum of the cost reduc�on elements.

A steadily increasing market and predictable project timings are criticalIn order to realise cost reductions, the single most importantprerequisite is a steadily increasing market for offshore windpower, together with a predictable set of project timings. Our stories and pathways demonstrate that increased levels ofcost reduction are possible in a larger market, but this needsto be coupled with predictability and permanence of themarket in order for cost reductions to be maximised.
The key issues to address to achieve this are:
• A smooth and timely transition to the new electricitymarket arrangements specified under the ElectricityMarket Reform (especially feed in tariff allocations andstrike prices), and clarity on public funding for renewable energy beyond 2015 as defined by the LevyControl Framework.
• Reliably meeting the clear timetable for planningdetermination in England and Wales, as proposed underthe Planning Act 2008 (as amended), and in Scotland (as administered by Marine Scotland).
• A clear and predictable regulatory framework for offshore transmission.
Supply chain companies are now considering building facilitiesand vessels and developing new products to supply wind farmprojects in the second half of this decade. These investmentswill typically need more than ten years to generate anadequate return. Investors, therefore, require a line of sight onthe offshore wind market to at least 2025. Steady marketgrowth is essential as it avoids the stop/ start cycles that aredetrimental to investment decisions and efficient working. Our analysis suggests that a UK market of at least 2GW/yearfrom 2015 to 2025 (ie that seen in the Technology Accelerationand Supply Chain Efficiency stories) is needed to ensuresignificant cost reduction, assuming market developmentplans in the rest of the EU remain on track.
Ensuring that project timings are predictable is also crucial toachieving cost reduction. This will encourage greatercollaboration, ease the new entry of innovative new productsand capital, and shorten project timetables.
Reliable planning, timely market reform, and clarity onoffshore transmission, were all seen by project participants asthe fundamental building blocks for the market going forward.
Other prerequisitesIn addition, Governments should continue to play a key role inencouraging technology development by continuing Research,Development and Demonstration support, including testingand demonstrating projects and ensuring effective use ofplanning flexibility.
Developers should be more proactive in further developingand funding full scale demonstration projects.
The ramp-up in offshore wind deployment which will drivedown costs depends on the availability of coastalmanufacturing and assembly facilities. Manufacturers,developers and consenting bodies must work closely togetherto ensure the timely availability of suitable sites.
Within this context, wind farm developers and their suppliersmust work together to deliver continuous, end-to-end costand risk reduction. This will mean a shift from working on aproject-by-project basis to managing a pipeline of projects todrive down cost, including:
• developers making a steadily increasing market foroffshore wind farms visible to the supply chain, to supportinvestment in facilities and new methods of working
• willingness to work together to achieve best practice andshare risks and incentivise improvements appropriatelywith a particular focus on the key risk areas of installationand operations and maintenance
• being open to standard solutions rather than insisting oninternal standards or bespoke approaches
• grasping opportunities to introduce new products
• jointly managing supply and installation hitches.
Developers, key suppliers and the finance community mustcollaborate to access new pools of equity, debt and bondfinance (recognising the not inconsiderable lead timeinvolved), involve insurers early in technology development toavoid delays and ensure risks are identified and understood quickly.
Finally, a wide variety of stakeholders need to work togetherto ensure an adequate supply of people with the right skillsand experience.
Public commitment to the futureof offshore wind is now essentialThe cost pathways we have developed, based onunprecedented input from industry, indicate a strong potentialfor offshore wind to achieve DECC's benchmark cost of£100/MWh by 2020. We believe the prerequisites toachieving cost reduction are both proportionate andachievable. We therefore call on industry and government tocommit publicly to putting those prerequisites in place in atimely manner and to working together to achieve a sustainable industry
x
Offshore wind cost reduction pathways study
The UK has stretching renewableenergy and emissions targetsThe use of renewable energy has many potential benefits,including greater energy security and protection from fossilfuel price fluctuations, as well as reduction in greenhouse gas emissions. The growth of renewable energy sources hasthe potential to stimulate employment through the creation of jobs in new ‘green’ industries.
In order to reap the benefits of renewable energy, at anaffordable cost, the Government has published its UKRenewable Energy Roadmap charting a course towards 15% offinal energy consumption from renewables by 2020,equivalent to some 234 TWh/year.4 This is consistent with theEU Renewables Directive which has set a target of 20% of EUenergy to come from renewable sources by 2020.
The UK has more than doubled its use of renewable energysince 2006 (from 1.5% to 3.3% in 2010).5 However, meetingthe 2020 target represents a considerable challenge as the UKhas the largest renewable energy ‘gap‘ of all EU countries (ie the difference between the current level of renewableenergy and the indicative 2020 target).
The UK could meet this target through greater use of a mix ofrenewable electricity, renewable heat and biofuels. DECC has most recently reviewed these options in the UKRenewable Energy Roadmap. Their central view of deploymenthighlights renewable electricity as delivering a high portion ofthe renewable energy gap, with at least 40% of 2020renewable energy coming from electricity.
The UK has also enshrined emissions targets in law throughthe Climate Change Act, a legally binding long-term emissionsreduction framework operating through a series of five-yearcarbon budgets. The currently legislated budget commits theUK to cutting greenhouse gas emissions by 34% by 2018-22over 1990 levels (or 21% compared with 2005).6 Analysis bythe Committee on Climate Change has identifieddecarbonisation of the power sector as one of the main waysof meeting the 2018-22 budgets, with a 40% emissionreduction realistically achievable through the deployment oflow carbon generation including offshore wind.7
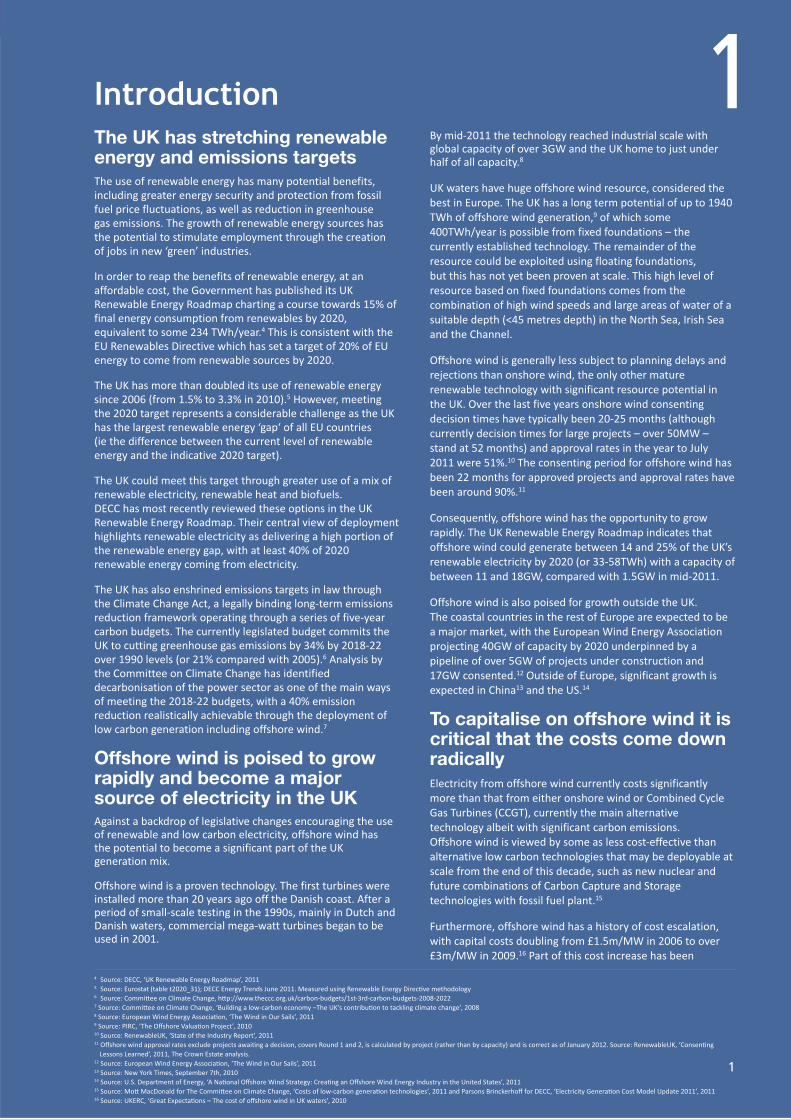
Offshore wind is poised to growrapidly and become a majorsource of electricity in the UKAgainst a backdrop of legislative changes encouraging the useof renewable and low carbon electricity, offshore wind has the potential to become a significant part of the UK generation mix.
Offshore wind is a proven technology. The first turbines wereinstalled more than 20 years ago off the Danish coast. After aperiod of small-scale testing in the 1990s, mainly in Dutch andDanish waters, commercial mega-watt turbines began to beused in 2001.
By mid-2011 the technology reached industrial scale withglobal capacity of over 3GW and the UK home to just underhalf of all capacity.8
UK waters have huge offshore wind resource, considered thebest in Europe. The UK has a long term potential of up to 1940TWh of offshore wind generation,9 of which some400TWh/year is possible from fixed foundations – thecurrently established technology. The remainder of theresource could be exploited using floating foundations, but this has not yet been proven at scale. This high level ofresource based on fixed foundations comes from thecombination of high wind speeds and large areas of water of asuitable depth (<45 metres depth) in the North Sea, Irish Seaand the Channel.
Offshore wind is generally less subject to planning delays andrejections than onshore wind, the only other maturerenewable technology with significant resource potential inthe UK. Over the last five years onshore wind consentingdecision times have typically been 20-25 months (althoughcurrently decision times for large projects – over 50MW –stand at 52 months) and approval rates in the year to July2011 were 51%.10 The consenting period for offshore wind hasbeen 22 months for approved projects and approval rates havebeen around 90%.11
Consequently, offshore wind has the opportunity to growrapidly. The UK Renewable Energy Roadmap indicates thatoffshore wind could generate between 14 and 25% of the UK’srenewable electricity by 2020 (or 33-58TWh) with a capacity ofbetween 11 and 18GW, compared with 1.5GW in mid-2011.
Offshore wind is also poised for growth outside the UK. The coastal countries in the rest of Europe are expected to bea major market, with the European Wind Energy Associationprojecting 40GW of capacity by 2020 underpinned by apipeline of over 5GW of projects under construction and17GW consented.12 Outside of Europe, significant growth isexpected in China13 and the US.14
To capitalise on offshore wind it iscritical that the costs come downradicallyElectricity from offshore wind currently costs significantlymore than that from either onshore wind or Combined CycleGas Turbines (CCGT), currently the main alternativetechnology albeit with significant carbon emissions. Offshore wind is viewed by some as less cost-effective thanalternative low carbon technologies that may be deployable atscale from the end of this decade, such as new nuclear andfuture combinations of Carbon Capture and Storagetechnologies with fossil fuel plant.15
Furthermore, offshore wind has a history of cost escalation,with capital costs doubling from £1.5m/MW in 2006 to over£3m/MW in 2009.16 Part of this cost increase has been
1
4 Source: DECC, ‘UK Renewable Energy Roadmap’, 2011 5 Source: Eurostat (table t2020_31); DECC Energy Trends June 2011. Measured using Renewable Energy Direc�ve methodology 6 Source: Commi�ee on Climate Change, h�p://www.theccc.org.uk/carbon-budgets/1st-3rd-carbon-budgets-2008-2022 7 Source: Commi�ee on Climate Change, ‘Building a low-carbon economy –The UK’s contribu�on to tackling climate change’, 2008 8 Source: European Wind Energy Associa�on, ‘The Wind in Our Sails’, 2011 9 Source: PIRC, ‘The Offshore Valua�on Project’, 2010 10 Source: RenewableUK, ‘State of the Industry Report’, 2011 11 Offshore wind approval rates exclude projects awai�ng a decision, covers Round 1 and 2, is calculated by project (rather than by capacity) and is correct as of January 2012. Source: RenewableUK, ‘Consen�ng
Lessons Learned’, 2011, The Crown Estate analysis. 12 Source: European Wind Energy Associa�on, ‘The Wind in Our Sails’, 2011 13 Source: New York Times, September 7th, 2010 14 Source: U.S. Department of Energy, ‘A Na�onal Offshore Wind Strategy: Crea�ng an Offshore Wind Energy Industry in the United States’, 201115 Source: Mo� MacDonald for The Commi�ee on Climate Change, ‘Costs of low-carbon genera�on technologies’, 2011 and Parsons Brinckerhoff for DECC, ‘Electricity Genera�on Cost Model Update 2011’, 2011 16 Source: UKERC, ‘Great Expecta�ons – The cost of offshore wind in UK waters’, 2010
Introduction 1

caused by commodity price increases and currencyfluctuations that have also affected other electricitygeneration technologies. However, the cost of offshore windhas increased further owing to supply chain bottlenecks, lackof competition, sub-optimal reliability, and deployment indeeper water.17 This is in stark contrast with the expectationsof declining costs in the late 1990s and early 2000s.18
Looking to the future, Government is in the process ofreforming the electricity market, including the financialsupport mechanism for the deployment of low carbongeneration technology. The way these changes areimplemented will largely set the size of the offshore windmarket up to 2020 and beyond. These changes are driven by a desire to minimise costs to consumers. Offshore wind’sposition in the future electricity generation mix will, to a largeextent, be driven by its cost relative to those of other forms of electricity.
In a significant step, DECC has directly linked its expectation ofthe size of the offshore wind market with cost reduction –stating that the delivery of 18GW of offshore wind capacity by2020 can only be achieved if costs fall to £100/MWh.19
This makes offshore wind power cost competitive with DECC’sforecast for other low carbon generation which will benecessary in the 2020s. With current offshore wind costs inthe order of £140/MWh, the magnitude of the cost reductionchallenge is enormous.
The interdependence betweenmarket size and costFuture costs and future market size are inextricably linked. The costs of offshore wind will reduce significantly only if theindustry as a whole invests in new technologies, large scaleautomated manufacturing facilities, more effective projectmanagement techniques, new installation vessels andmethods, and more effective ways of operating andmaintaining wind farms. Industry will, however, only invest if itperceives there is a sustainable and viable market for offshorewind. Full realisation of the cost reductions will be achievedthrough industry building on real experience which againdepends on a sustained, growing market.
We are faced, therefore, by a dilemma: Government will onlyprovide for a sizeable offshore wind market if it has confidencethat costs will drop significantly, but industry will only invest toreduce costs if it has confidence in the long term future of theoffshore wind market.
This is an urgent issue. To make significant progress by 2020,industry needs to begin investing now. It can take 7-10 years todevelop, approve and construct an offshore wind farm, and supply chain investments such as expanding ports,building new manufacturing facilities, and establishing gridconnections, often need to be made even earlier.
This project – building confidencein the future of offshore wind costsThis project seeks to resolve this dilemma by producing anauthoritative and credible analysis of the future developmentof the costs of offshore wind energy consistent with a large-scale, viable, long-term market. Credibility has beenunderpinned by:
• explicit industry and Government participation in and verification of the cost analysis and the resulting conclusions
• identification of the key developments, dependencies andactions required to realise cost reductions.
This study has explored the costs of offshore wind projectsreaching Final Investment Decision (FID) in the period to 2020.As the period from FID to full operations is around 3-4 years,we cover the costs of offshore wind power entering thewholesale electricity market through to 2023-2024. The costsof an offshore wind project entering operations in 2020 arebest represented by projects whose FID is in 2017.
We have covered in detail how technology, supply market, and finance can reduce the costs of energy delivered to theoffshore substation connection point. Different ways ofdeveloping and charging for the offshore transmission networkare being jointly assessed by Government and industry. The outcome of this work may have a considerable impact onthe future costs of transmission of offshore wind power, so detailed analysis is premature. Consequently, we engaged agroup of experts, under the aegis of RenewableUK, to providea high-level assessment of the potential for cost reduction in transmission.
Our analysis has predominantly focused on achievable costreductions from technologies, methods and services that areknown, or can be reliably projected, for the period to 2020.There is also potential for game-changing technology (often referred to as ‘disruptive’ technology) to begin to shapefurther cost reductions towards the end of the periodand outto 2030. The study has only considered disruptive changewhere the weight of industry opinion judges it appropriate.
The remainder of this report sets out the approach andmethodology we used to assess the potential for costreduction (Chapter 2) and quantifies the major gains thatcould come from new and improved technology, a moreefficient and effective supply chain and changes in thefinancing of offshore wind farms (Chapter 3). These are thendrawn together into four self-consistent cost reductionpathways (Chapter 4). The key requirements, or prerequisites,to achieve those cost reductions, are outlined in Chapter 5, in Chapter 6 we review the implications on health and safety, and our conclusions are presented in Chapter 7.
2 17 Source: UKERC, ‘Great Expecta�ons – The cost of offshore wind in UK waters’, 2010 and GL Garrard Hassan for the Ministry of Climate and Energy, ‘Background report 2: Analysis of compe��vecondi�ons within the offshore wind sector’, 2011
18 Source: Garrard Hassan for the Department of Trade and Industry and the Carbon Trust, ‘OFFSHORE WIND – Economies of scale, engineering resource and load factors’, 200319 Source: DECC, ‘UK Renewable Energy Roadmap’, 2011
Offshore wind cost reduction pathways study
A distinctive approachThis study has built upon a large body of work on the currentand potential future costs of offshore wind (see Appendix A).In order to create a credible analysis of the futuredevelopment of the costs of offshore wind energy, we haveused an approach that has four distinctive features:
• involves a high level of engagement with both the industrywind industry and the finance community
• is highly transparent
• focuses on the key decisions made by industry to drivedown costs
• shows multiple, alternative, coherent pathways to costreduction which examine all the key cost drivers and allowlike-for-like comparison with actual costs in the future.
Engagement
The whole project has been underpinned by a high level ofengagement with industry and the finance community. Overall 119 companies and organisations participated in theproject including:
• 10 of the wind farms developers active with UK offshorewind projects
• 6 existing offshore wind turbine suppliers and many ofthose considering entering the market
• 9 of the major foundations manufacturers and many of theleading developers of new foundation concepts
• 8 the key installers currently actives in UK waters
• 8 the main suppliers of cabling and electrical equipment
• 9 of the suppliers of key sub-components
• 6 banks involved in or considering the financing of offshorewind projects including both commercial banks andmultilateral agencies and government backed institutions
• 4 insurance brokers, rating agencies, export creditagencies, etc
• 4 of the major port companies
• 2 of the leading transmission companies
• 25 key industry consultants and observers.
Participation initially involved detailed one-to-one discussions(often over a number of meetings) to identify and evaluatecost reduction opportunities and to solicit underlyingevidence. In many cases this resulted in the disclosure ofconfidential internal company data. Insights from this datahave been drawn into the conclusions in this report withoutbreaching confidentiality. Companies were further involved in
a series of workshops to review and then validate theidentified cost reductions, ensure consistency and avoid duplication.
Transparency
In addition to publishing the results of this study, we aremaking public the underpinning basis and data for theassessment of cost reduction so that it is available to allstakeholders and is open to scrutiny. We believe that this willencourage greater openness within the industry in the futureand will facilitate a healthy process of challenge.
The specifically commissioned reports on the opportunities forcost reduction from technology, the supply chain and finance,which provide the majority of the data for this report, are nowavailable on The Crown Estate website, together with anassessment of the impact on health and safety.
The quantitative evaluation of cost reduction was developedthrough a series of interlinked Excel-based models. All the keydata inputs and model outputs upon which this report is basedhave been made publically available - both within this reportincluding its appendices, and within the individual workstream reports.
Key decisions
Our analysis has examined the real world decisions whichneed to be taken to drive down costs, and makes explicit whatneeds to be in place to allow those decisions to be taken. The key decision points are:
• The Final Investment Decision (FID) taken by an offshorewind farm developer (which occurs around 3-4 years priorto the wind farm becoming operational).
• The decision by a supplier to introduce a new product,such as a new turbine or foundation system.
• The decision by a supplier to invest in new facilities such as quays, manufacturing facilities or installation vessels,which often have a life well beyond 2020.
• The decision by investors and insurance companies toallocate capital to the offshore wind sector.
Each of these decisions is taken in the context of a widerprocess. For example a developer will progress an offshorewind project through a series of stage gates for around 4-6years prior to FID, followed by around 3-4 years of pre-construction and construction work before the wind farmis fully operational. Similarly, the introduction of, say, a newwind turbine, will progress through a series of steps of R&D,testing and demonstration prior to full commercial launch.
3
How we conducted the study 2
Pathways
The future is highly uncertain. This study, therefore, hasexamined a series of different pathways along which the costsof offshore wind power could evolve bearing in mind the keyuncertainties or variables within the industry, namely:
• the rate of offshore wind capacity build
• the pace of technology change
• the maturity of the supply chains serving offshore winddevelopers
• the depth of financial markets investing in offshore wind farms.
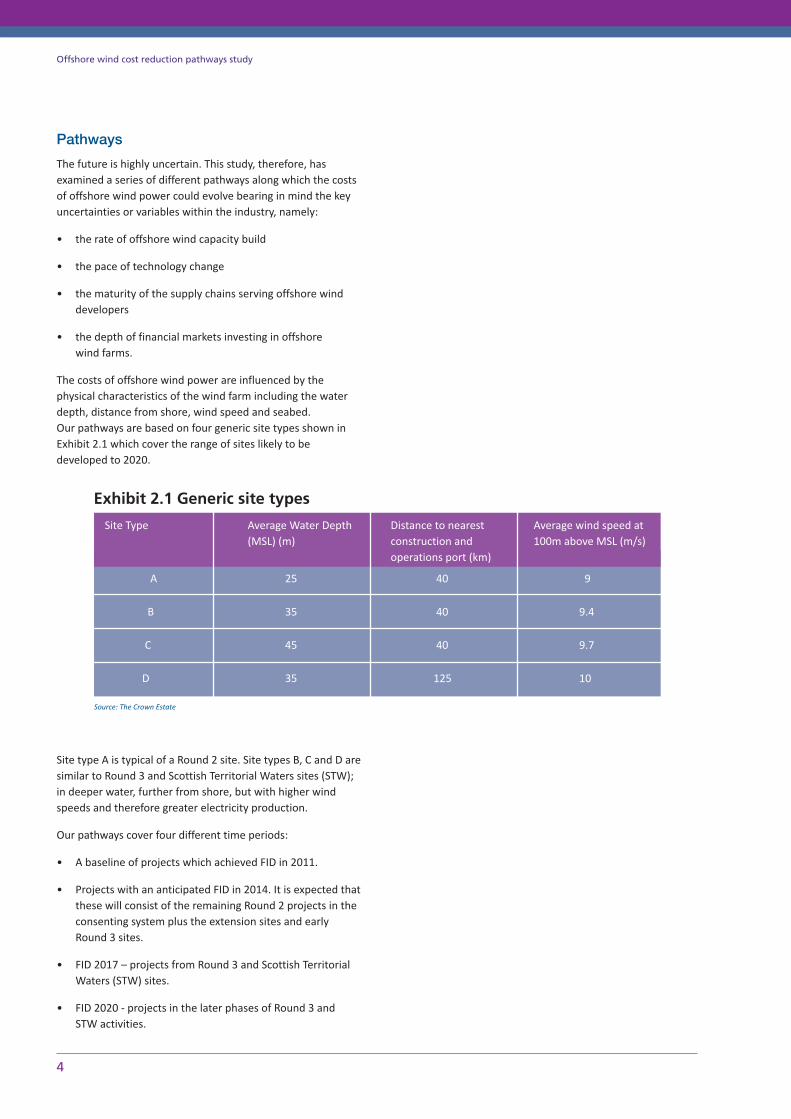
The costs of offshore wind power are influenced by thephysical characteristics of the wind farm including the waterdepth, distance from shore, wind speed and seabed. Our pathways are based on four generic site types shown in Exhibit 2.1 which cover the range of sites likely to bedeveloped to 2020.
Site type A is typical of a Round 2 site. Site types B, C and D aresimilar to Round 3 and Scottish Territorial Waters sites (STW);in deeper water, further from shore, but with higher windspeeds and therefore greater electricity production.
Our pathways cover four different time periods:
• A baseline of projects which achieved FID in 2011.
• Projects with an anticipated FID in 2014. It is expected thatthese will consist of the remaining Round 2 projects in theconsenting system plus the extension sites and earlyRound 3 sites.
• FID 2017 – projects from Round 3 and Scottish TerritorialWaters (STW) sites.
• FID 2020 - projects in the later phases of Round 3 and STW activities.
4
Offshore wind cost reduction pathways study
Exhibit 2.1 Generic site types
Source: The Crown Estate
A
B
C
D
25
35
45
35
40
40
40
125
9
9.4
9.7
10
Site Type Average Water Depth(MSL) (m)
Distance to nearestconstruction andoperations port (km)
Average wind speed at100m above MSL (m/s)
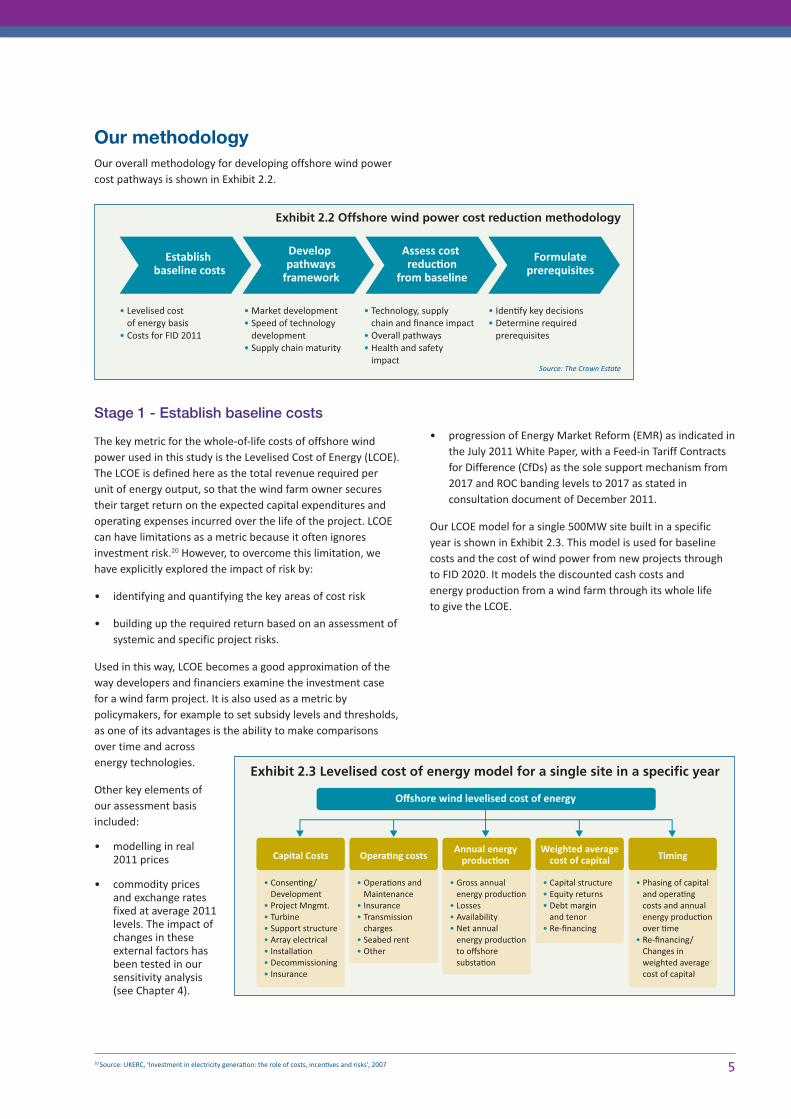
Our methodologyOur overall methodology for developing offshore wind powercost pathways is shown in Exhibit 2.2.
Stage 1 - Establish baseline costs
The key metric for the whole-of-life costs of offshore windpower used in this study is the Levelised Cost of Energy (LCOE).The LCOE is defined here as the total revenue required perunit of energy output, so that the wind farm owner securestheir target return on the expected capital expenditures andoperating expenses incurred over the life of the project. LCOEcan have limitations as a metric because it often ignoresinvestment risk.20 However, to overcome this limitation, wehave explicitly explored the impact of risk by:
• identifying and quantifying the key areas of cost risk
• building up the required return based on an assessment ofsystemic and specific project risks.
Used in this way, LCOE becomes a good approximation of theway developers and financiers examine the investment casefor a wind farm project. It is also used as a metric bypolicymakers, for example to set subsidy levels and thresholds,as one of its advantages is the ability to make comparisonsover time and acrossenergy technologies.
Other key elements ofour assessment basisincluded:
• modelling in real2011 prices
• commodity pricesand exchange ratesfixed at average 2011levels. The impact ofchanges in theseexternal factors hasbeen tested in oursensitivity analysis (see Chapter 4).
• progression of Energy Market Reform (EMR) as indicated inthe July 2011 White Paper, with a Feed-in Tariff Contractsfor Difference (CfDs) as the sole support mechanism from2017 and ROC banding levels to 2017 as stated inconsultation document of December 2011.
Our LCOE model for a single 500MW site built in a specific year is shown in Exhibit 2.3. This model is used for baselinecosts and the cost of wind power from new projects throughto FID 2020. It models the discounted cash costs and energy production from a wind farm through its whole life to give the LCOE.
520 Source: UKERC, ‘Investment in electricity genera�on: the role of costs, incen�ves and risks’, 2007
Establish baseline costs
Develop pathways
framework
Assess cost reduc�on
from baseline
Formulateprerequisites
• Market development• Speed of technology development• Supply chain maturity
• Levelised cost of energy basis
• Costs for FID 2011
• Technology, supply chain and finance impact• Overall pathways• Health and safety impact
• Iden�fy key decisions• Determine required prerequisites
Exhibit 2.2 Offshore wind power cost reduction methodology
Source: The Crown Estate
• Opera�ons and Maintenance• Insurance• Transmission charges• Seabed rent• Other
• Gross annual energy produc�on• Losses• Availability• Net annual energy produc�on to offshore substa�on
• Capital structure• Equity returns• Debt margin and tenor• Re-financing
• Phasing of capital and opera�ng costs and annual energy produc�on over �me• Re-financing/ Changes in weighted average cost of capital
• Consen�ng/ Development• Project Mngmt.• Turbine• Support structure• Array electrical• Installa�on• Decommissioning• Insurance
Offshore wind levelised cost of energy
Capital Costs Opera�ng costsAnnual energy
produc�onWeighted average
cost of capital Timing
Exhibit 2.3 Levelised cost of energy model for a single site in a specific year

In order to establish the costs of offshore wind power asperceived at FID 2011 we engaged the industry to understandfor our generic site types A and B (which are the only oneswith actual evidence to date) and for a 4MW-Class Turbine (an average of the 3-5MW turbines currently available in themarket) the key cost inputs as seen by a developer:
• Contract prices for the main packages procured bydevelopers:
‒ turbine supply (including warranty)
‒ foundation supply,
‒ array cables supply
‒ installation (either one package or split between foundation, turbine and cabling)
‒ insurance
‒ port facilities
• Developers’ contingency.
• The expected costs of operations and maintenance within and outside the usual five year warranty period for the turbine.
• The expected Annual Energy Production (AEP) afteraccounting for availability and losses.
We also engaged with developers and the financial communityto understand the required cost of capital in FID2011 using a:
• Bottom-up assessment of the components which make upthe cost of capital, drawing on market data for the cost ofequity and cost of debt and quantifying the premiumsinvestors require for project specific risks, extreme downside risks and the illiquid and imperfectnature of the market for offshore wind funding. The lattertwo were combined into a developer return uplift. The key areas of specific project risk were identified as:
‒ installation costs
‒ operations and maintenance costs
• Top-down assessment: Benchmarking returns fromcompleted offshore wind projects and the returns current investors have suggested to us they require toinvest in offshore wind projects. These represent ‘all-in‘return requirements and incorporate the underlying costof capital and additional risk premia.
A full listing of the key assumptions underlying the base lineand our assessment of future LCOE can be found in Appendix B
6
Offshore wind cost reduction pathways study
LCOE model definitions• LCOE is defined as the sum of discounted lifetime generation costs (£) divided by the sum of discounted lifetime electricity
output (MWh). Generation costs include all capital, operating, and decommissioning costs incurred over the lifetime of the project.
• LCOE is calculated for a generic project at FID at a given year, on a post -tax basis, and is expressed in real £2011 prices (forall FID years).
• Capital expenditures:‒ The cost of consenting and development is considered as a bullet ‘success payment’ at FID. This factors in the actual
expenditures incurred in this phase of the wind farm life, plus a developer premium‒ Project management covers costs from FID to works completion ‒ Turbine costs cover rotor and nacelle only ‒ Support structure covers both foundation and tower. This reflects the similarity of towers and foundations in technology
terms and the potential trend to integrate towers and foundations to a greater or lesser extent in the future. ‒ Array electrical covers intra-array cables up to the offshore sub-station.
• Operations and maintenance costs cover both planned and unplanned service.
• Transmission charges cover costs associated with transmission assets and system balancing charges incurred by thegenerator; these comprise transmission network use of system (TNUoS) charges (both local to the Offshore TransmissionOwner (OFTO) assets and the wider transmission system and Balancing Services Use of System (BSUoS) charges (bothcalculated as an annual charge). It excludes wider system balancing costs.
• Seabed Rent is that charged by The Crown Estate.
• Net annual energy production is the net metered generation at the offshore sub-station after wake and other losses andaccounting for wind farm availability.
• The Weighted Average Cost of Capital is calculated over the lifetime of the project, distinguishing between thedevelopment, construction and operational phases, each with an appropriate capital structure, equity and debt returns.The model allows the timing of key aspects to be altered, such as the point or points at which re-financing(s) occur.
• The LCOE does not necessarily correspond to the ‘strike price’ or level of support that would be required to support theproject – as it is as expression of cost rather than revenue.
• Taxation is calculated within the model (based on the prevailing rate of taxation and the cashflows within the model) rather than being set as an input to the model in per MW terms.

Stage 2 - Develop pathways framework
There are numerous ways in which the offshore wind industrycould develop in the future, each of which would lead todifferent costs of offshore wind power. This study focuses on anumber of discrete cost pathways, built on explicit views ofhow the industry could evolve, which have been broughttogether as ‘stories’ or narratives for the evolution of theindustry. The key aspects which vary across these ‘stories’ are:
• The size of the offshore wind market in the UK and in therest of Europe through to 2020 and beyond.
• The pace of technology development and hence the mix ofproducts (particularly turbine sizes) in the marketplace.
• The maturity of offshore wind finance and supply chain.
Four combinations of market size, technology development,and supply chain development were selected with industryinput as representing the reasonable boundaries within which the industry is likely to evolve and are summarised inExhibit 2.4.
These four ‘stories‘, were combined with the four generic sitetypes and four time periods to formulate our cost pathways(see Exhibit 2.5).
Stage 3 - Assess cost reduction from baseline
With a cost baseline established and a pathways frameworkset, we assessed the degree to which costs could be reduced examining:
• technology innovations through changes in product orcomponent design and manufacturing process.
• improvements in the supply chain for an offshore windfarm development.
• changes in the financing of offshore wind farms.
We also considered the impact of the key changeswhich could increase costs, notably:
• wind farms moving to deeper water and further from shore.
• potential for supply bottlenecks and limitedcompetition.
• potential constraints in the supply of capital,particularly in the risky construction phase and inindustry stories where market growth is rapid.
7
3. ‘Supply Chain Efficiency’• 36GW in Europe by 2020 (17GW in UK)• Incremental technology evolu�on (e.g. steady progress to 5-7MW turbines)• Greater compe��on, investment, project collabora�on and be�er risk management• Deeper financial markets, lower risk/lower cost of capital
High innova�on
High innova�on
Incrementalimprovement
Incrementalimprovement
Finance &Supply Chain
Technology
4. ‘Rapid Growth’• 43GW in Europe by 2020 (23GW in UK)• High levels of technology evolu�on across all wind farm elements (e.g. turbines progress rapidly to 5-7MW+)• Greater compe��on, investment, project collabora�on and be�er risk management• Challenging volume of finance required
1. ‘Slow Progression’ • 31GW in Europe by 2020 (12GW in UK)• Incremental technology evolu�on, progress limited by market size• Limited compe��on/economies of scale• Modest developments in financing solu�ons, reduced in risk/cost of capital
2. ‘Technology Accelera�on’• 36GW in Europe by 2020 (17GW in UK)• High levels of technology evolu�on across all wind farm elements (e.g. turbines progress rapidly to 5-7MW+)• Fragmented supply chain with some improvement in collabora�on• Limited improvement in cost of capital due to ongoing changes in technology
Exhibit 2.4 Four industry stories
ProductX in 2011
ProductX in 2014
ProductY in 2014
ProductX in 2017
ProductY in 2017
ProductZ in 2017
ProductX in 2020
ProductY in 2020
ProductZ in 2020
Industry ‘Story’ (x4)
Pathway (x16)
}Site Type(A,B,C,D)
‘Pathway’ Time (based on year of FID)
Industry mix of ‘Products’
Exhibit 2.5 Cost pathways
Note: Product mix refers to the different classes of turbines defined in this study togetherwith their relevant balance of plant. Refer Appendix B
TechnologyTogether with industry we identified around 60 separateinnovations that are likely to reduce LCOE by FID 2020. The impact of some of these innovations is to increase capitalcosts (per MW), however they are expected to reduce LCOE byimproving reliability, reducing O&M costs and/or increasingelectricity production.
In order to understand the impact of technology innovationson LCOE we:
• Assessed the full potential for each individual innovationto reduce LCOE in the most favourable circumstancesconsidering its overall impact on capital and operatingcosts and on annual energy production.
• Moderated this impact to take account of eachinnovation’s:
‒ Relevance – not all innovations are suited, say, in deeper water or further from shore.
‒ Readiness – some technologies will be ready at full potential by 2014, others will only reach a proportion of their full potential by 2020.
‒ Market take-up – many innovations are compatible but some are not (for example there may be improvements in monopile and jacket foundations, which cannot be applied to the same development but will take a share of the overall market). Innovations are therefore combined into groups and assigned a market share for a given site / turbine / year combination to reflect industry views of the likely take-up.
• Aggregated all impacts (on capital and operating costs andAEP) for a given site / turbine / FID year combination andapplied this to the baseline costs to derive a set of LCOEreductions for FID 2014, FID 2017 and FID 2020 comparedto the FID 2011 baseline.
• Assessed the overall impact of technology on the key riskfactors, and fed this into the finance model.
• Assessed the extent of technology progress across the fourstories: the starting point for this analysis was to considerthe progress possible in the technology-focused stories (ie ‘Technology Acceleration’ and ‘Rapid Growth’). In order to provide a comparable set of numbers for theother ‘stories’ we have imposed a delay in the rate oftechnology progress – to reflect the fact that these storiesare focused more on improving the supply chain thanmaking rapid progress in technology.
• All savings relate to the ‘net’ saving available to the developer once relevant costs to the supply chainare taken into account. For example, many of the costreductions involve investment in capital by the supplychain. The reported savings reflect the fact that this supplychain investment will need to be rewarded.
This provides a cost pathway assuming no change in supplymarket conditions from 2011 and no changes in the financingof wind farms.
Supply chainWe identified and tested with industry a series of changes inthe way in which offshore wind farms are supplied that willimpact LCOE. These supply chain levers have the potential toreduce capital and operating costs and / or risks, therebyreducing LCOE and cover:
• Asset growth and economies of scale: As capacityincreases, cost savings can be achieved through, forexample, productivity improvements (eg having morevessels reduces the impact of installation delays as itaffords increased flexibility) and logistics (eg if newcapacity and its associated supply chain are located closerto the market it is possible to minimise transport costs).With increased volumes, economies of scale can beachieved: in procurement, through ‘learning by doing’, by standardising processes and protocols reducing theneed for more expensive bespoke solutions and byincreasing the productivity of exiting assets (includingmanufacturing facilities) by increasing volume throughoutand run lengths.
• Changes in contract forms/terms: Moving away fromlump sum contracts, tightening terms and conditions andthe introduction of more appropriate incentivemechanisms may lead to cost reductions.
• Means of managing and pricing uncontrollable risk:Uncontrollable risks include unpredictable weather (sea state and wind), ground conditions at the offshoreconstruction site and consequential losses not covered bycontract terms. A better understanding and apportioningof uncontrollable risk can accrue savings by reducing their impact.
• Increased competition from UK, other European and lowcost country players: Greater competition in each of themain supply markets (eg turbines, foundations, installationetc) will both squeeze margins and increase the drive forlower costs. In some supply markets the entry of playersfrom China, South Korea, India etc may also have asignificant impact as their cost bases are significantly lower than their European counterparts due to lower costsof labour and, in some instances, access to lower cost rawmaterials or competitive finance. We considered theimpact of competition from low cost countries on both the supply of complete wind farm products and key components.
• Vertical collaboration across different tiers in the supply chain: Currently contracts are mainly awarded on aproject by project basis with most developers typicallyletting 5-8 major contracts. This can lead to a silo approachwithout adequate recognition and management of theinterdependencies between contracts. This often leavesthe developer bearing much of the ‘interface risk’.
8
Offshore wind cost reduction pathways study
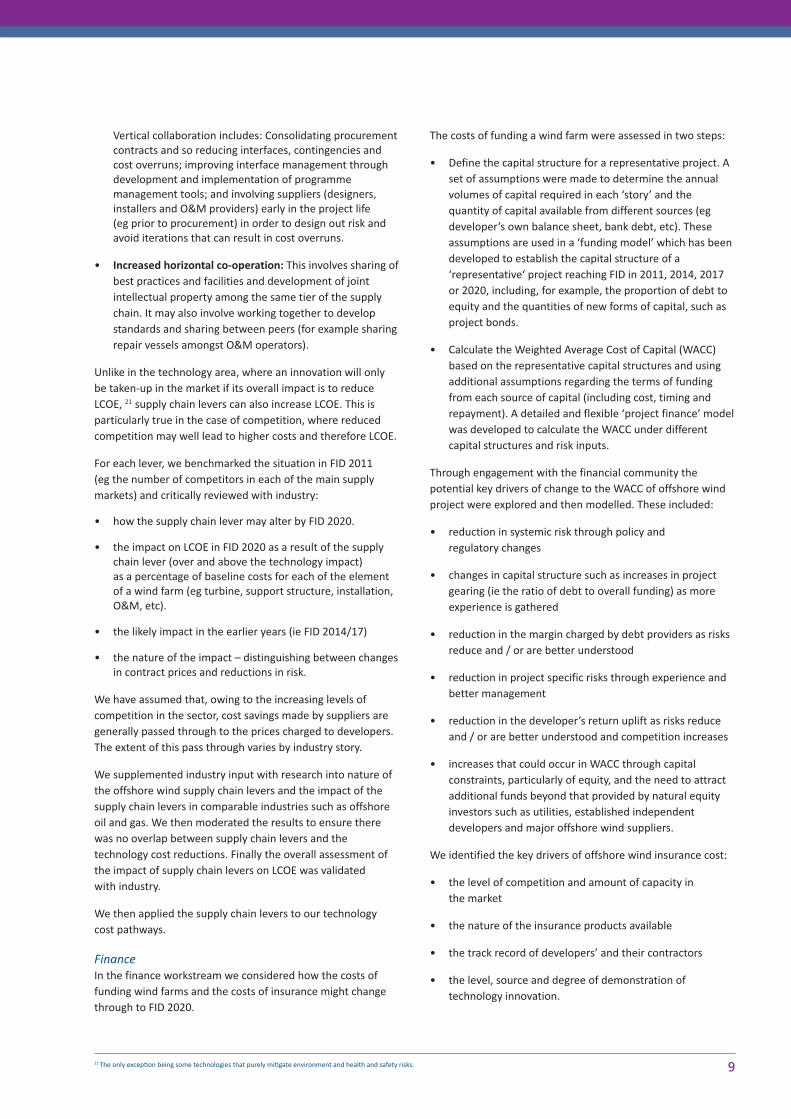
Vertical collaboration includes: Consolidating procurementcontracts and so reducing interfaces, contingencies andcost overruns; improving interface management throughdevelopment and implementation of programmemanagement tools; and involving suppliers (designers,installers and O&M providers) early in the project life (eg prior to procurement) in order to design out risk andavoid iterations that can result in cost overruns.
• Increased horizontal co-operation: This involves sharing ofbest practices and facilities and development of jointintellectual property among the same tier of the supplychain. It may also involve working together to developstandards and sharing between peers (for example sharingrepair vessels amongst O&M operators).
Unlike in the technology area, where an innovation will onlybe taken-up in the market if its overall impact is to reduceLCOE, 21 supply chain levers can also increase LCOE. This isparticularly true in the case of competition, where reducedcompetition may well lead to higher costs and therefore LCOE.
For each lever, we benchmarked the situation in FID 2011 (eg the number of competitors in each of the main supplymarkets) and critically reviewed with industry:
• how the supply chain lever may alter by FID 2020.
• the impact on LCOE in FID 2020 as a result of the supplychain lever (over and above the technology impact) as a percentage of baseline costs for each of the elementof a wind farm (eg turbine, support structure, installation,O&M, etc).
• the likely impact in the earlier years (ie FID 2014/17)
• the nature of the impact – distinguishing between changesin contract prices and reductions in risk.
We have assumed that, owing to the increasing levels ofcompetition in the sector, cost savings made by suppliers aregenerally passed through to the prices charged to developers.The extent of this pass through varies by industry story.
We supplemented industry input with research into nature ofthe offshore wind supply chain levers and the impact of thesupply chain levers in comparable industries such as offshoreoil and gas. We then moderated the results to ensure therewas no overlap between supply chain levers and thetechnology cost reductions. Finally the overall assessment ofthe impact of supply chain levers on LCOE was validated with industry.
We then applied the supply chain levers to our technology cost pathways.
FinanceIn the finance workstream we considered how the costs offunding wind farms and the costs of insurance might changethrough to FID 2020.
The costs of funding a wind farm were assessed in two steps:
• Define the capital structure for a representative project. Aset of assumptions were made to determine the annualvolumes of capital required in each ‘story’ and thequantity of capital available from different sources (egdeveloper’s own balance sheet, bank debt, etc). Theseassumptions are used in a ‘funding model’ which has beendeveloped to establish the capital structure of a‘representative‘ project reaching FID in 2011, 2014, 2017or 2020, including, for example, the proportion of debt toequity and the quantities of new forms of capital, such asproject bonds.
• Calculate the Weighted Average Cost of Capital (WACC)based on the representative capital structures and usingadditional assumptions regarding the terms of fundingfrom each source of capital (including cost, timing andrepayment). A detailed and flexible ‘project finance’ modelwas developed to calculate the WACC under differentcapital structures and risk inputs.
Through engagement with the financial community thepotential key drivers of change to the WACC of offshore windproject were explored and then modelled. These included:
• reduction in systemic risk through policy and regulatory changes
• changes in capital structure such as increases in projectgearing (ie the ratio of debt to overall funding) as moreexperience is gathered
• reduction in the margin charged by debt providers as risksreduce and / or are better understood
• reduction in project specific risks through experience andbetter management
• reduction in the developer’s return uplift as risks reduceand / or are better understood and competition increases
• increases that could occur in WACC through capitalconstraints, particularly of equity, and the need to attractadditional funds beyond that provided by natural equityinvestors such as utilities, established independentdevelopers and major offshore wind suppliers.
We identified the key drivers of offshore wind insurance cost:
• the level of competition and amount of capacity in the market
• the nature of the insurance products available
• the track record of developers’ and their contractors
• the level, source and degree of demonstration oftechnology innovation.
921 The only excep�on being some technologies that purely mi�gate environment and health and safety risks.
Through engagement with the finance community, we assessed the potential for insurance costs to reduce to FID 2020 for each industry story.
Overall pathwaysFor each of our ‘stories’ and generic site types, we combinedthe technology, supply chain and finance cost reductions withour assessment of baseline costs to define a set of overall costreduction pathways . These pathways are internally consistentand show how LCOE might evolve under each set ofassumptions. We have overlaid this with an assumed mix ofsites that might be built between now and FID 2020 (whichvaries by story), to estimate the overall envelope of LCOE at anindustry level through to FID 2020 (See Appendix B). The costpathways shown in Chapter 4 represent the average LCOEacross the assumed mix of sites and technologies in each year.
Where appropriate we also identified qualitatively thepotential for LCOE reduction beyond 2020 to give an indicationas to the possible trend in the next decade.
Where assumptions have been made in the models, for example on variables such as commodity prices, exchange rates, or operational lifetime, these have beentested through a sensitivity analysis to assess their impact onthe results (see Chapter 4).
Health and safetyThe requirement of the study is to reduce cost, but not to thedetriment of safety. The impact of innovations andimprovement in offshore wind technology and supply chain onhealth and safety was raised during our engagement withindustry. The response from industry were collated andreviewed by safety experts to identify whether the changeswould have a positive, neutral or negative impact on healthand safety. This was done using a series of risk reductionindicators such as:
• stepping up through hierarchical design mitigationstrategies (such as illustrated in the CDM Designers Guidereferenced below which contains a simple hierarchical listand information on DRM in practice)
• intrinsic safety introduced
• reduction in exposure hours for a particular element of work
• reducing the frequency of offshore trips and / or offshore transfers
• reducing the frequency of any exposure to potentiallyhazardous activity
• reducing quantity of interfaces requiring positivemanagement
• improving methodology to reduce number of operations.
Where negative impacts were identified, potential mitigationmeasures were considered and their implications assessed.
Stage 4 - Formulate prerequisites
A key aspect of this study is to explicitly state the conditions orprerequisites that need to be in place to allow cost reductionsto occur. To make this tangible, we have related theprerequisites to the specific decisions that need to be made todrive down the LCOE of offshore wind.
We consider the following key decisions:
• a series of decision gates during the development of awind farm project, culminating in FID
• the decision by a supply chain company to develop aproduct that could be purchased by a wind farmdeveloper, most notably a new wind turbine or foundation
• the decision by a supply chain company to invest in newassets primarily serving the offshore wind market (eg new installation vessels, automated jacket weldingfacility, new quays, etc)
• the decision by a provider of capital to fund a wind farm project.
We then:
• briefly characterised the key decision in term of scale andlead time of investment and either typical asset life or pay-back time
• engaged with the industry and the financial community tounderstand and validate the key prerequisites.
10
Offshore wind cost reduction pathways study

Study organisationThe study was based on five interrelated work streams:
• The technology work stream, which was conducted by BVG Associates, determined the baseline costs andassessed the potential for technology costs reduction.
• The supply chain work stream, which was conducted by E C Harris and assessed the potential for supply chain cost reductions.
• The finance work stream, which was conducted by PwC,assessed the availability and cost of capital, and thepotential for reductions in insurance costs.
• RenewableUK and The Crown Estate facilitated an industryexpert group, in order to identify and describe possiblecost reduction opportunities related to transmission.
• PMSS reviewed the health and safety implications of thecost reduction pathways.
The work and output of the five work streams were managedand integrated by a project team at The Crown Estate. The project team drew on the support of the Project AdvisoryPanel who provided guidance on the study process and criticalreview of the results (see Appendix C for its Terms ofReference). The members of the Panel were:
• Duarte Figueira DECC
• Allan Taylor DECC
• Mark Thomas InfrastructureUK
• Thomas Arensbach Gamesa (until March 2012)
• Ron Cookson Technip
• Gordon Edge RenewableUK
• Michael Rolls Siemens
• Richard Sandford RWE
• Christian Skakkebaek DONG Energy
• Ian Temperton Climate Change Capital
11

Offshore wind cost reduction pathways study

Current costs seem to have stabilisedThe escalation in offshore wind cost over the last decade has been well documented (see Section 1). However, experience fromrecent projects gives cause to believe that the cost of offshore wind energy may be stabilising:
• despite increasing water depth, capital costs seem to have levelled off
• more recent wind farms are in sites with higher wind speeds and therefore greater energy production
Despite increasing water depth, capital costs seem to have levelled off
Over the past decade, wind farms have been installed in increasing water depth (see Exhibit 3.1). Commercial wind farms from 2000to 2005 were in depths of 5-15m. From 2006, water depth increased sharply and wind farms installed in 2012 will be in waters of atleast 20m and up to 35m. Increasing water depth increases the costs of foundations and of installation on a like for like basis.
Despite this increase in water depth, recently announced wind farm capital cost seem to levelled off between £3m/MW and£3.5m/MW (including transmission capital costs) for sites which are similar to our reference sites A and B (see Exhibit 3.2). Thisreflects a number of factors including a better understanding of the key risks in offshore wind construction, oversupply in thegeneral wind turbine market and larger projects leading to greater economies of scale.
13
Cost reduction opportunities 3
2000 2002 2004 2006 2008 2010 20122001 2003 2005 2007 2009 2011
0
10
20
30
40
50
Year
Max
imum
wat
er d
epth
(m)
REST OF EUROPE
UNITED KINGDOM
Exhibit 3.1 European offshore wind farm water depth by year
Source: Technology work stream report
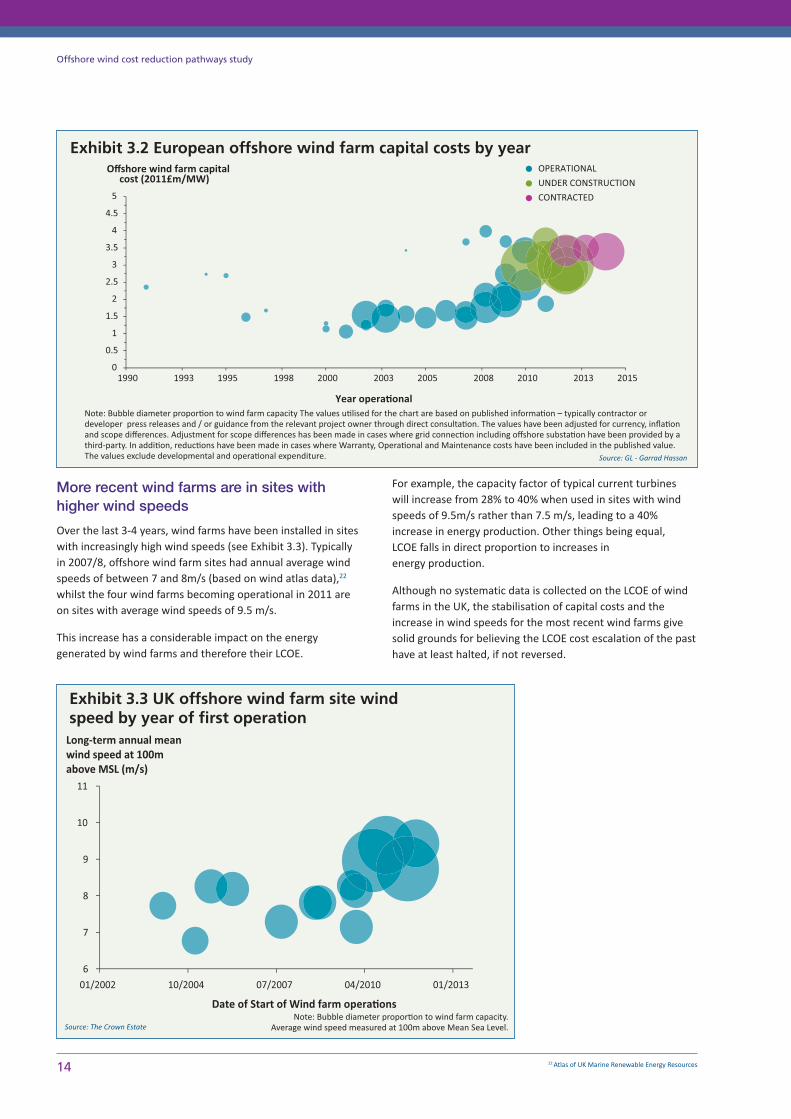
More recent wind farms are in sites withhigher wind speeds
Over the last 3-4 years, wind farms have been installed in siteswith increasingly high wind speeds (see Exhibit 3.3). Typicallyin 2007/8, offshore wind farm sites had annual average windspeeds of between 7 and 8m/s (based on wind atlas data),22
whilst the four wind farms becoming operational in 2011 areon sites with average wind speeds of 9.5 m/s.
This increase has a considerable impact on the energygenerated by wind farms and therefore their LCOE.
For example, the capacity factor of typical current turbines will increase from 28% to 40% when used in sites with windspeeds of 9.5m/s rather than 7.5 m/s, leading to a 40%increase in energy production. Other things being equal, LCOE falls in direct proportion to increases in energy production.
Although no systematic data is collected on the LCOE of windfarms in the UK, the stabilisation of capital costs and theincrease in wind speeds for the most recent wind farms givesolid grounds for believing the LCOE cost escalation of the pasthave at least halted, if not reversed.
14 22 Atlas of UK Marine Renewable Energy Resources
Offshore wind cost reduction pathways study
0
0.5
1
1.5
2
2.5
3
3.5
4
4.5
5
1990 1995 2000 2005 2010 2015
Offshore wind farm capital cost (2011£m/MW)
Year opera�onal
1993 1998 2003 2008 2013
OPERATIONAL
UNDER CONSTRUCTION
CONTRACTED
Exhibit 3.2 European offshore wind farm capital costs by year
Source: GL - Garrad Hassan
6
7
8
9
10
11
01/2002 10/2004 07/2007 04/2010 01/2013
Long-term annual mean wind speed at 100m above MSL (m/s)
Date of Start of Wind farm opera�ons
Exhibit 3.3 UK offshore wind farm site wind speed by year of first operation
Source: The Crown Estate
Note: Bubble diameter propor�on to wind farm capacity The values u�lised for the chart are based on published informa�on – typically contractor ordeveloper press releases and / or guidance from the relevant project owner through direct consulta�on. The values have been adjusted for currency, infla�onand scope differences. Adjustment for scope differences has been made in cases where grid connec�on including offshore substa�on have been provided by athird-party. In addi�on, reduc�ons have been made in cases where Warranty, Opera�onal and Maintenance costs have been included in the published value. The values exclude developmental and opera�onal expenditure.
Note: Bubble diameter propor�on to wind farm capacity. Average wind speed measured at 100m above Mean Sea Level.

Our baseline LCOE estimate isaround £140/MWhAgainst this background, we estimate baseline offshore windLCOE of £140/MWh.23 The key factors underlying this estimateare capital costs, turbine capacity factor and hence AnnualEnergy Production (AEP), the cost of capital, and operational costs.
We have estimated FID 2011 capital costs of £2.6m/MW and£2.9m/MW for sites A and B respectively (excludingtransmission costs which we consider in the modelling as anannual charge). This is in line with current costs when adjustedfor the capital costs of transmission, which represent about£0.5m/MW. Sites A and B are within the range of water depthand distance from shore seen in the most recently announced projects.
We have estimated that the capacity factor of an FID 2011project as 40% and 42% for sites A and B respectively. This issomewhat above the average capacity factor of 34%24 for thefive commercial UK wind farms for which there is a reasonablebody of data. At least three full years of data is needed foranalysis owing to the intra-year seasonality of wind speed andthe generally low availability of turbines in their first year ofoperation.25 Higher capacity factors are expected in FID 2011 because:
• of the higher wind speed of sites A and B (9 and 9.4m/s)compared with between 7.2 and 8.3 m/s for the fivecommercial UK wind farms for which there is a reasonablebody of data.
• our baseline LCOE estimates are based upon the use ofturbines with larger rotors for a given rated capacity, whichincreases the expected capacity factor.
Exhibit 3.4 illustrates both these impacts. The lines show theexpected relationship between annual average wind speedand capacity factor based on power curves and typicaloffshore wind speed distributions. The solid lines show thetwo most commonly used turbines in the UK (the Vestas V90and the Siemens SWT3.6-107) and the dotted lines show therecently introduced larger rotor Siemens SWT 3.6-120 and ourbaseline 4MW-Class Turbine. For any given wind speed thenewer, larger rotor turbines have a higher capacity factors. Thepoints are the actual capacity factors for the wind farms usingthe V90 turbine (Kentish Flats and Barrow) and the SWT 3.6-107 (Burbo Bank, Lynn and Inner Dowsing ) plotted against thewind farm average annual wind speed using wind atlas data.This shows that current wind farms are performing better thanmight be anticipated from wind atlas data. As we have usedwind atlas data to determine the wind speeds for sites A and B, this provides confidence that the baseline capacityfactors are realistic.
Operating costs of £164-167k/MW p.a. and a weightedaverage cost of capital of 10.0%(post-tax nominal), give a baselineLCOE of £140/MWh for Site A and£144/MWh for Site B. Capital expenditure accounts forjust over 60% of LCOE – themajority of which comprises thecost of the turbines, supportstructure and installation (see Exhibit 3.5). Operating costs, includingtransmission charges, are alsoimportant, together making upone third of the total. The supportstructure and installation cost ishigher for Site B reflecting thegreater water depth.
1523 For site type A. The corresponding figure for site type B is £144/MWh for projects at FID in 2011.24 From second full year of opera�on of each wind farm to December 2011. Covers wind farms using the V90 and SWT3.6-107 turbines rather than earlier models. Wind farms are: Ken�sh Flats, Barrow BurboBank, Lynn and Inner Dowsing.25 The first full year is not considered due to the ‘bathtub‘ effect. At least 2 further full years of opera�on is then needed.
Site A Site B
20
25
30
35
40
45
7 8 9 10
Net capacity factor (%)
Annual average wind speed at 100m (m/s)
Ken�sh Flats ('07-'11)
Barrow ('08-'11)
Burbo Bank ('09-'11)
Lynn ('10-'11)
Inner Dowsing ('10-'11)
Site A
Site B
V90
SWT 3.6-107
4MW-Class Turbine
SWT 3.6-120
Exhibit 3.4 Expected turbine and actual wind farm capacity factor versus annual average wind speed
-
20
40
60
80
100
120
140
160
Site A Site B
Levelised Cost of Energy (£/MWh)
Seabed Rent
Decommissioning
Transmission charge
Operating costs (exc.transmission)
Other capital (inc.contingency)
Installation
Array cables
Support structure
Turbine (exc. tower)
£140/MWh £144/MWh
Exhibit 3.5 2011 Levelised Cost of Energy breakdownby component, 4MW-Class Turbine £/MWh
Source: Finance work stream report
Note: Actual capacity factors for commercial UK wind farms using the V90 or the SWT3.6-107 turbine. Includes wind farms with more than 3 full years of opera�on, excludes first full year of opera�on (ie star�ng with 2nd full year of opera�on). Wind farm average actual net capacity factor is plo�ed against wind speed from the Atlas of UK Marine Renewable Energy Resources.

There are many, diverse ways inwhich offshore wind costs can bedriven down by technology andthe supply chainUp until now offshore wind farms have largely used productsadapted from application in other fields, for examplemarinised onshore wind turbines and foundations designedusing oil and gas industry standards for manned platforms.Similarly the supply chain that serves offshore wind farms isimmature and operates on a project-by-project basis. Moving to products specifically designed for offshore wind andindustrialising the supply chain provides a large number ofopportunities to reduce capital and operating costs andincrease power generation. Compared with a wind farmproject whose FID is in 2011, FID 2020 projects could reducethe LCOE of offshore wind power by 39% (see Exhibit 3.6).
The key opportunities for cost reduction are generated by:
• the introduction of turbines which are larger, have higherreliability and energy capture and lower operating costs.
• greater competition from within the UK, the rest of the EUand from low cost countries in key supply markets(turbines, support structures and installation).
• greater activity at the front end of the project includingearly involvement of suppliers, multi-variable optimisationof wind farm layout, more Front End Engineering andDesign (FEED) and more extensive site surveys.
• exploitation of economies of scale and productivityimprovements including greater standardisation, capturingand building on learning by doing and better procurement.
• optimisation of current installation methods.
• mass-produced support structures for use in water depthsgreater than 35 metres.
Other opportunities to reduce cost exist, both from othertechnology innovations (in particular operations andmaintenance), and from the other supply chain levers.However, these generate fewer cost savings or will only become a major cost reduction contributor post 2020.
Introduction of new turbines
Offshore wind turbines will radically change between now and 2020. Existing offshore wind turbines have mostly beenmarinised versions of the largest available onshore turbinesand therefore have been designed primarily to meet onshoremarket constraints. Offshore many of these constraints arereleased, eg:
• Visual impact and limits on the size of components thatcan be transported by road have restricted onshoreturbines to a maximum of 3-4MW. Offshore both of theseconstraints are loosened; taller structures are moreacceptable and transport limits are less stringent as largecomponents can be built then transported from docksidelocations.
• Onshore noise concerns have limited blade tip speed to70-80m/s, whereas offshore turbines may have tip speedsof up to 100m/s.
The cost structures of onshore and offshore wind turbines arequite different, and therefore so is the optimum trade-offbetween size, cost and capacity factor. Onshore wind capitalcosts are dominated by turbine costs (up to 75% of the total),26
whereas for offshore wind farms the turbine (including towerfor comparative purposes) represents between 40-50% of totalcapital costs.
The key expected changes between FID 2011 and FID 2020 aretherefore driven by the relaxation of constraints and differenteconomics offshore wind turbines as well as the developmentof new technologies:
• an increase in rated power of the workhorse turbines4MW-Class to 6MW-Class (ie from 3-5MW to 5-7MWmachines), together with the introduction of 8MW-Class Turbines.
• an increase in the ratio of rotor size to rated power.
• improvements in blade design and manufacture.
• changes in the drive train with improved mechanicallygeared high speed drive systems and the introduction ofnew technologies (including mid speed geared, direct andhydraulic drives).
The greatest cost reductions result from the increases inturbine size and changes in blades and drive trains (see Exhibit 3.7).
16 26 Source: Intelligent Energy-Europe, ‘Wind Energy – The Facts’, 2008
Offshore wind cost reduction pathways study
3%
4%
6%
3%
5%
17%
9%
39%Total
Other
Support structures
Installa�on
Scale / Produc�vity
Front end ac�vity
Compe��on
New Turbines
Supply chain Technology
Exhibit 3.6 Offshore wind power cost reductionopportunities from technology and supply chain% reduction in levelised cost of energy FID 2011 to FID 2020
Note: FID 2011 refers to a 500MW project whose Final Investment Decision is in 2011. Similarly for FID 2020. The period from FID to comple�nga wind farm is around three to four years.The cost reduc�on opportuni�es above are based on a comparison of atypical FID 2011 wind farm (3-5MW class turbine) vs. a typical FID 2020 windfarm (5-7MW class turbine).For this comparison the cost of capital is held constant over �me, and allcosts are in 2011 money.Percentages are mul�plica�ve not addi�ve so the total is the product ratherthan the sum of the cost reduc�on elements.
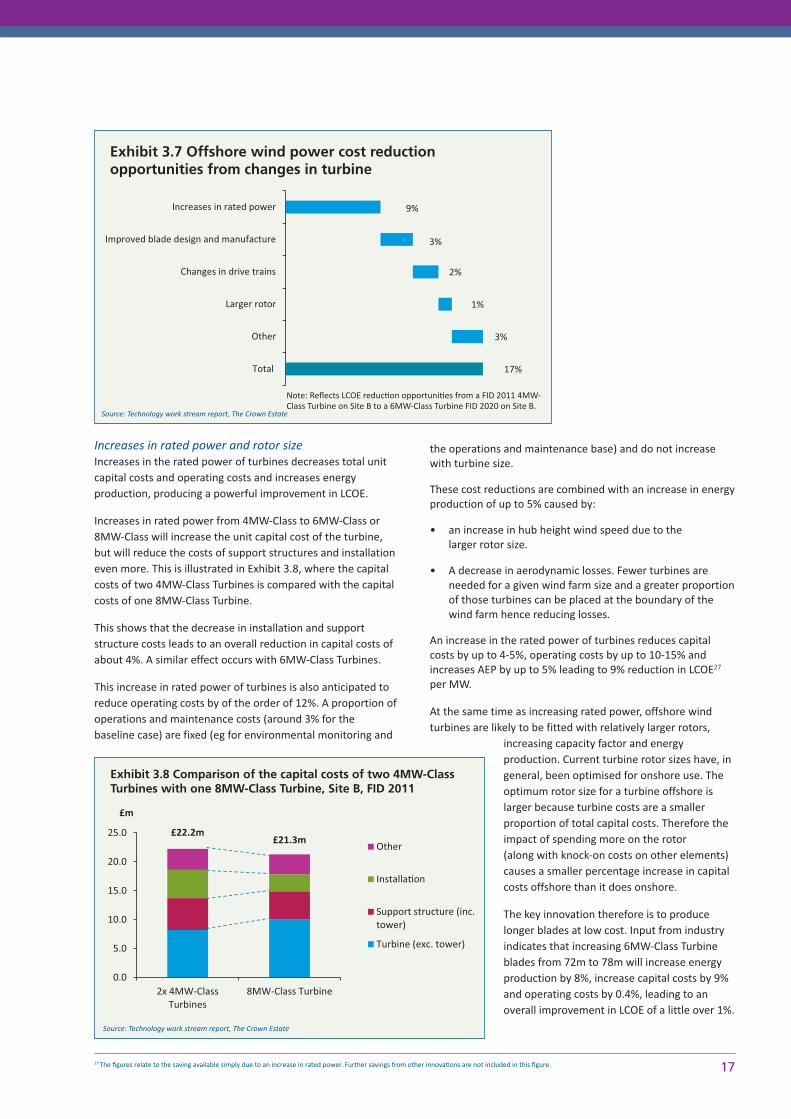
Increases in rated power and rotor sizeIncreases in the rated power of turbines decreases total unitcapital costs and operating costs and increases energyproduction, producing a powerful improvement in LCOE.
Increases in rated power from 4MW-Class to 6MW-Class or8MW-Class will increase the unit capital cost of the turbine,but will reduce the costs of support structures and installationeven more. This is illustrated in Exhibit 3.8, where the capitalcosts of two 4MW-Class Turbines is compared with the capitalcosts of one 8MW-Class Turbine.
This shows that the decrease in installation and supportstructure costs leads to an overall reduction in capital costs ofabout 4%. A similar effect occurs with 6MW-Class Turbines.
This increase in rated power of turbines is also anticipated toreduce operating costs by of the order of 12%. A proportion ofoperations and maintenance costs (around 3% for the baseline case) are fixed (eg for environmental monitoring and
the operations and maintenance base) and do not increasewith turbine size.
These cost reductions are combined with an increase in energyproduction of up to 5% caused by:
• an increase in hub height wind speed due to the larger rotor size.
• A decrease in aerodynamic losses. Fewer turbines areneeded for a given wind farm size and a greater proportionof those turbines can be placed at the boundary of thewind farm hence reducing losses.
An increase in the rated power of turbines reduces capitalcosts by up to 4-5%, operating costs by up to 10-15% andincreases AEP by up to 5% leading to 9% reduction in LCOE27
per MW.
At the same time as increasing rated power, offshore windturbines are likely to be fitted with relatively larger rotors,
increasing capacity factor and energyproduction. Current turbine rotor sizes have, ingeneral, been optimised for onshore use. Theoptimum rotor size for a turbine offshore islarger because turbine costs are a smallerproportion of total capital costs. Therefore theimpact of spending more on the rotor (along with knock-on costs on other elements)causes a smaller percentage increase in capitalcosts offshore than it does onshore.
The key innovation therefore is to producelonger blades at low cost. Input from industryindicates that increasing 6MW-Class Turbineblades from 72m to 78m will increase energyproduction by 8%, increase capital costs by 9%and operating costs by 0.4%, leading to anoverall improvement in LCOE of a little over 1%.
1727 The figures relate to the saving available simply due to an increase in rated power. Further savings from other innova�ons are not included in this figure.
3%
1%
2%
3%
9%
17% Total
Other
Larger rotor
Changes in drive trains
Improved blade design and manufacture
Increases in rated power
Exhibit 3.7 Offshore wind power cost reduction opportunities from changes in turbine
Source: Technology work stream report, The Crown Estate
£22.2m £21.3m
0.0
5.0
10.0
15.0
20.0
25.0
2x 4MW-ClassTurbines
8MW-Class Turbine
£m
Other
Installa�on
Support structure (inc.tower)
Turbine (exc. tower)
Exhibit 3.8 Comparison of the capital costs of two 4MW-ClassTurbines with one 8MW-Class Turbine, Site B, FID 2011
Note: Reflects LCOE reduc�on opportuni�es from a FID 2011 4MW-Class Turbine on Site B to a 6MW-Class Turbine FID 2020 on Site B.
Source: Technology work stream report, The Crown Estate
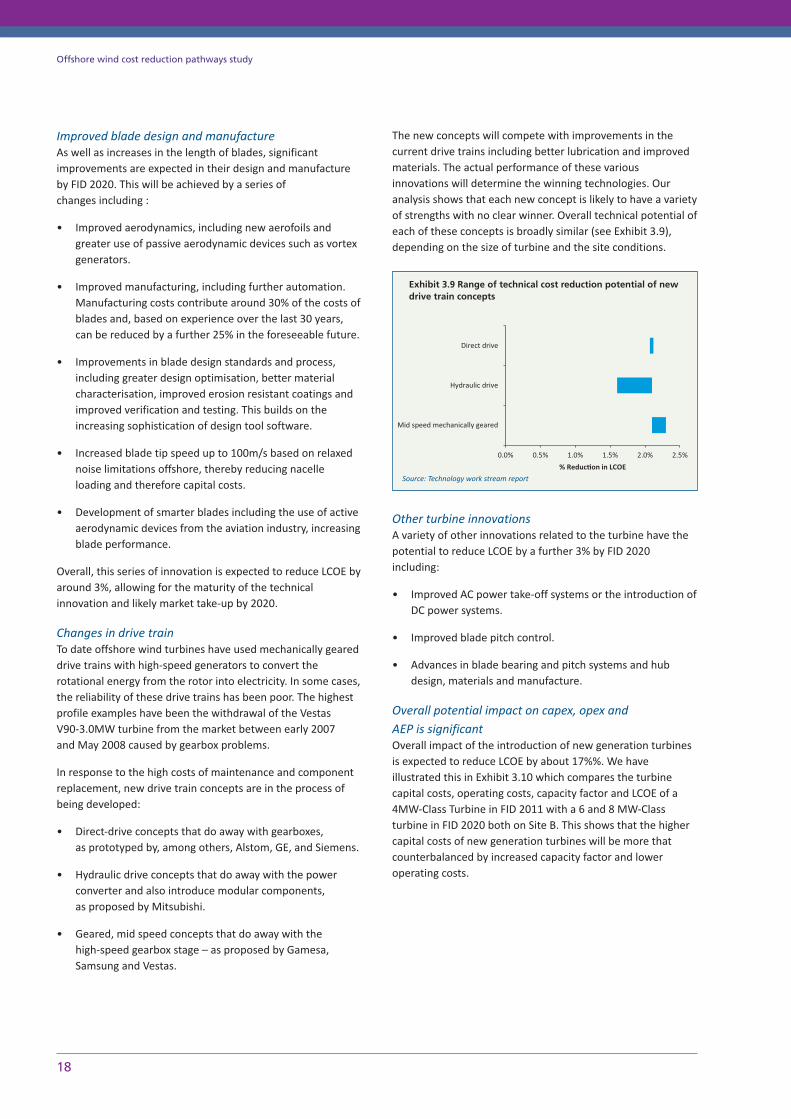
Improved blade design and manufactureAs well as increases in the length of blades, significantimprovements are expected in their design and manufactureby FID 2020. This will be achieved by a series of changes including :
• Improved aerodynamics, including new aerofoils andgreater use of passive aerodynamic devices such as vortexgenerators.
• Improved manufacturing, including further automation.Manufacturing costs contribute around 30% of the costs ofblades and, based on experience over the last 30 years,can be reduced by a further 25% in the foreseeable future.
• Improvements in blade design standards and process,including greater design optimisation, better materialcharacterisation, improved erosion resistant coatings andimproved verification and testing. This builds on theincreasing sophistication of design tool software.
• Increased blade tip speed up to 100m/s based on relaxednoise limitations offshore, thereby reducing nacelleloading and therefore capital costs.
• Development of smarter blades including the use of activeaerodynamic devices from the aviation industry, increasingblade performance.
Overall, this series of innovation is expected to reduce LCOE byaround 3%, allowing for the maturity of the technicalinnovation and likely market take-up by 2020.
Changes in drive trainTo date offshore wind turbines have used mechanically geareddrive trains with high-speed generators to convert therotational energy from the rotor into electricity. In some cases,the reliability of these drive trains has been poor. The highestprofile examples have been the withdrawal of the Vestas V90-3.0MW turbine from the market between early 2007 and May 2008 caused by gearbox problems.
In response to the high costs of maintenance and componentreplacement, new drive train concepts are in the process ofbeing developed:
• Direct-drive concepts that do away with gearboxes, as prototyped by, among others, Alstom, GE, and Siemens.
• Hydraulic drive concepts that do away with the powerconverter and also introduce modular components, as proposed by Mitsubishi.
• Geared, mid speed concepts that do away with the high-speed gearbox stage – as proposed by Gamesa,Samsung and Vestas.
The new concepts will compete with improvements in thecurrent drive trains including better lubrication and improvedmaterials. The actual performance of these variousinnovations will determine the winning technologies. Ouranalysis shows that each new concept is likely to have a varietyof strengths with no clear winner. Overall technical potential ofeach of these concepts is broadly similar (see Exhibit 3.9),depending on the size of turbine and the site conditions.
Other turbine innovationsA variety of other innovations related to the turbine have thepotential to reduce LCOE by a further 3% by FID 2020including:
• Improved AC power take-off systems or the introduction ofDC power systems.
• Improved blade pitch control.
• Advances in blade bearing and pitch systems and hubdesign, materials and manufacture.
Overall potential impact on capex, opex and AEP is significantOverall impact of the introduction of new generation turbinesis expected to reduce LCOE by about 17%%. We haveillustrated this in Exhibit 3.10 which compares the turbinecapital costs, operating costs, capacity factor and LCOE of a4MW-Class Turbine in FID 2011 with a 6 and 8 MW-Classturbine in FID 2020 both on Site B. This shows that the highercapital costs of new generation turbines will be more thatcounterbalanced by increased capacity factor and loweroperating costs.
18
Offshore wind cost reduction pathways study
0.0% 0.5% 1.0% 1.5% 2.0% 2.5%
Mid speed mechanically geared
Hydraulic drive
Direct drive
% Reduc�on in LCOE
Exhibit 3.9 Range of technical cost reduction potential of newdrive train concepts
Source: Technology work stream report
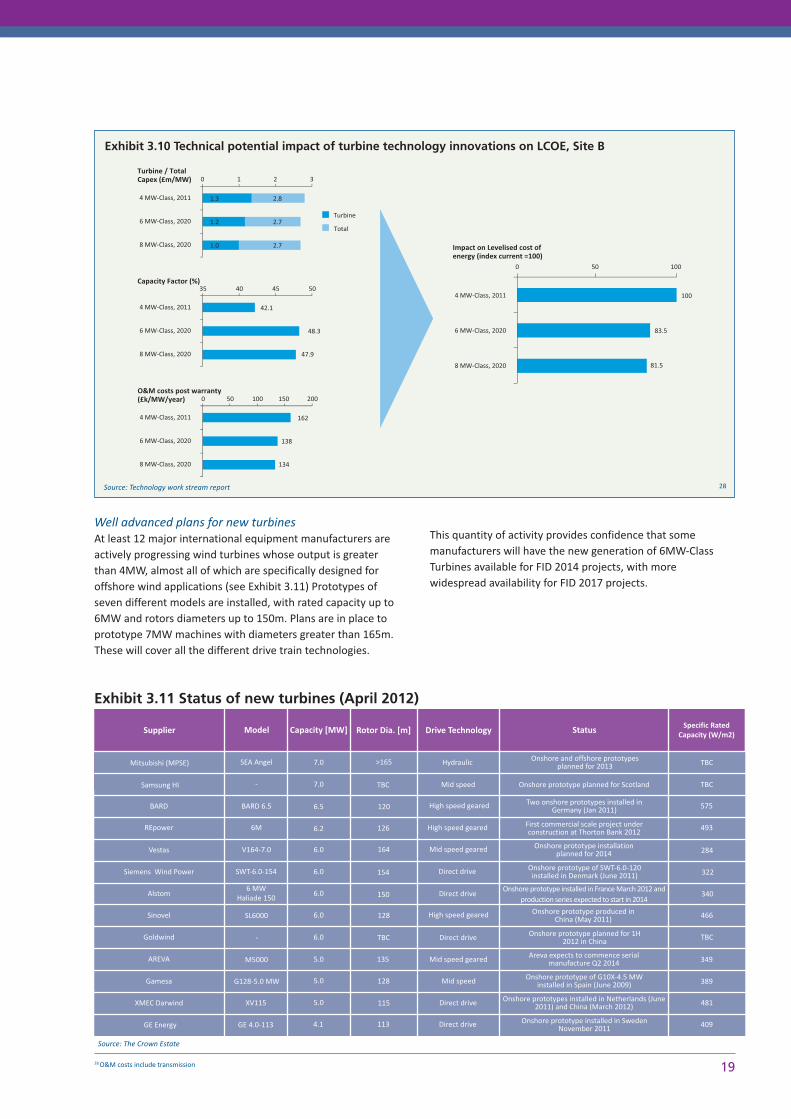
Well advanced plans for new turbinesAt least 12 major international equipment manufacturers areactively progressing wind turbines whose output is greaterthan 4MW, almost all of which are specifically designed foroffshore wind applications (see Exhibit 3.11) Prototypes ofseven different models are installed, with rated capacity up to6MW and rotors diameters up to 150m. Plans are in place toprototype 7MW machines with diameters greater than 165m.These will cover all the different drive train technologies.
This quantity of activity provides confidence that somemanufacturers will have the new generation of 6MW-ClassTurbines available for FID 2014 projects, with morewidespread availability for FID 2017 projects.
1928 O&M costs include transmission
Impact on Levelised cost ofenergy (index current =100)
0 50 100
4 MW-Class, 2011
6 MW-Class, 2020
8 MW-Class, 2020
100
83.5
81.5
0 1 2 3
4 MW-Class, 2011
6 MW-Class, 2020
8 MW-Class, 2020
1.3
1.2
1.0
2.8
2.7
2.7
Turbine / TotalCapex (£m/MW)
Turbine
Total
35 40 45 50
4 MW-Class, 2011
6 MW-Class, 2020
8 MW-Class, 2020
42.1
48.3
47.9
Capacity Factor (%)
O&M costs post warranty(£k/MW/year) 0 50 100 150 200
4 MW-Class, 2011
6 MW-Class, 2020
8 MW-Class, 2020
162
138
134
Source: Technology work stream report
Source: The Crown Estate
Supplier Model Capacity [MW] Rotor Dia. [m] Drive Technology Status Specific Rated Capacity (W/m2)
Mitsubishi (MPSE) SEA Angel
-
BARD 6.5
6M
V164-7.0
SWT-6.0-154
6 MW Haliade 150
SL6000
-
M5000
G128-5.0 MW
XV115
GE 4.0-113
7.0
7.0
6.5
6.2
6.0
6.0
6.0
6.0
6.0
5.0
5.0
5.0
4.1
>165
TBC
120
126
154
150
128
TBC
164
135
128
115
113
Hydraulic TBC
TBC
575
493
284
322
340
466
TBC
349
389
481
409
Mid speed
High speed geared
High speed geared
Direct drive
Direct drive
High speed geared
Direct drive
Mid speed geared
Mid speed geared
Mid speed
Direct drive
Direct drive
Samsung HI
BARD
REpower
Vestas
Siemens Wind Power
Alstom
Sinovel
Goldwind
AREVA
Gamesa
XMEC Darwind
GE Energy
Onshore prototype planned for Scotland
Onshore and offshore prototypes planned for 2013
Two onshore prototypes installed in Germany (Jan 2011)
First commercial scale project under construction at Thorton Bank 2012
Onshore prototype installation planned for 2014
Onshore prototype of SWT-6.0-120 installed in Denmark (June 2011)
Onshore prototype installed in France March 2012 andproduction series expected to start in 2014
Onshore prototype produced in China (May 2011)
Onshore prototype planned for 1H 2012 in China
Areva expects to commence serial manufacture Q2 2014
Onshore prototype of G10X-4.5 MW installed in Spain (June 2009)
Onshore prototypes installed in Netherlands (June2011) and China (March 2012)
Onshore prototype installed in Sweden November 2011
Exhibit 3.10 Technical potential impact of turbine technology innovations on LCOE, Site B
Exhibit 3.11 Status of new turbines (April 2012)
28
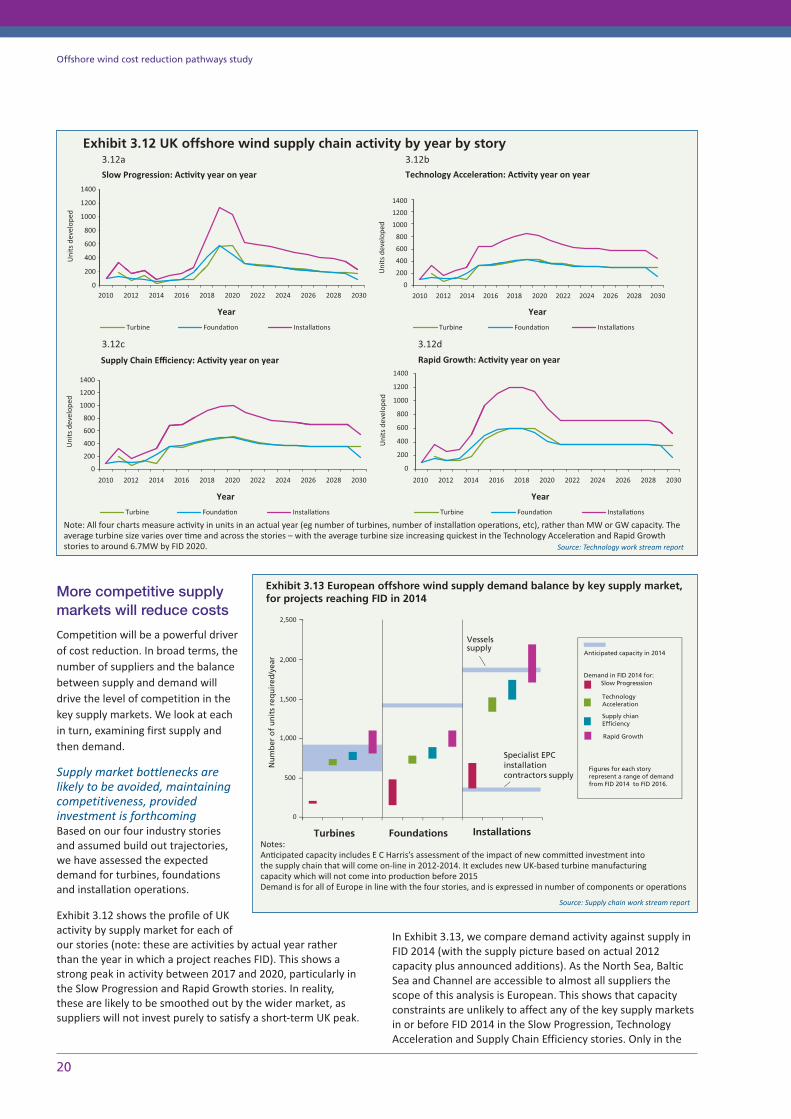
More competitive supplymarkets will reduce costs
Competition will be a powerful driverof cost reduction. In broad terms, thenumber of suppliers and the balancebetween supply and demand willdrive the level of competition in thekey supply markets. We look at eachin turn, examining first supply andthen demand.
Supply market bottlenecks arelikely to be avoided, maintainingcompetitiveness, provided investment is forthcomingBased on our four industry storiesand assumed build out trajectories,we have assessed the expecteddemand for turbines, foundationsand installation operations.
Exhibit 3.12 shows the profile of UKactivity by supply market for each ofour stories (note: these are activities by actual year ratherthan the year in which a project reaches FID). This shows astrong peak in activity between 2017 and 2020, particularly inthe Slow Progression and Rapid Growth stories. In reality,these are likely to be smoothed out by the wider market, assuppliers will not invest purely to satisfy a short-term UK peak.
In Exhibit 3.13, we compare demand activity against supply inFID 2014 (with the supply picture based on actual 2012capacity plus announced additions). As the North Sea, BalticSea and Channel are accessible to almost all suppliers thescope of this analysis is European. This shows that capacityconstraints are unlikely to affect any of the key supply marketsin or before FID 2014 in the Slow Progression, TechnologyAcceleration and Supply Chain Efficiency stories. Only in the
20
Offshore wind cost reduction pathways study
Slow Progression: Ac�vity year on year Technology Accelera�on: Ac�vity year on year
1400
1200
1000
800
600
400
200
02010 2012 2014 2016 2018 2020 2022 2024 2026 2028 2030 2010 2012 2014 2016 2018 2020 2022 2024 2026 2028 2030
Year
Turbine Founda�on Installa�ons
Year
Turbine Founda�on Installa�ons
2010 2012 2014 2016 2018 2020 2022 2024 2026 2028 2030
Year
Turbine Founda�on Installa�ons
2010 2012 2014 2016 2018 2020 2022 2024 2026 2028 2030
Year
Turbine Founda�on Installa�ons
Supply Chain Efficiency: Ac�vity year on year Rapid Growth: Ac�vity year on year
3.12a 3.12b
3.12c 3.12d
Uni
ts d
evel
oped
1400
1200
1000
800
600
400
200
0
Uni
ts d
evel
oped
1400
1200
1000
800
600
400
200
0
Uni
ts d
evel
oped
1400
1200
1000
800
600
400
200
0
Uni
ts d
evel
oped
Exhibit 3.12 UK offshore wind supply chain activity by year by story
Source: Technology work stream report
2,500
2,000
1,500
1,000
500
0
Source: Supply chain work stream report
Exhibit 3.13 European offshore wind supply demand balance by key supply market, for projects reaching FID in 2014
Note: All four charts measure ac�vity in units in an actual year (eg number of turbines, number of installa�on opera�ons, etc), rather than MW or GW capacity. Theaverage turbine size varies over �me and across the stories – with the average turbine size increasing quickest in the Technology Accelera�on and Rapid Growthstories to around 6.7MW by FID 2020.
Notes:An�cipated capacity includes E C Harris’s assessment of the impact of new commi�ed investment into the supply chain that will come on-line in 2012-2014. It excludes new UK-based turbine manufacturing capacity which will not come into produc�on before 2015Demand is for all of Europe in line with the four stories, and is expressed in number of components or opera�ons

Rapid Growth story are severe supply chain bottlenecks forwind farm installation expected to appear before FID2017. The only exception is specialist installation contractors offeringEngineer, Procure, Install and Construct (EPIC) contracts thatare in relatively short supply. However developers canovercome this potential bottleneck by multi contracting withindividual vessel owners who have the relevant expertise.
In the past offshore wind has suffered some supply chainbottlenecks as a consequence of high demand from eitheronshore wind or the oil and gas sector. We have not explicitlyconsidered in our analysis the impact of a resurgent demandfor oil and gas offshore services or onshore wind returning toprevious growth levels.
More competition will drive down costsIn a number of key supply markets, we expect to see anincrease in the number of competitors as the European marketgrows and matures, driving down costs.
In Exhibit 3.14, we highlight the number of players in theturbine, foundation and installation markets at present.
There are currently only a small number of players in theturbine, installation contractor and jacket foundation markets.Most of the players are based in the UK and the rest of the EU.The only notable presence of low cost countries has been thatof Shanghai Shenhua Heavy Industry which deliveredmonopiles to the Greater Gabbard wind farm.
TurbinesCurrently Siemens, which has provided nearly two thirds of allthe turbines installed in UK waters (see Exhibit 3.15),dominates the supply of offshore wind turbines, with Vestasand REpower also active in the UK market. Areva has beenactive in the supply of offshore wind turbines in the rest of theEU, but has yet to supply the UK market.
Ten companies have made announcements indicating anintention to invest in offshore wind manufacturing facilities inthe UK and the rest of Europe; including some interest fromcompanies based in low cost countries such as China, Indiaand Korea. It seems unlikely that all these announcements andinterest will convert into actual investments.
Our Technology Acceleration, Supply Chain Efficiency andRapid Progression stories imply a long term market foroffshore wind turbines in Europe of around 5GW/year throughto 2025. With the output of an offshore wind turbinemanufacturing facility estimated at between 0.5 to 1GW/year,the European long term market will require about 5-10factories. We have, therefore, assumed that the Europeanoffshore wind turbine market will support a minimum of 6competitors by 2020, of which 2 are expected to have a strongbase in low cost countries.
A greater level of competition will generate margincompression and increased cost pressures. The vast majorityof the cost of an offshore wind turbine is made-up ofcomponents that are assembled by the turbine manufacturer(see Exhibit 3.16). Many active turbine manufacturers have ahigh degree of in-house component supply eg Vestas andSiemens. Increased cost pressures are likely to generatesavings at the component level; either through outsourcing,shift of in-house supply to low cost countries, or increasedefficiency in their European component supply operations.Some signs of this are already occurring, with Vestas producingbedplates and generators in China as well as in Europe.
21
0 2 4 6 8 10
Monopile founda�ons
Jacket / Tripod founda�ons
Installa�on contractors
Turbines >5 MW
Turbines <5 MW
Number of compe�tors
Exhibit 3.14 Current number of competitors bykey supply market
Source: Supply chain work stream report
REpower 4%
Vestas 32%
Siemens 64%
Exhibit 3.15 UK offshore wind turbine market share
Source: Supply chain work stream report
Drive train including generator
and load path 30%
Blades 20% Tower excluding
electrical and control system
16%
Electrical and control system
including converter and transformer
13%
Auxiliary systems and nacelle
and hub cover 10%
Hub cas�ng, blade bearings and pitch
system 9%
Nacelle and hub assembly
2%
Exhibit 3.16 Offshore wind turbine cost structure
Source: BVG Associates
Note: based on data for 25 UK wind farms where the turbine manufacturer was stated
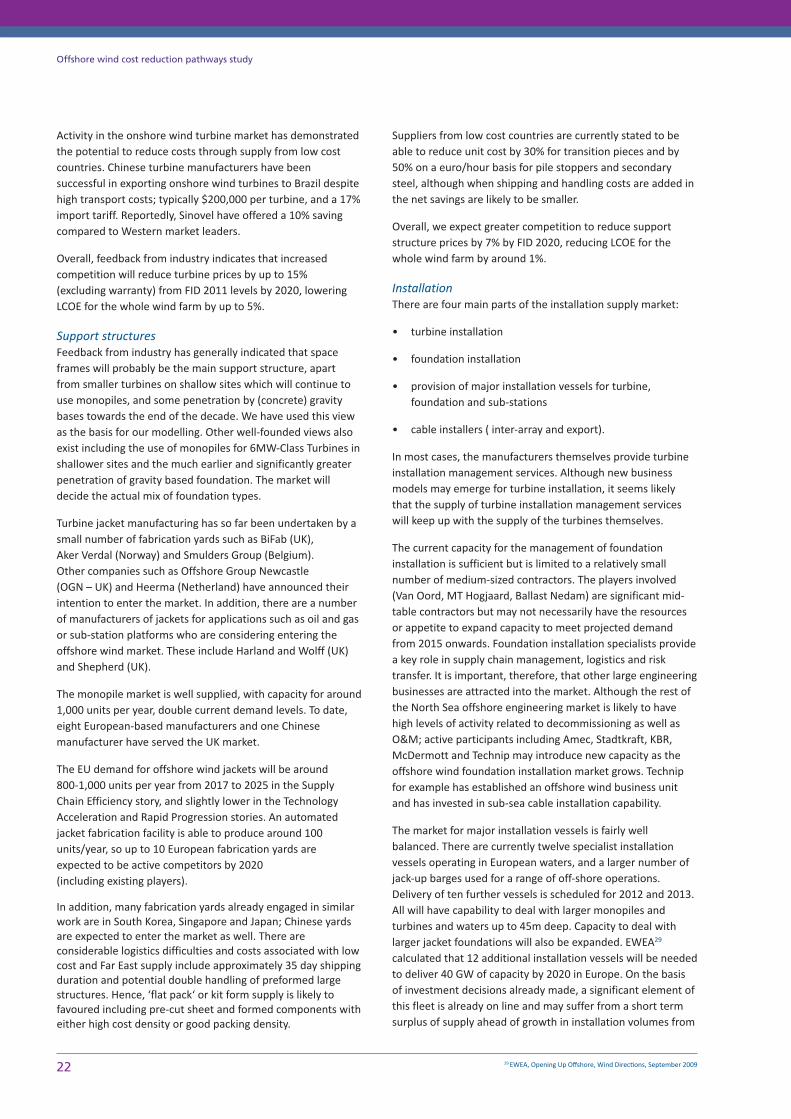
Activity in the onshore wind turbine market has demonstratedthe potential to reduce costs through supply from low costcountries. Chinese turbine manufacturers have beensuccessful in exporting onshore wind turbines to Brazil despitehigh transport costs; typically $200,000 per turbine, and a 17%import tariff. Reportedly, Sinovel have offered a 10% savingcompared to Western market leaders.
Overall, feedback from industry indicates that increasedcompetition will reduce turbine prices by up to 15% (excluding warranty) from FID 2011 levels by 2020, loweringLCOE for the whole wind farm by up to 5%.
Support structuresFeedback from industry has generally indicated that spaceframes will probably be the main support structure, apartfrom smaller turbines on shallow sites which will continue touse monopiles, and some penetration by (concrete) gravitybases towards the end of the decade. We have used this viewas the basis for our modelling. Other well-founded views alsoexist including the use of monopiles for 6MW-Class Turbines inshallower sites and the much earlier and significantly greaterpenetration of gravity based foundation. The market willdecide the actual mix of foundation types.
Turbine jacket manufacturing has so far been undertaken by asmall number of fabrication yards such as BiFab (UK), Aker Verdal (Norway) and Smulders Group (Belgium). Other companies such as Offshore Group Newcastle (OGN – UK) and Heerma (Netherland) have announced theirintention to enter the market. In addition, there are a numberof manufacturers of jackets for applications such as oil and gasor sub-station platforms who are considering entering theoffshore wind market. These include Harland and Wolff (UK)and Shepherd (UK).
The monopile market is well supplied, with capacity for around1,000 units per year, double current demand levels. To date,eight European-based manufacturers and one Chinesemanufacturer have served the UK market.
The EU demand for offshore wind jackets will be around 800-1,000 units per year from 2017 to 2025 in the SupplyChain Efficiency story, and slightly lower in the TechnologyAcceleration and Rapid Progression stories. An automatedjacket fabrication facility is able to produce around 100units/year, so up to 10 European fabrication yards areexpected to be active competitors by 2020 (including existing players).
In addition, many fabrication yards already engaged in similarwork are in South Korea, Singapore and Japan; Chinese yardsare expected to enter the market as well. There areconsiderable logistics difficulties and costs associated with lowcost and Far East supply include approximately 35 day shippingduration and potential double handling of preformed largestructures. Hence, ‘flat pack‘ or kit form supply is likely tofavoured including pre-cut sheet and formed components witheither high cost density or good packing density.
Suppliers from low cost countries are currently stated to beable to reduce unit cost by 30% for transition pieces and by50% on a euro/hour basis for pile stoppers and secondarysteel, although when shipping and handling costs are added inthe net savings are likely to be smaller.
Overall, we expect greater competition to reduce supportstructure prices by 7% by FID 2020, reducing LCOE for thewhole wind farm by around 1%.
InstallationThere are four main parts of the installation supply market:
• turbine installation
• foundation installation
• provision of major installation vessels for turbine,foundation and sub-stations
• cable installers ( inter-array and export).
In most cases, the manufacturers themselves provide turbineinstallation management services. Although new businessmodels may emerge for turbine installation, it seems likelythat the supply of turbine installation management serviceswill keep up with the supply of the turbines themselves.
The current capacity for the management of foundationinstallation is sufficient but is limited to a relatively smallnumber of medium-sized contractors. The players involved(Van Oord, MT Hogjaard, Ballast Nedam) are significant mid-table contractors but may not necessarily have the resourcesor appetite to expand capacity to meet projected demandfrom 2015 onwards. Foundation installation specialists providea key role in supply chain management, logistics and risktransfer. It is important, therefore, that other large engineeringbusinesses are attracted into the market. Although the rest ofthe North Sea offshore engineering market is likely to havehigh levels of activity related to decommissioning as well asO&M; active participants including Amec, Stadtkraft, KBR,McDermott and Technip may introduce new capacity as theoffshore wind foundation installation market grows. Technipfor example has established an offshore wind business unitand has invested in sub-sea cable installation capability.
The market for major installation vessels is fairly wellbalanced. There are currently twelve specialist installationvessels operating in European waters, and a larger number ofjack-up barges used for a range of off-shore operations.Delivery of ten further vessels is scheduled for 2012 and 2013.All will have capability to deal with larger monopiles andturbines and waters up to 45m deep. Capacity to deal withlarger jacket foundations will also be expanded. EWEA29
calculated that 12 additional installation vessels will be neededto deliver 40 GW of capacity by 2020 in Europe. On the basisof investment decisions already made, a significant element ofthis fleet is already on line and may suffer from a short termsurplus of supply ahead of growth in installation volumes from
22 29 EWEA, Opening Up Offshore, Wind Direc�ons, September 2009
Offshore wind cost reduction pathways study
2015 onwards. There are four main vessel providers: A2Sea,MPI Offshore, Seajacks and Seaway Heavy Lifting Based onannounced investments, Swire, Fred Olsen, RWE, Workfox andVan Oord will enter the market in 2012/13. The market forvessels is increasingly characterised by alliances and long termrelationships between developers and vessel owners. Theintroduction of additional capacity and new participantsduring 2012 and 2013 will help to ensure that the market forvessels is competitive and diverse in the medium term
The cable installer market is generating the greatest number ofinsurance claims. This market has been characterised byplayers with weak financial strength and poor track recordwith only a few main actors such as:
• Global Marine Systems
• Volker Stevin Marine Contractors
• JD Contractors
• Van Oord
• Technip (who recently purchased SubOcean – formally CNS)
• Subsea7.
Offshore Marine Management and CT Offshore are planning toenter the cable installation market.
By 2020, we expect a well-diversified installation contractingmarket that will eliminate current undersupply and introduceother new players from oil and gas and other sectors. Greatercompetitive pressure will lead to cost reductions through theintroduction of more efficient processes. For example, large oiland gas installers may be able to optimise practices such asvessel and staff utilisation across offshore work (oil and gas aswell as wind). This will reduce installation price by 5% by FID2020, reducing LCOE for the whole wind farm by around 0.5%.
Overall, increased competition is expected to reduce LCOE by6% by FID 2020 (including the impacts described above, plus impacts of competition on operations and maintenancecosts and array capital costs).
Mass produced support structuresAs indicated previously, although a variety of views exist, thebasis of our assessment is that space frames will be the mostcommon support structure in the future.
Although there is over 70 years’ experience of space frames inthe offshore oil and gas industry, the use of space frames inoffshore wind has been limited to date.
Currently space frames are designed for each turbine locationand manufactured using a batch process with much of thewelding done manually. This results in high proportion oftooling and labour costs, commonly two thirds of total costs.
We expect that space frames will be mass-produced in thefuture leading to considerable cost savings. This will involve
automated fabrication and automatic welding and the use ofmore standardised designs. The standardised designs willtolerate small changes in water depth (so the same foundationdesign will be used more than once) and use more standardparts such as the tubular sections and other components suchas personnel access arrangements.
As a result, production time and cost is expected to reduce by 50%. These innovations are expected to have reached ahigh level of market penetration by FID 2020, leading to areduction in LCOE of 2.6%.
Significant steps have already been taken by key players toadvance space frame manufacturing. This includes BiFab,which announced in 2010 an investment programme of £14million to extend its manufacturing facility at Methil, andWeserWind that has invested £90 million in Bremerhaven.Announcements on new facilities should also be expectedfrom existing and new players such as OGN and Heerema.
Greater activity at the front end of the project
Many of the key decisions that shape a wind farm project andtherefore its costs are taken at a relatively early stage, oftenprior to Final Investment Decision. The drive for more activityat the front end of a project has come from:
• the greater complexity of Round 3 sites, which are larger,often have variable water depth and sea-bed conditions,and grid connection constraints
• a series of lessons learnt from past projects whereunexpected cost increases occurred during the installationphase that could have been avoided by more thorough up-front characterisation of seabed and other conditions
• the availability of a wider range of technology that couldbe implemented on a given site and more advancedunderstanding to help make choices about the use of this technology.
Feedback from industry is that greater investment in windfarm design and optimisation at the development stage willyield considerable cost savings later in the project. The costreductions will come from both technology and supply changeinfluences. New software tools will drive multi-variableoptimisation of wind farm array layout. In addition, a combination of greater use of Front End Engineering andDesign (FEED), more use of geo-technical and geophysicalsurveying and earlier involvement of suppliers will design outcosts and avoid costly installation overruns.
Array optimisationIn the relatively benign and uniform conditions of Round 1 and2, array layout was largely defined by the site constraints and asimple trade-off between capital cost and turbine separation.The larger the turbine separation the lower the wake effectsand the higher the energy production per turbine, but at thecost of higher capital and operational expenditure and lessenergy production per unit of seabed. Round 3 sites call for amore sophisticated set of trade-offs between, for example,
23

wake effects, array cable costs, support structure costs,installation costs and consenting constraints. Implementing these trade-offs will involve the developmentand use of fast and reliable software tools that optimise thearray layout for the lowest cost of energy, or other parameterdepending on the targets of the developer.
Exhibit 3.17 illustrates the nature of these trade-offs at Gwynty Mor, where the turbines were not installed on part of thesite, and, the decision was taken to have two sub-stations andtransmission cables.
The overall benefit of this innovation is to reduce the cost ofenergy through improving the location of turbines. Depending on site conditions, this is likely to involve reducedsupport structure and installation costs, by avoiding the morechallenging areas of the site, reduced electrical array costs byconsidering the effect on the system cost when optimising,and an increase in energy production through reduced wakelosses and/or electrical array losses. Savings may also beavailable in operating costs due to, for example, better-spacedturbines causing less fatigue loading and therefore lessfrequent components replacement or repair. The use ofoptimisation tools may also lead to lower wind farmdevelopment costs owing to a reduction in the time taken tomanually analyse and iterate design options.
Overall optimised array layouts could reduce LCOE by up to 2%, however, we anticipate only 40% of this saving will berealised by FID 2020 as progress will be gradual as tools aretrialled and then developed to include more variables.
The first steps in the development of optimisation tools areunderway. The Carbon Trust’s Offshore Wind Acceleratorprogramme has undertaken some initial analysis ofparameterised models for wind farm layout. Further earlywork to develop optimisation tools is underway by aconsortium of companies led by DTU Wind Energy as part of aEuropean-funded research project.
Greater use of surveys and optimisation during FEEDThe saving from greater use of FEED and greater use of surveydata are highly linked, based on a philosophy of higher front-end spend to reduce overall costs.
FEED studies allow developers to choose the basic designconcept and the size of the key components. FEED studies
review a variety of design options to compare theeconomically viable solutions. At this stage, designoptions remain relatively flexible. With increasedoptimisation of design at FEED, decisions aboutconcepts are made following a more detailedanalysis of costs (eg to foundations, array cables,electrical architecture, installation method etc). Forexample by examining costs for a number ofcomplete, installed solutions; considering theimpact of array cable arrangements and secondarysteel costs, rather than simply comparing basicfoundation structure and foundation installationcosts on a per-tonne basis.
Often geotechnical and geophysical survey data areavailable only at turbine locations and with a focuson properties some distance below the sea-bed.This leads to significant uncertainties in cabledesign and installation. An improved knowledge ofsea-bed conditions, from surveys on the other
areas of the site or on soil conditions closer to the surface ofthe seabed, can lead to cost reductions in array cable andinstallation capital costs through earlier design work andhence the prevention of conservative overdesign or late designchanges. Support structure capital costs savings are alsopossible with an increased number of core samples taken atturbine locations. Overall, the technical impact of both theseinnovations is an increase in wind farm development costs of 5%, but a decrease in support structure, array cable andinstallation capital costs of around 5%, together with asubstantial reduction in installation risk. On a 500MW windfarm using our baseline 4MW-Class Turbine on Site B, we anticipate an investment of £2m in greater FEED and moresurvey data will reduce overall capital costs over £30m. We expect a high penetration of these innovations by 2020,leading to a reduction in LCOE of 1.2%.
Earlier involvement of supply chainIn addition to the impacts indicated above, early involvementof the supply chain will generate further cost reductionopportunities. These will manifest themselves mainly through:
• Lower installation costs from:
‒ Joined-up scheduling
‒ More appropriate scheduling of tasks
‒ Optimisation of logistics support
‒ More appropriate apportioning of risks
• Reduced over-ordering of steel for support structuresthrough detailed procurement planning
24
Offshore wind cost reduction pathways study
Exhibit 3.17 Gwynt y Mor wind farm layout
Source: The Crown Estate
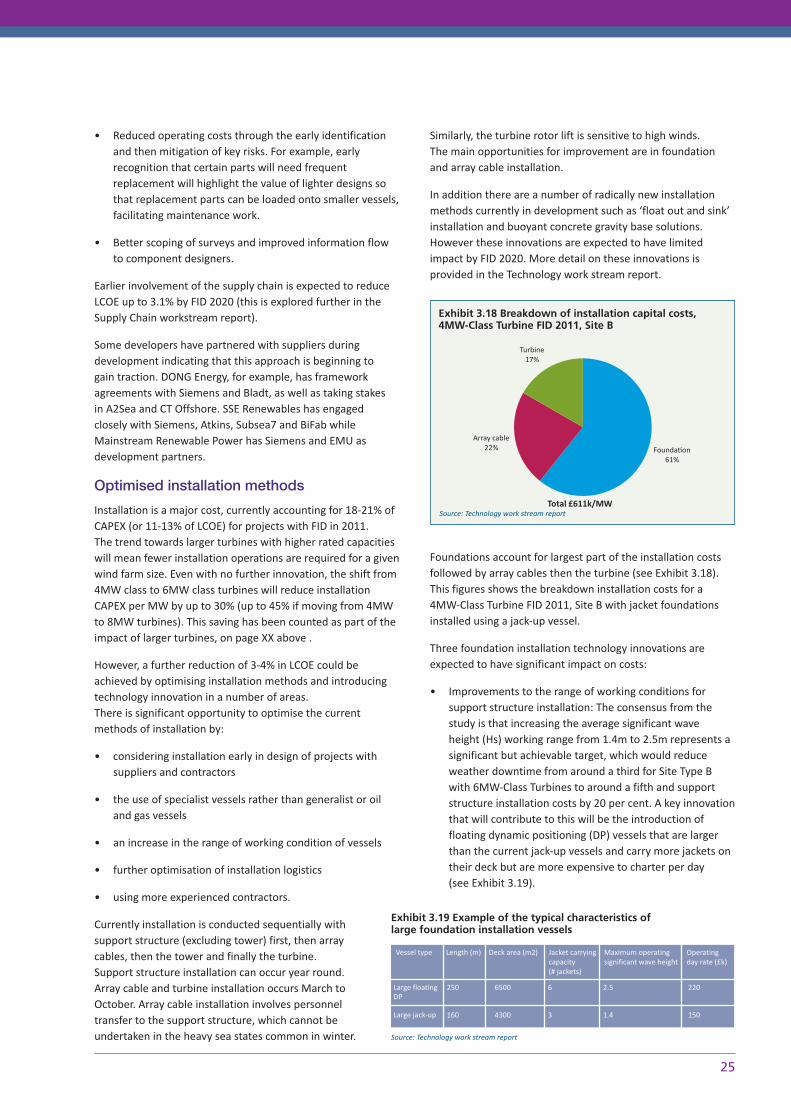
• Reduced operating costs through the early identificationand then mitigation of key risks. For example, earlyrecognition that certain parts will need frequentreplacement will highlight the value of lighter designs sothat replacement parts can be loaded onto smaller vessels,facilitating maintenance work.
• Better scoping of surveys and improved information flowto component designers.
Earlier involvement of the supply chain is expected to reduceLCOE up to 3.1% by FID 2020 (this is explored further in theSupply Chain workstream report).
Some developers have partnered with suppliers duringdevelopment indicating that this approach is beginning to gain traction. DONG Energy, for example, has frameworkagreements with Siemens and Bladt, as well as taking stakes in A2Sea and CT Offshore. SSE Renewables has engaged closely with Siemens, Atkins, Subsea7 and BiFab whileMainstream Renewable Power has Siemens and EMU asdevelopment partners.
Optimised installation methods
Installation is a major cost, currently accounting for 18-21% ofCAPEX (or 11-13% of LCOE) for projects with FID in 2011. The trend towards larger turbines with higher rated capacitieswill mean fewer installation operations are required for a givenwind farm size. Even with no further innovation, the shift from4MW class to 6MW class turbines will reduce installationCAPEX per MW by up to 30% (up to 45% if moving from 4MWto 8MW turbines). This saving has been counted as part of theimpact of larger turbines, on page XX above .
However, a further reduction of 3-4% in LCOE could beachieved by optimising installation methods and introducingtechnology innovation in a number of areas. There is significant opportunity to optimise the currentmethods of installation by:
• considering installation early in design of projects withsuppliers and contractors
• the use of specialist vessels rather than generalist or oiland gas vessels
• an increase in the range of working condition of vessels
• further optimisation of installation logistics
• using more experienced contractors.
Currently installation is conducted sequentially withsupport structure (excluding tower) first, then arraycables, then the tower and finally the turbine.Support structure installation can occur year round.Array cable and turbine installation occurs March toOctober. Array cable installation involves personneltransfer to the support structure, which cannot beundertaken in the heavy sea states common in winter.
Similarly, the turbine rotor lift is sensitive to high winds. The main opportunities for improvement are in foundationand array cable installation.
In addition there are a number of radically new installationmethods currently in development such as ‘float out and sink’installation and buoyant concrete gravity base solutions.However these innovations are expected to have limitedimpact by FID 2020. More detail on these innovations isprovided in the Technology work stream report.
Foundations account for largest part of the installation costsfollowed by array cables then the turbine (see Exhibit 3.18).This figures shows the breakdown installation costs for a4MW-Class Turbine FID 2011, Site B with jacket foundationsinstalled using a jack-up vessel.
Three foundation installation technology innovations areexpected to have significant impact on costs:
• Improvements to the range of working conditions forsupport structure installation: The consensus from thestudy is that increasing the average significant wave height (Hs) working range from 1.4m to 2.5m represents asignificant but achievable target, which would reduceweather downtime from around a third for Site Type Bwith 6MW-Class Turbines to around a fifth and supportstructure installation costs by 20 per cent. A key innovationthat will contribute to this will be the introduction offloating dynamic positioning (DP) vessels that are largerthan the current jack-up vessels and carry more jackets ontheir deck but are more expensive to charter per day (see Exhibit 3.19).
25
Founda�on 61%
Array cable 22%
Turbine 17%
Total £611k/MW
Exhibit 3.18 Breakdown of installation capital costs,4MW-Class Turbine FID 2011, Site B
Source: Technology work stream report
Exhibit 3.19 Example of the typical characteristics oflarge foundation installation vessels
Source: Technology work stream report
Vessel type Length (m) Deck area (m2) Jacket carryingcapacity (# jackets)
Maximum operatingsignificant wave height
Operating day rate (£k)
Large floating DP
250 6500 6 2.5 220
160 4300 3 1.4 150Large jack-up

• Greater use of feeder arrangements in the installation ofsupport structures: this can improve the utilisation of thelarge installation vessels by reducing the amount of timethey spend in port and in transit. This has already beendemonstrated at the Greater Gabbard wind farm.
• Improvements in the installation process for Jackets:industry indicates that there is scope for optimising theprocess through the introduction of a bespoke fleet ofvessels, each optimised for a specific task, whether pin-piling, support structure installation or grouting. This couldshorten the support structure installation process throughthe use of more efficient vessels, innovations in seabedpile templates and parallel operations, as well as decreasethe average day rate for vessels by not using over-specifiedvessels for less onerous tasks.
Three array cables installation innovations are expected tohave significant impact on costs:
• Greater use of specialist array cable installation vessels:Currently, most array cable installation, especially atshallow water sites, is done using barges (which are slowto reposition) or cable installation vessel that are neitherwide nor long enough to carry the largest, 7000 tonnecable carousels. Greater use of 100m cable installationvessels will reduce the time taken to load and lay cable.
• Increased range of working conditions: At present, arraycable installation involves access to the foundation to pull-in and hang-off the cable through a J-tube connectingthe sea bead to the turbine base. Access to the foundationis limited to sea conditions where the significant waveheight is at or below 1.4m. Improved access systems (including the use of heave compensated walkways) areexpected to increase the upper limit of working conditionsto 1.8m. This is anticipated to reduce weather downtimeand shorten installation programmes by 8%.
• Introduction of optimised cable pull-in and hang-off: A number of new methods are being developed eithereliminating the need for personnel access when the cableis drawn through the J-tube or introducing new turbineconnection points. These new methods are expected , on average , to reduce time spent at the foundationinterface by 20%, leading to a 6% reduction time in cableinstallation time.
Together with some more minor changes in turbineinstallation and allowing for higher day rates for morespecialised vessels, optimised installation methods areexpected to reduce offshore wind LCOE by around 3-4% by FID 2020.
There are promising signs that new foundations installationvessels are being developed. A2SEA and Teekay are planning todesign a DP foundation installation vessel capable of workingin water depths of up to 60m and in sea conditions withsignificant wave heights of up to 3m. Other vessel operators
are also expected to make similar announcements in the nextcouple of years.
Although a number of cable installers have plans forspecialised offshore wind cable-laying vessels, none has yetcommitted to an investment. However, the recent acquisitionof cable installer CT Offshore by DONG may well be aprecursor to new vessel investments.30
Exploitation of economies of scale andproductivity improvements
The offshore wind market is still relatively small anddominated by bespoke design and batch production. Stronggrowth is projected, particularly in the UK. However, this largely depends on Round 3 projects that haveyet to be consented or reach FID. For the supply chain, thismeans uncertainty around future orders.
With a steadily and predictably growing market it is possible tounlock investment in the supply chain, developing newcapacity (asset growth) and realising economies of scale.
Asset growth indicates the willingness of players to invest inadditional production lines or manufacturing facilities,associated infrastructure such as ports and assets all of whichhave high up-front investment costs, long lead times and longpay-back periods. For example a new installation vessel willtypically cost €240m, take three to four years to build and 15to 20 years to pay back. As supply chain capacity increases,cost savings can be achieved through, for example,productivity improvements (having more vessels reduces theimpact of installation delays as it affords increased flexibility)and logistics (if new capacity and its associated supply chainare located closer to the market it is possible to minimisetransport costs).
With increased volumes, economies of scale can be achievedand efficiencies obtained in:
• procurement due to volume (rationalising suppliers andobtaining volume discounts)
• ‘learning by doing’ and implementing procedures thatallow repetition (doing the same in larger volumes) in amore efficient manner
• standardising processes/protocols thus reducing the needfor more expensive bespoke solutions and serialproduction, standard lengths for array cables
• ‘sweating assets’ or increasing the productivity of existingassets (including manufacturing facilities) by increasingvolume throughout.
Asset growth and economies of scale will have the greatestcost reduction impact in installation, support structures and turbines.
26 30 In January 2012 A2SEA acquired a further 29% share interest in the Danish cable installa�on company CT bringing their total shareholding in the company to 67%. A2SEA is owned by DONG EnergyRenewables (principal shareholder) and Siemens Wind Power. During DONG’s ownership, A2SEA have invested in the turbine installa�on vessel, Sea Installer.
Offshore wind cost reduction pathways study
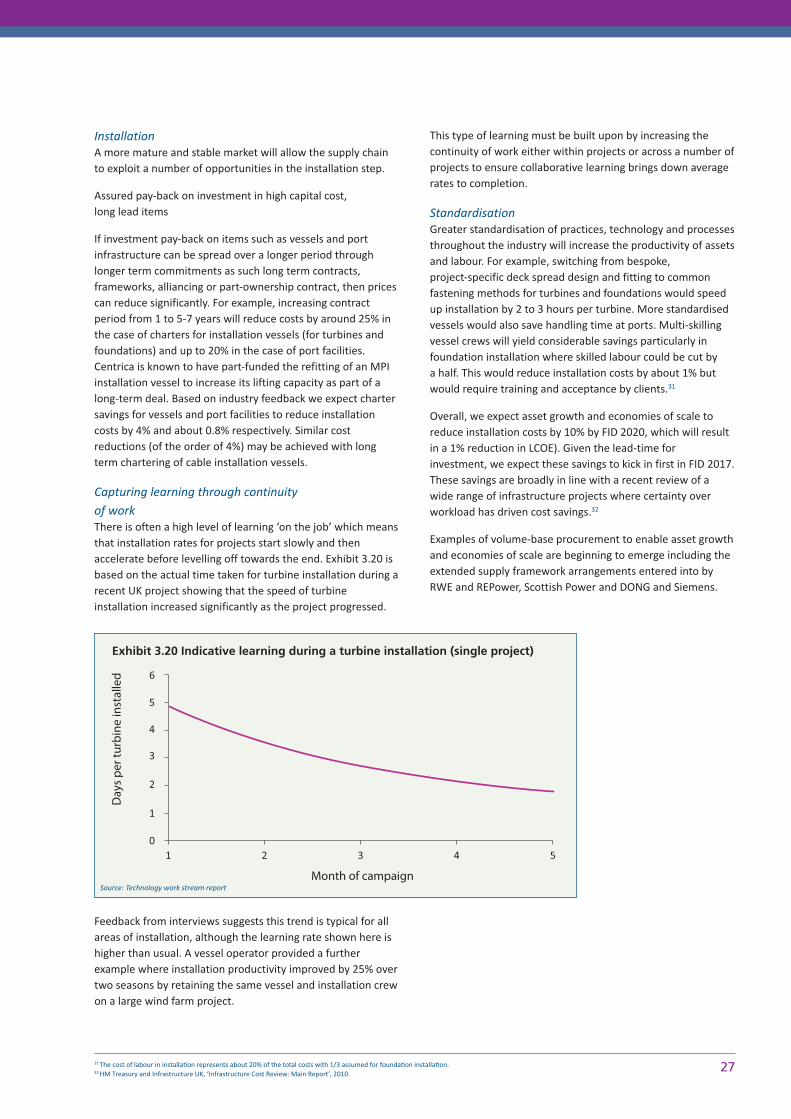
InstallationA more mature and stable market will allow the supply chainto exploit a number of opportunities in the installation step.
Assured pay-back on investment in high capital cost, long lead items
If investment pay-back on items such as vessels and portinfrastructure can be spread over a longer period throughlonger term commitments as such long term contracts,frameworks, alliancing or part-ownership contract, then pricescan reduce significantly. For example, increasing contractperiod from 1 to 5-7 years will reduce costs by around 25% inthe case of charters for installation vessels (for turbines andfoundations) and up to 20% in the case of port facilities.Centrica is known to have part-funded the refitting of an MPIinstallation vessel to increase its lifting capacity as part of along-term deal. Based on industry feedback we expect chartersavings for vessels and port facilities to reduce installationcosts by 4% and about 0.8% respectively. Similar costreductions (of the order of 4%) may be achieved with longterm chartering of cable installation vessels.
Capturing learning through continuity of workThere is often a high level of learning ‘on the job’ which meansthat installation rates for projects start slowly and thenaccelerate before levelling off towards the end. Exhibit 3.20 isbased on the actual time taken for turbine installation during arecent UK project showing that the speed of turbineinstallation increased significantly as the project progressed.
Feedback from interviews suggests this trend is typical for allareas of installation, although the learning rate shown here ishigher than usual. A vessel operator provided a furtherexample where installation productivity improved by 25% overtwo seasons by retaining the same vessel and installation crewon a large wind farm project.
This type of learning must be built upon by increasing thecontinuity of work either within projects or across a number ofprojects to ensure collaborative learning brings down averagerates to completion.
StandardisationGreater standardisation of practices, technology and processesthroughout the industry will increase the productivity of assetsand labour. For example, switching from bespoke, project-specific deck spread design and fitting to commonfastening methods for turbines and foundations would speedup installation by 2 to 3 hours per turbine. More standardisedvessels would also save handling time at ports. Multi-skillingvessel crews will yield considerable savings particularly infoundation installation where skilled labour could be cut by a half. This would reduce installation costs by about 1% butwould require training and acceptance by clients.31
Overall, we expect asset growth and economies of scale toreduce installation costs by 10% by FID 2020, which will resultin a 1% reduction in LCOE). Given the lead-time forinvestment, we expect these savings to kick in first in FID 2017.These savings are broadly in line with a recent review of awide range of infrastructure projects where certainty overworkload has driven cost savings.32
Examples of volume-base procurement to enable asset growthand economies of scale are beginning to emerge including theextended supply framework arrangements entered into byRWE and REPower, Scottish Power and DONG and Siemens.
2731 The cost of labour in installa�on represents about 20% of the total costs with 1/3 assumed for founda�on installa�on.32 HM Treasury and Infrastructure UK, ‘Infrastructure Cost Review: Main Report’, 2010.
0
5
6
1
2
3
4
1 2 3 4 5
Day
s per
turb
ine
inst
alle
d
Month of campaign
Exhibit 3.20 Indicative learning during a turbine installation (single project)
Source: Technology work stream report
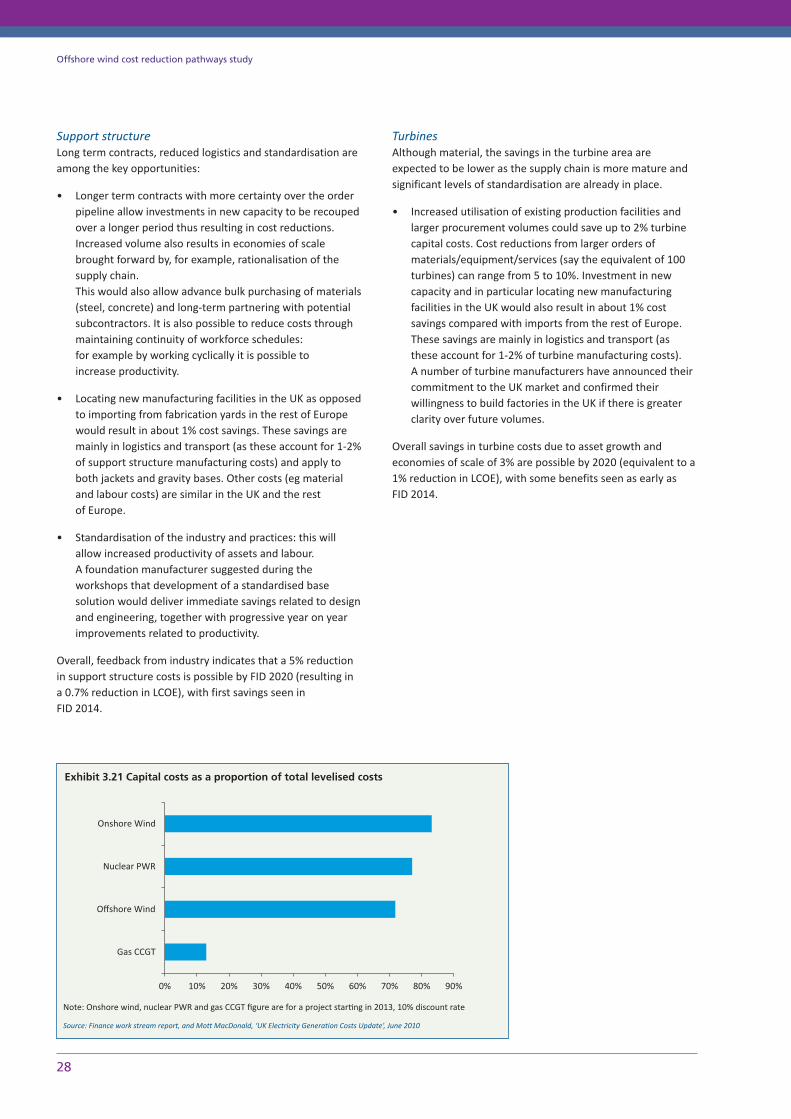
Support structureLong term contracts, reduced logistics and standardisation areamong the key opportunities:
• Longer term contracts with more certainty over the orderpipeline allow investments in new capacity to be recoupedover a longer period thus resulting in cost reductions.Increased volume also results in economies of scalebrought forward by, for example, rationalisation of thesupply chain. This would also allow advance bulk purchasing of materials(steel, concrete) and long-term partnering with potentialsubcontractors. It is also possible to reduce costs throughmaintaining continuity of workforce schedules: for example by working cyclically it is possible to increase productivity.
• Locating new manufacturing facilities in the UK as opposedto importing from fabrication yards in the rest of Europewould result in about 1% cost savings. These savings aremainly in logistics and transport (as these account for 1-2%of support structure manufacturing costs) and apply toboth jackets and gravity bases. Other costs (eg materialand labour costs) are similar in the UK and the rest of Europe.
• Standardisation of the industry and practices: this willallow increased productivity of assets and labour. A foundation manufacturer suggested during theworkshops that development of a standardised basesolution would deliver immediate savings related to designand engineering, together with progressive year on yearimprovements related to productivity.
Overall, feedback from industry indicates that a 5% reductionin support structure costs is possible by FID 2020 (resulting ina 0.7% reduction in LCOE), with first savings seen in FID 2014.
TurbinesAlthough material, the savings in the turbine area areexpected to be lower as the supply chain is more mature andsignificant levels of standardisation are already in place.
• Increased utilisation of existing production facilities andlarger procurement volumes could save up to 2% turbinecapital costs. Cost reductions from larger orders ofmaterials/equipment/services (say the equivalent of 100turbines) can range from 5 to 10%. Investment in newcapacity and in particular locating new manufacturingfacilities in the UK would also result in about 1% costsavings compared with imports from the rest of Europe.These savings are mainly in logistics and transport (asthese account for 1-2% of turbine manufacturing costs). A number of turbine manufacturers have announced theircommitment to the UK market and confirmed theirwillingness to build factories in the UK if there is greaterclarity over future volumes.
Overall savings in turbine costs due to asset growth andeconomies of scale of 3% are possible by 2020 (equivalent to a1% reduction in LCOE), with some benefits seen as early as FID 2014.
28
Offshore wind cost reduction pathways study
0% 10% 20% 30% 40% 50% 60% 70% 80% 90%
Gas CCGT
Offshore Wind
Nuclear PWR
Onshore Wind
Exhibit 3.21 Capital costs as a proportion of total levelised costs
Source: Finance work stream report, and Mott MacDonald, ‘UK Electricity Generation Costs Update’, June 2010
Note: Onshore wind, nuclear PWR and gas CCGT figure are for a project star�ng in 2013, 10% discount rate

Financing costs may well reduce slightlyFinancing is an important cost element
The initial capital cost of offshore wind (includingtransmission) currently account for about 70% of the LCOE ofoffshore wind.33 Exhibit 3.21shows that this proportion isvery similar to that of nuclearpower, but much greater than, for example, Gas CCGT.
As a result of the highproportion of front-up capitalcosts, financing cost play asignificant role in determiningLCOE and the quantities offunds required to deployoffshore wind are very high.
Holding all other factorsconstant, a one percentagepoint reduction in the cost ofcapital reduces the baselineLCOE by about 6% or £8/MWh.Future changes in the cost ofcapital could therefore have a significant impact on LCOE.
Availability of capital has an importantimpact prior to 2020
Exhibit 3.22 shows the cumulative funding requirements bystory based on the assumed deployment rate. A total of £52billion is needed by 2020 in the Technology Acceleration andSupply Chain Efficiency stories.34 This is heavily loaded towardsthe end of the decade, with £30bn required between 2017and 2020. The funding requirement rises to £68 billion by 2020in the Rapid Progress story, with an inflexion point in 2014.
Given the very high demand for funds made by offshore winddeployment, the availability of capital has a crucial impact onthe rate of build and the costs of finance.
In the UK to date, most projects have been funded purely bydevelopers’ equity through the construction phase; following
which some projects have been refinanced, generally 12-18months post-completion.35 This is driven by investors’perceptions of risk (see following section). Looking forward,we expect the funding structure of offshore wind farm projectsto change only slowly:
• Up to FID 2017, all construction work will be equityfinanced. As risk perceptions reduce, in FID 2020 up to
40% of the construction finance could be provided by amix of EIB / GIB, bank and mezzanine debt.
• We do not believe levels of post construction debt willincrease above current levels by FID 2020. In the storieswith a relatively higher level of technology risk(Technology Acceleration and Rapid Progression), debt levels will drop to 20-25% in FID 2014 and increase to30-40% by FID 2020.
• Debt in the form of project bonds will be only available inFID 2020. The offshore wind sector will need todemonstrate to investors that its financial profile matcheswhat they are seeking (eg long term, predictable cashflows) and that its risks (eg technology risk or outputvariability) are either at an acceptable level or can bemitigated. This demonstration will require significant timeand effort. Projects bonds widen the pool of funds thatoffshore wind farm financiers can draw upon, but do notsignificantly alter the costs of finance.
• With the availability of debt for offshore wind constructionlevels unlikely to rise significantly, the critical source offunding will be developer’s equity. To date about 50% ofthe developers’ equity has been drawn from UK basedvertically integrated utilities, 40% from European utilitiesand Independent Power Producers (IPPs), and 10% fromTurbine manufacturers.
• Our analysis shows, however, that the funding availablefrom the current set of developers is not sufficient to meetthe funding needs of any of the industry stories. Based onour developer future funding assumptions (see Futurefunding assumptions), we estimate a cumulative fundingshortfall to 2020 of between £7 billion in the SlowProgression story and £22 billion in the Rapid Progression story.
2933 For baseline 4MW-Class Turbine on site A, FID 2011. Includes transmission costs as part of the ini�al investment costs.34 Excluding funding for offshore transmission35 For the purposes of modelling the baseline FID 2011 project, we have assumed 100% equity funding at construc�on stage, with debt introduced only a�er about 18 months opera�on and at a low level of40% gearing.
-
10
20
30
40
50
60
70
80
2011 2012 2013 2014 2015 2016 2017 2018 2019 2020
Slow Progression Technology Accelera�on
Supply Chain Efficiency Rapid Growth
Cum
ula�
ve C
APE
X [£
bn]
Exhibit 3.22 Total cumulative CAPEX requirements by story (£bn, 2011) [excluding transmission assets]
Sour
ce: F
inan
ce w
ork
stre
am re
port
Future funding assump�ons
Key sources of funding Current share of UK offshore wind
Key assump�ons
UK ver�cally integrated u�li�es
50% • Very limited capacity to raise external funds and no significant growth in opera�onal cash flows before 2015
• Total UK capex held constant un�l 2015; increasing share allocated to offshore wind over period to 2020
European u�li�es / IPPs / oil and gas companies
40% • Con�nued interest in UK offshore wind provided financial returns remain compelling
• Assumed to retain current share of UK projects.
OEMs 10% • Con�nue to take minority shares in projects in order to help support sales of technology
Financial investors (pension, insurance and sovereign wealth funds, corporates)
<5% • Opera�onal projects only. Increasing appe�te, par�cularly post 2017 (replacement of RO-mechanism by feed-in tariff complete)
• Some corporate interest (including from Europe and other interna�onal
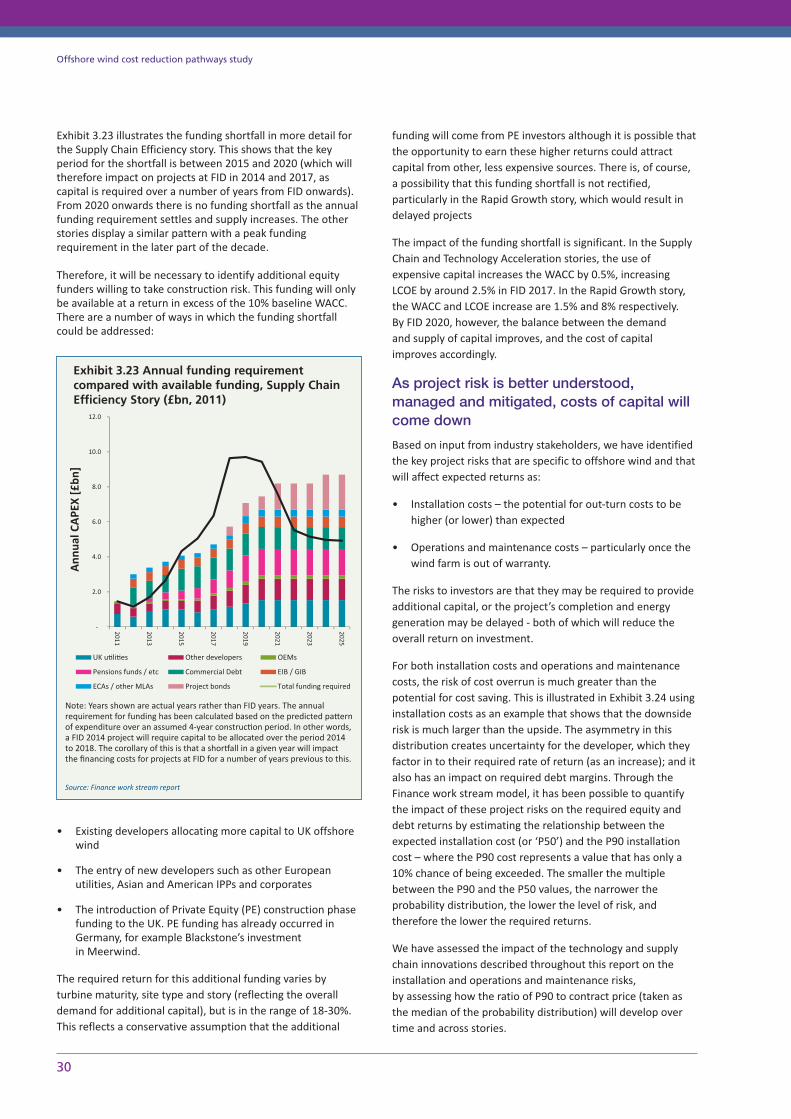
Exhibit 3.23 illustrates the funding shortfall in more detail forthe Supply Chain Efficiency story. This shows that the keyperiod for the shortfall is between 2015 and 2020 (which willtherefore impact on projects at FID in 2014 and 2017, ascapital is required over a number of years from FID onwards).From 2020 onwards there is no funding shortfall as the annualfunding requirement settles and supply increases. The otherstories display a similar pattern with a peak fundingrequirement in the later part of the decade.
Therefore, it will be necessary to identify additional equityfunders willing to take construction risk. This funding will onlybe available at a return in excess of the 10% baseline WACC.There are a number of ways in which the funding shortfallcould be addressed:
• Existing developers allocating more capital to UK offshorewind
• The entry of new developers such as other Europeanutilities, Asian and American IPPs and corporates
• The introduction of Private Equity (PE) construction phasefunding to the UK. PE funding has already occurred inGermany, for example Blackstone’s investment in Meerwind.
The required return for this additional funding varies byturbine maturity, site type and story (reflecting the overalldemand for additional capital), but is in the range of 18-30%.This reflects a conservative assumption that the additional
funding will come from PE investors although it is possible thatthe opportunity to earn these higher returns could attractcapital from other, less expensive sources. There is, of course,a possibility that this funding shortfall is not rectified,particularly in the Rapid Growth story, which would result indelayed projects
The impact of the funding shortfall is significant. In the SupplyChain and Technology Acceleration stories, the use ofexpensive capital increases the WACC by 0.5%, increasingLCOE by around 2.5% in FID 2017. In the Rapid Growth story,the WACC and LCOE increase are 1.5% and 8% respectively. By FID 2020, however, the balance between the demand and supply of capital improves, and the cost of capitalimproves accordingly.
As project risk is better understood,managed and mitigated, costs of capital willcome down
Based on input from industry stakeholders, we have identifiedthe key project risks that are specific to offshore wind and thatwill affect expected returns as:
• Installation costs – the potential for out-turn costs to behigher (or lower) than expected
• Operations and maintenance costs – particularly once thewind farm is out of warranty.
The risks to investors are that they may be required to provideadditional capital, or the project’s completion and energygeneration may be delayed - both of which will reduce theoverall return on investment.
For both installation costs and operations and maintenancecosts, the risk of cost overrun is much greater than thepotential for cost saving. This is illustrated in Exhibit 3.24 usinginstallation costs as an example that shows that the downsiderisk is much larger than the upside. The asymmetry in thisdistribution creates uncertainty for the developer, which theyfactor in to their required rate of return (as an increase); and italso has an impact on required debt margins. Through theFinance work stream model, it has been possible to quantifythe impact of these project risks on the required equity anddebt returns by estimating the relationship between theexpected installation cost (or ‘P50’) and the P90 installationcost – where the P90 cost represents a value that has only a10% chance of being exceeded. The smaller the multiplebetween the P90 and the P50 values, the narrower theprobability distribution, the lower the level of risk, andtherefore the lower the required returns.
We have assessed the impact of the technology and supplychain innovations described throughout this report on theinstallation and operations and maintenance risks, by assessing how the ratio of P90 to contract price (taken asthe median of the probability distribution) will develop overtime and across stories.
30
Offshore wind cost reduction pathways study
-
2.0
4.0
6.0
8.0
10.0
12.0
2011
2013
2015
2017
2019
2021
2023
2025
UK u�li�es Other developers OEMs
Pensions funds / etc Commercial Debt EIB / GIB
ECAs / other MLAs Project bonds Total funding required
Ann
ual C
APE
X [£
bn]
Exhibit 3.23 Annual funding requirementcompared with available funding, Supply ChainEfficiency Story (£bn, 2011)
Source: Finance work stream report
Note: Years shown are actual years rather than FID years. The annual requirement for funding has been calculated based on the predicted pa�ernof expenditure over an assumed 4-year construc�on period. In other words,a FID 2014 project will require capital to be allocated over the period 2014to 2018. The corollary of this is that a shor�all in a given year will impactthe financing costs for projects at FID for a number of years previous to this.
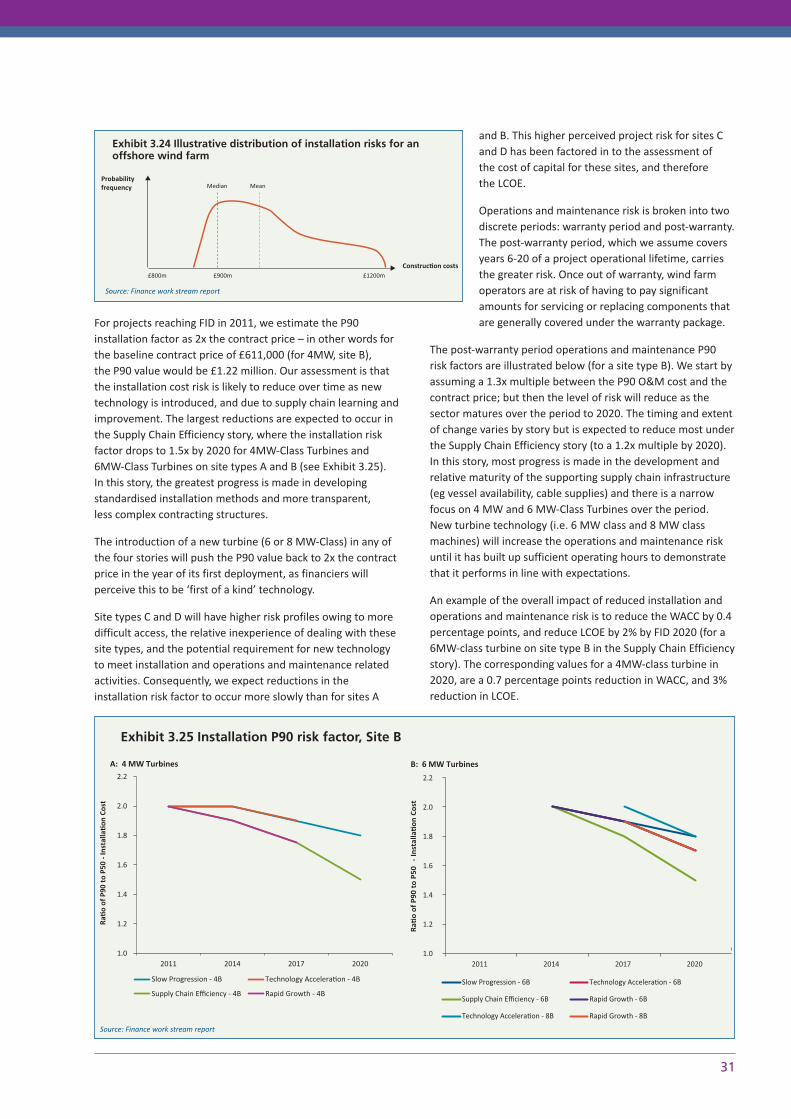
For projects reaching FID in 2011, we estimate the P90installation factor as 2x the contract price – in other words forthe baseline contract price of £611,000 (for 4MW, site B), the P90 value would be £1.22 million. Our assessment is thatthe installation cost risk is likely to reduce over time as newtechnology is introduced, and due to supply chain learning andimprovement. The largest reductions are expected to occur inthe Supply Chain Efficiency story, where the installation riskfactor drops to 1.5x by 2020 for 4MW-Class Turbines and6MW-Class Turbines on site types A and B (see Exhibit 3.25). In this story, the greatest progress is made in developingstandardised installation methods and more transparent, less complex contracting structures.
The introduction of a new turbine (6 or 8 MW-Class) in any ofthe four stories will push the P90 value back to 2x the contractprice in the year of its first deployment, as financiers willperceive this to be ‘first of a kind’ technology.
Site types C and D will have higher risk profiles owing to moredifficult access, the relative inexperience of dealing with thesesite types, and the potential requirement for new technologyto meet installation and operations and maintenance relatedactivities. Consequently, we expect reductions in theinstallation risk factor to occur more slowly than for sites A
and B. This higher perceived project risk for sites Cand D has been factored in to the assessment of the cost of capital for these sites, and therefore the LCOE.
Operations and maintenance risk is broken into two discrete periods: warranty period and post-warranty. The post-warranty period, which we assume coversyears 6-20 of a project operational lifetime, carriesthe greater risk. Once out of warranty, wind farmoperators are at risk of having to pay significantamounts for servicing or replacing components thatare generally covered under the warranty package.
The post-warranty period operations and maintenance P90risk factors are illustrated below (for a site type B). We start byassuming a 1.3x multiple between the P90 O&M cost and thecontract price; but then the level of risk will reduce as thesector matures over the period to 2020. The timing and extentof change varies by story but is expected to reduce most underthe Supply Chain Efficiency story (to a 1.2x multiple by 2020).In this story, most progress is made in the development andrelative maturity of the supporting supply chain infrastructure(eg vessel availability, cable supplies) and there is a narrowfocus on 4 MW and 6 MW-Class Turbines over the period. New turbine technology (i.e. 6 MW class and 8 MW classmachines) will increase the operations and maintenance riskuntil it has built up sufficient operating hours to demonstratethat it performs in line with expectations.
An example of the overall impact of reduced installation andoperations and maintenance risk is to reduce the WACC by 0.4percentage points, and reduce LCOE by 2% by FID 2020 (for a6MW-class turbine on site type B in the Supply Chain Efficiencystory). The corresponding values for a 4MW-class turbine in2020, are a 0.7 percentage points reduction in WACC, and 3%reduction in LCOE.
31
Probabilityfrequency
Construc�on costs£800m £900m £1200m
MeanMedian
Exhibit 3.24 Illustrative distribution of installation risks for anoffshore wind farm
Source: Finance work stream report
1.0
1.2
1.4
1.6
1.8
2.0
2.2
2011 2014 2017 2020
Ra�
o of
P90
to
P50
- Ins
talla
�on
Cos
t
Slow Progression - 4B Technology Accelera�on - 4B
Supply Chain Efficiency - 4B Rapid Growth - 4B
A: 4 MW Turbines
1.0
1.2
1.4
1.6
1.8
2.0
2.2
2011 2014 2017 2020
Ra�
o of
P90
to
P50
- In
stal
la�
on C
ost
Slow Progression - 6B Technology Accelera�on - 6B
Supply Chain Efficiency - 6B Rapid Growth - 6B
Technology Accelera�on - 8B Rapid Growth - 8B
B: 6 MW Turbines
Exhibit 3.25 Installation P90 risk factor, Site B
Source: Finance work stream report

Policy changes will reduce the costs of finance
As part of the proposals contained in the UK government’s2011 Electricity Market Reform White Paper, the RenewablesObligation is expected to be replaced by a feed-in tariffmechanism that would pay generators of low carbonelectricity a fixed price per unit of output. The rationalebehind this proposal is that it will reduce the overall risk ofinvesting in projects by removing some of the priceuncertainty under the Renewable Obligation framework. Anysuch reduction in systematic risk should be reflected in a lowercost of equity and hence a lower WACC. The reduction in riskwill also help attract new classes of investor, such as pensionfunds, particularly to operational assets, thereby allowingdevelopers to recycle their equity for other projects.
On the other hand, a feed-in tariff will remove the potentialfor equity holders to benefit from any upside from risingpower prices, a benefit they currently derive under theRenewables Obligation framework. Some market participantshave suggested that removing this upside reduces the overallattractiveness of investing in offshore wind. Therefore anyreduction in price risk could be partially offset by the additionof an equity premium. On balance, we expect that theintroduction of a feed-in tariff mechanism will reduce the costof equity by 0.5 percentage points based on a reduction in theasset beta from 0.6 to 0.5.36 Although the feed-in tariff will beavailable from FID 2014 onwards, it will take time before themarket fully incorporates the full reduction in risk into the cost
of capital; as a result the change in the asset beta is appliedonly to projects reaching FID from 2017 onwards.
New technologies will increase the costs of finance
The introduction of new technology increases risk until itdemonstrates performance in line with expectations. The uplift in WACC needed to compensate for this extra riskwill depend on a number of factors including the track recordof the technology developer, the strength and credibility ofperformance guarantees and the degree of testing of the technology.
Exhibit 3.27 compares the WACC of a 4MW-Class Turbinereaching FID in 2014, with a newly introduced 6MW-Class-Turbine both on site B. This shows that theintroduction of a new turbine is expected to increase WACC by0.5 percentage points.The LCOE impact of the WACC uplift isabout £4/MWh. This uplift will erode with time and by FID2020 is expected to be 0.2% percentage points or equivalentto around £1.5/MWh.
Overall costs of finance will drop by aroundone percentage point
Exhibit 3.28 illustrates the effect of the above changes on theWACC of the workhorse turbine, starting with a 4MW-ClassTurbine in FID 2011 and ending with a 6MW-Class Turbine inFID 2020 (site B, Supply Chain Efficiency story).
The WACC of the workhorse turbine only shows a smalldecrease from 10.2% in FID 2011 to 9.8% in FID 2017. The reduction in WACC from the policy change to a feed-in-tariff and lower installation and operations and maintenancerisk is counterbalanced by the increases in WACC due to theincrease in returns required to rectify the funding shortfall andan increase in technology related risk.
A more substantial reduction in WACC is expected betweenFID 2017 and FID 2020 because of the elimination of thefunding shortfall and reduced technology and installation andoperations and maintenance risk as the 6MW-Class Turbinematures further.
32 36 See sec�on 4, finance work stream report
Offshore wind cost reduction pathways study
WA
CC
9.5%
10.0%
10.5%
11.0%
4MW-Class Turbine 6MW-Class Turbine
0.5% WACC upli� new technology risk premium
Exhibit 3.27 Weighted average cost of capital by turbineclass, site B, FID 2014, Slow Progression story
Source: Finance work stream report
1.0
1.1
1.2
1.3
1.4
2011 2014 2017 2020
Ra�
o of
P90
to
P50
- O&
M c
ost
Slow Progression - 4B Technology Accelera�on - 4B
Supply Chain Efficiency - 4B Rapid Growth - 4B
A: 4 MW Turbines
1.0
1.1
1.2
1.3
1.4
2011 2014 2017 2020
Ra�
o of
P90
to
P50
- O&
M c
ost
Slow Progression - 6B Technology Accelera�on - 6B
Supply Chain Efficiency - 6B Rapid Growth - 6B
Technology Accelera�on - 8B Rapid Growth - 8B
B: 6 MW Turbines
Exhibit 3.26 Post-warranty operations and maintenanceP90 risk factor, site B
Source: Finance work stream report
Note: Post-tax nominal
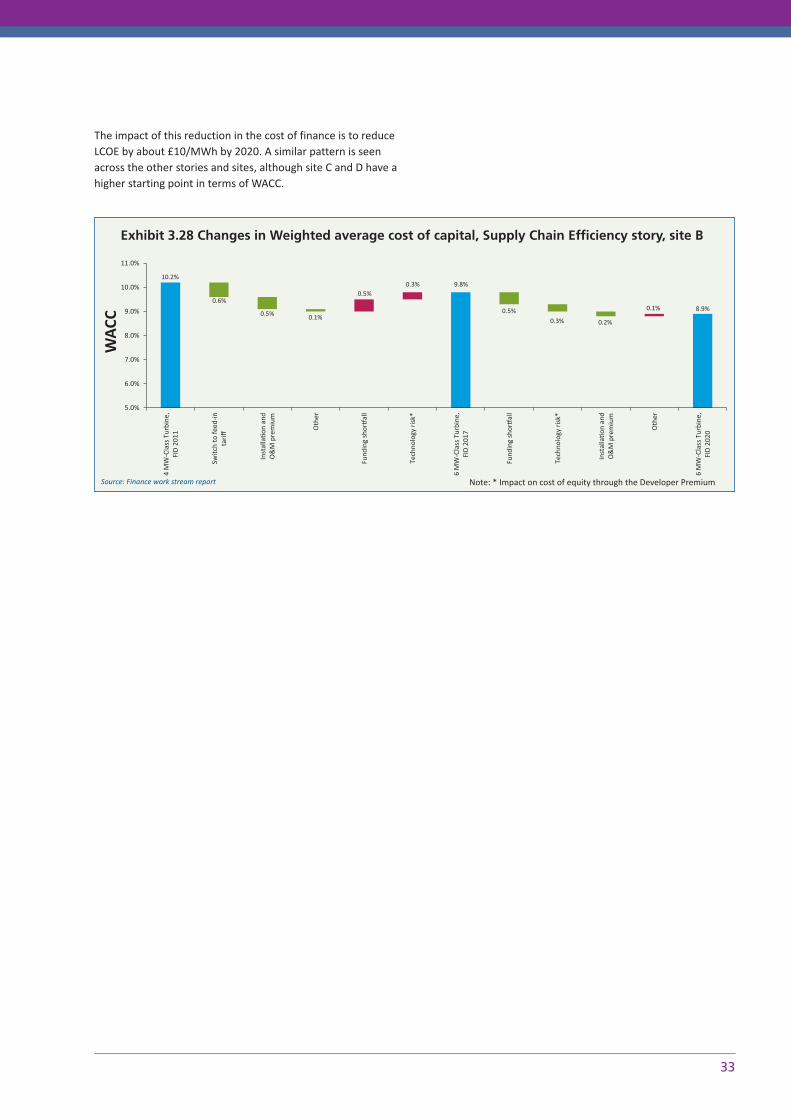
The impact of this reduction in the cost of finance is to reduceLCOE by about £10/MWh by 2020. A similar pattern is seenacross the other stories and sites, although site C and D have ahigher starting point in terms of WACC.
33
0.6%
0.5% 0.1% 0.5%
0.3% 0.2%
0.5%
0.3%
0.1%
10.2%
9.8%
8.9%
5.0%
6.0%
7.0%
8.0%
9.0%
10.0%
11.0%
4 M
W-C
lass
Tur
bine
,FI
D 2
011
Switc
h to
feed
-inta
riff
Inst
alla
�on
and
O&
M p
rem
ium
Oth
er
Fund
ing
shor
�al
l
Tech
nolo
gy r
isk*
6 M
W-C
lass
Tur
bine
,FI
D 2
017
Fund
ing
shor
�al
l
Tech
nolo
gy r
isk*
Inst
alla
�on
and
O&
M p
rem
ium
Oth
er
6 M
W-C
lass
Tur
bine
,FI
D 2
020
WA
CC
Exhibit 3.28 Changes in Weighted average cost of capital, Supply Chain Efficiency story, site B
Source: Finance work stream report Note: * Impact on cost of equity through the Developer Premium

Although not a core part of thisstudy, we believe there areopportunities to reducetransmission costsElectricity transmission infrastructure typically accounts foraround 15-20% of the capital costs of developing an offshorewind farm (equivalent to 10-15% of the LCOE). To date,transmission infrastructure has been developed by wind farmdevelopers as part of integrated projects. Given the licensingrequirements in the Electricity Act 1989 however, followingcommissioning, these assets must then be transferred to athird party (OFTO) via a competitive tender process run byOfgem. Given the range of current policy initiatives – includingin terms of network coordination,transmission charging andinterconnectors – there is a uncertaintyabout the future policy framework foroffshore transmission. For thesereasons, transmission was not includedas a core part of this study.Nevertheless, despite this challengingbackdrop, work undertaken byRenewableUK has identified that thereare opportunities to reduce the cost oftransmission over the short to medium term.
The workshop approach for consideringtransmission cost reductionopportunities took both a ‘bottom up‘and ‘top down‘ perspective. Under thebottom up approach, 11 priority costreduction opportunities were identifiedand it is clear that that the potential forcost reductions derives from a widerange of sources, such as:
• reduced capital costs;
• reduced risk (thereby reducing cost of capital);
• shorter development and construction periods (therebyreducing financing costs);
• lower O&M costs; and
• reducing plant depreciation costs (by extending asset lives).
The outcome of this process yielded a range of potentialcapital costs reductions of between 27-63%. It is highlyunlikely that this cumulative total would be achievable. It is important to note, however, that each opportunity wasreviewed on its own merits and no explicit consideration wasgiven to whether any of the opportunities were mutuallyexclusive or co-dependent. This will be an important future step.
The top down approach considered potential cost reductionfrom the viewpoint of a likely trajectory of transmission coststo 2020 for two hypothetical wind farm projects (one nearshore AC connected project and one far shore HVDC
connected project). This was a separate exercise from thebottom up approach and provides an alternative perspectiveon cost reduction potential.
For each project, key assumptions were made about thenetwork design based on the example configurations providedin the 2011 ODIS.37 Baseline costs for 2011 were then assumedfor the main assets of these network designs, where possibleusing information in the public domain.38 The workshopapproach was to consider a trajectory of costs at intervals to 2020, based on participants’ expectations of futuredevelopments. The RenewableUK report identifies a costreduction range of between 5.5-11.5% for the near shoreproject and around 14% for the far shore project. Exhibit 3.29 illustrates the potential cost trajectory for the farshore HVDC project.
Key reasons identified for the potential cost reduction trendsincluded:
• greater standardisation, for example with respect toplatform design,
• technology improvements,
• improved installation techniques, for example for cabling,
• more suppliers in the market, and
• improved risk management processes
The process followed to uncover cost reduction opportunitiesin transmission was much more limited than for other parts ofthe value chain and so the results must be considered asillustrative and qualitative only at this stage. It is alsorecognised that there is also work ongoing on some of theissues identified, for example in terms of encouraging networkcoordination and further development of the OFTO regime.
Nevertheless, the opportunities and indicative cost reductionsidentified are important ‘signposts‘ as to where detailed followup should be focused in order to understand the likelihood ofrealising the opportunity.
34 37 Appendix 1 of Na�onal Grid (2011) Offshore Development Informa�on Statement38 Capital costs largely from Na�onal Grid (2011) ODIS; financing and development costs based on OFTO transac�ons completed to date.te
Offshore wind cost reduction pathways study
0
100
200
300
400
500
600
700
FID 2011 FID 2014 FID 2017 FID 2020
Development costs
Financing costs
Onshore AC components
Offshore AC component
Offshore DC pla�orm
Offshore cable and installa�on
Onshore converter
Offshore converter
Cap
ital
Co
st (
£ms)
Exhibit 3.29: Potential cost trajectory for hypothetical far shore project (2011 prices)
Source: RenewableUK report
35
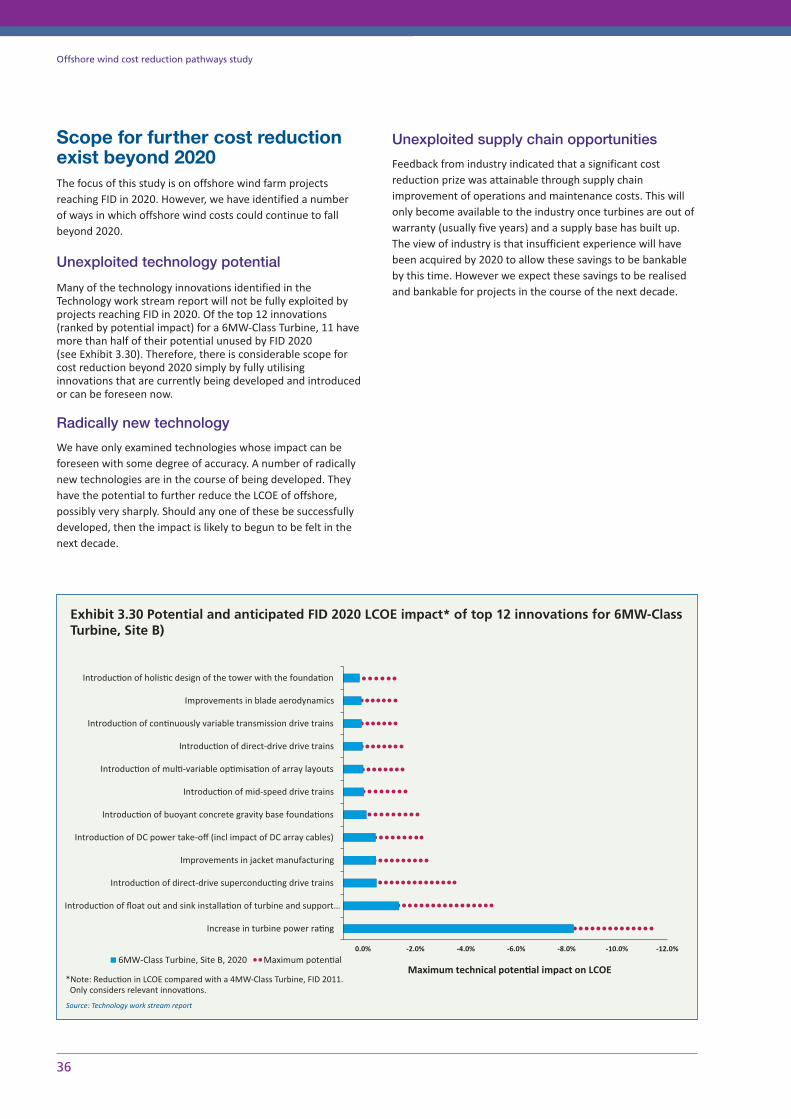
Scope for further cost reductionexist beyond 2020The focus of this study is on offshore wind farm projectsreaching FID in 2020. However, we have identified a number of ways in which offshore wind costs could continue to fallbeyond 2020.
Unexploited technology potential
Many of the technology innovations identified in theTechnology work stream report will not be fully exploited byprojects reaching FID in 2020. Of the top 12 innovations(ranked by potential impact) for a 6MW-Class Turbine, 11 havemore than half of their potential unused by FID 2020 (see Exhibit 3.30). Therefore, there is considerable scope forcost reduction beyond 2020 simply by fully utilisinginnovations that are currently being developed and introducedor can be foreseen now.
Radically new technology
We have only examined technologies whose impact can beforeseen with some degree of accuracy. A number of radicallynew technologies are in the course of being developed. Theyhave the potential to further reduce the LCOE of offshore,possibly very sharply. Should any one of these be successfullydeveloped, then the impact is likely to begun to be felt in thenext decade.
Unexploited supply chain opportunities
Feedback from industry indicated that a significant costreduction prize was attainable through supply chainimprovement of operations and maintenance costs. This willonly become available to the industry once turbines are out ofwarranty (usually five years) and a supply base has built up.The view of industry is that insufficient experience will havebeen acquired by 2020 to allow these savings to be bankableby this time. However we expect these savings to be realisedand bankable for projects in the course of the next decade.
36
Offshore wind cost reduction pathways study
Increase in turbine power ra�ng
Introduc�on of float out and sink installa�on of turbine and support…
Introduc�on of direct-drive superconduc�ng drive trains
Improvements in jacket manufacturing
Introduc�on of DC power take-off (incl impact of DC array cables)
Introduc�on of buoyant concrete gravity base founda�ons
Introduc�on of mid-speed drive trains
Introduc�on of mul�-variable op�misa�on of array layouts
Introduc�on of direct-drive drive trains
Introduc�on of con�nuously variable transmission drive trains
Improvements in blade aerodynamics
Introduc�on of holis�c design of the tower with the founda�on
6MW-Class Turbine, Site B, 2020 Maximum poten�al0.0% -2.0% -4.0% -6.0% -8.0% -10.0% -12.0%
Maximum technical poten�al impact on LCOE
Exhibit 3.30 Potential and anticipated FID 2020 LCOE impact* of top 12 innovations for 6MW-ClassTurbine, Site B)
Source: Technology work stream report
*Note: Reduc�on in LCOE compared with a 4MW-Class Turbine, FID 2011. Only considers relevant innova�ons.
371 Footnote
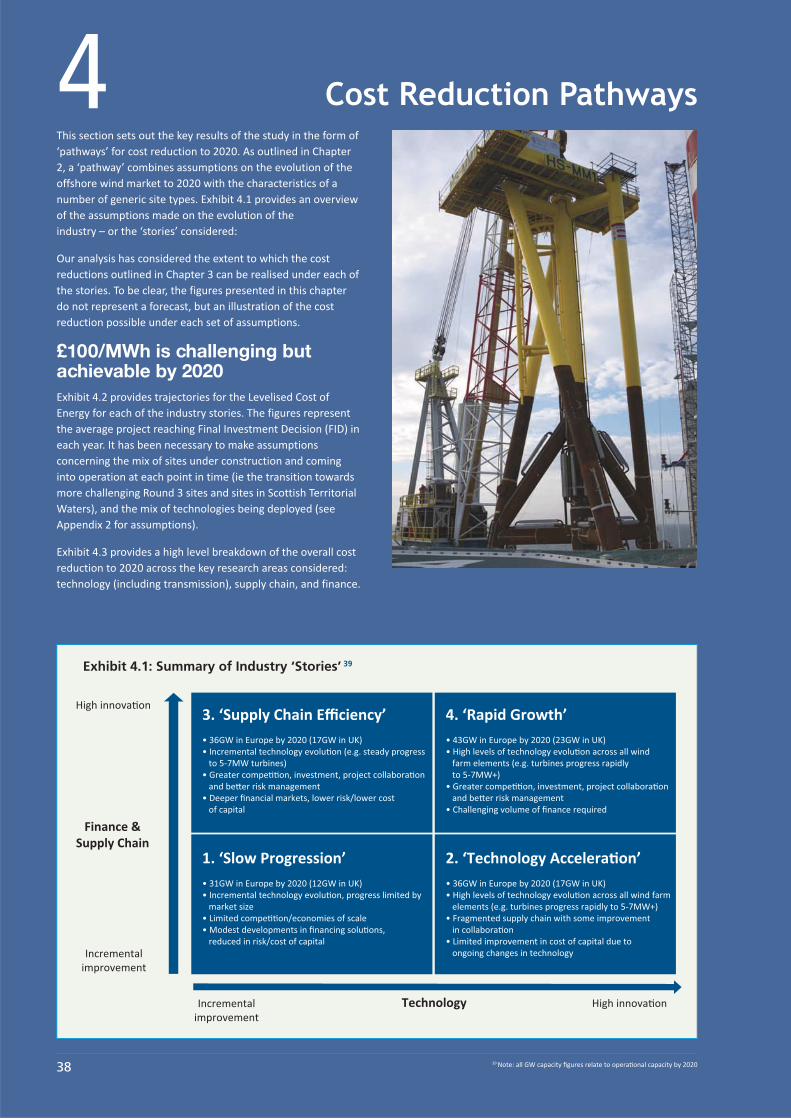
This section sets out the key results of the study in the form of‘pathways’ for cost reduction to 2020. As outlined in Chapter2, a ‘pathway’ combines assumptions on the evolution of theoffshore wind market to 2020 with the characteristics of anumber of generic site types. Exhibit 4.1 provides an overviewof the assumptions made on the evolution of the industry – or the ‘stories’ considered:
Our analysis has considered the extent to which the costreductions outlined in Chapter 3 can be realised under each ofthe stories. To be clear, the figures presented in this chapterdo not represent a forecast, but an illustration of the costreduction possible under each set of assumptions.
£100/MWh is challenging butachievable by 2020Exhibit 4.2 provides trajectories for the Levelised Cost ofEnergy for each of the industry stories. The figures representthe average project reaching Final Investment Decision (FID) ineach year. It has been necessary to make assumptionsconcerning the mix of sites under construction and cominginto operation at each point in time (ie the transition towardsmore challenging Round 3 sites and sites in Scottish TerritorialWaters), and the mix of technologies being deployed (seeAppendix 2 for assumptions).
Exhibit 4.3 provides a high level breakdown of the overall costreduction to 2020 across the key research areas considered:technology (including transmission), supply chain, and finance.
38 39 Note: all GW capacity figures relate to opera�onal capacity by 2020
3. ‘Supply Chain Efficiency’• 36GW in Europe by 2020 (17GW in UK)• Incremental technology evolu�on (e.g. steady progress to 5-7MW turbines)• Greater compe��on, investment, project collabora�on and be�er risk management• Deeper financial markets, lower risk/lower cost of capital
High innova�on
High innova�on
Incrementalimprovement
Incrementalimprovement
Finance &Supply Chain
Technology
4. ‘Rapid Growth’• 43GW in Europe by 2020 (23GW in UK)• High levels of technology evolu�on across all wind farm elements (e.g. turbines progress rapidly to 5-7MW+)• Greater compe��on, investment, project collabora�on and be�er risk management• Challenging volume of finance required
1. ‘Slow Progression’ • 31GW in Europe by 2020 (12GW in UK)• Incremental technology evolu�on, progress limited by market size• Limited compe��on/economies of scale• Modest developments in financing solu�ons, reduced in risk/cost of capital
2. ‘Technology Accelera�on’• 36GW in Europe by 2020 (17GW in UK)• High levels of technology evolu�on across all wind farm elements (e.g. turbines progress rapidly to 5-7MW+)• Fragmented supply chain with some improvement in collabora�on• Limited improvement in cost of capital due to ongoing changes in technology
Exhibit 4.1: Summary of Industry ‘Stories’ 39
Cost Reduction Pathways4
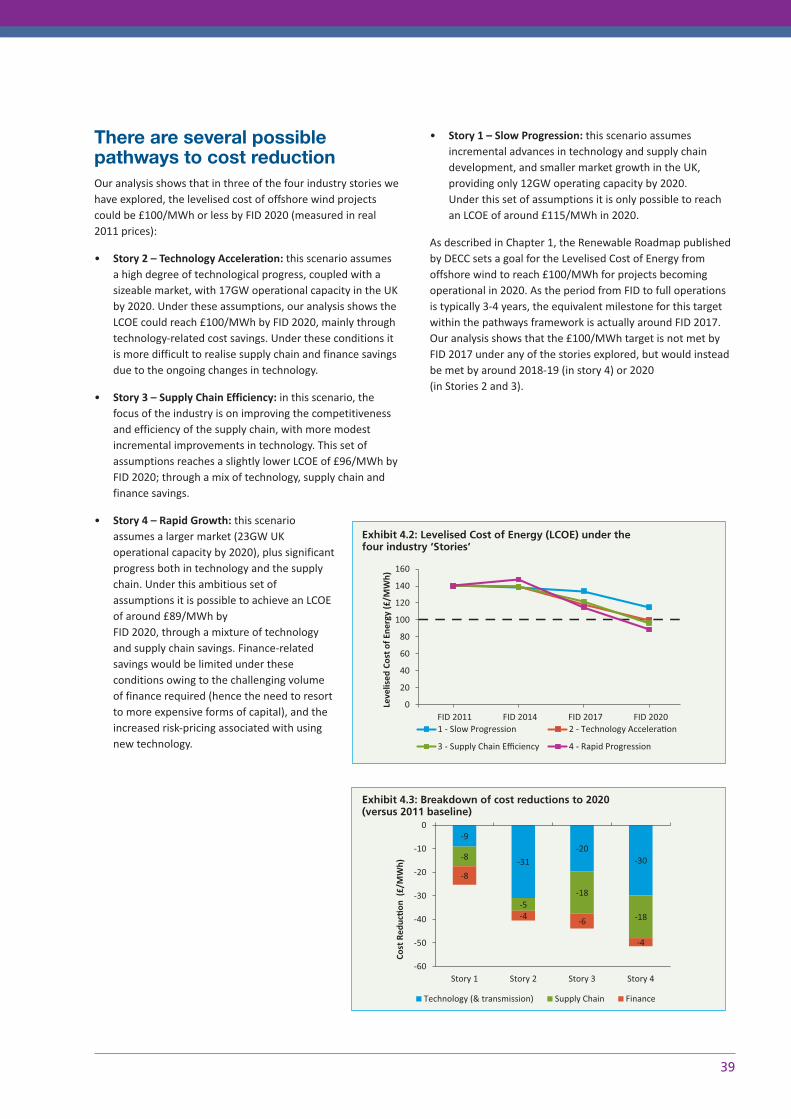
There are several possiblepathways to cost reductionOur analysis shows that in three of the four industry stories wehave explored, the levelised cost of offshore wind projectscould be £100/MWh or less by FID 2020 (measured in real2011 prices):
• Story 2 – Technology Acceleration: this scenario assumesa high degree of technological progress, coupled with asizeable market, with 17GW operational capacity in the UKby 2020. Under these assumptions, our analysis shows theLCOE could reach £100/MWh by FID 2020, mainly throughtechnology-related cost savings. Under these conditions itis more difficult to realise supply chain and finance savingsdue to the ongoing changes in technology.
• Story 3 – Supply Chain Efficiency: in this scenario, thefocus of the industry is on improving the competitivenessand efficiency of the supply chain, with more modestincremental improvements in technology. This set ofassumptions reaches a slightly lower LCOE of £96/MWh byFID 2020; through a mix of technology, supply chain andfinance savings.
• Story 4 – Rapid Growth: this scenarioassumes a larger market (23GW UKoperational capacity by 2020), plus significantprogress both in technology and the supplychain. Under this ambitious set ofassumptions it is possible to achieve an LCOEof around £89/MWh by FID 2020, through a mixture of technologyand supply chain savings. Finance-relatedsavings would be limited under theseconditions owing to the challenging volumeof finance required (hence the need to resortto more expensive forms of capital), and theincreased risk-pricing associated with usingnew technology.
• Story 1 – Slow Progression: this scenario assumesincremental advances in technology and supply chaindevelopment, and smaller market growth in the UK,providing only 12GW operating capacity by 2020. Under this set of assumptions it is only possible to reachan LCOE of around £115/MWh in 2020.
As described in Chapter 1, the Renewable Roadmap publishedby DECC sets a goal for the Levelised Cost of Energy fromoffshore wind to reach £100/MWh for projects becomingoperational in 2020. As the period from FID to full operationsis typically 3-4 years, the equivalent milestone for this targetwithin the pathways framework is actually around FID 2017.Our analysis shows that the £100/MWh target is not met byFID 2017 under any of the stories explored, but would insteadbe met by around 2018-19 (in story 4) or 2020 (in Stories 2 and 3).
39
0
20
40
60
80
100
120
140
160
FID 2011 FID 2014 FID 2017 FID 2020
Leve
lised
Cos
t of
Ene
rgy
(£/M
Wh)
1 - Slow Progression 2 - Technology Accelera�on
3 - Supply Chain Efficiency 4 - Rapid Progression
Exhibit 4.2: Levelised Cost of Energy (LCOE) under thefour industry ‘Stories’
-9
-31 -20
-30 -8
-5 -18
-18
-8
-4 -6
-4
-60
-50
-40
-30
-20
-10
0
Story 1 Story 2 Story 3 Story 4
Cost
Red
uc�
on (
£/M
Wh)
Technology (& transmission) Supply Chain Finance
Exhibit 4.3: Breakdown of cost reductions to 2020(versus 2011 baseline)

Key assumptionsThis story explores what would happen if the industry goes down a technology-driven route. The feedback from participantsthrough this project was that though rapid technology progress may lead to cost reduction in itself, it may also limit savings andprogress in terms of the supply chain and finance. This is due to a concern that the supply chain would remain fragmented (withlimited economies of scale or standardisation), and it would take longer for financiers to become accustomed with the risk profile ofeach new technology as it is introduced. Key assumptions of this story are as follows:
40
Story 2: Technology Acceleration
•Progressive shi� to larger turbines, improved yield, greater reliability
•5-7MW turbines dominate by 2020, plus uptake of larger machines (7-9MW range)
•Op�mised design and wind farm layout
•Innova�on in support structures, installa�on and O&M processes
Technology
•36GW opera�ng in Europe by 2020 (17GW in UK)
•Diverse/fragmented supply chain
•Some economies of scale •Modest improvement in ver�cal collabora�on
Supply Chain •£52bn of new finance required from 2011-20
•Takes �me for investors to 'get comfortable' with new technology; resul�ng in higher risk pricing
•Constraints in availability of low-cost equity finance in 2014/17
•Depth of insurance markets increases
Finance
Exhibit 4.4: Story 2 Key Assumptions
0
5
10
15
20
25
30
35
40
45
50
2010
2011
2012
2013
2014
2015
2016
2017
2018
2019
2020
2021
2022
2023
2024
2025
Cum
ula�
ve C
apac
ity
(GW
)
Capacity achieved FID
Opera�onal Capacity
Exhibit 4.5: Story 2 Capacity Trajectory
0
1
2
3
4
5
6
7
8
0%
10%
20%
30%
40%
50%
60%
70%
80%
90%
100%
FID 2011 FID 2014 FID 2017 FID 2020
Ave
rage
Tur
bine
Siz
e (M
W)
Shar
e of
Tur
bine
Mar
ket
3-5MW 5-7MW 7-9MW Average turbine size
Exhibit 4.6: Story 2 Turbine Mix
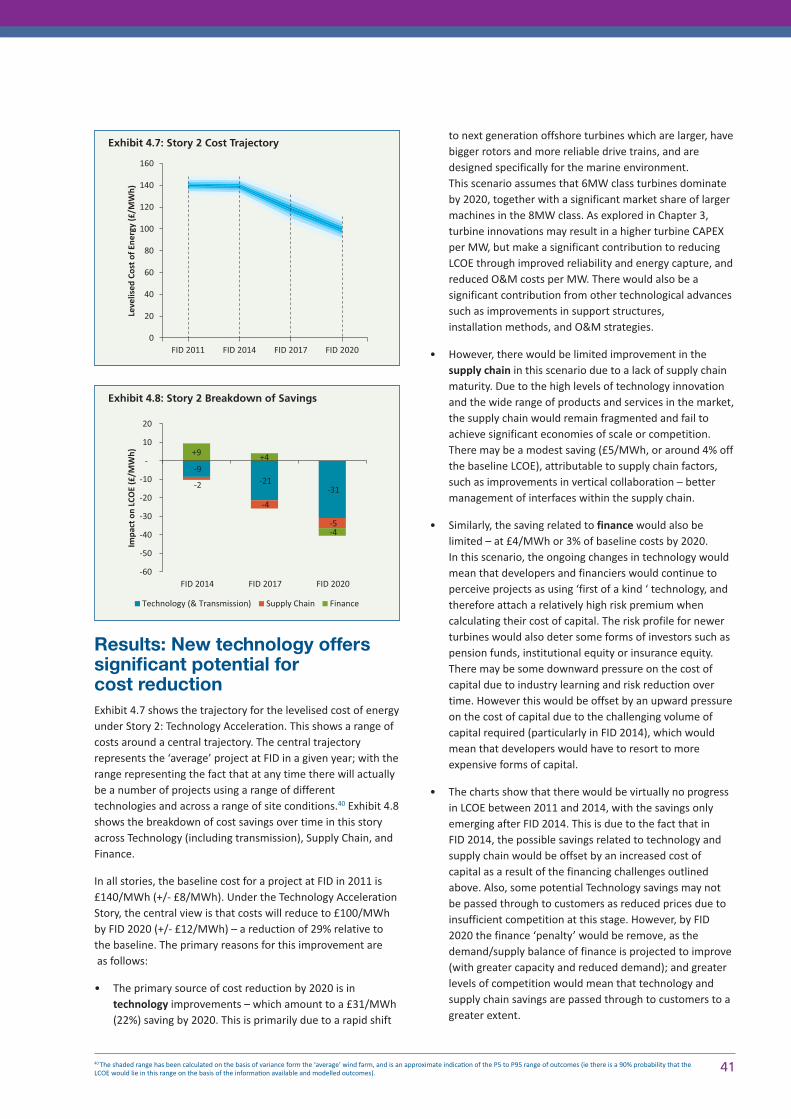
Results: New technology offerssignificant potential for cost reductionExhibit 4.7 shows the trajectory for the levelised cost of energyunder Story 2: Technology Acceleration. This shows a range ofcosts around a central trajectory. The central trajectoryrepresents the ‘average’ project at FID in a given year; with therange representing the fact that at any time there will actuallybe a number of projects using a range of differenttechnologies and across a range of site conditions.40 Exhibit 4.8shows the breakdown of cost savings over time in this storyacross Technology (including transmission), Supply Chain, andFinance.
In all stories, the baseline cost for a project at FID in 2011 is£140/MWh (+/- £8/MWh). Under the Technology AccelerationStory, the central view is that costs will reduce to £100/MWhby FID 2020 (+/- £12/MWh) – a reduction of 29% relative tothe baseline. The primary reasons for this improvement are as follows:
• The primary source of cost reduction by 2020 is intechnology improvements – which amount to a £31/MWh(22%) saving by 2020. This is primarily due to a rapid shift
to next generation offshore turbines which are larger, havebigger rotors and more reliable drive trains, and aredesigned specifically for the marine environment. This scenario assumes that 6MW class turbines dominateby 2020, together with a significant market share of largermachines in the 8MW class. As explored in Chapter 3,turbine innovations may result in a higher turbine CAPEXper MW, but make a significant contribution to reducingLCOE through improved reliability and energy capture, andreduced O&M costs per MW. There would also be asignificant contribution from other technological advancessuch as improvements in support structures, installation methods, and O&M strategies.
• However, there would be limited improvement in thesupply chain in this scenario due to a lack of supply chainmaturity. Due to the high levels of technology innovationand the wide range of products and services in the market,the supply chain would remain fragmented and fail toachieve significant economies of scale or competition.There may be a modest saving (£5/MWh, or around 4% offthe baseline LCOE), attributable to supply chain factors,such as improvements in vertical collaboration – bettermanagement of interfaces within the supply chain.
• Similarly, the saving related to finance would also belimited – at £4/MWh or 3% of baseline costs by 2020. In this scenario, the ongoing changes in technology wouldmean that developers and financiers would continue toperceive projects as using ‘first of a kind ‘ technology, andtherefore attach a relatively high risk premium whencalculating their cost of capital. The risk profile for newerturbines would also deter some forms of investors such aspension funds, institutional equity or insurance equity.There may be some downward pressure on the cost ofcapital due to industry learning and risk reduction overtime. However this would be offset by an upward pressureon the cost of capital due to the challenging volume ofcapital required (particularly in FID 2014), which wouldmean that developers would have to resort to moreexpensive forms of capital.
• The charts show that there would be virtually no progressin LCOE between 2011 and 2014, with the savings onlyemerging after FID 2014. This is due to the fact that in FID 2014, the possible savings related to technology andsupply chain would be offset by an increased cost ofcapital as a result of the financing challenges outlinedabove. Also, some potential Technology savings may notbe passed through to customers as reduced prices due toinsufficient competition at this stage. However, by FID2020 the finance ‘penalty’ would be remove, as thedemand/supply balance of finance is projected to improve(with greater capacity and reduced demand); and greaterlevels of competition would mean that technology andsupply chain savings are passed through to customers to agreater extent.
4140 The shaded range has been calculated on the basis of variance form the ‘average’ wind farm, and is an approximate indica�on of the P5 to P95 range of outcomes (ie there is a 90% probability that theLCOE would lie in this range on the basis of the informa�on available and modelled outcomes).
0
20
40
60
80
100
120
140
160
FID 2011 FID 2014 FID 2017 FID 2020
Leve
lised
Cos
t of
Ene
rgy
(£/M
Wh)
Exhibit 4.7: Story 2 Cost Trajectory
-9 -21
-31 -2
-4
-5
+9 +4
-4
-60
-50
-40
-30
-20
-10
-
10
20
FID 2014 FID 2017 FID 2020
Impa
ct o
n LC
OE
(£/M
Wh)
Technology (& Transmission) Supply Chain Finance
Exhibit 4.8: Story 2 Breakdown of Savings

Story 3: Supply Chain EfficiencyKey assumptionsThis story explores what would happen if the industry focuses on maximising improvements and efficiencies in the supply chain –such as realising economies of scale, attracting new entrants to the market to create competition, and increasing collaboration. In this scenario, it would still be possible to make some improvement in technology (albeit not as rapidly as in Story 2); and there issignificant scope for improvement in the finance and insurance markets, as financiers and developers get comfortable with thetechnology and risk is reduced.
42
0
5
10
15
20
25
30
35
40
45
50
2010
2011
2012
2013
2014
2015
2016
2017
2018
2019
2020
2021
2022
2023
2024
2025
Cum
ula�
ve C
apac
ity
(GW
)
Capacity achieved FID
Opera�onal Capacity
Exhibit 4.10: Story 3 Capacity Trajectory
0
1
2
3
4
5
6
7
8
0%
10%
20%
30%
40%
50%
60%
70%
80%
90%
100%
FID 2011 FID 2014 FID 2017 FID 2020
Ave
rage
Tur
bine
Siz
e (M
W)
Shar
e of
Tur
bine
Mar
ket
3-5MW 5-7MW 7-9MW Average turbine size
Exhibit 4.11: Story 3 Turbine Mix
•Progressive shi� to larger turbines, improved yield, greater reliability
•5-7MW turbines dominate by 2020, plus uptake of larger machines (7-9MW range)
•Op�mised design and wind farm layout
•Innova�on in support structures, installa�on and O&M processes
Technology
•36GW opera�ng in Europe by 2020 (17GW in UK)
•Diverse/fragmented supply chain
•Some economies of scale •Modest improvement in ver�cal collabora�on
Supply Chain •£52bn of new finance required from 2011-20
•Takes �me for investors to 'get comfortable' with new technology; resul�ng in higher risk pricing
•Constraints in availability of low-cost equity finance in 2014/17
•Depth of insurance markets increases
Finance
Exhibit 4.9: Story 3 Key Assumptions

Results: Significant cost reductionfrom supply chain improvementsis also possibleUnder the Supply Chain Efficiency Story, the central view isthat costs will reduce to £96/MWh by FID 2020 (+/- £12/MWh)– a reduction of 31% relative to the baseline. The primaryreasons for this improvement are as follows:
• Supply Chain factors result in a £18/MWh (13%) saving by 2020, due to a range of factors. The primary driver is anincrease in competition in the sector due to new entrantsin the UK, the rest of the EU, and low cost jurisdictions;which will result in lower margins and prices. The secondmost significant driver is the better management ofinterface risks through increased collaboration across thevarious actors within the supply chain (includingdevelopers). Thirdly, it will be possible for the supply chain to realise economies of scale and greaterproductivity through investment in new manufacturingcapacity and standardisation.
• Technology improvements, though not as rapid orextensive as in Story 2, still result in a £20/MWh (14%)saving by 2020. In this story, it is assumed that nextgeneration turbines in the 5-7MW class dominate themarket in 2020; which makes a significant contribution toreducing LCOE through improved reliability and energycapture, and reduced O&M costs. There would also be asignificant contribution from other technological advancessuch as improvements in support structures, installationmethods, and O&M strategies; albeit not to the sameextent as in Story 2.
• Finance would also make a contribution of £6/MWh (or 4%) by 2020. In this scenario, the finance and insurancecommunities become more familiar with technology as itis demonstrated and deployed at scale, and the perceivedrisk decreases. This results in a reduction in risk premia,combined with the entrance of new sources of finance(such as greater levels of debt finance, institutionalinvestors, pension funds, and bonds).
• Though there is a significant benefit by 2020, the improvement to FID 2014 is negligible. This is due tothe fact that many of the identified supply chain savingswill not materialise until at least FID 2017. As with Story 2,there is also a small cost penalty in FID 2014 associatedwith the challenging scale of finance required, and theneed to resort to more expensive forms of finance;although this is assumed to be mitigated by FID 2020.
43
0
20
40
60
80
100
120
140
160
FID 2011 FID 2014 FID 2017 FID 2020
Leve
lised
Cos
t of
Ene
rgy
(£/M
Wh)
Exhibit 4.12: Story 3 Cost Trajectory
-6 -20
-2 -10
-18
+3
-3
-6
-60
-50
-40
-30
-20
-10
0
10
20
FID 2014 FID 2017 FID 2020
Impa
ct o
n LC
OE
(£/M
Wh)
Technology (& Transmission) Supply Chain Finance
Exhibit 4.13: Story 3 Breakdown of Savings
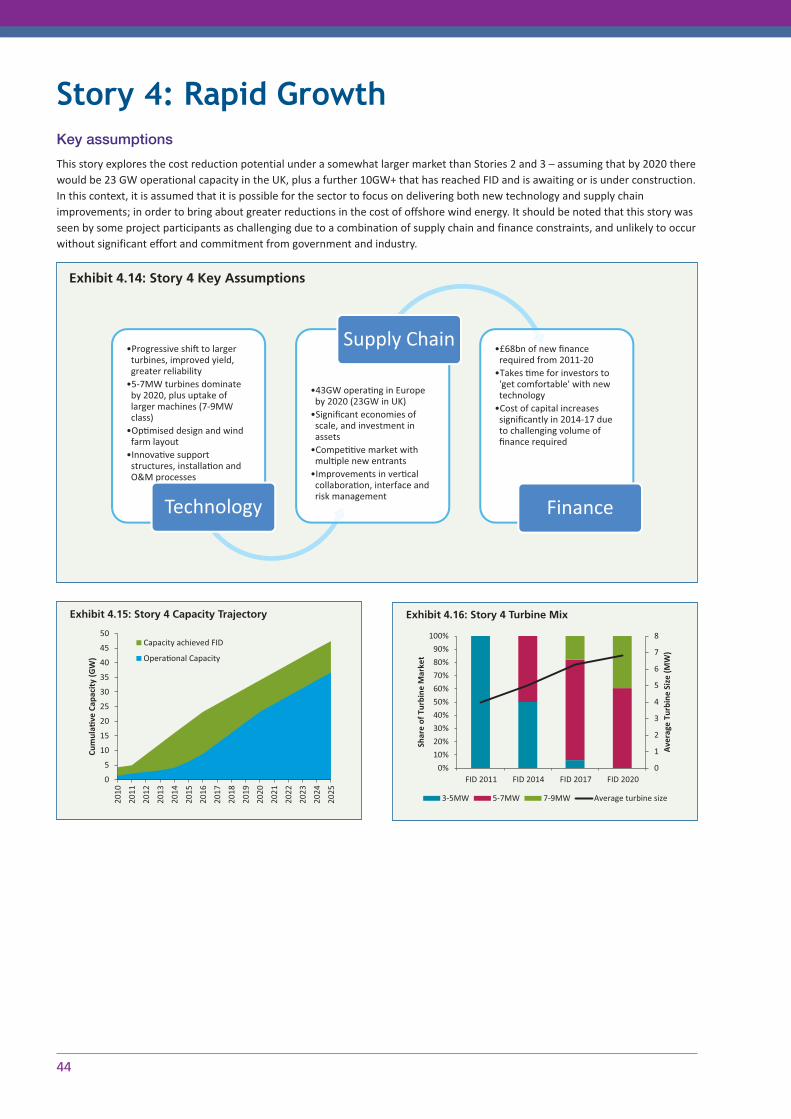
Key assumptions
This story explores the cost reduction potential under a somewhat larger market than Stories 2 and 3 – assuming that by 2020 therewould be 23 GW operational capacity in the UK, plus a further 10GW+ that has reached FID and is awaiting or is under construction.In this context, it is assumed that it is possible for the sector to focus on delivering both new technology and supply chainimprovements; in order to bring about greater reductions in the cost of offshore wind energy. It should be noted that this story wasseen by some project participants as challenging due to a combination of supply chain and finance constraints, and unlikely to occurwithout significant effort and commitment from government and industry.
44
•Progressive shi� to larger turbines, improved yield, greater reliability
•5-7MW turbines dominate by 2020, plus uptake of larger machines (7-9MW class)
•Op�mised design and wind farm layout
•Innova�ve support structures, installa�on and O&M processes
Technology
•43GW opera�ng in Europe by 2020 (23GW in UK)
•Significant economies of scale, and investment in assets
•Compe��ve market with mul�ple new entrants
•Improvements in ver�cal collabora�on, interface and risk management
Supply Chain •£68bn of new finance required from 2011-20
•Takes �me for investors to 'get comfortable' with new technology
•Cost of capital increases significantly in 2014-17 due to challenging volume of finance required
Finance
Exhibit 4.14: Story 4 Key Assumptions
0
5
10
15
20
25
30
35
40
45
50
2010
2011
2012
2013
2014
2015
2016
2017
2018
2019
2020
2021
2022
2023
2024
2025
Cum
ula�
ve C
apac
ity
(GW
)
Capacity achieved FID
Opera�onal Capacity
Exhibit 4.15: Story 4 Capacity Trajectory
0
1
2
3
4
5
6
7
8
0%
10%
20%
30%
40%
50%
60%
70%
80%
90%
100%
FID 2011 FID 2014 FID 2017 FID 2020
Ave
rage
Tur
bine
Siz
e (M
W)
Shar
e of
Tur
bine
Mar
ket
3-5MW 5-7MW 7-9MW Average turbine size
Exhibit 4.16: Story 4 Turbine Mix
Story 4: Rapid Growth
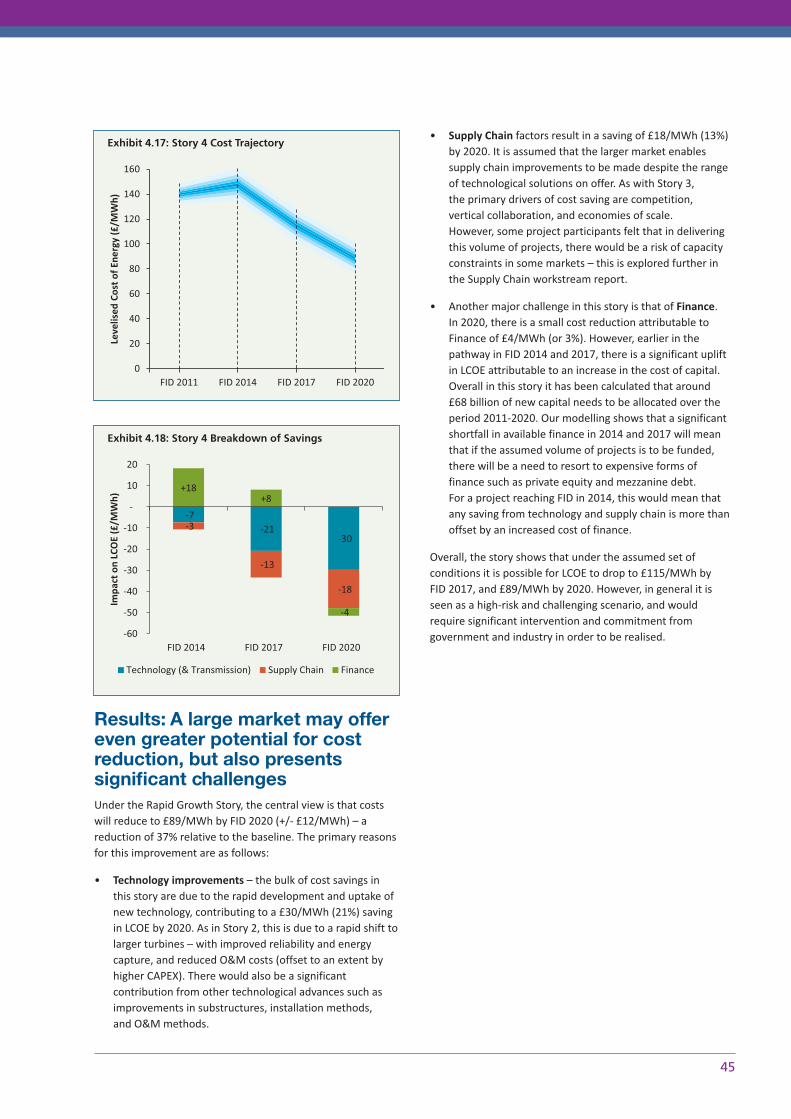
Results: A large market may offereven greater potential for costreduction, but also presentssignificant challengesUnder the Rapid Growth Story, the central view is that costswill reduce to £89/MWh by FID 2020 (+/- £12/MWh) – areduction of 37% relative to the baseline. The primary reasonsfor this improvement are as follows:
• Technology improvements – the bulk of cost savings inthis story are due to the rapid development and uptake ofnew technology, contributing to a £30/MWh (21%) savingin LCOE by 2020. As in Story 2, this is due to a rapid shift tolarger turbines – with improved reliability and energycapture, and reduced O&M costs (offset to an extent byhigher CAPEX). There would also be a significantcontribution from other technological advances such asimprovements in substructures, installation methods, and O&M methods.
• Supply Chain factors result in a saving of £18/MWh (13%)by 2020. It is assumed that the larger market enablessupply chain improvements to be made despite the rangeof technological solutions on offer. As with Story 3, the primary drivers of cost saving are competition, vertical collaboration, and economies of scale. However, some project participants felt that in deliveringthis volume of projects, there would be a risk of capacityconstraints in some markets – this is explored further inthe Supply Chain workstream report.
• Another major challenge in this story is that of Finance. In 2020, there is a small cost reduction attributable toFinance of £4/MWh (or 3%). However, earlier in thepathway in FID 2014 and 2017, there is a significant upliftin LCOE attributable to an increase in the cost of capital.Overall in this story it has been calculated that around £68 billion of new capital needs to be allocated over theperiod 2011-2020. Our modelling shows that a significantshortfall in available finance in 2014 and 2017 will meanthat if the assumed volume of projects is to be funded,there will be a need to resort to expensive forms offinance such as private equity and mezzanine debt. For a project reaching FID in 2014, this would mean thatany saving from technology and supply chain is more thanoffset by an increased cost of finance.
Overall, the story shows that under the assumed set ofconditions it is possible for LCOE to drop to £115/MWh by FID 2017, and £89/MWh by 2020. However, in general it isseen as a high-risk and challenging scenario, and wouldrequire significant intervention and commitment fromgovernment and industry in order to be realised.
45
0
20
40
60
80
100
120
140
160
FID 2011 FID 2014 FID 2017 FID 2020
Leve
lised
Cos
t of
Ene
rgy
(£/M
Wh)
Exhibit 4.17: Story 4 Cost Trajectory
-7 -21
-30 -3
-13
-18
+18 +8
-4
-60
-50
-40
-30
-20
-10
-
10
20
FID 2014 FID 2017 FID 2020
Impa
ct o
n LC
OE
(£/M
Wh)
Technology (& Transmission) Supply Chain Finance
Exhibit 4.18: Story 4 Breakdown of Savings
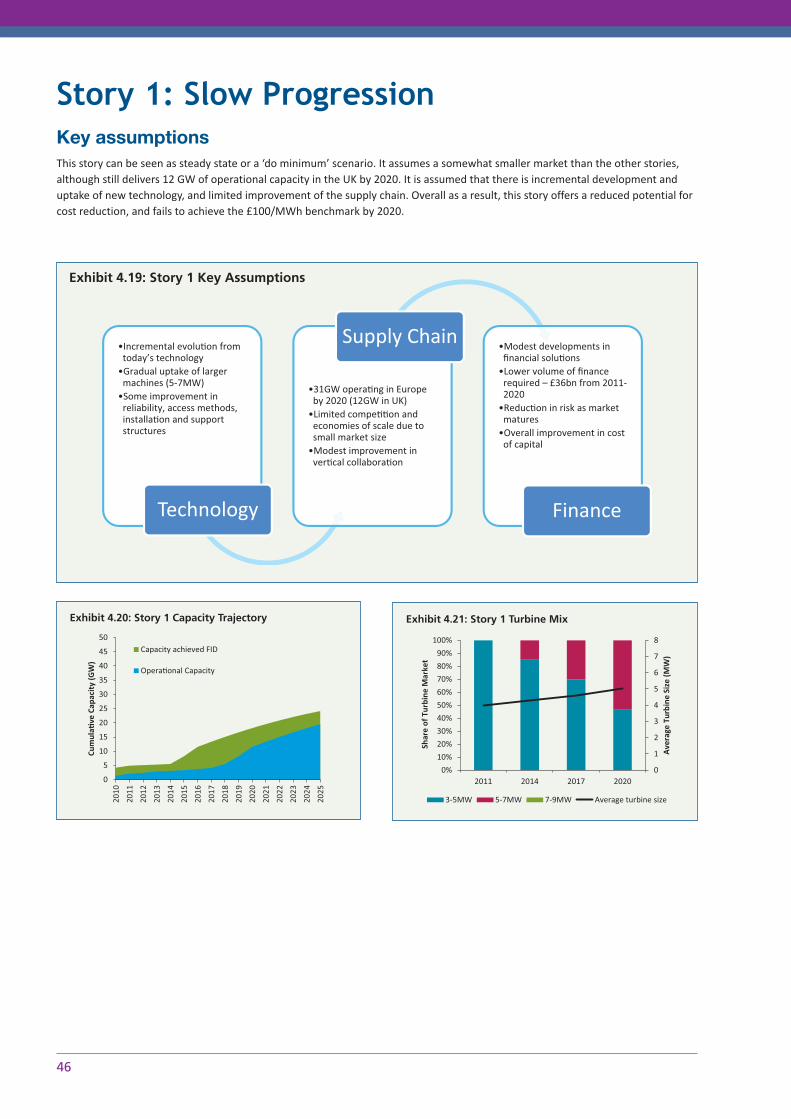
Key assumptionsThis story can be seen as steady state or a ‘do minimum’ scenario. It assumes a somewhat smaller market than the other stories,although still delivers 12 GW of operational capacity in the UK by 2020. It is assumed that there is incremental development anduptake of new technology, and limited improvement of the supply chain. Overall as a result, this story offers a reduced potential forcost reduction, and fails to achieve the £100/MWh benchmark by 2020.
46
•Incremental evolu�on from today’s technology
•Gradual uptake of larger machines (5-7MW)
•Some improvement in reliability, access methods, installa�on and support structures
Technology
•31GW opera�ng in Europe by 2020 (12GW in UK)
•Limited compe��on and economies of scale due to small market size
•Modest improvement in ver�cal collabora�on
Supply Chain •Modest developments in financial solu�ons
•Lower volume of finance required – £36bn from 2011-2020
•Reduc�on in risk as market matures
•Overall improvement in cost of capital
Finance
Exhibit 4.19: Story 1 Key Assumptions
0
5
10
15
20
25
30
35
40
45
50
2010
2011
2012
2013
2014
2015
2016
2017
2018
2019
2020
2021
2022
2023
2024
2025
Cum
ula�
ve C
apac
ity
(GW
)
Capacity achieved FID
Opera�onal Capacity
Exhibit 4.20: Story 1 Capacity Trajectory
0
1
2
3
4
5
6
7
8
0%
10%
20%
30%
40%
50%
60%
70%
80%
90%
100%
2011 2014 2017 2020
Ave
rage
Tur
bine
Siz
e (M
W)
Shar
e of
Tur
bine
Mar
ket
3-5MW 5-7MW 7-9MW Average turbine size
Exhibit 4.21: Story 1 Turbine Mix
Story 1: Slow Progression
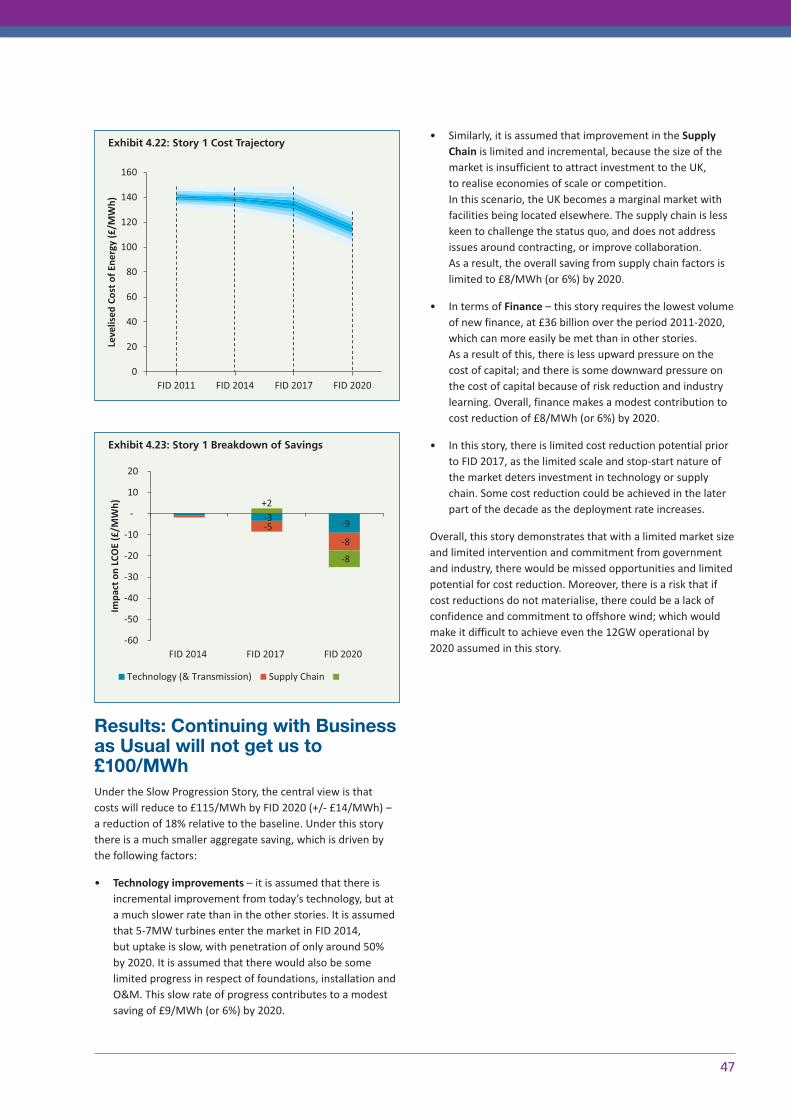
Results: Continuing with Businessas Usual will not get us to£100/MWhUnder the Slow Progression Story, the central view is thatcosts will reduce to £115/MWh by FID 2020 (+/- £14/MWh) –a reduction of 18% relative to the baseline. Under this storythere is a much smaller aggregate saving, which is driven bythe following factors:
• Technology improvements – it is assumed that there isincremental improvement from today’s technology, but ata much slower rate than in the other stories. It is assumedthat 5-7MW turbines enter the market in FID 2014, but uptake is slow, with penetration of only around 50% by 2020. It is assumed that there would also be somelimited progress in respect of foundations, installation andO&M. This slow rate of progress contributes to a modestsaving of £9/MWh (or 6%) by 2020.
• Similarly, it is assumed that improvement in the SupplyChain is limited and incremental, because the size of themarket is insufficient to attract investment to the UK, to realise economies of scale or competition. In this scenario, the UK becomes a marginal market withfacilities being located elsewhere. The supply chain is lesskeen to challenge the status quo, and does not addressissues around contracting, or improve collaboration. As a result, the overall saving from supply chain factors islimited to £8/MWh (or 6%) by 2020.
• In terms of Finance – this story requires the lowest volumeof new finance, at £36 billion over the period 2011-2020,which can more easily be met than in other stories. As a result of this, there is less upward pressure on thecost of capital; and there is some downward pressure onthe cost of capital because of risk reduction and industrylearning. Overall, finance makes a modest contribution tocost reduction of £8/MWh (or 6%) by 2020.
• In this story, there is limited cost reduction potential priorto FID 2017, as the limited scale and stop-start nature ofthe market deters investment in technology or supplychain. Some cost reduction could be achieved in the laterpart of the decade as the deployment rate increases.
Overall, this story demonstrates that with a limited market sizeand limited intervention and commitment from governmentand industry, there would be missed opportunities and limitedpotential for cost reduction. Moreover, there is a risk that ifcost reductions do not materialise, there could be a lack ofconfidence and commitment to offshore wind; which wouldmake it difficult to achieve even the 12GW operational by2020 assumed in this story.
47
0
20
40
60
80
100
120
140
160
FID 2011 FID 2014 FID 2017 FID 2020
Leve
lised
Cos
t of
Ene
rgy
(£/M
Wh)
Exhibit 4.22: Story 1 Cost Trajectory
-3 -9 -5
-8
+2
-8
-60
-50
-40
-30
-20
-10
-
10
20
FID 2014 FID 2017 FID 2020
Impa
ct o
n LC
OE
(£/M
Wh)
Technology (& Transmission) Supply Chain
Exhibit 4.23: Story 1 Breakdown of Savings
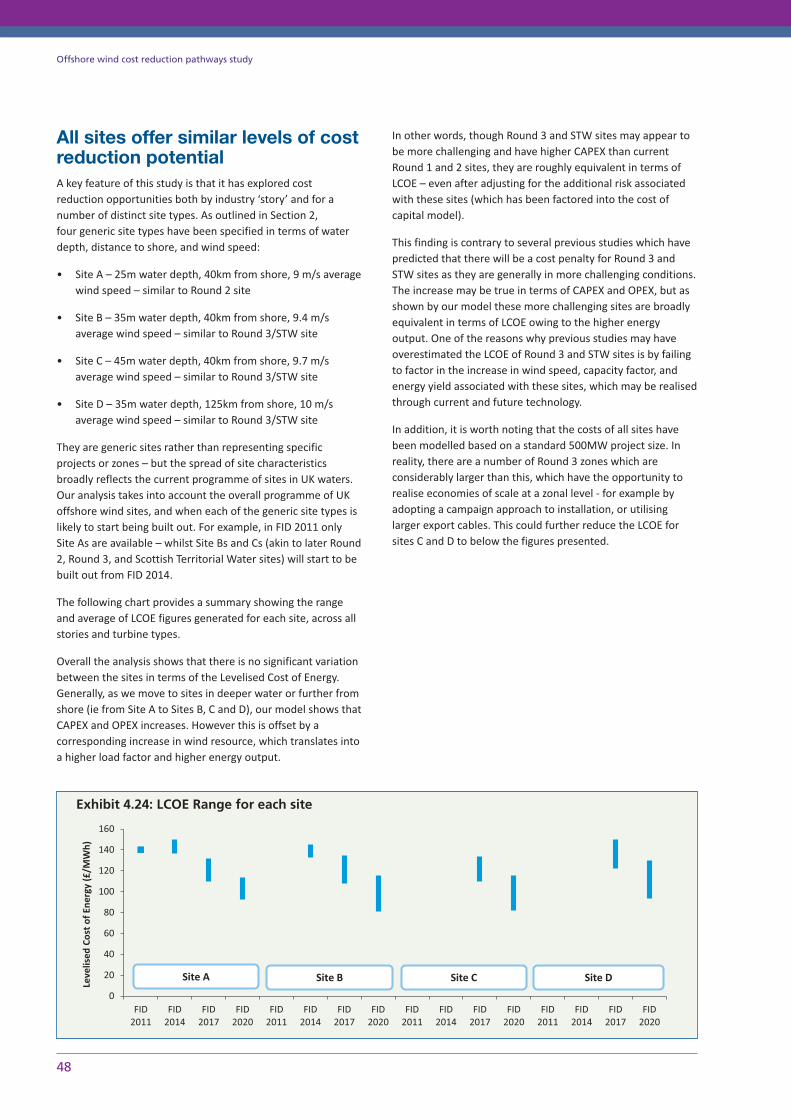
All sites offer similar levels of costreduction potentialA key feature of this study is that it has explored costreduction opportunities both by industry ‘story’ and for anumber of distinct site types. As outlined in Section 2, four generic site types have been specified in terms of waterdepth, distance to shore, and wind speed:
• Site A – 25m water depth, 40km from shore, 9 m/s averagewind speed – similar to Round 2 site
• Site B – 35m water depth, 40km from shore, 9.4 m/saverage wind speed – similar to Round 3/STW site
• Site C – 45m water depth, 40km from shore, 9.7 m/saverage wind speed – similar to Round 3/STW site
• Site D – 35m water depth, 125km from shore, 10 m/saverage wind speed – similar to Round 3/STW site
They are generic sites rather than representing specificprojects or zones – but the spread of site characteristicsbroadly reflects the current programme of sites in UK waters.Our analysis takes into account the overall programme of UKoffshore wind sites, and when each of the generic site types islikely to start being built out. For example, in FID 2011 onlySite As are available – whilst Site Bs and Cs (akin to later Round2, Round 3, and Scottish Territorial Water sites) will start to bebuilt out from FID 2014.
The following chart provides a summary showing the rangeand average of LCOE figures generated for each site, across allstories and turbine types.
Overall the analysis shows that there is no significant variationbetween the sites in terms of the Levelised Cost of Energy.Generally, as we move to sites in deeper water or further fromshore (ie from Site A to Sites B, C and D), our model shows thatCAPEX and OPEX increases. However this is offset by acorresponding increase in wind resource, which translates intoa higher load factor and higher energy output.
In other words, though Round 3 and STW sites may appear tobe more challenging and have higher CAPEX than currentRound 1 and 2 sites, they are roughly equivalent in terms ofLCOE – even after adjusting for the additional risk associatedwith these sites (which has been factored into the cost ofcapital model).
This finding is contrary to several previous studies which havepredicted that there will be a cost penalty for Round 3 andSTW sites as they are generally in more challenging conditions.The increase may be true in terms of CAPEX and OPEX, but asshown by our model these more challenging sites are broadlyequivalent in terms of LCOE owing to the higher energyoutput. One of the reasons why previous studies may haveoverestimated the LCOE of Round 3 and STW sites is by failingto factor in the increase in wind speed, capacity factor, andenergy yield associated with these sites, which may be realisedthrough current and future technology.
In addition, it is worth noting that the costs of all sites havebeen modelled based on a standard 500MW project size. Inreality, there are a number of Round 3 zones which areconsiderably larger than this, which have the opportunity torealise economies of scale at a zonal level - for example byadopting a campaign approach to installation, or utilisinglarger export cables. This could further reduce the LCOE forsites C and D to below the figures presented.
48
Offshore wind cost reduction pathways study
0
20
40
60
80
100
120
140
160
FID2011
FID2014
FID2017
FID2020
FID2011
FID2014
FID2017
FID2020
FID2011
FID2014
FID2017
FID2020
FID2011
FID2014
FID2017
FID2020
Leve
lised
Cos
t of
Ene
rgy
(£/M
Wh)
Site A Site B Site C Site D
Exhibit 4.24: LCOE Range for each site
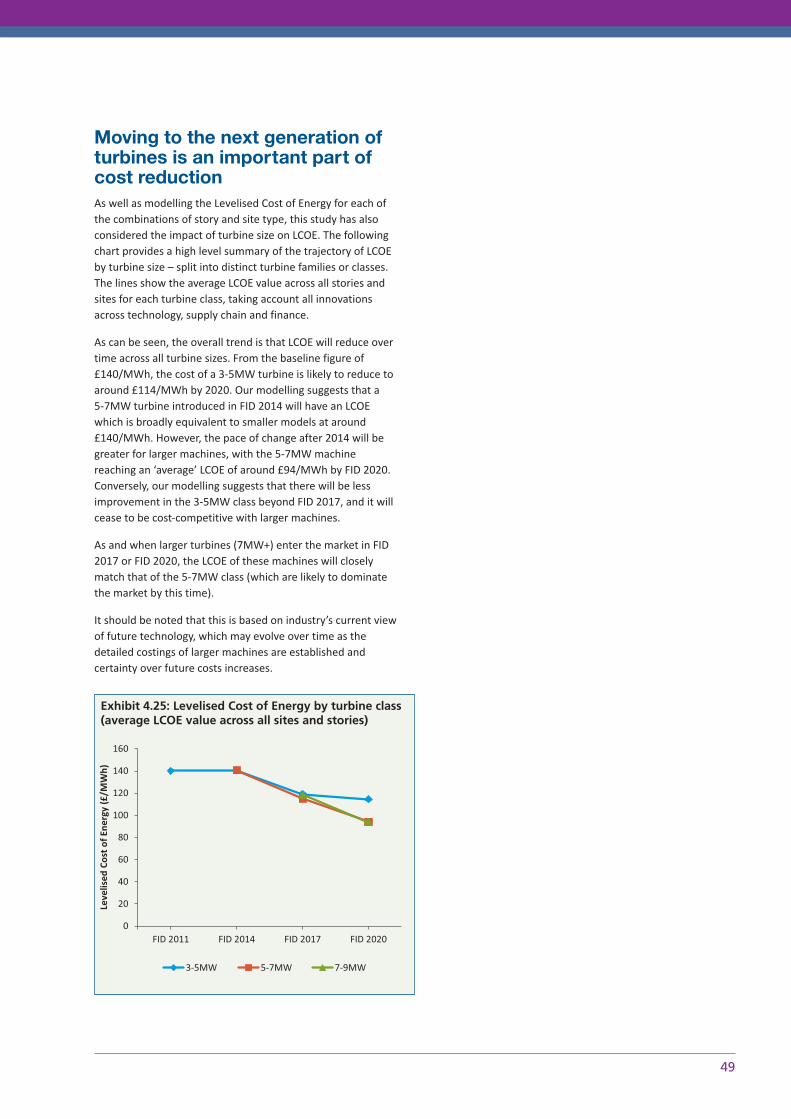
Moving to the next generation ofturbines is an important part ofcost reductionAs well as modelling the Levelised Cost of Energy for each ofthe combinations of story and site type, this study has alsoconsidered the impact of turbine size on LCOE. The followingchart provides a high level summary of the trajectory of LCOEby turbine size – split into distinct turbine families or classes.The lines show the average LCOE value across all stories andsites for each turbine class, taking account all innovationsacross technology, supply chain and finance.
As can be seen, the overall trend is that LCOE will reduce overtime across all turbine sizes. From the baseline figure of£140/MWh, the cost of a 3-5MW turbine is likely to reduce toaround £114/MWh by 2020. Our modelling suggests that a 5-7MW turbine introduced in FID 2014 will have an LCOEwhich is broadly equivalent to smaller models at around£140/MWh. However, the pace of change after 2014 will begreater for larger machines, with the 5-7MW machinereaching an ‘average’ LCOE of around £94/MWh by FID 2020.Conversely, our modelling suggests that there will be lessimprovement in the 3-5MW class beyond FID 2017, and it willcease to be cost-competitive with larger machines.
As and when larger turbines (7MW+) enter the market in FID2017 or FID 2020, the LCOE of these machines will closelymatch that of the 5-7MW class (which are likely to dominatethe market by this time).
It should be noted that this is based on industry’s current viewof future technology, which may evolve over time as thedetailed costings of larger machines are established andcertainty over future costs increases.
49
0
20
40
60
80
100
120
140
160
FID 2011 FID 2014 FID 2017 FID 2020
Leve
lised
Cos
t of
Ene
rgy
(£/M
Wh)
3-5MW 5-7MW 7-9MW
Exhibit 4.25: Levelised Cost of Energy by turbine class (average LCOE value across all sites and stories)

Offshore wind costs are sensitive to external factors and technical assumptionsThere are many factors which can influence the cost of energy of a wind farm project – from technical or supply chain factors, to site characteristics, to macro-economic factors such as interest rates, commodity prices and exchange rates. Within this study it has been necessary to make some choices about which aspects to model in detail, while making simplifyingassumptions in other areas. Where assumptions have been made, they have been tested through sensitivity analysis – ie byexamining the impact on LCOE of changing a single input variable.
The following chart provides an overview of our approach to analysing cost drivers – the first two categories have been modelled in detail, whilst for the latter two categories global assumptions have been made which have been tested as sensitivities.
The following chart provides the results from the sensitivity modelling,42 which are explored further below as well as in theworkstream reports:
50 41 O&M costs and Decommissioning costs are calculated for each data point (ie site, story, turbine, year combina�on); whereas the opera�onal life�me, commodity prices,exchange rates and interest rates are fixed across all datapoints. See Appendix 2 for more details of our assump�ons.
42 Analysis based on a wind farm at FID in 2020 using 6MW turbines, on site B, in the Supply Chain Efficiency story43 It should be noted that the impact of each of these sensi�vi�es changes over �me. For example, since the turbine increases as a propor�on of CAPEX and LCOE between FID
2011 and FID 2020, the impact of the steel price sensi�vity also increases over �me. The results presented related to a typical project at FID in 2020.
Offshore wind cost reduction pathways study
Site Characteris�cs
• Water depth • Distance to shore • Wind speed
Industry Evolu�on (Story)
• Size of the market (GW)
• Technology progress
• Supply Chain response
• Finance
Technical assump�ons
• Opera�onal life • Decommissioning
costs • O&M costs
Exogenous Factors
• Interest rates (risk free rate)
• Commodity prices (steel, copper)
• Exchange rates
Modelled in detail. Impact of drivers assessed through Pathways
Made assump�ons. Tested through sensi�vity analysis.
Exhibit 4.26: Cost Driver Analysis Approach41
-10% -5% 0% 5% 10%
Residual value at end of life
O&M costs
Risk free rate
Increase opera�ng life�me
Commodity prices
Currency fluctua�ons (€)
Impact on LCOE
Exhibit 4.27: Sensitivity Modelling Results (based on project at FID in 2020)43
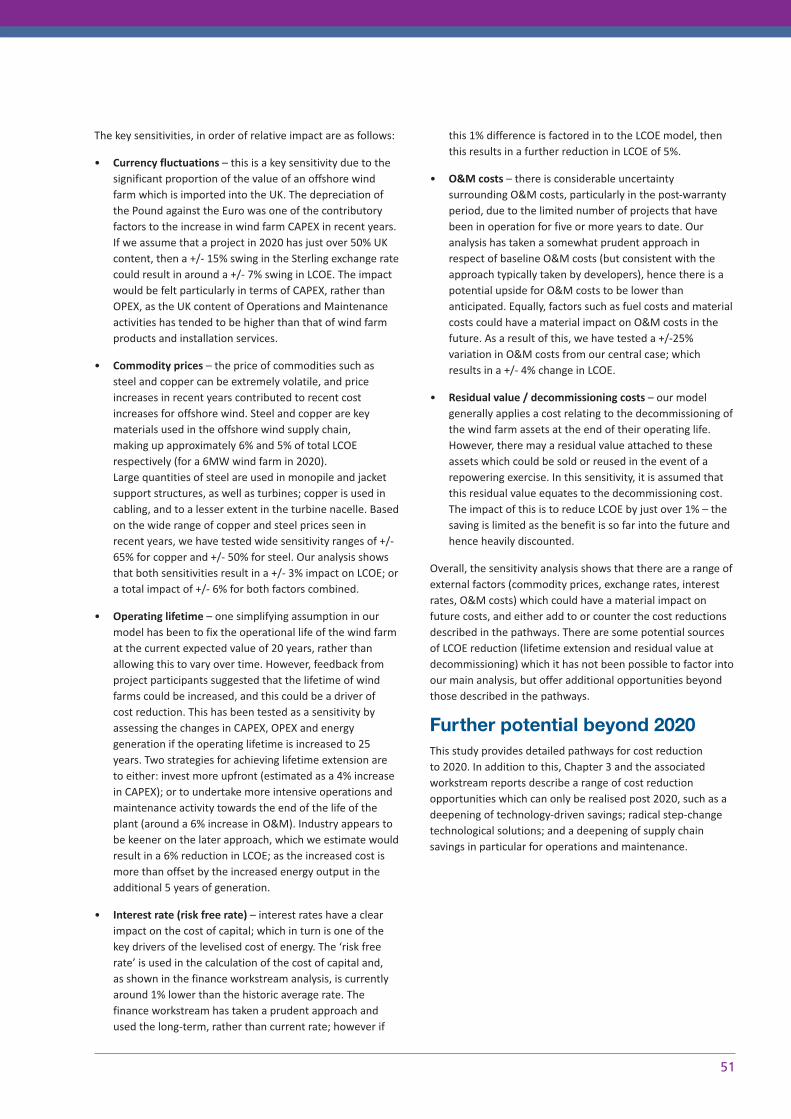
The key sensitivities, in order of relative impact are as follows:
• Currency fluctuations – this is a key sensitivity due to thesignificant proportion of the value of an offshore windfarm which is imported into the UK. The depreciation ofthe Pound against the Euro was one of the contributoryfactors to the increase in wind farm CAPEX in recent years.If we assume that a project in 2020 has just over 50% UKcontent, then a +/- 15% swing in the Sterling exchange ratecould result in around a +/- 7% swing in LCOE. The impactwould be felt particularly in terms of CAPEX, rather thanOPEX, as the UK content of Operations and Maintenanceactivities has tended to be higher than that of wind farmproducts and installation services.
• Commodity prices – the price of commodities such assteel and copper can be extremely volatile, and priceincreases in recent years contributed to recent costincreases for offshore wind. Steel and copper are keymaterials used in the offshore wind supply chain, making up approximately 6% and 5% of total LCOErespectively (for a 6MW wind farm in 2020). Large quantities of steel are used in monopile and jacketsupport structures, as well as turbines; copper is used incabling, and to a lesser extent in the turbine nacelle. Basedon the wide range of copper and steel prices seen inrecent years, we have tested wide sensitivity ranges of +/-65% for copper and +/- 50% for steel. Our analysis showsthat both sensitivities result in a +/- 3% impact on LCOE; ora total impact of +/- 6% for both factors combined.
• Operating lifetime – one simplifying assumption in ourmodel has been to fix the operational life of the wind farmat the current expected value of 20 years, rather thanallowing this to vary over time. However, feedback fromproject participants suggested that the lifetime of wind farms could be increased, and this could be a driver of cost reduction. This has been tested as a sensitivity byassessing the changes in CAPEX, OPEX and energygeneration if the operating lifetime is increased to 25years. Two strategies for achieving lifetime extension areto either: invest more upfront (estimated as a 4% increasein CAPEX); or to undertake more intensive operations andmaintenance activity towards the end of the life of theplant (around a 6% increase in O&M). Industry appears tobe keener on the later approach, which we estimate wouldresult in a 6% reduction in LCOE; as the increased cost ismore than offset by the increased energy output in theadditional 5 years of generation.
• Interest rate (risk free rate) – interest rates have a clearimpact on the cost of capital; which in turn is one of thekey drivers of the levelised cost of energy. The ‘risk freerate’ is used in the calculation of the cost of capital and, as shown in the finance workstream analysis, is currentlyaround 1% lower than the historic average rate. Thefinance workstream has taken a prudent approach andused the long-term, rather than current rate; however if
this 1% difference is factored in to the LCOE model, thenthis results in a further reduction in LCOE of 5%.
• O&M costs – there is considerable uncertaintysurrounding O&M costs, particularly in the post-warrantyperiod, due to the limited number of projects that havebeen in operation for five or more years to date. Ouranalysis has taken a somewhat prudent approach inrespect of baseline O&M costs (but consistent with theapproach typically taken by developers), hence there is apotential upside for O&M costs to be lower thananticipated. Equally, factors such as fuel costs and materialcosts could have a material impact on O&M costs in thefuture. As a result of this, we have tested a +/-25%variation in O&M costs from our central case; whichresults in a +/- 4% change in LCOE.
• Residual value / decommissioning costs – our modelgenerally applies a cost relating to the decommissioning ofthe wind farm assets at the end of their operating life.However, there may a residual value attached to theseassets which could be sold or reused in the event of arepowering exercise. In this sensitivity, it is assumed thatthis residual value equates to the decommissioning cost.The impact of this is to reduce LCOE by just over 1% – thesaving is limited as the benefit is so far into the future andhence heavily discounted.
Overall, the sensitivity analysis shows that there are a range ofexternal factors (commodity prices, exchange rates, interestrates, O&M costs) which could have a material impact onfuture costs, and either add to or counter the cost reductionsdescribed in the pathways. There are some potential sourcesof LCOE reduction (lifetime extension and residual value atdecommissioning) which it has not been possible to factor intoour main analysis, but offer additional opportunities beyondthose described in the pathways.
Further potential beyond 2020This study provides detailed pathways for cost reduction to 2020. In addition to this, Chapter 3 and the associatedworkstream reports describe a range of cost reductionopportunities which can only be realised post 2020, such as adeepening of technology-driven savings; radical step-changetechnological solutions; and a deepening of supply chainsavings in particular for operations and maintenance.
51

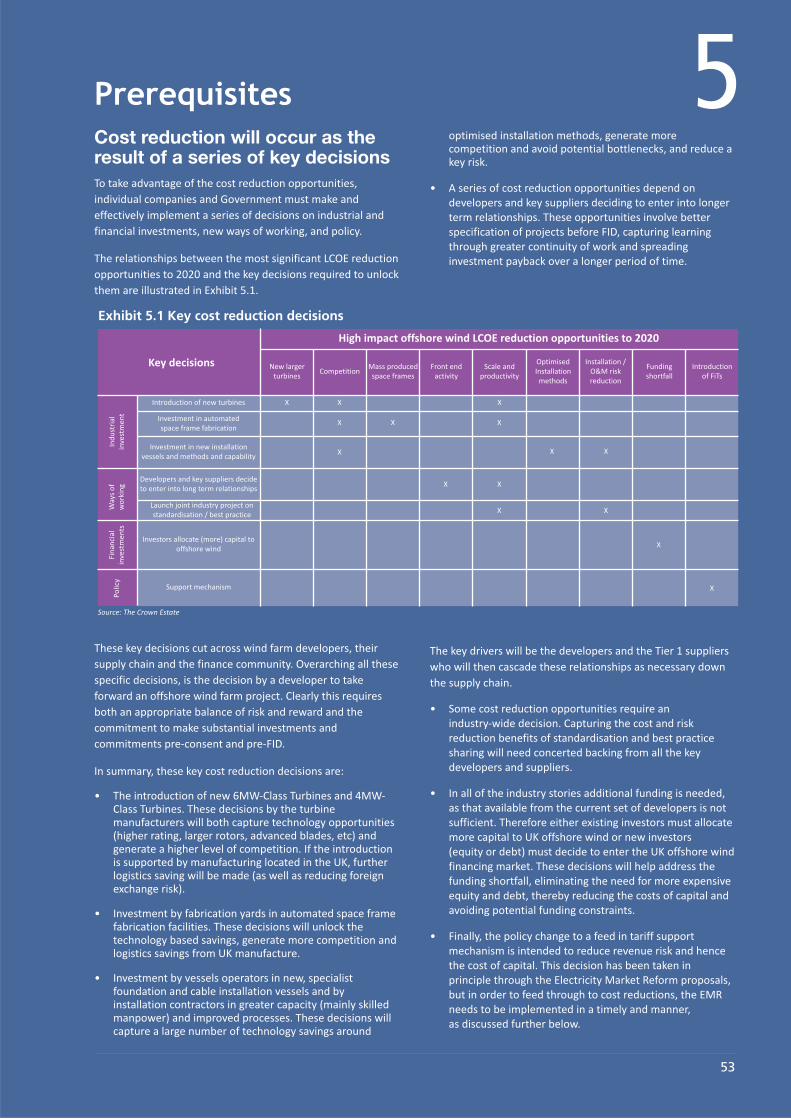
Cost reduction will occur as theresult of a series of key decisionsTo take advantage of the cost reduction opportunities,individual companies and Government must make andeffectively implement a series of decisions on industrial andfinancial investments, new ways of working, and policy.
The relationships between the most significant LCOE reductionopportunities to 2020 and the key decisions required to unlockthem are illustrated in Exhibit 5.1.
These key decisions cut across wind farm developers, theirsupply chain and the finance community. Overarching all thesespecific decisions, is the decision by a developer to takeforward an offshore wind farm project. Clearly this requiresboth an appropriate balance of risk and reward and thecommitment to make substantial investments andcommitments pre-consent and pre-FID.
In summary, these key cost reduction decisions are:
• The introduction of new 6MW-Class Turbines and 4MW-Class Turbines. These decisions by the turbinemanufacturers will both capture technology opportunities(higher rating, larger rotors, advanced blades, etc) andgenerate a higher level of competition. If the introductionis supported by manufacturing located in the UK, furtherlogistics saving will be made (as well as reducing foreignexchange risk).
• Investment by fabrication yards in automated space framefabrication facilities. These decisions will unlock thetechnology based savings, generate more competition andlogistics savings from UK manufacture.
• Investment by vessels operators in new, specialistfoundation and cable installation vessels and byinstallation contractors in greater capacity (mainly skilledmanpower) and improved processes. These decisions willcapture a large number of technology savings around
optimised installation methods, generate morecompetition and avoid potential bottlenecks, and reduce akey risk.
• A series of cost reduction opportunities depend ondevelopers and key suppliers deciding to enter into longerterm relationships. These opportunities involve betterspecification of projects before FID, capturing learningthrough greater continuity of work and spreadinginvestment payback over a longer period of time.
The key drivers will be the developers and the Tier 1 supplierswho will then cascade these relationships as necessary downthe supply chain.
• Some cost reduction opportunities require an industry-wide decision. Capturing the cost and riskreduction benefits of standardisation and best practicesharing will need concerted backing from all the keydevelopers and suppliers.
• In all of the industry stories additional funding is needed,as that available from the current set of developers is notsufficient. Therefore either existing investors must allocatemore capital to UK offshore wind or new investors (equity or debt) must decide to enter the UK offshore windfinancing market. These decisions will help address thefunding shortfall, eliminating the need for more expensiveequity and debt, thereby reducing the costs of capital andavoiding potential funding constraints.
• Finally, the policy change to a feed in tariff supportmechanism is intended to reduce revenue risk and hencethe cost of capital. This decision has been taken inprinciple through the Electricity Market Reform proposals,but in order to feed through to cost reductions, the EMRneeds to be implemented in a timely and manner, as discussed further below.
53
Prerequisites 5
High impact offshore wind LCOE reduction opportunities to 2020
Key decisions
Polic
yFi
nanc
ial
inve
stm
ents
Way
s of
w
orki
ngIn
dust
rial
in
vest
men
t
New largerturbines
Competition
Introduction of new turbines X X
X X X
X
X
X
X
XX
X X
X
X
Investment in automated space frame fabrication
Investment in new installation vessels and methods and capability
Developers and key suppliers decideto enter into long term relationships
Support mechanism
Launch joint industry project on standardisation / best practice
Investors allocate (more) capital tooffshore wind
Mass producedspace frames
Front end activity
Scale andproductivity
OptimisedInstallation
methods
Installation /O&M riskreduction
Fundingshortfall
Introductionof FiTs
Exhibit 5.1 Key cost reduction decisions
Source: The Crown Estate

The list of key decisions is relatively constant across thedifferent cost pathways, but the balance of investment altersin each of the pathways. For example, in the TechnologyAcceleration story, the quicker introduction of new turbinesincorporating a greater number of innovations is emphasised,whereas in the Supply Chain Efficiency story decisions on jointworking and new methods are more important.
Prerequisites must be in place toenable cost reduction decisionsto be takenFor almost all the key cost reduction decisions, a number ofprerequisites need to be in place. Without these prerequisites,it is unlikely that any company will take the decisionsnecessary to reduce offshore wind costs.
The nature of the prerequisites depends on the type ofdecisions being made. We have combined these into threegroups taken by private sector companies:
• Industrial investments.
• Ways of working.
• Financial investments.
Prerequisites for industrial investmentsrevolve around market, availability ofmanufacturing sites, and technology support
The industrial investment decisions include the introduction of6MW-Class and 8MW-Class turbines, automated space framefabrication facilities, and new installation vessels andcapabilities. All of these decisions involve very significantcapital expenditures ranging from £50m to £400m (see Exhibit 5.2). Particularly for fabrication yards these arelarge compared to the size of the typical players in theseindustries and so the exposure and hence risk related to these
investment is high. These are also long cycle investments. For example, the total lifecycle of a turbine is at least 13 years(6 years of development and at least 7 years of sales life), or about ten years from FID for a production facility.
The market for offshore wind power is mandated byGovernment rather than customer demand. As the investmentdecisions needed for cost reduction are long cycle and involvehigh levels of capital expenditure, the extent to whichcompanies can rely on the existence of a market for theirgoods and services in 10+years time is critical. There are atleast four resulting prerequisites:
• A predictable flow of projects emerging from theconsenting process. This requires that the clear timetablefor planning determination (as proposed under the NIDand Planning Act) is met reliably. This allows the supplychain companies to gain confidence that the wind farmprojects necessary to justify industrial investments willreach final investment decision and generate a steadystream of orders. Delays in the project flow will delayorders and hence stop industrial investments.
• A robust policy framework mandating steady andgrowing demand for offshore wind with reasonablecertainty over a 10-15 year period. This will generatemarket confidence for offshore wind farms against whichturbine manufacturers and the rest of the supply chain caninvest. It is crucial to avoid lulls in demand. These are toxicfor almost all cost reductions; increasing perceptions ofrisk, decreasing the appetite to invest and destroying theopportunity for learning. Turbine manufacture, fabricationyards, vessel operators and marine contractor all operatewithin a European if not global market. However, the UK is expected to make up around half of Europeandemand and so has a crucial role in establishing a steadygrowing market.
54
Offshore wind cost reduction pathways study
Decision
Introduction of new turbines
Investment in automated space frame fabrication
Investment in new installation vesselsand methods and capability
Fabrication yards(£100-300m/year)
Vessel operators(£30-60m/year)
Installation contractors(~£1bn/year)
Up to 2 years Up to £5m
• 3-4 years from FID to operations for new build
• 2-3 years for conversions£200m/ vessel
• Up to 3years for a jacket (from FID to operations)
£50-160m/facility
International engineering companies
(£1-50bn/year)
• 6 years from concept design to full commercial launch
• 3 years from FID of manufacturing facilities to full commercial launch
£150-400m /turbine (inc. RD&D and
production facilities)
Typical investor(turnover)
Investment lead time Typical investment size
Source: Finance workstream report, Technology workstream report, Supply chain workstream report, The Crown Estate
Exhibit 5.2 Characteristics of key industrial investment decisions

• Developers pass through of market demand. Fabricationyards and installers need to make technology specificinvestment decisions. Therefore, developers need to signalthe nature of their technology choices and then to makesupply commitments at the earliest possible opportunityto provide a strong market backdrop to allow investment.
• Planning envelope flexibility. The planning process mustallow developers to adjust technology choices afterconsent within reasonable limits. This will speed up theintroduction of new turbines and optimised installationmethods. Limited flexibility will lock in old technology anddelay the realisation of cost reductions.
Offshore wind turbine manufacturers have demandingrequirements for their factories. For example, a nacelleassembly facility needs in excess of 20ha of land adjacent tostrengthened deep water (8m at LAT) quayside with 24 houraccess. Therefore in addition to market demand, the timelyavailability of consented sites for coastal manufacturing andassembly44 is also a prerequisite. Turbine manufacturers andfabrication yards will need to build new coastal facilities fortheir 6MW-Class Turbine and support structures. Finding andconsenting suitable sites is a potential bottleneck – forexample, there are only 1-2 possible East coast sites with thepotential to meet the demand for quayside lay down /marshalling. These sites could be in the rest of Europe,however, this would diminish the cost reduction potential andlessen the economic benefit to the UK.
Finally, there are prerequisites related to technologydevelopment. A key step in the commercialisation of newturbines is test and demonstration. This is particularly criticalgiven the step change expected with the introduction of 6MW-Class Turbines and the increasing demands on reliability madeon further from shore sites. Testing and demonstrationrequires verification facilities and both onshore and offshoredemonstration sites. A prerequisite is therefore the availabilityof demonstration sites and verification facilities.Furthermore, analysis by the UK and Scottish Governments45
has identified continuing Government support for Research,Development and Demonstration (RD&D) as a prerequisite forboth cost reduction and generation of UK benefit.
Underpinning all these prerequisites is the availability ofpeople with the right skills. Although not a key focus of thisstudy, other analyses have shown that the sector will requirean inflow of over 40,000 people with engineering,manufacturing and construction skills at the professional andtechnical level.46
Greater collaboration is a key prerequisite fornew ways of working
Decisions by developers to enter into longer term relationshipswith key suppliers and for the industry to work collectively tostandardise and establish best practice will generateconsiderable cost savings. In addition to market certainty and
human capital prerequisites discussed above, developers andthe supply chain must embrace collaborative working asopposed to adversarial working. This prerequisite has anumber of aspects:
• Attitude: The industry player must be open to ideas fromoutside their organisation, challenge existingpreconceptions on how to design, build and operateoffshore wind farms and be prepared to accept standardrather than in-house solutions.
• Incentive structures: Developers must put in placecontractual or other mechanisms to share risks andincentivise the supply chain to bring forward costreductions, stop considering projects as one-off and takeadvantage of the scale across the UK and the rest of the EUto manage a portfolio of projects.
Extensive industry, Government and financecommunity engagement is a prerequisite forfinancial investment in offshore windalongside a robust policy framework
To avoid a funding shortfall, new investors in either equity orproject bonds need to be attracted to the sector. In addition,the increased use of debt needs to be facilitated.
New equity or project bond investors will invest in UK offshorewind only if:
• The potential financial returns are sufficiently attractiverelative to other opportunities both in the UK and beyond.
• Risks around the regulatory framework, construction andoperations are understood and can be managed.
If effectively implemented, the policy framework changesproposed in the Electricity Market Reform White Paper arehelpful in that FiTs will reduce revenue risk and prices will beset by the market rather than by Government and so shouldachieve investors required returns.
In addition to the policy framework a further prerequisite isengagement between developers / supply chain and newinvestors to ensure that they understand the key installationand O&M risks and how these are being addressed throughnew technology, and methods of working. There is a particularneed for a high level of engagement with pension andinsurance funds that may provide project bonds. The lead timefor them to become comfortable with the risk is considerableand developers need to understand their requirements.Government has a role in ensuring that these funds are notinadvertently discouraged from making investments in longterm infrastructure assets such as offshore wind due toregulatory changes (such as Solvency II), pension regulation,and revisions to accountancy rules (eg IAS 19).
Introducing debt into wind farm projects when operational willrelease funds that can be recycled into further projects,
5544 Including considerable quayside lay down and marshalling areas. For example the purpose-built offshore wind farm port in Belfast harbour will have a 450-metre quay and 50-acres of building space.45 For example see: Low Carbon Innova�on Coordina�on Group, ‘Technology Innova�on Needs Assessment (TINA) Offshore Wind Power Summary Report’, February 2012.46 RenewableUK, ‘Working for a Green Britain’, 2011. Includes both direct and indirect employees.

reducing the funding shortfall. To date one of the challengeshas been the impact of project debt on the credit rating ofproject sponsors which equity fund the construction and earlyoperational phases. A number of potential solutions are beingworked on but none have been proven. The industry wouldbenefit from co-ordinated engagement with the ratingsagencies on potential financing structures: for exampleindicative structures could be reviewed by the ratings agenciesand the feedback shared with market participants.
Independent power producers represent a potentiallyimportant source of capital, as they arguably face fewerissuers with the credit rating agencies and are more able toraise non-recourse debt finance (as evidenced in the Europeanmarket). In many of these financings, the EIB and other Multi-Lateral Agencies (MLAs) have played a significant roleand it is likely that support from the GIB would be required.
The prerequisites with the most wide rangingimpact are the policy framework, consenting process, and developer passthrough of demand
Exhibit 5.3 summaries the link between the key decisionsneeded to realise high impact LCOE reduction opportunities to2020 and the prerequisites that must be in place for thosedecisions to be taken.
The prerequisites that make possible the widest range costreduction opportunities revolve around market certainty – the policy framework, the flow of consented projects, and ensuring the supply chain gets market signals fromdevelopers. Without market certainty, developers and thesupply chain will not make the investments needed to reducecosts, be they industrial investments or investments in timeand effort to introduce new ways of working or investments inhuman capital.
The prerequisites around finance (engagement with newinvestors and credit rating agencies and MLA support) are bothfocused and critical, as expensive capital or even worse acapital constraint would severely limit industry progress andcost reduction.
Offshore transmissionprerequisitesIn common with the rest of this study, we have not studied theprerequisites for offshore transmission cost reductions in suchdetail. However, the results of our more high-level workindicates a small number of broad themes which are largelyconsistent with the rest of our analysis:
• Stable and predictable policy framework – this will enableinvestment and development in full view of risks andopportunities.
• Appropriate risk/reward balance – will be required toincentivise behaviours of all market participants, andallocate risk where it is best managed.
• Industry collaboration – notwithstanding the competitivenature of the generation market in the UK, there are clearopportunities for enhanced collaboration in key areas suchas transmission system design and construction bestpractice. Industry structures need to be aligned to enablesuch an approach and behaviours need to be appropriatelyincentivised.
• Standardised approach – as the market matures it will beessential that common standards are adopted for keytransmission assets to fully enable interoperability acrossdifferent transmission systems (nationally andinternationally) and to harness benefits throughout thesupply chain.
56
Offshore wind cost reduction pathways study
Key Decisions to realise high impact LCOE reduction opportunities to 2020
PrerequisitesIntroduction of new turbines
Investment in automated space frame fabrication
Industrial investment Ways of working Financial investments
Investment in new installation vessels andmethods and capability
Developers decide to enter into long term relationships
with key suppliers
Launch joint industry project on standardisation
/ best practice
Investors allocate(more) capital to
offshore windA robust policy framework mandating
demand for offshore wind X
X
X
X
X
X
X
X
X
X
X
X
X
X
X
X
X
X
X
X
X
X
X
X
X X
X
X
X
X
A predictable flow of projects emerging from the consenting process
Developers pass through of market demand
Planning envelop flexibility
Government RD&D support
Availability of demonstration sites and verification facilities
Availability of consented sites for coastal manufacturing and assembly
Collaborative working
Engagement with new investors
Engagement with credit agencies
MLA support
Source: Finance workstream report, Technology workstream report, Supply chain workstream report, The Crown Estate
Exhibit 5.3 Offshore wind prerequisites vs. key decisions
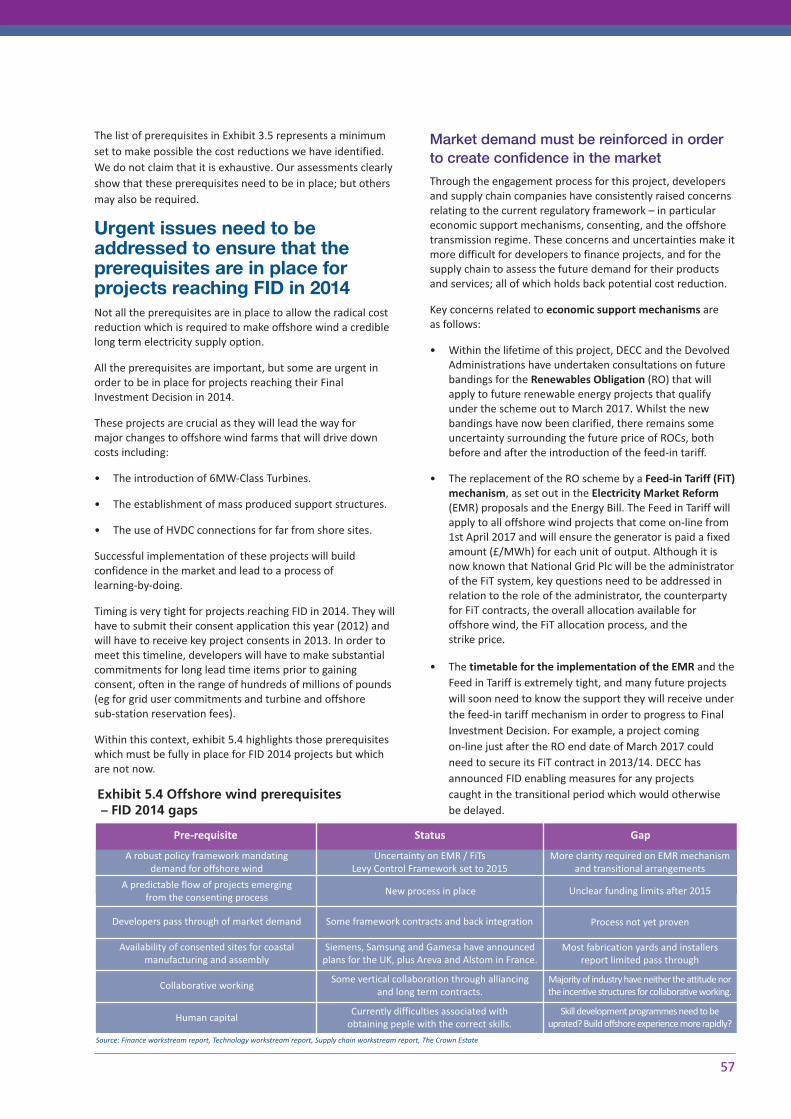
The list of prerequisites in Exhibit 3.5 represents a minimumset to make possible the cost reductions we have identified.We do not claim that it is exhaustive. Our assessments clearlyshow that these prerequisites need to be in place; but othersmay also be required.
Urgent issues need to beaddressed to ensure that the prerequisites are in place forprojects reaching FID in 2014Not all the prerequisites are in place to allow the radical costreduction which is required to make offshore wind a crediblelong term electricity supply option.
All the prerequisites are important, but some are urgent inorder to be in place for projects reaching their FinalInvestment Decision in 2014.
These projects are crucial as they will lead the way for major changes to offshore wind farms that will drive downcosts including:
• The introduction of 6MW-Class Turbines.
• The establishment of mass produced support structures.
• The use of HVDC connections for far from shore sites.
Successful implementation of these projects will buildconfidence in the market and lead to a process of learning-by-doing.
Timing is very tight for projects reaching FID in 2014. They willhave to submit their consent application this year (2012) andwill have to receive key project consents in 2013. In order tomeet this timeline, developers will have to make substantialcommitments for long lead time items prior to gainingconsent, often in the range of hundreds of millions of pounds(eg for grid user commitments and turbine and offshore sub-station reservation fees).
Within this context, exhibit 5.4 highlights those prerequisiteswhich must be fully in place for FID 2014 projects but whichare not now.
Market demand must be reinforced in orderto create confidence in the market
Through the engagement process for this project, developersand supply chain companies have consistently raised concernsrelating to the current regulatory framework – in particulareconomic support mechanisms, consenting, and the offshoretransmission regime. These concerns and uncertainties make itmore difficult for developers to finance projects, and for thesupply chain to assess the future demand for their productsand services; all of which holds back potential cost reduction.
Key concerns related to economic support mechanisms are as follows:
• Within the lifetime of this project, DECC and the DevolvedAdministrations have undertaken consultations on futurebandings for the Renewables Obligation (RO) that willapply to future renewable energy projects that qualifyunder the scheme out to March 2017. Whilst the newbandings have now been clarified, there remains someuncertainty surrounding the future price of ROCs, bothbefore and after the introduction of the feed-in tariff.
• The replacement of the RO scheme by a Feed-in Tariff (FiT)mechanism, as set out in the Electricity Market Reform(EMR) proposals and the Energy Bill. The Feed in Tariff willapply to all offshore wind projects that come on-line from1st April 2017 and will ensure the generator is paid a fixedamount (£/MWh) for each unit of output. Although it isnow known that National Grid Plc will be the administratorof the FiT system, key questions need to be addressed inrelation to the role of the administrator, the counterpartyfor FiT contracts, the overall allocation available foroffshore wind, the FiT allocation process, and the strike price.
• The timetable for the implementation of the EMR and theFeed in Tariff is extremely tight, and many future projectswill soon need to know the support they will receive underthe feed-in tariff mechanism in order to progress to FinalInvestment Decision. For example, a project coming on-line just after the RO end date of March 2017 couldneed to secure its FiT contract in 2013/14. DECC hasannounced FID enabling measures for any projects caught in the transitional period which would otherwisebe delayed.
57
Exhibit 5.4 Offshore wind prerequisites– FID 2014 gaps
Pre-requisite Status Gap
A robust policy framework mandating demand for offshore wind
A predictable flow of projects emerging from the consenting process
Developers pass through of market demand
Availability of consented sites for coastal manufacturing and assembly
Collaborative working
Human capital
Uncertainty on EMR / FiTsLevy Control Framework set to 2015
More clarity required on EMR mechanismand transitional arrangements
Unclear funding limits after 2015
Process not yet proven
Most fabrication yards and installers report limited pass through
Majority of industry have neither the attitude northe incentive structures for collaborative working.
Skill development programmes need to be uprated? Build offshore experience more rapidly?
New process in place
Some framework contracts and back integration
Siemens, Samsung and Gamesa have announcedplans for the UK, plus Areva and Alstom in France.
Some vertical collaboration through alliancing and long term contracts.
Currently difficulties associated with obtaining peple with the correct skills.
Source: Finance workstream report, Technology workstream report, Supply chain workstream report, The Crown Estate

• In view of the increased focus on energy affordability, a key consideration for all offshore wind players is the levelof public funding that the UK government will makeavailable (ie through consumers paying a premium onenergy bills) to renewable energy over the next decade,and what happens if that level is exceeded. At present,money available to fund renewable energy is cappedunder the Levy Control Framework. The currentframework runs for the term of this government (ie untilMay 2015) and is likely to be reset for the expected periodof the next government (May 2015 – May 2020). However, at present investors have no guidance as to thelikely level of the cap, and whether it will be sufficient tocover offshore wind deployment (under any of theindustry stories) as well as other renewable energytechnologies and schemes like Warm Front.
In addition potential issues remain on consenting. The newlyestablished consenting process needs to be proven. In particular it is critical that the next wave of major projectsthat have recently entered the consenting process (such asGalloper and Triton Knoll) or will apply this year gain theirconsents in 2013.
Offshore wind farm demand must be passed through fromdevelopers to the supply chain. There are some indications ofthis beginning to occur, for example:
• Framework agreements have been put in place betweenRWE and RePower on turbines and DONG Energy andBladt for monopiles.
• Some developers have back integrated into turbineinstallation vessels, such as Centrica (through a long termcharter), RWE and DONG Energy.
The feedback from the supply chain, in particular foundationsuppliers and installers, is strongly that more needs to be doneto ensure a flow of supply chain investment in time for FID2014 projects.
Finally, in order to achieve the key cost reductions ontransmission, there is a requirement for a stable andpredictable offshore transmission policy framework.
The policy landscape for the transmission sector has beenvolatile over recent times. Whilst this is inevitable in order tobring the fundamental changes needed in the sector, the sheer volume of initiatives – none of which can beconsidered in isolation – appears to be a contributing factor tooverall industry uncertainty. For example, Ofgem’s recentreview of transmission charging and connection securityrequirements (both under the auspices of ‘Project TransmiT‘)could have led to fundamental changes to the commercialframework for developers. Recent decisions on connectionsecurity and the direction of travel for charging suggest thatchange will be less radical than could have been, but this wasunclear until relatively recently. These developments providewelcome stability. However, uncertainty remains on the
horizon in these key areas, particularly how thesearrangements will evolve to adequately cater for a coordinatedonshore/offshore grid, where the risk/reward profile may needto differ going forward in order to sufficiently incentivisebehaviours across the sector. Other regulatory initiatives thathave been progressed along similar timeframes include theongoing development of the enduring OFTO regime, the emergence of a new regulatory model for interconnectors,and to the encouragement of better onshore/offshorenetwork coordination. These sit alongside wider developmentssuch as EMR and establishing new consenting processes.
As decisions in each of these areas have been or are taken(and the requisite delivery mechanisms deployed) thelandscape has and will continue to become clearer thusenabling developers to pursue projects against a stablebackdrop. However, there is still uncertainty in key policyareas: the enduring OFTO regime is still being developed and there is a lack of clarity on how different types of transmissionasset (eg that involve combinations of onshorereinforcements, offshore generation and connections andinterconnection) would be treated.
Urgent issues must be addressed aroundmanufacturing and assembly sites andcollaborative working
In order to supply and construct FID 2014 projects, turbinemanufactures will need to have consented coastal sites forturbine manufacture and developers will need access to largeareas of high specification quayside lay down and marshallingareas. This prerequisite is apparently not fully in place.
At present Siemens, Samsung and Gamesa have announcedplans to establish turbine manufacturing facilities in the UK.None however, have a consented site for 6MW-Class Turbinemanufacturing. Only one developer, DONG Energy has aconsented site for assembly / lay down (Belfast).
Turbine manufacture could be done at any suitable site on theNorth Sea (eg Germany, Denmark, etc). This is particularlyimportant in the Technology Acceleration story, in which 50%of turbines at FID 2014, are of the new 6MW-Class.
Similarly assembly could be done on continental sites forNorth Sea wind farms (although this is more difficult forprojects in the Irish Sea or Bristol Channel.
A number of continental options exist for both turbinemanufacture and assembly including St Nazaire, Cherbourg,Eemshvaven and Ostende should enough UK sites not beavailable, but with a potential loss of UK economic benefit.
In order to deliver FID 2014 projects, collaborative working will be needed to meet very tight timelines. This is particularlytrue of Sites B, C and D, which will all require new forms offoundations and HVDC connections to shore. Although theinitial steps have been taken, industry reports that neither theattitudes nor the incentive structures needed are yet in place.
58
Offshore wind cost reduction pathways study
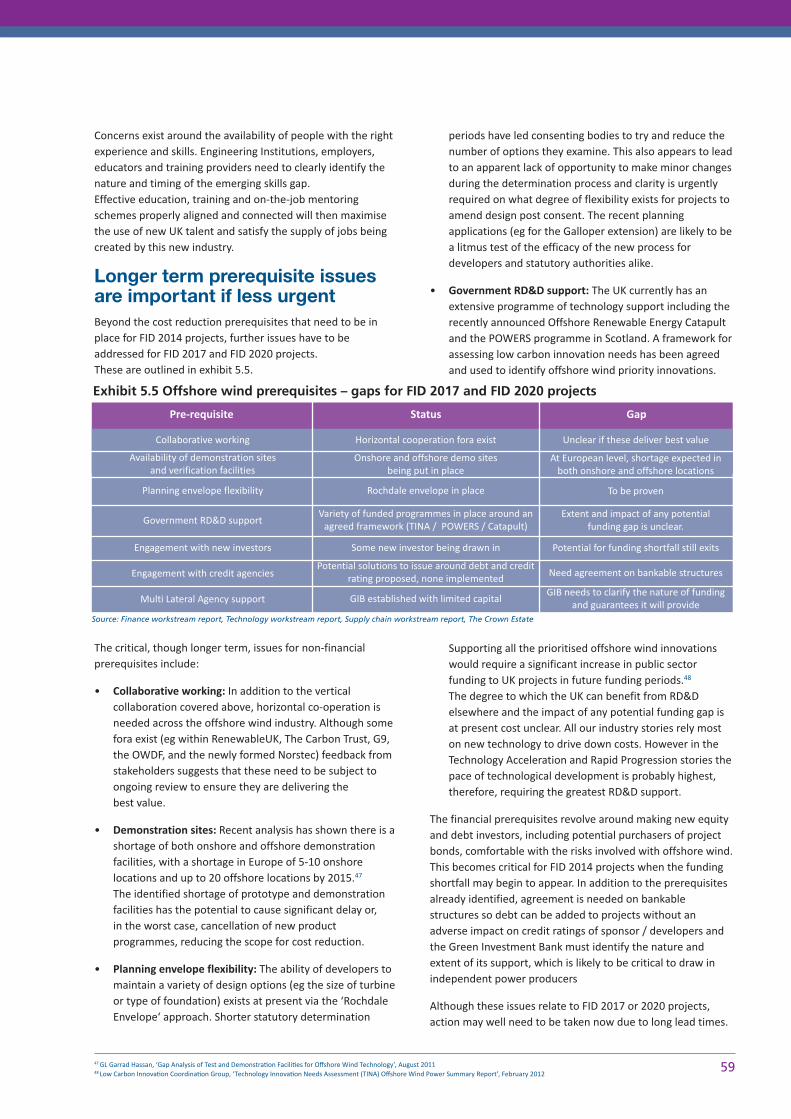
Concerns exist around the availability of people with the rightexperience and skills. Engineering Institutions, employers,educators and training providers need to clearly identify thenature and timing of the emerging skills gap. Effective education, training and on-the-job mentoringschemes properly aligned and connected will then maximisethe use of new UK talent and satisfy the supply of jobs beingcreated by this new industry.
Longer term prerequisite issuesare important if less urgentBeyond the cost reduction prerequisites that need to be inplace for FID 2014 projects, further issues have to beaddressed for FID 2017 and FID 2020 projects. These are outlined in exhibit 5.5.
The critical, though longer term, issues for non-financialprerequisites include:
• Collaborative working: In addition to the verticalcollaboration covered above, horizontal co-operation isneeded across the offshore wind industry. Although somefora exist (eg within RenewableUK, The Carbon Trust, G9,the OWDF, and the newly formed Norstec) feedback fromstakeholders suggests that these need to be subject toongoing review to ensure they are delivering the best value.
• Demonstration sites: Recent analysis has shown there is ashortage of both onshore and offshore demonstrationfacilities, with a shortage in Europe of 5-10 onshorelocations and up to 20 offshore locations by 2015.47
The identified shortage of prototype and demonstrationfacilities has the potential to cause significant delay or, in the worst case, cancellation of new productprogrammes, reducing the scope for cost reduction.
• Planning envelope flexibility: The ability of developers tomaintain a variety of design options (eg the size of turbineor type of foundation) exists at present via the ‘RochdaleEnvelope‘ approach. Shorter statutory determination
periods have led consenting bodies to try and reduce thenumber of options they examine. This also appears to leadto an apparent lack of opportunity to make minor changesduring the determination process and clarity is urgentlyrequired on what degree of flexibility exists for projects toamend design post consent. The recent planningapplications (eg for the Galloper extension) are likely to bea litmus test of the efficacy of the new process fordevelopers and statutory authorities alike.
• Government RD&D support: The UK currently has anextensive programme of technology support including therecently announced Offshore Renewable Energy Catapultand the POWERS programme in Scotland. A framework forassessing low carbon innovation needs has been agreedand used to identify offshore wind priority innovations.
Supporting all the prioritised offshore wind innovationswould require a significant increase in public sectorfunding to UK projects in future funding periods.48
The degree to which the UK can benefit from RD&Delsewhere and the impact of any potential funding gap isat present cost unclear. All our industry stories rely moston new technology to drive down costs. However in theTechnology Acceleration and Rapid Progression stories thepace of technological development is probably highest,therefore, requiring the greatest RD&D support.
The financial prerequisites revolve around making new equityand debt investors, including potential purchasers of projectbonds, comfortable with the risks involved with offshore wind.This becomes critical for FID 2014 projects when the fundingshortfall may begin to appear. In addition to the prerequisitesalready identified, agreement is needed on bankablestructures so debt can be added to projects without anadverse impact on credit ratings of sponsor / developers andthe Green Investment Bank must identify the nature andextent of its support, which is likely to be critical to draw inindependent power producers
Although these issues relate to FID 2017 or 2020 projects,action may well need to be taken now due to long lead times.
5947 GL Garrad Hassan, ‘Gap Analysis of Test and Demonstra�on Facili�es for Offshore Wind Technology’, August 201148 Low Carbon Innova�on Coordina�on Group, ‘Technology Innova�on Needs Assessment (TINA) Offshore Wind Power Summary Report’, February 2012
Exhibit 5.5 Offshore wind prerequisites – gaps for FID 2017 and FID 2020 projects
Pre-requisite Status Gap
Collaborative working Horizontal cooperation fora exist Unclear if these deliver best value
At European level, shortage expected in both onshore and offshore locations
To be proven
Extent and impact of any potential funding gap is unclear.
Potential for funding shortfall still exits
Need agreement on bankable structures
GIB needs to clarify the nature of fundingand guarantees it will provide
Onshore and offshore demo sites being put in place
Rochdale envelope in place
Variety of funded programmes in place around anagreed framework (TINA / POWERS / Catapult)
Some new investor being drawn in
Potential solutions to issue around debt and creditrating proposed, none implemented
GIB established with limited capital
Availability of demonstration sites and verification facilities
Planning envelope flexibility
Government RD&D support
Engagement with credit agencies
Engagement with new investors
Multi Lateral Agency support
Source: Finance workstream report, Technology workstream report, Supply chain workstream report, The Crown Estate
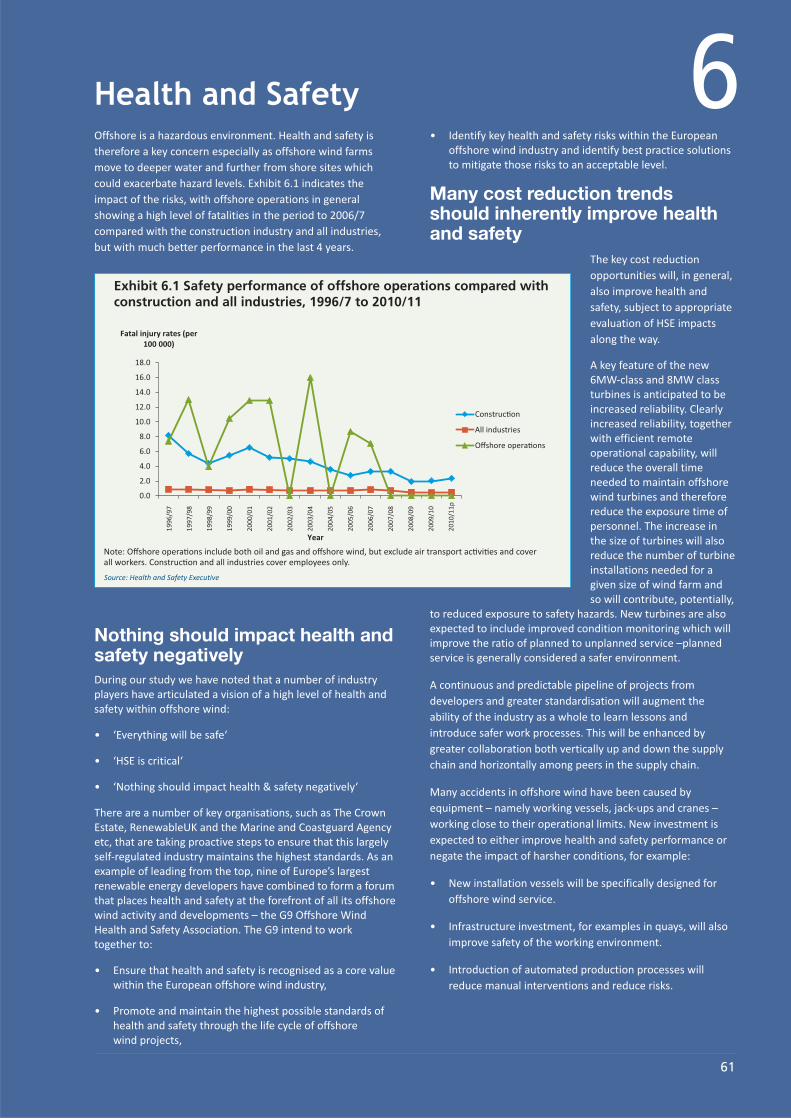
61
Health and SafetyOffshore is a hazardous environment. Health and safety istherefore a key concern especially as offshore wind farmsmove to deeper water and further from shore sites whichcould exacerbate hazard levels. Exhibit 6.1 indicates theimpact of the risks, with offshore operations in generalshowing a high level of fatalities in the period to 2006/7compared with the construction industry and all industries,but with much better performance in the last 4 years.
Nothing should impact health andsafety negativelyDuring our study we have noted that a number of industryplayers have articulated a vision of a high level of health andsafety within offshore wind:
• ‘Everything will be safe‘
• ‘HSE is critical‘
• ‘Nothing should impact health & safety negatively‘
There are a number of key organisations, such as The CrownEstate, RenewableUK and the Marine and Coastguard Agencyetc, that are taking proactive steps to ensure that this largelyself-regulated industry maintains the highest standards. As anexample of leading from the top, nine of Europe’s largestrenewable energy developers have combined to form a forumthat places health and safety at the forefront of all its offshorewind activity and developments – the G9 Offshore WindHealth and Safety Association. The G9 intend to work together to:
• Ensure that health and safety is recognised as a core valuewithin the European offshore wind industry,
• Promote and maintain the highest possible standards ofhealth and safety through the life cycle of offshore wind projects,
• Identify key health and safety risks within the Europeanoffshore wind industry and identify best practice solutionsto mitigate those risks to an acceptable level.
Many cost reduction trendsshould inherently improve healthand safety
The key cost reductionopportunities will, in general,also improve health andsafety, subject to appropriateevaluation of HSE impactsalong the way.
A key feature of the new6MW-class and 8MW classturbines is anticipated to beincreased reliability. Clearlyincreased reliability, togetherwith efficient remoteoperational capability, willreduce the overall timeneeded to maintain offshorewind turbines and thereforereduce the exposure time ofpersonnel. The increase inthe size of turbines will alsoreduce the number of turbineinstallations needed for agiven size of wind farm andso will contribute, potentially,
to reduced exposure to safety hazards. New turbines are alsoexpected to include improved condition monitoring which willimprove the ratio of planned to unplanned service –plannedservice is generally considered a safer environment.
A continuous and predictable pipeline of projects fromdevelopers and greater standardisation will augment theability of the industry as a whole to learn lessons andintroduce safer work processes. This will be enhanced bygreater collaboration both vertically up and down the supplychain and horizontally among peers in the supply chain.
Many accidents in offshore wind have been caused byequipment – namely working vessels, jack-ups and cranes –working close to their operational limits. New investment isexpected to either improve health and safety performance ornegate the impact of harsher conditions, for example:
• New installation vessels will be specifically designed foroffshore wind service.
• Infrastructure investment, for examples in quays, will alsoimprove safety of the working environment.
• Introduction of automated production processes willreduce manual interventions and reduce risks.
0.0
2.0
4.0
6.0
8.0
10.0
12.0
14.0
16.0
18.0
Fatal injury rates (per 100 000)
Year
Construc�on
All industries
Offshore opera�ons
1996
/97
1997
/98
1998
/99
1999
/00
2000
/01
2001
/02
2002
/03
2003
/04
2004
/05
2005
/06
2006
/07
2007
/08
2008
/09
2009
/10
2010
/11p
Exhibit 6.1 Safety performance of offshore operations compared withconstruction and all industries, 1996/7 to 2010/11
Note: Offshore opera�ons include both oil and gas and offshore wind, but exclude air transport ac�vi�es and coverall workers. Construc�on and all industries cover employees only.
Source: Health and Safety Executive
6

New installation methods (float out and sink and buoyantconcrete gravity bases) will reduce the need for heavy liftoperations offshore and so also offer the potential for safer working.
There is therefore no inherent incompatibility between healthand safety and cost reduction; indeed we expect them to workcontemporaneously in all cases.
High risk operations and safety bydesign need to be addressedOur analysis has shown a number of health and safety relatedissues need to be addressed.
• Helicopter: There is the potential for some operators touse helicopter access as part of their O&M approach.Helicopters are a high risk operation even in matureapplications such as offshore oil and gas. Depending onthe extent of use, this may become an area of concern. Itis worthy of note that oil & gas H&S performance statisticsdo not include air travel.
• Divers: Diving is a high risk operation and is currently usedduring installation to intervene in vessel repair, cableinstallation and repair, inspections of structures,protection systems, recovery of dropped object and the like. To improve health and safety performance, use of diving must be reduced or eliminated. This willinvolve both technology (eg use of specially adapted ROVs– ‘the right tools!‘) and careful design (to reduce oreliminate root causes)
• Safety by design: This is a key area where we must focuslonger and harder, including quantifying reliability casesfor key components. The Crown Estate – Offshore WindCost Reduction Pathway Development – PMSS health &safety guidance note – dated 2 September 2011 givesdetailed consideration of the health and safety indicatorsand relevant reference documentation.
• Worker health & welfare: As more projects are built andmaintained further from shore new challenges willemerge, particularly around the behavioural aspect ofsafety management and welfare considerations. Whetherworking remotely from a fixed platform, or aboard one ofthe new mothership concepts, attention will need to bepaid to patterns of working and rest and the need to keephealth and safety top of mind in all situations. Clearly,valuable lessons from the oil and gas industry can beadopted in many cases and modified where the windindustry has different requirements and hazard levels.
• 24/7 working: We need clear evaluation of the Implicationof, and increase in 24/7 working – the influence onaccommodation, fatigue, working time directives, staffing levels and quantity of competent resourcerequirements in the industry to facilitate this.
Taking the leadThe three primary areas of health and safety performance,safe equipment, safe procedures and safe behaviour need tobe tackled holistically within the industry.
The concern often voiced is that too narrow a focus on drivingdown capital and operational costs could impact negatively onhealth and safety performance. As we have concluded, most ofthe areas where we would expect that levelised costs could bereduced have an inherently beneficial impact on risk andhazard exposure and reduction, in all phases of the life cycle ofan offshore wind farm asset. However, some of the necessarychanges to technology, working methods and equipment willbring both opportunity and threat and it will be important thatat all levels of the supply chain, clear leadership on safetymatters will be required, to ensure the holistic approach tohealth and safety is followed and not simply a one-dimensional response.
Much can also be learned from similar industries that havebeen implementing their own cost reduction initiatives and atthe same time improving health and safety performance andculture. Both the onshore construction industry and theoffshore oil and gas industry have developed effectiveprogrammes that deal with both of these issues in a mutuallybeneficial way and the offshore wind sector needs to takethese lessons and apply them in an appropriate way. The goal should be a cost-effective industry with an exemplaryhealth and safety record that sets a new standard forperformance in this environment.
62
Offshore wind cost reduction pathways study
There is a very considerable prize to be won by reducing theLCOE of offshore wind to levels competitive with other formsof [low carbon] generation. This will unlock up to £68 billion inwind farm investment by the mid 2020s as well as many largeinvestments within the supply chain, for example in windturbine and component manufacture, port infrastructure,operations and maintenance bases, etc. Lowering the LCOE ofoffshore wind will also reduce the burden on consumer energy bills.49
This will result in a more secure energy supply, the generationof jobs and unique expertise, and a material contribution totackling carbon emissions. It will also serve to position the UKas the clear leader in offshore renewable energy generation,providing the UK with valuable export opportunities.
We have identified a number of pathways that result in costsof £100/MWh or lower for projects reaching FID in 2020:Rapid Growth, Technology Acceleration and Supply ChainEfficiency. The fact that there is no single ‘silver bullet’, eitherin terms of technologies or changes in the supply chain, givesconfidence that the pathways we describe are robust,providing multiple routes by which this figure could beachieved. This variety of approaches increases confidence thatthis target could be reached, enables key players to progresstheir solutions within an ‘envelope‘ of possibilities, andprovides an important element of redundancy if somepromising initiatives do not succeed.
Our Rapid Growth story is deliberately a way of testing theboundaries of what is possible and shows that, if everythinggoes well, reaching an offshore wind LCOE below £90/MWh isconceivable for projects reaching FID in 2020. Our TechnologyAcceleration and Supply Chain Efficiency stories show thatcosts of £100/MWh in 2020 can be achieved either through anemphasis on new technologies , new construction methodsand a high level of R&D; or a focus on economies of scale,standardisation and more competition. These highlight anatural tension between developers of new technologies andmethods on the one hand and financiers and wind farmdevelopers on the other. The search for the optimum balancewill be a constant concern for the whole industry and is likelyto emerge from the decisions of individual players. All three ofthese pathways are fundamentally underpinned by a steadilygrowing market for offshore wind.
The Slow Progression scenario illustrates, among other things,the potential impact of a less conducive market. The LCOEremains stubbornly high through most of the decade until FID 2020. Feedback is that Slow Progression is by no means aworst-case scenario.
Our pathways are not projections or LCOE forecasts. Significantincreases in input costs could move us away from thepathways we describe although many of these (such as steelprices and exchange rates) will also impact other forms of lowcarbon and traditional forms of generation. In the future themain ‘wild card’ or external event that could jeopardise the
cost reduction pathways is a rapid increase in demand foroffshore vessels and skilled personnel from the oil and gassector. There is a natural hedge to this ‘wild card’ as it is mostlikely to occur in combination with surging oil and gas prices,which in turn will make offshore wind more competitive withfossil fuel based electricity generation.
All four stories require the raising of significant amounts ofcapital probably from a wider variety of sources.The pre-requisites we have identified address cost reduction
and the potential for a funding shortfall. Through timely andcoordinated action to put in place the pre-requisites, the offshore wind sector could enter a virtuous spiral of riskreduction and transparent asset performance leading to lowerrequired returns and greater appetite for investment.
Many of the 120 companies and organisations involved in thisstudy have key decisions to make which will contribute to costreduction. These decisions are highly complex and tightlyintegrated. Successful cost reduction will, therefore, requirepartnership between Government (including centralGovernment, the Devolved Administrations, planning andconsenting authorities and regulators), developers, Tier 1 and2 suppliers and the finance community (which itself is broadand varied).
Government’s role is largely to deliver the pre-requisites forthe development of a steadily increasing market that willsupport investment. This means putting in place a robustframework for mandating offshore wind demand and ensuringthe new consenting processes works in practice, hencedelivering a predictable flow of projects and consented coastalmanufacturing and other sites. These pre-requisites are notfully in place and urgent action is required. Longer term theGovernment has a role in ensuring the consenting processdelivers the flexibility that is currently envisaged, supporting RD&D, and engaging with and removing obstaclesto new investors investing in offshore wind (including betterclarification on the role of the GIB).
Many actions fall squarely with industry and a large proportionof these are essentially ‘no regret‘ activities. Industry is in thedriving seat directly to implement cost reductions such as theintroduction of larger, more reliable turbines. However,industry also has a very important role to establish theprerequisites for cost reduction. Developers must pass throughmarket signals and certainty to their key suppliers in order forthem to invest. Industry as a whole also needs to becomemuch more comfortable with working collaboratively,challenging attitudes, and agreeing appropriate incentivestructures. Industry also has a key role in supporting orestablishing further demonstration and other testing facilities(potentially with some Government support) and engagingwith the finance community to help them get morecomfortable with the balance of risk and reward available inoffshore wind.
6349 For a quan�fica�on of the benefit to the UK of reducing the costs of offshore power wind see: Low Carbon Innova�on Coordina�on Group, ‘Technology Innova�on Needs Assessment (TINA) Offshore Wind Power Summary Report’, February 2012.
Conclusions 7

With a large number of programmes of work undertaken byvarious agencies and organisations it is essential that they are pulled together in a coherent, structured and measuredway as:
• Many different decisions and work programmes are closely intertwined.
• Confidence will grow as tangible success is achieved andwell communicated.
• Changes will inevitably occur which will require aconsidered and collective response from the sector as a whole.
The DECC/Industry Cost Reduction Taskforce will address how this might be achieved and under what governance. In presenting this detailed evidence to the Taskforce, The Crown Estate reaffirms its commitment to assist industryand Government in setting and reaching targets designed tomaximise the value of offshore wind to the benefit of the UK.
64
Offshore wind cost reduction pathways study

AEP Annual Energy Production
BSUOS Balancing Services Use of System
CCGT Combined Cycle Gas Turbines
CfDs Contracts for Differences
EMR Energy Market Reform
FEED Front End Engineering and Design
FID Final Investment Decision
FiT Feed-in Tariff
H&S Health & Safety
GIB Green Investment Bank
IIPs Independent Power Producers
LCOE Levelised Cost of Energy
LCF Levy Control Framework
MLA Multi-Lateral Agency
OFTO Offshore Transmission Owner
PE Private Equity
RUK RenewableUK
STW Scottish Territorial Waters
TNUoS Transmission Network Use of System
WACC Weighted Average Cost of Capital
65
Glossary


• Mott MacDonald for DECC, UK Electricity Generation Costs Update, 2010
• Parsons Brinckerhoff for DECC, Electricity Generation Cost Model Update 2011, 2011
• Ernst and Young for DECC, Cost of and financial support for offshore wind, 2009
• Garrad Hassan for BWEA, UK Offshore Wind: Charting the Right Course, 2009, http://www.bwea.com/pdf/publications/ChartingtheRightCourse.pdf
• Garrad Hassan for WINDSPEED, Inventory of location specific wind energy cost, 2011, http://www.windspeed.eu/publications.php?id=19 (WP2 Report D2.2)
• UKERC, Great Expectations – The costs of offshore wind in UK waters, 2010, http://www.ukerc.ac.uk/support/tiki-read_article.php?articleId=613
• PricewaterhouseCoopers, Turning Windpower promise into performance, 2011, http://www.pwc.com/gx/en/utilities/publications/pwc-offshore-windpower-survey.jhtml
• Garrard Hassan for the Danish Ministry of Climate and Energy, Background Report 2: Analysis of competitive conditions withinthe offshore wind sector, 2011, http://www.ens.dk/daDK/UndergrundOgForsyning/VedvarendeEnergi/Vindkraft/Havvindmoeller/Fremtidens%20havmoelleparker/Documents/Deloitte%20Background%20report%202%20%20Analysis%20of%20competitive%20conditions%20within%20the%20offshore%20wind%20sector.pdf
• Mott MacDonald for The Committee on Climate Change, Costs of low-carbon generation technologies, 2011
• Carbon Trust, Offshore wind: big challenge, big opportunity, 2009, http://www.carbontrust.co.uk/publications/pages/publicationdetail.aspx?id=CTC743
• Arup for DECC, Review of the generation costs and deployment potential of renewable electricity technologies in the UK, 2011,http://www.decc.gov.uk/assets/decc/What%20we%20do/UK%20energy%20supply/Energy%20mix/Renewable%20energy/policy/renew_obs/1834-review-costs-potential-renewable-tech.pdf
67
Appendix A - Recent Analyses ofOffshore Wind Costs

This Appendix details assumptions made within the projectwhich are not covered in the individual workstream reports.
Global assumptions• Modelling in real (2011) prices
• Commodity prices fixed at average 2011 levels
• Exchange rates fixed at average 2011 levels
• Energy prices fixed at average 2011 levels
• Energy Policy – it is assumed that EMR progresses onschedule as set out in the White Paper (July 2011), with Feed-in Tariff Contract for Difference (CfDs) as thesole support mechanism from April 2017; and ROC re-banding is implemented as stated in the consultationdocument (October 2011).
Baseline wind farm cost elementassumptions• Size: 500MW wind farm
• Operational life: design certified for operational life of 20 years
• Array cabling: 33kV on fully flexible strings (in base case) ie provision to isolate an individual turbine and for theisolated turbines on the string make live a connection toanother string
• Ground conditions: characterised by geotech pre-FID, with 20 per cent of foundation locations deemed moredifficult (eg soft, rocky, gradient)
• Energy yield: an expected (P50) value has been calculatedfor each datapoint (i.e. each combination of site, year,turbine, story), and used as the base case for the model.This represents the average yield across all years ofoperation (taking the variability of wind speed across yearsand degradation into account).P10/P90 values for energyyield have also been estimated, at +/- 11% around the P50value (in the base case).
• Baseline turbines reaching FID in 2011 (to whichinnovations are applied for subsequent years): 3 bladedupwind, 3 stage gearbox, part conversion, DFIG 1500 rpm690V output, 88 m/s tip speed. The turbine cost excludesthe tower as this is counted under the support structure.
• 4 MW, 120 m diameter, specific rating of 354 W/m2
• 6 MW, 147 m diameter, specific rating of 354 W/m2
• 8 MW, 169 m diameter, specific rating of 354 W/m2
• Support structure: includes the jacket plus the tower
• installation:
• Sequential installation of jacket, array cable, then pre-assembled tower and turbine together
• Jack-up collecting components from installation port.
• Distance to installation port assumed equal to distance to nearest O&M port.
• Array cables installed via J-tubes, one cable vessel and ROV
• Decommissioning: Reverse assembly process toinstallation taking 1 year. Piles and cables cut off at a depthbelow seabed which is unlikely to lead to uncovering.Environmental monitoring conducted at end. Residualvalue and the cost of scrapping have been ignored.
• Operations and Maintenance: Access by work boats andmother ship / accommodation platform for site D. Jack-upsused for major component replacement.
• Transmission: this has been factored into the model as anannual TNUoS (Transmission Network Use of System)charge rather than as CAPEX. Charges have been derivedfor the sites in accordance with a National Grid Guidancenote: TNUoS charges for Offshore Generators, which canbe found at: http://www.nationalgrid.com/NR/rdonlyres/869AF29F-0CBE-4189-97D5-
562CBD01AD86/44194/GuidetooffshoreTNUoStariffs.pdf
Capital costs for the assets were largely taken fromNational Grid’s 2011 Offshore Development InformationStatement at:http://www.nationalgrid.com/uk/Electricity/OffshoreTransmission/ODIS/.
The model also factors in BSUoS charges (BalancingServices Use of System), which have been calculated as setout in the following note:http://www.nationalgrid.com/uk/Electricity/Balancing/bsuos/
Contracting and finance assumptions (base case, FID 2011)
• In the baseline, it is assumed that the development andconstruction costs of the wind farm are funded entirely bythe project developer, which is consistent with UKexperience to date for the sector. It is assumed howeverthat once the wind farm is operational, project finance canbe secured to a maximum level of 40 per cent, payableover a period of 14 years and priced at 325bps.
• Multi-contract approach to contracting for construction.
69
Appendix B – Key Assumptions
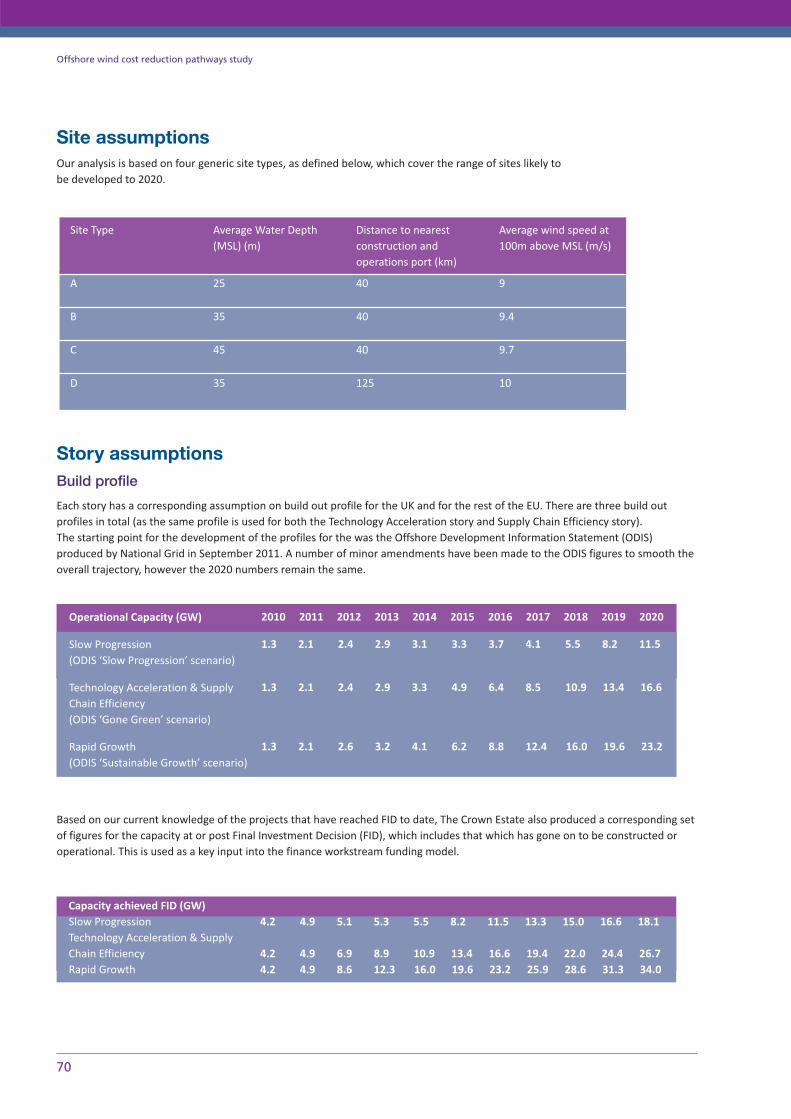
Site assumptionsOur analysis is based on four generic site types, as defined below, which cover the range of sites likely to be developed to 2020.
Story assumptionsBuild profile
Each story has a corresponding assumption on build out profile for the UK and for the rest of the EU. There are three build outprofiles in total (as the same profile is used for both the Technology Acceleration story and Supply Chain Efficiency story). The starting point for the development of the profiles for the was the Offshore Development Information Statement (ODIS)produced by National Grid in September 2011. A number of minor amendments have been made to the ODIS figures to smooth theoverall trajectory, however the 2020 numbers remain the same.
Based on our current knowledge of the projects that have reached FID to date, The Crown Estate also produced a corresponding setof figures for the capacity at or post Final Investment Decision (FID), which includes that which has gone on to be constructed oroperational. This is used as a key input into the finance workstream funding model.
70
Offshore wind cost reduction pathways study
A
B
C
D
25
35
45
35
40
40
40
125
9
9.4
9.7
10
Site Type Average Water Depth(MSL) (m)
Distance to nearestconstruction andoperations port (km)
Average wind speed at100m above MSL (m/s)
2010 2011 2012 2013 2014 2015 2016 2017 2018 2019 2020
1.3 2.1 2.4 2.9 3.1 3.3 3.7 4.1 5.5 8.2 11.5
1.3 2.1 2.4 2.9 3.3 4.9 6.4 8.5 10.9 13.4 16.6
1.3 2.1 2.6 3.2 4.1 6.2 8.8 12.4 16.0 19.6 23.2
Operational Capacity (GW)
Slow Progression(ODIS ‘Slow Progression’ scenario)
Technology Acceleration & Supply Chain Efficiency(ODIS ‘Gone Green’ scenario)
Rapid Growth(ODIS ‘Sustainable Growth’ scenario)
Capacity achieved FID (GW)Slow Progression 4.2 4.9 5.1 5.3 5.5 8.2 11.5 13.3 15.0 16.6 18.1 Technology Acceleration & Supply Chain Efficiency 4.2 4.9 6.9 8.9 10.9 13.4 16.6 19.4 22.0 24.4 26.7Rapid Growth 4.2 4.9 8.6 12.3 16.0 19.6 23.2 25.9 28.6 31.3 34.0
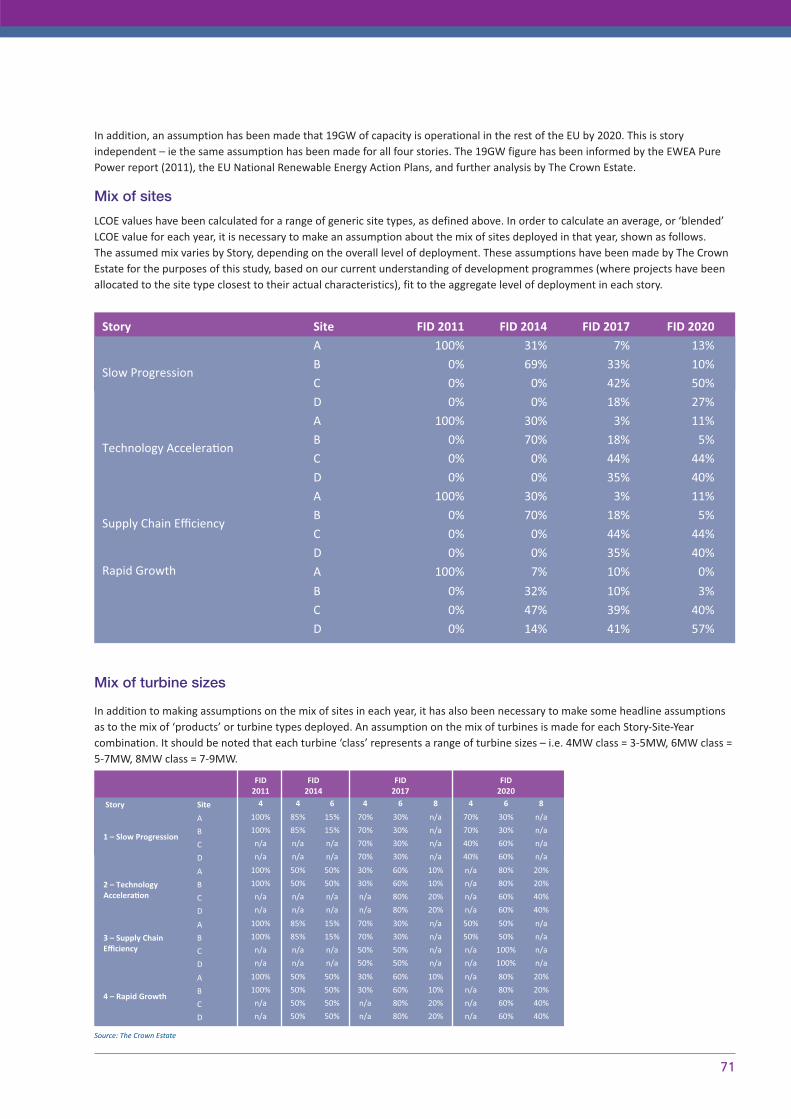
In addition, an assumption has been made that 19GW of capacity is operational in the rest of the EU by 2020. This is storyindependent – ie the same assumption has been made for all four stories. The 19GW figure has been informed by the EWEA PurePower report (2011), the EU National Renewable Energy Action Plans, and further analysis by The Crown Estate.
Mix of sites
LCOE values have been calculated for a range of generic site types, as defined above. In order to calculate an average, or ‘blended’LCOE value for each year, it is necessary to make an assumption about the mix of sites deployed in that year, shown as follows. The assumed mix varies by Story, depending on the overall level of deployment. These assumptions have been made by The CrownEstate for the purposes of this study, based on our current understanding of development programmes (where projects have beenallocated to the site type closest to their actual characteristics), fit to the aggregate level of deployment in each story.
Mix of turbine sizes
In addition to making assumptions on the mix of sites in each year, it has also been necessary to make some headline assumptionsas to the mix of ‘products’ or turbine types deployed. An assumption on the mix of turbines is made for each Story-Site-Yearcombination. It should be noted that each turbine ‘class’ represents a range of turbine sizes – i.e. 4MW class = 3-5MW, 6MW class =5-7MW, 8MW class = 7-9MW.
71
Story Site FID 2011 FID 2014 FID 2017 FID 2020
Slow Progression
A 100% 31% 7% 13% B 0% 69% 33% 10% C 0% 0% 42% 50% D 0% 0% 18% 27%
Technology Accelera�on
A 100% 30% 3% 11% B 0% 70% 18% 5% C 0% 0% 44% 44% D 0% 0% 35% 40%
Supply Chain Efficiency
A 100% 30% 3% 11% B 0% 70% 18% 5% C 0% 0% 44% 44% D 0% 0% 35% 40%
Rapid Growth A 100% 7% 10% 0%
B 0% 32% 10% 3% C 0% 47% 39% 40% D 0% 14% 41% 57%
FID
2011 FID
2014 FID
2017 FID
2020
Story Site 4 4 6 4 6 8 4 6 8
1 – Slow Progression
A 100% 85% 15% 70% 30% n/a 70% 30% n/a
B 100% 85% 15% 70% 30% n/a 70% 30% n/a
C n/a n/a n/a 70% 30% n/a 40% 60% n/a
D n/a n/a n/a 70% 30% n/a 40% 60% n/a
2 – Technology Accelera�on
A 100% 50% 50% 30% 60% 10% n/a 80% 20%
B 100% 50% 50% 30% 60% 10% n/a 80% 20%
C n/a n/a n/a n/a 80% 20% n/a 60% 40%
D n/a n/a n/a n/a 80% 20% n/a 60% 40%
3 – Supply Chain Efficiency
A 100% 85% 15% 70% 30% n/a 50% 50% n/a
B 100% 85% 15% 70% 30% n/a 50% 50% n/a
C n/a n/a n/a 50% 50% n/a n/a 100% n/a
D n/a n/a n/a 50% 50% n/a n/a 100% n/a
4 – Rapid Growth
A 100% 50% 50% 30% 60% 10% n/a 80% 20%
B 100% 50% 50% 30% 60% 10% n/a 80% 20%
C n/a 50% 50% n/a 80% 20% n/a 60% 40%
D n/a 50% 50% n/a 80% 20% n/a 60% 40%
Source: The Crown Estate

PurposeThe Offshore Wind Cost Reduction Pathways project is a studyled by The Crown Estate to assist industry and government indeveloping a common view as to the cost reductions that canbe achieved in delivering new generation capacity, and thedetailed assumptions of what is required to achieve them. In order to assist and support the project team in theengagement and analysis of potential pathways it is proposedthat a Project Advisory Panel is constituted withrepresentation from both Government and Industry. Its principle remit will be to:
• Provide guidance in the manner of engagement and typesof output that will be meaningful to all parties
• Provide a sounding board within the project for industryparticipants engaged in the process
• Help to energise and broker cross-sector working duringthe project
• Assist The Crown Estate in working with the DECC CostReduction Taskforce to ensure the work of each project iscomplementary and enables effective integration of theseprogrammes of work
• Provide specific input on particular issues within theindividual members’ (and their parent organisations’)sphere of influence and knowledge
• Share progress of the project with the wider communitiesthat they represent, where required
• Identify areas in which more work or effort is required andthe most appropriate method of addressing thoseconcerns
• Generally assist The Crown Estate in managing the risk toproject delivery
MembershipThe proposed membership is as follows:
• Duarte Figueira DECC
• Allan Taylor DECC
• Mark Thomas InfrastructureUK
• Thomas Arensbach Gamesa (until March 2012)
• Ron Cookson Technip
• Gordon Edge RenewableUK
• Michael Rolls Siemens
• Richard Sandford RWE
• Christian Skakkebaek DONG Energy
• Ian Temperton Climate Change Capital
The Crown Estate members: Adrian Fox, Duncan Clark (n.b. Richard Howard from January 2012)
One corresponding member – Andrew Jamieson (Scottish Power): Chair DECC Cost reduction Taskforce
Alternates will be nominated by each of the members above,to ensure full representation at each meeting, should the mainmember be unable to attend.
If a member or their alternate is absent for two meetings thena replacement person may be invited to represent thatsegment for future meetings.
The possibility of additional corresponding members will be reviewed on application and agreed at the next available meeting.
FunctionsThe first meeting of this Panel has reviewed the draft Terms ofReference and accepts this as its working mandate.
Each member will, in addition to the general remit describedunder ‘Purpose‘ have the following specific responsibilities.
The Crown Estate will:
• prepare all necessary documentation for each meeting insufficient time to allow members to be able to respond tothe information and issues raised,
• organise relevant presentations from the workstreamconsultants and report progress and any impediments tothe panel at each meeting.
DECC (ORED) will:
• liaise as necessary with Devolved Administrations andother government departments to distribute projectprogress and information and provide a conduit forinformation to be made available to the project team fromthose bodies.
The Developers will:
• report progress of the project to any meeting of the OWDF(or its sub-groups) that takes place within the time frameof the study if that is appropriate within the agenda itemsof the meeting.
RenewableUK will:
• work to engage with their extensive member and workinggroup networks to cover a wide range of supply chaincontributions to the study.
• work to involve wider stakeholders, such as the steelindustry, which could influence the reduction in cost,
• Provide a forum for disseminating any out puts of theprocess through their programme of conferences andworkshops
• Through its affiliation with Scottish Renewables providethem with periodic updates and provide a route for theirpotential contributions to the project.
73
Appendix C - Project Panel Termsof Reference
1

Meeting arrangements
Frequency: Meetings will be held every four weeks.
Location: Meetings will normally be held at The Crown Estate’soffices. Video and teleconferencing facilities will be madeavailable where possible.
Correspondence: Any information provided by members willbe stored on an appropriate data management system relatedto this project only. Members will be notified when newinformation is published by email.
Chair: The chairperson will initially be appointed from TheCrown Estate for the duration of the study.
Administration: Minutes will be prepared and circulated byThe Crown Estate.
Reporting
• These Terms of Reference for the Panel may be reviewedat any time during its tenure by special request at anyformal meeting.
• The panel will provide suitable updates on the projectprogress to the Industry Cost Reduction Task Force.
74
Offshore wind cost reduction pathways study
This CD contains:
• BVG Associates, Offshore wind cost reduction pathways – Technology work stream, April 2012
• E C Harris, Offshore wind cost reduction pathways – Supply Chain work stream, April 2012
• PMSS, Offshore Wind Cost Reduction Pathways – Health & Safety Review, April 2012
• PricewaterhouseCoopers, Offshore wind cost reduction pathways project – Finance work stream, April 2012
• RenewableUK, Potential for offshore transmission cost reductions, February, 2012

London16 New Burlington PlaceLondon W1S 2HXTel. 020 7851 5000
Edinburgh6 Bells BraeEdinburgh EH4 3BJTel. 0131 260 6070
www.thecrownestate.co.ukAll facts and figures are correct at �me of print (May 2012).Produced by The Crown Estate 2012.
The Crown Estate is a diverse property businessvalued at more than £7 billion. We have been trustedto manage a wide range of properties across the UKincluding commercial developments, retail propertiesand rural holdings. Our portfolio includes agriculturalland, parkland and forestry. It also comprises around half of the UK’s foreshore,and almost all of the seabed around the UK out tothe 12 nautical mile territorial limit.We are above all a commercial organisation, tasked by Parliament with enhancing the value of theportfolio we manage and generating a profit for thebenefit of the nation. In the last year we concluded over £1 billion of propertytransactions, including sales and acquisitions, andalso some of the most ambitious redevelopmentschemes in the heart of London. We manage one ofthe nation's largest rural estates.
To help drive the UK's emerging offshore renewable energy industry we are investing over£100 million alongside some of the world's largestenergy companies.