Embed Size (px)
Citation preview
1 www.bea.gov
Offshore Outsourcing and Multinational Companies
J. Steven Landefeld, Director
Raymond Mataloni, Senior Economist
U.S. Bureau of Economic Analysis
The Brookings Institution
Services Offshoring: What Do the Data Tell Us?
June 22, 2004
Views expressed in this presentation are those of the presenters and do not necessarily reflect those of the Bureau of Economic Analysis.
2 www.bea.gov
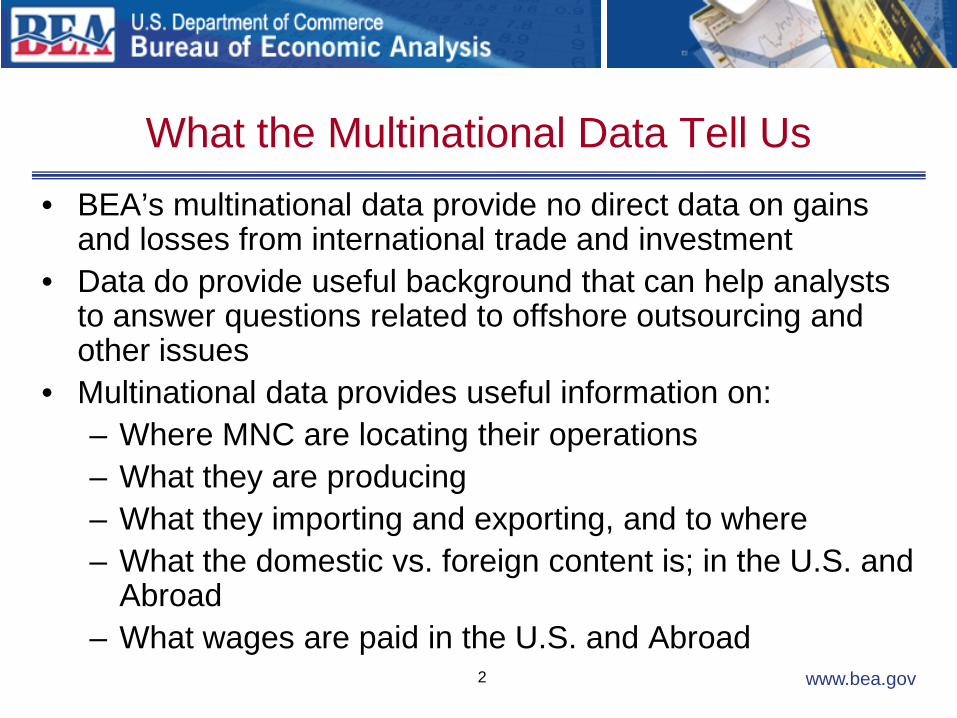
What the Multinational Data Tell Us • BEA’s multinational data provide no direct data on gains
and losses from international trade and investment • Data do provide useful background that can help analysts
to answer questions related to offshore outsourcing and other issues
• Multinational data provides useful information on: – Where MNC are locating their operations – What they are producing – What they importing and exporting, and to where – What the domestic vs. foreign content is; in the U.S. and
Abroad – What wages are paid in the U.S. and Abroad
3 www.bea.gov
What the Multinational Data Tell Us
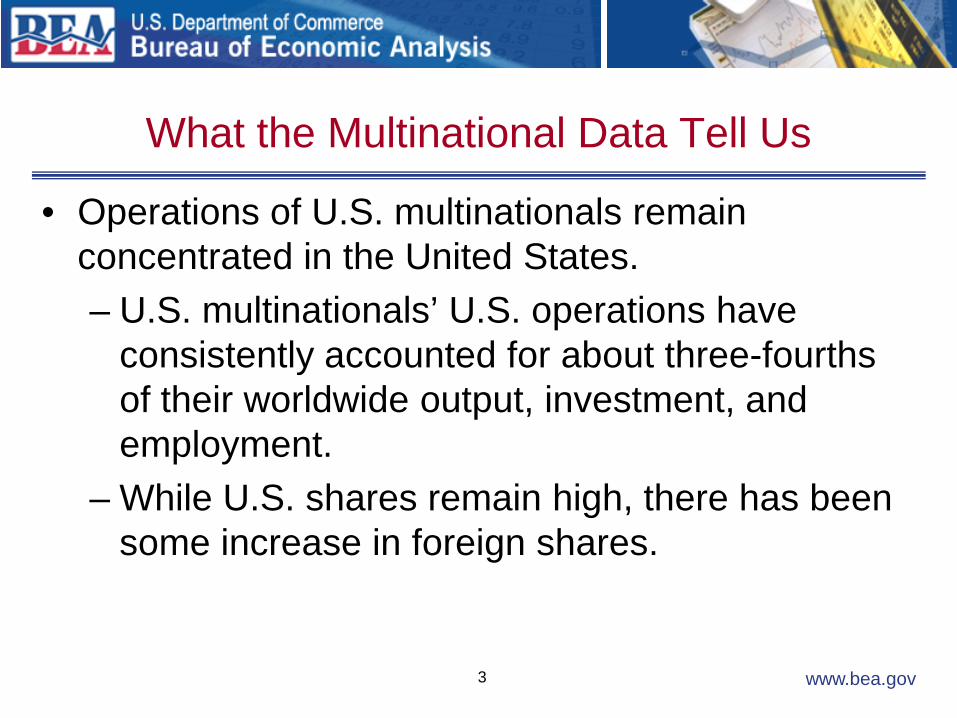
• Operations of U.S. multinationals remain concentrated in the United States. – U.S. multinationals’ U.S. operations have
consistently accounted for about three-fourths of their worldwide output, investment, and employment.
– While U.S. shares remain high, there has been some increase in foreign shares.
4 www.bea.gov
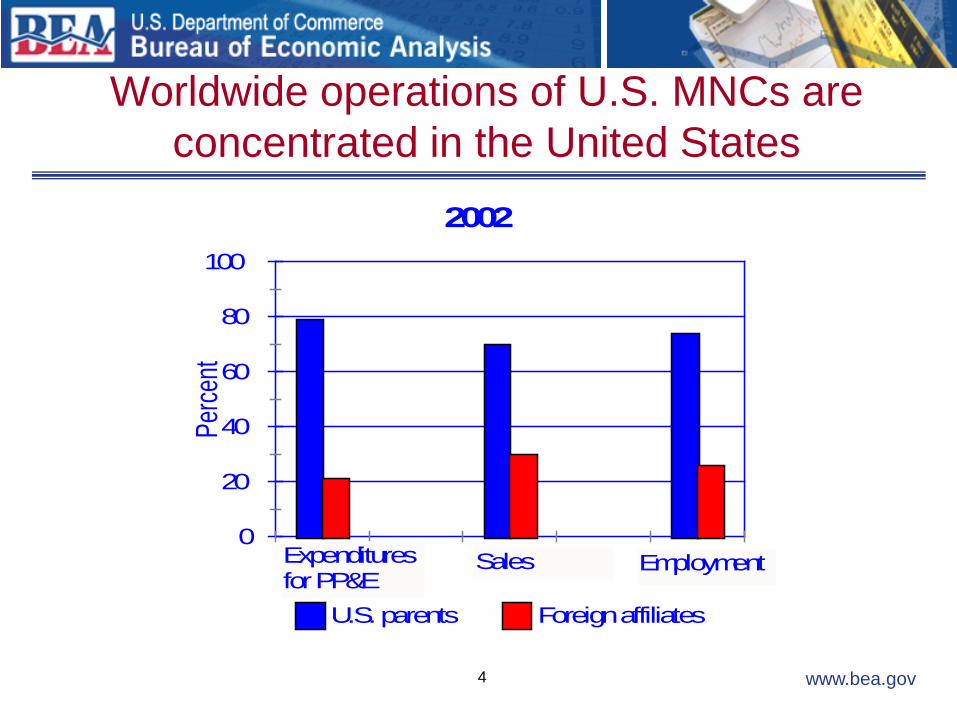
Worldwide operations of U.S. MNCs are concentrated in the United States
0
20
40
60
80
100
Perce
nt
U.S. parents Foreign affiliates
2002
Expendituresfor PP&E
EmploymentSales
5 www.bea.gov
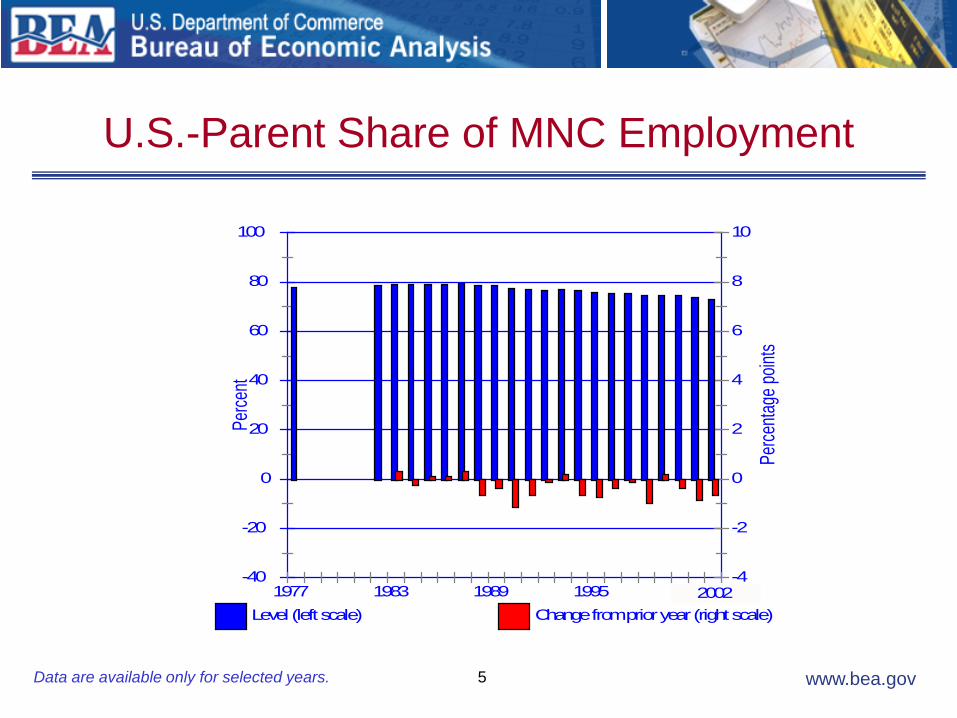
U.S.-Parent Share of MNC Employment
Data are available only for selected years.
-40
-20
0
20
40
60
80
100 Pe
rcent
-4
-2
0
2
4
6
8
10
Perce
ntage
point
s
1977 1983 1989 1995 2001Level (left scale) Change from prior year (right scale)
2002
6 www.bea.gov
What the Multinational Data Tell Us
• Foreign employment by U.S. multinationals has grown faster than their U.S. employment; however: – U.S. employment growth in U.S. MNCs has
been little different than U.S. employment growth; in the aggregate and across industries.
7 www.bea.gov
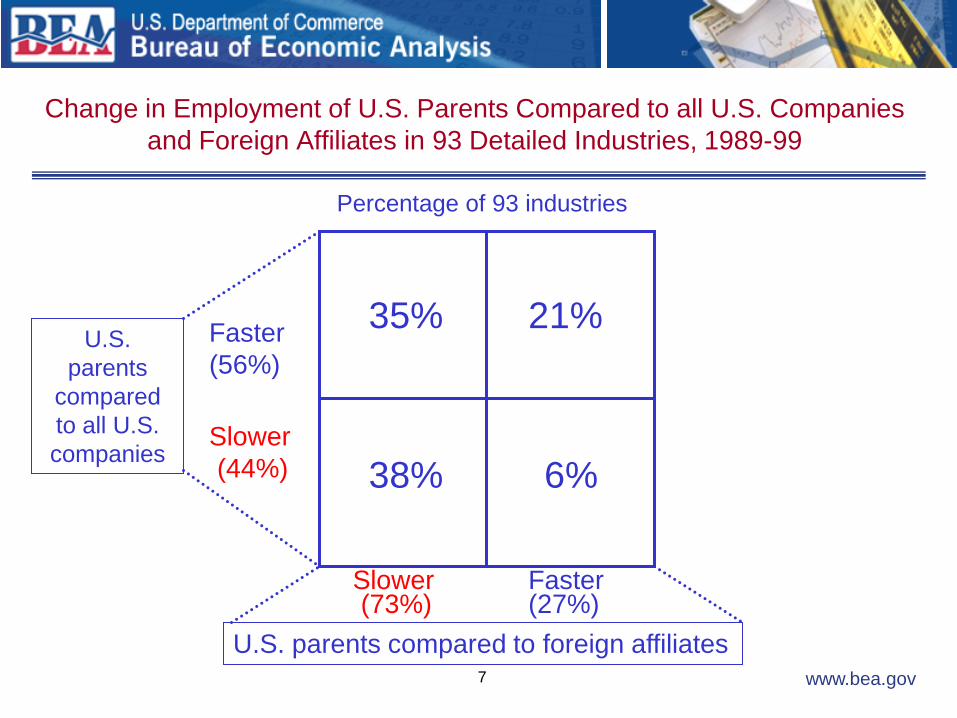
Change in Employment of U.S. Parents Compared to all U.S. Companies and Foreign Affiliates in 93 Detailed Industries, 1989-99
U.S. parents
compared to all U.S. companies
U.S. parents compared to foreign affiliates
Faster
Faster
Slower
Slower
38% 6%
Percentage of 93 industries
35% 21% (56%)
(44%)
(27%) (73%)
8 www.bea.gov
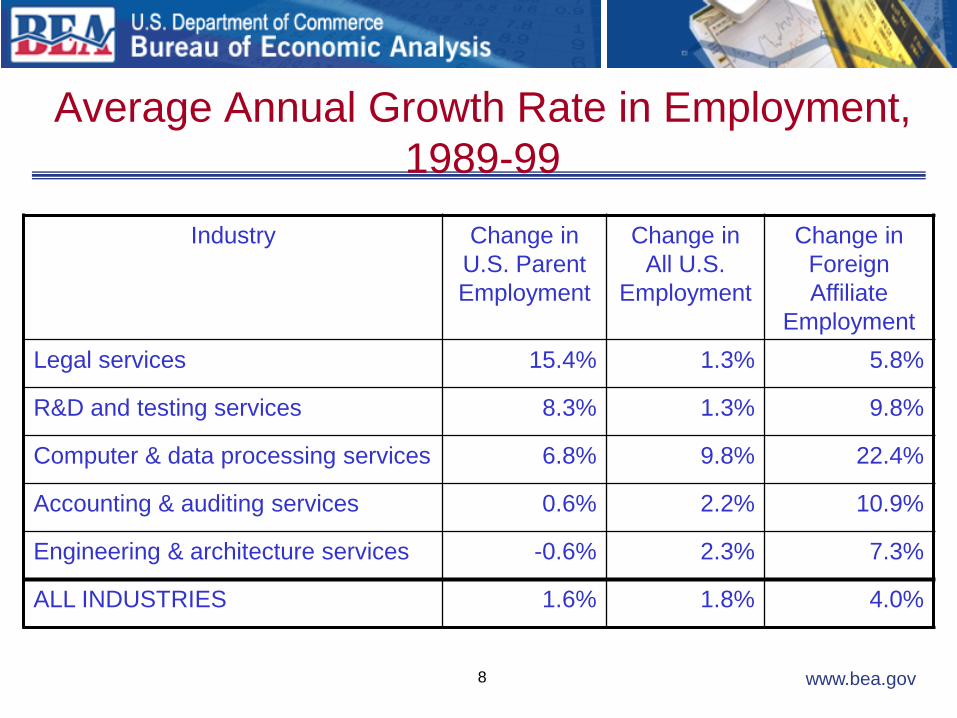
Average Annual Growth Rate in Employment, 1989-99
Industry Change in U.S. Parent Employment
Change in All U.S.
Employment
Change in Foreign Affiliate
Employment Legal services 15.4% 1.3% 5.8%
R&D and testing services 8.3% 1.3% 9.8%
Computer & data processing services 6.8% 9.8% 22.4%
Accounting & auditing services 0.6% 2.2% 10.9%
Engineering & architecture services -0.6% 2.3% 7.3%
ALL INDUSTRIES 1.6% 1.8% 4.0%
9 www.bea.gov
What the Multinational Data Tell Us
• Foreign employment by U.S. multinationals has grown at a faster rate than their U.S. employment; however: – Because of differences in levels, U.S.
employment has increased by 4.7 million vs. 3.5 million in foreign employment, 1988-2002.
– Foreign-owned MNCs have increased their employment in the United States by 3.1 million, 1988-2002.
10 www.bea.gov
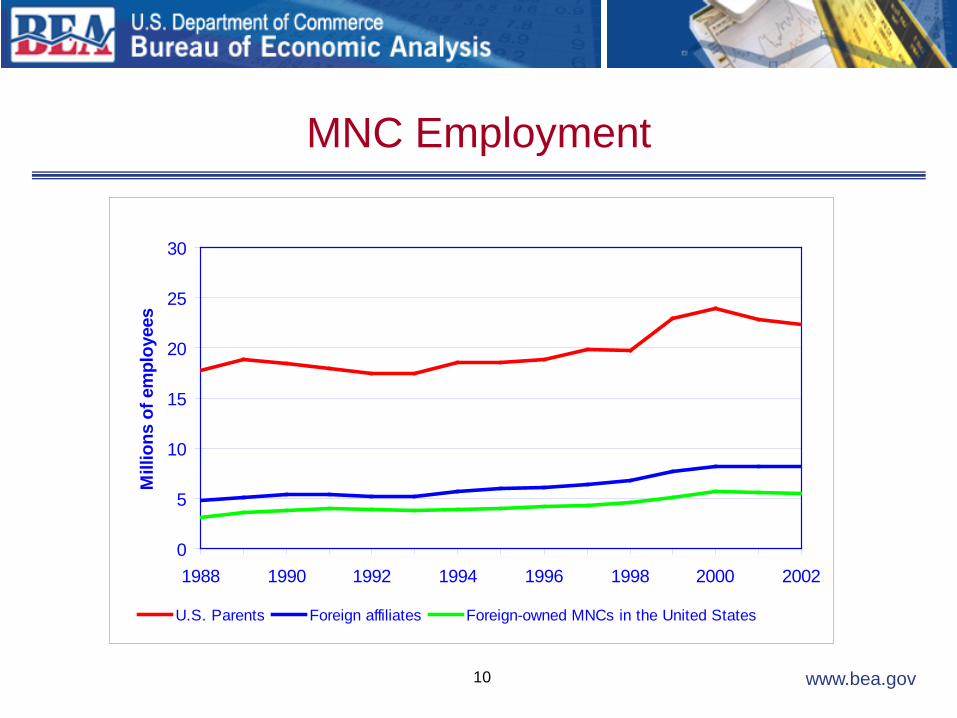
MNC Employment
0
5
10
15
20
25
30
1988 1990 1992 1994 1996 1998 2000 2002
Mill
ions
of e
mpl
oyee
s
U.S. Parents Foreign affiliates Foreign-owned MNCs in the United States
11 www.bea.gov
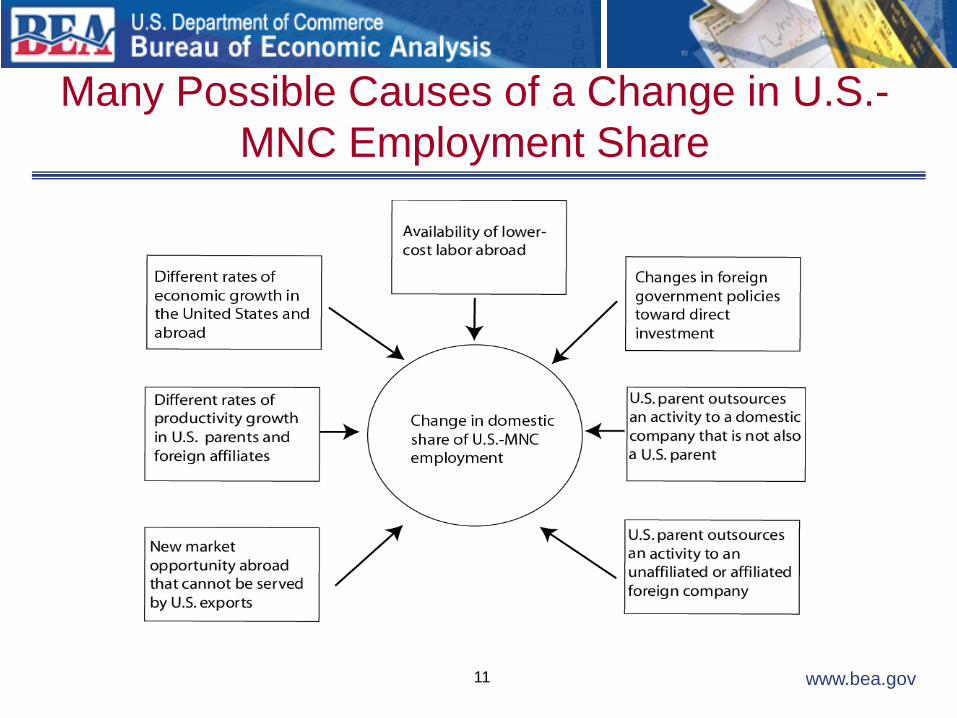
Many Possible Causes of a Change in U.S.-MNC Employment Share
12 www.bea.gov
What the Multinational Data Tell Us
• U.S. MNCs pay lower wages to their overseas workers, but without expanded data and research, it is difficult to tell if lower wages are paid for the same occupations.
• Despite some shift in employment to low-wage countries, production remains centered in high-wage countries. – Low-wage countries with increasing share are
also large and rapidly growing markets.
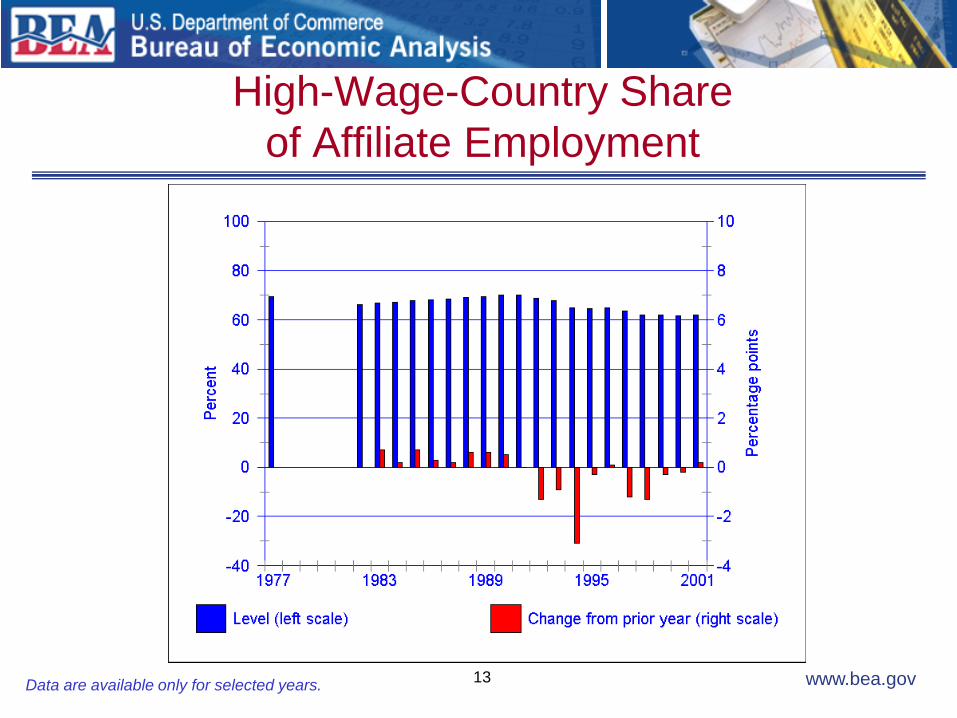
13 www.bea.gov
High-Wage-Country Share of Affiliate Employment
Data are available only for selected years.
14 www.bea.gov
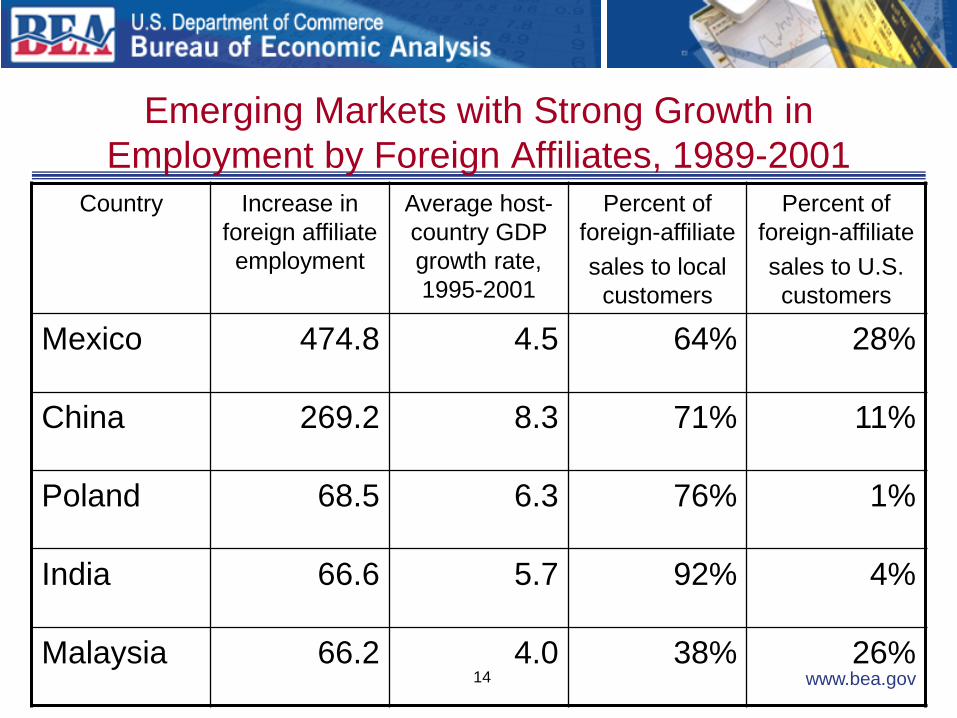
Emerging Markets with Strong Growth in Employment by Foreign Affiliates, 1989-2001
Country Increase in foreign affiliate employment
Average host-country GDP growth rate, 1995-2001
Percent of foreign-affiliate sales to local
customers
Percent of foreign-affiliate sales to U.S. customers
Mexico 474.8 4.5 64% 28%
China 269.2 8.3 71% 11%
Poland 68.5 6.3 76% 1%
India 66.6 5.7 92% 4%
Malaysia 66.2 4.0 38% 26%
15 www.bea.gov
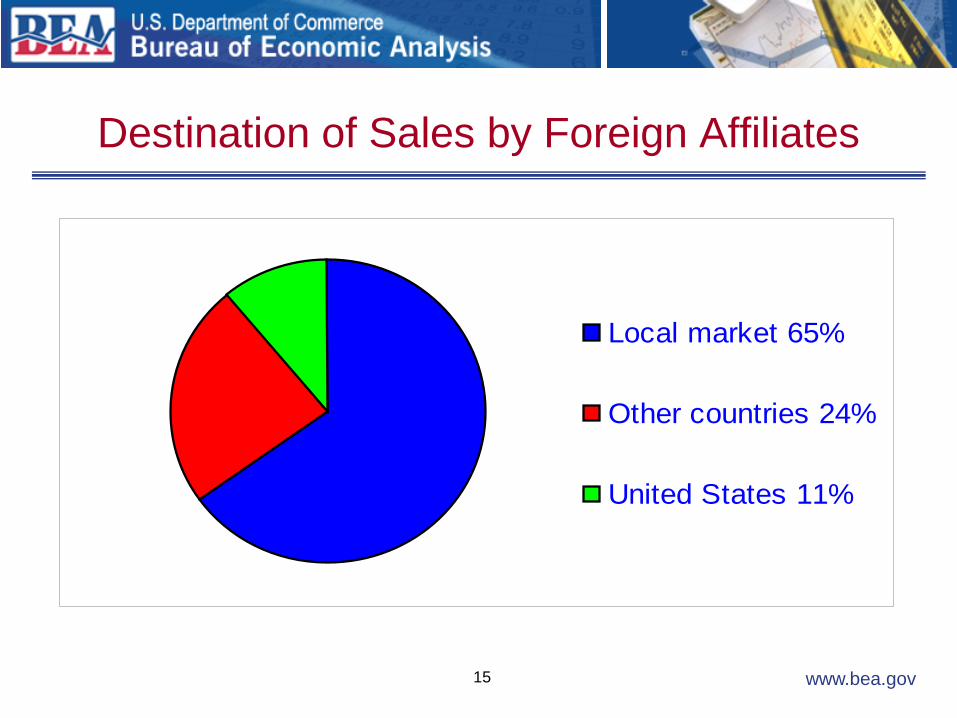
Destination of Sales by Foreign Affiliates
Local market 65%
Other countries 24%
United States 11%
16 www.bea.gov
What the Multinational Data Tell Us
• U.S. MNCs appear to be increasing outsourcing somewhat, but little evidence that it is foreign outsourcing. – Increasing purchases of intermediate goods and
services as a share of sales, 1977- 2001 – But U.S. parents’ imports of goods as a share of
sales have not seen a marked increase and have been decreasing since 1998.
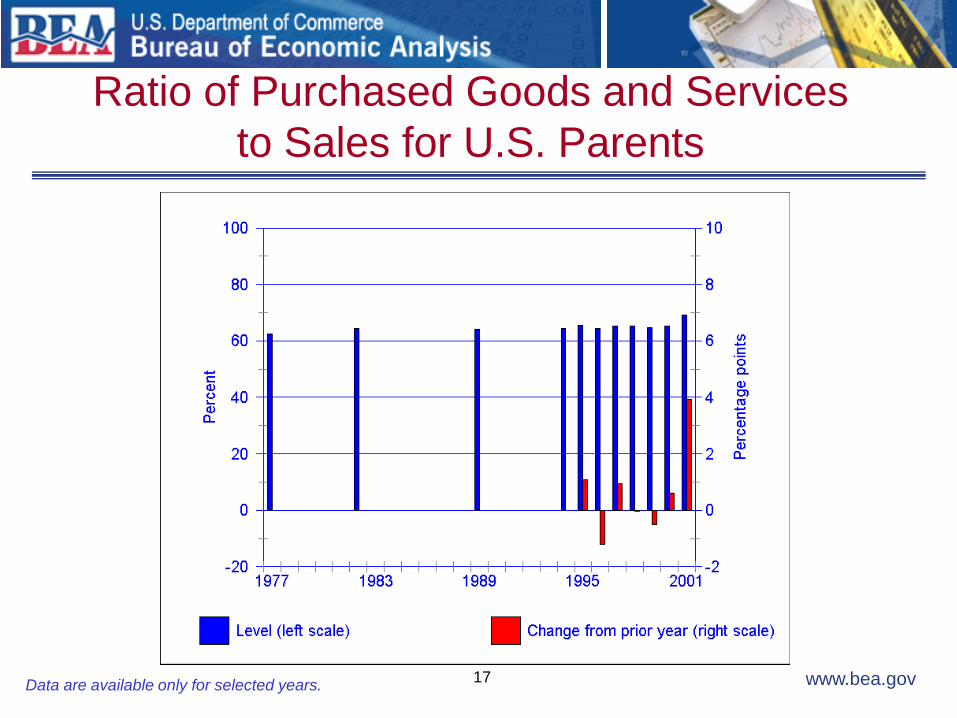
17 www.bea.gov
Ratio of Purchased Goods and Services to Sales for U.S. Parents
Data are available only for selected years.
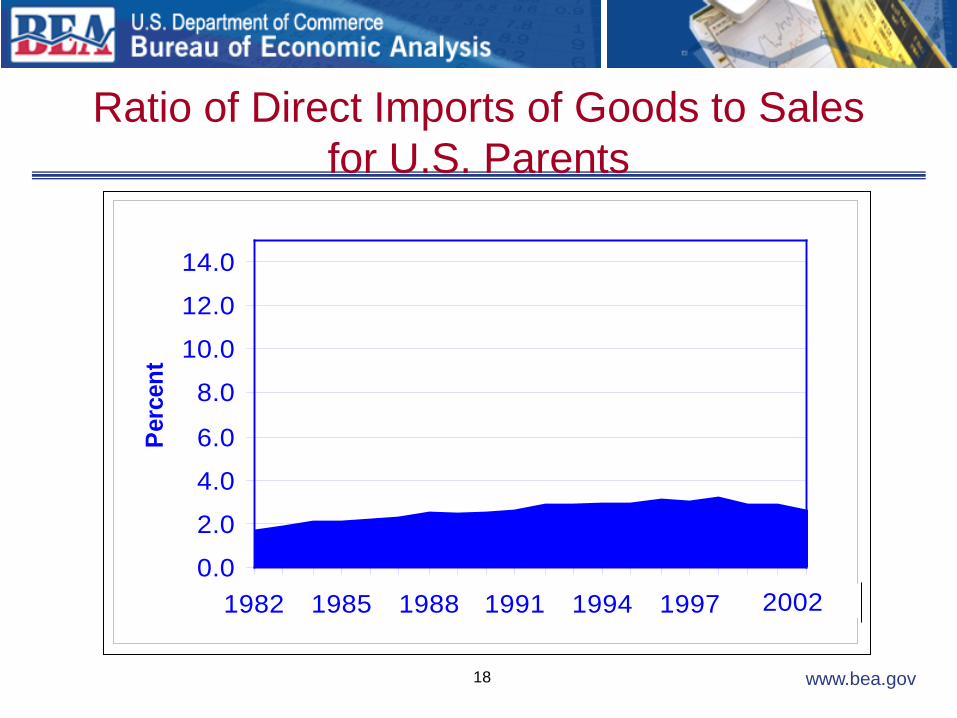
18 www.bea.gov
Ratio of Direct Imports of Goods to Sales for U.S. Parents
0.0
2.0
4.0
6.0
8.0
10.0
12.0
14.0
1982 1985 1988 1991 1994 1997 2000
Perc
ent
2002
19 www.bea.gov
What the Multinational Data Tell Us
• Multinationals and backward linkages to the U.S. economy – Multinationals and value added chains – Overseas sales through foreign affiliates of $2.5 trillion – U.S. MNCs account for 58% of exports of goods and
services and for 37% of imports – U.S.-MNC operations in the United States account for
1/4 of GDP, 1/5 of employment, and their worldwide operations account for 1/2 of U.S. profits.
• Overseas affiliates yield high returns; their contribution to U.S. corporate profits is twice as large as one would expect from their overseas production.
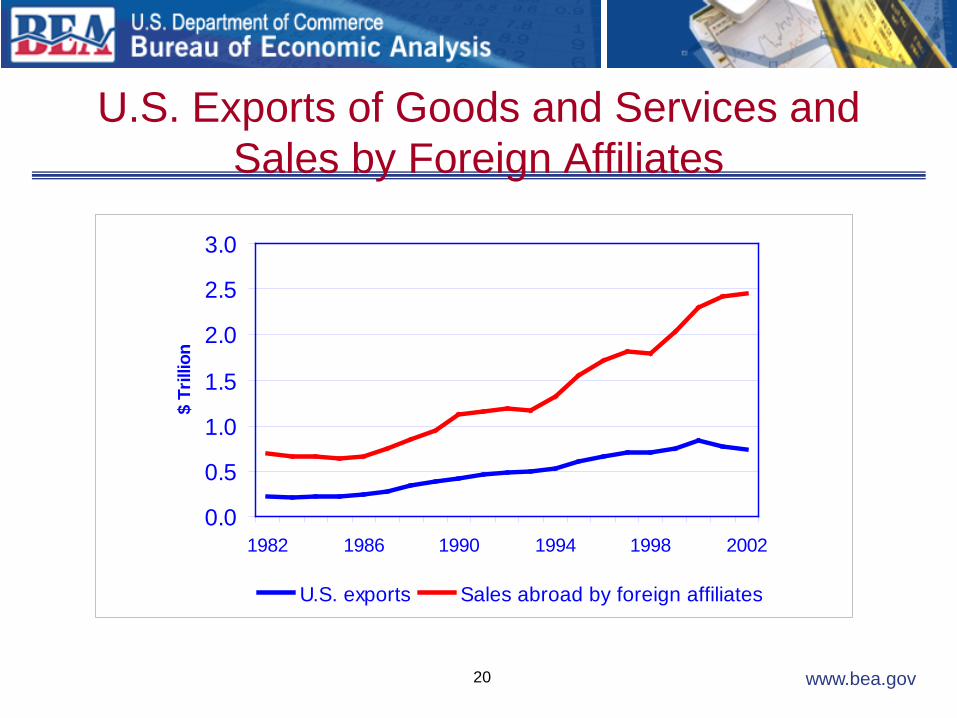
20 www.bea.gov
U.S. Exports of Goods and Services and Sales by Foreign Affiliates
2002 0.0
0.5
1.0
1.5
2.0
2.5
3.0
1982 1986 1990 1994 1998 2002
$ Tr
illio
n
U.S. exports Sales abroad by foreign affiliates
21 www.bea.gov
What the Multinational Data Tell Us
• Multinationals and backward linkages to the U.S. economy – Multinationals and value added chains – If we add in foreign-owned MNCs in the United
States net trade to that of U.S. MNCs, they account for 69% of exports of goods and services and for 56% of imports
– Foreign-owned MNCs in the United States account for 6 percent of GDP and for 5 percent of employment


![How effective is offshore outsourcing[1]](https://img.pdfslide.us/doc/110x75/54634163b1af9f7e3a8b4960/how-effective-is-offshore-outsourcing1.jpg)