Embed Size (px)
Citation preview

Office Property Market OverviewINDIAOctober - 2015
2 Research & Forecast Report | October 2015 | Colliers International
ContentsMacro Economic Overview 3
Mumbai Office Market Overview 4
Delhi Office Market Overview 6
Gurgaon Office Market Overview 8
NOIDA Office Market Overview 10
Chennai Office Market Overview 12
Bengaluru Office Market Overview 14
Kolkata Office Market Overview 16
Pune Office Market Overview 18
3 Research & Forecast Report | October 2015 | Colliers International
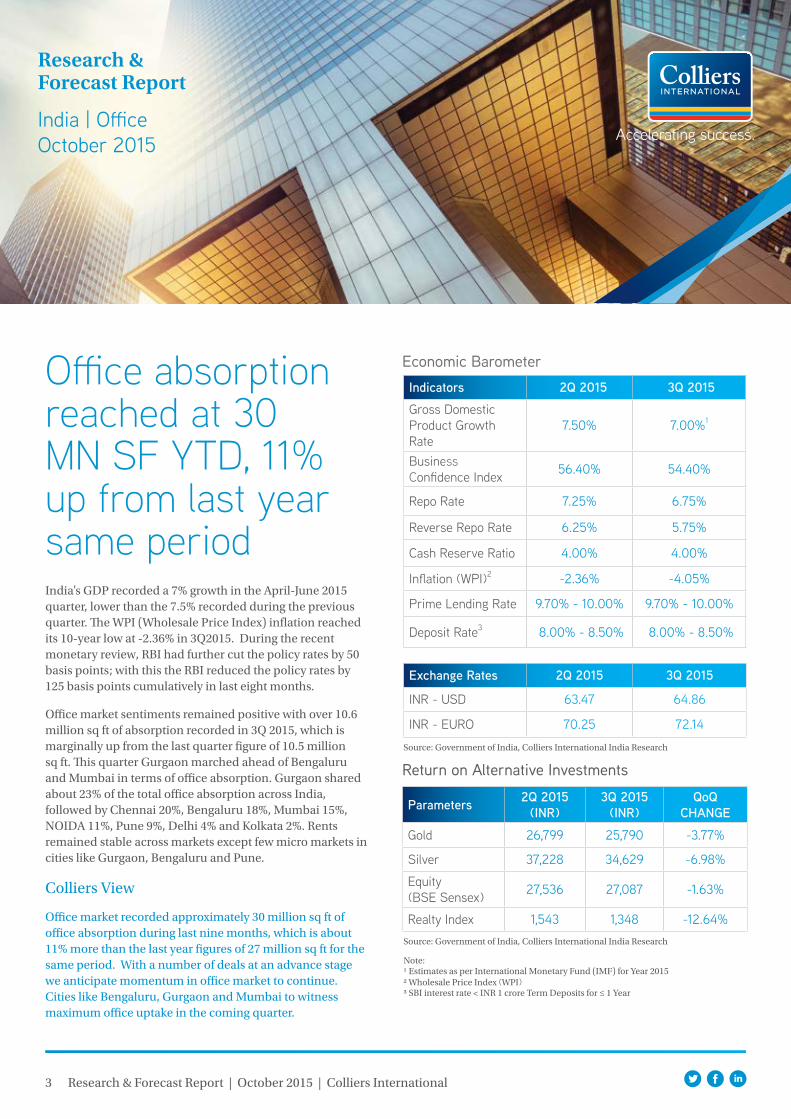
Office absorption reached at 30 MN SF YTD, 11% up from last year same period India’s GDP recorded a 7% growth in the April-June 2015 quarter, lower than the 7.5% recorded during the previous quarter. The WPI (Wholesale Price Index) inflation reached its 10-year low at -2.36% in 3Q2015. During the recent monetary review, RBI had further cut the policy rates by 50 basis points; with this the RBI reduced the policy rates by 125 basis points cumulatively in last eight months.
Office market sentiments remained positive with over 10.6 million sq ft of absorption recorded in 3Q 2015, which is marginally up from the last quarter figure of 10.5 million sq ft. This quarter Gurgaon marched ahead of Bengaluru and Mumbai in terms of office absorption. Gurgaon shared about 23% of the total office absorption across India, followed by Chennai 20%, Bengaluru 18%, Mumbai 15%, NOIDA 11%, Pune 9%, Delhi 4% and Kolkata 2%. Rents remained stable across markets except few micro markets in cities like Gurgaon, Bengaluru and Pune.
Colliers View
Office market recorded approximately 30 million sq ft of office absorption during last nine months, which is about 11% more than the last year figures of 27 million sq ft for the same period. With a number of deals at an advance stage we anticipate momentum in office market to continue. Cities like Bengaluru, Gurgaon and Mumbai to witness maximum office uptake in the coming quarter.
Return on Alternative Investments
Economic Barometer
Note: 1 Estimates as per International Monetary Fund (IMF) for Year 20152 Wholesale Price Index (WPI)3 SBI interest rate < INR 1 crore Term Deposits for ≤ 1 Year
Research & Forecast Report
India | OfficeOctober 2015
Parameters 2Q 2015 (INR)
3Q 2015 (INR)
QoQCHANGE
Gold 26,799 25,790 -3.77%
Silver 37,228 34,629 -6.98%
Equity(BSE Sensex) 27,536 27,087 -1.63%
Realty Index 1,543 1,348 -12.64%
Source: Government of India, Colliers International India Research
Source: Government of India, Colliers International India Research
Indicators 2Q 2015 3Q 2015Gross DomesticProduct GrowthRate
7.50% 7.00%1
Business Confidence Index 56.40% 54.40%
Repo Rate 7.25% 6.75%
Reverse Repo Rate 6.25% 5.75%
Cash Reserve Ratio 4.00% 4.00%
Inflation (WPI)2 -2.36% -4.05%
Prime Lending Rate 9.70% - 10.00% 9.70% - 10.00%
Deposit Rate3 8.00% - 8.50% 8.00% - 8.50%
Exchange Rates 2Q 2015 3Q 2015
INR - USD 63.47 64.86
INR - EURO 70.25 72.14
4 Research & Forecast Report | October 2015 | Colliers International
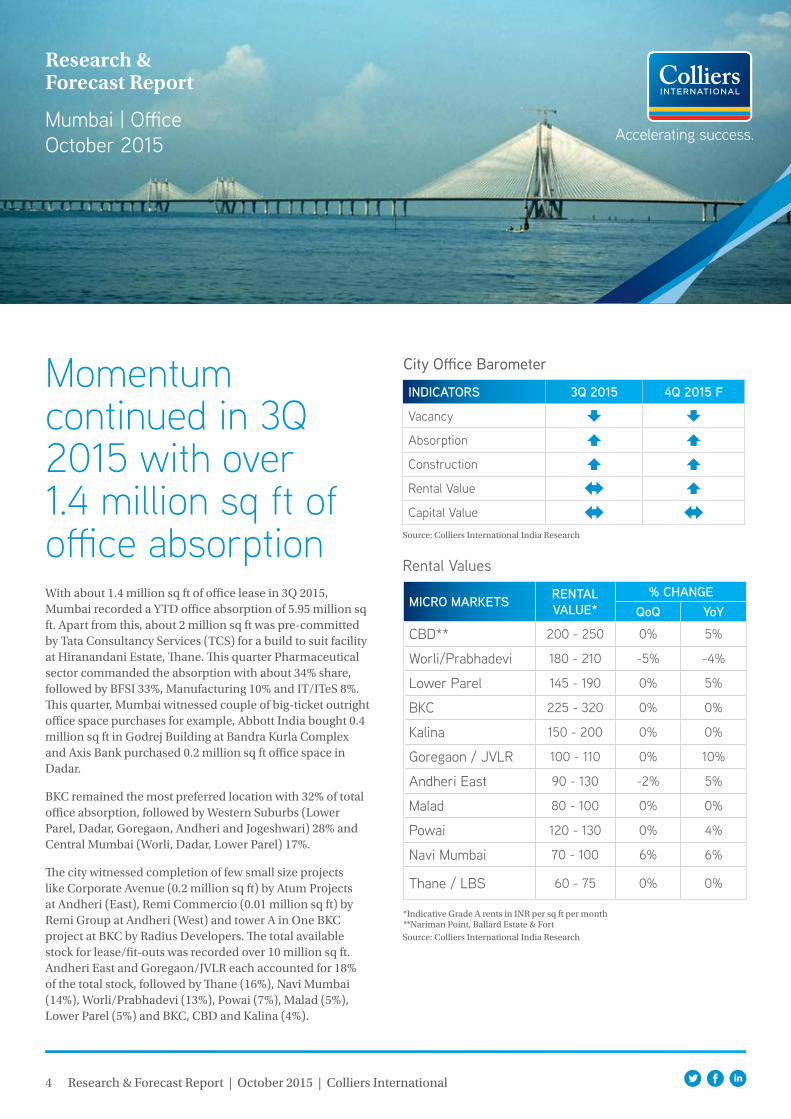
Momentum continued in 3Q 2015 with over 1.4 million sq ft of office absorptionWith about 1.4 million sq ft of office lease in 3Q 2015, Mumbai recorded a YTD office absorption of 5.95 million sq ft. Apart from this, about 2 million sq ft was pre-committed by Tata Consultancy Services (TCS) for a build to suit facility at Hiranandani Estate, Thane. This quarter Pharmaceutical sector commanded the absorption with about 34% share, followed by BFSI 33%, Manufacturing 10% and IT/ITeS 8%. This quarter, Mumbai witnessed couple of big-ticket outright office space purchases for example, Abbott India bought 0.4 million sq ft in Godrej Building at Bandra Kurla Complex and Axis Bank purchased 0.2 million sq ft office space in Dadar.
BKC remained the most preferred location with 32% of total office absorption, followed by Western Suburbs (Lower Parel, Dadar, Goregaon, Andheri and Jogeshwari) 28% and Central Mumbai (Worli, Dadar, Lower Parel) 17%.
The city witnessed completion of few small size projects like Corporate Avenue (0.2 million sq ft) by Atum Projects at Andheri (East), Remi Commercio (0.01 million sq ft) by Remi Group at Andheri (West) and tower A in One BKC project at BKC by Radius Developers. The total available stock for lease/fit-outs was recorded over 10 million sq ft. Andheri East and Goregaon/JVLR each accounted for 18% of the total stock, followed by Thane (16%), Navi Mumbai (14%), Worli/Prabhadevi (13%), Powai (7%), Malad (5%), Lower Parel (5%) and BKC, CBD and Kalina (4%).
Rental Values
*Indicative Grade A rents in INR per sq ft per month**Nariman Point, Ballard Estate & Fort
Research & Forecast Report
Mumbai | OfficeOctober 2015
City Office Barometer
Source: Colliers International India Research
Source: Colliers International India Research
MICRO MARKETS RENTALVALUE*
% CHANGEQoQ YoY
CBD** 200 - 250 0% 5%
Worli/Prabhadevi 180 - 210 -5% -4%
Lower Parel 145 - 190 0% 5%
BKC 225 - 320 0% 0%
Kalina 150 - 200 0% 0%
Goregaon / JVLR 100 - 110 0% 10%
Andheri East 90 - 130 -2% 5%
Malad 80 - 100 0% 0%
Powai 120 - 130 0% 4%
Navi Mumbai 70 - 100 6% 6%
Thane / LBS 60 - 75 0% 0%
INDICATORS 3Q 2015 4Q 2015 F
Vacancy
Absorption
Construction
Rental Value
Capital Value
5 Research & Forecast Report | October 2015 | Colliers International
Notes:
1. Office Market: The major business locations in Mumbai are the CBD (Nariman Point, Fort and Ballard Estate), Central Mumbai (Worli, Lower Parel and Parel), Bandra Kurla
Complex (BKC) and Andheri Kurla stretch. Powai, Malad and Vashi are the preferred IT/ ITES destinations, while Airoli at Navi Mumbai and Lal Bahadur Shastri Marg are
emerging as new office and IT/ITES submakets.
2. Rents/Capital Value: Market average of indicative asking price for Grade A office space.
3. Available Supply: Total Grade A office space being marketed for sale or lease in surveyed quarter.
4. City Barometer: Represents increase, decrease or stable scenario; as compared to previous quarter.
5. All the figures in the report is based on market information as on 25th September 2015.
Top 5 Transactions of the Quarter
Key Under Construction Projects
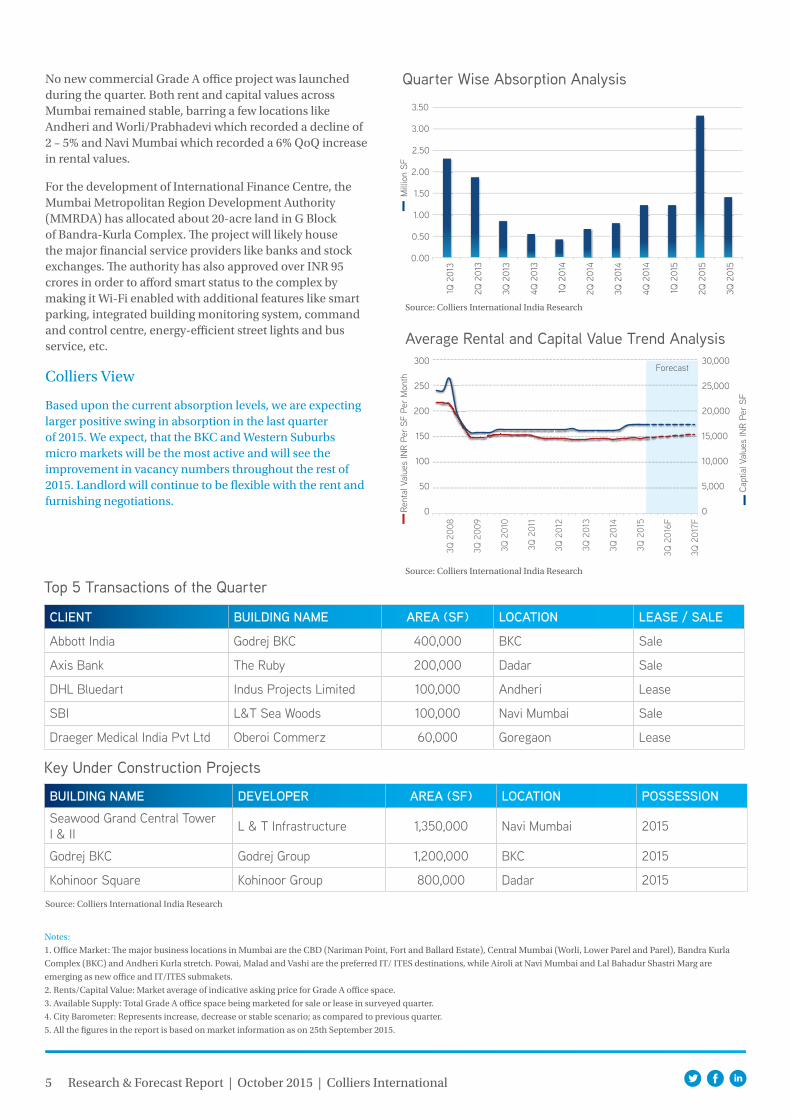
Quarter Wise Absorption Analysis
Average Rental and Capital Value Trend Analysis
Mill
ion
SFRe
ntal
Val
ues
INR
Per
SF P
er M
onth
Capt
ial V
alue
s IN
R Pe
r SF
No new commercial Grade A office project was launched during the quarter. Both rent and capital values across Mumbai remained stable, barring a few locations like Andheri and Worli/Prabhadevi which recorded a decline of 2 – 5% and Navi Mumbai which recorded a 6% QoQ increase in rental values.
For the development of International Finance Centre, the Mumbai Metropolitan Region Development Authority (MMRDA) has allocated about 20-acre land in G Block of Bandra-Kurla Complex. The project will likely house the major financial service providers like banks and stock exchanges. The authority has also approved over INR 95 crores in order to afford smart status to the complex by making it Wi-Fi enabled with additional features like smart parking, integrated building monitoring system, command and control centre, energy-efficient street lights and bus service, etc.
Colliers View
Based upon the current absorption levels, we are expecting larger positive swing in absorption in the last quarter of 2015. We expect, that the BKC and Western Suburbs micro markets will be the most active and will see the improvement in vacancy numbers throughout the rest of 2015. Landlord will continue to be flexible with the rent and furnishing negotiations.
Source: Colliers International India Research
Source: Colliers International India Research
Source: Colliers International India Research
CLIENT BUILDING NAME AREA (SF) LOCATION LEASE / SALE
Abbott India Godrej BKC 400,000 BKC Sale
Axis Bank The Ruby 200,000 Dadar Sale
DHL Bluedart Indus Projects Limited 100,000 Andheri Lease
SBI L&T Sea Woods 100,000 Navi Mumbai Sale
Draeger Medical India Pvt Ltd Oberoi Commerz 60,000 Goregaon Lease
BUILDING NAME DEVELOPER AREA (SF) LOCATION POSSESSIONSeawood Grand Central Tower I & II L & T Infrastructure 1,350,000 Navi Mumbai 2015
Godrej BKC Godrej Group 1,200,000 BKC 2015
Kohinoor Square Kohinoor Group 800,000 Dadar 2015
300
250
30,000
25,000
20,000
15,000
10,000
5,000
0
200
150
100
50
0
2.50
3.00
3.50
2.00
1.50
1.00
0.50
0.00
1Q 2
013
2Q 2
013
3Q 2
013
4Q 2
013
1Q 2
014
2Q 2
014
3Q 2
014
4Q 2
014
1Q 2
015
2Q 2
015
3Q 2
015
Forecast
3Q 2
008
3Q 2
009
3Q 2
010
3Q 2
011
3Q 2
012
3Q 2
013
3Q 2
014
3Q 2
015
3Q 2
016F
3Q 2
017F
6 Research & Forecast Report | October 2015 | Colliers International
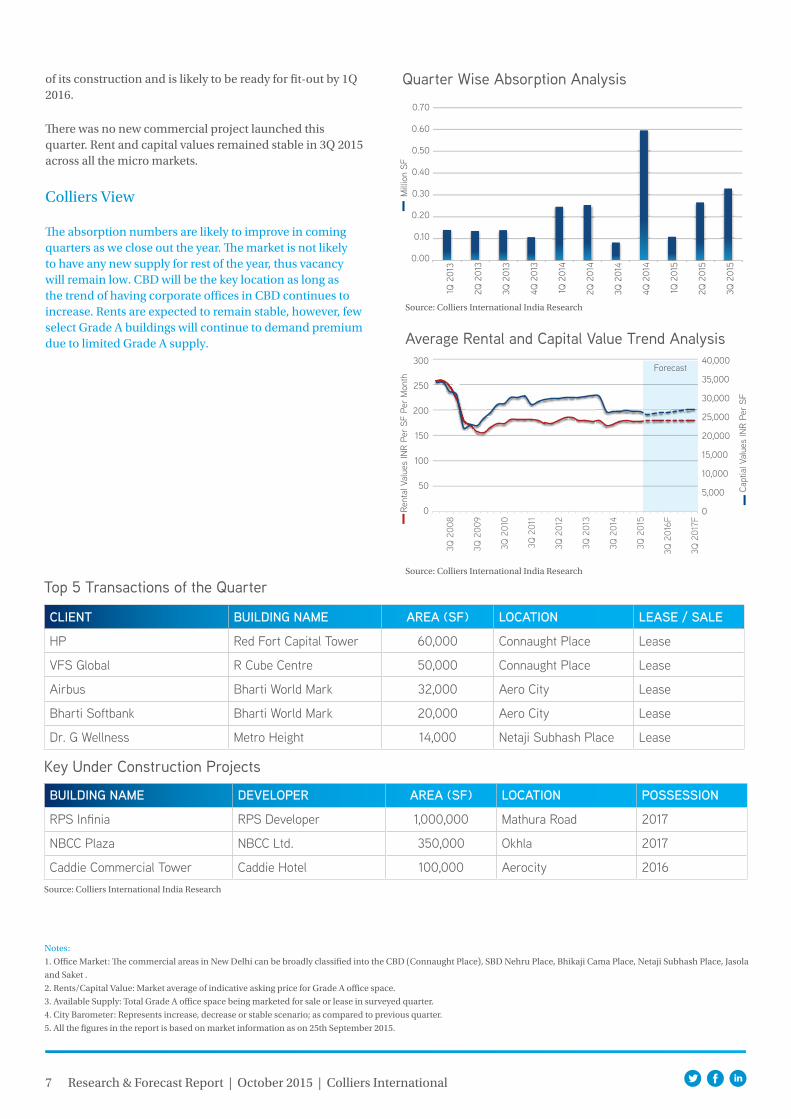
Positive momentum continued, office absorption up by 24% QoQ The optimistic momentum continued in Delhi office market and absorption recorded at 0.33 million sq ft in 3Q 2015, which is about 24% more than the previous quarter figure of 0.27 million sq ft. The IT / ITeS sector dominated the city’s office absorption, with over 38% of the total absorption, followed by BFSI (30%), Manufacturing (15%), Pharma (10%) and Engineering and Government (6%). The maximum number of office transactions were concluded in CBD (43%), followed by Aero City (16%) and Jasola (12%).
A few of the major office transactions concluded during the quarter were, 60,000 sq ft lease by HP in Red Fort Capital Tower by Parsvnath group and 50,000 sq ft lease by VFS Global in R cube Centre by DMRC, both located in Connaught Place, 32,000 sq ft lease by Airbus and 20,000 sq ft by Bharti Softbank, both in Bharti World Mark by Bharti Realty at Aero City.
About 1.8 million sq ft of Grade A office supply was available for fit out in Delhi during the survey period, out of which majority of the supply is located in the CBD (62%), followed by Netaji Subhash Place (12%), Saket (11%), Nehru Place (8%) and Jasola (7%). No new Grade A commercial supply was added in the total office inventory this quarter. Also no major supply is in pipeline for rest of the year. However, a project known as “Skipper House”, admeasuring about 0.15 million sq ft located at Connaught Place is in advance stages
Rental Values
*Indicative Grade A rents in INR per sq ft per month**Connaught Place***Netaji Subhash Place
Research & Forecast Report
Delhi | OfficeOctober 2015
City Office Barometer
Source: Colliers International India Research
Source: Colliers International India Research
MICRO MARKETS RENTALVALUE*
% CHANGEQoQ YoY
CBD** 180 - 450 0% 3%
Nehru Place 170 - 250 0% 5%
Saket 130 - 190 0% 5%
Jasola 90 - 130 0% 5%
NSP*** 70 - 120 0% 0%
INDICATORS 3Q 2014 4Q 2015 F
Vacancy
Absorption
Construction
Rental Value
Capital Value
7 Research & Forecast Report | October 2015 | Colliers International
of its construction and is likely to be ready for fit-out by 1Q 2016.
There was no new commercial project launched this quarter. Rent and capital values remained stable in 3Q 2015 across all the micro markets.
Colliers View
The absorption numbers are likely to improve in coming quarters as we close out the year. The market is not likely to have any new supply for rest of the year, thus vacancy will remain low. CBD will be the key location as long as the trend of having corporate offices in CBD continues to increase. Rents are expected to remain stable, however, few select Grade A buildings will continue to demand premium due to limited Grade A supply.
Top 5 Transactions of the Quarter
Key Under Construction Projects
Quarter Wise Absorption Analysis
Average Rental and Capital Value Trend Analysis
Mill
ion
SFRe
ntal
Val
ues
INR
Per
SF P
er M
onth
Capt
ial V
alue
s IN
R Pe
r SF
Notes:
1. Office Market: The commercial areas in New Delhi can be broadly classified into the CBD (Connaught Place), SBD Nehru Place, Bhikaji Cama Place, Netaji Subhash Place, Jasola
and Saket .
2. Rents/Capital Value: Market average of indicative asking price for Grade A office space.
3. Available Supply: Total Grade A office space being marketed for sale or lease in surveyed quarter.
4. City Barometer: Represents increase, decrease or stable scenario; as compared to previous quarter.
5. All the figures in the report is based on market information as on 25th September 2015.
Source: Colliers International India Research
Source: Colliers International India Research
Source: Colliers International India Research
CLIENT BUILDING NAME AREA (SF) LOCATION LEASE / SALE
HP Red Fort Capital Tower 60,000 Connaught Place Lease
VFS Global R Cube Centre 50,000 Connaught Place Lease
Airbus Bharti World Mark 32,000 Aero City Lease
Bharti Softbank Bharti World Mark 20,000 Aero City Lease
Dr. G Wellness Metro Height 14,000 Netaji Subhash Place Lease
BUILDING NAME DEVELOPER AREA (SF) LOCATION POSSESSION
RPS Infinia RPS Developer 1,000,000 Mathura Road 2017
NBCC Plaza NBCC Ltd. 350,000 Okhla 2017
Caddie Commercial Tower Caddie Hotel 100,000 Aerocity 2016
250
300
30,000
35,000
40,000
25,000
20,000
15,000
10,000
5,000
0
200
150
100
50
0
0.10
0.20
0.30
0.50
0.60
0.70
0.40
0.00
Forecast
1Q 2
013
2Q 2
013
3Q 2
013
4Q 2
013
1Q 2
014
2Q 2
014
3Q 2
014
4Q 2
014
1Q 2
015
2Q 2
015
3Q 2
015
3Q 2
008
3Q 2
009
3Q 2
010
3Q 2
011
3Q 2
012
3Q 2
013
3Q 2
014
3Q 2
015
3Q 2
016F
3Q 2
017F
8 Research & Forecast Report | October 2015 | Colliers International
Research & Forecast Report
Gurgaon | OfficeOctober 2015
Rental Values
*Indicative Grade A rents in INR per sq ft per month
City Office Barometer
Source: Colliers International India Research
Source: Colliers International India Research
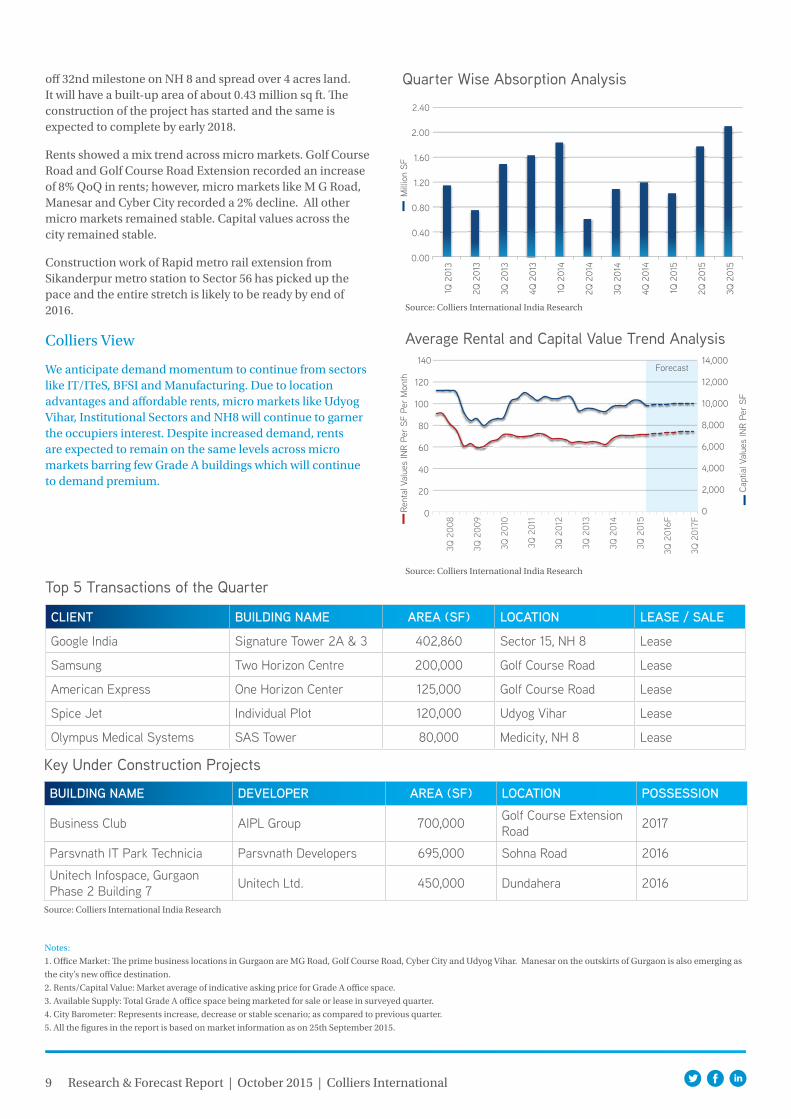
Gurgaon conquers office market in 3Q 2015, records highest office absorption in the countryGurgaon’s office property market saw a robust office space absorption in 3Q 2015. The city witnessed 2.1 million sq ft of office absorption this quarter, totalling to about 4.9 million sq ft YTD (Year-to-Date). On quarterly basis, office absorption recorded an 18% increase. IT/ITeS sector remained the key occupier this quarter with about 60% share of the total office absorption followed by BFSI 20% manufacturing 10% and others 10%. NH 8 (National Highway 8) remained the most preferred micro market sharing about 29% of total office absorption, followed by Golf Course Road 25% and Udyog Vihar 21%.
About 14.5 million sq ft of Grade A office space was available for lease in Gurgaon. Most of this available stock was located in locations like Udyog Vihar and Industrial Sectors (27%), NH 8 (14%), Golf Course Road Ext / Sohna Road (11%), Golf Course Road (6%), M G Road (4%) and Institutional sectors (44, 32, 18) (3%). Given the large vacant stock, developers continued to refrain from adding speculative supply and no new commercial Grade A project or part of the project was completed during the quarter.
During this quarter, Experion Developers has tied up with Milestone Ventures to develop a commercial project in Gurgaon. The project (Milestone Experion Centre) is located
MICRO MARKETS RENTALVALUE*
% CHANGEQoQ YoY
MG Road 110 - 145 -2% 13%
DLF Cyber City (IT) 95 - 103 -1% 18%
Golf Course Road 100 - 170 8% 20%
Institutional Sectors (Sec 44, 32, 18) 60 - 95 0% 7%
Golf Course Road Ext./Sohna Road 60 - 75 8% 8%
National Highway 8 50 - 130 0% -5%
Udyog Vihar & Industrial Sectors 28 - 40 0% -20%
Manesar 38 - 45 -2% 11%
INDICATORS 3Q 2015 4Q 2015 F
Vacancy
Absorption
Construction
Rental Value
Capital Value
9 Research & Forecast Report | October 2015 | Colliers International
Top 5 Transactions of the Quarter
CLIENT BUILDING NAME AREA (SF) LOCATION LEASE / SALE
Google India Signature Tower 2A & 3 402,860 Sector 15, NH 8 Lease
Samsung Two Horizon Centre 200,000 Golf Course Road Lease
American Express One Horizon Center 125,000 Golf Course Road Lease
Spice Jet Individual Plot 120,000 Udyog Vihar Lease
Olympus Medical Systems SAS Tower 80,000 Medicity, NH 8 Lease
Quarter Wise Absorption Analysis
Average Rental and Capital Value Trend Analysis
Mill
ion
SFRe
ntal
Val
ues
INR
Per
SF P
er M
onth
Capt
ial V
alue
s IN
R Pe
r SF
Key Under Construction Projects
BUILDING NAME DEVELOPER AREA (SF) LOCATION POSSESSION
Business Club AIPL Group 700,000 Golf Course Extension Road 2017
Parsvnath IT Park Technicia Parsvnath Developers 695,000 Sohna Road 2016
Unitech Infospace, Gurgaon Phase 2 Building 7 Unitech Ltd. 450,000 Dundahera 2016
Notes:
1. Office Market: The prime business locations in Gurgaon are MG Road, Golf Course Road, Cyber City and Udyog Vihar. Manesar on the outskirts of Gurgaon is also emerging as
the city’s new office destination.
2. Rents/Capital Value: Market average of indicative asking price for Grade A office space.
3. Available Supply: Total Grade A office space being marketed for sale or lease in surveyed quarter.
4. City Barometer: Represents increase, decrease or stable scenario; as compared to previous quarter.
5. All the figures in the report is based on market information as on 25th September 2015.
Source: Colliers International India Research
Source: Colliers International India Research
Source: Colliers International India Research
off 32nd milestone on NH 8 and spread over 4 acres land. It will have a built-up area of about 0.43 million sq ft. The construction of the project has started and the same is expected to complete by early 2018.
Rents showed a mix trend across micro markets. Golf Course Road and Golf Course Road Extension recorded an increase of 8% QoQ in rents; however, micro markets like M G Road, Manesar and Cyber City recorded a 2% decline. All other micro markets remained stable. Capital values across the city remained stable.
Construction work of Rapid metro rail extension from Sikanderpur metro station to Sector 56 has picked up the pace and the entire stretch is likely to be ready by end of 2016.
Colliers View
We anticipate demand momentum to continue from sectors like IT/ITeS, BFSI and Manufacturing. Due to location advantages and affordable rents, micro markets like Udyog Vihar, Institutional Sectors and NH8 will continue to garner the occupiers interest. Despite increased demand, rents are expected to remain on the same levels across micro markets barring few Grade A buildings which will continue to demand premium.
100
140
120
8,000
10,000
14,000
12,000
6,000
4,000
2,000
0
80
60
40
20
0
0.40
0.80
1.20
1.60
2.00
2.40
0.00
Forecast
1Q 2
013
2Q 2
013
3Q 2
013
4Q 2
013
1Q 2
014
2Q 2
014
3Q 2
014
4Q 2
014
1Q 2
015
2Q 2
015
3Q 2
015
3Q 2
008
3Q 2
009
3Q 2
010
3Q 2
011
3Q 2
012
3Q 2
013
3Q 2
014
3Q 2
015
3Q 2
016F
3Q 2
017F
10 Research & Forecast Report | October 2015 | Colliers International
IT/ITeS occupiers brace the NOIDA office absorption in 3Q 2015Noida market revived in 3Q 2015 with office absorption increased to 0.98 million sq ft, about 32% more than the last quarter number of 0.74 million sq ft. With this, the city recorded total office absorption of about 2.22 million sq ft YTD. The IT/ITeS sector continued to dominate the city’s office absorption with over 87% of the total absorption, followed by FMCG 4% and BFSI 3%. About 56% of the office transactions were concluded in sectors like 125, 127, 132 and 135, located along NOIDA Expressway, followed by Greater NOIDA (17%), sector 62 (16%) and sector 6 (4%) and rest (6%) in other locations. In big-ticket transactions, Vivo Mobile leased 0.3 million sq ft in World Trade Center located in Greater NOIDA, Cognizant took 0.20 million sq ft in Infospace 2, Oracle, Reliance Jio and Genpact all leased 0.1 million sq ft each in Express Trade Towers 2, Logix Cyber park and Stellar IT Park located in sector 132, sector 62 and sector 135 respectively.
No new commercial Grade A project / parts of the project was completed this quarter. Similarly, no new project was launched during the quarter. The total available stock for fit-outs was over 10 million sq ft. Approximately, 90% of this vacant stock was located in Industrial sectors, including locations like: sector 1 – 9, sector 57 – 60 and sector 63 – 65.
About 9% of the total available stock is located in Institutional sectors, including locations like sector 16A, sector 62 and sectors 125 to 142. Limited supply is available in the Commercial sectors. Overall fall in vacancy levels was noticed during the quarter due to increased absorption and no new supply addition.
Research & Forecast Report
NOIDA | OfficeOctober 2015
Rental Values
*Indicative Grade A rents in INR per sq ft per month**Sector 18***Sector 16A, 62, 125-142****Sector 124, 57-60, 63-75
City Office Barometer
Source: Colliers International India Research
Source: Colliers International India Research
MICRO MARKETS RENTALVALUE*
% CHANGEQoQ YoY
Commercial Sectors** 90 - 110 0% -2%
Institutional Sectors (Non IT)*** 60 - 110 0% 13%
Institutional Sectors (IT)*** 45 - 65 0% 10%
Industrial Sector (IT)**** 35 - 55 0% 7%
INDICATORS 3Q 2015 4Q 2015 F
Vacancy
Absorption
Construction
Rental Value
Capital Value
11 Research & Forecast Report | October 2015 | Colliers International
Both rents and capital values across micro markets remained stable. However, capital value in Institutional sectors marginally increased by 1% QoQ.
To improve the metro connectivity in NOIDA and Greater NOIDA, the NOIDA Authority Board has approved two metro routes, a 15 kms metro corridor from sector 76 NOIDA to Knowledge Park 5 in Greater NOIDA, and another 11 kms stretch from Okhla Bird Sanctuary to sector 142 NOIDA.
Colliers View
With demand picking up in the market, the overall vacancy rate is expected to decrease slightly, though the average rents will remain at the current level. There will be a consistent demand for good Grade B office space in institutional sectors like sectors 62-65 from BFSI, IT/ITeS and Media occupiers due to talent availability. While NOIDA expressway will remained the preferred location for large IT/ITeS occupiers due to availability of Grade A office space.
Top 5 Transactions of the Quarter
Key Under Construction Projects
Quarter Wise Absorption Analysis
Average Rental and Capital Value Trend Analysis
Notes:
1. Office Market: NOIDA market is comprised of sectors broadly classified as institutional, industrial and commercial sectors. Institutional sectors include sec 16A, 62 and125-142,
industrial sectors include Sec 1-9, 57-60 and 63- 65 while sector 18 is the most developed commercial sector.
2. Rents/Capital Value: Market average of indicative asking price for Grade A office space.
3. Available Supply: Total Grade A office space being marketed for sale or lease in surveyed quarter.
4. City Barometer: Represents increase, decrease or stable scenario; as compared to previous quarter.
5. All the figures in the report is based on market information as on 25th September 2015.
Source: Colliers International India Research
Mill
ion
SFRe
ntal
Val
ues
INR
Per
SF P
er M
onth
Capi
tal V
alue
s IN
R Pe
r SF
Source: Colliers International India Research
Source: Colliers International India Research
CLIENT BUILDING NAME AREA (SF) LOCATION LEASE / SALE
Vivo Mobile World Trade Center 300,000 Greater NOIDA Lease
Cognizant Infospace 2 200,000 Sector 135 Lease
Genpact Stellar IT Park 100,000 Sector 135 Lease
Oracle Express Trade Towers 2 100,000 Sector 132 Lease
Reliance Jio Logix Cyberpark 100,000 Sector 62 Lease
BUILDING NAME DEVELOPER AREA (SF) LOCATION POSSESSION
Wave One The Wave Group 2,000,000 Sector 18 2016
World Trade Tower ET Infra Developers Pvt. Ltd. 1,700,000 Sector 16 2016
Delhi One The 3C Company 2,000,000 DND Flyway 2018
70
90
80
8,000
10,000
14,000
12,000
6,000
4,000
2,000
0
60
50
40
30
10
20
0
0.40
0.20
0.60
0.80
1.00
1.20
0.00
Forecast
1Q 2
013
2Q 2
013
3Q 2
013
4Q 2
013
1Q 2
014
2Q 2
014
3Q 2
014
4Q 2
014
1Q 2
015
2Q 2
015
3Q 2
015
3Q 2
009
3Q 2
010
3Q 2
011
3Q 2
012
3Q 2
013
3Q 2
014
3Q 2
015
3Q 2
016F
12 Research & Forecast Report | October 2015 | Colliers International
Chennai office market bounce back with over 1.8 MN SF of absorption in 3Q 2015During third quarter, Chennai’s office absorption volume was recorded at 1.82 million sq ft totaling to about 3.63 million sq ft YTD. IT/ITES sector accounted for 88% of the total absorption in the quarter, followed by Pharma at 5%, Engineering and BFSI both at 4% each. The logistics and Manufacturing sectors occupiers also took the office spaces during the period. CBD, Off CBD, GST road, and MPR (Mount-Poonamallee Road) dominated the overall lease volume with 51% share together, followed by Ambattur (25%), OMR (Old Mahabalipuram Road) (24%). In noteworthy transactions, Accenture have expanded its current portfolio by leasing about 0.76 million sq ft in Shriram Gateway SEZ at GST Road and Divyashree IT Park at OMR. Apart from this, Yes Bank took 0.4 million sq ft in India Bulls at Ambattur and BNY took 0.08 million sq ft in DLF SEZ located at MPR.
Despite revival in demand for office space, developers remained cautious and thus no new commercial Grade A project or part of the project was launched during the quarter. The total available supply for lease / fit-out stood at 7.1 million sq ft. By micro-market, OMR (IT corridor- Pre & Post Toll) accounted for about 60% of this total available supply, followed by CBD 16%, Ambattur 15%, Off CBD 6%, GST Road and MPR together 3%. Dearth of new completed supply has led to a decline in vacancy percentage across
City Office Barometer
Research & Forecast Report
Chennai | OfficeOctober 2015
Rental Values
*Indicative Grade A rents in INR per sq ft per month**OMR I (Madhya Kailash – Perungudi- Toll gate I) ***OMR II (Thoraipakkam – Sholinganallur) & OMR III (Semmencherry – Siruseri)
Source: Colliers International India Research
Source: Colliers International India Research
MICRO MARKETS RENTALVALUE*
% CHANGEQoQ YoY
CBD 65 - 80 0% 4%
Off CBD 50 - 60 0% 0%
Ambattur 26 - 32 0% 16%
OMR (Pre Toll)** 50 - 60 0% 4%
OMR (Post Toll)*** 25 - 40 0% -7%
Mount-Poonamallee Road 50 - 60 0% 0%
GST Road 35 - 45 0% 7%
INDICATORS 3Q 2015 4Q 2015 F
Vacancy
Absorption
Construction
Rental Value
Capital Value
13 Research & Forecast Report | October 2015 | Colliers International
Chennai.
Rents and capital values remained stable across micro markets this quarter.
In order to improve the office and industrial clusters, the Government of Tamil Naidu and Japan International Cooperation Agency (JICA) is carrying out a Detailed Project Report (DPR) for the Chennai-Bengaluru Industrial Corridor (CBIC) project. The CBIC project will have an area spreading up to 75 kms both sides of the NH 46 passing through several districts including Vellore, Kancheepuram, Tiruvallur and Chennai.
In a private equity investment, Brookfield Asset Management has picked up 80% stake in an upcoming 200 acres industrial park in Sriperumbudur. The project will be developed by Bengaluru-based realty developer Embassy Group. The build-to-suit industrial and warehousing park is expected to be completed over the next three years and will have a total built up space of more than 3 million sq ft.
Colliers View
The positive absorption and limited new supply addition in last few quarters led to decrease in vacancy rates in most of micro markets in Chennai. CBD, Off CBD and OMR (Pre toll) will continue to be the most preferred locations among occupiers. We do not expect any significant increase in overall market rents in near term due to abundant available supply in the market.
Top 5 Transactions of the Quarter
Key Under Construction Projects
Notes:
1. Office Market: Prime office properties in Chennai are located in seven principal sub markets: CBD, Off CBD, Ambattur, OMR I, OMR II & III, Mount - Poonamallee Road, GST
Road.
2. Rents/Capital Value: Market average of indicative asking price for Grade A office space.
3. Available Supply: Total Grade A office space being marketed for sale or lease in surveyed quarter.
4. City Barometer: Represents increase, decrease or stable scenario; as compared to previous quarter.
5. All the figures in the report is based on market information as on 25th September 2015.
Quarter Wise Absorption Analysis
Average Rental and Capital Value Trend Analysis
Source: Colliers International India Research
Mill
ion
SFRe
ntal
Val
ues
INR
Per
SF P
er M
onth
Capi
tal V
alue
s IN
R Pe
r SF
Source: Colliers International India Research
Source: Colliers International India Research
CLIENT BUILDING NAME AREA (SF) LOCATION LEASE / SALE
Accenture Shriram Gateway SEZ 437,000 GST Road Lease
Yes Bank India Bulls 400,000 Ambattur Lease
Accenture Divyashree 325,000 OMR Lease
BNY DLF SEZ 87,000 MPR Lease
Westminister Healthcare Rajkamal Pinnacle 70,000 CBD Lease
BUILDING NAME DEVELOPER AREA (SF) LOCATION POSSESSION
Chennai One SEZ – South Block IG3 infra Ltd 1200,000 Pallavaram Thoraipak-kam Road 2015
Doshi High Street Doshi Housing 160,000 Anna Salai 2015
Rajkamal Pinnacle Olympia Group 70,000 Nungambakkam High Road 2015
105
9,000
10,500
7,500
6,000
4,500
3,000
1,500
0
90
75
60
45
15
30
0
0.4
0.8
1.2
1.6
2.0
0
Forecast
1Q 2
013
2Q 2
013
3Q 2
013
4Q 2
013
1Q 2
014
2Q 2
014
3Q 2
014
4Q 2
014
1Q 2
015
2Q 2
015
3Q 2
015
3Q 2
008
3Q 2
009
3Q 2
010
3Q 2
011
3Q 2
012
3Q 2
013
3Q 2
014
3Q 2
015
3Q 2
016F
3Q 2
017F
14 Research & Forecast Report | October 2015 | Colliers International
IT/ITeS sector leads the way, represents 56% of 3Q volumeWith about 1.6 million sq ft in 3Q 2015, Bengaluru total office absorption was recorded over 8 million sq ft YTD. Deal flow was dominated by the IT/ITeS sector, which represents about 56% of the third quarter volume followed by manufacturing sector (16%) and BFSI (10%). A few of the major office transactions recorded during the quarter were, 0.19 million sq ft leased by Exxon Mobil in Prestige Shantiniketan at Whitefield and 0.14 million sq ft leased by Citrix & Continental. Among the micro markets, the maximum number of office transactions were concluded in the SBD (50%) including Outer Ring Road (ORR) - Marathahalli to Sarjapur Road, JP Nagar, CV Raman Nagar, Bannerghatta Road, Old Madras Road and Old Airport Road followed by PBD (43%) including ORR - KR Puram to Hebbal, Whitefield, Electronic City, and the CBD (7%).
The quarterly volume of new office development was 1.8 million sq ft. The projects accounted for this supply were Manyata Embassy Business Park (0.77 millionsq ft) developed by Embassy Group at ORR, Brigade Magnum (0.52 million sq ft) developed by Brigade Group and Sattva Galleria (0.25 million sq ft) developed by Sattva group both located at Bellary Road, HVP Crest (0.21 million sq ft) constructed by Habitat Venture at Whitefield and Skylark Zenith (0.06 million sq ft) by Skylark Group at Hosur Road.
No new project was launched during the quarter as developers were focusing to complete their existing under construction projects. Currently, over 7 million sq ft of Grade A office supply is available for fit out in Bengaluru, among which majority of the supply is located in EPIP
City Office Barometer
Research & Forecast Report
Bengaluru | OfficeOctober 2015
Rental Values
*Indicative Grade A rents in INR per sq ft per month**Northern part of ORR - KR Puram till Hebbal
Source: Colliers International India Research
Source: Colliers International India Research
MICRO MARKETS RENTALVALUE*
% CHANGEQoQ YoY
CBD 90 - 130 0% 16%
Outer Ring Road (Marathalli - Sarjapur)
60 - 65 4% 11%
Bannerghatta Road 55 - 65 0% 9%
Outer Ring Road (North)** 57 - 65 8% 8%
Hosur Road 25 - 40 0% 0%
EPIP Zone/ Whitefield 28 - 36 0% 0%
Electronic City 28 - 36 0% 8%
INDICATORS 3Q 2015 4Q 2015 F
Vacancy
Absorption
Construction
Rental Value
Capital Value
15 Research & Forecast Report | October 2015 | Colliers International
Zone/ Whitefield (37%) followed by Electronic City (21%), ORR (14%), CBD(11%), Bannerghatta Road (10%) and Hosur Road (7%).
Rents remained unchanged in most of the micro markets, except in Marathahalli to Sarjapur stretch of ORR and North side of Outer Ring Road, where rental values recorded an increase of 6% QoQ. Capital values remained stable across the micro markets.
This quarter, Agence Francaise Development (AFD) and Bangalore Metro Rail Corporation (BMRCL) signed an independent loan agreement for €200 million (INR 1,500 crore) for the Bangalore Metro Phase II. The loan will be utilised to finance the four extension lines in east-west and north-south corridors: Mysore Road to Kengeri, Byappanahalli to Whitefield, Puttenahalli to Anjanapura and Nagasandra to BIEC.
Colliers View
We expect, that growth of new sectors like e-commerce this year will drive demand for office space, and position the office market for a strong year. Rents are likely to remain stable across micro markets. The outlook for Bengaluru office markets looks positive, owing both to an anticipated demand and large amount of construction under way to complement this demand.
Top 5 Transactions of the Quarter
Key Under Construction Projects
Quarter Wise Absorption Analysis
Average Rental and Capital Value Trend Analysis
Notes:
1. Office Market: Prime office properties in Bengaluru can be divided into three principal sub-market— CBD/Off CBD (MG Road, Millers Road, Vittal Mallya Road etc.) the SBD
(Banerghatta Road & Outer Ring Road (ORR)) and PBD (Hosur Road, EPIP Zone, Electronic City and Whitefield).
2. Rents/Capital Value: Market average of indicative asking price for Grade A office space.
3. Available Supply: Total Grade A office space being marketed for sale or lease in surveyed quarter.
4. City Barometer: Represents increase, decrease or stable scenario; as compared to previous quarter.
5. All the figures in the report is based on market information as on 25th September 2015.
Source: Colliers International India Research
Mill
ion
SFRe
ntal
Val
ues
INR
Per
SF P
er M
onth
Capi
tal V
alue
s IN
R Pe
r SF
Source: Colliers International India Research
Source: Colliers International India Research
CLIENT BUILDING NAME AREA (SF) LOCATION LEASE / SALE
Exxon Mobil Prestige Shantiniketan 189,985 Whitefield Lease
Citrix Embassy Golf Link 145,870 Intermediate Ring Road Lease
Continental Gold Hill Supreme Tech Park 140,000 Electronic City Lease
HSBC RMZ Futura 100,000 Bannerghatta Road Lease
Molex Stand Alone 80,000 Whitefield Lease
BUILDING NAME DEVELOPER AREA (SF) LOCATION POSSESSION
RMZ Ecoworld - 6A & 6B RMZ Group 1,000,000 Outer Ring Road 2016
Bagmane Constellation Business Park - Virgo Block Bagmane Developers 800,000 Outer Ring Road 2015
RGA Tech Park Primal Realty 800,000 Sarjapur Road 2015
8,000
10,000
12,000
6,000
4,000
2,000
0
70
60
50
40
30
10
20
0
2
1
3
4
5
6
7
0
Forecast
1Q 2
013
2Q 2
013
3Q 2
013
4Q 2
013
1Q 2
014
2Q 2
014
3Q 2
014
4Q 2
014
1Q 2
015
2Q 2
015
3Q 2
015
3Q 2
008
3Q 2
009
3Q 2
010
3Q 2
011
3Q 2
012
3Q 2
013
3Q 2
014
3Q 2
015
3Q 2
016F
3Q 2
017F
16 Research & Forecast Report | October 2015 | Colliers International
Third quarter bring no cheer to office market in KolkataThe city office transaction volume was recorded at 0.2 million sq ft in 3Q 2015, which is about 30% less than the previous quarter. Occupiers demand remained concentrated in developing locations like sector V/ New town due to availability of Grade A buildings and less congestion then the traditional markets. The primary sectors occupying office space were, pharma, IT/ITeS and BFSI accounted for 44%, 36% and 19% of the total absorption, respectively. Major transactions during the quarter includes, lease of about 70,000 sq ft office space in Martin Burn Business Park by Cerner Corporation, 30,000 sq ft office space by Cap Gemini in Infospace and about 20,000 sq ft leased by Serco Global in Godrej Water Side. Beside this Veheretech IT Solution has done a outright purchase of about 10,000 sq ft in PS Srijan Corporate Park.
In the third quarter of 2015, we have not seen any major office developments being completed barring a mixed use project “Acropolis Mall”, which has an office component of about 0.35 million sq ft. Low demand kept the developers cautious in starting new projects, thus no new commercial Grade A project / parts of the project was launched during the quarter.
Rents remained stable across all the micro markets in Kolkata with minor increase of 4% QoQ recorded in Sector V / New Town micro markets.
In order to fasten up the building approvals process in Kolkata, the local authorities have initiated the online sanction of building plans. The aim is to reduce the approval time from current 3 months to 45 days. However, to start with, the facility is initially be restricted to Park Street, Camac Street, Loudon Street, Theatre Road, Ballygunge
City Office Barometer
Research & Forecast Report
Kolkata | OfficeOctober 2015
Rental Values
*Indicative Grade A rents in INR per sq ft per month**Park Street, Camac Street, Chowranghee Road, AJC Bose Road***EM Bypass, Topsia, Ruby****Salt Lake, New Town, Rajarhat
Source: Colliers International India Research
Source: Colliers International India Research
MICRO MARKETS RENTALVALUE*
% CHANGEQoQ YoY
CBD** 85 - 115 0% -5%
SBD*** 65 - 75 0% -7%
Sector V 40 - 48 4% -4%
PBD**** 34 - 35 0% -1%
INDICATORS 3Q 2015 4Q 2015 F
Vacancy
Absorption
Construction
Rental Value
Capital Value
17 Research & Forecast Report | October 2015 | Colliers International
and other locations which fall under Kolkata Municipal Corporation. The pre-requisite to avail this facility is to have a Licenced Building Surveyor (LBS) who is empanelled with the KMC buildings department. The LBS on behalf of owner can apply for sanction of construction or additional construction on a particular building or on a vacant plot.
Colliers View
The volume of new office development will remain low in the coming quarters, as the developers are focusing to complete their small scale under construction projects. In Kolkata office market, the demand is primarily coming from domestic occupiers, while MNCs and major IT/ITeS firms continue to keep a distance from the market, thus we do not expect any major change in the rental values across the micro market.
Top 5 Transactions of the Quarter
Key Under Construction Projects
Notes:
1. Office Market: The major business locations in Kolkata are CBD (Park Street, Camac Street, Chowranghee Rd, AJC Bose Rd), East Kolkata (EM Bypass, Topsia, Ruby), Salt Lake/
Sector V and New Town / Rajarhat.
2. Rents/Capital Value: Market average of indicative asking price for Grade A office space.
3. Available Supply: Total Grade A office space being marketed for sale or lease in surveyed quarter.
4. City Barometer: Represents increase, decrease or stable scenario; as compared to previous quarter.
5. All the figures in the report is based on market information as on 25th September 2015.
Quarter Wise Absorption Analysis
Average Rental and Capital Value Trend Analysis
Source: Colliers International India Research
Mill
ion
SFRe
ntal
Val
ues
INR
Per
SF P
er M
onth
Capi
tal V
alue
s IN
R Pe
r SF
Source: Colliers International India Research
Source: Colliers International India Research
CLIENT BUILDING NAME AREA (SF) LOCATION LEASE / SALE
Cerner Corporation Martin Burn Business Park 70,000 Sector V Lease
Capgemini Infospace 30,000 Sector V Lease
Serco Global Godrej Water Side 24,000 Sector V Lease
Veheretech IT Solution PS Srijan Corporate Park 9,700 Sector V Sale
Value Labs Eco Space 9,000 New Town Lease
BUILDING NAME DEVELOPER AREA (SF) LOCATION POSSESSION
Mani Twin Mani Group 1,800,000 Rajarhat 2016
Technopolis 2 Forum Projects 1,200,000 Bantala 2016
Magnacon Infinity Group 740,000 Salt Lake 2016
8,000
10,000
12,000
6,000
4,000
2,000
0
120
100
80
60
20
40
0
0.50
0.40
0.30
0.20
0.10
0.60
0.70
0.80
0.90
1.00
0.00
Forecast
1Q 2
013
2Q 2
013
3Q 2
013
4Q 2
013
1Q 2
014
2Q 2
014
3Q 2
014
4Q 2
014
1Q 2
015
2Q 2
015
3Q 2
015
3Q 2
008
3Q 2
009
3Q 2
010
3Q 2
011
3Q 2
012
3Q 2
013
3Q 2
014
3Q 2
015
3Q 2
016F
3Q 2
017F
18 Research & Forecast Report | October 2015 | Colliers International
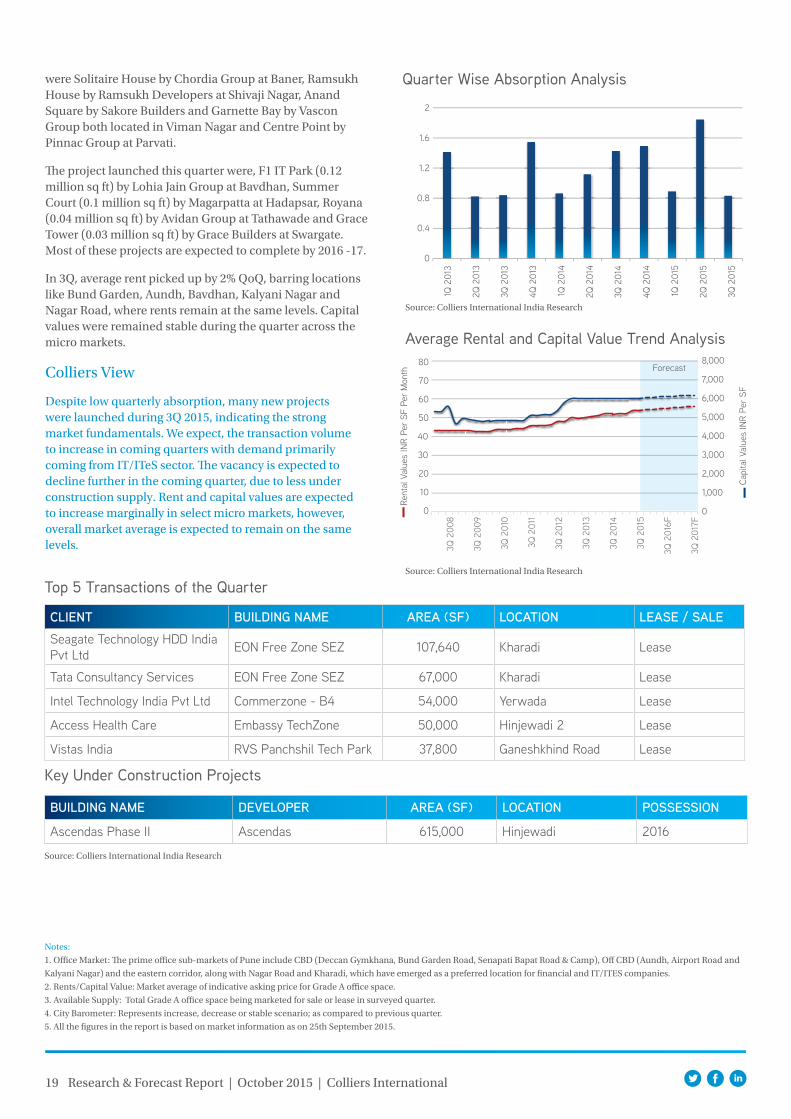
IT/ITeS remained the prime driver with 68% of total absorptionThe office leasing transaction volume for 3Q 2015 was over 0.83 million sq ft, which was about 55% less than the previous quarter. Despite low level absorption recorded in third quarter, the YTD absorption has reached 3.57 million sq ft, which is about 5% more than the absorption of the same period last year.
Occupier demand remained focused in CBD, while locations like Kharadi, Senapati Bapat Road and Hinjewadi also attracts the interest from the occupiers. All these locations together accounted for more than 70% of the total transaction volume. IT/ITeS, Pharma and BFSI were the first, second and third primary sector driving demand. Over 68% of the total transaction volume was shared by IT/ITeS sector alone. The major deals executed in third quarter were, 0.10 million sq ft lease by Seagate Technology HDD India, 0.06 million sq ft office lease by Tata Consultancy Services, both in EON Free Zone SEZ, 0.05 million sq ft each leased by Access Health Care and Intel Technology India in Embassy – Mississippi and Commerzone - B4, located at Hinjewadi and Yerwada, respectively.
More than 4.8 million sq ft (Grade A & Grade B IT & Non IT) was available for fit-out in Pune market, of which 18% was located in Hinjewadi, 17% on Airport Road / Pune Station, 13% each on Nagar Road and Kalyani Nagar, 11% in Bund Garden, 10% in Kharadi, 8% on Senapati Bapat Road and remaining 10% in Baner, Bavdhan and Hadapsar / Fursungi. The city witnessed a few office development completions, and only about 0.26 million sq ft of supply was added to the city’s inventory. Projects that contributed to this new supply
City Office Barometer
Research & Forecast Report
Pune | OfficeOctober 2015
Rental Values
*Indicative Grade A rents in INR per sq ft per month
Source: Colliers International India Research
Source: Colliers International India Research
MICRO MARKETS RENTALVALUE*
% CHANGEQoQ YoY
Baner 48 - 55 3% 3%
Bund Garden 50 - 65 0% 0%
Airport road/pune station 55 - 80 5% 13%
Aundh 45 - 60 0% 0%
Senapati Bapat Road 60 - 90 7% 7%
Bavdhan 35 - 45 0% 0%
Kalyani Nagar 45 - 62 0% 2%
Nagar Road 45 - 60 0% 5%
Hinjewadi 38 - 50 2% 14%
Hadapsar/Fursungi 40 - 65 2% 2%
Kharadi 40 - 75 2% 19%
INDICATORS 3Q 2015 4Q 2015 F
Vacancy
Absorption
Construction
Rental Value
Capital Value
19 Research & Forecast Report | October 2015 | Colliers International
were Solitaire House by Chordia Group at Baner, Ramsukh House by Ramsukh Developers at Shivaji Nagar, Anand Square by Sakore Builders and Garnette Bay by Vascon Group both located in Viman Nagar and Centre Point by Pinnac Group at Parvati.
The project launched this quarter were, F1 IT Park (0.12 million sq ft) by Lohia Jain Group at Bavdhan, Summer Court (0.1 million sq ft) by Magarpatta at Hadapsar, Royana (0.04 million sq ft) by Avidan Group at Tathawade and Grace Tower (0.03 million sq ft) by Grace Builders at Swargate. Most of these projects are expected to complete by 2016 -17.
In 3Q, average rent picked up by 2% QoQ, barring locations like Bund Garden, Aundh, Bavdhan, Kalyani Nagar and Nagar Road, where rents remain at the same levels. Capital values were remained stable during the quarter across the micro markets.
Colliers View
Despite low quarterly absorption, many new projects were launched during 3Q 2015, indicating the strong market fundamentals. We expect, the transaction volume to increase in coming quarters with demand primarily coming from IT/ITeS sector. The vacancy is expected to decline further in the coming quarter, due to less under construction supply. Rent and capital values are expected to increase marginally in select micro markets, however, overall market average is expected to remain on the same levels.
Top 5 Transactions of the Quarter
Key Under Construction Projects
Notes:
1. Office Market: The prime office sub-markets of Pune include CBD (Deccan Gymkhana, Bund Garden Road, Senapati Bapat Road & Camp), Off CBD (Aundh, Airport Road and
Kalyani Nagar) and the eastern corridor, along with Nagar Road and Kharadi, which have emerged as a preferred location for financial and IT/ITES companies.
2. Rents/Capital Value: Market average of indicative asking price for Grade A office space.
3. Available Supply: Total Grade A office space being marketed for sale or lease in surveyed quarter.
4. City Barometer: Represents increase, decrease or stable scenario; as compared to previous quarter.
5. All the figures in the report is based on market information as on 25th September 2015.
Quarter Wise Absorption Analysis
Average Rental and Capital Value Trend Analysis
Rent
al V
alue
s IN
R Pe
r SF
Per
Mon
th
Capi
tal V
alue
s IN
R Pe
r SF
Source: Colliers International India Research
Source: Colliers International India Research
Source: Colliers International India Research
CLIENT BUILDING NAME AREA (SF) LOCATION LEASE / SALESeagate Technology HDD India Pvt Ltd EON Free Zone SEZ 107,640 Kharadi Lease
Tata Consultancy Services EON Free Zone SEZ 67,000 Kharadi Lease
Intel Technology India Pvt Ltd Commerzone - B4 54,000 Yerwada Lease
Access Health Care Embassy TechZone 50,000 Hinjewadi 2 Lease
Vistas India RVS Panchshil Tech Park 37,800 Ganeshkhind Road Lease
BUILDING NAME DEVELOPER AREA (SF) LOCATION POSSESSION
Ascendas Phase II Ascendas 615,000 Hinjewadi 2016
6,000
7,000
8,000
5,000
4,000
3,000
2,000
1,000
0
80
70
60
50
20
10
40
30
0
0.4
0.8
1.2
1.6
2
0
Forecast
1Q 2
013
2Q 2
013
3Q 2
013
4Q 2
013
1Q 2
014
2Q 2
014
3Q 2
014
4Q 2
014
1Q 2
015
2Q 2
015
3Q 2
015
3Q 2
008
3Q 2
009
3Q 2
010
3Q 2
011
3Q 2
012
3Q 2
013
3Q 2
014
3Q 2
015
3Q 2
016F
3Q 2
017F
About Colliers International
colliers.com
67 countries on 6 continentsUnited States: 140 Canada: 31 Latin America: 24
199 EMEA: 108
$2.3billion in annual revenue
1.7billion square feet under management
16,300professionals
Primary Authors:
Surabhi Arora Associate Director | Research +91 124 456 [email protected]
Sachin Sharma Manager | Research
Amit Oberoi I National DirectorValuation & Advisory Services & Research
For Office Services:
Mumbai: George Mckay I South Asia [email protected]
Delhi / NCR: Vikas Kalia | National [email protected]
Bengaluru: Goutam Chakraborty I [email protected]
Pune: Rishav Vij I Senior Associate [email protected]
Chennai: Shaju Thomas | Senior Associate Director [email protected]
Kolkata: Swapan Dutta I Senior Associate [email protected]
Colliers InternationalTechnopolis Building, 1st Floor, DLF Golf Course Road, Sector 54, Gurgaon - 122 002TEL +91 124 456 7500
502
2015