Embed Size (px)
Citation preview

Office of the President
1
Moving Forward As A University Community
September 29, 2009
President John Haeger

Office of the President
2008-2009 Accomplishments
• NCAA accreditation
• Native American Cultural Center – received a $2M contribution from the San Manuel tribe.
• ARD -- Award from Royal Institute of British Architects
• Kiplinger’s Personal Finance magazine ranks NAU as one of the best values among public colleges nationwide
• Implemented “joint admission” programs with Coconino Community College and Yavapai College
• Health and Learning Center /SPEED Projects
2

Office of the President
3
Growth Since 2005
Fall Enrollments by Campus, Fall 2005-2009;
Total = 23,600

Office of the President
Enrollment Issues
• Community Campuses enrollment
• Drop in graduate enrollment both online and in community campuses
• Competitive position versus for-profit institutions
• System Architecture
• Need for investment in new programs
4

Office of the President
FY 2010 BudgetFY09 Original
FY 09Final
FY10
Total State Budget $214,181.4 $192,893.1 $207,711.7
General Fund 161,560.9 140,272.6 134,642.8
State Collections52,620.5 52,620.5 73,068.9 Est.
State Budget Initial Investment Flexibility
$12.0 M
Commitments (Utilities, Class Coverage, Critical Hires, Diversity)
$3.55 M
Reserve $5.0 M
Surplus for Commitments
$3.45 M

Office of the President
Budget Situation
120,000.0
130,000.0
140,000.0
150,000.0
160,000.0
170,000.0
State General Fund
6
• Total state budget for FY 2010 is approximately $8 million down from FY09.
• Tuition and fee revenues helped stabilize the overall state budget.
• This year, also have a tuition surcharge bringing in $5 million, plus an IT Fee increase which allowed us to move IT personnel off the state budget
• We also have one-time flexibility in local funds
2007
Adju
sted
200
8
2009
Orig
inal
2009
Fina
l20
100.0
50,000.0
100,000.0
150,000.0
200,000.0
250,000.0
Total State Budget
State General Fund State Tuition and Surcharge

Office of the President
Warning Signs for the Future in Arizona
• State budget is unlikely to return to FY08 levels
• Tuition cannot continue to rise
• Arizona’s current and future demographics are sobering
7

Office of the President
For 2010, Arizona Remains Among States With The Worst Budget Problems
Source: National Conference of State Legislatures, 2009/Dennis Jones, NCHEMS
Office of the President
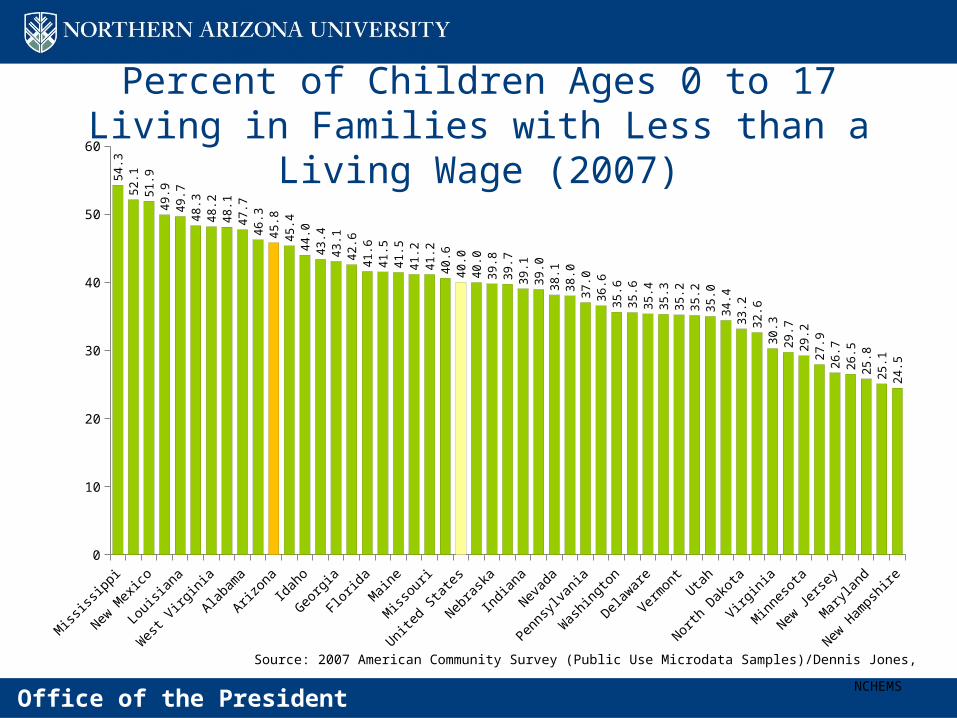
Percent of Children Ages 0 to 17 Living in Families with Less than a Living Wage (2007)
Miss
issipp
i
New M
exico
Louis
iana
Wes
t Virg
inia
Alabam
a
Arizon
aId
aho
Georg
ia
Florida
Main
e
Miss
ouri
United
Sta
tes
Nebra
ska
India
na
Nevad
a
Penns
ylvan
ia
Was
hingt
on
Delawar
e
Verm
ont
Utah
North
Dak
ota
Virgini
a
Minn
esot
a
New J
erse
y
Mar
yland
New H
amps
hire
0
10
20
30
40
50
60
54
.35
2.1
51
.94
9.9
49
.74
8.3
48
.24
8.1
47
.74
6.3
45
.84
5.4
44
.04
3.4
43
.14
2.6
41
.64
1.5
41
.54
1.2
41
.24
0.6
40
.04
0.0
39
.83
9.7
39
.13
9.0
38
.13
8.0
37
.03
6.6
35
.63
5.6
35
.43
5.3
35
.23
5.2
35
.03
4.4
33
.23
2.6
30
.32
9.7
29
.22
7.9
26
.72
6.5
25
.82
5.1
24
.5
Source: 2007 American Community Survey (Public Use Microdata Samples)/Dennis Jones, NCHEMS

Office of the President
Arizona Provides Very Little Need-Based Aid
108% 102% 96%88% 86% 84%
84% 82%74% 70%
62% 59% 57%56% 50%
49%48%48% 46% 43% 41%
41% 37%36% 33%
32% 29%28%28%28% 24% 21%
20%19% 17%
16% 13% 10% 9% 8% 8% 6% 5% 5% 5% 3% 1% 1% 0% 0%
0%
20%
40%
60%
80%
100%
120%
Washington
New
Jersey Verm
ont N
ew York
Pennsylvania Indiana M
innesota Illinois Connecticut N
orth Carolina W
isconsin M
aryland M
assachusetts
California Virginia Delaw
are Kentucky N
evada O
hio W
est Virginia Colorado O
klahoma
Maine
South Carolina Iow
a Texas M
issouri Arkansas M
ichigan Rhode Island O
regon Florida N
ew M
exico N
ebraska Kansas Tennessee N
ew Ham
pshire N
orth Dakota M
ontana Louisiana U
tah Alaska Alabam
a Haw
aii Idaho Arizona M
ississippi W
yoming
Georgia
South Dakota
Source: Measuring Up 2008/Dennis Jones, NCHEMS
State need-based aid as a proportion of federal need-based aid.

Office of the President
National Higher Education Agenda
11
“…by 2020, America will once again have the highest
proportion of college graduates in the world.”President Barack ObamaAddress to the Joint Session of Congress, February 24, 2009
Increase the percentage of Americans
with high-quality, two- or four-year college
degrees and credentials …
To be nationally competitive in the percentage of Arizona’s citizens with a high-quality bachelor’s degree …” (50% more bachelor’s degrees)
• At full build-out in 2020, the system will include at least four additional four-year campuses

Office of the President
12
Median Earnings by Education: 2006
$18,868 $20,506
$27,384
$35,274
$46,435
$55,445
$85,857
$78,212
No Diploma(Less than 9th
Grade)
No Diploma (9th- 12th Grade)
High-SchoolDiploma
AssociateDegree
Bachelor'sDegree
Master's Degree ProfessionalDegree
DoctorateDegree
Source: U.S. Census Bureau, Current Population Survey 2007
Median Earnings by Education Level

Office of the President
International Perspective: Proportion of Population (Age 25-34) With Bachelor’s Degree or Higher
13
Norway
Unite
d Sta
tes
Nethe
rland
s
Korea
Denm
ark
Sweden
Japa
n
New Z
eala
nd
Austra
lia
Canad
a
Finla
nd
Unite
d Kin
gdom
Icela
nd
Irela
nd
Polan
d
Spain
Franc
e
Luxe
mbo
urg
Switzer
land
Arizon
a
Hunga
ry
Portu
gal
Belgi
um
Greec
eIta
ly
Mex
ico
Slova
k Rep
ublic
Czech
Rep
ublic
Germ
any
Austri
a
Turke
y
40 %
35 %
23 %
13 %
Arizona
Source: Education at a Glance 2008, OECD; 2006 Data
United States

Office of the President
14
Ger
man
y
Gre
ece
Finlan
d
Japa
n
Korea
Norway
Czech
Rep
ublic
Icela
nd
Switzer
land
United
King
dom
Denm
ark
Irelan
dIta
ly
EU19 A
vera
ge
Hunga
ry
OECD A
vera
ge
Slovak
ia
Canad
a
Poland
United
Sta
tes
Sweden
New Z
ealan
d
Luxe
mbo
urg
Spain
Turke
y
Mex
ico0
20
40
60
80
100
120
EU19 Average 86
OECD Average 83
United States 77
International Perspective: High School Graduation Rates 2006
Source: Education at a Glance 2008, OECD IndicatorsNote: Figures for net exporters of students may be underestimated and overestimated for net importers.

Office of the President
Performance Issues in Higher Education
• Retention and graduation rates
• Inadequate STEM degree production
• Tuition Increases
• Misalignment of education with skills needed for 21st century
• Resistance to change
• College readiness
• Inefficient governance structures
15

Office of the President
16
Directions of the European Commission on Education and Training
• Research should remain a key task of the systems as a whole, but not necessarily for all institutions.
• The proportion of graduates who have spent at least one term or semester abroad or with experience in industry should at least double.)
• Reorganization of the university away from disciplinary departments and into units reflecting research and teaching themes
• Provide incentives for structured partnerships with the business community.
• University programs should be structured to enhance directly the employability of graduates and to offer broad support to the workforce more generally.
• Enhance interdisciplinary research and teaching
• Reward excellence at the highest level….

Office of the President
Addressing The Challenge
17

Office of the President
Changing the Paradigm• Programs on-campus the same as off-campus
• Freshman year as a time for “exploration”
• Reduced loads for freshmen
• Large numbers of degree and course options represents a healthy curriculum
• The only pathway to a degree is through the classic liberal arts/academic major
• All instruction should be delivered by tenured faculty
18

Office of the President
Degree Granting Public Institutions
19
Carnegie Classification 2008

Office of the President
20
NAU - Yavapai
Dr. James R. Carruthers Research and Education
building; NAU-Yuma

Office of the President
The Extended Campus Model
• Lower cost to students and state
• Highly structured degree programs
• Degree programs related to market need
• Different faculty workload and research expectations
• Redesigned transfer process 21

Office of the President
Response to New Reality: Mission Differentiation
Mission Focus
Curricular Autonomy / Faculty
Governance
Academic Programs
Non-academic Services
Funding Sources
Relative Tuition Level
Admission
Flagstaff Residential Campus
Research/ Teaching Yes
Many Options
Full Spectrum
State/ Tuition High Selective
Branch Campuses (Yuma, Yavapai) Teaching Yes
Structured/ Streamlined
Limited and Outsourced
State/ City/ County/ Tuition Moderate
Moderately Selective
Community Campuses/ Online Campus Teaching No
Structured/ Streamlined Limited
State/ Tuition Moderate Selective
22

Office of the President
Continued Investments in Research
• Purchased Grants and Contracts-specific software
• Investment in personnel infrastructure
• Investment in supporting ARRA grants
• Approval granted for acquiring Web of Science/InCites
23

Office of the President
Moving Forward On The Research Agenda• Established NAU Ventures, a formal partnership to
promote patents and copyrights by NAU faculty
• Nearly $9M in funding awarded by the National Institutes of Health to revitalize the Native American Cancer Partnership.
• Darrell Kaufman’s work on global warming in arctic regions published in Science magazine.
• Tom Acker and Sustainable Energy Solutions group awarded $8M grant from Science Foundation Arizona (pending obtaining matching funds from private/community partners)
24

Office of the President
Undergraduate Education Redesign…to improve retention and degree completion within a financially
sustainable structure:• Redirect low-demand programs
• Move faculty to interdisciplinary programs • Develop new curricula and delivery systems
• Math; New programs explicitly tied to the 21st century needs—green jobs, health informatics, service management, health professions; sustainability
• Conduct policy audit• Prerequisites, retaking of courses for better grade, late dropping of
courses
• Encourage web course formats and year-round scheduling
• Web-based advising system
25

Office of the President
Courses With 33% Or More D-F-W’sCourse Title
ANT 301 Peoples of the World
BIO 201 Human Anatomy/Physiology I
CIS 120 Intro to Computer Information Systems
MAT 108 Algebra for Pre-Calculus
MAT 119 Finite Mathematics
MAT 125 Pre-Calculus
MAT 136 Calculus I
MAT 137 Calculus II
PSY 277 Introduction to Personality
26
Note: PSY 101 (Introduction to Psychology) and BIO 181 (Unity of Life) recently came off this list due to course redesigns which fostered student success

Office of the President
NAU Retention and Graduation Rates
27
1994 1995 1996 1997 1998 1999 2000 2001 2002 2003 2004 2005 2006 2007 200840%
45%
50%
55%
60%
65%
70%
75%
Six Year Graduation Rate 1 Year Retain
Peer Average-Median

Office of the President
The Necessity for Speed • Federal stimulus dollars on competitive basis
• Better use of shrinking resources
• Innovation Fund ($1 million from stimulus dollars).
– Individuals or departments to write new and re-design existing curricula . We will support those wishing to change policies that get in the way.
• Retirement incentive program for tenured faculty
– Provides flexibility in base budget
– Will allow investment in new and growing programs
• Committee on Innovation and Change
28